Embed Size (px)
Citation preview
i
UKRAINE’S CURRENCY CRISIS IN SEPTEMBER-AUGUST 1998:
FINANCING A BUDGET DEFICIT THROUGH DEBT
by
Maxym Chaban
A thesis submitted in partial fulfillment of the requirements for
the degree of
Master of Arts in Economics
Economic Education and Research Consortium at the University “Kiev-
Mohyla Academy”
1999
Approved by ___________________________________________________ Chairperson of Supervisory Committee
__________________________________________________
__________________________________________________
__________________________________________________
Program Authorized to Offer Degree _________________________________________________
Date _________________________________________________________
EERC at the University “Kiev-Mohyla Academy”
Abstract
UKRAINE’S CURRENCY CRISIS IN SEPTEMBER-AUGUST 1998: FINANCING A BUDGET DEFICIT THROUGH DEBT
by Maxym Chaban
Chairperson of the Supervisory Committee: Professor [Name] Department of Economics
This thesis analyzes the currency crisis that Ukraine experienced in August-September
1998. It is shown that due to a budget deficit, a current account deficit and low level of
reserves, Ukraine was highly vulnerable to a currency crisis and a fixed exchange rate
regime was not sustainable in the long-run. Nevertheless, capital inflows, namely in the
form of portfolio investment in Ukrainian Treasury bills, provided some artificial
stability to the economy, while at the same time increased its vulnerability to a crisis. As
capital inflows suddenly stopped in September 1997 any negative expectations became
self-fulfilling and led to collapse of both stock and T-bill markets. Rough estimates
show that the T-bills debt to foreign investors exceeded the foreign exchange reserves
at that time. Ukraine certainly faced a problem of illiquidity, even though it was still
considered by foreign investors as solvent. Although Ukraine borrowed extensively in
the first half of 1998, it reached some binding constraints on international borrowing
and was not able to reduce the T-bills debt-to-reserves ratio. Analysis suggests that both
Asian and Russian crises, although they could have severe impact on Ukraine, in fact
were of little importance. The currency crisis is the first manifestation of government’s
attempts to follow a Ponzi scheme of financing: borrow more and more in order to
repay previous debt.
i
TABLE OF CONTENTS
1. Introduction ................................................................................................ 1 1.1 A Chronology of Events Leading to the Crisis..................................... 1
2. Theoretical Models of Crises........................................................................ 5 2.1. First-generation Models ...................................................................... 6 2.2. Second-generation Models .................................................................. 7 2.3. Balance Sheet Crises ........................................................................... 9 2.4. Herding Behavior.............................................................................. 10 2.5. Contagion Effects ............................................................................. 11
3. Do First-generation Models Explain the Crisis?......................................... 14 3.1. Empirical Determinants of Currency Crises: An Overview .............. 14 3.2. Behavior of Main Macroeconomic Variables .................................... 20
4. Role of Capital Inflows and Outflows for Financial Stability in Ukraine .. 30 4.1. Supply and Demand for T-bills ......................................................... 31 4.2. Development of Ukrainian T-bills Market ........................................ 32 4.3. External Borrowing as Soft Budget Constraint ................................. 46
5. Conclusions................................................................................................ 48 Appendix 1..................................................................................................... 49 References...................................................................................................... 51
ii
LIST OF FIGURES
Number Page 1. Empirical Regularities During Balance of Payments Crises 19
2. Real Exchange Rate 21
3. Monetary Aggregate M1 22
4. Foreign Exchange Reserves Excluding Gold 24
5. M2/Reserves 24
6. Nominal Exchange Rate 32
7. Inflation, monthly % change of CPI 33
8. Treasury Bills Market 34
9. Monthly Structure of T-bills Sale in 1997, by maturity, % 35
iii
ACKNOWLEDGMENTS
I am especially grateful to my advisor Professor James Dean for valuable
remarks and support.
Earlier drafts of this thesis were shown to a number of people. I wish to thank
Professor Lance Brannman for constructive comments and suggestions,
especially about the structure of the thesis, and for valuable critique of the first
draft of the Subsection 4.2. I owe a great debt of gratitude to Viktor Lysytsky,
Head of Advisors’ Group to the NBU Governor, for interest to my work and
for introducing me some aspects of situation in Ukraine. Also, I am really
thankful to Timofiy Mylovanov for a number of discussions.
Finally, I wish to thank Professors Roy Gardner, Eric Pentecost, and Klaus
Waller for comments and suggestions.
1
C h a p t e r 1
INTRODUCTION
On August 13, 1998 one of the world’s leading financial players Mr. G.Soros,
in the letter to The Financial Times, made a proposal to devalue the ruble by 25-
30%.
On August 17, 1998 the Central Bank of Russia announced a new currency
corridor: in two days the exchange rate devaluated by 50% and the Russian
Government defaulted on its payment obligations (HIID, 1998a, p.7). On
August 21 the Ukraine’s official exchange rate, which is determined at the
Ukrainian Interbank Currency Exchange (UICE), approached the upper limit of
the announced band (2.25 UAH/USD). The National Bank of Ukraine (NBU)
maintained the hryvnia at 2.25 UAH/USD for several days, then closed the
UICE and, a few days later, announced a new corridor of 2.5-3.5 UAH/USD. It
was the first manifestation of the Ukrainian crisis. The crisis cost a lot for
Ukraine: the hryvnia devaluated by 60%, domestic prices increased by 20%, the
NBU lost 40% of its gross reserves (ICPS, 1998, p.4).
The aim of this thesis is to analyze the roots of the currency crisis. I will try to
answer the following question. Can existing theories of, and empirical facts
about, currency crises explain the Ukraine’s crisis?
1.1 A Chronology of Events Leading to the Crisis
Since independence, Ukraine has always had a budget deficit. While there is
some positive dynamics in fiscal policy, the situation with state finance is very
dangerous. An ordinary investor borrows money and invests in projects whose
returns exceed the interest on debt. A government should borrow money if it
can successfully invest in the economy and obtain positive growth of GDP. In
the case of Ukraine, this means that the government should use borrowed
2
money only for restructuring the economy and conducting real reforms.
Otherwise, the only way to pay debt is to borrow more and more and finally
default on payment obligations. This way of financing is called Ponzi scheme.
Before 1996 the budget deficit was financed by printing money and the build-
up of wage arrears. This caused hyperinflation. At the end of 1995 the
government adopted a package to switch financing the budget deficit from
seignorage to borrowing. This package included the following features. First, in
the second quarter of 1995 the government established the bond market and
issued T-bills. Second, the NBU introduced a currency corridor (fixed exchange
rate with bands). The goals were to reduce expectations of inflation and attract
foreign investors who would operate on the Ukrainian T-bill market. T-bills
financed 37% of the budget deficit in 1996 and 71% in 1997 (HIID, 1998a).
Since investment in Ukrainian T-bills was risky, the rate of return was high in
order to attract foreign investors. The effective annual rate of return was 143%
in 1995, 102% in 1996 and 43% in the first quarter of 1997 (HIID, 1998a). At
such rates, even a small budget deficit becomes very difficult to sustain. For
comparison, the interest rate on T-bills is below 5% in USA. The high yields
also attract domestic banks.
The performance of the T-bill market showed some positive dynamics until
September 1997. The government was able to reduce yields, increase maturity
of issued bonds and a volume of transactions. It seems that the government
policy deserved credibility from foreign investors. Nevertheless, the situation
changed rapidly in September 1997. Here I present events that occurred in
September, while the impact of these events on the collapse of the T-bills
market and the currency crisis I discuss in Section 4. First, the financial crises
in Asian countries took place between July and December 1997. They reduced
the investors’ confidence in “emerging markets”. The Ukrainian stock market
crashed in September. The stock exchange index Pro U-50 reached its
maximum on September 1, 1997 and after that, started going down
continuously (ICPS, 1998). At the same time yield on T-bills reached its lowest
level 22% in August 1997 and, thus, T-bills became less attractive for non-
3
residents. In addition, during this period the government decided to pay back
its wage arrears. Credit from the Bank of Luxembourg was spent for this
purpose (HIID, 1998a). The increase in the domestic money supply combined
with the fall in non-residents’ demand for the hryvnia forced the currency to
depreciate. Finally, in September 1997 the IMF refused to grant the second
tranche of its stand-by loan (about USD 49 mln) because Ukraine exceeded the
budget deficit limit, one of the basic requirements of the loan (HIID, 1998a).
All these events contributed to investors’ withdrawing their funds from the T-
bill market. Since that time the NBU started loosing its reserves. Since the
beginning of 1998 the NBU was major buyer of T-bills. The NBU tried to
stabilize the situation: it increased the discount rate from 17% to 25% and then
to 35%, and required reserves from 11% to 15% (HIID, 1998a). The tight
monetary policy postponed the time occurrence of the crisis.
During January-September 1998, the Ukrainian government had borrowed
UAH 10.6 bln (USD 3.1 bln) in domestic and foreign loans, 95% of which was
spent on debt servicing. The Finance Ministry issued three groups of eurobonds
(HIID, 1998a). Two tranches of deutsche mark-denominated three-year
Eurobonds were issued in February and May. In March the Ministry issued
Euro-denominated Eurobonds with two-year maturity. In June, it turned out
that there were no buyers for Ukraine’s eurobonds even with very attractive
rates (HIID, 1998b).
The NBU introduced a new currency band in September after Russia’s financial
crisis, the exchange rate reached its upper limit very soon and the NBU
imposed strict administrative controls regulating the official forex market
(UEPLAC, 1998a, p.4). All transactions have to go through unique window of
the Kyiv exchange, which implies a ban on direct inter-bank transactions. A list
of ‘critical’ imports has been decreed and foreign currency is provided in
principle only to the corresponding importers, with adequate justifications. The
exporters are required to surrender 50% of their currency earnings. Finally, the
rate for cash in exchange points is regulated and only a narrow margin around
the official rate is allowed. The government, in turn, imposed administrative
4
controls over some prices in July 1998, even before the crisis. These measures
reduced “quantitative” indicators of the crisis, such as rate of inflation or
devaluation, but caused other damage to the economy.
Section 2 is devoted to theoretical models of crises. In Section 3 I discuss to
what degree first generation models may explain the crisis. In Section 4 I
analyze the impact of a sudden stop of capital inflow on the crisis and discuss
why foreign investors left Ukrainian T-bills market. In Section 5 I conclude.
5
C h a p t e r 2
THEORETICAL MODELS OF CRISES
Generally, a currency crisis exists when there is an abrupt nominal devaluation
accompanied by a large and abrupt change in the real exchange rate. The
presence of both nominal and real devaluations is needed to exclude a nominal
devaluation caused by hyperinflation from the definition of a currency crisis.
Technically, definitions of a currency crisis are different. Some authors consider
that a currency crisis has occurred when the accumulated three-month real
exchange rate change is 15 percent, others use a 25 percent change of nominal
exchange rate as a threshold value. Some authors define a currency crisis as
when the one-month change in the real exchange rate (RER) is several times
higher the country-specific standard deviation of the RER monthly growth rate.
On any definition, Ukraine experienced a currency crisis in September 1998.
One of the necessary conditions of a currency crisis is that the exchange rate is
somehow fixed. Under some conditions, which will be discussed below, market
participants start buying excessively the foreign currency to which the domestic
currency is linked. This excessive buying is called as a speculative attack.
Sometimes, the central bank succeeds in fighting off speculative attacks by
using its foreign exchange reserves, and, thus, there is no devaluation. If,
however, the central bank loses most of its reserves, this event is called as a
balance-of-payments crisis. So, the difference between a currency crisis and a
balance-of-payments crisis is in ability of the central bank to defend the fixed
exchange rate. Although, consequences of a currency and balance-of-payments
crisis may be different, reasons for both types of crises are identical.
2.1 First-generation Models
Krugman (1979) developed the first model of a currency crisis. There are two
assets in his model: domestic and foreign currency. Expansionary monetary
6
policy leads to higher rates of inflation and market participants are willing to
change their portfolios and hold more foreign currency. Thus, there is excessive
demand for foreign currency and if the exchange rate is fixed, the central bank
intervenes to cover the excessive demand. Thus, his model shows that, under a
fixed exchange rate, domestic credit expansion in excess of money demand
growth leads to a gradual but persistent loss of international reserves and,
ultimately, to a speculative attack on the currency. This attack immediately
depletes reserves and forces the authorities to abandon the parity. The process
ends with an attack because economic agents understand that the fixed
exchange rate regime will ultimately collapse, and that in the absence of an
attack they would suffer a capital loss on their holdings of domestic money.
This model suggest that the period preceding a currency crisis would be
characterized by a gradual but persistent decline in international reserves and a
rapid growth of domestic credit relative to the demand for money. Since the
excessive money creation may result from the need to finance the public sector,
fiscal imbalances and credit to the public sector could also serve as indicators
of a currency crisis. For that matter, central bank credit to troubled domestic
financial institutions would play the same role.
A number of papers have extend Krugman’s basic model in various directions
(see survey in Garber and Svensson, 1994). Some of these extensions have
shown that a real appreciation of the currency and a deterioration of the trade
balance would generally precede speculative attacks. These results have been
derived from models in which expansionary fiscal and credit policies lead to
higher demand for traded goods (which causes a deterioration of the trade
balance) and nontraded goods (which causes an increase in the relative price of
these goods, and thus a real appreciation of the currency). They also follow
from models in which expectations of future crisis lead to an increase in
nominal wages, which, in the presence of sticky prices, results in higher real
wages and lower competitiveness. Also, the authorities can raise interest rates
to defend the parity and reduce loses of foreign exchange reserves. Thus, these
models suggest that the evolution of the real exchange rate, the trade or current
7
account balance, real wages, and domestic interest rates could be used as
leading indicators of crises.
2.2 Second-generation Models
“Perhaps the best way to describe what is wrong with the canonical model (first
generation model) is to say that it represents government policy (though not the
market response) in a very mechanical way. The government is assumed to
blindly keep on printing money to cover a budget deficit, regardless of the
external situation; the central bank is assumed to doggedly sell foreign exchange
to peg the exchange rate until the last dollar of reserves is gone” (Krugman,
1998, p.3). In reality both the government and the central bank have much
wider policies to defend the exchange rate, including in particular the ability to
tighten domestic fiscal and monetary policies. Of course, there are costs to
such policies and “defense of an exchange rate is a matter of tradeoffs rather
than a simple matter of selling foreign exchange until the money is gone”
(Krugman, 1998, p.3).
Second generation models focus on the possibility of a crisis even when
economic fundamentals do not deteriorate to a degree assumed by first
generation models. In these models, economic policies are not predetermined
but respond to changes in the economy, and economic agents take this
relationship into account in forming their expectations. These models require
three ingredients. First, there must be a reason why the government would like
to abandon the fixed exchange rate. Second, there must be a reason why the
government would like to defend the rate. Finally, the costs of defending the
fixed exchange rate must increase as market participants expect that the rate
might be abandoned.
Why might a government have a motive to abandon the fixed exchange rate?
One possibility is if the government has a large debt burden denominated in
domestic currency. In this case the government might reduce costs of debt
servicing by inflation, but cannot do so as long as the exchange rate is fixed.
8
Another possibility is if the country suffers from unemployment and the
government would like to adopt a more expansionary monetary policy.
Why might a government have a motive to defend the fixed exchange rate? One
answer might be that it has a history of inflation and regards a fixed exchange
rate as a guarantor of credibility. Another might be that abandonment of a fixed
rate may cause foreign investors to withdraw their money.
Finally, why would public lack of confidence in maintenance of a fixed rate
have the effect of making that rate more difficult to defend? Obstfeld (1994)
emphasizes that a fixed rate will be costly to defend if market participants
expected in past that it would be depreciated now. For example, debt-holders
might have demanded a high rate of interest in anticipation of depreciation. Or
unions, expecting depreciation, might have set wages at higher levels. Another
alternative is to suppose that a fixed rate is costly to defend if people now
expect that it will be depreciated in future. One channel involves short-term
interest rates: to defend the currency in the face of future depreciation requires
higher short-term rates that might depress output and employment.
As pointed out in Krugman (1996), it is possible to combine three ingredients
to produce a general story about currency crises. Suppose that a country’s
fundamental tradeoff between the costs of maintaining the current parity and
costs of abandoning it is predictably deteriorating, so that at some date the
government is likely to abandon parity even without speculative attacks.
Speculators expecting this would surely try to buy foreign currency ahead of
devaluation; by doing so they would worsen the government’s tradeoff, leading
to an earlier devaluation. Therefore, a crisis would take place before the
fundamentals would appear to make devaluation necessary.
Recent models also have suggested that crises may develop without any
noticeable change in fundamentals. Nevertheless, it may be the case that the
government will abandon the peg if faced with a sufficiently severe speculative
attack. The result in such cases will be the possibility of self-fulfilling exchange
9
rate crises and multiple equilibria, when the economy moves from one
equilibrium to another without a change in fundamentals. An individual
investor will not pull his money out of country if he believes that the currency
regime is in no imminent danger, but he will do so if a currency collapse seems
likely. A crisis takes place if many individual investors pull their money out.
The result is that either optimism or pessimism will be self-confirming. In the
case of self-confirming pessimism, a country will be justified in claiming that it
suffered an unnecessary crisis. An important implication of models with self-
fulfilling crises is that predicting crises may be extremely difficult
2.3. Balance Sheet Crises
As stressed by Feldstein (1999), a country may come under attack even if it has
a current account surplus and the exchange rate is not overvalued. This
happens if private and government short-term liabilities denominated in foreign
currencies exceed the country’s foreign exchange reserves. Thus, the country is
solvent, because it can repay its obligations in future, but has problems of
illiquidity since it cannot meet its obligations in short-term. If foreign investors
have confidence in the country they will continue to roll over the short-term
debts. But if enough creditors believe that the country will not be able to meet
obligations because other investors will withdraw their money, the country is
forced to default or reschedule its payment obligations or to devalue its
currency.
Dornbusch (1998) found that one of the reasons for the Asian crisis is
mismatching of maturities in the balance sheet of the financial system. If
emerging market banks and firms borrow short either because it is cheaper or
nobody is willing to lend to them and use this money in long-term projects,
then they are subject to liquidity risk - the sudden inability to roll over debts
that moves the economy to a crisis. “Not a good idea to fund highways with
usch, 1998, p.2)
Balance sheet crises are very similar to financial panic in the model of a bunk
run developed by Dybvig and Diamond (1983). A panic takes place when
10
short-term creditors suddenly withdraw their loans from a solvent borrower.
Dybvig and Diamond stressed that, in general, a panic can occur when three
conditions hold: short-term debts exceed short-term assets; no single creditor is
large enough to supply all of the credits necessary to pay the existing short-term
debts; and there is no lender of last resort. Under these conditions, it is rational
to withdraw credits if the other creditors are also fleeing from the borrower,
even though each creditor is willing to lend if the other creditors will do the
same. Korea’s experience in 1997 is a good example of a balance sheet crisis
(see Dean, 1998).
2.4. Herding Behavior
Both the first and second generation models assume that exchange markets are
efficient, they make the best use of the available information. Nevertheless,
there is very little evidence that such markets are in fact efficient. Crises may
occur as a result of herding behavior of speculators, when investors based their
decisions on limited information and observations what other investors do.
Krugman (1998) provides a good example of such behavior. Suppose that
investor 1 has insider information about stock market, investor 2 has special
information about the financial conditions of banks and investor 3 has
confidential information about government policy. If, for example, investor 1
receives negative information about prospects of stock market, he can
withdraw money. Investor 2, observing that investor 1 goes away from the
market, can also sell even though his information is neutral or even slightly
positive. Finally, investor 3 also sells even though his private information is
positive, because he may conclude that information obtained by investors 1 and
2 is negative, while in fact only the first investors received bad news.
Krugman (1998) provides another explanation of herding behavior that
is based on the fact that much of the invested money is managed by agents
rather than by principals. If performance of managers is evaluated by
comparison with other managers then managers have strong incentives to act
alike. Krugman express the behavior of managers in the following way: “I will
11
probably feel worse if I lose money in a Thai devaluation when others do not
than I will if I lose the same amount of money in general rout” (Krugman,
1998, p. 6).
2.5. Contagion Effects
Currency crisis in one country can cause strong pressure on exchange
rates and asset prices in other countries and lead to crises in these countries.
There are several reasons why a crisis in one country causes a crisis in other
countries. First, a crisis in one emerging market may affect the macroeconomic
fundamentals in other emerging markets, for instance because devaluation
reduces the price competitiveness of other countries. Second, a crisis in one
country can conceivably trigger a crisis elsewhere for reasons unexplained by
macroeconomic fundamentals. Third, a crisis may spread from one country to
another if the two countries have macroeconomic or financial similarities. Some
authors consider all three channels as contagion. Masson (1998) proposes to
distinguish these various reasons and applies the term contagion only to the
second category, while the first category is called “spillovers” and the third
category is called “monsoonal effects”. In this paper I will follow his definitions
and, thus, will distinguish spillovers, monsoonal and contagion effects.
Eichengreen, Rose and Wyplosz (1996) in their empirical study find that crises
appear to spread more easily to countries which are closely tied by international
trade linkages than to countries in similar macroeconomic circumstances. Glick
and Rose (1998) also find empirical support that patterns of international trade
are important in understanding how currency crises spread; by way of contrast,
macroeconomic and financial influences are found not to be associated with the
cross-country incidence of speculative attacks.
One explanation of pure contagion between seemingly unlinked economies is
provided by Drazen (1997). Countries may be perceived as a group with some
common, but imperfectly observed characteristics. For example, countries may
share common culture and if investors see one country with that culture to
abandon its exchange rate under pressure they may revise downward their
12
estimates of the willingness of other such countries to defend their exchange
rates.
Calvo (1999) provides another model that incorporates contagion and herding
behavior. The key point of the model is that knowing about emerging market
economies involves large fixed cost relative to the size of investment projects.
Learning about any single country is costly and requires a team of experts
continuously monitoring macroeconomic and political variables. In the case of
emerging market monitoring is even costly since the economy transforms
rapidly. Thus, fixed cost generates economies of scale. This makes it plausible
to assume that there is a set of informed investors and a set of uninformed
investors. Since informed investors know better about a given project they have
incentives to borrow to finance this project and, thus, are potentially liable to
margin calls. If investors lose money in one country they are subject to margin
calls and will withdraw money from other countries. Uninformed investors, in
turn, observe price and some details of investment strategy followed by
informed investors. If they see that informed investors sell emerging market
securities they cannot determine whether this selling is caused by changes in
fundamentals or because informed investors are subject to margin calls. Thus,
they face what sometimes is called as a “signal extraction”. If they also decide
to sell securities and withdraw money then a country faces capital outflow that
may be not related to its fundamentals. So, this model provides the channel
through which a crisis in one emerging economy may spread to all emerging
economies.
Goldstein (1998) provides another view of contagion. In his model contagion
operates through changes in expectations for unchanged values of fundamentals
and a crisis in one country creates a “wake up call” for another country. In this
view, fundamentals are in fact poor, but investors did not realize this until a
crisis somewhere else does not manifest problems with fundamentals.
It should be mentioned that some authors refer to contagion effects as a part of
second-generation models.
13
C h a p t e r 3
DO FIRST GENERATION MODELS EXPLAIN THE CRISIS?
First, Ukraine had a budget deficit. Second, Ukraine adopted an exchange rate-
based inflation stabilization plan. Third, although the government financed a
budget deficit mainly by borrowing abroad rather than by printing money,
capital inflows were not sterilized and, thus, one could expect a growth in
money supply. These three facts imply that first generation models may explain
the Ukraine’s currency crisis.
First generation models provide channels through which a crisis may take place,
but they do not answer the questions: what budget deficit is sustainable, what
growth in money supply is dangerous and so on. In order to answer these
questions we need to look at empirical facts about crises. For these purposes, I
review empirical studies on the determinants of currency crises and present
stylized facts about them.
3.1. Empirical Determinants of Currency Crises: An Overview
The main goal of this subsection is to review approaches that are used for an
analysis of currency crises, such as single-country and multi-country studies,
“warning system” approach, and stylized facts, emphasizing variables that were
found as leading indicators of crises.
There are a large number of empirical studies on the determinants of currency
crises. All the studies were driven by desire of authors to analyze potential
causes and symptoms of currency crises and to develop a warning system that
would help to monitor whether a country may face a crisis. Financial market
participants are interested in a warning system because they want to make
money, policymakers because they wish to avoid the crisis, and academics
because they “have a long history of fascination with financial crises “
14
(Kaminsky, Lizondo, Reinhart, 1998, p 2). These studies can be divided in two
types. One focuses on analysis of the determinants of crises in a single country.
The other relies on multy-country analysis, and uses either a cross-section of
countries or a panel-data structure.
The single-country studies usually relate the timing of devaluation to the
behavior of several macroeconomic indicators. The classical study was done by
Blanco and Garber(1986) who analyzed the devaluations of the Mexican peso
between 1976 and 1982 and showed that large exchange rate adjustments in
Mexico were preceded by substantial increases in the ex-ante probability of
devaluation. Subsequent studies focused on Argentina (Cumby and Van
Wijnbergen, 1989), Mexico in the 1980s (Goldberg, 1994), Mexico between
1982 and 1994 (Pazarbasioglu and Otker, 1997), and the experiences of several
European countries in the context of the European Monetary System (Otker
and Pazarbasioglu, 1997). For more detailed review of these studies, see
Kaminsky, Lizondo, Reinhart (1998). These works have generally found that
macroeconomic indicators play a key role in determining currency crises. Crises
tend to be preceded by foreign reserve losses, expansionary fiscal and monetary
policies and by high interest rate differentials. However, these results, although
suggestive, are somewhat limited since they are obtained from a small number
of countries during very specific situation.
Multi-country studies avoid the limitations of country-specific analyses due to
the higher variability associated with cross-country information. Although there
is a huge number of multi-country studies I will review only some of them (for
more detailed survey see Esquivel and Larrain (1998) and Kaminsky, Lizondo,
Reinhart (1998)).
Frankel and Rose (1996) use a panel of annual data for 105 developing
countries from 1971 through 1992 to analyze the determinants of currency
crises. They find that low levels of foreign direct investment, low international
reserves (as a share of imports), high domestic credit growth, high foreign
interest rates and overvaluation of the real exchange rate are useful in
15
predicting crises. Interestingly, the authors find that neither the current account
deficit nor the fiscal deficit has a significant effect on the likelihood of a crisis.
Kaminsky, Lizondo, Reinhart (1998) propose the monitoring of indicators that
tend to exhibit unusual behavior prior to a crisis. A currency crisis is defined to
occur when a weighted average of monthly percentage depreciations of the
exchange rate and monthly percentage declines in reserves exceeds its mean by
more than three standard deviations. The authors choose 15 indicators based
on theoretical priors and on the availability of monthly data. An indicator issues
a signal whenever it moves beyond a given threshold level. A “good” signal is
one that is followed by a crisis within 24 months. An “optimal” set of
thresholds is calculated, defined as a set that minimizes the noise-to-signal
ratio: i.e., the ratio of false signals to good signals.
Thresholds are defined relative to the percentiles of the distribution of the
indicator by country. For example, the threshold for real exchange rate
deviations might be the 85th percentile, so that any value of the real exchange
rate deviation above this percentile would constitute a signal. The percentiles
are calculated relative to each country’s empirical distribution of the variable in
question. To continue the example, the threshold value of the real exchange
rate deviation for each country is the 85th percentile of that country’s
distribution of real exchange rate deviations. Thus, minimizing the noise-to-
signal ratio for the sample of countries yields a percentile for each indicator that
is uniform across countries, but the corresponding country-specific thresholds
associated with that percentile will differ across countries.
The variables that have the best track record in anticipating crises include
output, exports, deviations of the real exchange rate from trend, equity prices,
and the ratio of broad money to gross international reserves. The evidence does
not provide support for some of the other indicators that were considered,
including imports, the differential between foreign and domestic real deposit
interest rates, the ratio of lending to deposit interest rates, and bank deposits.
16
Unfortunately, the developed warning system cannot be applied to Ukraine,
since it requires more than 6 years of data available for Ukraine.
Esquivel and Larrain (1998) use a panel dataset with annual information for 30
countries during the period 1975-96. Their paper considerably departs from
other empirical studies. First, the number of countries in their sample is second
largest among empirical studies. Second, unlike studies that have focused
exclusively on either developed or developing countries, their paper uses a
diverse group of 15 high-income and 15 middle-income countries. Finally, the
empirical approach differs from previous studies in that it represents the first
attempt to simultaneously test the main predictions of both first and second-
generation models of currency crises.
The explanatory variables closely associated with first-generation models are
seignorage, real exchange rate misalignment, current account balance, and
M2/reserves ratio. In the light of second-generation models, they choose terms
of trade shock, per capita income growth and contagion effects. Interestingly,
the results indicates that the insights developed by second-generation models
complement rather than substitute for the explanation provided by first-
generation models.
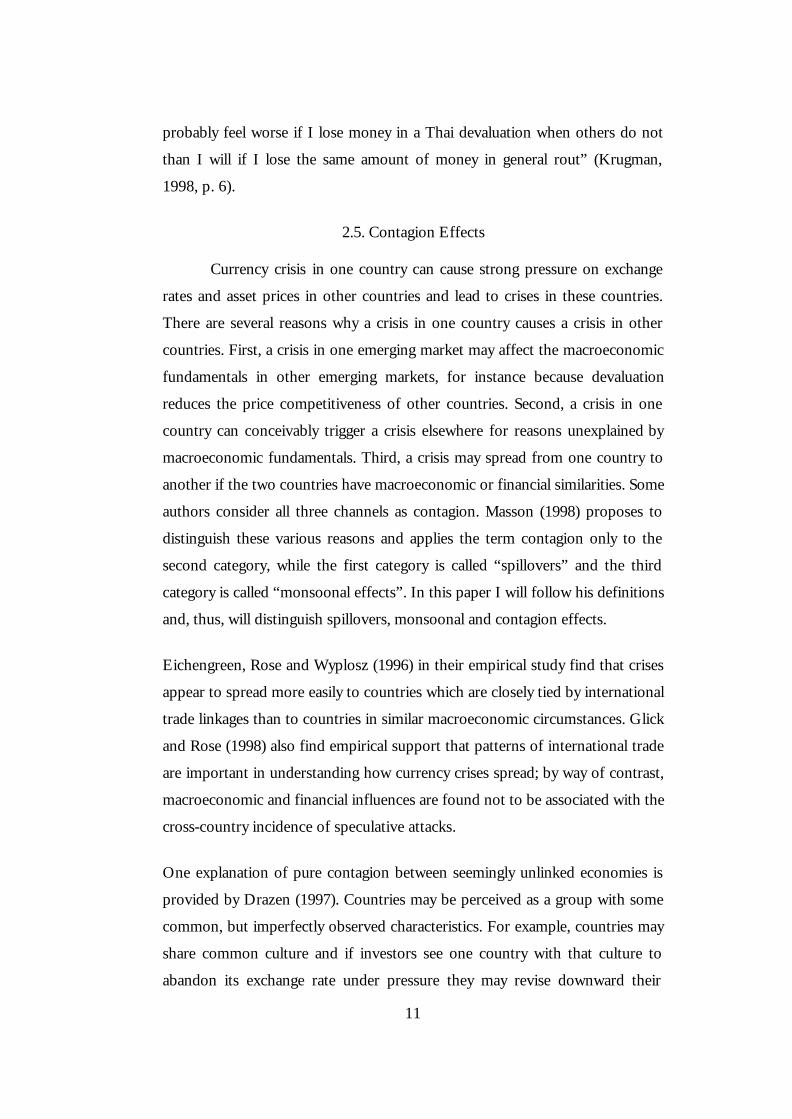
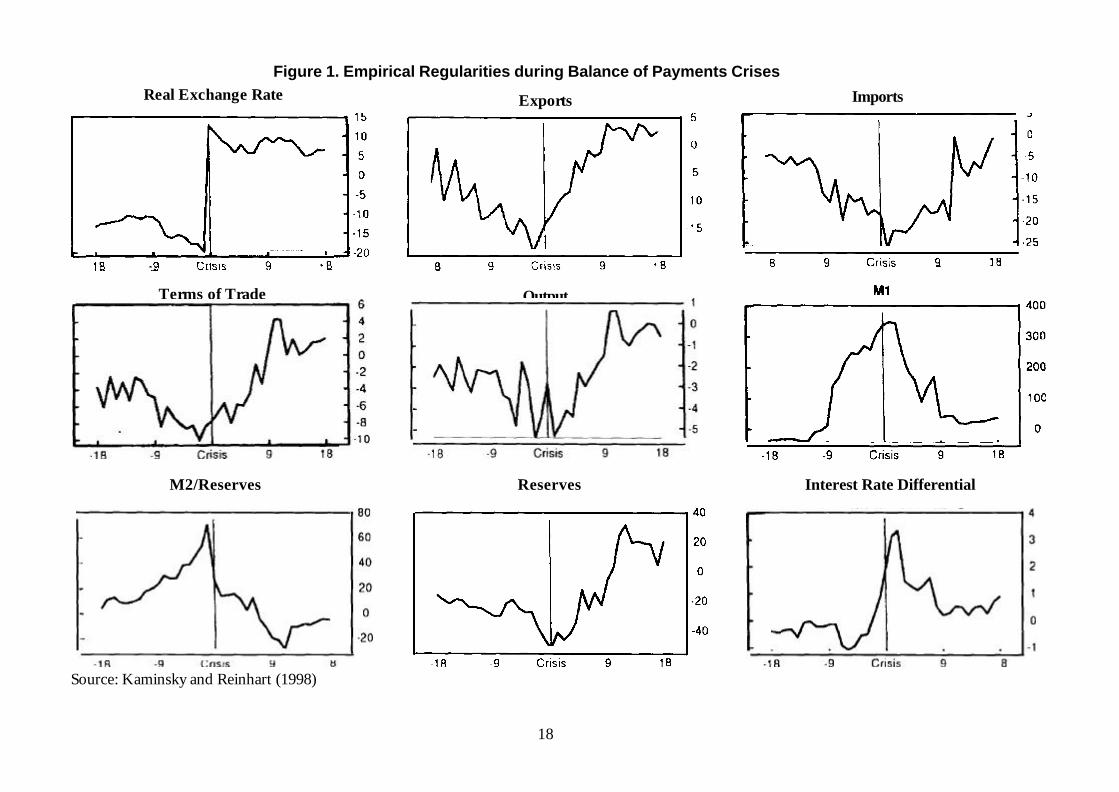
Kaminsky and Reinhart (1996) examine a large number of countries that
experienced crises and find that there are macroeconomic “stylized facts” that
are common for those countries. In particular, they examine the behavior of:
real exchange rates, the value of exports and imports (in US dollars), the terms
of trade (defined as the unit value of exports over the unit value of imports),
the ratio of M2 (converted into dollars) to foreign exchange reserves, and
domestic-foreign interest rate differentials. Interest rate differentials are
reported in levels, while real exchange rate in the percent difference in the
index level relative to tranquil times. All the other variables are reported as 12-
month percent changes, again, relative to tranquil times. Since it is difficult to
say what times are tranquil for Ukraine, we cannot apply these stylized facts
directly but for sure can draw some conclusions.
17
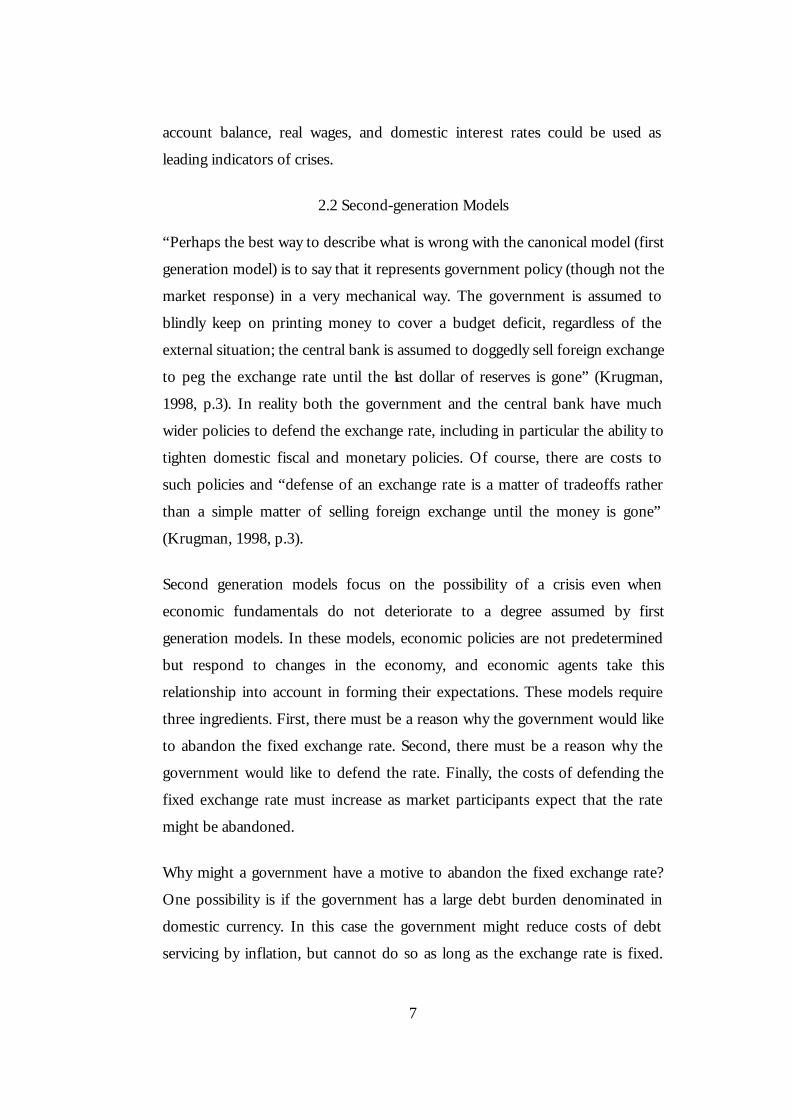
Figure 1 is taken from their article. As can be seen, the real exchange rate is
overvalued and continues to appreciate before a crisis. The large real
appreciation before the crisis is, not surprisingly, accompanied by deterioration
in the performance of export, as shown on the next panel. As the real exchange
rate appreciates, we should expect growth in imports. Nevertheless, as can be
seen from the next panel, imports falls before the crisis. This can be explained
by slowdown in economic activity and the deterioration of the terms of trade,
and a decline in output shows that economic activity decreases. The next two
panels show the evolution of monetary aggregates. The first panel shows M2
and the next one shows M2-to-reserve ratio. The months preceding crises are
characterized by expansionary monetary policy as follows from theory. With
fixed or nearly fixed exchange rate regime, it is reasonable to expect that the
central bank stands ready to back some portion of the monetary base. As
reserves fall and monetary aggregate M2 grows prior a crisis, M2-to-reserves
ratio increased sharply. The next panel shows the 12-months percentage change
in foreign reserves. As expected, reserves fall substantially prior a crisis. Finally,
the last panel shows the evolution of interest rate differential. The high
(relative to normal times) interest rate differentials observed immediately
before crisis
18
Figure 1. Empirical Regularities during Balance of Payments Crises
Exports
Source: Kaminsky and Reinhart (1998)
Real Exchange Rate Imports
Terms of Trade Output
M2/Reserves Reserves Interest Rate Differential
20
could be a sign that monetary policy was tightened in order to stem reserve
losses.
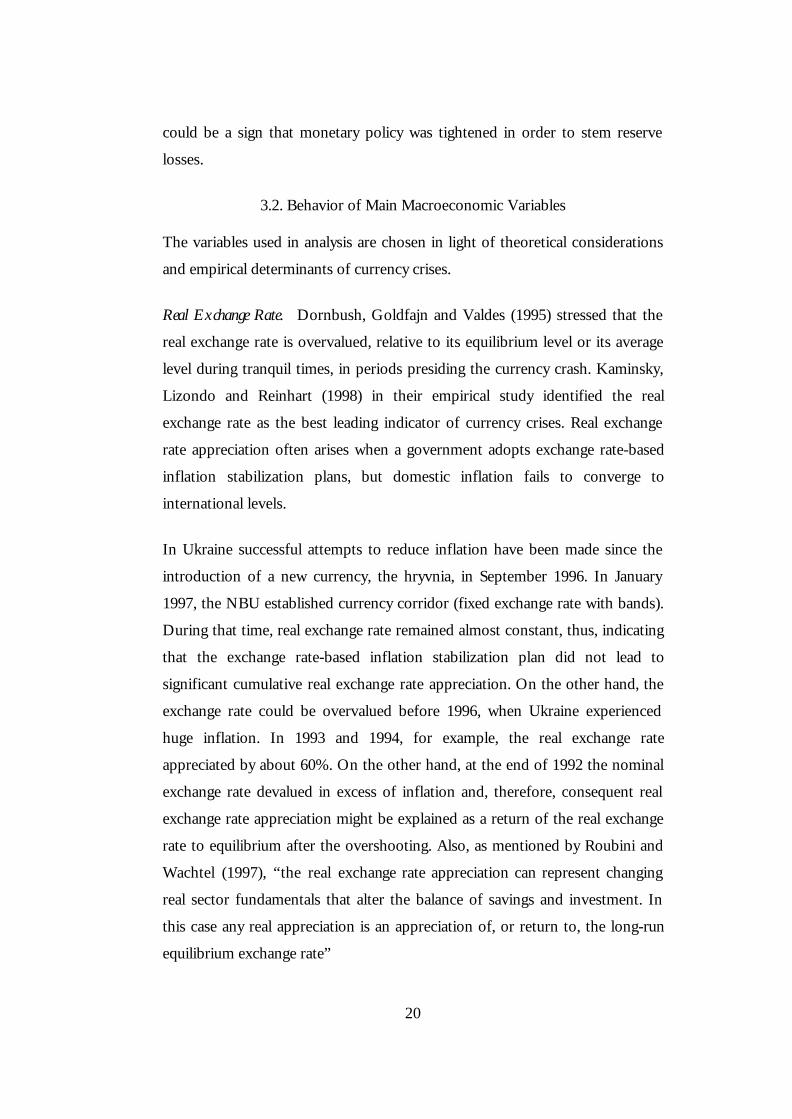
3.2. Behavior of Main Macroeconomic Variables
The variables used in analysis are chosen in light of theoretical considerations
and empirical determinants of currency crises.
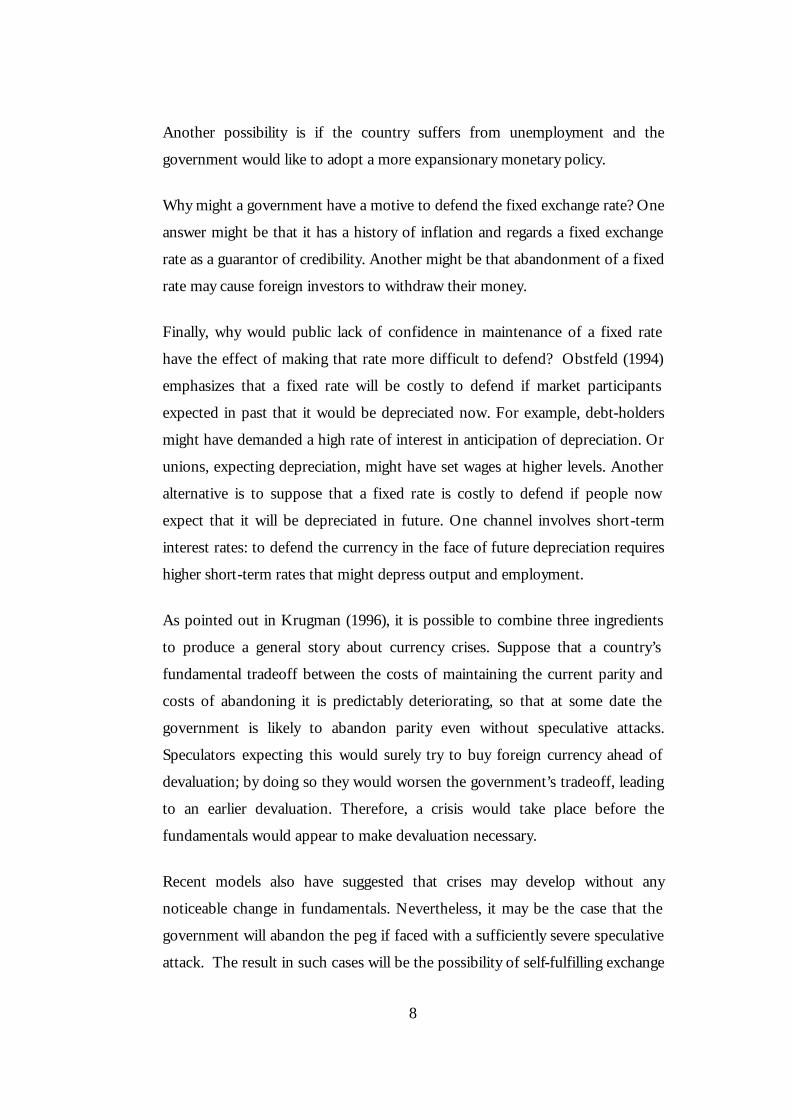
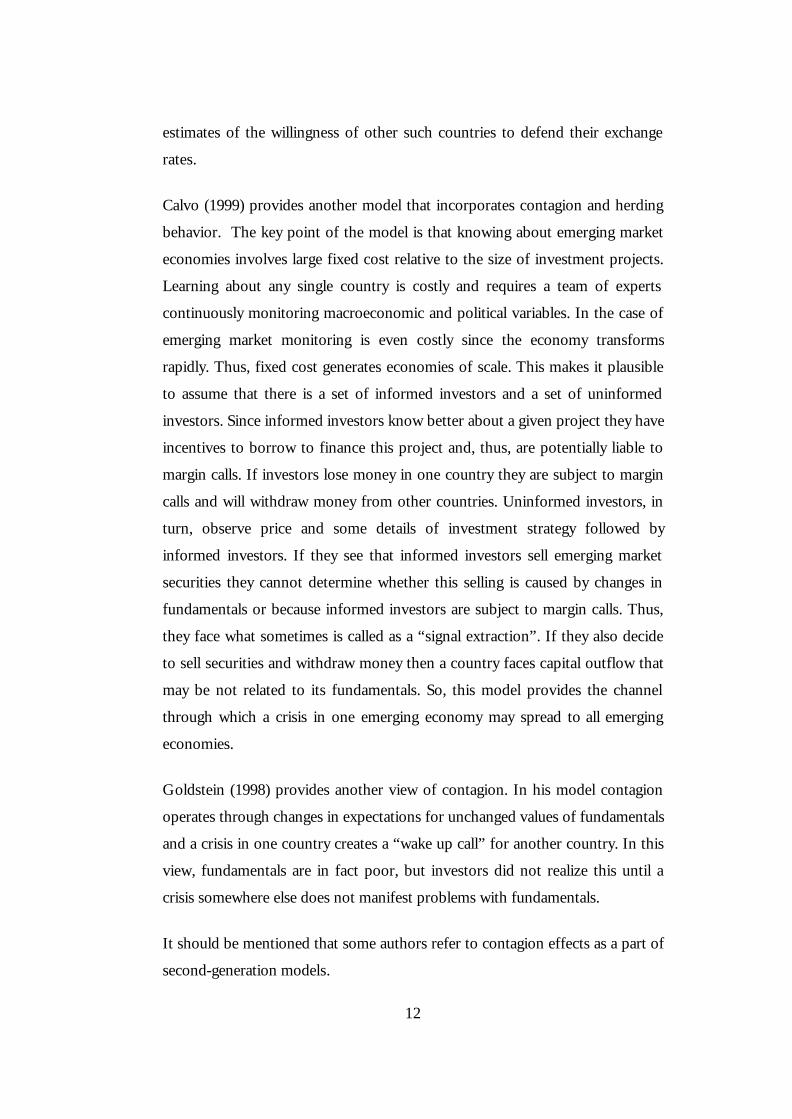
Real Exchange Rate. Dornbush, Goldfajn and Valdes (1995) stressed that the
real exchange rate is overvalued, relative to its equilibrium level or its average
level during tranquil times, in periods presiding the currency crash. Kaminsky,
Lizondo and Reinhart (1998) in their empirical study identified the real
exchange rate as the best leading indicator of currency crises. Real exchange
rate appreciation often arises when a government adopts exchange rate-based
inflation stabilization plans, but domestic inflation fails to converge to
international levels.
In Ukraine successful attempts to reduce inflation have been made since the
introduction of a new currency, the hryvnia, in September 1996. In January
1997, the NBU established currency corridor (fixed exchange rate with bands).
During that time, real exchange rate remained almost constant, thus, indicating
that the exchange rate-based inflation stabilization plan did not lead to
significant cumulative real exchange rate appreciation. On the other hand, the
exchange rate could be overvalued before 1996, when Ukraine experienced
huge inflation. In 1993 and 1994, for example, the real exchange rate
appreciated by about 60%. On the other hand, at the end of 1992 the nominal
exchange rate devalued in excess of inflation and, therefore, consequent real
exchange rate appreciation might be explained as a return of the real exchange
rate to equilibrium after the overshooting. Also, as mentioned by Roubini and
Wachtel (1997), “the real exchange rate appreciation can represent changing
real sector fundamentals that alter the balance of savings and investment. In
this case any real appreciation is an appreciation of, or return to, the long-run
equilibrium exchange rate”
21
It is difficult to say to what degree the exchange rate is overvalued in Ukraine.
One conclusion can be drawn from the discussion above. If the real exchange
rate misalignment indicated a crisis, it indicated a crisis for both 1997 and 1998
years, since the real exchange rate did not appreciate significantly during 1996
and 1997.
Real Exchange Rate, Index base '92
0,00
5,00
10,00
15,00
20,00
25,00
Oct
-95
Jan-
96
Apr
-96
Jul-9
6
Oct
-96
Jan-
97
Apr
-97
Jul-9
7
Oct
-97
Jan-
98
Apr
-98
Jul-9
8
Oct
-98
UA
H/U
SD
Source: Ukrainian Economic Trends. 1998. November
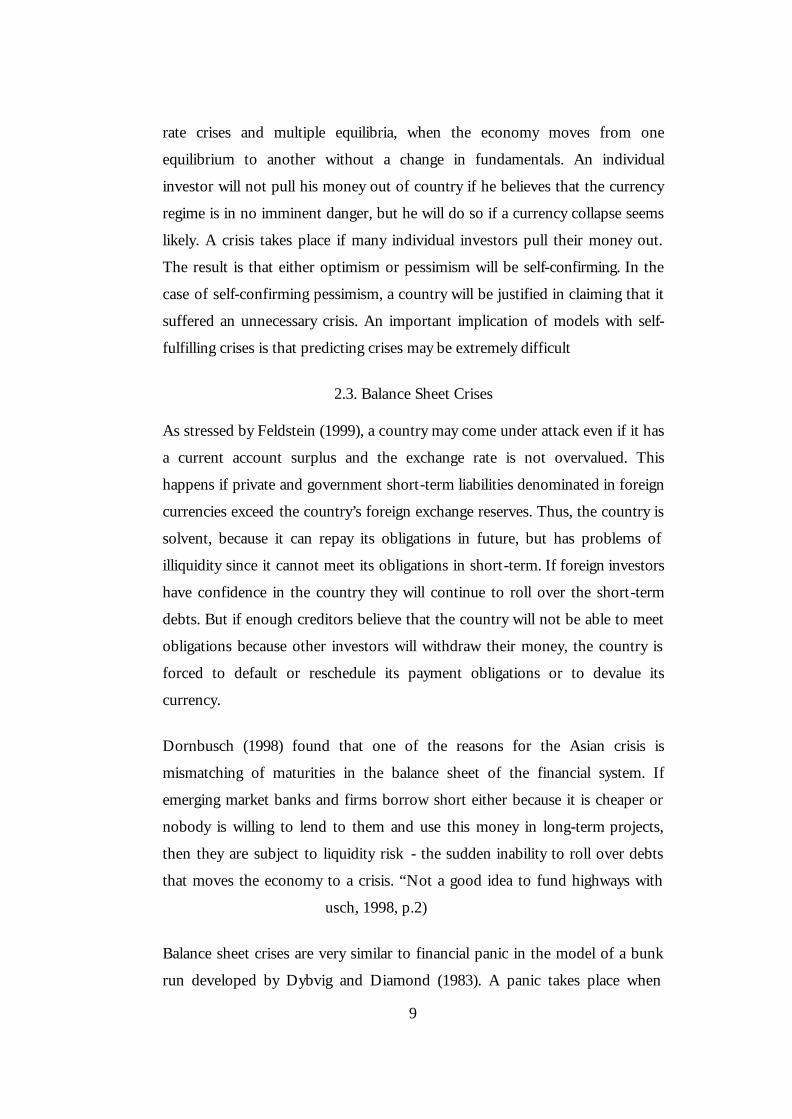
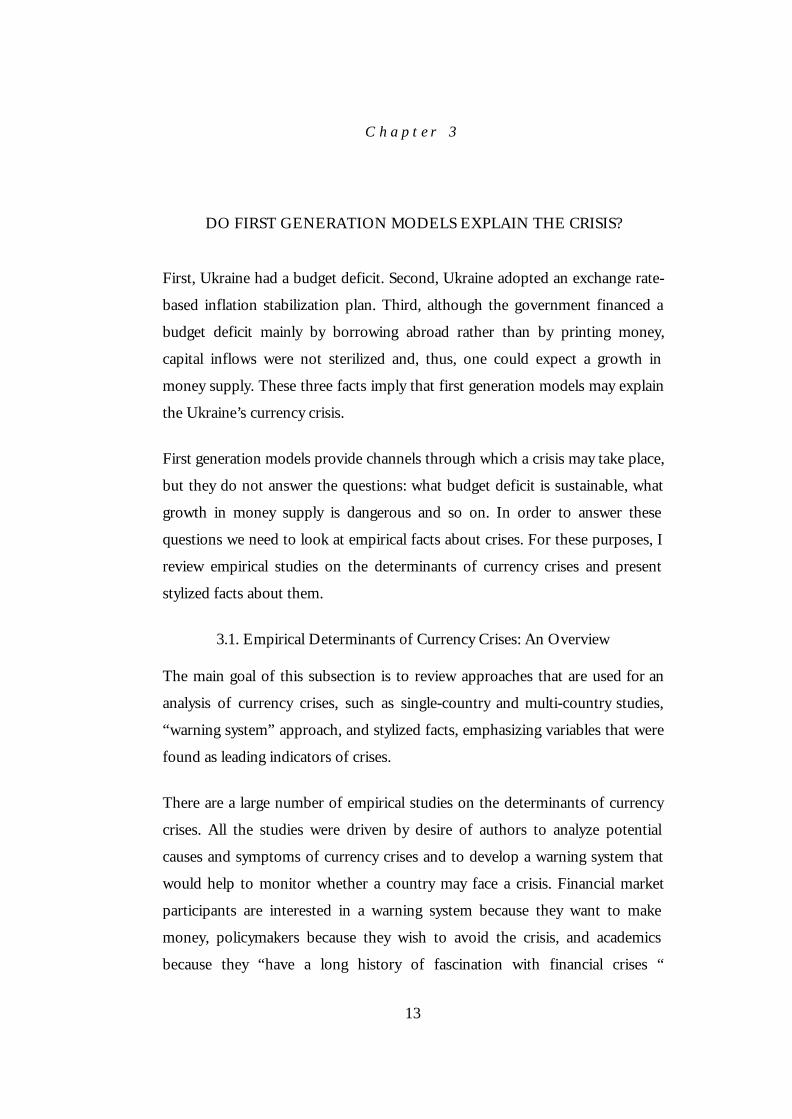
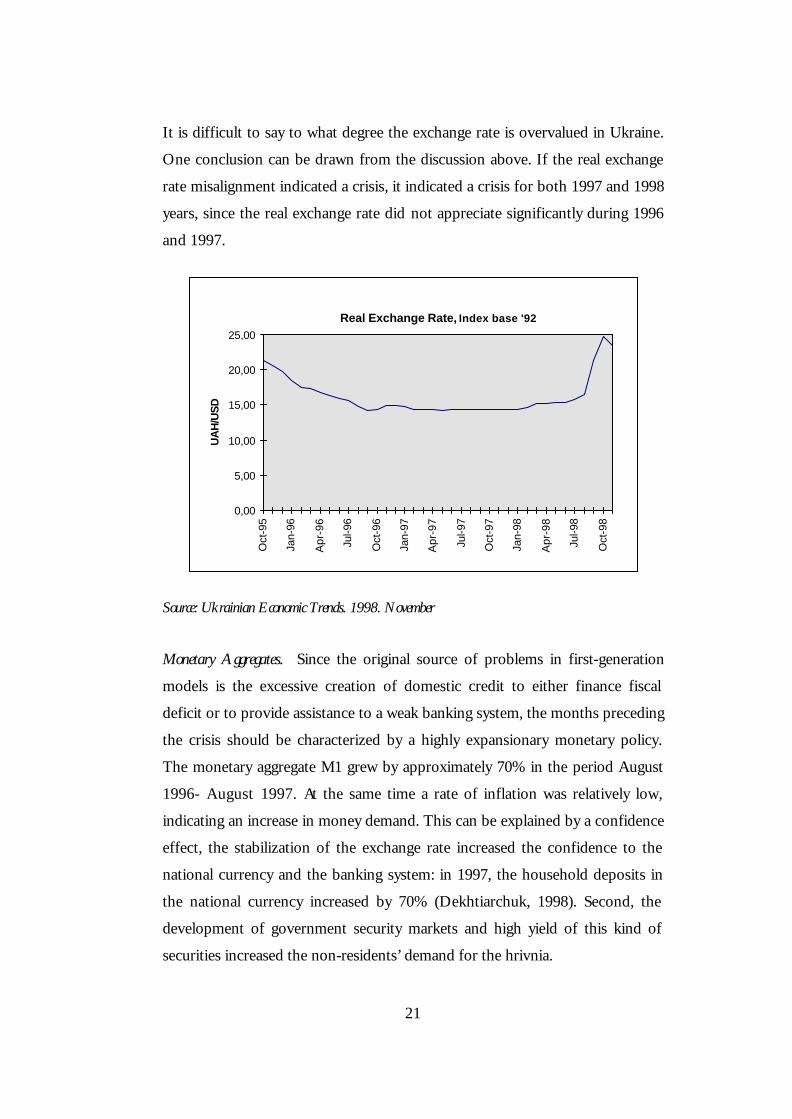
Monetary Aggregates. Since the original source of problems in first-generation
models is the excessive creation of domestic credit to either finance fiscal
deficit or to provide assistance to a weak banking system, the months preceding
the crisis should be characterized by a highly expansionary monetary policy.
The monetary aggregate M1 grew by approximately 70% in the period August
1996- August 1997. At the same time a rate of inflation was relatively low,
indicating an increase in money demand. This can be explained by a confidence
effect, the stabilization of the exchange rate increased the confidence to the
national currency and the banking system: in 1997, the household deposits in
the national currency increased by 70% (Dekhtiarchuk, 1998). Second, the
development of government security markets and high yield of this kind of
securities increased the non-residents’ demand for the hrivnia.
22
Thus, the described phenomenon is remonetization of the economy. The
economy was significantly demonetized during the period of hyperinflation,
when foreign currency played the roles of medium of exchange and store of
value. The maximum 12-months percentile growth of M1 was about 70% in
August 1997. This number is sufficiently below usually observed growth
preceding crises in other countries: 200% - 300% relative to tranquil times
(Kaminsky and Reinhart, 1996, see figure 1). Therefore, the money growth was
not so expansionary as in other countries that faced crises. However, it should
be mentioned that the sensitivity of the economy to money growth depends on
the level of monetization. An economy with the level of monetization equal to,
say, 70% is less sensitive to money growth than an economy, like Ukraine,
where the level of monetization is about 15%.
Monetary Aggregate M1
Aug 1997
0100020003000400050006000700080009000
10000
Jan
1996
Apr
199
6
Jul 1
996
Oct
199
6
Jan
1997
Apr
199
7
Jul 1
997
Oct
199
7
Jan
199
8
Apr
199
8
Jul 1
998
Oct
199
8
mln
UA
H
Source: Ukrainian Economic Trends. 1998. November.
Current Account Balance. Roubini and Watchel (1997) stressed that a current
account deficit may be a reflection of both the strength and weakness of a
developing economy. “On the one hand, a current account deficit may be a
reflection of the strength, if it measures resources coming into the economy to
finance investment demand in excess of national saving. On the other hand, a
current account deficit can reflect a dangerous and unsustainable imbalance
23
between national savings and domestic investment and the accumulation of
debts that cannot be serviced”. A deterioration of the current account balance
is expected in anticipation of a currency crisis. In 1996 and 1997 current
account deficit was 2.7% of GDP (ICPS, 1998).
Economic Activity. The slowdown of economic activity is usually observed before
crisis (Kaminsky and Reinhart, 1996). This slowdown may be reflected in a
decline in output, the terms of trade and import. Since Ukraine has never
experienced growth in output, we cannot use this indicator in our analysis,
since we cannot distinguish whether a decline of output is due to
transformation of the economy or due to slowdown of economic activity prior
to a crisis. Exports and imports grew by 9% and 17% in 1996 respectively
(UEPLAC, 1998). But in 1997 exports and imports fell slightly (by less than
1%). In the first nine months of 1998 export and import fell more radically,
export by 13% and import by 17% (PBU, 1998). This can be partly explained
by a decrease of exports to Asian countries due to the Asian crisis (Asia had
imported approximately 70% of Ukrainian metallurgical export (ICPS, 1998b))
and partly by an agreement between Russia and Ukraine under which Ukraine
reduced prices on gas transport, while Russia reduced prices on gas sold to
Ukraine (Volchenko, 1998). Also, government has adopted seven decrees and
increased more than 400 rates of duty for first six months 1998 in order to
reduce import (Volchenko, 1998).
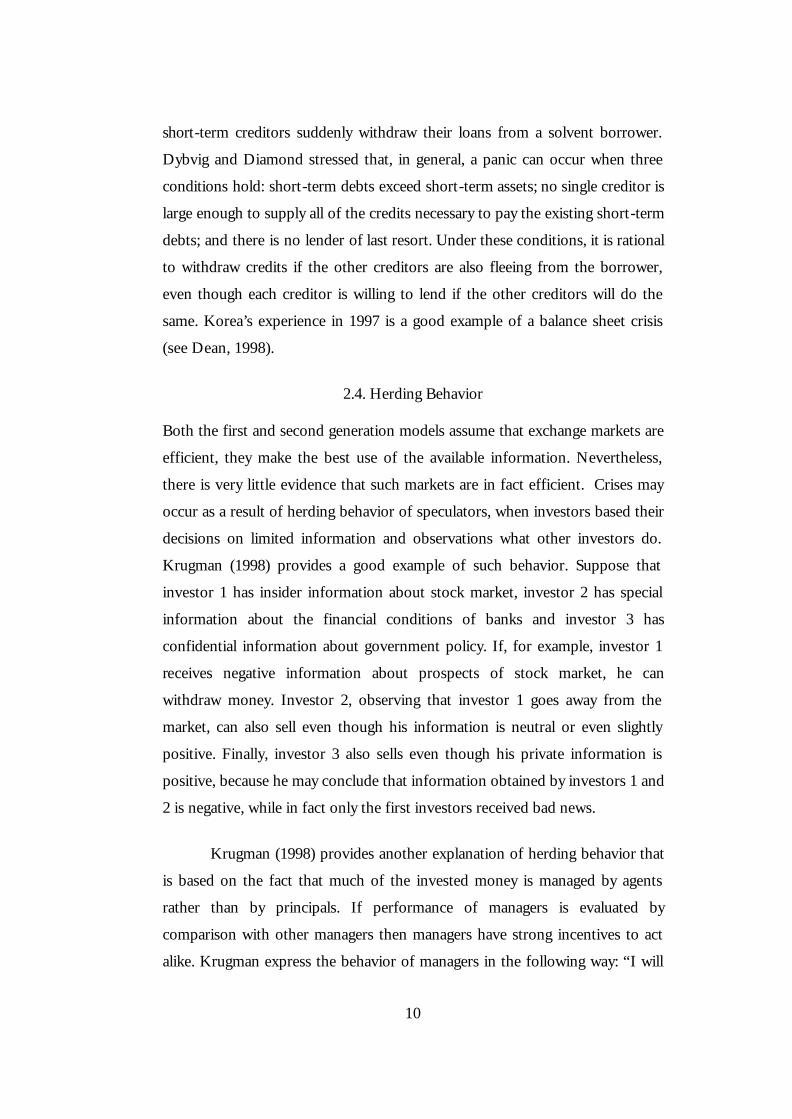
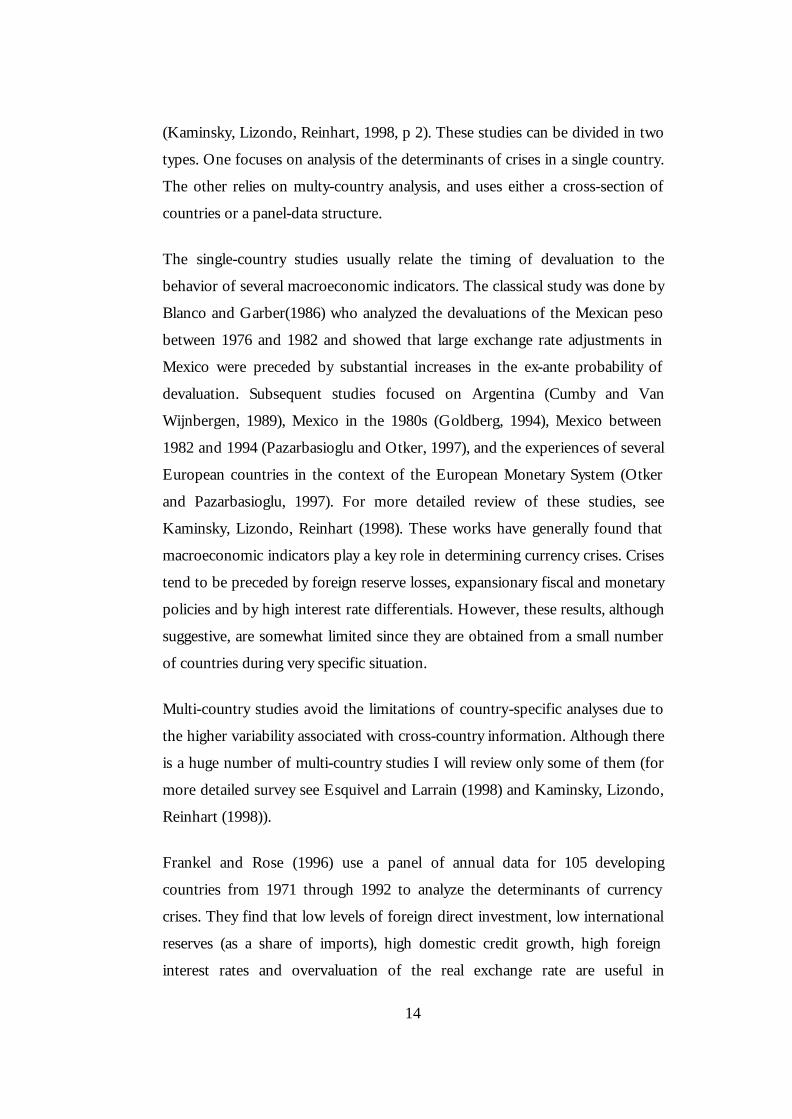
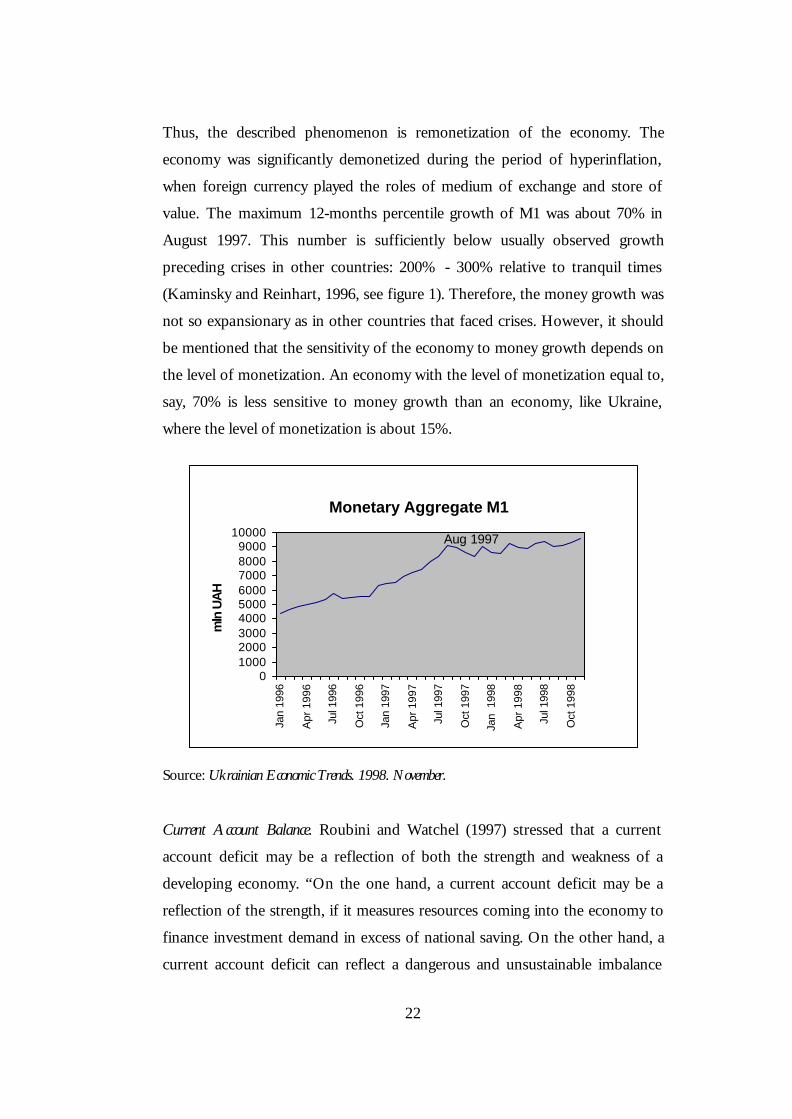
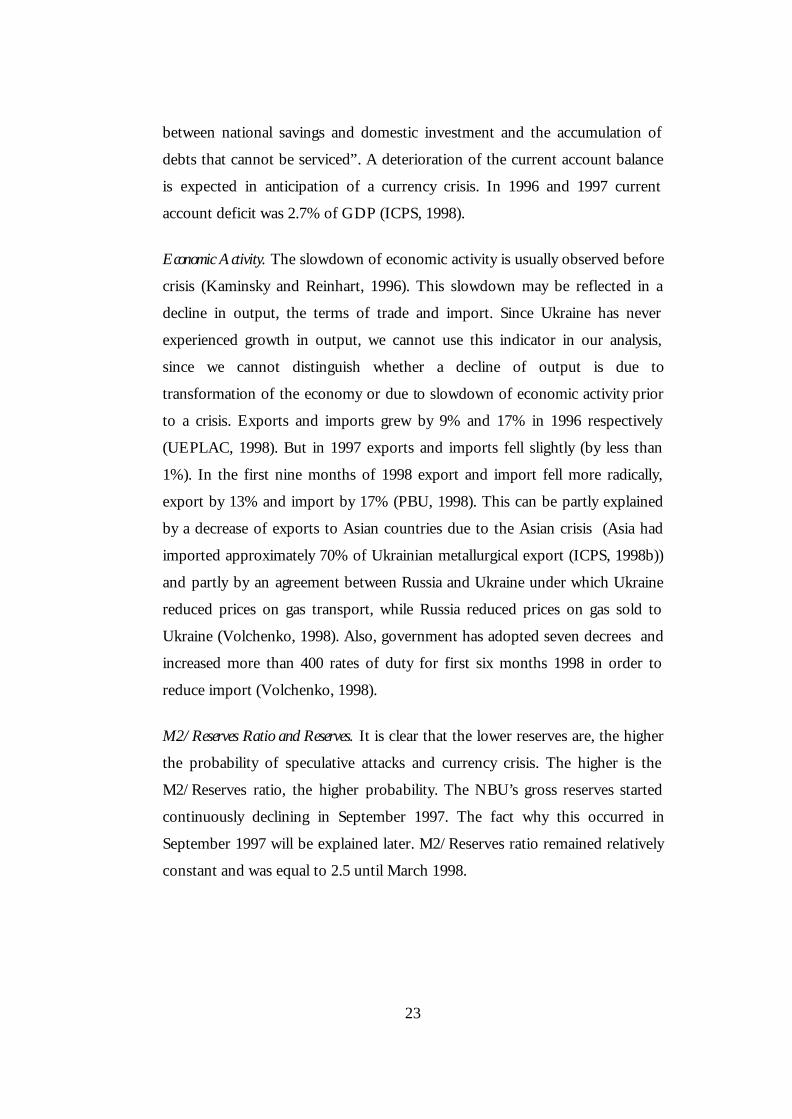
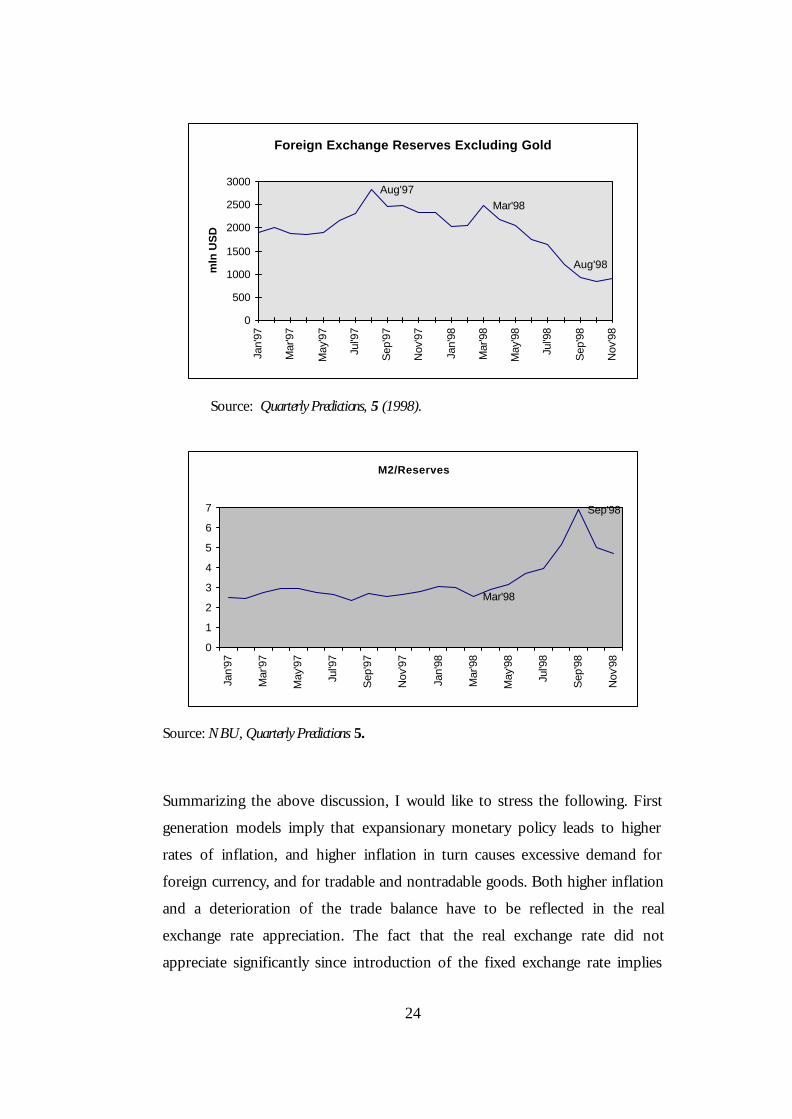
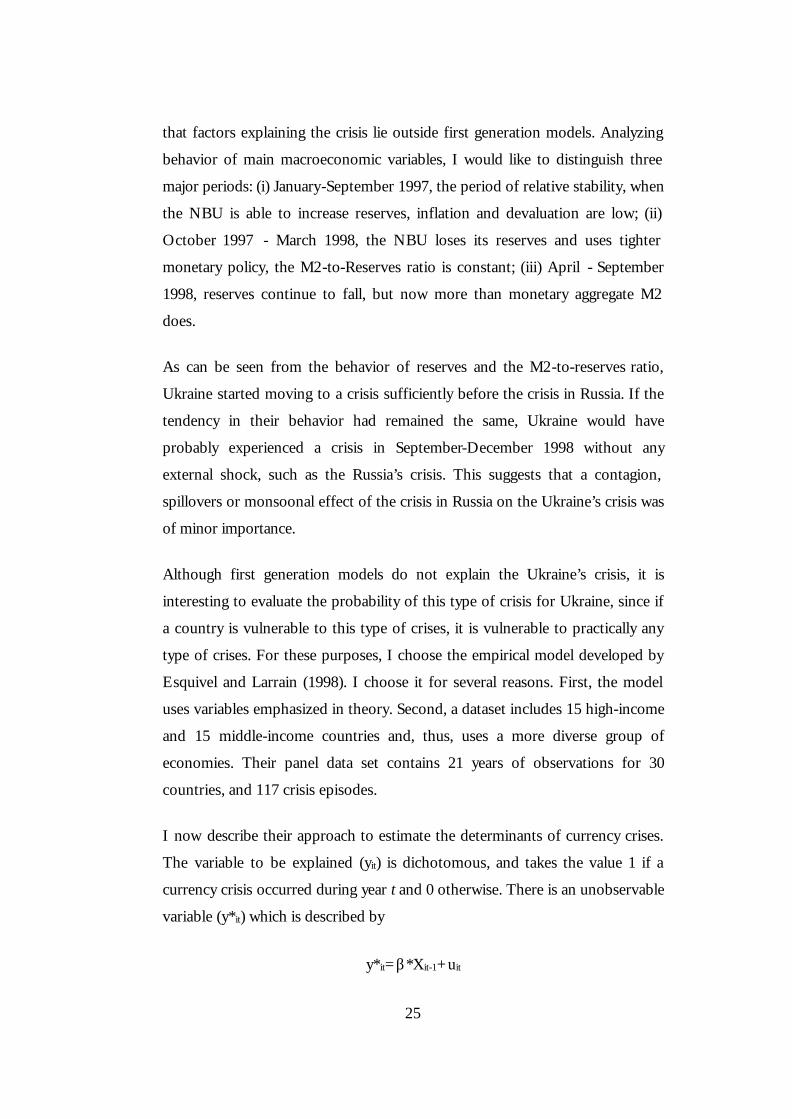
M2/Reserves Ratio and Reserves. It is clear that the lower reserves are, the higher
the probability of speculative attacks and currency crisis. The higher is the
M2/Reserves ratio, the higher probability. The NBU’s gross reserves started
continuously declining in September 1997. The fact why this occurred in
September 1997 will be explained later. M2/Reserves ratio remained relatively
constant and was equal to 2.5 until March 1998.
24
Foreign Exchange Reserves Excluding Gold
Aug'97Mar'98
Aug'98
0
500
1000
1500
2000
2500
3000
Jan'
97
Mar
'97
May
'97
Jul'9
7
Sep
'97
Nov
'97
Jan'
98
Mar
'98
May
'98
Jul'9
8
Sep
'98
Nov
'98
mln
US
D
Source: Quarterly Predictions, 5 (1998).
M2/Reserves
Mar'98
Sep'98
0
1
2
3
4
5
6
7
Jan'
97
Mar
'97
May
'97
Jul'9
7
Sep
'97
Nov
'97
Jan'
98
Mar
'98
May
'98
Jul'9
8
Sep
'98
Nov
'98
Source: NBU, Quarterly Predictions 5.
Summarizing the above discussion, I would like to stress the following. First
generation models imply that expansionary monetary policy leads to higher
rates of inflation, and higher inflation in turn causes excessive demand for
foreign currency, and for tradable and nontradable goods. Both higher inflation
and a deterioration of the trade balance have to be reflected in the real
exchange rate appreciation. The fact that the real exchange rate did not
appreciate significantly since introduction of the fixed exchange rate implies
25
that factors explaining the crisis lie outside first generation models. Analyzing
behavior of main macroeconomic variables, I would like to distinguish three
major periods: (i) January-September 1997, the period of relative stability, when
the NBU is able to increase reserves, inflation and devaluation are low; (ii)
October 1997 - March 1998, the NBU loses its reserves and uses tighter
monetary policy, the M2-to-Reserves ratio is constant; (iii) April - September
1998, reserves continue to fall, but now more than monetary aggregate M2
does.
As can be seen from the behavior of reserves and the M2-to-reserves ratio,
Ukraine started moving to a crisis sufficiently before the crisis in Russia. If the
tendency in their behavior had remained the same, Ukraine would have
probably experienced a crisis in September-December 1998 without any
external shock, such as the Russia’s crisis. This suggests that a contagion,
spillovers or monsoonal effect of the crisis in Russia on the Ukraine’s crisis was
of minor importance.
Although first generation models do not explain the Ukraine’s crisis, it is
interesting to evaluate the probability of this type of crisis for Ukraine, since if
a country is vulnerable to this type of crises, it is vulnerable to practically any
type of crises. For these purposes, I choose the empirical model developed by
Esquivel and Larrain (1998). I choose it for several reasons. First, the model
uses variables emphasized in theory. Second, a dataset includes 15 high-income
and 15 middle-income countries and, thus, uses a more diverse group of
economies. Their panel data set contains 21 years of observations for 30
countries, and 117 crisis episodes.
I now describe their approach to estimate the determinants of currency crises.
The variable to be explained (yit) is dichotomous, and takes the value 1 if a
currency crisis occurred during year t and 0 otherwise. There is an unobservable
variable (y*it) which is described by
y*it=β*Xit-1+uit
26
where Xit-1 is a vector of explanatory variables from country i in period t-1, β is
a vector of coefficients to be estimated, and uit is a composite error term. The
observed currency crisis variable behaves according to
yit =1 if y*it >0
and
yit =0 otherwise
The authors use a probit model with random effects and the probability of a
crisis can be then calculated as
Prob(Crisisit)=Φ(βXit-1)
where Φ represents the standard normal distribution.
Running the regression, they obtained the following results (t-statistics in
parenthesis).
y*=0.05*Seignorage+0.014*RERMisalignment-0.049*CAB+0.34*Log(M2/Reserves)
(1.84) (1.98) (-3.00) (3.50)
The dependent variable is the unobservable variable and its threshold level is
0.3. Thus, if estimated y* is greater than 0.3, the country is expected to face a
crisis, otherwise tranquil times are predicted for the next year. The explanatory
variables, which are associated with first-generation models of crises, are
seignorage, real exchange rate misalignment, current account balance and
M2/Reserves. Seignorage is defined as the annual change in reserve money as a
percent of GDP. Since seignorage is usually caused by the need to finance a
budget deficit, this variable can be directly linked to a budget deficit. RER
Misalignment is defined as the negative percentage deviation of the RER from
its average over the previous 60 months. CAB is current account balance as
percent of GDP.
27
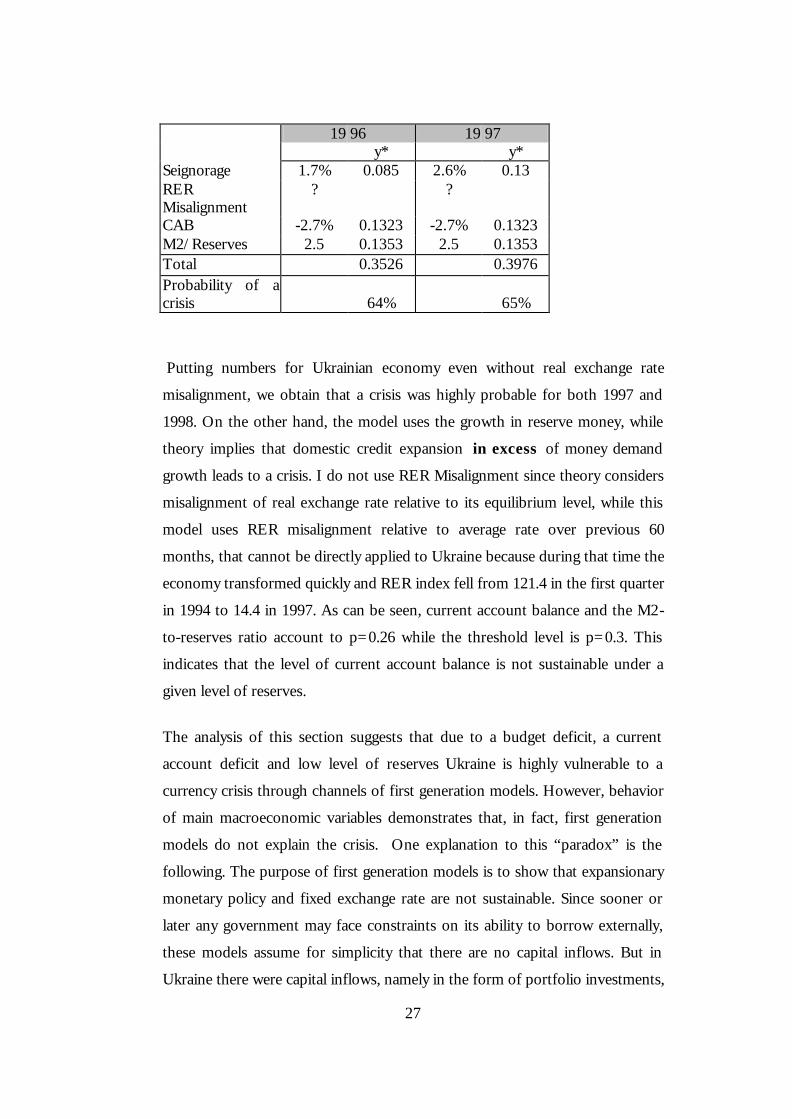
19 96 19 97 y* y* Seignorage 1.7% 0.085 2.6% 0.13 RER Misalignment
? ?
CAB -2.7% 0.1323 -2.7% 0.1323 M2/Reserves 2.5 0.1353 2.5 0.1353 Total 0.3526 0.3976 Probability of a crisis
64%
65%
Putting numbers for Ukrainian economy even without real exchange rate
misalignment, we obtain that a crisis was highly probable for both 1997 and
1998. On the other hand, the model uses the growth in reserve money, while
theory implies that domestic credit expansion in excess of money demand
growth leads to a crisis. I do not use RER Misalignment since theory considers
misalignment of real exchange rate relative to its equilibrium level, while this
model uses RER misalignment relative to average rate over previous 60
months, that cannot be directly applied to Ukraine because during that time the
economy transformed quickly and RER index fell from 121.4 in the first quarter
in 1994 to 14.4 in 1997. As can be seen, current account balance and the M2-
to-reserves ratio account to p=0.26 while the threshold level is p=0.3. This
indicates that the level of current account balance is not sustainable under a
given level of reserves.
The analysis of this section suggests that due to a budget deficit, a current
account deficit and low level of reserves Ukraine is highly vulnerable to a
currency crisis through channels of first generation models. However, behavior
of main macroeconomic variables demonstrates that, in fact, first generation
models do not explain the crisis. One explanation to this “paradox” is the
following. The purpose of first generation models is to show that expansionary
monetary policy and fixed exchange rate are not sustainable. Since sooner or
later any government may face constraints on its ability to borrow externally,
these models assume for simplicity that there are no capital inflows. But in
Ukraine there were capital inflows, namely in the form of portfolio investments,
28
before September 1997. Due to these inflows, supply of dollars on the forex
market usually exceeded demand and the NBU increased its reserves by
interventions. Thus, capital inflows provided stability to the forex market and
hrivnia devaluated only by about 6% from September 1996 to September 1997.
The stability of exchange rate, in turn, sufficiently reduced the rate of inflation.
Nevertheless, in September 1998 capital inflows changed to capital outflows, it
is reasonable to expect that further development would follow channels of first
generation models. In fact, Ukraine faced some constraints on its ability to
borrow in 1998. Although Ukraine has borrowed extensively, 95% of these
loans was spent on debt servicing (HIID, 1998a). Thus, the only remaining
source of financing the budget deficit was seignorage that according to first
generation models could lead to higher rates of inflation and higher devaluation
pressure on the domestic currency. Why that was not so can be explained by
the NBU’s policy. First, since September the NBU has tightened monetary
policy: refinance rate was changed from 16% to 23.9% (Nov-97), then to 35%
(Dec-97), to 42.4% (Feb 98), to 43% (May-98), to 51% (Jun-98), to 76% (Jul-
98), and finally to 82% (Aug-98). Also, the NBU increased the required
reserves from 11% to 15%, and then to 17%. The broken shape of the M1 on
the above figure can be explained in the following way. The NBU increases
money supply, then tightens monetary policy, then again increases money
supply by printing money, again decreases it due to tight monetary policy and
so on. Second, the NBU imposed more severe administrative controls over the
foreign exchange market (see Bereslavska, 1998a), which can be interpreted as
constraints on the banks’ ability to buy dollars just because they prefer to hold
more dollars.
We see that capital inflows play an important role in providing stability. The
reasons why there were capital inflows despite weak fundamentals of the
economy, why foreign investors left Ukraine and what was the impact of capital
outflows are discussed in the next section.
29
C h a p t e r 4
ROLE OF CAPITAL INFLOWS AND OUTFLOWS FOR FINANCIAL STABILITY IN UKRAINE
There are four major types of capital inflow: portfolio investment, foreign direct
investment, bank loans and official lending. Portfolio investment, bank loans
and official lending are forms of debt finance. “The issuer of the instrument
must repay a fixed value (the sum of principal plus interest) regardless of
economic situation.” (Krugman, Obstfeld, 1997, p. 653). Foreign direct
investment is a form of equity finance. “It is a claim to a firm’s profits, rather
then to a fixed payment, and its payoff will vary according to circumstances”
(Ibid.). Thus, debt instruments are more dangerous in the case of adverse
economic events. Among them, official lending from international agencies like
the IMF, the World Bank or directly from foreign governments is a debt
instrument more open to negotiations and quite often possesses interest rates
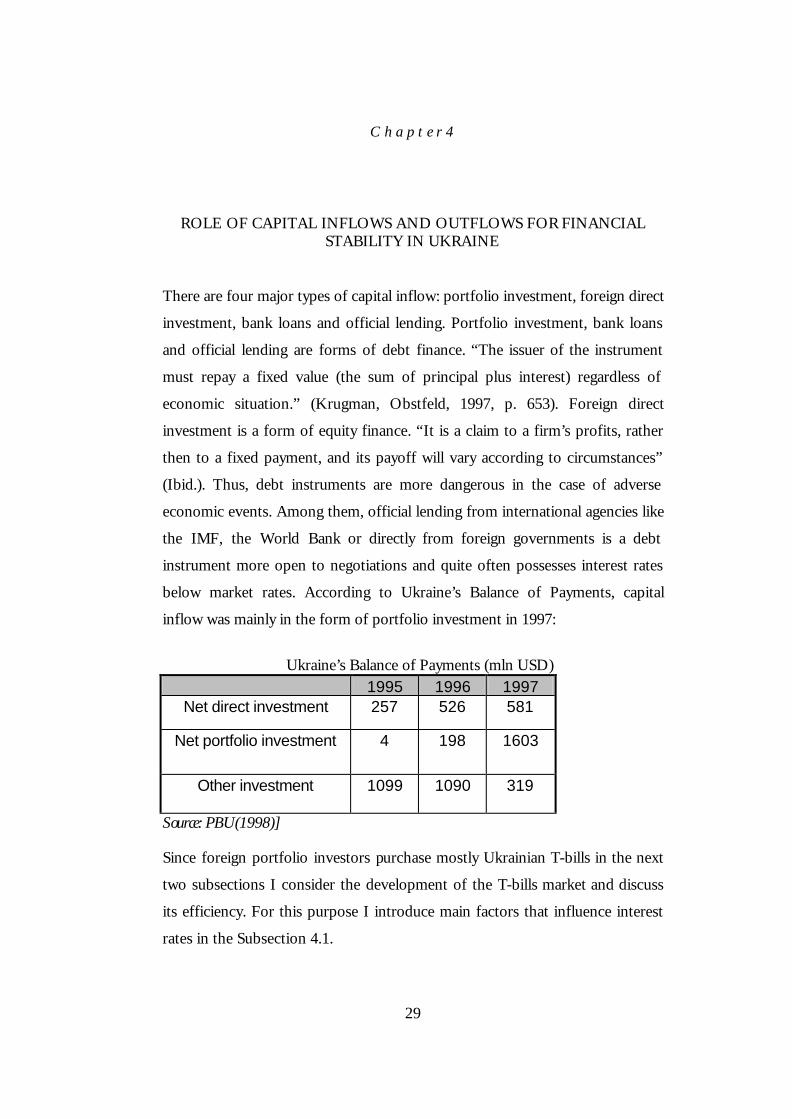
below market rates. According to Ukraine’s Balance of Payments, capital
inflow was mainly in the form of portfolio investment in 1997:
Ukraine’s Balance of Payments (mln USD) 1995 1996 1997
Net direct investment 257 526 581
Net portfolio investment 4 198 1603
Other investment 1099 1090 319
Source: PBU(1998)] Since foreign portfolio investors purchase mostly Ukrainian T-bills in the next
two subsections I consider the development of the T-bills market and discuss
its efficiency. For this purpose I introduce main factors that influence interest
rates in the Subsection 4.1.
30
4.1. Supply and Demand for T-bills
In economics, market equilibrium occurs when the amount that people are
willing to buy equals the amount that people are willing to sell. The price of T-
bills is determined by the same principles. I use supply and demand analysis
that is frequently referred as the loanable funds framework (see Mishkin,
chapter 6). I analyze the primary T-bills market, so the supply of T-bills is
determined by the current need to finance the budget deficit and redeem
previously issued bills. Since T-bills debt grows, the supply of T-bills has
growing trend, implying that the interest rate should go up, ceteris paribus.
If in the developed countries T-bills are considered risk-free securities, they
certainly possess some risks in emerging markets and, thus, buyers require risk
premium on them, shifting the demand curve and increasing interest rate. All
the definitions are taken from Fabozzi, Modigliani and Ferri (FMF, p. 180).
Default risk or credit risk premium. The default risk premium is the reward for
taking on the risk of default in the case of a loan or bond or the risk of loss of
principal for other assets.
Liquidity premium. The liquidity premium is the reward for investing in an asset
that may not be readily converted to cash at a fair maket value.
Exchange-rate risk premium. The exchange-rate risk premium, which is the reward
for investing in an asset that is not denominated in the investor’s home
currency.
Inflation premium. The inflation premium is the compensation for the expected
decline in the purchasing power of money lent to borrowers.
4.2. Development of Ukrainian T-bills Market
Ukrainian T-bills market has a short but very dynamic history of development.
Its establishment was a part of a package adopted by the government, the main
goal of which was to shift the focus from financing a budget by seignorage to
31
financing it through debt. The first Ukrainian T-bills were issued in March
1995. At that time they did not play an important role: raised funds accounted
to 304.1 mln hryvnia and covered 7% of the budget deficit (HIID, 1998a)1.
This relatively small amount was borrowed at high costs, the average effective
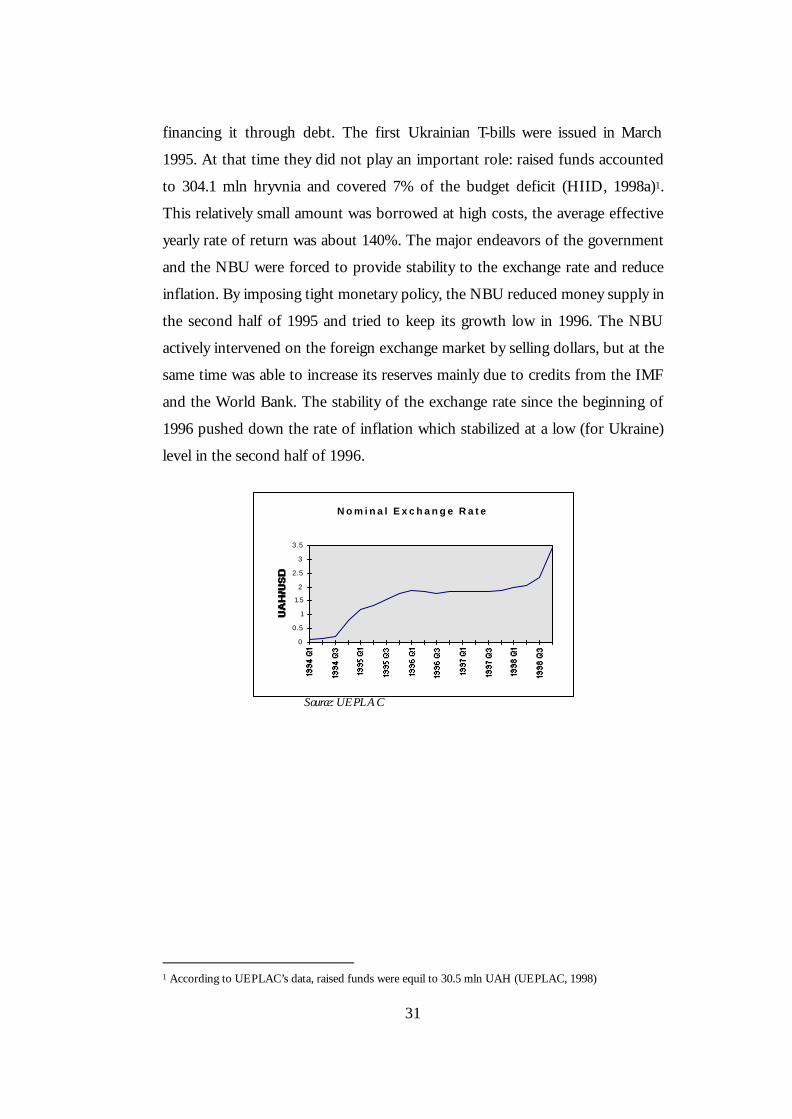
yearly rate of return was about 140%. The major endeavors of the government
and the NBU were forced to provide stability to the exchange rate and reduce
inflation. By imposing tight monetary policy, the NBU reduced money supply in
the second half of 1995 and tried to keep its growth low in 1996. The NBU
actively intervened on the foreign exchange market by selling dollars, but at the
same time was able to increase its reserves mainly due to credits from the IMF
and the World Bank. The stability of the exchange rate since the beginning of
1996 pushed down the rate of inflation which stabilized at a low (for Ukraine)
level in the second half of 1996.
N o m i n a l E x c h a n g e R a t e
0
0.5
1
1.5
2
2.5
3
3.5
Source: UEPLAC
1 According to UEPLAC’s data, raised funds were equil to 30.5 mln UAH (UEPLAC, 1998)
32
I n f l a t i o n , m o n t h l y % c h a n g e o f C P I
0.0
5.0
10.0
15.0
20.0
25.0
30.0
35.0
40.0
%
Source: UEPLAC
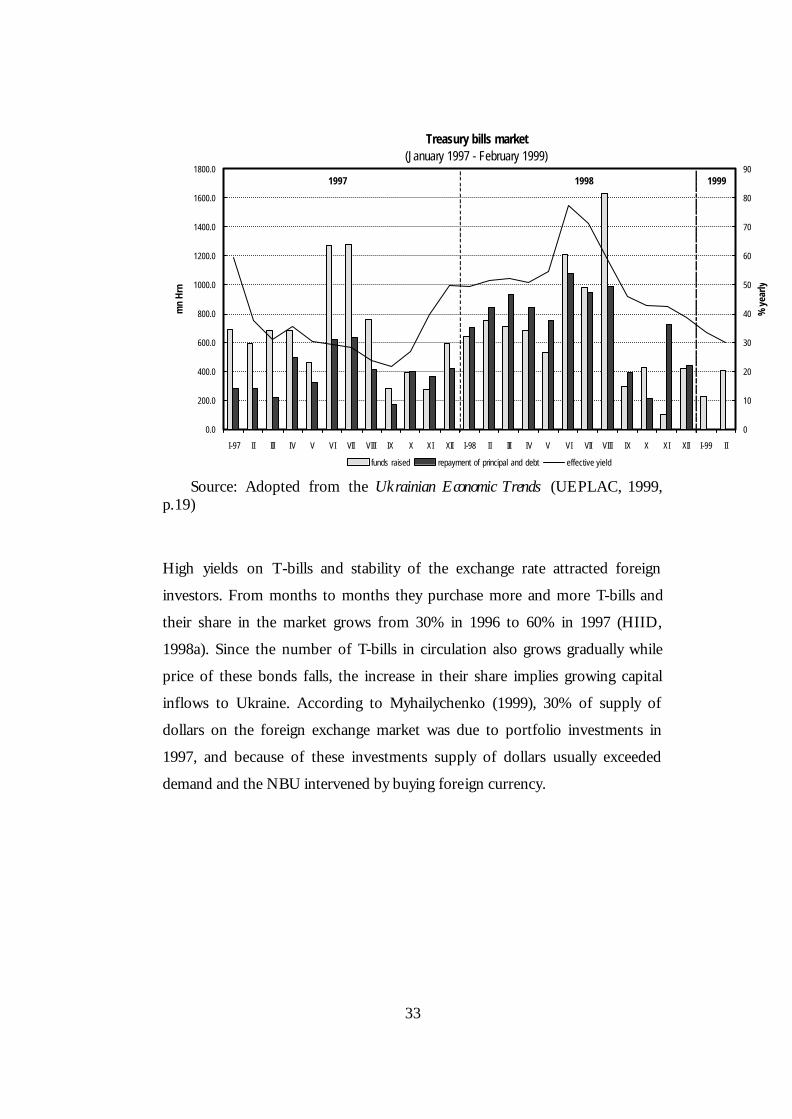
Lower inflation and stabilization of the national currency helped build
investors’ confidence in the market and starting from the second quarter of
1996 funds raised from the T-bill market have increased significantly at lower
costs, the yearly effective rate of return reduced to 64% in December 1996
(UEPLAC, 1998). In terms of risk premium, this can be explained by a
decrease of short-term exchange-rate risk due to stabilization of the exchange
rate and by a decrease of inflation premium. However, the long-term exchange-
rate risk is expected to increase since the real exchange rate appreciated before
October 1996. The liquidity premium is expected to decrease due to
development of the secondary market. Funds transferred to the budget
amounted to 3145.1 mln hrivnia and financed 37% of the budget deficit in
1996 (HIID, 1998a). The positive dynamics of the T-bill market continued in
the first half of 1997, issued T-bills were enough not only to redeem previously
issued bonds but also to cover 60% of the budget deficit. 4360.6 mln UAH was
transferred to the budget. It seems that policy of the government and the NBU
deserved more and more credibility. As can be seen from the next two figures,
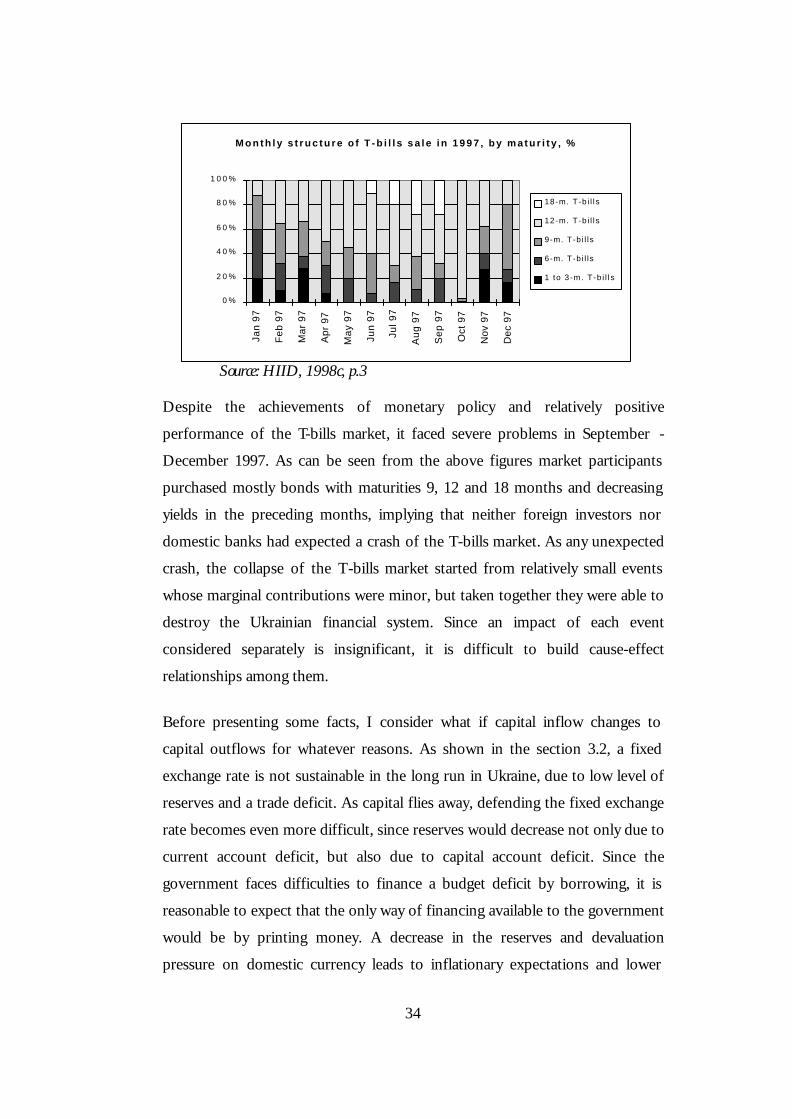
yields continue to fall and investors’ interest shifts to longer bonds.
33
Treasury bills market(January 1997 - February 1999)
0.0
200.0
400.0
600.0
800.0
1000.0
1200.0
1400.0
1600.0
1800.0
I-97 II III IV V VI VII VIII IX X XI XII I-98 II III IV V VI VII VIII IX X XI XII I-99 II
mn
Hrn
0
10
20
30
40
50
60
70
80
90
% y
early
funds raised repayment of principal and debt effective yield
1997 1998 1999
Source: Adopted from the Ukrainian Economic Trends (UEPLAC, 1999, p.19)
High yields on T-bills and stability of the exchange rate attracted foreign
investors. From months to months they purchase more and more T-bills and
their share in the market grows from 30% in 1996 to 60% in 1997 (HIID,
1998a). Since the number of T-bills in circulation also grows gradually while
price of these bonds falls, the increase in their share implies growing capital
inflows to Ukraine. According to Myhailychenko (1999), 30% of supply of
dollars on the foreign exchange market was due to portfolio investments in
1997, and because of these investments supply of dollars usually exceeded
demand and the NBU intervened by buying foreign currency.
34
M o n t h l y s t r u c t u r e o f T - b i l l s s a l e i n 1 9 9 7 , b y m a t u r i t y , %
0 %
2 0 %
4 0 %
6 0 %
8 0 %
1 0 0 %
Jan
97
Feb
97
Mar
97
Apr
97
May
97
Jun
97
Jul 9
7
Aug
97
Sep
97
Oct
97
Nov
97
Dec
97
18-m. T-b i l l s
12-m. T-b i l l s
9-m. T-b i l ls
6-m. T-b i l ls
1 to 3 -m. T-b i l l s
Source: HIID, 1998c, p.3
Despite the achievements of monetary policy and relatively positive
performance of the T-bills market, it faced severe problems in September -
December 1997. As can be seen from the above figures market participants
purchased mostly bonds with maturities 9, 12 and 18 months and decreasing
yields in the preceding months, implying that neither foreign investors nor
domestic banks had expected a crash of the T-bills market. As any unexpected
crash, the collapse of the T-bills market started from relatively small events
whose marginal contributions were minor, but taken together they were able to
destroy the Ukrainian financial system. Since an impact of each event
considered separately is insignificant, it is difficult to build cause-effect
relationships among them.
Before presenting some facts, I consider what if capital inflow changes to
capital outflows for whatever reasons. As shown in the section 3.2, a fixed
exchange rate is not sustainable in the long run in Ukraine, due to low level of
reserves and a trade deficit. As capital flies away, defending the fixed exchange
rate becomes even more difficult, since reserves would decrease not only due to
current account deficit, but also due to capital account deficit. Since the
government faces difficulties to finance a budget deficit by borrowing, it is
reasonable to expect that the only way of financing available to the government
would be by printing money. A decrease in the reserves and devaluation
pressure on domestic currency leads to inflationary expectations and lower
35
credibility of the government, and lower confidence of population. Thus, it is
highly probable that monetary growth would be in excess of demand and would
lead to even higher inflation and because of this to even higher pressure on the
local currency. All these factors suggest that the exchange rate would be
extremely devalued in future. As second generation models suggest, domestic
currency is attacked now if market participants expect that it will be
depreciated in future. We see that capital inflows, although providing artificial
stability to the financial system, in fact increase its vulnerability to a crisis since
any bad news can change expectations of future capital inflows and any
negative expectations become self-fulfilling.
In the second half of August, the government decided to partially pay back
wage arrears. Credit from the Bank of Luxembourg (396 mln dollars) was spent
for this purpose (Bereslavska, 1997). This credit with some lags returned to
domestic banks and banks used this money to buy dollars on the foreign
exchange market. Relatively small amount of T-bills had to be redeemed in
September (less than 200 mln hrivnia) and the Ministry of Finance (the issuer
of T-bills) decided to reduce yields of issued bonds. In most countries, an issuer
of T-bills announces supply of T-bills for sale while a stop yield is determined
by the competition among bidders, but in Ukraine stop yield is determined by
the issuer. There were auctions when the issuer announced the number of T-
bills for sale while sold in fact more or less than this announced number. Since
the Ministry of Finance planned to issue eurobonds (bonds denominated in
foreign currency) with rate of return of 12%, it tried to equalize this rate to an
expected rate of return in foreign currency of T-bills (Ohrimenko, 1997,
Business, October 20, p.23)2.
It should be mentioned that the exchange rate bands for the next year were not
announced at that time. If the exchange rate does not exceed the limit 2.1
UAH/USD at the end of 1998, 18-months bonds will give at least 13.5% of
2 Business is the most professional Ukrainian newspaper in the areas of economics, business and finance.
Mr. Ohrimenko holds the degree of Candidat of Science in Economics and works as a dealer of the Joint-Stock Commercial Bank “Societe Generale Ukraine”.
36
returns in dollars on a date of redemption; 12-months bonds will give 14% at
the exchange rate 2 UAH/USD; 9-months bonds will give 13% at the exchange
rate 1.95 UAH/USD (Ohrimenko, Business, October 6, 1997, p. 24). If the
government is going to issue eurobonds with rate of return 12%, which possess
less currency risk since they are denominated in foreign currency, than the rate
of return in foreign currency of T-bills should be higher and probably higher
than 13-14% of expected returns of T-bills. This factor can explain why
foreign investors were less interested in buying T-bills at the rates proposed by
the Ministry of Finance.
Since the Ministry of Finance issued relatively small number of T-bills, supply
of dollars from nonresidents was low and the hrivnia was under devaluation
pressure. By interventions on the forex market, the NBU started loosing its
reserves. This caused inflationary expectations. Given rising inflationary
expectations, rates of return on the secondary market were higher than on the
primary market (Ohrimenko, 1997, Business, September 22, p. 24).
Nevertheless, the Ministry of Finance did not want to raise rates on the primary
market, trying to sell T-bills to foreign investors who do not participate on the
secondary market.
Ukrainian stock market also experienced difficulties. The Stock exchange index
Pro U-50 reached its maximum on September 1, 1997 and after that, started
going down continuously (ICPS, 1998). As quite often happens on stock
markets, sometimes it is enough for traders not to buy securities for several
days as all the participants realize that the only reason why they bought
securities was that they had expected that somebody else would buy them in
future. As these expectations crash, all traders start selling securities since they
expect that other will do the same. A date of a stock market crash is highly
unpredictable and a crash may take place due to a lot of reasons.
In the beginning of October, CS First Boston and some other foreign
investments groups and banks announced that they left the Ukrainian T-bills
market and would not invest or reinvest in T-bills (Trotskyy, Business, October
37
13, 1997, p.23). It is clear that such an announcement might only worsen
negative expectations of other market participants. The NBU tried to stabilize
the situation and announced the exchange rate bands 1.75-1.95 UAH/USD
until June 30, 1998 (HIID, 1999). Since October 1997 the Ministry of Finance
has started raising yields on the primary market. The secondary market has
responded in an unexpected way and also raised yields so they again were
higher than on the primary market. Given nonresidents’ desire to leave the
market, Ukrainian banks could not absorb the supply of T-bills even if they are
very profitable, since the biggest Ukrainian banks such as “Ukraina”,
“Prominvestbank” and others have to subsidize different sectors of the
Ukrainian economy, while the capital of the other banks is very small. In this
situation, the only player that has necessary capital is the NBU and from month
to month its share of T-bills in circulation grew. The second aspect why the T-
bills market become more illiquid is that some domestic banks were more
interested in buying dollars rather than T-bills, indicating that their expectations
of future devaluation were different from the adopted bands and that the
credibility of the government’s policy was quite low.
Not surprisingly, devaluation pressure on hrivnia, raising inflationary
expectations, difficulties of the T-bills and stock markets led to speculative
attacks on foreign currency. According to Trotskyy’s analysis of the demand for
dollars on the foreign exchange market in the beginning of November, 1997,
speculative demand accounted to 20-25% of the total demand (Trotskyy, 1997,
Business, November 10, p. 21). Due to negative expectations, exporters in turn
are expected to reduce the supply of dollars. Under these conditions, the NBU
becomes the only seller of dollars.
As a response to the increased demand for foreign currency and the reduced
supply, the NBU tightened monetary policy. The NBU increased the refinance
rate from 16% to 23.9%, and required reserves from 11% to 15%. As stressed
by Sachs (1998), an increase in interest rates to defend the currency results in
lower confidence among money managers. As an additional tool, the NBU
tightened an administrative control over the foreign exchange market. How the
38
NBU can administratively control the market is beyond this MA thesis (for
more details, see for example Bereslavska (1998a)).
In September-December 1997 some foreign investors left the T-bills market,
while some still operated on it, since January 1998 the NBU is major buyer of
T-bills and foreigners invested only about 60 mln UAH in T-bills in the first
quarter of 1998 (Bereslavska, 1998b). According to Bereslavska (1999), 60%
of T-bills in circulation were in hands of foreign investors as of the end of
1997. Given that the government T-bill debt including interest was 8761.6 mln
UAH (ICPS, 1998a, p.87) and the exchange rate was 1.9 UAH/USD, it is easy
to calculate T-bills debt to foreigners in foreign currency: about 2768 mln USD.
If we use data published by the UEPLAC (UEPLAC, 1998, p.18), then the net
outstanding debt including principals and interests was 7628 mln UAH.
Calculating in the same way the debt to foreign investors, we obtain about
2400 mln USD. The NBU’s gross reserves were 2340 mln USD as of the end of
1997 (ICPS, 1998a, p.87). On the other hand, Ohrimenko (Business, 1997,
October 13, p. 24) reported that foreigners’ share of T-bills in circulation was
about 48% (or about 1.5 bln USD) as of the end of September 1997. Since
foreign investors were leaving the T-bills market in October-December, there is
obvious contradiction between Bereslavska’s and Ohrimenko’s data. Another
source of data is Ukraine’s Balance of Payments, but data is presented as
portfolio investments from foreigners without specifying investments in
particular securities and includes only principals. I try to estimate T-bills debt
to foreign investors (see for more details Appendix 1). For this purpose, I take
data about portfolio investments from the Ukraine’s Balance of Payments
(PBU) and multiply quarterly data by the corresponding effective annual rate of
return taken from the Ukrainian Economic Trends (UEPLAC, 1998, p. 18). In this
way, I obtain that the debt to foreigners was about 1950 mln USD. Since before
September 1997, foreign investors usually rolled over their T-bills I add to this
sum total net debt to foreigners as of the end of 1996 multiplied by 1.3 (30% is
roughly average (not weighted) rate of return in 1997) and obtain that the debt
39
to foreigners was about 2417 mln USD, suggesting that Bereslavska’s
estimation of foreigners’ share is more reliable.
Since the T-bills debt exceeded reserves of the NBU, Ukraine faced the
problem of illiquidity, it could not repay its obligations in short-run. It should
be mentioned that a critical short-term debt-to-reserves ratio for Ukraine is less
than 1, since Ukraine has to use reserves to cover a trade deficit and service
other debts (credits from international organizations and others). If this money
had been borrowed by Ukrainian banks, a crisis would have taken place in
September-December of 1997, since all the conditions for financial panic were
met: short-term debts exceeded short-term assets; no single creditor was large
enough to supply all of the credits necessary to pay the existing short-term
debts; and there was no lender of last resort. Since, on the one hand, T-bills are
securities guaranteed by the government and, on the other hand, the secondary
market in Ukraine was very illiquid, foreign investors could not leave Ukraine
suddenly and had to wait until redemption. These factors postponed the time
occurrence of the crisis. The above discussion suggests that due to weak
fundamentals Ukraine is not ready for financial liberalization. One of the
reasons why Russia’s crisis was considerably deeper than the Ukraine’s crisis is
that financial markets were more liberalized in Russia (see HIID, 1998b).
Ukrainian banks unlike Russian ones have not managed to take loans at the
international market and have not entered the large scale of derivative
operations. Ukrainian stock market was underdeveloped relatively to Russian
one.
The currency crises in Asian countries that took place in July - December 1997
could have severe impacts on Ukraine. First, fundamentals of Asian countries
were sufficiently better than those of Ukraine. The fact that Asian countries
experienced currency crises could lead foreign investors to revalue a currency
crisis risk in Ukraine and, thus, the crises in Asia could create a “wake up call”
for Ukraine. Second aspect is that foreign investors could treat all emerging
markets as similar and the Asia’s crises could reduce their confidence in all
emerging markets. It is difficult to say when exactly the Asia’s crises had an
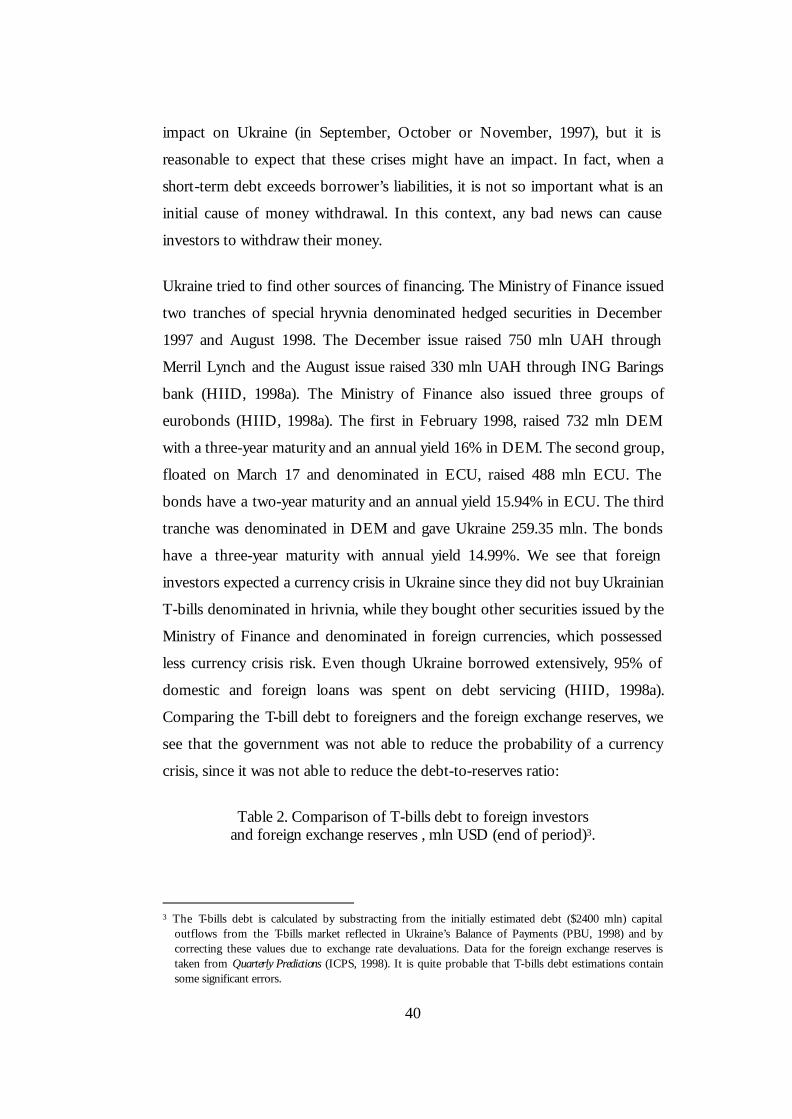
40
impact on Ukraine (in September, October or November, 1997), but it is
reasonable to expect that these crises might have an impact. In fact, when a
short-term debt exceeds borrower’s liabilities, it is not so important what is an
initial cause of money withdrawal. In this context, any bad news can cause
investors to withdraw their money.
Ukraine tried to find other sources of financing. The Ministry of Finance issued
two tranches of special hryvnia denominated hedged securities in December
1997 and August 1998. The December issue raised 750 mln UAH through
Merril Lynch and the August issue raised 330 mln UAH through ING Barings
bank (HIID, 1998a). The Ministry of Finance also issued three groups of
eurobonds (HIID, 1998a). The first in February 1998, raised 732 mln DEM
with a three-year maturity and an annual yield 16% in DEM. The second group,
floated on March 17 and denominated in ECU, raised 488 mln ECU. The
bonds have a two-year maturity and an annual yield 15.94% in ECU. The third
tranche was denominated in DEM and gave Ukraine 259.35 mln. The bonds
have a three-year maturity with annual yield 14.99%. We see that foreign
investors expected a currency crisis in Ukraine since they did not buy Ukrainian
T-bills denominated in hrivnia, while they bought other securities issued by the
Ministry of Finance and denominated in foreign currencies, which possessed
less currency crisis risk. Even though Ukraine borrowed extensively, 95% of
domestic and foreign loans was spent on debt servicing (HIID, 1998a).
Comparing the T-bill debt to foreigners and the foreign exchange reserves, we
see that the government was not able to reduce the probability of a currency
crisis, since it was not able to reduce the debt-to-reserves ratio:
Table 2. Comparison of T-bills debt to foreign investors and foreign exchange reserves , mln USD (end of period)3.
3 The T-bills debt is calculated by substracting from the initially estimated debt ($2400 mln) capital
outflows from the T-bills market reflected in Ukraine’s Balance of Payments (PBU, 1998) and by correcting these values due to exchange rate devaluations. Data for the foreign exchange reserves is taken from Quarterly Predictions (ICPS, 1998). It is quite probable that T-bills debt estimations contain some significant errors.
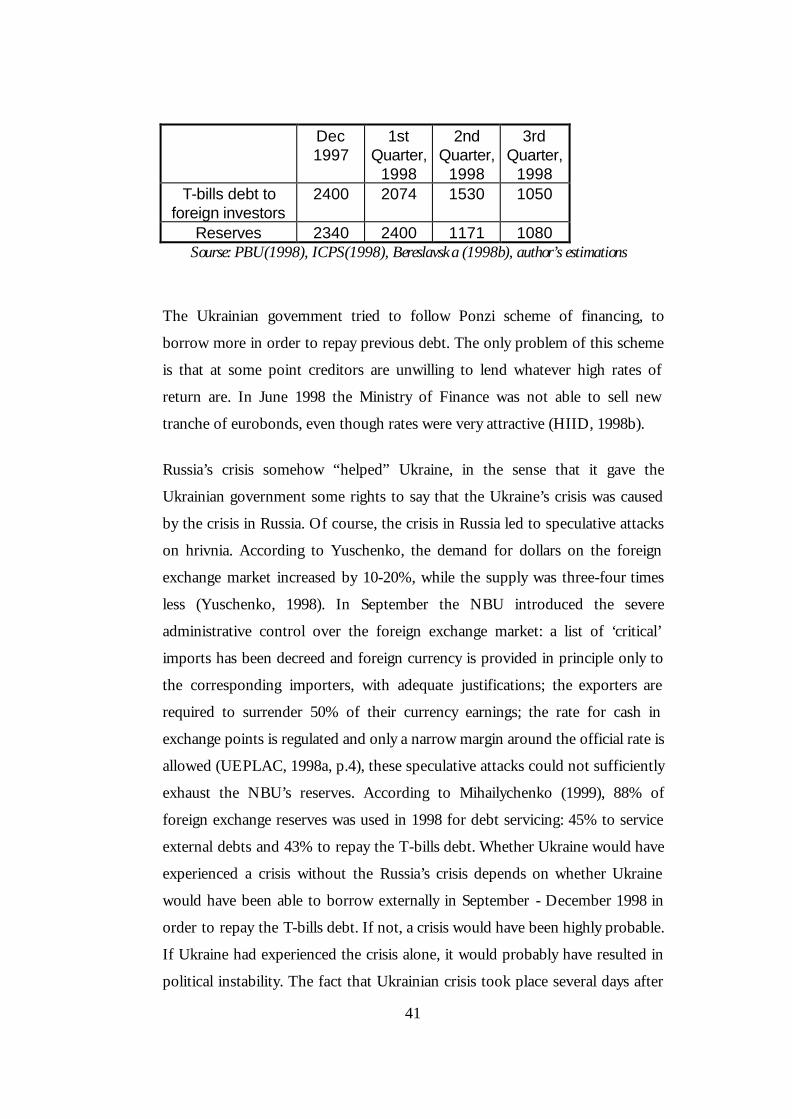
41
Dec 1997
1st Quarter,
1998
2nd Quarter,
1998
3rd Quarter,
1998 T-bills debt to
foreign investors 2400 2074 1530 1050
Reserves 2340 2400 1171 1080 Sourse: PBU(1998), ICPS(1998), Bereslavska (1998b), author’s estimations
The Ukrainian government tried to follow Ponzi scheme of financing, to
borrow more in order to repay previous debt. The only problem of this scheme
is that at some point creditors are unwilling to lend whatever high rates of
return are. In June 1998 the Ministry of Finance was not able to sell new
tranche of eurobonds, even though rates were very attractive (HIID, 1998b).
Russia’s crisis somehow “helped” Ukraine, in the sense that it gave the
Ukrainian government some rights to say that the Ukraine’s crisis was caused
by the crisis in Russia. Of course, the crisis in Russia led to speculative attacks
on hrivnia. According to Yuschenko, the demand for dollars on the foreign
exchange market increased by 10-20%, while the supply was three-four times
less (Yuschenko, 1998). In September the NBU introduced the severe
administrative control over the foreign exchange market: a list of ‘critical’
imports has been decreed and foreign currency is provided in principle only to
the corresponding importers, with adequate justifications; the exporters are
required to surrender 50% of their currency earnings; the rate for cash in
exchange points is regulated and only a narrow margin around the official rate is
allowed (UEPLAC, 1998a, p.4), these speculative attacks could not sufficiently
exhaust the NBU’s reserves. According to Mihailychenko (1999), 88% of
foreign exchange reserves was used in 1998 for debt servicing: 45% to service
external debts and 43% to repay the T-bills debt. Whether Ukraine would have
experienced a crisis without the Russia’s crisis depends on whether Ukraine
would have been able to borrow externally in September - December 1998 in
order to repay the T-bills debt. If not, a crisis would have been highly probable.
If Ukraine had experienced the crisis alone, it would probably have resulted in
political instability. The fact that Ukrainian crisis took place several days after
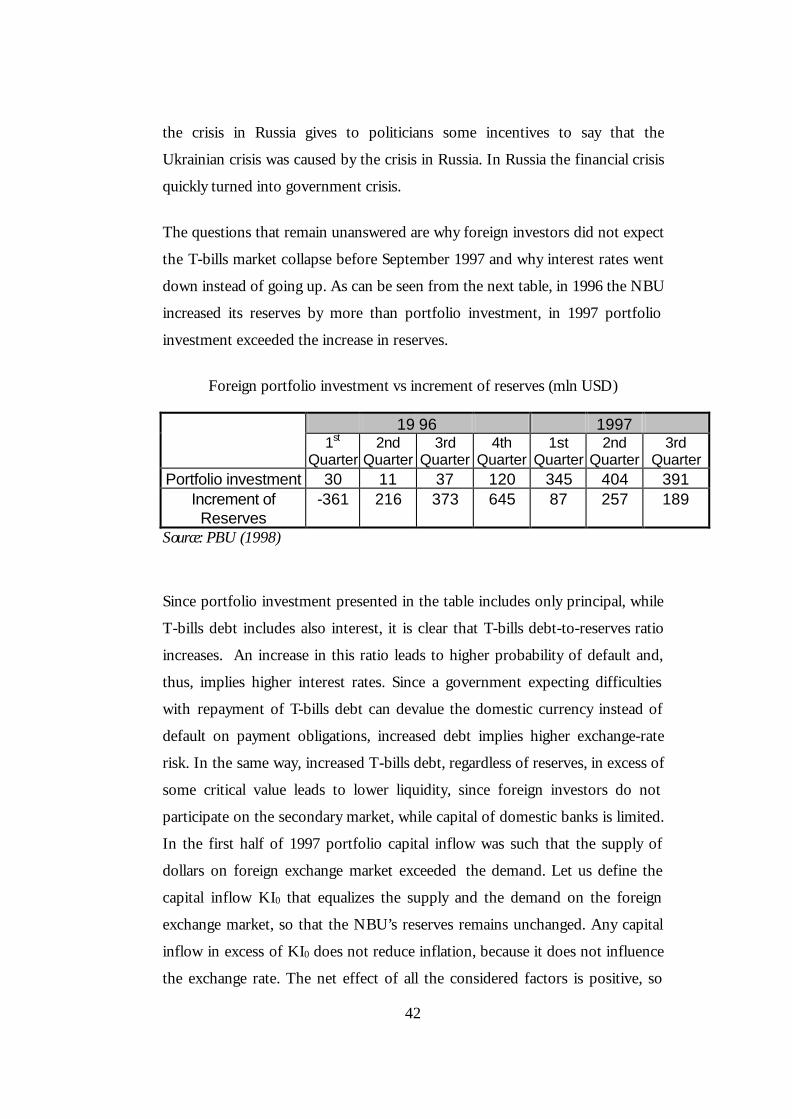
42
the crisis in Russia gives to politicians some incentives to say that the
Ukrainian crisis was caused by the crisis in Russia. In Russia the financial crisis
quickly turned into government crisis.
The questions that remain unanswered are why foreign investors did not expect
the T-bills market collapse before September 1997 and why interest rates went
down instead of going up. As can be seen from the next table, in 1996 the NBU
increased its reserves by more than portfolio investment, in 1997 portfolio
investment exceeded the increase in reserves.
Foreign portfolio investment vs increment of reserves (mln USD)
19 96 1997 1st
Quarter 2nd
Quarter 3rd
Quarter 4th
Quarter 1st
Quarter 2nd
Quarter 3rd
Quarter Portfolio investment 30 11 37 120 345 404 391
Increment of Reserves
-361 216 373 645 87 257 189
Source: PBU (1998)
Since portfolio investment presented in the table includes only principal, while
T-bills debt includes also interest, it is clear that T-bills debt-to-reserves ratio
increases. An increase in this ratio leads to higher probability of default and,
thus, implies higher interest rates. Since a government expecting difficulties
with repayment of T-bills debt can devalue the domestic currency instead of
default on payment obligations, increased debt implies higher exchange-rate
risk. In the same way, increased T-bills debt, regardless of reserves, in excess of
some critical value leads to lower liquidity, since foreign investors do not
participate on the secondary market, while capital of domestic banks is limited.
In the first half of 1997 portfolio capital inflow was such that the supply of
dollars on foreign exchange market exceeded the demand. Let us define the
capital inflow KI0 that equalizes the supply and the demand on the foreign
exchange market, so that the NBU’s reserves remains unchanged. Any capital
inflow in excess of KI0 does not reduce inflation, because it does not influence
the exchange rate. The net effect of all the considered factors is positive, so
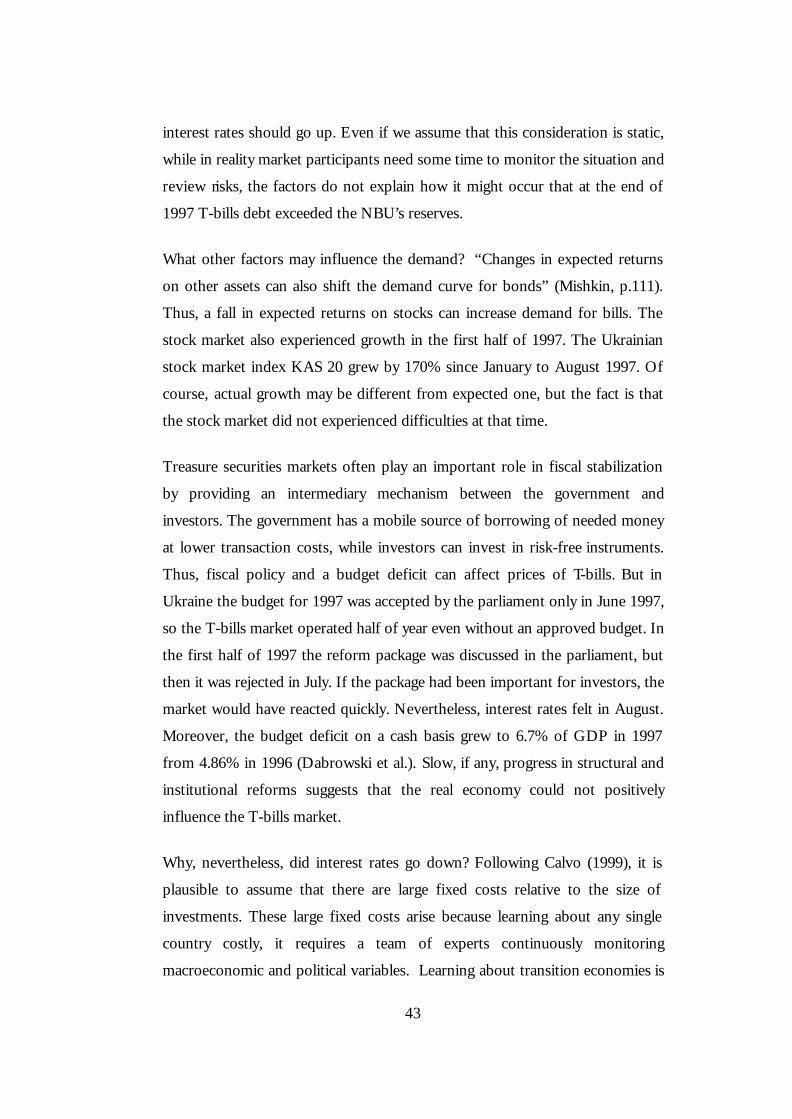
43
interest rates should go up. Even if we assume that this consideration is static,
while in reality market participants need some time to monitor the situation and
review risks, the factors do not explain how it might occur that at the end of
1997 T-bills debt exceeded the NBU’s reserves.
What other factors may influence the demand? “Changes in expected returns
on other assets can also shift the demand curve for bonds” (Mishkin, p.111).
Thus, a fall in expected returns on stocks can increase demand for bills. The
stock market also experienced growth in the first half of 1997. The Ukrainian
stock market index KAS 20 grew by 170% since January to August 1997. Of
course, actual growth may be different from expected one, but the fact is that
the stock market did not experienced difficulties at that time.
Treasure securities markets often play an important role in fiscal stabilization
by providing an intermediary mechanism between the government and
investors. The government has a mobile source of borrowing of needed money
at lower transaction costs, while investors can invest in risk-free instruments.
Thus, fiscal policy and a budget deficit can affect prices of T-bills. But in
Ukraine the budget for 1997 was accepted by the parliament only in June 1997,
so the T-bills market operated half of year even without an approved budget. In
the first half of 1997 the reform package was discussed in the parliament, but
then it was rejected in July. If the package had been important for investors, the
market would have reacted quickly. Nevertheless, interest rates felt in August.
Moreover, the budget deficit on a cash basis grew to 6.7% of GDP in 1997
from 4.86% in 1996 (Dabrowski et al.). Slow, if any, progress in structural and
institutional reforms suggests that the real economy could not positively
influence the T-bills market.
Why, nevertheless, did interest rates go down? Following Calvo (1999), it is
plausible to assume that there are large fixed costs relative to the size of
investments. These large fixed costs arise because learning about any single
country costly, it requires a team of experts continuously monitoring
macroeconomic and political variables. Learning about transition economies is
44
even more costly since institutional framework and environment are different.
This creates incentives for herding behavior especially for small investors that
invest in T-bills just because others invest and withdraw money if others do the
same. However, it seems that monitoring of the debt-to-reserves ratio is not too
costly in principal, although it may be difficult to do due to low transparency of
the market.
I would like to propose the following explanation. The package which Ukraine
adopted at the end of 1995 and which included the stabilization of the
exchange rate and establishment of the T-bills market was suggested by the
IMF. Thus, foreign investors could treat Ukrainian T-bills as risk-free, assuming
that the IMF implicitly would support them. This may explain why interest rate
decreased, it adjusted to long-run risk-free equilibrium level. In September
1997, the IMF refused to grant the second tranche of its stand-by loan because
Ukraine exceeded the budget deficit limit. Foreign investors could consider this
fact as a sign that the IMF was dissatisfied with Ukrainian policy and might not
support Ukrainian T-bills. Given that T-bills debt to foreigners exceeded
foreign exchange reserves and that the IMF would not probably support
Ukraine, it was reasonable for foreign investors to leave the market. In fact,
Ukraine did not receive any credits from the IMF during September 1997 –
March 1998. Moreover, Ukraine was not able to sign any contract with the IMF
at the end of 1997, suggesting that the IMF was reluctant to support Ukraine. I
think that the IMF had realized that the T-bills market was an unlimited source
of funds for Ukraine and a kind of soft constraint that resulted in softer fiscal
policy. That is why the IMF did not give credits to Ukraine and did not support
Ukrainian T-bills.
4.3. External Borrowing as Soft Budget Constraint
I show here that easy source of borrowing, such as the T-bill market, has
negative impact on Ukrainian fiscal policy and was a kind of soft constraint.
First, the budget deficit increased to 6.7% of GDP in 1997 from 4.86% in 1996
(Dabrowski et al.). Second, the Ministry of Finance issued T-bills by 47.7%
45
more than was planned, while it was not able to borrow more from other
external sources and borrowed only 62.6% of planned funds in 1997
(Yuschenko, 1998b).
On the other hand, as Ukraine reached some constraints on external borrowing
in 1998, when foreign investors withdrew their money from the T-bills market,
and when the Ministry of Finance was not able to sell the fourth tranche of
eurobonds in June 1998, the government was forced to make budget
corrections in July 1998. Government expenditures were reduced by 4.4 bln
hrivnia, and the budget deficit was reduced to 2.34 bln UAH from 3.4 bln
UAH, initially planned (HIID, 1999). Ukraine ended up with the budget deficit
2.766 bln UAH in 1998, that is quite close to the revised budget, taking into
account higher inflation at the end of 1998 (HIID, 1999).
46
C h a p t e r 5
CONCLUSIONS
The main roots of the currency crisis are the budget deficit and absence of
structural and institutional reforms. In 1993-1995 financing the budget deficit
by seignorage caused hyperinflation, while financing budget deficit through
debt in 1996-1997 led to the currency crisis. Capital inflows provided artificial
stability to the economy. If Ukraine had used that time of financial stability for
structural reforms, the crisis may not been so dangerous. Instead, the
government used borrowed money for everything except reforms and tended to
borrow more and more, which resulted in softer fiscal policy.
Although Ukraine was vulnerable to a currency crisis through channels of first
and second-generation models due to weak fundamentals, tight monetary policy
and administrative control over the foreign exchange market eliminated the
possibility of these types of crises for Ukraine. The crisis took place mainly due
to capital outflow from the Ukrainian T-bills market, that is, through channels
of balance sheet crises. T-bills debt to foreign investors exceeded the foreign
exchange reserves as of the end of 1997 and Ukraine reached some constraint
on its ability to borrow externally in 1998.
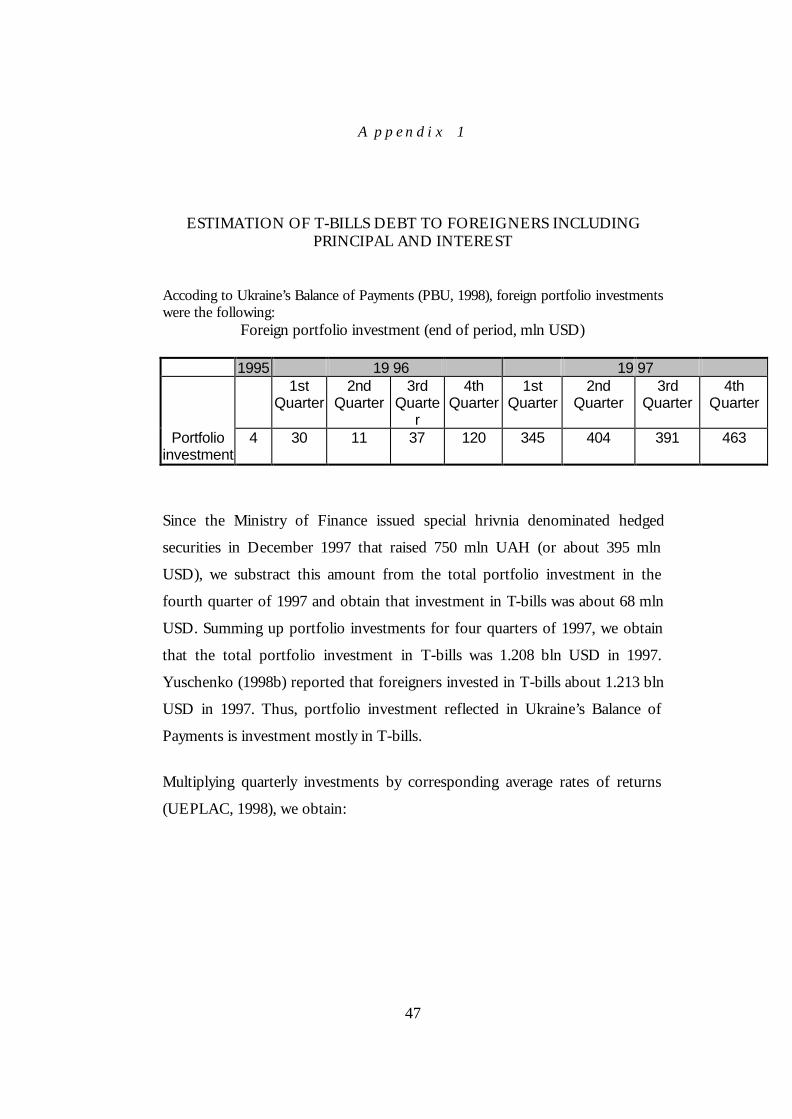
47
A p p e n d i x 1
ESTIMATION OF T-BILLS DEBT TO FOREIGNERS INCLUDING PRINCIPAL AND INTEREST
Accoding to Ukraine’s Balance of Payments (PBU, 1998), foreign portfolio investments were the following:
Foreign portfolio investment (end of period, mln USD)
1995 19 96 19 97 1st
Quarter 2nd
Quarter 3rd
Quarter
4th Quarter
1st Quarter
2nd Quarter
3rd Quarter
4th Quarter
Portfolio investment
4 30 11 37 120 345 404 391 463
Since the Ministry of Finance issued special hrivnia denominated hedged
securities in December 1997 that raised 750 mln UAH (or about 395 mln
USD), we substract this amount from the total portfolio investment in the
fourth quarter of 1997 and obtain that investment in T-bills was about 68 mln
USD. Summing up portfolio investments for four quarters of 1997, we obtain
that the total portfolio investment in T-bills was 1.208 bln USD in 1997.
Yuschenko (1998b) reported that foreigners invested in T-bills about 1.213 bln
USD in 1997. Thus, portfolio investment reflected in Ukraine’s Balance of
Payments is investment mostly in T-bills.
Multiplying quarterly investments by corresponding average rates of returns
(UEPLAC, 1998), we obtain:
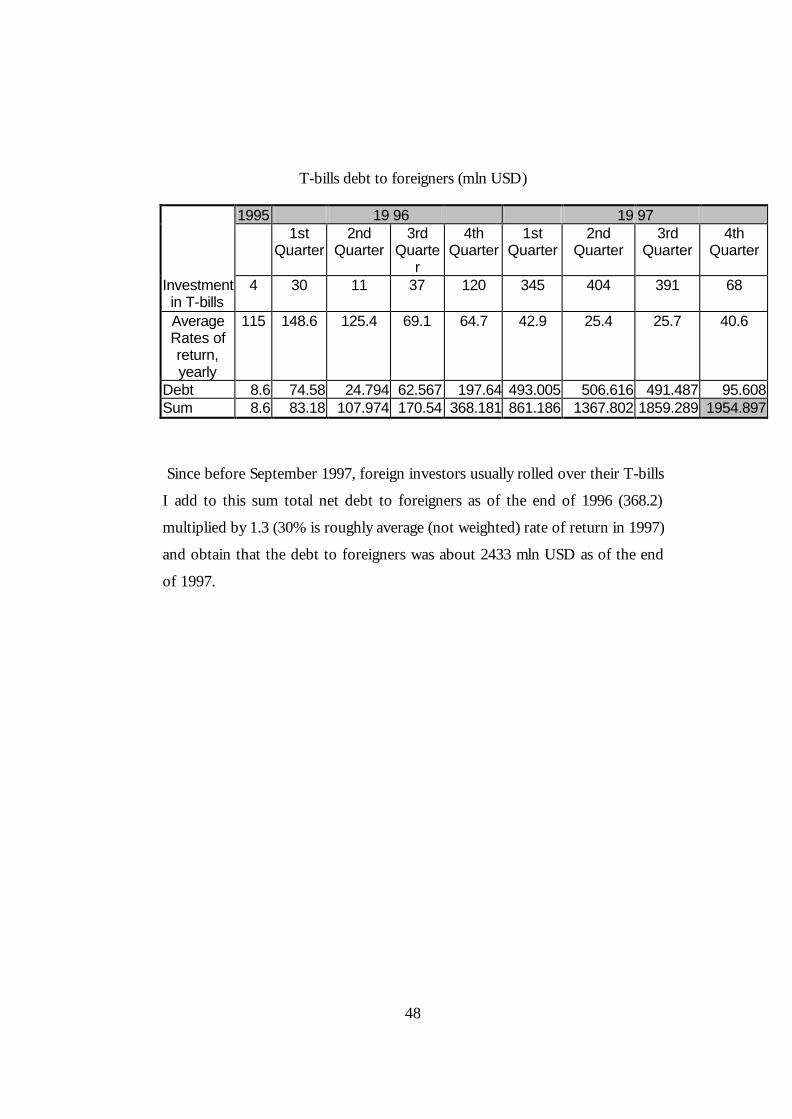
48
T-bills debt to foreigners (mln USD)
1995 19 96 19 97 1st
Quarter 2nd
Quarter 3rd
Quarter
4th Quarter
1st Quarter
2nd Quarter
3rd Quarter
4th Quarter
Investment in T-bills
4 30 11 37 120 345 404 391 68
Average Rates of return, yearly
115 148.6 125.4 69.1 64.7 42.9 25.4 25.7 40.6
Debt 8.6 74.58 24.794 62.567 197.64 493.005 506.616 491.487 95.608 Sum 8.6 83.18 107.974 170.54 368.181 861.186 1367.802 1859.289 1954.897
Since before September 1997, foreign investors usually rolled over their T-bills
I add to this sum total net debt to foreigners as of the end of 1996 (368.2)
multiplied by 1.3 (30% is roughly average (not weighted) rate of return in 1997)
and obtain that the debt to foreigners was about 2433 mln USD as of the end
of 1997.
49
REFERENCES
Akerlof and Romer 1994. “Looting: The Economic Underworld of Bankruptcy for Profit”. NBER Working Paper No. 1869 (April). Bereslavska, Olena. 1997. “Tendentsii rozvytku valutnogo rynku protyagom trioh kvartaliv 1997 roku / Development of exchange market during the third quarters of 1997”. Visnyk NBU, October, pp. 14-16. Bereslavska, Olena. 1998a. “Hrivnya u vyri rynkovoi stykhii.” Visnyk NBU, February, pp. 11-15. Bereslavska, Olena. 1998b. “‘Zdorov’ya’ hryvni zalezhit’ ne tak vid NBU, yak vid tempiv economichnyh reform / Stability of hryvnia depends on economic reforms rather than on the NBU” Visnyk NBU, March, pp. 22-24. Bereslavska, Olena. 1999. “Pid znakom devalvatsii: valutnyy rynok Ukrainy u 1998 rotsi/ Under devaluation pressure: Ukraine’s foreign exchange market in 1998.” Visnyk NBU, February, pp. 16-19. Blanchard, Olivier and Mark Watson 1982. “Bubbles, Rational Expectations, and Financial Markets”. In Paul Wachtel (ed.), Crises in the Economic and Financial Structure: Lexington Books. Blanco, Herminio and Peter M. Garber. 1986. “Recurrent Devaluations and Speculative Attacks on the Mexican Peso”. Journal of Political Economy, 94, pp. 148-166. Calvo, Guillermo and Enrique G. Mendoza. 1997. “Rational Herd Behavior and the Globalization of
Securities Markets”, mimeo, University of Maryland, November. Calvo, Guillermo. 1999. “Contagion in Emerging Markets: when Wall Street is a carrier.” http://www.bsos.umd.edu/econ/ciecalvo.htm Cumby, Robert E. and Sweder Van Wijenbergen 1989. “Financial Policy and Speculative Runs with a Crawling Peg: Argentina 1979-1981.” Journal of International Economics 27, pp.111-127. Dean, James W. 1998. “Asia’s Financial Crisis in Historical Perspective.” Challenge 41, 1-14. Dekhtiarchuk, Martha, 1998 “Relationship between Money Supply
http://www.harvard.kiev.ua/mailbrundles/98_10_december_24/acb8e031.htm. Diamond, Gouglas and Phillip Dybvig. 1983. “Bank Runs, Liquidity, and Deposit Insurance”. Journal of Political Economy 91 pp.401-419. Dornbusch, R; I Goldfajn and R. Valdes. 1995 “Currency Crises and Collapses” Brookings Papers on Economic Activity 2, pp. 219-295. Dornbusch, Rudi. 1998. “After Asia: New Directions for the International Financial System.” Http:\\www.mit.edu/~rudi/aftera~1.pdf Drazen, A. 1997. “Contagious Currency Crises.” Mimeo.
2
Eichengreen, Barry; Andrew K. Rose and Charles Wyplosz. 1996. “Contagious Currency Crises.” NBER Working Paper 5681. Esquivel, Gerardo and Felipe Larrain 1998. “Explaining Currency Crises”. http://www.stern.nyu.edul/~nroubini/asia/Asia Homepagr.html Feldstein, Martin. 1999. “Self-protection for Emerging Market Economies.” NBER Working Paper 6907. Frankel, Jeffrey and Andrew. K. Rose. 1996 “Currency Crasher in Emerging Markets. An Empirical Treatment.” Journal of International Economics 41, pp. 351-366. Garber, Peter and Lars Svensson. 1994. “The operation and collapse of Fixed Exchange Rate Regimes”. NBER Working Paper No 4971. Gerlaeh, Stefan and Frank Smets. 1995. “Contagious Speculative Attacks”. European Journal of Political Economy, 11, pp.45-63. Glick, Reuven and Andrew K. Rose. 1998. “Contagion and Trade: Why Are Currency Crises Regional?” Pacific Basin Working Paper No. PB98-03. Goldberg, Linda. 1994. ”Predicting Exchange Rate Crises: Mexico Revisited” Journal of International Economics 36, pp.413-430. HIID (Harvard Institute for International Development). 1998a. “Fiscal Policy and New Instruments of Budget Deficit Financing in Ukraine.” pp. 1-9. http://www. harvard.kiev.na/mailundles/98_decem
ber/aab8e 01z. html (3 Dec 1998) HIID. 1998b. “Crisis in Russia and Lessons for Ukraine” http://www.harvard.kiev.ua/mailbundles/98_10_december_24/hac8e032.htm (12 Feb 1999) HIID. 1998c. “Ukrainian T-bills Market: Review and Macroeconomic Implications” http://www.harvard.kiev.ua/mailbundles/98_november/ha58e014.htm (24 Dec 1998) HIID. 1999. “Ukraine: Review of Economic Situation”. January. ICPS (International Centre for Policy Studies).1998a. Quarterly Predictions 5, pp.1-98. ICPS. 1998b. Quarterly Predictions 4. Kaminsky, Graciela L. and Carmen M. Reinhart (1996) “The Twin Crises: The Causes of Banking and Balance-of-Payments Problems”, International Finance Discussion Papers No.544. Board of Governors of the Federal Reserve System. Kaminsky, Grasiela; Saul Lizondo and Carmen M. Reiwhart. 1998 “Leading Indicators of Currency Crises” . IMF Staff Papers 45, pp. 1-48. Krugman, Paul. 1979. “A Model of Balance-of-Payments Crises.” Journal of Money, Credit, and Banking 11, pp.311-325. Krugman, Paul. 1996. “Are Currency Crises Self-fulfilling?” NBER Macroeconomic Annual
3
Krugman, Paul.1998. “Currency Crises” http://web.mit.edu/krugman/www/crises.html. Krugman, Paul and Maurice Obstfeld. 1997. International Economics: Theory and Policy. 4th ed., Addison Wesley Lomgman, Inc. Masson, Paul. 1998. “Contagion: Monsoonal Effects, Spillovers, and Jumps Between Multiple Equilibria.” IMF Working Paper 142. Mishkin, Frederic S. 1998. The Economics of Money, Banking, and Financial Markets. Fifth ed., Addison Wesley Longman, Inc. Myhailychenko, Sergiy. 1999. “Problemy ta perspektyvy rozvytku valutno-kursovoi polityky v Ukraini / Problems and perspectives of exchange rate policy in Ukraine”. Visnyk NBU, February, pp. 10-15. Obstfeld, Maurice. 1994. “The Logic of Currency Crises”. NBER Working Paper 4640. PBU (Platizhnyy Balans Ukrainy/Ukraine’s Balance of Payments). 1998. NBU, Kyiv. Radelet, Steven and Jeffrey Sachs. 1998. “The Onset of the East Asian Financial crisis”, Paper presented to the seminar at USAID and the National Bureau of Economic Research Currency Crisis Conference. Roubini, Nouriel and Paul Wachtel. 1997 “Current Account Sustainability in Transition Economies”. Paper presented at the Third Dubrovnik Conference on Transition Economics Dubrovnik, Croatia.
Sachs, Jeffrey. 1998. “Global Capitalism: Making It Work.” The Economist, September 12. UEPLAC (Ukrainian-European Policy and Legal Advice Centre). 1998. Ukrainian Economic Trends, November. UEPLAC. 1999. Ukrainian Economic Trends, February. Yuschenko, Viktor. 1998. “Bankivska systema Ukrainy i potochna economichna sytuatsiya/ Ukraine’s banking system and current economic situation.” Visnyk NBU, November, pp. 3-7. Yuschenko, Viktor. 1998b. “Dopovid na plenarnomu zasidanni Verkhovnoi Rady Ukrainy Golovy Natsionalnogo banku Ukrainy V.A. Yuschenko”. Visnyk NBU, December, pp. 3-8.

4