Embed Size (px)
Citation preview

10.1177/0022427803260263ARTICLEJOURNAL OF RESEARCH IN CRIME AND DELINQUENCYWright et al. / CRIMINALLY PRONE INDIVIDUALS
DOES THE PERCEIVED RISKOF PUNISHMENT DETER
CRIMINALLY PRONE INDIVIDUALS?RATIONAL CHOICE,
SELF-CONTROL, AND CRIME
BRADLEY R. E. WRIGHTAVSHALOM CASPI
TERRIE E. MOFFITTRAY PATERNOSTER
Society’s efforts to deter crime with punishment may be ineffective because those indi-viduals most prone to commit crime often act impulsively, with little thought for thefuture, and so they may be unmoved by the threat of later punishment. Deterrence mes-sages they receive, therefore, may fall on deaf ears. This article examines this issue bytesting the relationship between criminal propensity, perceived risks and costs of pun-ishment, and criminal behavior. The authors analyzed data from the Dunedin (NewZealand) Study, a longitudinal study of individuals from birth through age 26 (N =1,002). They found that in fact, deterrence perceptions had their greatest impact oncriminally prone study members.
Keywords: deterrence theory; criminal propensity
Society controls its members by threatening punishments, both formal,such as arrest and imprisonment, and informal, such as social disapprovaland withholding of resources. Policymakers, as well as the general public,have widely accepted the punishment-as-deterrence doctrine (Liska andMessner 1999), and so the punishment of criminals, more than other, positive
We thank the Dunedin Study members, their parents, teachers, and peer informants, DunedinUnit Director Richie Poulton, and Study founder Phil Silva. We thank HonaLee Harrington andColin Baier for research assistance. The Dunedin Multidisciplinary Health and Development Re-search Unit is supported by the New Zealand Health Research Council. This research receivedsupport from the National Consortium on Violence Research (NCOVR), which is supported un-der grant #SBR 9513040from the National Science Foundation, from the William Freeman VilasTrust at the University of Wisconsin, from US-NIMH grants MH45070, MH49414, from theWilliam T. Grant Foundation, and from Air New Zealand.
JOURNAL OF RESEARCH IN CRIME AND DELINQUENCY, Vol. 41 No. 2, May 2004 180-213DOI: 10.1177/0022427803260263© 2004 Sage Publications
180

interventions is politically viable under the rubric of “getting tough oncrime.” Given society’s considerable faith in, and resources spent on, punish-ing wrong-doers, we have a vested interest in knowing whether in fact threat-ened punishments deter criminal behavior, and so social scientists have longstudied punishment as deterrence (e.g., Beccaria 1963; Becker 1968;Bentham 1948; Piliavin et al. 1986). Of particular significance is the ques-tion, Does the threat of punishment differ according to a person’s motivationor propensity to commit crime?
There are three basic, though seemingly contradictory, answers to thisquestion that can be derived from the existing literature: (1) All individualsrespond roughly in the same manner to sanction threats (criminal motivationdoes not matter); (2) because they are impulsive and present-oriented, crimi-nal offenders are less responsive to sanction threats which are distant in time,and the irrelevance of sanctions increases as criminal propensity increases(high motivation reduces any deterrent impact); and (3) because those low incriminal propensity are not motivated to commit crimes or are likely inhib-ited by other considerations (moral concerns, for example) sanction threatsshould have the greatest effect among those high in criminal propensity andthe deterrent effect of sanctions should increase as criminal propensityincreases.
Some careful scholarship has already been directed at the issue of the rela-tionship between the deterrent effect of sanction threats and criminal propen-sity. For several reasons that we will discuss at greater length in the next sec-tion of the article, however, we think this important issue is still unsettled andwarrants additional research. First, the findings from these studies have beencontradictory—some report a weak deterrent effect for those least prone tocrime whereas some a strong effect. Moreover, sometimes the magnitude ofthe deterrent effect in different groups varies for the certainty and severity ofpunishment. Second, many of these studies have relied on student samples,relatively minor offending, and outcome variables of self-reported intentionsto offend. Samples of university students may not have sufficient variation incriminal propensity to fully test the relevant hypothesis of an interactionbetween deterrence variables and criminal propensity. These studies havealso used self-reported intentions to offend, and although intentions to offendare a staple in this literature, they may encourage “trash talk” or boastfulnessamong those with a criminal propensity. This trash talk would take the formof responding to a scenario that they would commit a criminal act even in theface of certain and severe punishment but acting in the real world in a moreprudent manner. Finally, the position that sanction threats effectively inhibitthe criminal behavior even among those with high levels of criminal propen-sity is also consistent with the empirical literature and harmonious with com-pelling theoretical positions.
Wright et al. / CRIMINALLY PRONE INDIVIDUALS 181

In this article, we reexamine the relationship among stable differences incriminal propensity, sanction threats, and criminal activity. We analyze datafrom the Dunedin (New Zealand) Multidisciplinary Health and Develop-ment Study. The Dunedin study is of a birth cohort of approximately 1,037study members followed up from birth to age 26. Detailed psychological,medical, and sociological information has been collected on all subjects,including self-reported and official delinquent and criminal offending.Because it is comprised of a birth cohort, contains substantial information oneach respondent, and is longitudinal, this study offers strategic advantagesfor examining the interaction between criminal propensity and sanctionthreats in its effect on offending.
SANCTION THREATS AND CRIMINAL PROPENSITY:RATIONAL CHOICE AND THEORIES OF STABLEINDIVIDUAL DIFFERENCES
The substantive question driving this article is whether the deterrent effectof sanction threats varies depending upon individuals’ level of motivation orpropensity to commit crime. Consultation with criminological theory canlead to several different, and equally compelling, answers.
First, classical deterrence theorists argue that criminal motivation or pro-pensity is irrelevant for deterrence. In this view, the motivation to commitcrimes is taken to be constant across persons, and therefore, the costs of crimedeter all people equally, regardless of their initial inclination or disinclinationtoward offending (Taylor, Walton, and Young 1973). What accounts forbetween individual differences in criminal offending, therefore, are the situa-tional contingencies of the costs and benefits of crime rather than differencesin personality, peer group association, income, or social status.
A second answer, drawn from criminal propensity theories, asserts thatthe threatened punishments of crime deter criminally prone individuals lessthan others because of their impulsive, risk-taking, and present-orientednatures. Impulsivity leads the criminally prone to neglect the long-term con-sequences of their behavior to focus instead on their immediate benefits(Gottfredson and Hirschi 1990:95; Wilson and Herrnstein 1985). By seekingimmediate gratification, those at high levels of criminal propensity are rela-tively unmoved by the potential pains of punishment that are both uncertainand removed in the future. As such, the “emotional force” of present desiresoverwhelms the apprehension of pain in the future (Fry 1951), and the deter-rent effect of sanction threats diminishes as presently oriented people dis-count future punishments.1 A related argument would be that the highly im-pulsive behavior and self-centeredness of criminally prone persons renders it
182 JOURNAL OF RESEARCH IN CRIME AND DELINQUENCY

difficult for them to establish long-term social relationships, persist in educa-tional training, or commit themselves to long-term career goals. In sum, theyare unable to make a meaningful investment in conventionality and as a resulthave much less at stake than others. With fewer conventional investments,criminally prone persons would have little at risk that could potentially belost through formal or informal sanctions.
This theoretical position is not that sanction threats are irrelevant for thecriminally prone, just that they are less influential than among those withlower levels of criminal propensity. Even seasoned propensity theorists likeGottfredson and Hirschi (1990) and Wilson and Herrnstein (1985) haveargued that individual differences in criminal propensity, and its attendanttraits of impulsivity and present-orientation, are differences in degree. Thisimplies both that all persons discount future consequences somewhat andthat all persons are attuned to the situational incentives and disincentives oftheir actions. In other words, even those who are high in criminal propensityand impulsivity are capable of some foresight and are, therefore, somewhatattuned to the situational contingencies of their behavior. The argument isthat they are simply less responsive than others to the attendant costs of theircriminal behavior. As Nagin and Paternoster (1993:471) have argued, onaverage, criminal offenders are oriented to the present rather than the futureand, because of that fact, “future consequences have only a de minimus im-pact on their decision calculus.”
A third theoretical position is that the costs of crime are likely to detercriminally prone individuals substantially more than others. This predictionis found in diverse theoretical arguments. For example, Talcott Parsons(1937) in his classic work, The Structure of Social Action, argued that the cal-culation of the costs of crime vary by one’s morality. Because unsocializedand amoral individuals are more willing to commit crime, the calculation ofits costs and benefits have greater salience, whereas among those for whom“a rule is accepted as moral obligation, the attitude of calculation is lacking”(Parsons 1937:403). A similar theoretical position was carved out by Etzioni(1988) in his treatise on moral attitudes and economic behavior. He arguedthat strong moral beliefs about the inappropriateness of some behavior cre-ates “non-market” areas—areas of life and behavior in which individuals actin strict accordance with their moral beliefs and neglect more instrumentalconsiderations. In these nonmarket areas of behavior, considerations of thepotential costs and benefits of one’s actions are irrelevant.
The view that strongly socialized individuals are immune to the influenceof sanction threats is also given expression in criminological theory. Toby(1964:333) noted that “only the unsocialized (and therefore amoral) individ-ual . . . is deterred from expressing deviant impulses by a nice calculation ofpleasures and punishments.” Silberman (1976:443) echoed this view when
Wright et al. / CRIMINALLY PRONE INDIVIDUALS 183

he argued that “those who are already deterred from committing a deviant actbecause they are committed to conform to the norm cannot be deterred fur-ther by the threat of punishment” (see also, Bachman et al. 1992; Paternosterand Simpson 1996; Trasler 1993; Tittle 1977, 1980; Wilkins 1962). In thisthird theoretical view, then, deterrence will best inhibit the criminal activityof those who are actively at risk of offending. Those who are effectivelyinhibited from crime by other considerations will be immune to the threat ofpunishment.
We can illustrate this perspective with a simple metaphor. A restaurantowner can sell more prime rib by lowering its price, but not to vegetarianpatrons. The price of prime rib here represents the situational inducementtoward ordering meat, but vegetarianism represents a predisposition awayfrom it, and thus the effect of meat pricing significantly varies by levels ofmeat eating. Likewise, the effects of deterrence perceptions might similarlyvary by levels of criminal propensity.
With this as background, we recognize a fourth possible position. Perhapssanction threats are ineffective in deterring both those who are over-socialized and refrain from criminal activity by such things as moral compul-sions and those who are so impulsive and pathologically present-orientedthat they completely discount the future consequences of their actions. Thisview would predict an inverted “U” shape for the susceptibility of sanctionthreats—no deterrent effect at either the lowest levels of criminal propensity(the “oversocialized”) or at the highest (the most impulsive and present-oriented). The deterrent “bang” would only be felt in the midrange of crimi-nal propensity. This group could easily be characterized as Zimring andHawkins’s (1968, 1973) marginal offender. The marginal offender is awavering one, who is at risk of and therefore at the margins of offending, nei-ther strongly committed to conformity nor crime. Zimring and Hawkins’sview is that these marginal offenders will be particularly responsive tosanction threats.
SANCTION THREATS AND CRIMINAL PROPENSITY:DOES CRIMINAL PROPENSITY CONDITIONTHE EFFECT OF SANCTION THREATS?
In the previous section, we outlined four possible and equally compellingtheoretical rationales for both the existence and direction of an interactionbetween individual criminal propensity and the deterrent effect of sanctionthreats. Although the theoretical arguments may be equally compelling, it ispossible that there is a body of empirical literature that may unambiguouslyput the issue to rest with strong evidence in support of only one of these.
184 JOURNAL OF RESEARCH IN CRIME AND DELINQUENCY
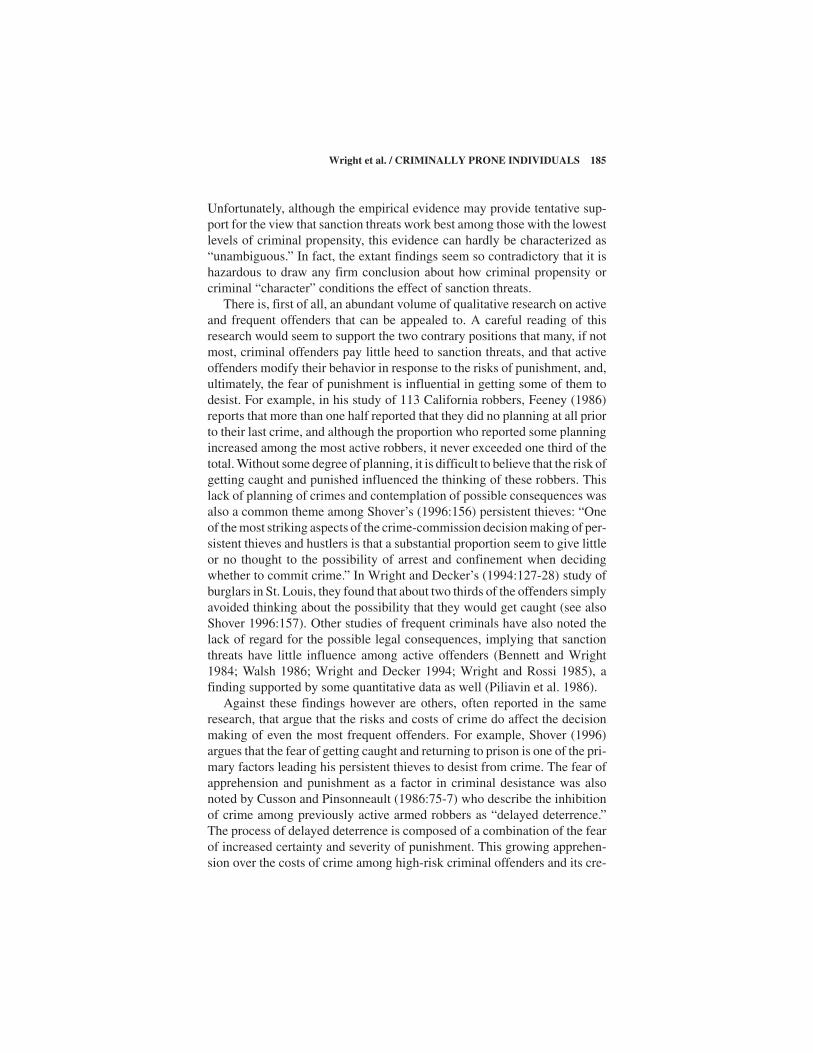
Unfortunately, although the empirical evidence may provide tentative sup-port for the view that sanction threats work best among those with the lowestlevels of criminal propensity, this evidence can hardly be characterized as“unambiguous.” In fact, the extant findings seem so contradictory that it ishazardous to draw any firm conclusion about how criminal propensity orcriminal “character” conditions the effect of sanction threats.
There is, first of all, an abundant volume of qualitative research on activeand frequent offenders that can be appealed to. A careful reading of thisresearch would seem to support the two contrary positions that many, if notmost, criminal offenders pay little heed to sanction threats, and that activeoffenders modify their behavior in response to the risks of punishment, and,ultimately, the fear of punishment is influential in getting some of them todesist. For example, in his study of 113 California robbers, Feeney (1986)reports that more than one half reported that they did no planning at all priorto their last crime, and although the proportion who reported some planningincreased among the most active robbers, it never exceeded one third of thetotal. Without some degree of planning, it is difficult to believe that the risk ofgetting caught and punished influenced the thinking of these robbers. Thislack of planning of crimes and contemplation of possible consequences wasalso a common theme among Shover’s (1996:156) persistent thieves: “Oneof the most striking aspects of the crime-commission decision making of per-sistent thieves and hustlers is that a substantial proportion seem to give littleor no thought to the possibility of arrest and confinement when decidingwhether to commit crime.” In Wright and Decker’s (1994:127-28) study ofburglars in St. Louis, they found that about two thirds of the offenders simplyavoided thinking about the possibility that they would get caught (see alsoShover 1996:157). Other studies of frequent criminals have also noted thelack of regard for the possible legal consequences, implying that sanctionthreats have little influence among active offenders (Bennett and Wright1984; Walsh 1986; Wright and Decker 1994; Wright and Rossi 1985), afinding supported by some quantitative data as well (Piliavin et al. 1986).
Against these findings however are others, often reported in the sameresearch, that argue that the risks and costs of crime do affect the decisionmaking of even the most frequent offenders. For example, Shover (1996)argues that the fear of getting caught and returning to prison is one of the pri-mary factors leading his persistent thieves to desist from crime. The fear ofapprehension and punishment as a factor in criminal desistance was alsonoted by Cusson and Pinsonneault (1986:75-7) who describe the inhibitionof crime among previously active armed robbers as “delayed deterrence.”The process of delayed deterrence is composed of a combination of the fearof increased certainty and severity of punishment. This growing apprehen-sion over the costs of crime among high-risk criminal offenders and its cre-
Wright et al. / CRIMINALLY PRONE INDIVIDUALS 185

ation of a delayed deterrence effect has been noted by others (Cromwell,Olson, and Avary 1991; Meisenhelder 1977; West 1978). Furthermore, bothqualitative and quantitative studies of offenders have consistently found thatin terms of selecting their targets, frequent criminals do try to minimize therisk that they take (Decker, Wright, and Logie 1993; Piquero and Rengert1999; Rengert and Wasilchick 1985; Shover 1996; Walsh 1986; Wright andDecker 1994).
What these various studies of active offenders seems to indicate is that atleast some active offenders do pay attention to sanction threats at least someof the time. This rather ambiguous conclusion that “maybe criminals areaffected by the costs of crime, and maybe they are not” is perfectly capturedin Shover’s (1996:162) observation that
notwithstanding variation in target selection by type of crime, age, and thenumber of offenders, it is equally clear that street-level persistent thieves aresensitive to the risk of failure. They behave purposefully and even rationally. Itwould be a mistake, however, to infer from this that they are aware of and sensi-tive to even substantial variation or changes in the schedule of threatened pun-ishments. Most often they are not.
What we do not know from this abundant literature is whether these fits ofrational conduct are more or less prevalent among those with less criminalpropensity. Therefore, although this research may shed some light on theissue, the most probative evidence would come from studies that directlycompared any deterrent effect among groups differing in criminal propen-sity. There are a few studies that do exactly this, although it remains unclearas to what conclusion may safely be drawn.
In their attempt to reconcile individual difference and rational choicetheories of crime, Nagin and Paternoster (1994) found that a composite mea-sure of informal sanction risk did interact with a measure of self-control(impulsivity/self-centeredness) in its effect on the self-reported intention tocommit three crimes, drunk driving, larceny, and sexual assault. For two ofthe three offenses, larceny and sexual assault, the deterrent effect of informalsanctions was significantly greater among those high in self-control (low incriminal propensity) than for those at the highest level. These findings wouldargue for the theoretical position that sanction threats work best when crim-inal propensity is low than when it is high. However, they did not find thispattern of effects for the offense of larceny, and the deterrent effect of infor-mal sanctions was not monotonically related to the level of self-control.There were no statistically significant differences between those in the mid-range of self-control and either the low or high levels for any of the threeoffenses.
186 JOURNAL OF RESEARCH IN CRIME AND DELINQUENCY

In a series of laboratory experiments, Block and Gerety (1995) examinedthe effect of variations in the certainty and severity of punishment on hypo-thetical criminal activity (collusive pricing) among college students and asample of incarcerated offenders. Drawing on Becker’s (1968) classic paperon the economics of crime and punishment, they hypothesized that criminalsare risk takers and would, therefore, be influenced more by the certainty ofpunishment than its severity. The conventional sample, they argued, wouldbe risk averse, and would be more responsive to variations in the severity ofpunishment. They found that both groups were responsive to sanction threatsbut in qualitatively different ways. As predicted, the students were more sen-sitive to variations in the severity than the certainty of punishment, whereasthe offenders were more responsive to the certainty than severity of punish-ment. This study seems to show that one dimension of sanction threats (cer-tainty) works best among the most prone to crime whereas another (severity)works best among the least.
Nagin and Pogarsky (2001:874) hypothesized that the deterrent effect forthe perceived severity of punishment would be smaller for those who weremore presented-oriented (crime prone) because the costs of criminal activityare generally far removed in the future. Their prediction that the deterrenteffect of the severity of punishment should be weaker among those at highrisk of crime is consistent with the expectation argued by Block and Gerety(1995). In the Nagin and Pogarsky (2001) study of drunk driving among asample of college students, they were able to identify a group who were char-acterized as being particularly present oriented. For this group that tended todiscount future consequences, Nagin and Pogarsky predicted a diminisheddeterrent effect for sanction threats. They also identified another group thatwas the virtual opposite of present-oriented. These “negative discounters”preferred immediate punishment and were extraordinarily future-oriented.Among this group, a stronger than average deterrent effect was predicted.Only partial support was found for these two predictions. The two interactioneffects of Severity × Present Orientation and Severity × Negative Discounterswere not statistically significant. However, the authors did report that that thelatter interaction was substantively large—the severity effect for those with astrong future orientation was about four times as large as those with a presentorientation.
In a related piece of research, Pogarsky (2002) argued that sanction threatswould be ineffective in inhibiting the criminal behavior of both “acute con-formists” (those who comply with rules out of moral obligation), and the“incorrigible” (those driven by strong, sometimes pathological urges, thosewith severe cognitive deficits, and the impulsive), and most effective among“deterrable” offenders (those neither strongly committed to conformity nordeviance). With a sample of university students, he found that perceptions of
Wright et al. / CRIMINALLY PRONE INDIVIDUALS 187

both the certainty and severity of punishment were inversely related to self-reported intentions to drink and drive only among those defined as“deterrable.” Among the group of incorrigibles, neither the severity nor cer-tainty of punishment had any effect on intentions to drink and drive.
Although these findings would appear to support the position that sanc-tion threats are ineffective among those with the greatest criminal propensity,there are some uncertainties. First, the group that Pogarsky defined as “incor-rigible” might not be the most impulsive but only those, who for other rea-sons, are not responsive to variations in sanction risk and cost. He measuredthe impulsivity of his respondents and reported that there were no differencesamong the “acute conformists,” “deterrables,” and “incorrigibles” on thistrait. Second, the groups labeled as “deterrable” and “incorrigible” were de-fined on the basis of their receptivity to sanction threats, and it should not besurprising that there were differences in their response to certainty and sever-ity. For example, those deemed “incorrigible” reported at least a 50 percentlikelihood of drinking and driving in response to a hypothetical scenario, andtheir self-reported intention to offend was unaffected by one scenario condi-tion that there was “absolutely no chance” that they would be caught. The“deterrables” were more likely to report that they would drink and driveunder the “absolutely no chance” of getting caught condition than in theabsence of that condition. They were, therefore, by definition amenable toappeals to punishment.
Finally, Piquero and Pogarsky (2002) conducted two hypothesis tests ofrelevance to our concern about the conditional effect of sanction threats. Witha sample of university students and a scenario methodology, they examinedwhether the effect of variation in the certainty and severity of punishment onintentions to commit a crime varied between groups who differed in theirprior offending and their impulsivity. Consistent with the prediction thatthose high in criminal propensity are more responsive to sanction threats,they found that the deterrent effect for both the certainty and severity of pun-ishment was higher among those who have some offending experience com-pared with those with no prior offending reported. Contrary to Block andGerety (1995), they found that those most at risk for criminal activity becauseof their high levels of impulsivity were more responsive to the severity ofpunishment than they were to its certainty compared with those low inimpulsivity. There was a significant deterrent effect for perceived severityamong those high in impulsivity (and a weak and nonsignificant effect forperceived certainty), and a significant deterrent effect for perceived certaintyamong those low in impulsivity (and a weak and nonsignificant effect for per-ceived severity). These findings are, however, consistent with the argumentmade by Silberman (1976) that threats of severe rather than certain pun-ishment is necessary to deter those predisposed to crime because they are
188 JOURNAL OF RESEARCH IN CRIME AND DELINQUENCY

generally unmoved by its certainty.2 We should also note that these contradic-tory findings are possible because of the weak positive relationship betweenimpulsivity and both prior and self-reported intentions to offend (r = .23 and.13, respectively).3
In sum, appealing to the empirical literature on the question as to whetherthose high in criminal propensity are more or less responsive to sanctionthreats than those less at risk is unsatisfying. Although some studies havefound evidence that the criminally prone are less affected by the certainty andseverity of punishment, most of these have come from research involvinguniversity students responding to hypothetical crime scenarios. Althoughgenerally such a methodology is a sound way to examine issues pertaining torational choice and offending, it may not be the most effective strategy inaddressing the possible conditional effect of impulsivity.
Ideally, one would want to have substantial variation across persons incriminal propensity. University samples are likely to have substantially trun-cated variation in traits like criminal propensity, impulsivity, and present-orientation. This is not, of course to say that there is no variation in such sam-ples, but it is to say that because university attendance requires a nontrivialamount of perseverance and future orientation, it is likely that college sam-ples will not include those at the upper tail of criminal propensity. What sam-ples of university students may capture, particularly with respect to com-monly studied crimes like drinking and driving, sexual assault, petty theft,drug use, and cheating, are “marginal offenders,” who because there are nostrong moral inhibitions against nor strong motivations toward such acts, aregoing to be responsive to instrumental factors such as the risks and possiblepenalties involved.
Furthermore, this line of research frequently uses intentions to commitcrimes in response to hypothetical scenarios as the outcome variable. Again,although generally a sound and productive strategy with abundant advan-tages over other methodologies, it is possible that it may lead to bias. Supposea manifestation of criminal propensity/impulsivity is a tendency towardboastful “trash talk,” saying you will commit a crime in response to a hypo-thetical scenario in spite of clear sanction costs. Such talk is cheap and in realsituations these persons might be more responsive to risks and penalties. Theobserved outcome in scenario research, however, will be a diminished effectof sanction threats among those with both chutzpah and a proneness towardcrime and antisocial behavior.4
In sum, we think that whether and how criminal propensity/impulsivityconditions the effect of sanction threats is both a terribly important yet unset-tled question in the field. It is clear that the position of classical deterrencetheory that criminal motivation is constant is untenable, yet the exact causalsignificance of motivation still is not clear. We have tried to suggest that there
Wright et al. / CRIMINALLY PRONE INDIVIDUALS 189

are several equally compelling theoretical and empirical reasons for very dif-ferent arguments about the conditional effect that criminal propensity mighthave. In the current article we hope to address this issue with a more generalsample of respondents and self-reported behavior rather than intentions tobehave. In the next section we will outline our general methodology, the sam-ple, and our key measures. This is followed by our results and concludes witha discussion of the implications of our findings.5
METHOD
Data
We conducted our analyses of data from the Dunedin MultidisciplinaryHealth and Development Study (Silva and Stanton 1996). The members ofthe Dunedin study are children born from April 1972 through March 1973 inDunedin, New Zealand, a city of approximately 120,000 people. A total of1,037 study members (91 percent of the eligible births) participated in thefirst follow-up assessment at age 3. These study members formed the basesample for a longitudinal study that has since been followed up, with highlevels of participation, at ages 5 (n = 991), 7 (n = 954), 9 (n = 955), 11 (n =925), 13 (n = 850), 15 (n = 976), 18 (n = 1,008), 21 (n = 992), and 26 (n = 980).The study members were given a diverse battery of psychological, medical,and sociological measures at each assessment. Data about the study memberswere collected from the study members themselves, parents, teachers, in-formants, and trained observers.
In general, the rates of criminal offending in New Zealand approximatethose found in other industrialized countries such as the United States, Can-ada, Australia, and the Netherlands (Junger-Tas, Terlouw, and Klein 1994;van Dijk and Mayhew 1992). Likewise, the rates of crime victimization inNew Zealand are close to those of other countries (van Dijk and Mayhew1992) as are rates of violent crime (Zimring and Hawkins 1997). More spe-cifically, various cross-national comparisons have found that the findingsfrom the Dunedin study generalize to other industrialized countries, espe-cially in the area of criminal behavior. For example, the predictors of problembehavior among the Dunedin Study members are the same as those in a simi-lar longitudinal sample of Black and White youth collected in Pittsburgh(Moffitt et al. 1995).
Our analysis of these longitudinal, observational data may shed light onthe theoretical issues framing this study because previous empirical studieshave tended to rely on scenario experiment research designs. This experi-mental approach, however, explicitly instructs participants to weigh commit-
190 JOURNAL OF RESEARCH IN CRIME AND DELINQUENCY
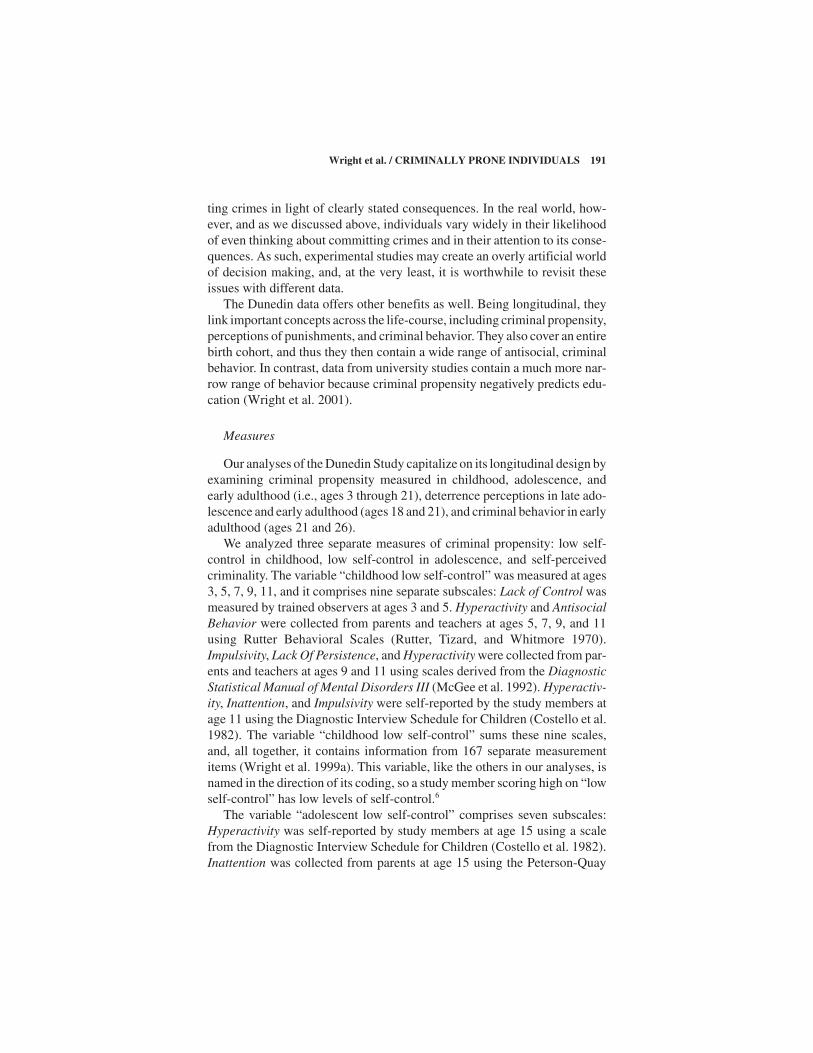
ting crimes in light of clearly stated consequences. In the real world, how-ever, and as we discussed above, individuals vary widely in their likelihoodof even thinking about committing crimes and in their attention to its conse-quences. As such, experimental studies may create an overly artificial worldof decision making, and, at the very least, it is worthwhile to revisit theseissues with different data.
The Dunedin data offers other benefits as well. Being longitudinal, theylink important concepts across the life-course, including criminal propensity,perceptions of punishments, and criminal behavior. They also cover an entirebirth cohort, and thus they then contain a wide range of antisocial, criminalbehavior. In contrast, data from university studies contain a much more nar-row range of behavior because criminal propensity negatively predicts edu-cation (Wright et al. 2001).
Measures
Our analyses of the Dunedin Study capitalize on its longitudinal design byexamining criminal propensity measured in childhood, adolescence, andearly adulthood (i.e., ages 3 through 21), deterrence perceptions in late ado-lescence and early adulthood (ages 18 and 21), and criminal behavior in earlyadulthood (ages 21 and 26).
We analyzed three separate measures of criminal propensity: low self-control in childhood, low self-control in adolescence, and self-perceivedcriminality. The variable “childhood low self-control” was measured at ages3, 5, 7, 9, 11, and it comprises nine separate subscales: Lack of Control wasmeasured by trained observers at ages 3 and 5. Hyperactivity and AntisocialBehavior were collected from parents and teachers at ages 5, 7, 9, and 11using Rutter Behavioral Scales (Rutter, Tizard, and Whitmore 1970).Impulsivity, Lack Of Persistence, and Hyperactivity were collected from par-ents and teachers at ages 9 and 11 using scales derived from the DiagnosticStatistical Manual of Mental Disorders III (McGee et al. 1992). Hyperactiv-ity, Inattention, and Impulsivity were self-reported by the study members atage 11 using the Diagnostic Interview Schedule for Children (Costello et al.1982). The variable “childhood low self-control” sums these nine scales,and, all together, it contains information from 167 separate measurementitems (Wright et al. 1999a). This variable, like the others in our analyses, isnamed in the direction of its coding, so a study member scoring high on “lowself-control” has low levels of self-control.6
The variable “adolescent low self-control” comprises seven subscales:Hyperactivity was self-reported by study members at age 15 using a scalefrom the Diagnostic Interview Schedule for Children (Costello et al. 1982).Inattention was collected from parents at age 15 using the Peterson-Quay
Wright et al. / CRIMINALLY PRONE INDIVIDUALS 191

Behavioral Checklist (Quay and Peterson 1987). Impulsivity, PhysicalResponse to Conflict, and Risk-taking were self-reported by study membersat age 18 using the Multidimensional Personality Questionnaire (Tellegenand Waller 1994). Impulsivity and Inattention were collected from infor-mants at age 18 with single-item measures. “Adolescent low self-control”sums these scales and contains information from 76 measurement items(Wright et al. 1999a).
The variable “self-perceived criminality” was measured at both ages 18and 21 with the following question: “Compared to most people your age,about how would your rate yourself on this scale from 1 to 10? 1 = you do lessillegal things than the average person, 10 = you do more illegal things thanthe average person, and 5 = you are about like most people.” Study membersresponded to the 1-10 scale using a visual ladder. We recognize that somereaders may find this measure of criminal propensity to be controversial dueto possible overlap of the outcome measure of self-reported delinquent acts;however, we use it in this article for several reasons. Most fundamentally, weview self-perceived criminality as a distinct theoretical construct from crimi-nal behavior for it incorporates individuals’ reference groups as well as othercognitive processes that generate self-appraisal.7 Also, the study of deter-rence emphasizes the importance of perceived punishments and rewards, andso its clearest linkage to criminal propensity would also be in the realm ofperceptions (i.e., self-perceived criminality).8
We analyzed two types of deterrence perceptions. The first, “gettingcaught,” was measured at ages 18 and 21 (which we combined into one vari-able) and then again at age 26 (a second variable). At each age, study mem-bers responded to a series of questions about the detection of seven differentcriminal behaviors. Study members were asked, “If you did [crime]on 10 different days, how many times do you think that you would get caughtfor doing it?” Their answers were coded from 0 to 10 days, with higher scoresindicating a greater risk of detection. The crimes inquired about includedshoplifting, car theft, burglary, and using stolen credit cards (all three ages),marijuana use, hitting someone in a fight, and driving while drunk (ages 21and 26 only).
The second type of perception variable, “social sanctions,” was measuredat ages 21 and 26 (two separate variables). Study members answered a seriesof questions about what would happen to them if others found out that theyhad committed various crimes. The first question asked “Would you lose therespect and good opinion of your close friends if they knew that you ——?”The crimes inserted here were shoplifting, car theft, burglary, using stolencredit cards, marijuana use, hit someone in a fight, and driving while drunk.The study members could answer “yes,” “maybe,” or “no.” The remainingquestions referred to the same crimes and asked, “Would you lose the respect
192 JOURNAL OF RESEARCH IN CRIME AND DELINQUENCY

and good opinion of your parents and relatives if they found out that you?” “Would it harm your future job prospects if people knew that you?” “Would it harm your chance to attract or keep your ideal partner ifpeople knew that you ?”
Unfortunately, the otherwise rich Dunedin data set does not measurestudy members’ perceptions about the rewards of crime. Based on the theo-retical discussion above, we would expect that these rewards would havetheir strongest pull toward crime among those individuals most prone tocrime—just as the costs of crime should most affect these same, criminallyprone people. However, we cannot test this expectation of reward percep-tions with our data. The omission of reward data might alter our findings,however, if reward-perceptions make spurious the causal linkage betweencost-perceptions and criminal behavior. We have no a priori reason to ex-pect this type of spuriousness, though, nor have previous studies of rewardsin deterrence models suggested its existence (e.g., Bachman et al. 1992;Paternoster and Simpson 1996; Piliavin et al. 1986).
In our analyses, we standardized the criminal-propensity and deterrence-perception variables described above to have a mean of zero and a standarddeviation of one. This standardization makes regression coefficients easier tointerpret, with a one standard deviation change in X producing some esti-mated change in Y. Centering these main effects at zero also reducesmulticollinearity in interactive models (Jaccard, Turrisi, and Wan 1990:31).
We constructed our dependent variables with self-reported offending datameasured at age 26 with an instrument developed by Elliott and Huizinga(1989) for the National Youth Survey (and adapted for use in the DunedinStudy). This instrument asked study members about their participation in 48different criminal acts, commonly committed by young adults, during theprevious year. These criminal acts included traditionally studied crimes suchas theft, burglary, assault, fraud, and drug offenses. They also included othercrimes such as credit card fraud, prostitution, embezzlement, disabilityfraud, abusing a child, and moving from an apartment without paying thefinal bills. For sensitivity analyses, we also analyzed the self-reported crimedata from the age-21 interview.
From these self-reported data, we created two measures of criminalbehavior—a variety scale and a relative frequency scale. The variety scaleassigns 1 point for every type of crime committed by study members in theprevious year, regardless of how often they committed the crime. Previousstudies have found that adolescents and young adults often do not specializein one type of criminal behavior (Piquero et al. 1999), and so the range oftheir criminal behavior is an important dimension. Variety scales have beendescribed as the best operational measure of general criminal offending(Hirschi and Gottfredson 1995:134).
Wright et al. / CRIMINALLY PRONE INDIVIDUALS 193

To complement the variety scale, we also created a type of frequencyscale. We did this by first identifying major subscales of the self-reportedcrime data—Drug Use, Violence, Theft, Aggression, and Fraud. We did notsimply sum together the frequencies of these subscales, however, becausethey had widely varying distributions. Drug Use, for example, ranged from 0to 2,408 acts whereas violent crime ranged only from 0 to 4. These differ-ences reflect the differing severity of these crimes. Instead, we standardizedthe subscales into a common metric with a mean of zero and a standard devia-tion of one, and we then summed together the standardized subscales to mea-sure the relative frequency of study members’crime—relative in that it mea-sures the frequency of criminal acts relative to other study members. Theresulting measure was highly skewed to the right, so we analyzed itslogarithm.
Our multivariate analyses controlled for gender and social class. The gen-der variable was a dummy variable coded 1 = male and 0 = female. The socialclass variable measured the socioeconomic status (SES) of study members’families with a 6-point scale developed by Elley and Irving (1976). This scaleplaces parents’ occupations into one of six categories based on the educa-tional levels and income associated with that occupation in data from theNew Zealand census. The scale ranges from 1 = “unskilled laborer” to 6 =“professional.” For our analyses, we combined SES levels from birth throughage 15 to create a summary measure of study members’ socioeconomic con-ditions while they were growing up (Wright et al. 1999b).
The data analyzed from the Dunedin Study had relatively few missingcases, usually for only about 2 percent to 3 percent of study members. Toaccount for the missing data in our independent variables, we recoded themissing cases to the mean of the observed cases, and then we created a sepa-rate dummy variable that indicated which cases were recoded. We thenincluded both the recoded substantive variable and the corresponding miss-ing-dummy variable into our regression equations. This procedure allowedus both to analyze more study members and to test if those with missing datadiffered from those without. We did not present the missing-dummy results,however, unless they were statistically significant.
RESULTS
The Distribution of Deterrence Perceptions
We begin our analyses by examining the distribution of deterrence per-ceptions across levels of criminal propensity. This distribution mattersbecause if criminally prone individuals never view crime as costly or risky,
194 JOURNAL OF RESEARCH IN CRIME AND DELINQUENCY
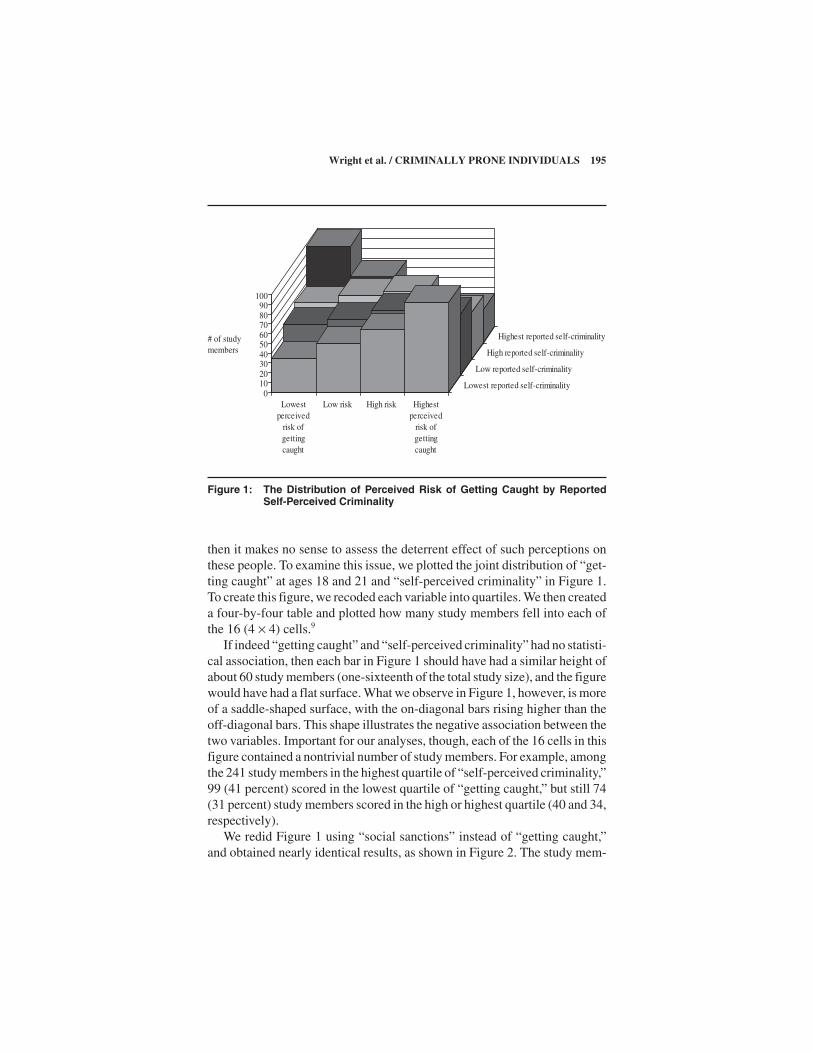
then it makes no sense to assess the deterrent effect of such perceptions onthese people. To examine this issue, we plotted the joint distribution of “get-ting caught” at ages 18 and 21 and “self-perceived criminality” in Figure 1.To create this figure, we recoded each variable into quartiles. We then createda four-by-four table and plotted how many study members fell into each ofthe 16 (4 × 4) cells.9
If indeed “getting caught” and “self-perceived criminality” had no statisti-cal association, then each bar in Figure 1 should have had a similar height ofabout 60 study members (one-sixteenth of the total study size), and the figurewould have had a flat surface. What we observe in Figure 1, however, is moreof a saddle-shaped surface, with the on-diagonal bars rising higher than theoff-diagonal bars. This shape illustrates the negative association between thetwo variables. Important for our analyses, though, each of the 16 cells in thisfigure contained a nontrivial number of study members. For example, amongthe 241 study members in the highest quartile of “self-perceived criminality,”99 (41 percent) scored in the lowest quartile of “getting caught,” but still 74(31 percent) study members scored in the high or highest quartile (40 and 34,respectively).
We redid Figure 1 using “social sanctions” instead of “getting caught,”and obtained nearly identical results, as shown in Figure 2. The study mem-
Wright et al. / CRIMINALLY PRONE INDIVIDUALS 195
0102030405060708090
100
Lowestperceived
risk ofgettingcaught
Low risk High risk Highestperceived
risk ofgettingcaught
Lowest reported self-criminality
Low reported self-criminality
High reported self-criminality
Highest reported self-criminality# of study members
Figure 1: The Distribution of Perceived Risk of Getting Caught by ReportedSelf-Perceived Criminality

bers with the highest self-perceived criminality perceived overall low socialsanctions, yet a meaningful number of them perceived high sanctions.
Figures 1 and 2 demonstrate that some criminally prone study membersviewed crime as risky or costly, and, conversely, some less-prone individualsdid not. This allows us to meaningfully discuss the impact of deterrence per-ceptions at all levels of criminal propensity. It also provides some empiricalsupport for the theoretical position that all persons consider the conse-quences of their behavior and that even those who are high in criminal pro-pensity and impulsivity are capable of foresight. The differences between theimpulsive and criminally prone and others, therefore, may be differences indegree.
Testing the Differential Effect of Deterrence Perceptions
We tested the differential effect of deterrence perceptions with a series ofregression equations that contained interaction terms between deterrenceperceptions and criminal propensity. In the first set of equations, presented inTable 1, we used OLS regression to regress the self-reported offending vari-ety scale at age 26 on “getting caught” at ages 18 and 21 and each of the threecriminal propensity variables.10 Table 1 has six columns with each columnreporting a different regression equation. The first equation, in column 1,tests the main effects of “getting caught” and “childhood low self-control” on
196 JOURNAL OF RESEARCH IN CRIME AND DELINQUENCY
0
20
40
60
80
100
120
Lowestperceived
risk of socialsanctions
Low socialsanctions
High socialsanctions
Highestperceived
risk of socialsanctions
Lowest reported self-criminality
Low reported self-criminality
High reported self-criminality
Highest reported self-criminality# of study members
Figure 2: The Distribution of Perceived Risk of Social Sanctions by ReportedSelf-Criminality

197
TAB
LE
1:
Th
e V
aryi
ng
Eff
ect
of
Per
ceiv
ed R
isk
of
Get
tin
g C
aug
ht
on
th
e Va
riet
y o
f C
rim
inal
Beh
avio
r
Dep
ende
nt V
aria
ble
= V
arie
ty o
f Sel
f-R
epor
ted
Offe
ndin
g at
Age
26
Inde
pend
ent V
aria
ble
(1)
(2)
(3)
(4)
(5)
(6)
Per
ceiv
ed r
isk
of g
ettin
gca
ught
(ag
es 1
8 an
d 21
)–.
650*
(–6.
20)
–.62
1*(–
5.91
)–.
545*
(–5.
38)
–.51
4*(–
5.09
)–.
219*
(–2.
24)
–.23
1*(–
2.39
)M
ale
.903
*(8
.29)
.916
*(8
.43)
.762
*(7
.34)
.775
*(7
.50)
.726
*(7
.59)
.739
*(7
.80)
Soc
ial c
lass
–.28
2*(–
2.72
)–.
266*
(–2.
57)
–.30
0*(–
3.10
)–.
281*
(–2.
91)
–.37
7*(–
4.20
)–.
359*
(–4.
03)
Chi
ldho
od L
ow S
elf-
Con
trol
.335
*(3
.00)
.298
*(2
.67)
Chi
ldho
od L
ow S
elf-
Con
trol
×R
isk
of G
ettin
g C
augh
t–.
260*
(–2.
65)
Ado
lesc
ent l
ow s
elf-
cont
rol
.995
*(9
.71)
.953
*(9
.27)
Ado
lesc
ent L
ow S
elf-
Con
trol
×R
isk
of G
ettin
g C
augh
t–.
307*
(–3.
34)
Sel
f-pe
rcei
ved
crim
inal
ity1.
490*
(15.
81)
1.40
3*(1
4.71
)S
elf-
perc
eive
d C
rimin
ality
×R
isk
of G
ettin
g C
augh
t–.
354*
(–4.
48)
R2
.178
.184
.245
.253
.346
.359
NO
TE
:Cel
ls r
epor
t uns
tand
ardi
zed
OLS
reg
ress
ion
coef
ficie
nts
(t-v
alue
s in
par
enth
eses
).N
= 9
77.
* p<
.05
(tw
o-ta
iled
test
s).

“variety of criminal behavior at age 26,” and column 2 adds an interactionterm created by multiplying together these two predictor variables. Columns3 and 4 present the main and interaction effects for “getting caught” and“adolescent low self-control.” Columns 5 and 6 present the effects for “self-perceived criminality.” Each of these six equations controls for social classand gender.
As shown in columns 1, 3, and 5, the main effects of “getting caught” andof each of the three propensity variables were statistically significant and inthe expected directions. The study members who anticipated getting caughtalso committed fewer crimes, and those with low self-control or high self-perceived criminality committed more crimes.
As shown in columns 2, 4, and 6, the interaction terms between “gettingcaught” and the three propensity variables were statistically significant andnegative.11 Their negative sign indicates that the deterrent effect “gettingcaught” (i.e., its negative effect) was greatest (i.e., even more negative)among study members low in self-control and high in self-perceived crimi-nality. Because the variables used to create these interaction terms share thesame metric, we can roughly compare the magnitude of these interactioncoefficients, and the effect of the perceived risk of getting caught on crimeinteracted most strongly with self-perceived criminality, followed by ado-lescent and childhood low self-control (b = –.354, –.307, and –.260,respectively).
In the second set of equations, presented in Table 2, we repeated the analy-ses of Table 1 using “social sanctions” at age 21 instead of “getting caught,”and we obtained nearly identical results. As shown in columns 1, 3, and 5,“social sanctions” and each of the three criminal propensity variables signifi-cantly predicted variety of self-reported offending as main effects. In col-umns 2, 4, and 6, the interaction terms between “social sanctions” and thethree propensity variables were statistically significant and negative. Assuch, the deterrent effect of perceived social sanctions was strongest amongthe criminally prone study members. The effect of perceived social sanctionson crime interacted most strongly with childhood low self-control, followedby adolescent self-control and then self-perceived criminality (b = –.292,–.225, and –.209, respectively).
To test the robustness of the analyses in Tables 1 and 2, we replicated themusing several different model specifications: an OLS regression equationpredicting offending at age 21 (instead of age 26), a tobit regression equationpredicting offending at age 21, and a tobit regression equation predictingoffending at age 26. We estimated tobit equations to allow for left-hand cen-soring due to the 18 percent of study members who reported “zero” crimes atage 26 (and 8 percent reporting zero at age 21; see Caspi et al. 1998 for a dis-cussion of tobit equations).12
198 JOURNAL OF RESEARCH IN CRIME AND DELINQUENCY

199
TAB
LE
2:
Th
e V
aryi
ng
Eff
ect
of
Per
ceiv
ed R
isk
of
So
cial
San
ctio
ns
on
th
e V
arie
ty o
f C
rim
inal
Beh
avio
r
Dep
ende
nt V
aria
ble
= V
arie
ty o
f Sel
f-R
epor
ted
Offe
ndin
g at
Age
26
Inde
pend
ent V
aria
ble
(1)
(2)
(3)
(4)
(5)
(6)
Per
ceiv
ed r
isk
of s
ocia
lsa
nctio
ns (
age
21)
–.81
0*(–
8.06
)–.
786*
(–7.
83)
–.61
1*(–
6.13
)–.
578*
(–5.
76)
–.34
1*(–
3.53
)–.
320*
(–3.
32)
Mal
e1.
018*
(9.9
0)1.
021*
(9.9
6).8
77*
(8.8
4).8
76*
(8.8
5).7
58*
(8.1
7).7
57*
(8.1
7)S
ocia
l cla
ss–.
088
(–.8
5)–.
089
(–.8
6)–.
141
(–1.
44)
–.14
6(–
1.49
)–.
265*
(–2.
88)
–.25
1*(–
2.73
)C
hild
hood
low
sel
f-co
ntro
l.2
22*
(1.9
9).2
03(1
.82)
Chi
ldho
od L
ow S
elf-
Con
trol
×R
isk
of S
ocia
l San
ctio
ns–.
292*
(–2.
98)
Ado
lesc
ent l
ow s
elf-
cont
rol
.886
*(8
.42)
.866
*(8
.22)
Ado
lesc
ent L
ow S
elf-
Con
trol
×R
isk
of S
ocia
l San
ctio
ns–.
225*
(–2.
51)
Sel
f-pe
rcei
ved
crim
inal
ity1.
429*
(14.
67)
1.37
2*(1
3.79
)S
elf-
perc
eive
d C
rimin
ality
×R
isk
of S
ocia
l San
ctio
ns–.
209*
(–2.
63)
R2
.192
.199
.247
.252
.337
.341
NO
TE
:Cel
ls r
epor
t uns
tand
ardi
zed
OLS
reg
ress
ion
coef
ficie
nts
(t-v
alue
s in
par
enth
eses
).N
= 9
77.
* p<
.05
(tw
o-ta
iled
test
s).

In our replications of the “getting caught” analyses in Table 1, all threeinteraction terms were statistically significant and negative in each of thethree replication analyses—OLS regression with age 21 crime, tobit regres-sion with age 21 crime, and tobit regression with age 26 crime. In our replica-tions of the “social sanction” analyses in Table 2, all three interaction termswere significant and negative in the OLS and tobit equations with crime atage 21. In the third replication, however, using tobit regression and age-26crime, all three interaction effects were negative but only the “childhood self-control” by “social sanctions” effect was statistically significant. In thesereplication analyses, then, 22 of 24 interaction effects were statisticallysignificant in the expected direction.
In the third set of equations, presented in Table 3, we repeated the “gettingcaught” analyses in Table 1 but with a different dependent variable—the rela-tive frequency of crime (logged), rather than its variety, and we again ob-tained similar, if not actually stronger, substantive findings. As shown in col-umns 1, 3, and 5, “getting caught” and each criminal propensity variablesignificantly predicted “relative frequency of self-reported offending” asmain effects. In columns 2, 4, and 6, “getting caught” significantly and nega-tively interacted with each of the three propensity variables. The effect of“getting caught” on crime interacted most strongly with self-perceived crimi-nality, followed by adolescent self-control and then childhood self-control(b = –.049, –.035, and –.020, respectively).
We tested the robustness of the relative frequency analyses in Table 3by replicating them with several different model specifications: a tobit re-gression; an OLS regression using “social sanctions” rather than “gettingcaught”; and a tobit regression using “social sanctions.” In each of these rep-lications, all interaction terms between deterrence perceptions and criminalpropensity were statistically significant and negative.
Illustrating the Differential Effect of Deterrence Perceptions
The regression equations presented test the statistical significance of per-ception-by-propensity interaction effects, but, frankly, they lack intuitiveappeal. To convey more fully the strength and direction of these interactioneffects, we now illustrate them with numerical and graphical methods.
Numerically, we illustrate the differential impact of deterrence percep-tions as follows. In a regression equation Y = B1X1 + B2X2 + B3X1*X2, the coef-ficient B2 represents the effect of X2 on Y when X1 is set at zero (Jaccard et al.1990:26). To estimate the effects of X2 at other levels of X1, one can simplyrecenter X1. We did this with “adolescent self-control.”13
We present our results in Table 4. This table reports the main effects of thetwo deterrence variables, “getting caught” and “social sanctions,” on self-
200 JOURNAL OF RESEARCH IN CRIME AND DELINQUENCY

201
TAB
LE
3:
Th
e V
aryi
ng
Eff
ect
of
Per
ceiv
ed R
isk
of
Get
tin
g C
aug
ht
on
Rel
ativ
e F
req
uen
cy o
f C
rim
inal
Beh
avio
r
Dep
ende
nt V
aria
ble
= R
elat
ive
Freq
uenc
y of
Sel
f-R
epor
ted
Offe
ndin
g at
Age
26
(logg
ed)
Inde
pend
ent V
aria
ble
(1)
(2)
(3)
(4)
(5)
(6)
Per
ceiv
ed r
isk
of g
ettin
gca
ught
(ag
e 21
)–.
054*
(–6.
18)
–.05
2*(–
5.91
)–.
046*
(–5.
35)
–.04
2*(–
4.96
)–.
025*
(–2.
91)
–.02
7*(–
3.18
)M
ale
.033
*(3
.63)
.034
*(3
.75)
.027
*(3
.10)
.029
*(3
.29)
.026
*(3
.14)
.028
*(3
.44)
Soc
ial c
lass
–.02
4*(–
2.82
)–.
023*
(–2.
69)
–.03
1*(–
3.80
)–.
029*
(–3.
58)
–.03
7*(–
4.69
)–.
034*
(–4.
47)
Chi
ldho
od lo
w s
elf-
cont
rol
.050
*(5
.40)
.047
*(5
.08)
Chi
ldho
od L
ow S
elf-
Con
trol
×R
isk
of G
ettin
g C
augh
t–.
020*
(–2.
46)
Ado
lesc
ent l
ow s
elf-
cont
rol
.080
*(9
.23)
.075
*(8
.69)
Ado
lesc
ent L
ow S
elf-
Con
trol
×R
isk
of G
ettin
g C
augh
t–.
035*
(–4.
56)
Sel
f-pe
rcei
ved
crim
inal
ity.1
05*
(12.
69)
.093
*(1
1.25
)S
elf-
perc
eive
d C
rimin
ality
×R
isk
of G
ettin
g C
augh
t–.
049*
(–7.
20)
R2
.129
.135
.176
.193
.231
.270
NO
TE
:Cel
ls r
epor
t uns
tand
ardi
zed
OLS
reg
ress
ion
coef
ficie
nts
(t-v
alue
s in
par
enth
eses
).N
= 9
77.
* p<
.05
(tw
o-ta
iled
test
s).

202
TAB
LE
4:
Th
e E
ffec
ts o
f D
eter
ren
ce P
erce
pti
on
s o
n C
rim
e at
Dif
fere
nt
Lev
els
of
Ad
ole
scen
t L
ow S
elf-
Co
ntr
ol
The
Effe
ct o
f Eac
h D
eter
renc
e P
erce
ptio
n A
sses
sed
at:
Very
Low
Low
Med
ian
Hig
hVe
ry H
igh
Sel
f-C
ontr
olS
elf-
Con
trol
Sel
f-C
ontr
olS
elf-
Con
trol
Sel
f-C
ontr
olC
rime-
Cos
t Per
cept
ion
(90t
h pe
rcen
tile)
(70t
h pe
rcen
tile)
(50t
h pe
rcen
tile)
(30t
h pe
rcen
tile)
(10t
h pe
rcen
tile)
Ris
k of
get
ting
caug
ht(a
ges
18 a
nd 2
1)–.
865*
–.72
4*–.
552*
–.38
1*–.
127
–.25
6–.
215
–.16
4–.
113
–.03
8(–
6.22
)(–
6.35
)(–
5.48
)(–
3.40
)(–
.79)
Ris
k of
soc
ial s
anct
ions
(ag
e 21
)–.
835*
–.73
1*–.
605*
–.48
0*–.
294
–.24
9–.
218
–.18
0–.
143
–.08
8(–
6.25
)(–
6.62
)(–
6.08
)(–
4.27
)(–
1.82
)
NO
TE
:Cel
lsre
port
unst
anda
rdiz
edO
LSre
gres
sion
coef
ficie
nts,
with
stan
dard
ized
coef
ficie
nts
inita
lics
(t-v
alue
sin
pare
nthe
ses)
.All
equa
tions
con-
trol
for
gend
er a
nd s
ocia
l cla
ss.D
epen
dent
var
iabl
e =
age
26
varie
ty o
f crim
inal
beh
avio
r.D
ata
from
the
Dun
edin
Stu
dy.N
= 9
77.
* p<
.05
(tw
o-ta
iled
test
s).

reported offending as assessed at five different levels of adolescent low self-control. (For clarity of presentation, we do not report the remaining co-efficients in each equation, those of low self-control, the interaction terms,gender, and social class.) The first column of numbers reports the effect ofeach deterrence-perception variable on criminal behavior as estimated at a“very low” level of self-control. At this level, the effect of “getting caught”was b = –.865 (and standardized coefficient β = –.256), and the effect of“social sanctions” was b = –.835 (β = –.249), and both variables were statisti-cally significant. At a “low” level of self-control, the effects of the deterrenceperceptions remained negative and significant, but dropped in magnitudesomewhat, at b = –.724 (β = –.215) and b = –.731 (β = –.218), and the vari-ables remained significant at gradually smaller magnitudes through “high”self-control. At a “very high” level of self-control, however, a changeoccurred, for neither deterrence-perception variable was statistically signifi-cant (b = –.127 and β = –.038; b = –.294 and β = –.088). As such, the percep-tion of crime as risky or as costly was estimated to have little effect on thecriminal behavior of this subset of highly controlled study members.
Graphically, we illustrate these interaction effects by plotting the distri-bution of criminal behavior as a function of “getting caught” and “self-perceived criminality.” We present our results in Figure 3, which like Figure1, has a horizontal axis that gives quartile groupings of “getting caught” at
Wright et al. / CRIMINALLY PRONE INDIVIDUALS 203
012345678
Lowestperceived
risk ofgettingcaught
Low risk High risk Highestperceived
risk ofgettingcaught
Lowest reported self-criminality
Low reported self-criminality
High reported self-criminality
Highest reported self-criminality# ofself-reportedcrimes
Figure 3: Self-Reported Offending by Perceived Risk of Getting Caught andReported Self-Criminality

ages 18 and 21 and “self-perceived criminality.” The Y-axis, however, nowreports the average crime scores of the study members in that particular cell.For example, the bar in the front left of Figure 3 rises to slightly above “1,”indicating that the study members at the lowest levels of “getting caught” and“self-perceived criminality” averaged only 1.1 different crimes in the previ-ous 12 months. In contrast, the bar in the back left of Figure 3 shows that thestudy members lowest in “getting caught” but highest in “self-perceivedcriminality” averaged 7.5 crimes.
Several patterns emerge in Figure 3. The bars in the back are overallhigher than those in front, representing the main effect of self-perceivedcriminality. The bars on the left tend to be higher than those on the right, rep-resenting the main effect of the perceived risk of getting caught. In the backrow, the bars change in height considerably when going from left to right—from 7.5 crimes to 3.9 crimes; whereas, in the front row, they change onlyfrom 1.2 to 1.1. This represents the interaction between the perceived risk ofgetting caught and self-perceived criminality in that the former decreasescrime levels most strongly at high levels of the latter.
In Figure 3, we replicate Figure 4 with the variable “social sanctions,” andwe got almost identical results. Self-perceived criminality again had a maineffect from back to front, perceived social sanctions had a main effect fromleft to right, and the effect of perceived social sanctions varied strongly bylevels of self-perceived criminality.
204 JOURNAL OF RESEARCH IN CRIME AND DELINQUENCY
0
1
2
3
4
5
6
7
Lowestperceived
risk of socialsanctions
Low socialsanctions
High socialsanctions
Highestperceived
risk of socialsanctions
Lowest reported self-criminality
Low reported self-criminality
High reported self-criminality
Highest reported self-criminality
# ofself-reportedcrimes
Figure 4: Self-Reported Offending by Perceived Risk of Social Sanctions andReported Self-Criminality

Figures 3 and 4 bear upon another explanation for the relationship be-tween punishments and criminal propensity. Several studies have advancedthe possibility of a curvilinear relationship between criminal propensity anddeterrence, with threatened punishments having no effect on those eithermost likely or least likely to commit crime; instead, punishments affect onlythose in the middle—marginal offenders (Andenaes 1974; Nagin andPaternoster 1994; Pogarsky in press; Zimring and Hawkins 1968, 1973).Empirical evidence for this curvilinear relationship, however, has not beenstrong. Nagin and Paternoster (1994) found a monotonic relationshipbetween deterrence and criminal propensity. Pogarsky (2002) found thatincorrigible respondents responded less to punishments than did others, but itis not clear from the presented analyses that acute conformists were lessdeterred than marginal offenders. As shown in Figures 3 and 4, we found noevidence of a curvilinear relationship, for the respondents with the highestself-reported criminality (i.e., those in the back row), and not those with mid-levels of criminality (i.e., those in the middle two rows) showed the mostresponsiveness to social sanctions.
DISCUSSION
This article examined the relationship between criminal propensity, per-ceptions of the risks and costs of crime, and criminal behavior. We began byreviewing four theoretical perspectives on these relationships. A traditionaldeterrence perspective would hold that the threat of punishment equallyaffects all people, regardless of criminal inclination. Self-control theorywould hold that threatened punishments have a greatly diminished effect onindividuals with low levels of self-control. A third perspective drawn fromvarious sources would hold that the threat of punishment would be mostsalient for, and thus have its greatest impact on, individuals most prone tocrime. An implicit fourth perspective would hold that the effect of sanctionthreats is minimal both for those low in criminal propensity, whose criminalconduct is likely effectively inhibited by noninstrumental factors such asstrong moral beliefs, and for those who are highest in criminal propensity,those who are exceptionally present oriented and impulsive and who, there-fore, are incapable of much foresight.
We tested these competing perspectives using data from the Dunedin(New Zealand) study with which we regressed self-reported crime uponmeasures of criminal propensity, perceived costs of crime, and interactionterms between the two. Using various model specifications, we found consis-tent support for the third theoretical perspective, that viewing criminalbehavior as costly and risky most deterred study members low in self-control
Wright et al. / CRIMINALLY PRONE INDIVIDUALS 205

and high in self-perceived criminality. In fact, at sufficiently low levels ofcriminal propensity, these threatened punishments may have no deterrenteffect at all. The latter results are consistent with a large body of research thatshows that when other inhibitions are strong (such as those provided by one’smoral beliefs), the deterrent effect of sanction threats are irrelevant.
Our findings differ from several recent studies of these issues, and wethink that these differences might arise, in part, due to differences in researchdesigns. Many previous studies have used self-reported intentions to commitcrime as the outcome variable (Nagin and Paternoster 1994; Piquero andPogarsky 2002; Pogarsky 2002). We have suggested that one manifestationof low self-control is a kind of boastful “trash talk” that takes the form of indi-cating that they would commit a crime even in face of risk (maybe because ofthe risk of sanction) in response to a hypothetical crime scenario while beingmore risk conscious when dealing with the commission of an actual crime.Our results also differ from those recently reported by Pogarsky (2002). Hefound that perceived sanction threats did not affect a would-be offender’sself-reported intention to offend when they were classified as “incorrigible.”There are design and sampling differences between Pogarsky’s study andours that may account for the divergent findings. Like Nagin and Paternoster(1994), Pogarsky (2002) employed a scenario design and his respondentswere university students who by their decision to attend college have shownan obvious ability to delay present for future gratification. In addition, thereis an important conceptual difference between the two studies. Our interest inthis article has been on self-control and how it conditions the effect of sanc-tion threats. Pogarsky’s “incorrigible” offenders were not defined on thebasis of their impulsivity or their present orientation. Incorrigible offenderswere those who reported that there was a good chance that they would com-mit a criminal offense (drive while intoxicated) both when sanction threatswere viable and when there was no chance that they would be apprehended.Incorrigible respondents, therefore, were no more likely to offend if theythought they could do so with impunity. It should not be surprising, therefore,that in the analysis reported by Pogarsky, sanction threats had no effectwithin this group. Furthermore, in terms of their impulsivity, Pogarskyreported that the mean level among the incorrigibles was no different fromthose deemed “deterrable” and a group of nonoffenders (“chronic conform-ists”). On closer inspection, therefore, our finding that deterrence works bestamong those at high risk because of their level of self-reported criminal pro-pensity and low self-control is not at odds with Pogarsky’s findings, put theydo raise important questions for future research.
Moreover, our finding that sanction threats inhibit the criminal activity ofthose most at risk of offending does square with other findings reported in theempirical literature. Both qualitative and quantitative research have found
206 JOURNAL OF RESEARCH IN CRIME AND DELINQUENCY

that persistent criminal offenders do consider the risks involved when bothcommitting specific crimes and in deciding to quit the crime “business”(Piquero and Rengert 1999; Rengert and Wasilchick 1985; Shover 1996;Wright and Decker 1994). In addition, experimental research by Block andGerety (1995) has shown that the least conventional are more affected bysome dimensions of punishment (variation in risk) than others (variations inits severity). Our finding that threatened social punishments most affectedcriminally prone individuals is also consistent with those in a previous studywith these same data. In Wright et al. (2001), we found that social bonds,such as to work, family, education, and partners, influenced the criminalbehavior of criminally prone individuals more than others less at risk foroffending.
The conceptual model developed in this article has implications for boththeory of and policy toward crime. For explanations of crime, our model con-tends that propensity theories such as those espoused by Wilson andHerrnstein (1985) and Gottfredson and Hirschi (1990) are not incompatiblewith the notion that offenders also react to the situational incentives and dis-incentives of their behavior. Such propensity theories need not and shouldnot be taken to mean that those at high risk of criminal activity (because of theimpulsivity) are incapable of foresight. Although they may, on average, bemore present-oriented than most, all individuals discount future conse-quences to some extent, and all to some degree are responsive to situationalcontingencies. In fact, our findings suggest that for those most at risk of crim-inal conduct, such instrumental considerations may be the most influentialfactors in deciding both if and how to offend.
More generally, our hypotheses and findings point to a broad conceptualmodel of crime based on both social and psychological predictors. Collec-tively, these findings suggest a broad hypothesis for future study: Manysocial processes bear upon criminal behavior, and whatever the nature oftheir effect, whether to increase or decrease criminal behavior, they havetheir greatest impact on individuals with personal characteristics, both psy-chological and biological in origin, that increase their proclivity to crime.
This “interdependence” hypothesis suggests consistent shortcomings incurrent theories of crime. It implies that sociologically and economicallybased theories, such as social control, labeling, social disorganization, ano-mie, conflict, and Marxist theories, are misspecified on account of not expli-cating the variable impact of social processes as a function of individual pro-pensities. It also implies that psychological and biological theories of crime,such as low self-control, personality, and some developmental theories, aremisspecified due to not incorporating individuals’ differential response totheir social environment. In sum, any explanation of crime must address both
Wright et al. / CRIMINALLY PRONE INDIVIDUALS 207

the person and the person’s social situation, and in this sense, the study ofcrime is intrinsically social-psychological.
For psychological explanations of crime, our model contends that propen-sity theories such as self-control theory (Gottfredson and Hirschi 1990) areincorrect in assuming that criminally prone individuals do not respond tothe perceived risk of criminal sanctions; in fact, they should respond moststrongly. This finding suggests a need to revisit, and perhaps reject, theassumption of social imperviousness that is central to self-control theory. Forsociological explanations of crime, our model warns against assuming uni-form responses to social controls of crime, for the impact of these controlscan vary widely by individuals’preexisting characteristics. For public policy,our model gives optimism for policies that would deter criminal behavior byincreasing its costs. These policies should have their greatest impact on thosetargeted by policy makers—potential criminals. Given that previous studieshave commonly measured deterrence effects across the general population,thereby including many prosocial, less-responsive individuals, these studiesmay have underestimated the true deterrent effect of various policies amongthe criminally prone, and so deterrence policies actually might be moresuccessful than currently thought.
NOTES
1. An implication of this is that because of their present-orientation, those prone to crimewill be more responsive than others to immediate contingencies, such as the rewards, pleasures,and thrills of crime. We do not pursue this interesting angle in this article.
2. Silberman (1976:454) noted that “[f]or persons who are psychologically, culturally, orsocially disposed to commit this type of [serious] crime, neither socialization nor the mere pro-bability of getting caught is sufficient to deter them. The negative correlation between severity ofpunishment and crimes for such ‘serious’ offenses may be because individuals who otherwisewould be inclined to engage in such behavior are in fact deterred by the threat of severepunishment.”
3. Another relevant study is Decker, Wright, and Logie (1993). They found that in responseto posed hypothetical crime situations, a group of active residential burglars were more respon-sive to the possible costs of the risk of being arrested than a noncriminal group of controls. Theynoted, however, that not too much should be made of this fact because the noncriminal group wasnot likely to state that they would commit a burglary.
4. We thank Greg Pogarsky for bringing this observation to our attention.5. We focus our discussion here on the risks and costs of crime, rather than its rewards, due
to data limitations discussed below.6. See Wright et al. (1999b, 2001) for more information about the construction and justifica-
tion of these low self-control measures.7. Several lines of theory are relevant here. In a symbolic interaction approach, young peo-
ple who see themselves as bad kids, relative to others in their reference group, are more likelythan others to commit delinquency (Bartusch and Matsueda 1996; Matsueda 1992). In the book,Seductions of Crime, Katz (1988) describes three components to criminal motivation, including
208 JOURNAL OF RESEARCH IN CRIME AND DELINQUENCY
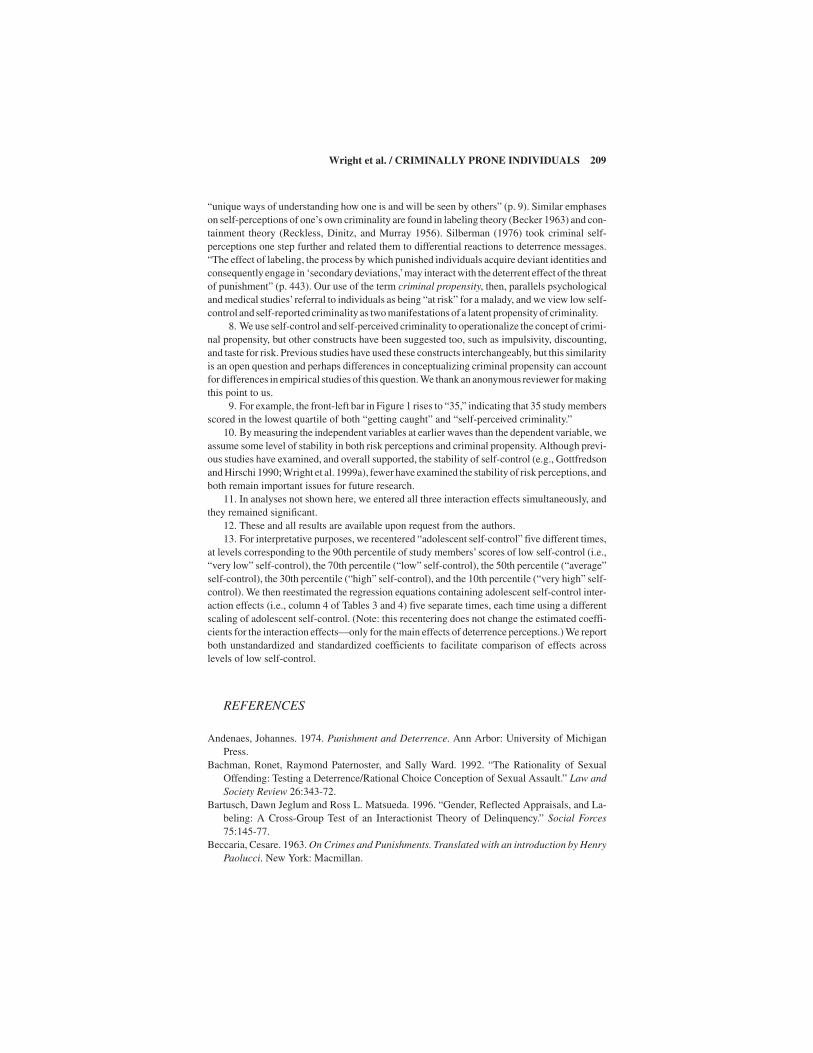
“unique ways of understanding how one is and will be seen by others” (p. 9). Similar emphaseson self-perceptions of one’s own criminality are found in labeling theory (Becker 1963) and con-tainment theory (Reckless, Dinitz, and Murray 1956). Silberman (1976) took criminal self-perceptions one step further and related them to differential reactions to deterrence messages.“The effect of labeling, the process by which punished individuals acquire deviant identities andconsequently engage in ‘secondary deviations,’may interact with the deterrent effect of the threatof punishment” (p. 443). Our use of the term criminal propensity, then, parallels psychologicaland medical studies’ referral to individuals as being “at risk” for a malady, and we view low self-control and self-reported criminality as two manifestations of a latent propensity of criminality.
8. We use self-control and self-perceived criminality to operationalize the concept of crimi-nal propensity, but other constructs have been suggested too, such as impulsivity, discounting,and taste for risk. Previous studies have used these constructs interchangeably, but this similarityis an open question and perhaps differences in conceptualizing criminal propensity can accountfor differences in empirical studies of this question. We thank an anonymous reviewer for makingthis point to us.
9. For example, the front-left bar in Figure 1 rises to “35,” indicating that 35 study membersscored in the lowest quartile of both “getting caught” and “self-perceived criminality.”
10. By measuring the independent variables at earlier waves than the dependent variable, weassume some level of stability in both risk perceptions and criminal propensity. Although previ-ous studies have examined, and overall supported, the stability of self-control (e.g., Gottfredsonand Hirschi 1990; Wright et al. 1999a), fewer have examined the stability of risk perceptions, andboth remain important issues for future research.
11. In analyses not shown here, we entered all three interaction effects simultaneously, andthey remained significant.
12. These and all results are available upon request from the authors.13. For interpretative purposes, we recentered “adolescent self-control” five different times,
at levels corresponding to the 90th percentile of study members’ scores of low self-control (i.e.,“very low” self-control), the 70th percentile (“low” self-control), the 50th percentile (“average”self-control), the 30th percentile (“high” self-control), and the 10th percentile (“very high” self-control). We then reestimated the regression equations containing adolescent self-control inter-action effects (i.e., column 4 of Tables 3 and 4) five separate times, each time using a differentscaling of adolescent self-control. (Note: this recentering does not change the estimated coeffi-cients for the interaction effects—only for the main effects of deterrence perceptions.) We reportboth unstandardized and standardized coefficients to facilitate comparison of effects acrosslevels of low self-control.
REFERENCES
Andenaes, Johannes. 1974. Punishment and Deterrence. Ann Arbor: University of MichiganPress.
Bachman, Ronet, Raymond Paternoster, and Sally Ward. 1992. “The Rationality of SexualOffending: Testing a Deterrence/Rational Choice Conception of Sexual Assault.” Law andSociety Review 26:343-72.
Bartusch, Dawn Jeglum and Ross L. Matsueda. 1996. “Gender, Reflected Appraisals, and La-beling: A Cross-Group Test of an Interactionist Theory of Delinquency.” Social Forces75:145-77.
Beccaria, Cesare. 1963. On Crimes and Punishments. Translated with an introduction by HenryPaolucci. New York: Macmillan.
Wright et al. / CRIMINALLY PRONE INDIVIDUALS 209

Becker, Gary S. 1968. “Crime and Punishment: An Economic Approach.” Journal of PoliticalEconomy 76:169-217.
Becker, Howard S. 1963. Outsiders: Studies in the Sociology of Deviance. New York: Free Press.Bennett, Trevor and Richard T. Wright. 1984. Burglars on Burglary: Prevention and the Of-
fender. Hampshire, UK: Gower.Bentham, Jeremy. 1948. An Introduction to the Principles of Morals and Legislation. Edited with
an introduction by Laurence J. Lafleur. New York: Hafner.Block, Michael K. and Vernon E. Gerety. 1995. “Some Experimental Evidence on Differences
Between Student and Prisoner Reactions to Monetary Penalties and Risk.” Journal of LegalStudies 24:123-38.
Caspi, Avshalom, Bradley R. Entner Wright, Terrie E. Moffitt, and Phil A. Silva. 1998. “EarlyFailure in the Labor Market: Childhood and Adolescent Predictors of Unemployment in theTransition to Adulthood.” American Sociological Review 63:424-51.
Costello, Anthony, Craig Edelbrock, R. Kalas, Marie Kessler, and S. Klaric. 1982. NationalInstitute of Mental Health Diagnostic Interview Schedule for Children. Rockville, MD:National Institute of Mental Health.
Cromwell, Paul F., James N. Olson, and D’Aunn Wester Avary. 1991. Breaking and Entering: AnEthnographic Analysis of Burglary. Newbury Park, CA: Sage.
Cusson, Maurice and Pierre Pinsonneault. 1986. “The Decision to Give Up Crime.” Pp. 72-82 inThe Reasoning Criminal: Rational Choice Perspectives of Offending, edited by Derek B.Cornish and Ronald V. Clarke. New York: Springer-Verlag.
Decker, Scott, Richard Wright, and Scott Logie. 1993. “Perceptual Deterrence among ActiveResidential Burglars: A Research Note.” Criminology 31:135-47.
Elliott, Delbert S. and David Huizinga. 1989. “Improving Self-Reported Measures of Delin-quency.” Pp. 155-86 in Cross-National Research in Self-Reported Crime and Delinquency,edited by Malcolm W. Klein. Dordrecht: Kluwer-Nijhoff.
Elley, Warrick B. and James C. Irving. 1976. “Revised Socio-Economic Index for New Zealand.”New Zealand Journal of Educational Studies 7:153-67.
Etzioni, Amitai. 1988. The Moral Dimension: Toward a New Economics. New York: Free Press.Feeney, Floyd. 1986. “Robbers as Decision-Makers.” Pp. 53-71 in The Reasoning Criminal:
Rational Choice Perspectives of Offending, edited by Derek B. Cornish and Ronald V.Clarke. New York: Springer-Verlag.
Fry, Margery. 1951. Arms of the Law. London: Victor Gollancz Ltd.Gottfredson, Michael R. and Travis Hirschi. 1990. A General Theory of Crime. Stanford, CA:
Stanford University Press.Hirschi, Travis and Michael R. Gottfredson. 1995. “Control Theory and the Life-Course Per-
spective.” Studies on Crime and Crime-Prevention (Swedish National Council for CrimePrevention) 4:131-42.
Jaccard, James, Robert Turrisi, and Choi K. Wan. 1990. Interaction Effects in Multiple Regres-sion. Newbury Park, CA: Sage.
Junger-Tas, Josine, Gert-Jan Terlouw, and Malcolm W. Klein. 1994. Delinquent BehaviorAmong Young People in the Western World. Amsterdam: Kugler.
Katz, Jack. 1988. Seductions of Crime: Moral and Sensual Attractions of Doing Evil. New York:Basic Books.
Liska, Allen E. and Steven F. Messner. 1999. Perspectives on Crime and Deviance, 3rd ed. UpperSaddle River, NJ: Prentice Hall.
Matsueda, Ross L. 1992. “Reflected Appraisals, Parental Labeling, and Delinquency: Specify-ing a Symbolic Interactionist Theory.” American Journal of Sociology 97:1577-1611.
McGee, Rob, Michael Feehan, Sheila M. Williams, and Jessie C. Anderson. 1992. “DSM-IIIDisorders from Age 11 to 15 years.” Journal of Abnormal Child Psychology 13:337-52.
210 JOURNAL OF RESEARCH IN CRIME AND DELINQUENCY

Meisenhelder, Thomas N. 1977. “An Exploratory Study of Exiting from Criminal Careers.”Criminology 15:319-34.
Moffitt, Terrie E., Avshalom Caspi, Phil A. Silva, and Magda Stouthamer-Loeber. 1995. “Indi-vidual Differences in Personality and Intelligence Are Linked to Crime: Cross-Context Evi-dence from Nations, Neighborhoods, Genders, Races, and Age-Cohorts.” Pp. 1-34 inCurrent Perspectives on Aging and the Life Cycle, Volume 4, Delinquency and Disrepute inthe Life Course: Contextual and Dynamic Analyses, edited by John Hagan. Greenwich, CT:JAI.
Nagin, Daniel S. and Greg Pogarsky. 2001. “Integrating Celerity, Impulsivity, and ExtralegalSanction Threats into a Model of General Deterrence: Theory and Evidence.” Criminology39:865-92.
Nagin, Daniel S. and Raymond Paternoster. 1993. “Enduring Individual Differences and Ratio-nal Choice Theories of Crime.” Law & Society Review 27:467-96.
Nagin, Daniel S. and Raymond Paternoster. 1994. “Personal Capital and Social Control: TheDeterrence Implications of a Theory of Individual Differences in Criminal Offending.”Criminology 32:581-606.
Parsons, Talcott. 1937. The Structure of Social Action. New York: Free Press.Paternoster, Raymond and Sally Simpson. 1996. “Sanction Threats and Appeals to Morality:
Testing a Rational Choice Model of Corporate Crime.” Law & Society Review 30:549-83.Piliavin, Irving, Rosemary Gartner, Craig Thornton, and Ross L. Matsueda. 1986. “Crime,
Deterrence, and Rational Choice.” American Sociological Review 51:101-19.Piquero, Alex R. and Greg Pogarsky. 2002. “Beyond Stafford and Warr’s Reconceptualization of
Deterrence: Personal and Vicarious Experiences, Impulsivity, and Offending Behavior.”Journal of Research in Crime and Delinquency 39:153-86.
Piquero, Alex R., Raymond Paternoster, P. Mazerolle, Robert Brame, and C. W. Dean. 1999.“Onset Age and Offense Specialization.” Journal of Research in Crime and Delinquency36:275-99.
Piquero, Alex R. and George Rengert. 1999. “Studying Deterrence with Active Residential Bur-glars.” Justice Quarterly 16:451-71.
Pogarsky, Greg. 2002. “Identifying Deterrable Offenders: Implications for DeterrenceResearch.” Justice Quarterly 19(3):431-452.
Quay, Herb C. and D. R. Peterson. 1987. Revised Behavioral Problem Checklist: Interim Man-ual. Coral Gables, FL: University of Miami.
Reckless, Walter, Simon Dinitz, and Ellen Murray. 1956. “Self-Concept as an Insulator againstDelinquency.” American Sociological Review 21:744-56.
Rengert, George and John Wasilchick 1985. Suburban Burglary: A Time and Place for Every-thing. Springfield, IL: Charles C Thomas.
Rutter, Michael, J. Tizard, and K. Whitmore. 1970. Education, Health, and Behavior. New York:Wiley.
Shover, Neal. 1996. Great Pretenders: Pursuits and Careers of Persistent Thieves. Boulder, CO:Westview Press.
Silberman, Matthew. 1976. “Toward a Theory of Criminal Deterrence.” American SociologicalReview 41:442-61.
Silva, Phil A. and Warren R. Stanton. 1996. From Child to Adult: The Dunedin MultidisciplinaryHealth and Development Study. Auckland, New Zealand: Oxford University Press.
Taylor, Ian, Paul Walton, and Jock Young. 1973. The New Criminology. New York: Harper andRow.
Tellegen, Auke and Niels G. Waller. 1994. “Exploring Personality through Test Construction:Development of the Multidimensional Personality Questionnaire.” Pp. 133-61 in Personality
Wright et al. / CRIMINALLY PRONE INDIVIDUALS 211

Measures: Development and Evaluation, Vol. 1, edited by Steven R. Briggs and Jonathan M.Cheek. Greenwich, CT: JAI.
Tittle, Charles R. 1977. “Sanction Fear and the Maintenance of Social Order.” Social Forces55:579-96.
Tittle, Charles R. 1980. Sanctions and Social Deviance: The Question of Deterrence. New York:Praeger.
Toby, Jackson. 1964. “Is Punishment Necessary?” Journal of Criminal Law, Criminology, andPolice Science 55:332-37.
Trasler, Gordon. 1993. “Conscience, Opportunity, Rational Choice, and Crime.” Pp. 305-22 inRoutine Activity and Rational Choice, Advances in Criminological Theory, Volume 5, editedby Ronald V. Clarke and Marcus Felson (Freda Adler and William Laufer, series editors).New Brunswick, NJ: Transaction Press.
Van Dijk, Jan and Pat Mayhew. 1992. Criminal Victimization in the Industrialized World. TheHague, the Netherlands: Ministry of Justice.
Walsh, Dermot. 1986. “Victim Selection Procedures among Economic Criminals: The RationalChoice Perspective.” Pp. 39-52 in The Reasoning Criminal: Rational Choice Perspectives ofOffending, edited by Derek B. Cornish and Ronald V. Clarke. New York: Springer-Verlag.
West, W. Gordon. 1978. "The Short-Term Careers of Serious Thieves.” Canadian Journal ofCriminology 20:169-90.
Wilkins, Leslie T. 1962. “Criminology: An Operational Research Approach.” Pp. 305-332 inSociety: Problems and Methods of Study, edited by A. T. Welford, Michael Argyle, D. V.Glass, and J. N. Morris. New York: Philosophical Library.
Wilson, James Q. and Richard Herrnstein. 1985. Crime and Human Nature. New York: Simon &Schuster.
Wright, Bradley R. E., Avshalom Caspi, Terrie E. Moffitt, and Phil A. Silva. 1999a. “Low Self-Control, Social Bonds, and Crime: Social Causation, Social Selection, or Both?” Criminol-ogy 37:479-514.
Wright, Bradley R. E., Avshalom Caspi, Terrie E. Moffitt, Richard A. Miech and Phil A. Silva.1999b. “Reconsidering the Relationship between SES and Delinquency: Causation but NotCorrelation.” Criminology 37:175-94.
Wright, Bradley R. E., Avshalom Caspi, Terrie E. Moffitt, and Phil A. Silva. 2001. “The Effectsof Social Ties on Crime Vary by Criminal Propensity: A Life-Course Model of Interdepen-dence.” Criminology 39:321-51.
Wright, James D. and Peter H. Rossi. 1985. Armed Criminals in America: A Survey of Incarcer-ated Felons, 1983. Ann Arbor, MI: Inter-University Consortium for Political and SocialResearch.
Wright, Richard T. and Scott H. Decker. 1994. Burglars on the Job: Streetlife and ResidentialBreak-ins. Boston: Northeastern University Press.
Zimring, Franklin E. and Gordon J. Hawkins. 1968. “Deterrence and Marginal Groups.” Journalof Research in Crime and Delinquency 5:100-14.
Zimring, Franklin E. and Gordon J. Hawkins. 1973. Deterrence: The Legal Threat in Crime Con-trol. Chicago: University of Chicago Press.
Zimring, Franklin E. and Gordon Hawkins. 1997. Crime Is Not The Problem: Lethal Violence inAmerica. Oxford: Oxford University Press.
Bradley R. E. Wright is an assistant professor in the Department of Sociology at the Uni-versity of Connecticut. His research focuses on the social psychology of crime anddeviance.
212 JOURNAL OF RESEARCH IN CRIME AND DELINQUENCY
Avshalom Caspi is a professor of personality and social psychology at the Institute ofPsychiatry at King’s College London, and professor of psychology at the Universityof Wisconsin. He research focuses on the measurement, development, and implicationsof personality differences across the life span. For his research, he received the Dis-tinguished Scientific Award for Early Career Contribution to Psychology from theAmerican Psychological Association (1995) and the John P. Hill Memorial Award forcontributions to the understanding of adolescent development from the Society for Re-search on Adolescence (2002).
Terrie E. Moffitt researches the interplay between nature and nurture in the origins ofproblem behaviors, particularly antisocial behaviors. She directs the Environmental-Risk Longitudinal Twin Study (“E-risk”) and is associate director of the DunedinMultidisciplinary Health and Development Study in New Zealand, which is described inher 2001 book, Sex Differences in Antisocial Behaviour: Conduct Disorder, Delin-quency and Violence in the Dunedin Study (Cambridge University Press).
Ray Paternoster is a professor in the Department of Criminology and Criminal Justice atthe University of Maryland. He is interested in criminal offending over the life course,capital punishment, and quantitative methods in criminology.
Wright et al. / CRIMINALLY PRONE INDIVIDUALS 213