Embed Size (px)
Citation preview

Does the US use Food Safety Regulation as a Disguised Barrier to Trade? Evidence from Canadian Agri-food Commodity
Exports.
Emily R. Rollins, Department of Food, Agriculture and Natural Resources - University of Guelph,
Selected Paper prepared for presentation at the 2015
Agricultural & Applied Economics Association and Western Agricultural Economics Association Annual
Meeting, San Francisco, CA, July 26-28 Copyright 2015 by Emily R. Rollins. All rights reserved. Readers may make verbatim copies of this document for non-commercial purposes by any means, provided that this copyright notice appears on all such copies.

2
Does the US use Food Safety Regulation as a Disguised Barrier to Trade? Evidence from Canadian Agri-food Commodity Exports.
Emily R. Rollins
Department of Food, Agriculture and Natural Resources University of Guelph
Abstract
This study asks the question: is the US using food safety regulations illegitimately, that is as a non-tariff barrier to trade rather than to manage food safety risks, specifically in the context of agri-food imports from Canada? Data on US import refusals of three categories of fruits, vegetables and nuts, cereal products, and seafood are used as a proxy for stringency and enforcement of US food safety regulations, with a negative binomial generalized linear model being employed to determine the significance of range of food safety risk and other less legitimate drivers of US food safety regulations. Key variables used to capture political influence on US food safety regulations are lobbying contributions, changes in import prices, and the occurrence of countervailing investigations. While US border rejections for these commodities are largely explained by food safety risks, there is evidence of political influence, with qualitative and quantitative difference across the commodities. Keywords: Food safety regulation, non-tariff barriers, protectionism, import refusals
1. Introduction
Agricultural food trade has experienced significant growth and change over the last decades (Figure 1). The establishment of the World Trade Organization (WTO), along with multilateral trade agreements such as the North American Free Trade Agreement (NAFTA) encouraged the principles of free trade, reducing tariffs and eliminating quotas. Additionally, factors such as improvements in technology and transportation have also contributed to increased trade in food products (Jaffee, et al. 2005). At the same time, the combination of a growing population and globalization of the food supply and food value chains has altered and increased the world demand for food. Globalization and higher incomes have transformed and diversified consumer preferences, which now demand the availability of a wide range of multicultural foods. Additionally, product attributes such as quality, nutritional value, and convenience contribute to consumer purchasing decisions (Josling et al., 2004), and a rapid increase in trade of high-value agricultural commodities such as meats, fish, fruits and vegetables can now be seen. Agricultural trade plays an important role in light of this increasing demand for imported foods.

3
The EU and the U.S. are the leading importers of food in the world, (Statistica, 2014), and are Canada’s most important trading partners. American food and agricultural product imports have increased by 177 percent over the years 1999 to 2013 (USDA, 2014), with high-value products such as meats, fish, fruits and vegetables being the fastest growing traded agricultural commodities – which happen to have the highest level of food risk associated with them. In fact, food-related illnesses have grown with globalization and population growth, proliferating health risks through agricultural trade. Figure 1 US imports of Agri-Food Products over US GDP
Source: World Bank, 2015 Over the years, new and changing food-bourne diseases have been discovered, and new technology and scientific studies have allowed for a deeper understanding of existing food-related health hazards. Meanwhile, the growing number of occurrences of food-related health outbreaks alongside global agri-food trade has raised concerns surrounding food safety, and eroded consumer confidence in the food system. Increased awareness and scientific understanding of food-bourne illness along with consumer demands for safer food in the past decades has lead to food safety regulation reform, in which public and private regulatory initiatives were developed to harmonize standards and restore consumer confidence. As a result, food safety regulation has increased in complexity and stringency. In the case of the U.S., the introduction of the Food Safety Modernization Act (FSMA) in 2011 granted the Food and Drug Administration (FDA) the authority to perform recalls for all food products (Food and Drug Administration, 2014), and the power to regulate growers and producers on all levels of the supply chain. One feature of food safety reform over the years has been a shift in focus from specification-based standards to performance-based measures, allowing for greater flexibility. Performance-based measures specify food safety goals, but leave the process
0
20000
40000
60000
80000
100000
120000
140000
2002 2003 2004 2005 2006 2007 2008 2009 2010 2011 2012 2013
US Dollars
US GDP (Real, in billions) US agri-‐food imports (in millions)

4
of production to the discretion of producers (Henson and Caswell, 1999). Also, the role of private standards in food safety regulation has become stronger. The principles of Hazard Analysis Critical Control Point (HACCP) has been mandated for use in process controls, which allow the process to be customized to individual facilities by identifying the critical points in production requiring the most oversight. HACCP is an intensive certification system that monitors food production from all stages of the value chain working as a preventative measure, used to identify and control hazards.
2. Trade-distorting effect of regulation
In the context of international agri-food trade, regulation is seen as a key mechanism to manage food safety risks associated with imports. The benefits of safety regulations are felt by both producers and consumers, and depend on the type of regulation. The benefits include reduced health risks, improved product choices from strengthened transparency, and gains in consumer confidence. However, because regulation imposes compliance costs, it’s understood that it can impede trade. In theory, these regulation costs are offset by the benefits they provide. With increased stringency and emerging food safety standards, new challenges are posed to agricultural exporters – raising the cost of exporting, damaging their comparative advantage, and sometimes preventing trade from happening at all. Since the inception of the WTO, the use of tariffs has been largely eliminated, eroding the ability for countries to protect. Along with the increased trade flow, domestic producers are incentivized to turn to illegitimate regulations for alternate means of protection, leading to concerns that food safety regulation can be used in place of tariffs as non-tariff barriers (NTB’s), thus imposing unwarranted costs on exporters and damaging comparative advantage. Illegitimate uses of regulation create problems because, as NTB’s, they distort trade with no added benefits to consumer safety, and because they are so difficult to identify in the context of safety regulations. This study considers “illegitimate regulation” as the illegitimate use of, and/or setting of regulation. Thus, the establishment and/or enforcement of food safety regulation driven by factors apart from health or environmental risk, under the pretense that it is, for domestic gain. This definition accounts for instances of increased pressure on the FDA to increase inspection on imports for means other than food safety. As mentioned, if regulation is used legitimately then in principle a reduction in trade due to higher costs, but an increase in consumer protection, should be seen – which can actually raise consumer demand and cancel out the costs. However, when regulation is imposed when no health risks exist, there are no offsetting health benefits (ignoring the perceived consumer benefits associated with food safety regulations). Josling et. al, (1999) propose a regulatory protection model in which the purpose of regulation is to provide protection for the importing country, with no legitimate health risks associated with the regulation. The two-panel trade diagram in Figure 2 shows the effects of compliance costs due to protectionist regulation on trade. The left hand graph depicts the importer, and the right shows the world market. At Pw, the domestic demand is Qd1, the

5
domestic supply is Qs1, and the difference between them is the amount imported. In the right hand panel, M1 is the amount exported. When the importing country adopts an illegitimate border regulation to protect domestic producers, the cost of compliance for the exporting countries raises the price from pw to pw+c. The new cost curve makes the imports fall from M1 to M2, or Qd2-Qs2. The consumer surplus falls by A+B+C+D, and the producer surplus increases by A. The net welfare loss, or reduction in the gains from trade becomes E+F. This model shows the effect of an illegitimate regulation on trade, which is the basis for the empirical model of this study.
Figure 2. Regulatory protection model.
Source: Joslings et. al, 1999 The role NTB’s in international trade as a means to protection have long been of concern (Hillman, 1978). While it has been shown that protectionist trade measures such as antidumping duties and safeguard tariffs can inhibit exports of trading partners, and deflect trade to third parties (Anders and Caswell, 2009, Grant and Anders, 2010, Mart´ı nez-Zaroso and Nowak-Lehmann, 2005), only a limited body of empirical literature considers the legitimacy of food safety regulations on agricultural trade. The existing literature analyzing the drivers of food safety regulation in the context of agricultural trade shows empirical evidence suggesting the use of food safety regulation as barriers to trade (Baylis et al. 2009; Nakuja and Kerr. 2013). The scope of analysis on the legitimacy of food safety regulation is very limited, and there is a need for research focus on specific sectors and trading partners. Furthermore, there is no existing analysis of the legitimacy of American regulations on Canadian agricultural imports based on import refusal data on the particular commodity groups of this study.
!"#$%&'()*%+%$,"&(+-'$$"$.!/0!(0"123-2"2!$".2'"&(34!)!-3'"+56'-.37'"+)"&(+.'-.3/8"0+4'$.3-"-(+&$9"":/".2'('8%*!.+(;"&(+.'-.3+/"4+0'*<".2'('"!('"/+"!-.%!*"&2;=.+$!/3.!(;"(3$>$"!$$+-3!.'0"13.2"34&+(.$"+)".2'"&(+0=%-.?".2'"&(+-'$$"$.!/0!(0"$34&*;"'@3$.$".+"(!3$'"-+$.$)+(")+('38/"&(+0%-'($9
!"#$%&'%()'%*#'+&,-'
A2'".(!0'"!/0"1'*)!('"'))'-.$"3/"!"('8%*!.+(;"&(+.'-=.3+/"4+0'*".2!."!('"$''/"3/")38%('"B"(')*'-.".2'")+**+1=3/8"!$$%4&.3+/$C"#D,".2'"('8%*!.3+/"!&&*3'$".+"!**-+%/.(3'$"'@&+(.3/8".+".2'"34&+(.3/8"-+%/.(;#'@&+(.'(=%/37'($!*,<"#B,"+/*;".23$"34&+(.'("!&&*3'$.2'"('8%*!.3+/"#34&+(.'(=$&'-3)3-,<"!/0"#E,".2'"*'7'*"+)34&+(.$"3$"$4!**"('*!.37'".+".2'".+.!*"1+(*0"4!(>'.#.2'"$4!**"-+%/.(;"-!$',9"F &(+2353.37'"('8%*!.3+/"+/34&+(.$<"$%-2"!$"!".+.!*"5!/<"1+%*0"*'!0".+".(!0'"7+*=%4'"!."G'(+"+("HI9""A(!0'"3/".2'"!5$'/-'"+)".2'"('8%=*!.3+/"1+%*0"*'!0".+"34&+(."7+*%4'"HD<"13.2".2'
%$%!*"8!3/$")(+4".(!0'9""J3.2".2'"/+/=&(+2353.37'"('8=%*!.3+/"34&+$'0"+/"34&+(.$<".2'"&(3-'"+)".2+$'34&+(.$"(3$'$"!/0".(!0'"$2(3/>$"#HB,<"('0%-3/8".2'8!3/$")(+4".(!0'"5;"!('!$"K"L"M9""N+.'".2!.".2'"1'*=)!('"*+$$"3$"/+."6%$.".2'".(3!/8*'")!43*3!(")(+4".!(3))!/!*;$3$"5%."!*$+".2'"('-.!/8%*!("!('!".2!."0'&'/0$"+/.2'".+.!*"*'7'*"+)"34&+(.$"!/0".2'"2'382."+)".2'"('8%*!=.+(;"-+4&*3!/-'"-+$.9""A2%$"1'"-!/"$!;"13.2"('!$+/=!5*'"-'(.!3/.;".2!.".2'"&+.'/.3!*"1'*)!('"*+$$'$")(+4%/1!((!/.'0"('8%*!.+(;"&(+.'-.3+/"'@-''0".2+$'")(+4.!(3))$<"123-2"1+%*0"('$%*."3/"!".!(3))=3/-*%$37'"&(+0=%-."&(3-'"'O%!*".+"P1""L"Q"3/".2'"34&+(.3/8"-+%/.(;<!$".!(3))$"!."*'!$."8'/'(!.'".!(3))"('7'/%'9
A2'"'!$3'$."1!;".+"-2!(!-.'(3G'".2'".(!0'"'))'-.$"+)('8%*!.+(;"&(+.'-.3+/"&+*3-3'$"3$".+"%$'".2'"-+/-'&."+)!".!(3))"'O%37!*'/."#!$"-2+$'/"5;"R(3$$+))<"Q!*73/<"!/0S(!;,9""A23$"-!/"5'"0')3/'0"!$".2'".!(3))".2!."1+%*0('$.(3-.".(!0'".+".2'"$!4'"'@.'/."!$".2'"('8%*!.+(;"&(+=.'-.3+/9"":/".2'"$34&*'"'@!4&*'"837'/"2'('<".2'".!(3))'O%37!*'/."3$"'O%!*".+".2'"-+$."+)"-+4&*3!/-'9""A23$
BT !"#$%&'"()*+,-"',#$).#//'+/0)12)*/#3+ K-+/+43-"U'$'!(-2"V'(73-'WXVYF
!"#$%&#'()*%#++($,)-,*$%,"*%,)-.*%-/.%0*+&-)*%*&&*1,$%#/%,"*%)*'(+-,2)3%4)2,*1,#2/%52.*+6%7#*0*.%&)25%,"*%4*)$4*1,#7*%2&%,"*%#542),8#/'%12(/,)39%%:$$(5*%,"*%;$5-++812(/,)3;%1-$*%&2)%,"*%#542),*)6%0#,"%.25*$,#1%4)2.(1*)$%-/.%12/$(5*)$%&-1#/'%,"*%02)+.%4)#1*6<=9%%:,%,"#$%4)#1*6%,"*%>(-/,#,3%.*5-/.*.%?3%12/$(5*)$%#$%@AB 6%,"*%>(-/,#,3%$(44+#*.%?3%.25*$,#1%4)2.(1*)$%#$%@CB6%-/.%,"*.#&&*)*/1*%?*,0**/%,"*$*%,02%-52(/,$%#$%,"*%>(-/,#,3%#542),*.%D$**/%-$%@AB 8%@CB #/%,"*%+*&,8"-/.%4-/*+%-/.%EB #/%,"*%)#'","-/.%4-/*+F9%%="*/%,"#$%#542),*)%-+2/*%-.24,$%-%(/#7*)$-+%?2).*)%)*'(+-,#2/%#/,*/.*.%$2+*+3%,2%4)2,*1,%.25*$,#1%4)2.(1*)$6%,"*4)#1*%#/%,"*%#542),#/'%12(/,)3%#/1)*-$*$9%%G/%,"#$%$1*/-)#26%#542),$%&-++%,2%EH D$**/%-$%@AH 8%@CH #/%,"*%+*&,%"-/.%4-/*+F6%.*,*)85#/*.%?3%,"*%#/,*)$*1,#2/%2&%,"*%*I1*$$%.*5-/.%1()7*%JA%-/.%,"*%/*0%1254+#-/1*%12$,8#/1+($#7*%4)2.(1,%4)#1*%<= K%L9L2/$(5*)%$()4+($%-+$2%&-++$6%?3%,"*%-)*-%: K%M%K%L%K%A6%0"#+*%4)2.(1*)%$()4+($%#/1)*-$*$%?3%:9%%!"*%)*'(+-,#2/%,"*)*&2)*%)*$(+,$#/%/*,%0*+&-)*%+2$$*$%D2)%-%)*.(1,#2/%#/%,"*%'-#/$%&)25%,)-.*%)*+-,#7*%,2%,"*%&)**%,)-.*%*>(#+#?)#(5%-,%,"*%#/,*)$*1,#2/%2&%JA%-/.<=F%*>(-+%,2%,"*%-)*-%J%K%N9

6
The North American Free Trade Agreement (NAFTA) and the World Trade Organization (WTO) have provisions in place to discourage and avoid the misuse of food safety regulations, are to settle trade disputes over import regulations. They uphold each country’s right to implement Sanitary and Phytosanitary (SPS) measures so long as they are based on sound scientific evidence, are non-discriminatory, and only used to the necessary extent (Orden and Romano, 1996). Established in 1994, NAFTA provides a dispute settlement mechanism for quick impartial ruling on trade disputes (North American Free Trade Agreement, 2013). The WTO attempts to address concerns of trade-distorting safety regulation by setting suggested regulation levels through the WTO agreement on SPS measures. The purpose of SPS measures is to protect human, animal or plant life or health (WTO, 2014) while making sure that safety regulations are not illegitimately used for protectionist purposes. The WTO established SPS and TBT agreements among member countries to regulate additional adopted regulatory measures by requiring scientific risk assessments and that the regulatory goals be attainted in the least-trade-distorting manner (Josling et al., 2004.).
3. Border Rejection Data
One outcome of food safety regulations on agricultural trade is a failure to comply, resulting in import refusals. Import refusals (or border rejections) offer a new dimension in the analysis of the effects of food safety regulations on trade; they can act as an indicator of an exporters’ compliance capacity in relation to the stringency of a regulation. Border rejection data is useful for analysis of instances of non-compliance with food safety regulations in trade: it is usually attainable, and it offers an evaluation (albeit somewhat limited) of the compliance capacity of an exporter. Border rejections have recently been incorporated in analyses of agricultural trade (Baylis 2009; Nakuja and Kerr 2013; Grant and Anders 2011) however, little work has been done with rejection data – in particular with regards to analysis of the legitimacy of food safety regulations and the effects on trade. Border rejection data does not come without limitations, however. It only presents instances of non-compliance when trade happens. Because of this, the data will not reflect instances where compliance costs are so high that they prevent trade from occurring. Additionally, it does not reveal the number of consignments that meet regulations, nor does it show the percentage of compliant imports – restricting the researcher from observing the relative performance of the importing country. In the case of US border rejections, the FDA only inspects about 1% of all imports, limiting the extent that it can explain the compliance capacity of an exporter. FDA inspections are not random; they follow risk-based criteria and monitor countries and markets with histories of US import regulation violations through their import alert system. This risk-based criterion imposes a selection bias and does not reveal the true level of risk posed to consumers from imports (Buzby et al., 2008). Import refusals instead highlight recurring compliance and food-safety problems and the focus of the

7
FDA import alerts (Brooks et al., 2009). In consideration of its biased nature, import refusal data should be interpreted with care.
4. Political Economy Analysis of US Border Rejections of Canadian Agri-Food Exports
The aim of this study is to empirically test the hypothesis that US food safety regulations are partially driven by political factors and used as barriers to trade. US border rejections of three commodity groups of Canadian exports are used as a proxy for food safety regulations and model them against variables representing political drivers as well as legitimate risk. These variables are shown in Table 1 along with a description and their expected signs. The three commodity groups modeled are: (1) fruits, vegetables and nuts, (2) seafood, and (3) cereal products. These groups were chosen based on two features that would be expected to reveal both legitimate and illegitimate rejections: high import value from Canada into the US, as well as high numbers of rejections. Figure 3 presents the value of exports of the three commodity groups from Canada to the US and the world over the period 2002-2013. Figure 3. Major Canadian Exports to the US Versus the World from 2001-2013.
Source: United States International Trade Commission, 2013
0
5000000
10000000
15000000
20000000
25000000
30000000
35000000
40000000
45000000
Seafood Fruits, vegetables and nuts
Cereal products
1000 USD
Canada to U.S. Canada to Rest of World

8
Table 1 Variables and Hypothesized Coefficient Signs
Variable Description Expected Sign
Risk
Riskt-1 Food safety refusal t-1. Refusal associated with health risk. Positive
CanReft-1 Refusals of all Canadian products t-1. Indication of Canadian risk Positive NonCanRefkt
-1 US refusals of non-Canadian product t-1. Indication of non-Canadian product risk Positive
EURefkt-1 EU Refusals of Canadian product t-1. Indication of Canadian product risk Positive
CanVolk Controls for Canadian trade volume (in 1,000,000 kg). Positive Alertst-1 Controls for legitimate product risk Positive
Outlier Dummy variable that indicates discrete food safety hazard events for fruit, vegetables and nuts and cereals. Positive
Non-Risk Non-riskt-1 Refusal associated with labeling and technical problems Positive
CanVolkt-1 Lagged Canadian trade volume (in 1,000,000 kg). More trade would create pressure for protection. Positive
USVolkt-1 Lagged world volume of traded product (in 1,000,000 kg). Increased trade would create pressure for protection. Positive
CVADkt-1 Countervailing and Antidumping t-1 against Canadian products. Indication of explicit protection. Positive
%ΔWorld pricekt-3
Lagged change in world price by a quarter. Decrease would create protection pressure. Increase would reduce rejections. Negative
%ΔCanpricekt-3
Lagged change in Canadian price by a quarter. Decrease would create protection pressure. Increase would reduce rejections. Negative
Unempt-1 Lagged unemployment (‘000). An increase in unemployment would create political pressure for protection. Positive
GR Great recession dummy variable. Positive
Lobbymak 12-month moving average of lobby expenditure for each commodity (in $1000). An increase is expected to result in more refusals. Positive
Others Exch Exchange rate. ($C/$US) Positive Q1 First quarter Neutral Q2 Second quarter Neutral Q3 Third quarter Neutral
The potential for political influence on food safety regulation is modeled with US border rejection data, using monthly count data of commodity refusals over the years 2001-2013 as the dependent variable. Because the count data indicates over-dispersion, a negative binomial model is used. Three models are developed, one for each commodity group, with 156 observations. The variables are chosen to represent either legitimate risk to the

9
importing country, non-risk, and other reasons for rejection, with the expectation being that significant non-risk variables will suggest possible political influence. The empirical framework assumes that border rejections of agri-food commodities result from legitimate risks (legitimate rejections), as well as political economy factors (illegitimate rejections). The empirical model enables testing of hypotheses that both factors contribute to border rejections. The model is designed such that variables associated with risk capture “legitimate” rejections of agri-food commodities, while non-risk variables capture “illegitimate” rejections motivated by political economy drivers. The model is specified in Eq (1), where k is product and t is time (in months): Eq (1)
• Refkt= β0 + β1Riskkt-1+β2CanRefkt-1+β3USRefkt-1+β4EURefkt-1+β5CanVolk +β6Alertskt-1 +β7Non-riskkt-1+β8 CanVolkt-1 + β9USVolkt-1+β10 CVADkt-
1+β11%ΔWorldpricekt-3 +β12 %ΔCanpricekt-3 +β13 Unempkt-1 + β14GR + β15Lobbymak +β16Exchg + β17Outlier +β18 Q1 + β19Q2 + β20Q3 + εi
The dependent variable in the model is the US rejection of each Canadian commodity of interest. The data for the fruits, vegetables and nuts commodity group includes all fresh and frozen fruits and vegetables, and unprocessed nuts. Seafood data includes all fresh and frozen unprocessed seafood. Cereal products data includes all cereal products made of milled grains and tapioca. The US refusal data is provided by the Food and Drug Administrations’ (FDA) Operational and Administrative System for Import Support (OASIS) on the FDA website1. All trade data in this study is categorized by Harmonized System (HS) codes at the 2-digit level; however because the FDA has its own coding system for products, the FDA codes were matched with HS codes. The HS codes for the specific commodity refusals are 07 for fresh and frozen vegetables, 08 for Fruits, and Nuts, 19 for cereal and bakery products, and 03 for seafood products. Nuts are included in the fruits and vegetables model because they are included with the HS code 08, but make up a negligible portion of the commodity category.
4.1 Risk Variables The reasons for rejection of the response variable were accessed and categorized into two separate dummy variables: risk and non-risk. The risk-related reasons include adulteration such as presence of filth, salmonella, listeria or unsanitary production processes. The non-risk related reasons include issues with labeling and other technical problems that pose no immediate threat to human health. These terms have been lagged and included in the model to signify legitimate and non-legitimate product risk of the refusals. vA positive sign for the risk variable (Riskt-1) is hypothesized, since risk-related rejections are expected to give rise to further rejections. This is because once a legitimate health risk has been detected there will likely be higher vigilance in inspection.
1 http://www.accessdata.fda.gov/scripts/importrefusals/

10
It is conjectured that previous EU rejections of Canadian imports could cause US import authorities to increase inspection pressure on particular Canadian commodities, thereby increasing the probability of a refusal of that commodity by US inspectors. A lagged EU refusals variable for each imported Canadian commodity (EURefki-1) is used to capture Canadian commodity risk, acting as an indicator of potential risks associated with the respective country-product pair. Baylis et al., 2009 incorporate this variable in their analysis, finding that past EU rejections by product are positively correlated with present US rejections. The EU refusal data is obtained from the Rapid Alert System for Food and Feed (RASFF), and categorized by 2-digit HS codes. A term to capture the product risk is included. It is reasonable to assume that commodities carry varying degrees of risk, with certain commodities facing more rejections based on inherent risks. For example, there is more risk associated with importing seafood than say, bakery products. It is assumed that if the US refuses commodity imports from all other countries but Canada, there will be increased vigilance in inspections of that commodity from Canada. To control for this product risk, a lagged term for refusals of each commodity from all importing countries but Canada to the U.S is included (NonCanRefki-1). The expected sign is positive. A term is included to acknowledge the possibility that Canada may face rejections as a result of it’s national capacity to comply with food safety regulations (CanReft-1), therefore reflecting cross-commodity risk from Canada. A lagged term for all US rejections of Canadian agri-food product imports (minus the commodity of interest) is used to control for the riskiness of Canada as an agri-food trading partner. The expected sign of the coefficient is positive. The volume of each commodity (in units of 1,000,000 kg) is included in the model to control for the volume of trade from Canada (CanVolt-t). The reasoning being that as the import volume increases, so too does the probability of refusals. The expected sign of the coefficient is positive. This data was taken from the United States International Trade Commission website.2 Baylis et al., 2009 use a similar variable to control for the volume of trade, however because they look at all agri-food trading partners with the US, they use the world volume of imports. They obtain a significant but negative correlation between US refusals and world volume – contrary to the hypothesis in this study. When particular problems occur that generate risk to consumer health, the FDA issues import alerts that specify the affected products, countries and firms. The import alert system communicates to FDA field offices the need for closer examination of specific food imports from particular countries with a history of compliance issues or previous refusals. Many FDA-refused imports are a result of these import alerts placed on a particular commodity or firm (Buzby and Roberts, 2011). The assumption is that alerts trigger refusals; therefore, the model will account for this effect by including these data.
2 http://dataweb.usitc.gov/, accessed July 6th, 2013

11
The expected sign on the coefficient is positive. The alert data is available on the FDA website.3
Baylis et al., (2009) and Kerr and Nakuja (2013) include import alerts in their models, and their results both conclude that alerts generate refusals. The FDA website records import alerts by country, product and the dates that each alert was published. Each import alert shows the countries listed under the alert; and for each country affected, the associated firms and dates each firm was added to the alert. The published date that appears next to an alert on the FDA website indicates the date that it was last updated – not when the alert was put in place. This can be misleading for researchers looking for the correct start date for the alert, as most of the current alerts originated in the 1990’s, unlike what the published dates show. In addition, the descriptions used for the alerts are inconsistent, with some including a reference to the original start date and others not including this information at all. Baylis et al. (2009) model alerts as pre-existing as the vast majority of current alerts were issued before 1998. Since the FDA does not make the data for past alerts available, they include the probability that an alert was in place and then later removed (Baylis et al., 2009). They also run a second model with only the refusals of commodities with pre-existing alerts. They find a positive and significant correlation between alerts and US refusals of seafood imports.
In their model, Nakuja and Kerr (2013) use a lagged monthly count to indicate each time the alert was updated for all fruits and vegetable products. It is assumed this is to capture increased vigilance on the products affected by the alert triggered by updates. Normally an alert is updated each time a country or firm has been added to it; sometimes these are firms previously under old alerts. They find a positive and significant correlation between past alerts and US refusals of Canadian fruit and vegetable imports.
It is assumed that as signals to inspectors, not all alerts have the same weight; rather, alerts with greater numbers of firms and products will receive more surveillance attention. Thus a count variable for the monthly count of firms and products added to each alert is included (Alertst-1) with the hypothesis that the number of rejections will increase with the number of firms and products added. Also included in the count are the dates that products and firms previously under an old alert were added to the new alert with the assumption that because the firms and products have been newly added to an alert, it has been brought to the forefront of the FDA inspector’s attention.
Two sets of observations in the commodity refusal data skew the results for the fruits, vegetables and nuts model and the cereal products model. An abnormally large number of refusals of cucumbers due to pesticide residues above the US maximum residue limit (MRL) from a single set of producers occurred during August 2008. In the case of the cereals model, a similar event occurred in May 2004 due to insanitary preparation
3 http://www.accessdata.fda.gov/cms_ia/country_CA.html, accessed September 3rd, 2014).

12
conditions for cookies by a single firm. A dummy variable is used (Outlier) to identify these observations, with an expected positive coefficient.
4.2 Non-Risk Variables The model includes a lagged dummy variable for each commodity to denote non-risk reasons for rejections of the dependent variable (Non-riskt-1). This variable is intended to differentiate between justifiable risk and more elusive reasons for rejection that could be associated with political influence. The idea is that if there were illegitimate activity in import inspections, they would most likely be passed as non-risk reasons for rejections, as risk-related problems would require legitimate scientific backing. Thus, past non-risk refusals would likely encourage present non-risk refusals if they were indeed driven by illegitimate reasons. A positive coefficient is expected to indicate political influence.
A lagged term of the volume of trade of Canadian imports per commodity (CanVolkt-1), as well as a lagged term of the lagged world imports of each commodity (USVolkt-1), in units of 1,000,000 kg, is included as a non-risk variable, to denote political influence. The reasoning here is that an increase in imports could create political pressure to protect domestic producers. The hypothesized sign of this variable is positive, implying that an increase in past imports of a certain commodity is expected to result in an increase in present rejections of said commodity. Nakuja and Kerr (2013) also use a lagged value for Canadian imports of fruits and vegetables to the US, however their reasoning is different, and not related to political influence. They hypothesize that past import volume generates refusals because the pre-export screening time spent on products is reduced as the volume of production increases, thus increasing the number of products in non-compliance. Their results show that past imports do indeed generate more refusals, however the explanation is debatable.
Examples of direct protectionist efforts include antidumping and countervailing duties. The United States International Trade Commission (USITC) and the US Department of Commerce scrutinize anti-dumping and countervailing petitions based on a five-stage investigation process. Each investigation stage determines whether the product in question shows signs of dumping or subsidizing and whether a US industry is threatened by material injury or has been materially injured by the import (Carpenter, 2008). Material injury is defined as “harm which is not inconsequential, immaterial or unimportant” by the Trade Agreements Act of 1979 (Carpenter, 2008). Once an antidumping or countervailing duty is in place, it is reviewed every five years under the sunset review to be revoked if the product is found to no longer pose a threat, or to be renewed if there is evidence that the product continues to cause material harm. Baylis et al. (2009) employ a lagged dummy variable for each instance of an antidumping case filed against each product-country pair, and show that there is a positive relationship between refusals and antidumping cases. Nakuja and Kerr, (2013) include a count of total antidumping activity/cases against all fruits and vegetable products from all

13
countries per month. Although Nakuja and Kerr, (2013) investigate US protectionist effort on Canadian imports, they look at antidumping activities/cases against fruits and vegetables from all US trading partners, not just those from Canada. They argue that US antidumping activities against all countries are a better measure of protection by the US because it shows direct protectionist effort, “acting as a signal to regulatory institutions to increase protection” (Nakuja and Kerr, 2013). Their results do not show any significance behind antidumping cases explaining US refusals of Canadian fruit and vegetable imports. A monthly count of all investigations filed against each Canadian commodity is created, assuming that pressure for protection is generated once an investigation against a product is initiated (CVADt-1). Investigations filed against all trading partners are not used because of the possible diversion that could arise – meaning, US importers could import these commodities from other, less efficient countries at a lower cost than the commodities with antidumping and countervailing duties. Instead a lagged monthly count of all investigations filed against each Canadian commodity is included to capture the explicit use of protectionist measures against Canada (CVADkt-1). Investigations are used because there were no duties filed against the Canadian commodities of interest during the years of study; however protectionist efforts are still captured by including investigations. Only one observation was recorded of US antidumping investigations in the Canadian fruit, vegetable and nut category, against Canadian tomatoes. This should be taken into account when interpreting the results as it acts as a dummy variable for this single event. Furthermore, there were no investigations against Canadian cereal products over the years 2001-2013, so an antidumping/countervailing variable is not included in the cereal products model. Antidumping and countervailing data was obtained from the World Bank global countervailing and antidumping databases organized by Bown (2014), and from the United States International Trade Commission website4. The expected sign for this variable is negative, the rationale being that efforts directed towards explicit protectionist measures will reduce the need for non-tariff barriers. The model includes the lagged change in commodity prices for both Canadian (%ΔCanpricekt-3), and world imports (%ΔWorldpricekt-3). The rationale is that a change in commodity price alone should not influence refusals, thus a significant coefficient for this variable would suggest political influence. It is hypothesized that there is an inverse relationship between the change in price and product refusals. For example, a price decrease would indicate a rise in import competition, resulting in an increase in refusals. Since the variable represents the change in price of each commodity, the coefficient represents the refusal outcome with a positive change in price. A negative coefficient would indicate that an increase in the price of imports from either Canada or the world is associated with fewer refusals – suggesting the motivation of a declining threat from competition. The unit price for Canadian imports and for all world imports into the US for each commodity is the value per unit volume (in kg) of imports. This data was taken from the United States International Trade Commission website5. Because the time-series data is monthly, these terms are lagged by three months to allow sufficient time to pass 4 http://www.usitc.gov/trade_remedy/731_ad_701_cvd/investigations/active/index.htm, accessed August 6, 2014 5 http://dataweb.usitc.gov/, accessed July 20, 2013.

14
for reactions to sustained price changes, after quarterly fiscal reports. Baylis et al. (2009) use a one-month lag for the change in world price, with their results matching the hypothesis in this study; however, a longer lag time was chosen in consideration that politically-motivated refusals in response to the effect of price changes on competitiveness would be more likely to occur after sufficient time passes to observe domestic market responses. The variable is lagged by three months to denote a fiscal quarter. The volume data used in calculating the unit price was also used to control for the amount of trade. A rise in unemployment could create a cause for concern and pressure for government involvement. Thus, monthly unemployment in the agriculture sector for the fruits and vegetables model, and unemployment data in the food manufacturing sector for seafood and cereal products are included in the model (Unempt-1). Because it is assumed unemployment will bring about political pressure for protection, the expected sign on the coefficient is positive. Nakuja and Kerr (2013) use agricultural unemployment in their model, and show that increases in unemployment do indeed generate refusals. Baylis et al., (2009) use the change in employment, and obtain similar results to those of Nakuja and Kerr (2013). Unemployment data for the agricultural and food manufacturing sector was obtained from the Bureau of Labor Statistics website, and is recorded as per thousand people unemployed. The National Bureau of Economic Research records the great recession of as officially starting in December of 2007 and ending in June 20096. The great recession variable (GR) is included to capture the effect of the financial stress during this time on import refusals. Liquidity shortage and a downward shift in demand are expected to create a need for political protection by domestic producers and pressure the government to protect their own economy, so the hypothesized sign for this variable is positive. Annual lobbying data for the seafood industry, fruits and vegetable industry and cereal product industry is included to determine whether concerns about the domestic industry influence border rejections (Lobbymak). The assumption is that increased lobbying will result in more rejections, so the hypothesized coefficient sign is positive. Baylis et. al., (2009) also use lobbying expenditure, with results showing that increases in expenditure actually reduces rejections. Annual data for lobbying expenditure for each sector was taken from the Center for Responsive Politics7. Unfortunately, only annual data is available and so to overcome this each year was divided by 12, and an un-weighted moving average of this term was used to smooth out the data.
4.3 Other determinants of refusals The Canadian – US dollar exchange rate is included (Exch), because the combination of exchange rate and the price variable reveals the relative price for the change in price variable. The data for monthly exchange rate was collected from the OECD stats extracts 6 http://www.nber.org, accessed August 19th, 2014 7 https://www.opensecrets.org/lobby/, accessed January 14th 2013

15
website8, and is listed as the monthly average in US dollars. Finally, three quarter dummies are included to control for seasonality, excluding the fourth quarter. The expected signs are neutral, so there is no hypothesis associated with these variables.
5 Empirical Results: Fruits, Vegetables and Nuts, Seafood and Cereal Products
This section presents the empirical results for three commodity groups: cereal products, fruits, vegetables and nuts and seafood. Because of over-dispersion, a negative binomial Generalized Linear Model is used to estimate the count data. The negative binomial distribution uses the successes of a series of Bernoulli trials to model a discrete probability distribution. In this case, the successes are the number of refusals and the failures instances of no refusals. The non-linear nature of the model doesn’t permit standard checks for homoscedasticity and autocorrelation. The generalized linear model (GLM) is a flexible generalization of ordinary least squares regression that relates the response variable (count of refusals) to the linear model via a link function and the magnitude of the variance of each measurement to be a function of its predicted value (Dobson and Barnett 2008). A generalized linear model with a log link and negative binomial family is therefore used to check the assumptions of the model. To correct for heteroskedasticity, the GLM regressions were run using robust standard errors. Table 2 shows the estimation results of the fruits, vegetables and nuts model. Recall that the US refusals of non-Canadian product variable represents the lagged US refusals of fruits, vegetables and nuts from all trading partners except for Canada, and the EU refusals of Canadian product variable represents the lagged EU refusals of Canadian fruit, vegetable and nut imports. The results for these variables are consistent with the hypothesis. It was found that an increase in unemployment positively influences the number of refusals, which is also consistent with the hypothesis. The marginal effects for unemployment show that refusals increase by .015 when unemployment increases by 1000. These findings are consistent with that of Nakuja and Kerr (2012) and Baylis et al., (2009) who also find that declines in employment has a positive effect on import refusals. Of particular interest is the variable depicting countervailing and antidumping investigations, which is extremely significant, with a negative coefficient. The marginal effects show that with every investigation filed against Canadian fruit, vegetables and nuts, there are 3.458 fewer refusals the following month. This supports the hypothesis that increased efforts of direct protectionism reduces the need for illegitimate regulation.
8 http://stats.oecd.org/index.aspx?queryid=169, accessed June 20th, 2014

16
5.1 Model 1: Fruits, Vegetables and Nuts Table 2. GLM results for fruits, vegetables and nuts.
Variable Coefficient Robust standard error
Marginal effects
Standard error
Food safety refusal t-1 0.127 0.259 0.385 0.753 US refusals of all Canadian products t-1 0.004 0.004 0.013 0.013 US refusals of non-Canadian products t-1 0.005** 0.002 0.014** 0.005 EU refusals of Canadian product t-1 0.530* 0.228 1.672* 0.684 Canadian volume 0.003 0.005 0.009 0.016 Alerts t-1 -0.005 0.012 -0.016 0.037 Non-risk refusal t-1 0.192 0.179 0.605 0.567 Canadian volume t-1 -0.006 0.005 -0.018 0.017 US World volume t-1 -0.002 0.001 -0.005 0.003 Can countervailing and antidumping t-1 -14.045*** 1.079 -3.458*** 0.283 %Change in world price t-3 0.652 0.495 2.058 1.594 %Change in Canadian price t-3 1.077 0.940 3.401 2.975 Unemployment t-1 0.005* 0.002 0.015* 0.007 Great recession 0.561* 0.236 2.214 1.156 Moving average of lobby expenditure 0.002 0.003 0.005 0.010 Control for pesticide refusals outlier 2.968*** 0.289 57.142*** 16.608 Exchange rate ($C/$US) -0.497 1.008 -1.570 3.204 Q1 -0.165 0.382 -0.500 1.117 Q2 -0.023 0.446 -0.073 1.393 Q3 -0.097 0.350 -0.299 1.057 Constant 1.690 2.401
Marginal effects predicted mean = 3.156
No. of obs 154 Variance function
V(u) = u+(1)u^2 [Neg. Binomial]
Residual df 132 Link function g(u) = ln(u) [Log]
Scale Parameter 1 Log pseudolikelihood -366.104
Deviance 116.22 (1/df) Deviance 0.873 Pearson 117.818 (1/df) Pearson 0.885 AIC 5.027 BIC -553.693 Legend: * p<.05; ** p<.01; *** p<.001

17
Conversely, Baylis et al (2009) find that refusals increase for products-country pairs with US antidumping complaints. Nakuja and Kerr (2012) do not find any significance that antidumping and countervailing activity influence refusals of Canadian fruits and vegetables, however they use antidumping and countervailing activities against all countries as opposed to just Canada in their model. However, recall that this variable only captures one occurrence in April 2001 of a US antidumping investigation against Canadian tomatoes. The investigation was initiated during the US-Mexico tomato disputes, when US border measures against Mexican tomatoes induced a diversion effect, and a flood of Canadian tomato exports to the US aggravated producers from Texas and Florida (Baylis and Perloff, 2010). The dummy variable for the great recession captures the effects of liquidity and a downward shift in demand in the US on refusals of Canadian imports of fruits, vegetables and nuts. The results show a positive and significant coefficient of 0.561, however the marginal effects do not show a significant difference in the incremental change between months during the great recession on refusals. The positive coefficient from the GLM model however, is consistent with the hypothesis. Presumably, if lobbying efforts seeking protection for the agriculture sector were to exist, past imports of fruits, vegetables and nuts into the US would surely encourage these efforts. A separate model was estimated interacting world imports and lobbying, under the hypothesis that increased imports would raise concern for domestic producers and increase lobbying spending. However, the term had no significant effects on the model and so was omitted from this section. The overall results suggest that there may indeed be political factors behind some Canadian border rejections of fresh fruits, vegetables and nuts based on the results for unemployment, countervailing/antidumping investigations, as well as the great recession variable. The significance of the unemployment variable indicates that as unemployment in the agricultural sector raises, the number of fruit, vegetable and nut border rejections from Canada also increases. This could be due to domestic pressure for political action to protect agriculture producers from damaging competition during times of high unemployment. The countervailing/antidumping variable must not be interpreted too closely, as it represents a single instance. What can be gauged from it however is that trade remedy policies during this period of high tension may have had a strong influence on US refusals of Canadian tomatoes. The great recession variable suggests that factors such as a drop in demand and liquidity could have encouraged government to protect their own economy using food safety regulation.
18
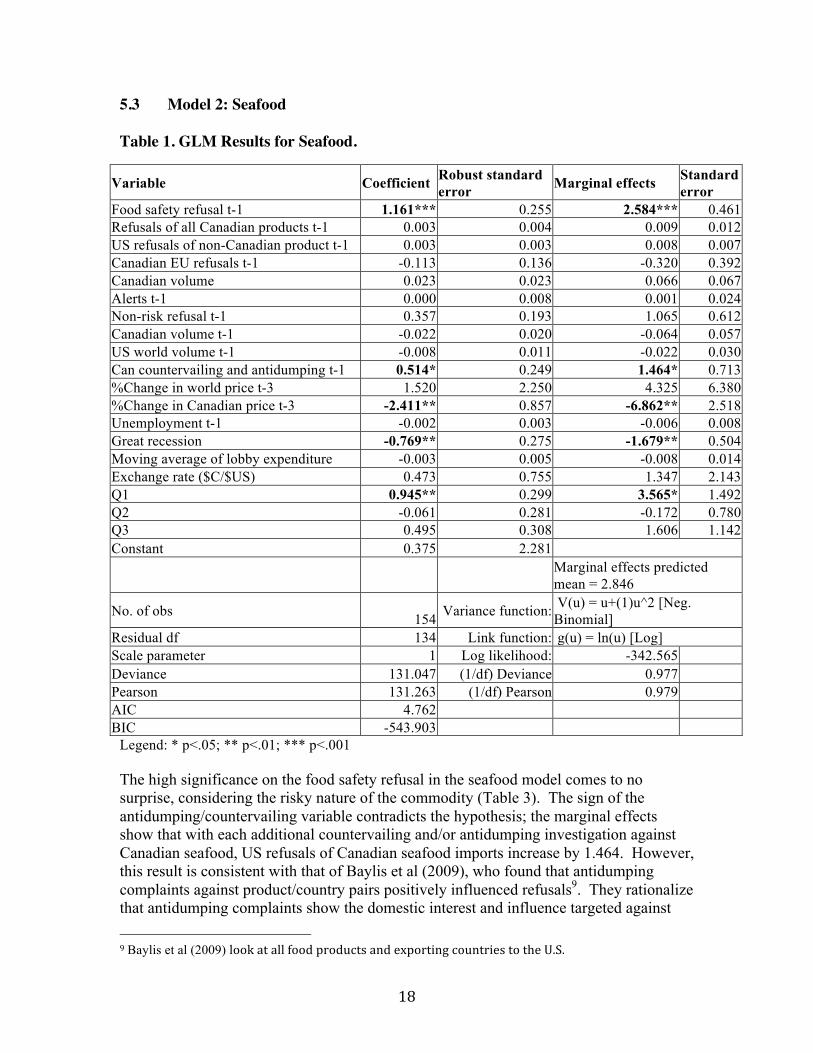
5.3 Model 2: Seafood Table 1. GLM Results for Seafood.
Variable Coefficient Robust standard error Marginal effects Standard
error Food safety refusal t-1 1.161*** 0.255 2.584*** 0.461 Refusals of all Canadian products t-1 0.003 0.004 0.009 0.012 US refusals of non-Canadian product t-1 0.003 0.003 0.008 0.007 Canadian EU refusals t-1 -0.113 0.136 -0.320 0.392 Canadian volume 0.023 0.023 0.066 0.067 Alerts t-1 0.000 0.008 0.001 0.024 Non-risk refusal t-1 0.357 0.193 1.065 0.612 Canadian volume t-1 -0.022 0.020 -0.064 0.057 US world volume t-1 -0.008 0.011 -0.022 0.030 Can countervailing and antidumping t-1 0.514* 0.249 1.464* 0.713 %Change in world price t-3 1.520 2.250 4.325 6.380 %Change in Canadian price t-3 -2.411** 0.857 -6.862** 2.518 Unemployment t-1 -0.002 0.003 -0.006 0.008 Great recession -0.769** 0.275 -1.679** 0.504 Moving average of lobby expenditure -0.003 0.005 -0.008 0.014 Exchange rate ($C/$US) 0.473 0.755 1.347 2.143 Q1 0.945** 0.299 3.565* 1.492 Q2 -0.061 0.281 -0.172 0.780 Q3 0.495 0.308 1.606 1.142 Constant 0.375 2.281
Marginal effects predicted mean = 2.846
No. of obs 154 Variance function: V(u) = u+(1)u^2 [Neg. Binomial]
Residual df 134 Link function: g(u) = ln(u) [Log] Scale parameter 1 Log likelihood: -342.565 Deviance 131.047 (1/df) Deviance 0.977 Pearson 131.263 (1/df) Pearson 0.979 AIC 4.762 BIC -543.903
Legend: * p<.05; ** p<.01; *** p<.001 The high significance on the food safety refusal in the seafood model comes to no surprise, considering the risky nature of the commodity (Table 3). The sign of the antidumping/countervailing variable contradicts the hypothesis; the marginal effects show that with each additional countervailing and/or antidumping investigation against Canadian seafood, US refusals of Canadian seafood imports increase by 1.464. However, this result is consistent with that of Baylis et al (2009), who found that antidumping complaints against product/country pairs positively influenced refusals9. They rationalize that antidumping complaints show the domestic interest and influence targeted against 9 Baylis et al (2009) look at all food products and exporting countries to the U.S.

19
imports. While one clear explanation for this result is not possible with the information available, speculations can be made that build off the results of Baylis et al., (2009). Imported seafood makes up a very large portion of seafood consumption in the US – as high as eighty percent in 2011. Moreover, although Canada is the highest single exporter of seafood to the US, only an average of sixteen percent of all imported seafood into the US came from Canada between 2002-2013. Because there is such high competition, along with an increasing trade deficit, there could be multiple and varied efforts from the seafood industry for protection. In this case, antidumping and countervailing investigations against Canadian seafood products are an indicator that there are indeed efforts to protect this industry, and the results show that additional investigations are followed by an increase in refusals. The speculations surrounding the results of the antidumping/countervailing variable can be further supported by the highly significant results of the percent change in Canadian price. It can be seen that a one percent increase in the change in price of Canadian seafood imports into the US results in 6.862 fewer refusals of Canadian seafood imports the next quarter. This result suggests that refusals are highly influenced by the price of imports. Since antidumping investigations are in response to low import prices that threaten domestic industry, and the majority of the investigations collected for the seafood model were in fact antidumping investigations, evidence that seafood prices are very influential drivers of protectionism can be seen. Although Baylis et al (2009) only lag their change in price variable by a month; they obtain a similar result, showing that increases in import price have a negative effect on seafood imports to the US. However, one difference is that this variable is significant only when they model refusals for country-product pairs with alerts in place, as opposed to using alerts as an explanatory variable – in which case they receive no significance. Also of interest is the significance of the first quarter variable, showing that the count of rejections increase by 3.565 in January, February and March. Since the volume of trade has been controlled for in the model, it is unclear what drives these refusals. It is speculated that this could be connected to one of two reasons: 1) the domestic production of seafood is highest during these months, increasing competition and encouraging domestic producers to seek protection through government intervention, or 2) the risk is higher during these months. The sign on the great recession variable shows that seafood refusals decreased during the recession, conflicting with the hypothesis. Since the volume of trade has been controlled for, one explanation could be that during the recession there were less FDA employees available for import inspections. The evidence supports the hypothesis that political influence is a potential driver of import refusals in seafood trade between Canada and the US. The price change of imports should have no effect on border rejections if rejections are based on food risk, however the results show that changes in price of Canadian seafood imports can have a significant and very large effect on border rejections. A correlation between antidumping and countervailing activities and seafood rejections from Canada is also noticed.
20
A second model is estimated, this time with an interaction effect between lagged world imports and lobbying (Table 4). Baylis et. al, 2009 use this interaction term in their study to show the effect of lobbying on refusals at times with high world imports. Unlike this study however, they do not lag the world volume variable for the interaction effect, whereas a lagged world volume variable and 12-month moving average of lobbying expenditure is used in this study. The interaction effect was also replicated with an unlagged world volume variable, with no difference in results. The results show that on their own lagged world volume of imports and lobbying are highly significant and positive. This expresses that when lobbying is held constant, a 1,000,000 kg increase in world volume of seafood from Canada results in .265 refusals. Also, when the world volume of seafood is held constant, every $1000 spent in lobbying by the seafood industry results in .215 refusals. This result should be loosely interpreted, as there are likely numerous reasons behind lobbying contributions, apart from influencing trade policy or stringency of border inspections. Otherwise, this result would suggest that a monthly increase in .265 refusals provides enough trade protection to offset the $1000 spent in collective lobbying contributions per month by the seafood industry. The statistical software used interprets the interaction term as a separate variable when calculating marginal effects, so the coefficient for the interaction term is not an accurate representation of the effect of lobbying on refusal counts when the world volume of imports is high. It can be seen, however, that the sign of the coefficient from the GLM model is negative – suggesting that as the world volume of seafood imports increases, the impact of lobbying on refusals decreases until lobbying has a negative effect on refusals. Baylis et al, 2009 obtained opposite results for this interaction effect – however their study included all agri-food products and all US trading partners. This is an interesting result that seems to suggest that after a certain amount of imports, government places more weight on the value of imports than it does lobbying contributions and protecting domestic producers. The idea of an equilibrium outcome through a political process of lobbying and trade policy set by government was introduced in Grossman and Helpman’s theoretical model in 1994 in their paper “Protection for Sale”. In their study, they model an incumbent government’s objective function as a function of lobbying contributions, as well as aggregate well being, or social welfare. The idea is that an incumbent government will attain it’s goal of re-election through maximizing their objective function and equalize consumer welfare and lobbying contributions, assuming that the government values lobbying contributions to finance campaign spending (Grossman and Helpman, 1994). In their empirical testing of the Protection for Sale model, Goldberg and Giovanni, 1999 (among other similar studies) found that government actually places a higher weight on consumer welfare. Support of this theory can be seen in the context of the seafood model. Since seafood is such a heavily imported product in the U.S, government intervention influencing domestic seafood prices would highly impact consumer welfare. Building off of this theory and the evidence from the results, it can be extrapolated that lobbying contributions from the US seafood industry does indeed affect food safety regulation on seafood imports, albeit not as much as domestic producers may want. Baylis et. al, 2009 obtain contrasting

21
results, however, and find that at times when world volume of imports is high, lobbying has a positive effect on refusals. They do, however, look at a much wider range of commodities and all trading partners with the US. It can also be noticed that when lobbying during times of high volumes of seafood imports is accounted for, the Canadian-US exchange rate has a positive and significant effect on refusals. The results show that as the Canadian dollar devalues, the US rejects 5.232 imports of Canadian seafood. Since the volume and change in price of seafood imports from Canada is accounted for, other factors associated with the exchange rate must influence these refusals
Table 2. GLM Results for Seafood with Interaction Effect
Variable Coefficient Robust standard error Marginal effects Standard
error Food safety refusal t-1 1.159*** 0.237 2.486*** 0.442 Refusals of all Canadian products t-1 0.003 0.004 0.009 0.011 US refusals of non-Canadian product t-1 0.002 0.003 0.005 0.007 Canadian EU refusals t-1 -0.107 0.140 -0.294 0.386 Canadian volume 0.012 0.022 0.034 0.061 US world volume t-1 0.096** 0.036 0.265** 0.096 Alerts-1 -0.002 0.009 -0.007 0.025 Non-risk refusal t-1 0.276 0.186 0.783 0.554 Canadian volume t-1 -0.013 0.019 -0.035 0.051 Can countervailing and antidumping t-1 0.553* 0.240 1.517* 0.666 Change in world price t-3 0.604 2.361 1.656 6.463 Change in Canadian price t-3 -2.592** 0.901 -7.109** 2.622 Unemployment t-1 0.000 0.003 0.000 0.008 Great recession -0.794** 0.257 -1.658*** 0.445 Moving average of lobby expenditure 0.078** 0.027 0.215** 0.075 Interaction lobby and world volume t-1 -0.001** 0.000 -0.002** 0.001 Exchange rate ($C/$US) 1.908* 0.859 5.232* 2.340 Q1 0.846** 0.305 2.979* 1.365 Q2 -0.017 0.299 -0.047 0.813 Q3 0.492 0.307 1.537 1.095 Constant -13.690** 4.966
Marginal effects predicted mean = 2.742
No. of obs 154 Variance function V(u) = u+(1)u^2 [Neg. Binomial]
Residual df 133 Link function g(u) = ln(u) [Log]
Scale parameter 1 Log pseudolikelihood -343.574
Deviance 124.838 (1/df) Deviance 0.938 Pearson 125.24 (1/df) Pearson 0.941 AIC 4.734 BIC -545.076 Legend: * p<.05; ** p<.01; *** p<.001

22
5.4 Model 3: Cereal products Table 3. Heteroskedasticity-Corrected GLM Results for Cereal Products.
Variable Coefficient Robust standard error Marginal effects Standard error
Food safety refusal t-1 -0.167 0.236 -0.620 0.893 Refusals of all Canadian products t-1 0.001 0.007 0.004 0.024 US refusals of non-Canadian product t-1 0.002 0.002 0.006 0.007 Canadian EU Refusals t-1 0.280* 0.111 1.025* 0.402 Canadian Volume 0.036* 0.015 0.131* 0.052 Alerts-1 0.020*** 0.005 0.073*** 0.018 Non-risk refusal t-1 0.291 0.279 1.008 0.909 Canadian Volume t-1 0.053* 0.026 0.195* 0.096 US World Volume t-1 0.036* 0.017 0.130* 0.064 Change in World Price t-3 1.658 2.212 6.064 8.126 Change in Canadian Price t-3 -3.053 3.590 -11.170 13.260 Unemployment t-1 0.000 0.004 0.001 0.015 Great Recession 0.670* 0.321 3.215 1.941 Moving average of lobby expenditure -0.011*** 0.002 -0.041*** 0.008 Outlier 3.612*** 0.326 128.758** 41.464 Exchange Rate ($C/$US) 1.935 1.051 7.080 3.772 Q1 1.308* 0.509 7.255 4.186 Q2 0.949* 0.411 4.546 2.594 Q3 0.907* 0.431 4.285 2.684 Constant -8.480* 3.727 Marginal effects predicted mean = 3.658
No. of obs 153
Variance function V(u) = u+(1)u^2 [Neg. Binomial]
Residual df 134 Link function g(u) = ln(u) [Log] Scale Parameter 1 Log pseudolikelihood -377.177 Deviance 148.467 (1/df) Deviance 1.107 Pearson 130.183 (1/df) Pearson 0.971 AIC 5.178 BIC -525.611 Legend: * p<.05; ** p<.01; *** p<.001 The results in Table 5 corresponds with the hypothesis surrounding alerts, showing that an increase in refusals of Canadian cereal products is highly significant and positively correlated with an increase of Canadian firms and cereal products added to alerts. The marginal effects show that with every product or firm added to an alert cereal product refusals increase by .073 above the mean of 3.658. This supports the idea that alerts, and

23
specifically the amount of products and firms under these alerts, create increased vigilance in import inspections, resulting in more refusals. The model also shows that US refusals of EU cereal products increase refusals of Canadian cereal products, with marginal effects of 1.025 refusals above the mean of 3.658. This could be due to an increased awareness of FDA officials on cereal product imports as a result of rejections in the EU. As expected, an increase in the volume of cereal product imports from Canada raises the probability of a rejection. Each additional 1,000,000 kilograms of cereal products imported to the US from Canada results in .131 refusals. All three quarter variables are significant at the five percent level, with the first quarter resulting in the highest amount of refusals (7.255). As for the non-risk variables, a significance level of five percent for both lagged world and Canadian imports of cereal products can be seen. The marginal effects show that with every 1,000,000 kg of cereal products imported into the US from either Canada or the world, import refusals in the next month increase by .195 and .130, respectively. This indicates that domestic producers may pressure government for protection against the increased competition when imports of cereal products into the US increase. These results are similar to those of Baylis et al (2009) who also obtain a positive and significant result for lagged world volume. Nakuja and Kerr (2013) do not capture the effect of lagged world volume on import refusals from Canada in their model. Also, it is important to keep in mind that multicollinearity has inflated the errors of these variables, meaning the significance of the results is higher than what is reported. It is interesting to note that the sign on the lobbying expenditure variable is negative, and highly significant – a similar result to the seafood model. The marginal effects show that all else remaining constant, an increase in lobbying expenditure of $1000 results in a decreased count of refusals of .041. In the seafood model, a drop in refusals could be observed when lobbying increased at times when world imports of seafood was high. In the cereal model, however, changes in import volume has no influence on the effect lobbying has on refusals. Baylis et al., (2009) obtain a similar result for lobbying expenditure when it is not interacted with past world volume. One reason for this result could be similar to the explanation from the seafood model – government places more weight on consumer welfare than on lobbying spending. The interaction variable may not be necessary to compare these results to that of the seafood model, as approximately half of all cereal product imports to the US come from Canada. The negative effect that lobbying has on cereal product refusals is, however, very small compared to that of the seafood model, which could be because seafood has such a high import penetration ratio in the US. There is little evidence to support the hypothesis that political interests drive refusals of cereal product imports from Canada. The only support of possible politically motivated misuse of regulation for protection is from the variables denoting lagged import volume of cereal products from Canada and the world – which is also supported by Baylis et al (2009), and the lobbying variable. The evidence presented by these models suggests that cereal product import rejections are driven primarily by legitimate risk. Keep in mind

24
however, that there are considerable flaws associated with the lobbying data, compromising some of its integrity.
6 Discussion
The US is Canada’s largest agri-food trading partner, accounting for about fifty percent of all agri-food exports from Canada. Therefore, it is important for the health and competitiveness of the Canadian agricultural sector, that US import rejections of Canadian agri-food products are legitimate. Not only would the loss in trade be harmful to Canadian producers, but also needless time and resources would be spent on attempting to upgrade compliance capacity in areas that may or may not require such attention. Illegitimate rejections reduce the efficiency of compliance and research efforts. Moreover, harkening back to the conceptual framework depicted in Figure 2, it can be seen that the needless compliance cost that illegitimate regulation imposes on the exporter raises prices for the importing country (the US) that translates into welfare losses, and losses in trade gains for the exporting country (Canada). Additionally, the implications of these regulations on Canadian consumers would be increased prices for these commodities – the increased costs to Canadian exporters would create an inward shift in excess supply, raising the domestic commodity prices. So, can it be concluded that the US is using regulation illegitimately?
Overall, there is evidence indicating the presence of certain political drivers behind US import refusals of Canadian agri-food exports. However, as is expected, the majority of rejected Canadian imports can be explained by legitimate food risk. It is noticed that the FDA inspection process and direction is highly influenced by past refusals, suggesting that the FDA observes the international food safety climate to direct inspection. In particular, it is shown that the FDA keeps a watchful eye on food safety issues regarding cereal products and fruit, vegetable and nut imports to the EU. Inspectors go further with Canadian fruit, vegetable and nut imports by monitoring the safety of all fruit, vegetable and nut imports into the US, which influence rejections of Canadian imports. It is also found that the more Canadian seafood imports that are rejected at the US border due to food safety-related reasons result in further food safety-related refusals. This suggests that the FDA is much more attentive to Canadian seafood imports after past incidents of health risk. In the case of cereal products, the evidence shows that the more Canadian firms and products added to an alert raise the chances of refusals. Also, increases in the volume of Canadian cereal product imports raise the probability of rejection. The most prominent evidence of political influence driving food safety regulation is from US border rejections of Canadian seafood imports. The results show that changes in the Canadian unit price of seafood imports to the US are highly influential on US border rejection of Canadian seafood. However, the possibility of other factors behind the significance of this variable should be taken into account. Various factors are likely behind the association of seafood prices and refusals, making room for alternate explanations. For example, low import prices can be related to lower quality products, which certainly increase the chance of rejection – especially for a risky commodity such

25
as seafood. Further, an alternate variable denoting domestic price could have been used in place of the unit price of imports to capture domestic activity surrounding the commodity. For example, events such as the BP oil spill back in 2009 may also play a role in the link between lower seafood prices and rejections, i.e., reduced domestic supply of seafood in the U.S., as well as reduced quality and consumer perception of seafood. Future studies might use a price ratio of both the domestic and the import price to serve as a more encompassing and informative variable. This study finds that US countervailing and antidumping investigations against seafood increase seafood refusals – a result similar to that of Baylis et al (2009). In addition, the findings suggest that lobbying expenditure from seafood industries at times where world seafood imports are high actually has a negative effect on refusals – suggesting that the government places higher value on consumer welfare as the world volume of imports increases. The results also show that at times when seafood imports into the US remain constant, $1000 in US lobbying efforts increase seafood refusals by .215. This result should be taken lightly, however, as there is no information on where the lobbying efforts are directed, or where in particular they come from. It is unlikely that the value in protective benefits of .215 refusals would be worth $1000 in profits by the domestic seafood industry. As such, it is important to look at these results as more a part of a bigger picture of political influence rather than individually. In the case of fruits, vegetables and nuts, it is found that domestic unemployment levels in the agricultural sector have some influence on US border rejections of Canadian imports. Also, US countervailing and antidumping investigations against Canadian fruit, vegetables and nuts reduce domestic industry efforts for protection through food safety regulation as seen in the large decrease in import refusals. It is important to keep in mind that this is not the only interpretation of the antidumping/countervailing variable; that other factors may contribute to the association between anti-dumping investigations and refusals. Namely, a reduction in refusals could also be attributed to the deflection of Canadian exports to another market as a result of the threat of a duty against Canada. It could also reflect increased precaution of Canadian exporters in complying with regulation to ensure the exported commodities do not face further scrutiny. Additionally, the significance of the recession variable for fruit, vegetables and nuts as well as cereal products suggests the existence of border rejection drivers associated with the recession, such as a downward shift in demand and liquidity shortage. For Canadian cereal products, higher levels of US refusals are associated with increased levels of past Canadian and world cereal imports to the US. This indicates possible domestic pressure for government protection when domestic cereal product producers face greater competition from increased imports. Similarly to the results in the seafood model, increased lobbying from US cereal product industries result in greatly reduced rejections of Canadian cereal product imports – however independent of past world cereal product imports. This result is interpreted similarly to that from the seafood model; policy makers place greater weight on consumer welfare than lobbying contributions for their own personal gain of re-election. While it is not interacted with world import volume, it is acknowledged that Canada is responsible for half of all cereal product imports in the U.S., so it can be concluded that the import volume is relatively high.

26
While Baylis et al (2009), used current FDA alerts in place since the 1990’s, a monthly count of every update to existing and new alerts was used in this study. This represents the legitimate health risks of commodities, as well as captures the degree of FDA’a focus on particular products each month. Additionally, a quarterly lag between price changes in Canadian commodity imports and possible political response was accounted for – something Baylis et al., (2009) does not do. In the study by Nakuja and Kerr (2013), a monthly count of antidumping and countervailing activities against all countries is used as opposed to against just Canada as in the study – even though their scope is also limited to Canada and the US. They do not obtain significant results, while it is shown that this variable is highly significant.
7 Conclusion
While the findings show associations between particular non-risk variables and rejections, it is safe to assume that there are several other factors afoot interacting with these variables. If a different combination of risk and non-risk variables were used, the results would be expected to change, which makes room for further research. This is not to say that the results are irrelevant, but that multiple factors are likely behind rejections so future research using new variables could help to elucidate the drivers of rejections. The results are not precise – the results show a mixture of activity driving refusals and they vary depending on the commodity. This does not come as a surprise, as illegitimate regulation is expected to have a degree of ambiguity if disguised as safety regulation. This presents a challenge in sorting out the results. The findings do, however, provide support to the existing body of literature raising eyebrows surrounding US food safety regulation. Furthermore, this strengthening of empirical evidence can buttress Canadian challenges to U.S. food safety regulation. Since the import refusal data is an aggregate account of each commodity group, protectionist activity behind individual products is not clear. Rather, it represents the bigger picture in terms of compliance capacity and political activity behind each commodity group as a whole. Since meat and poultry are not under the jurisdiction of the FDA, they were not included as a commodity of interest in this study. However, if US import refusal data for meat and poultry could be obtained, it would greatly complement this research. It would greatly improve this study if future research on this topic were to include US import refusals of meat and poultry. It is recommended that Canada closely monitors US regulation when exporting agri-food products, and to consider challenging suspicious import refusals – particularly during times where Canadian commodity prices are low. It is also recommended that the mechanisms in place in NAFTA to avoid the misuse of food safety regulation be reviewed, and if needed revised. This study concludes by speculating other possible factors associated with the complex web of US politics and trade policy. US retaliation to Canadian trade barriers could be a driver of increased rejections, or other stakeholders. Further, this study does not take into account Canadian retaliation or response to US rejections. When an import from Canada
27
is rejected at the US border, exporters have a few options: they can prove within ninety days of rejection that the product is in fact in compliance with US regulation, they can have the consignment destroyed, or they can re-export it to other markets. As Canadian agri-food trade is diversifying and growing in new markets, it is possible that Canadian exporters may be incentivized to re-export refused consignments or even shift the destination of exports from the US to new trading partners. Finally, it is difficult to disentangle the various regulations associated with refusals. Many, if not most, food safety regulations are legitimate means to consumer safety. It would be interesting to explore the legitimacy of specific food safety regulations on the commodities in this study, as well as meat and poultry, for future research. References Anders S., J. A. Caswell. 2009. Standards as Barriers versus Standards as Catalysts:
Assessing the Impact of HACCP Implementation on US Seafood Imports. American Journal of Agricultural Economics 91(2): 310-321.
Baylis, K., A. Martens and L. Nogueira. 2009. What Drives Import Refusals?
American Journal of Agricultural Economics 91 (5): 1477-1483 Baylis, K. and J. Perloff, 2010. Trade Diversion From Tomato Suspension Agreements.
The Canadian Journal of Economics/Revue Canadienne d’Economique, 43(1):127-151.
Baylis, K., L. Nogueira, and K. Pace. 2011. Food Import Refusals: Evidence
From The European Union. American Journal of Agricultural Economics 93 (2): 566-572.
Bown, Chad P. 2014. Global Antidumping Database. The World Bank, June. http://econ.worldbank.org/ttbd/gad/ (accessed September 10th, 2014).
Bown, Chad P. 2014. Global Countervailing Duties Database. The World Bank, June.
http://econ.worldbank.org/ttbd/gcvd/ (accessed September 10th, 2014).
Buzby, J.C., D. Roberts. 2011. Food Trade And Food Safety Violations: What Can We Learn From Import Refusal Data? American Journal of Agricultural Economics 93(2): 560–565.
Buzby, J. C., L. Unnevehr, and D. Roberts. 2008. Food Safety and Imports; An Analysis of FDA Food-Related Import Refusal Reports. Economic Information Bulletin Number 39, United States Department of Agriculture, Economic Research Service, September.
Brooks N., J. C. Buzby, A. Regmi. 2009. Globalization and Evolving Preferences Drive
US Food Import Growth. Journal of Food Distribution Research 40: 39-46.

28
Carpenter, Robert. 2008. Antidumping and Countervailing Handbook, Thirteenth Edition. United States International Trade Commission. Publication No. 4056. Washington D.C.: Office of Investigations.
Center for Responsive Politics. Lobbying Database. https://www.opensecrets.org/lobby/
(accessed January 14th 2013).
Food and Drug Administration. 2014. Overview of the FSMA Proposed Rules on Produce Safety Standards and Preventive Controls for Human Food.
http://www.fda.gov/Food/guidanceregulation/FSMA/ucm334120.htm. (accessed June 17th, 2014)
Food and Drug Administration. 2014. Import Refusal Report. http://www.accessdata.fda.gov/scripts/importrefusals/ (accessed June 15th, 2013)
Food and Drug Administration. 2014. Import Alerts for a Country/Area. http://www.accessdata.fda.gov/cms_ia/country_CA.html (accessed September 3rd, 2014)
Goldberg, P.K., and M. Giovanni. 1999. Protection for Sale: An Empirical Investigation. The American Economic Review 89(5): 1135-1155
Grant, J. and S. Anders. 2011. Trade Deflection Arising From US Import Refusals And Detentions In Fishery And Seafood Trade. American Journal of Agricultural Economics 93(2): 573–580.
Grossman, G., and E. Helpman. 1994. Protection for Sale. The American Economic Review 84 (4): 833-850.
Henson, S. and J. Caswell. 1999. Food Safety Regulation: An Overview of Contemporary Issues. Food Policy 24: 589-603
Hillman. 1978. Nontariff Agricultural Trade Barriers. University of Nebraska Press.
Jaffee, Steven, et al. 2005. Food Safety and Agricultural Health Standards: Challenges and Opportunities for Developing Country Exports. Rep. no. 31207. World Bank.
Josling, T., D. Roberts and D. Orden. 2004. Food Regulations and Trade. Washington, DC: Institute for International Economics.
Josling, T., D. Roberts and D. Orden. 1999. A framework for analyzing technical trade barriers in agricultural markets. Technical Bulletin No. 1876, Washington, DC, March.
Martínez-Zarzoso, I & Nowak-Lehmann D., Felicitas, 2004. MERCOSUR-European

29
Union Trade: How important is EU Trade Liberalisation for MERCOSUR's Exports?, Center for European, Governance and Economic Development Research Discussion Papers 30,
Nakuja, T. W.A. Kerr. 2013. Protectionism or Legitimate Regulations; What Can Trade
Partners Expect From the New US Food Safety Regime? Canadian Agricultural Trade Policy and Competitiveness Research Network Commissioned Paper 2013-04. March, 2013.
National Bureau of Economic Research. 2014. US Business Cycle Expansions and Contractions. http://www.nber.org/cycles.html (accessed August 19th, 2014)
North American Free Trade Agreement. 2013. About NAFTA. http://www.naftanow.org/about/default_en.asp (accessed October 2, 2014).
Orden, David and Eduardo Romano. 1996. “The Avocado Dispute and Other Technical Barriers to Agricultural Trade Under NAFTA.” Invited paper presented at the conference on NAFTA and Agriculture: Is the Experiment Working, San Antonio, Texas, November.
Organization For Economic Co-operation and Development StatExtracts. Monthly Monetary and Financial Statistics (MEI). http://stats.oecd.org/index.aspx?queryid=169 (accessed June 20th, 2014).
Statistica. 2014. Value of the Leading Food Importers Worldwide in 2013, By Country.
http://www.statista.com/statistics/236265/value-of-the-leading-15-global-food-importers-by-country/. (Accessed December 29th, 2014).
United States Department of Agriculture. 2014. Economic Research Service, US Food Imorts. http://www.ers.usda.gov/data-products/us-food-imports.aspx. (Accessed December 29th, 2014).
United States International Trade Commission. Trade Remedy Publications. http://www.usitc.gov/trade_remedy/731_ad_701_cvd/investigations/active/index.htm (accessed August 6, 2014).
United States International Trade Commission. DataWeb (US import/Export data) http://dataweb.usitc.gov/, accessed July 6th, 2013
World Bank. 2015. Data, GDP (Current US$)
http://data.worldbank.org/indicator/NY.GDP.MKTP.CD/countries/US?display=default (accessed April 13, 2015)
WTO. 2014. Understanding the WTO: The Agreements. http://www.wto.org/english/thewto_e/whatis_e/tif_e/agrm4_e.htm. (Accessed April 12, 2014)