Embed Size (px)
Citation preview
JOURNAL OF NATURAL RESOURCES AND DEVELOPMENT
Comparing farmer and measured assessments of soil quality in Tanzania: Do they align?
Allison C. Kelly a* and C. Leigh Anderson a
a Daniel J. Evans School of Public Policy and Governance, University of Washington, United States.
* Corresponding author: [email protected]
Journal of Natural Resources and Development 2016; 06: 55 - 65 55DOI number: 10.5027/jnrd.v6i0.06
Abstract
Received 02/06/2016 Accepted 18/07/2016Published 28/07/2016
Article history
Soil quality perceptionsYield gapSoil management adoption
Keywords
Background: There is a wide gap between actual and potential yields for many crops in Sub-Saharan Africa (SSA). Experts identify poor soil quality as a primary constraint to increased agricultural productivity. Therefore, increasing agricultural productivity by improving soil quality is seen as a viable strategy to enhance food security. Yet adoption rates of programs focused on improving soil quality have generally been lower than expected [1], [2].
Results: We explore a seldom considered factor that may limit farmers’ demand for improved soil quality, namely, whether the farmers’ self-assessment of their soil quality match the assessments of soil scientists. In this paper, using data from the Tanzania National Panel Survey (TZNPS), part of the Living Standards Measurement Study – Integrated Surveys on Agriculture (LSMS-ISA), we compare farmers’ own assessments of soil quality with scientific measurements of soil quality from the Harmonized World Soil Database (HWSD). The study found a considerable “mismatch” and most notably, that 11.5 percent of survey households that reported having “good” soil quality are measured by scientific standards to have severely limited nutrient availability.
Conclusion: Mismatches between scientific measurements and farmer assessments of soil quality may highlight a potential barrier for programs seeking to encourage farmers to adopt soil quality improvement activities.

56Journal of Natural Resources and Development 2016; 06: 55 - 65DOI number: 10.5027/jnrd.v6i0.06
• Soil quality is fundamental to maintaining and increasing agricultural productivity.
• Scientific measurements of soil quality and farmer assessments differ.
• 33% of farmers do not see a soil quality constraint where soil scientists do.
• The variance of farmer assessments is smaller at smaller spatial scales.
• Spatial variances of scientific measurements differ less than those of farmers’.
• Differing assessments may contribute to low adoption of soil improvement projects.
The concept of a “yield gap” focuses attention on discrepancies between potential agricultural yields and actual yields of a given crop in a specific farming system. Across Sub-Saharan Africa (SSA), experts have estimated that small farms producing in the maize mixed farming system i have potential yields of between 5 and 10 t ha-1 but that typical farm yields range from 1-3 t ha-1 [3]. In Tanzania, potential maize yields are estimated at 2 t ha-1 but median farmers produce only 0.66 t ha-1 based on reported harvested plot yields [4]ii. Figure 1 shows estimates of maize yield gaps in seven zones of Tanzania. An estimated 70 percent of households in Africa rely on agriculture as their primary source of income and subsistence, hence narrowing yield gaps has the potential to improve food security and reduce poverty [5].
Using panels of crop research and extension experts, a 2007 study by Gibbon and colleagues [3] ranked the relative contributions of abiotic, biotic, crop management, and socioeconomic constraints to yield gaps in several agricultural sub-systems throughout the world. The results of the expert panels concluded that low soil nitrogen, low soil fertility, and drought were the most common causes of reduced yields in the maize mixed subsystem in SSA. Combined, the soil quality constraints of low soil nitrogen and low soil fertility were
estimated to be, by far, the greatest constraints limiting agricultural production in this subsystem.
Accordingly, many non-governmental and international organizations have implemented development projects directed at improving agricultural productivity and soil quality. Project activities range from encouraging increased inorganic fertilizer use to soil conservation and composting. For example, the World Bank and the Food and Agriculture Organization (FAO) of the United Nations launched the “Soil Fertility Initiative” (SFI) in 1996, to work towards country-specific plans to address declining soil fertility in SSA [6].
Many development programs to support soil improvement, however, have not been as successful as desired. In general, many development programs report lower than expected participation rates [1]. A review of 31 empirical studies attempting to identify the factors that explain variation in farmers’ adoption of soil conservation technologies revealed a variety of hypotheses. Commonly tested variables included education level, age, farm size, and land tenure status. The review found no consensus on the relationships among the explanatory variables, and concluded that a universal explanation for adoption was unlikely [2].Introduction
Research Highlights
Figure 1: Maize Yield Gaps by Zone in Tanzania
i Gibbon et al. (2007) define the maize mixed farming system as areas where 50% of the cultivated area is devoted to maize. This farming system also typically includes substantial cultivated area of cassava, sorghum, beans, groundnut, millet, and sweet potatoes.ii Potential yields” can be defined based on theoretical yields, demonstration farm yields, or the 90th percentile of farm yields in a region. The SSA potential yield estimate from the Gibbon et al. (2007) study is a theoretical potential. The Tanzanian potential yield is based on the yield of the 90th percentile farm yield in Tanzania, as reported in the Tanzania National Panel Survey (TZNPS), part of the Living Standard Measurement Study – Integrated Survey on Agriculture (LSMS-ISA). Yields are recorded in the TZNPS based on the question “What was the quantity harvested?” Responses are converted from local units to kg.

57
A reasonable requisite for adoption of any new technology is an awareness of the problem it addresses, or at least an expectation of a net benefit from its use [7], [8], and [9]. One possible explanation for lower than expected farmer participation in soil quality improvement projects is that farmers do not perceive soil quality as a primary constraint to greater productivity, and are therefore unlikely to adopt technologies or activities to improve it.
In this paper, we explore whether disparities between expert and farmer soil quality assessments exist, and whether they are a factor underlying low adoption rates – assuming farmers have access to appropriate technologies and techniques. Using data from the Tanzania National Panel Survey (TZNPS), part of the Living Standards Measurement Study – Integrated Surveys on Agriculture (LSMS-ISA), comparisons are drawn between the farmers’ own assessments of soil quality and scientific measurements of soil quality from the Harmonized World Soil Data Base (HWSD)iii. It was found that farmers’ self-assessments of the quality of their soil generally do not correspond to expert measurements, and that there are large numbers of farmers who comparatively under-rate, or perhaps more importantly for explaining adoption, comparatively over-rate their soil quality. It is therefore hypothesized that the mismatch in soil quality assessments is driven by different standards in use by farmers and experts. While soil quality researchers may base soil quality assessments on comparisons with regional and international standards, many farmers may operate with a more limited knowledge of the comparative quality of their soil.
1.1. The Potential for Disparate Soil Quality Assessments
The few studies that compare farmers’ assessments of soil quality to assessments based on scientific measurements, including those conducted in Nepal, Ghana, and Kenya, have found that expert assessments and local farmer assessments generally align [9], (N=192 farmers); [10], (N=68 households); [11], (N=331 households). These findings, however, are based on relatively smaller-scale studies that focus on one village or district. Perhaps importantly, both the farmers and scientists were working on a common scale, drawing samples from within the same spatial extent for these comparisons. Another small-scale study conducted in Burkina Faso found that farmer soil quality assessments matched with expert assessments. Over time, however, farmers were found to report soil quality changes and degradations that were not reflected in scientific measurements [12](N=54), suggesting potentially different conceptions and standards of soil quality Disparities between expert and farmer soil quality assessments, if they exist, can arise both from different conceptions of soil quality between soil scientists and farmers, and from different standards or baselines (temporal or spatial) against which each group measures quality. Accordingly, we first summarize the literature
comparing how farmers and soil scientists conceive soil quality.
1.2. Conceptions of “Soil Quality”
Even among soil scientists, soil quality does not have a universal definition. Definitions of soil quality have evolved from a focus on yield potentials and nutrient levels to a focus on environmental quality, food safety, and human health [13] and [14]. A commonly cited definition from Doran and Parkin (1994) [15], describes soil quality as “the capacity of a soil to be functional, within the limits imposed by the ecosystem and land use, to preserve the biological productivity and environmental quality, and promote plant, animal and human health” [14]. However, this description is quite broad and open to many interpretations and measurements.
Research suggests that farmers and soil scientists rely on different parameters and indicators in assessing soil quality. In comparing farmers’ soil quality assessments to researchers’ assessments, most authors note that the concept of soil quality is subjective from either perspective and that the parameters farmers and scientists identify as important vary [16]. Researchers consider farmer indicators to be holistic and soil scientist indicators to be more reductionist, but also find that some soil scientists have made a shift towards more holistic assessments of soil quality. In general, there is more variation in the indicators farmers use, and farmers also use more indicators than soil scientists. Figure 2 shows a comparison of the indicators commonly identified by these two groups based on a review of studies comparing farmer and scientist assessments [9], [10], [11], [14], [16], and [17].
Journal of Natural Resources and Development 2016; 06: 55 - 65DOI number: 10.5027/jnrd.v6i0.06
iii Throughout this paper, we use “HWSD measurements” to refer to expert assessments of soil quality collaboratively provided by the FAO, International Institute for Applied Systems Analysis (IIASA), ISRIC-World Soil Information, Institute of Soil Science, Chinese Academy of Sciences (ISSCAS), and the Joint Research Centre of the European Commission (JRC), and “TZNPS reported” to refer to the farmer assessments of soil quality recorded in the TZNPS.
Figure 2: Comparison of Soil Science and Local Knowledge Soil Quality Indicators

58Journal of Natural Resources and Development 2016; 06: 55 - 65DOI number: 10.5027/jnrd.v6i0.06
Given their different conceptions of soil quality, there is a potential for farmers and soil scientists to differ in their evaluations of whether a plot has “good” or “bad” soil quality. Farmers’ efforts to improve soil quality may therefore fall below researchers’ or scientists’ expectations. Particularly, where farmers estimate their soil quality to be higher than a soil scientist’s assessment, they may have a lower than expected interest in participating in soil-improving activities or using fertilizer. Though any individual farmer may assess a plot’s soil quality based on yield, there is no significant correlation between soil perceptions and estimated yields [18].
Working at the national scale in Tanzania, our study uses existing data on farmer and soil scientist assessments of soil quality to determine if there is a difference between assessments. Our goal is to contribute to the standard literature featuring prices and access of inputs, outputs and knowledge, and those that also consider biophysical constraints ([2], [18] and [19]) a potentially important additional factor that mitigates demand for soil-enhancing technologies: namely, that farmers do not similarly perceive soil quality as a primary constraint.
The study analyzes the nationally-representative household survey data from the TZNPS, linking them geospatially to the HWSD measurements, to compare farmer-reported assessments of soil quality to scientific measurements derived from the HWSD. The sample and these data are further described in Sections 2.2 and 2.3. Statistical analyses for these comparisons were performed using the survey package in R (http://r-survey.r-forge.r-project.org/survey/). The results summarized in Table 3, Table 5, Table 6 and Table 7 were generated using a cross tabulation function which incorporates recommended TZNPS survey weights (svytable). Statistical differences across groups are tested using Pearson’s chi-squared statistics with Rao-Scott adjustments. A 95 percent confidence level was used to determine significance.
To explore the proposition that the resulting disparities are driven by different standards in use by farmers and soil scientists, we compare the variation in the TZNPS farmer assessments with the variation in the HWSD measurements at different spatial scales. A multilevel mixed-effects linear model is used to compare soil quality assessment variances. This analysis was performed using the lme4 package in R (http://lme4.r-forge.r-project.org/). It is expected that there will be smaller differences in variance at different spatial scales for soil scientists than for farmers, as soil scientists are able to use comparatives which are standardized at a global level whereas farmers may only have local comparatives, such as their own plots or
the plots of neighboring farmers.
2.1. HWSD Measured Soil Quality
The measured soil quality estimates used in this study are categorical data from the Harmonized World Soils Database (HWSD). The HWSD links several global databases, and standardizes soil characteristics using geographic information systems (GIS) toolsiv. Characteristics in the HWSD include: organic carbon, pH, water storage capacity, soil depth, cation exchange capacity of the soilv and the clay fraction, total exchangeable nutrients, lime and gypsum content, sodium exchange percentage, salinity, textural class and granulometry [23]. These data are represented at a one-km resolution (30-arc second grid), creating a raster database with global coveragevi. Of the global data, the authors of the HWSD consider the reliability of the data in eastern Africa to be among the highest [23].
Using this database, the International Institute for Applied Systems Analysis (IIASA) and Food and Agriculture Organization (FAO) of the United Nations, as part of their work developing world agro-ecological zones, have derived variables representing “key soil qualities” for crop production [24]. The authors selected maize as the reference crop for these variables based on its global importance and wide geographic distribution. They derive seven categorical variables based on key HWSD characteristics. As shown in Table 1, the soil quality variables are based on weighted averages of the HWSD soil characteristics listed in the right hand column of the table.
The nutrient availability variable (listed in the first row of Table 1) is used in this paper as the best representation of a “low soil fertility” constraint. The Gibbon et al. panel [1] judged low soil fertility to contribute most to yield gaps in the maize mixed production system in SSA. This variable is also a good representation of soil quality as it relates to “low-input farming”. Low-input farming systems minimize the use of off-farm resources relying instead on on-farm resources such as naturally-occurring soil nutrients [25]. The majority of the farmers in our sample are considered low-input farmers, with only 9 percent of plots reported as receiving inorganic fertilizer (see summary statistics in Table 2).
2.2. TZNPS Farmer Assessments of Soil Quality
Farmer assessments of soil quality are drawn from the TZNPS. The TZNPS is a nationally-representative household panel survey that includes information on agricultural production, consumption expenditures, and several other socio-economic characteristics. It is part of the Living Standards Measurements Study – Integrated Surveys on Agriculture, an on-going research agenda of the World Bank, which generates household panel data for seven countries
iv The HWSD stitches together existing soil maps, which are based on on-the-ground measurementsv The maximum quantity of total cations, of any class, that a soil is capable of holding, at a given pH value, it can be used as a measure of nutrient retention capacity.vi A raster format is a grid or dot matrix GIS layer type, in which each pixel contains a value for a given variable.
2. Methods and Data

59Journal of Natural Resources and Development 2016; 06: 55 - 65DOI number: 10.5027/jnrd.v6i0.06
in SSA. The agricultural questionnaire collects information about a household’s agricultural activities at the plot and crop levels. Plot details include agricultural practices, ownership status, use of organic or inorganic fertilizers, use of pesticides, and other inputs. The TZNPS includes 3,265 households within 410 enumeration areas in Tanzania that were surveyed between October 2008 and October 2009.
Our sample with complete data from this survey includes 1,744 households for which HWSD data and a response to the survey questions are available. As summarized in Table 2, female household members headed approximately one-quarter of these households. The average age of household heads was approximately 46 years with an average of 6-years of education. The average household includes five members. Households farm on average two plots during the long rainy season; approximately 30 percent of households farm only one plot during the long rainy season while 70 percent farm
more than one plot. Of these plots, approximately 83 percent were reported as owned or co-owned by households, though households held titles for only 9 percent.
Approximately 83 percent of farming households in Tanzania grow maize, though there are at least five distinct agroecological zones supporting a variety of farming systems throughout the country producing a diversity of other crops [4] and [20]. The majority of farming households are smallholders, farming less than three ha. Soils have been classified into volcanic soils, light sandy soils, soils of granite/gneiss origin, red soils, Ironstone soils, and mbuga black vertisols [20] and [21]. Estimates of soil quality vary throughout the country, but it is considered a major constraint to increased productivity in the most recent census by the Ministry of Agriculture [22].
Table 1: Measured Soil Quality Variables
Table 2: Summary Statistics for Household Characteristics
(Fisher et al., 2008)

60Journal of Natural Resources and Development 2016; 06: 55 - 65DOI number: 10.5027/jnrd.v6i0.06
As part of the TZNPS, participants were asked two specific soil quality questions:
• How do you know the quality of your soil?
Response options included: “Scientifically tested,” “Own experience,” or “Other”.
• What is the soil quality of this plot?
Response options included: “Good,” “Average,” or “Bad”
2.3. Comparison of HWSD-Measured and TZNPS-Reported Soil Quality
Both the HWSD-measured data and the TZNPS-reported data are linked to geospatial coordinates allowing these two data sources to be matched at a household scale. While the HWSD-measured data are available as a one-km resolution raster coverage dataset, the TZNPS publicly-available data include averaged coordinate locations of households, and farmer soil quality assessments taken at the plot level. These spatial incongruities require some averaging assumptions.
First, the finest available location collected by the TZNPS is at the household level. For households with multiple plots, this requires aggregating reported soil quality assessments for each plot to a single assessment for the household. Our sample contains 1,232 households with multiple plots, of which 725 households reported different soil quality assessments on different plots. Of the farmers with multiple plots, approximately 60 percent have different assessments of soil quality on their different plots. To convert the plot-level assessment of each plot to a household-level variable we first used the closest plot to each household, as it is more closely located to the geo-referenced household data and thus improves our accuracy. In cases where the household had plots of equal distances with different soil quality assessments, there is no opportunity to limit error based on geospatial considerations. In these cases, we used the largest plot’s recorded soil quality assessment, which captures the most common soil quality assessment by a given farmer. Where distance and size were equal, we used the median of the soil quality assessments and for eight households where this was not feasible we used the lowest reported soil quality.
A further challenge, as is common with publicly available geospatial survey data, is precisely matching the HWSD measured data to a specific plot. The TZNPS household locations have been averaged to protect survey respondents’ specific locations and identities. While this spatial averaging occurred after the HWSD data were merged, ensuring analysis using these data are not affected by the averaging, it limits us from linking any additional spatial data accurately. Location averaging also limits GIS analytical techniques beyond the approximate representation shown in Figure 3. As illustrated, HWSD
soil quality measurements of soil nutrient availability are similar over fairly large geographic regions. Averaged TZNPS household locations are mapped onto these HWSD measurements. For households well within common blocks of measured soil quality, incongruities between plot locations and the HWSD data are of little concern. For households near the border of changing assessment, however, particularly those near borders between “no” constraint and “severe” or “very severe” constraints, caution is necessary in interpreting our results. Due to averaged household locations, we can only estimate the number of households near the border of soil quality changes. Approximately 28 households that the HWSD reports having no or a slight constraint are within the one kilometer buffer zone of soil quality measured as having a severe constraint, based on this averaged location.
For our analysis, we first show the distribution and general statistics of the HWSD-measured soil quality variables for our sample at the household level (N=1,744). We then show the distribution and general statistics for variables collected as part of the TZNPS survey relating to farmers’ soil quality assessments and soil assessment methods.
Our comparison focuses on the nutrient availability variable of the HWSD-measured data and compares it with the soil quality assessment recorded in the TZNPS survey dataset. The HWSD uses maize as the reference crop for its variables, as it is the most commonly grown crop in Tanzania, grown by an estimated 83 percent
3. Results and Discussion
Figure 3: Map of Nutrient Availability (as derived in the HWSD)

61Journal of Natural Resources and Development 2016; 06: 55 - 65DOI number: 10.5027/jnrd.v6i0.06
of households, which makes the HWSD variables well-suited for the present analysis [4].
As shown in Figure 4, 39 percent of households in the sample are measured by the HWSD to have no or slight constraints due to nutrient availability in soils, while 52 percent are measured to have a moderate constraint and 9 percent are measured to have severely constrained soils. Figure 3 shows the spatial distribution of this soil quality variable in Tanzaniavii.
The scientific assessments are slightly less favorable than farmers’, 98 percent of whom assess soil quality based on their own experience rather than scientific testing. The lighter bars in Figure 4 summarize the responses recorded for “What is the soil quality of this plot?” aggregated to the household level. About 46 percent of farmers in the TZNPS report “Good” quality soil, while an additional 48 percent report “Average” quality soil. Less than six percent of households report having “Bad” quality soil.
Table 3 presents a cross tabulation of the TZNPS-reported soil quality assessments against the HWSD-measured nutrient availability. The dark grey corner cells in Table 3 indicate a “strong mismatch” between the HWSD-recorded and the TZNPS-reported assessments (off by 2 categories). Grey cells indicate a “mismatch”, where the assessments are off by one category. As shown, of households that report having “good” quality soil, 38.5 percent are measured as having no or slight constraints due to nutrient availability in the HWSD, and 50 percent are measured as having moderate constraints. But, 11.5 percent of households self-reported as having “good” soil quality in the TZNPS are measured in the HWSD as having a severe constraint due to soil nutrient availability.
At the other extreme, 29 percent of households that report having “bad” soil quality in the TZNPS have no constraints related to soil nutrient availability as recorded in the HWSD. This comparison suggests disparities between farmers’ assessments of soil quality and measured assessments.
We find no statistically significant difference in the percentage of households that match and do not match assessments in a comparison of households with multiple plots and households with one plot (Pearson’s χ2 (Rao & Scott adjustment) F-stat = 0.064 p-value = 0.8).
Overall in our sample, approximately 43 percent of households report soil quality assessments that match the HWSD assessment. Grouping together the “mismatch” and “strong mismatch” categories, approximately 33 percent of households report soil quality assessments in the TZNPS that are higher than the HWSD measurements and approximately 25 percent of households report lower assessments. Of particular concern for programs interested in encouraging soil quality improvement strategies are the households recorded in the HWSD as having a moderate or severe constraint that are nonetheless reported as having “good” quality in the TZNPS (cells with bold text in Table 3).
3.1. Variances in Soil Quality Assessments Across Spatial Levels
Are disparities in quality assessments driven by different comparatives in use by farmers and researchers? We hypothesize that if farmers have more limited comparatives and anchor their assessments of soil quality based on neighboring plots, that the variance in TZNPS-reported assessments will be larger at smaller spatial levels. Conversely, we expect that the variance of the HWSD measured soil quality assessment will not be different at different spatial levels, as it is based on a standard comparative held in common by soil scientists. The TZNPS is hierarchical in structure, with different spatial scales
Figure 4: Comparison of Soil Quality Assessments
vii Note: Household locations shown are modified coordinate locations, averaged household GPS coordinates by enumeration area offset between 0 and 10 km depending on sample area density.
Table 3: Cross Tabulation: TZNPS Reported and HWSD Measured
Pearson’s χ2 (Rao & Scott adjustment) F-stat = 2.82 p-value = 0.06 Strong Mismatch (off by 2 categories);
(off by 1 category); MismatchBold text indicates households of particular concern for programs interested in en-couraging soil quality improvement strategies.
62Journal of Natural Resources and Development 2016; 06: 55 - 65DOI number: 10.5027/jnrd.v6i0.06
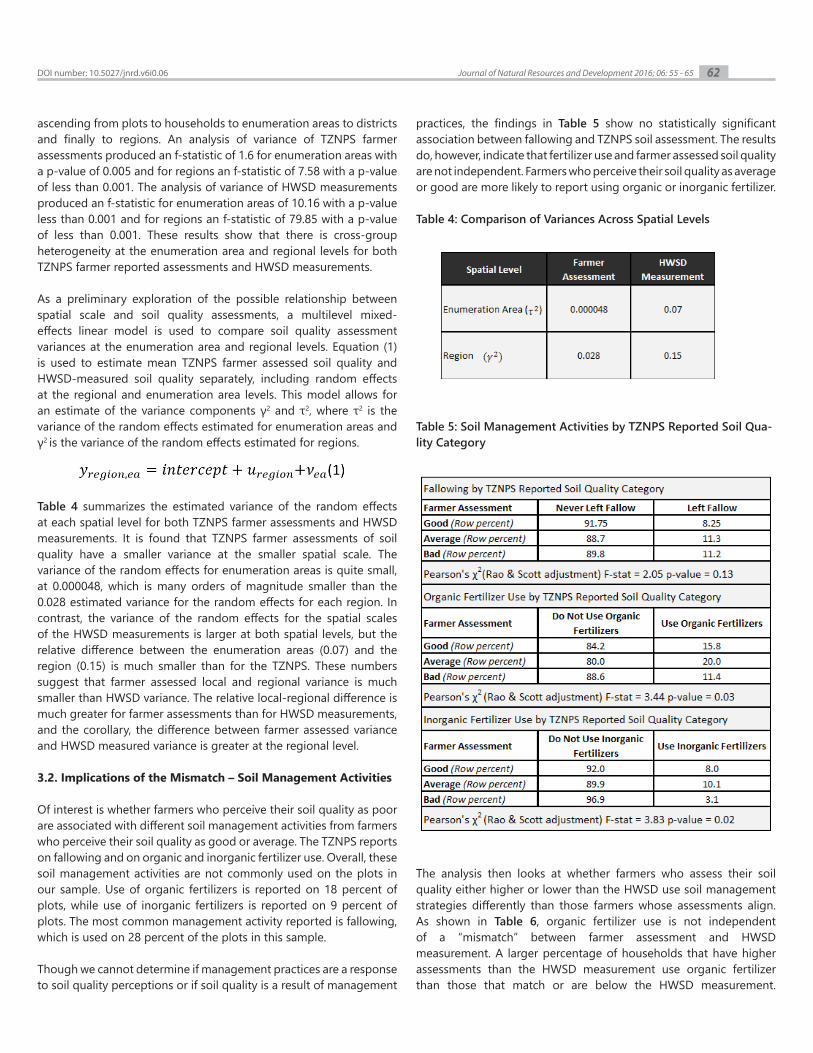
ascending from plots to households to enumeration areas to districts and finally to regions. An analysis of variance of TZNPS farmer assessments produced an f-statistic of 1.6 for enumeration areas with a p-value of 0.005 and for regions an f-statistic of 7.58 with a p-value of less than 0.001. The analysis of variance of HWSD measurements produced an f-statistic for enumeration areas of 10.16 with a p-value less than 0.001 and for regions an f-statistic of 79.85 with a p-value of less than 0.001. These results show that there is cross-group heterogeneity at the enumeration area and regional levels for both TZNPS farmer reported assessments and HWSD measurements.
As a preliminary exploration of the possible relationship between spatial scale and soil quality assessments, a multilevel mixed-effects linear model is used to compare soil quality assessment variances at the enumeration area and regional levels. Equation (1) is used to estimate mean TZNPS farmer assessed soil quality and HWSD-measured soil quality separately, including random effects at the regional and enumeration area levels. This model allows for an estimate of the variance components γ2 and τ2, where τ2 is the variance of the random effects estimated for enumeration areas and γ2 is the variance of the random effects estimated for regions.
Table 4 summarizes the estimated variance of the random effects at each spatial level for both TZNPS farmer assessments and HWSD measurements. It is found that TZNPS farmer assessments of soil quality have a smaller variance at the smaller spatial scale. The variance of the random effects for enumeration areas is quite small, at 0.000048, which is many orders of magnitude smaller than the 0.028 estimated variance for the random effects for each region. In contrast, the variance of the random effects for the spatial scales of the HWSD measurements is larger at both spatial levels, but the relative difference between the enumeration areas (0.07) and the region (0.15) is much smaller than for the TZNPS. These numbers suggest that farmer assessed local and regional variance is much smaller than HWSD variance. The relative local-regional difference is much greater for farmer assessments than for HWSD measurements, and the corollary, the difference between farmer assessed variance and HWSD measured variance is greater at the regional level.
3.2. Implications of the Mismatch – Soil Management Activities
Of interest is whether farmers who perceive their soil quality as poor are associated with different soil management activities from farmers who perceive their soil quality as good or average. The TZNPS reports on fallowing and on organic and inorganic fertilizer use. Overall, these soil management activities are not commonly used on the plots in our sample. Use of organic fertilizers is reported on 18 percent of plots, while use of inorganic fertilizers is reported on 9 percent of plots. The most common management activity reported is fallowing, which is used on 28 percent of the plots in this sample.
Though we cannot determine if management practices are a response to soil quality perceptions or if soil quality is a result of management
practices, the findings in Table 5 show no statistically significant association between fallowing and TZNPS soil assessment. The results do, however, indicate that fertilizer use and farmer assessed soil quality are not independent. Farmers who perceive their soil quality as average or good are more likely to report using organic or inorganic fertilizer.
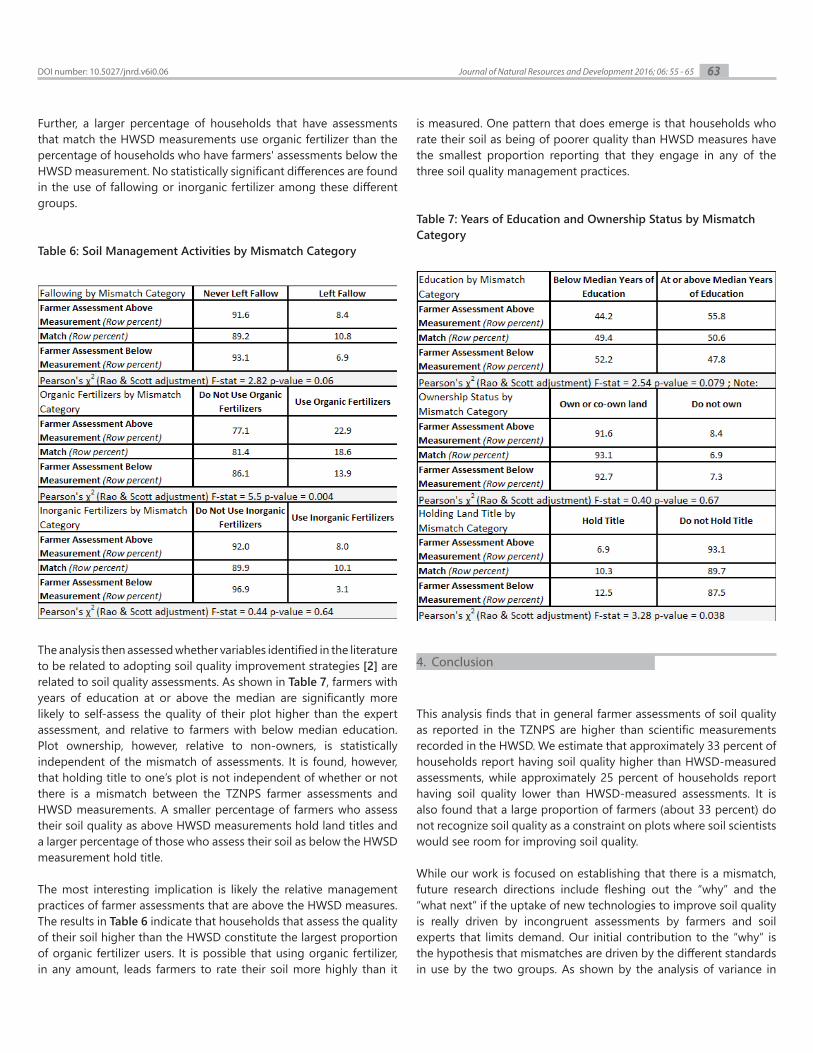
The analysis then looks at whether farmers who assess their soil quality either higher or lower than the HWSD use soil management strategies differently than those farmers whose assessments align. As shown in Table 6, organic fertilizer use is not independent of a “mismatch” between farmer assessment and HWSD measurement. A larger percentage of households that have higher assessments than the HWSD measurement use organic fertilizer than those that match or are below the HWSD measurement.
Table 4: Comparison of Variances Across Spatial Levels
Table 5: Soil Management Activities by TZNPS Reported Soil Qua-lity Category
63Journal of Natural Resources and Development 2016; 06: 55 - 65DOI number: 10.5027/jnrd.v6i0.06
Further, a larger percentage of households that have assessments that match the HWSD measurements use organic fertilizer than the percentage of households who have farmers' assessments below the HWSD measurement. No statistically significant differences are found in the use of fallowing or inorganic fertilizer among these different groups.
The analysis then assessed whether variables identified in the literature to be related to adopting soil quality improvement strategies [2] are related to soil quality assessments. As shown in Table 7, farmers with years of education at or above the median are significantly more likely to self-assess the quality of their plot higher than the expert assessment, and relative to farmers with below median education. Plot ownership, however, relative to non-owners, is statistically independent of the mismatch of assessments. It is found, however, that holding title to one’s plot is not independent of whether or not there is a mismatch between the TZNPS farmer assessments and HWSD measurements. A smaller percentage of farmers who assess their soil quality as above HWSD measurements hold land titles and a larger percentage of those who assess their soil as below the HWSD measurement hold title.
The most interesting implication is likely the relative management practices of farmer assessments that are above the HWSD measures. The results in Table 6 indicate that households that assess the quality of their soil higher than the HWSD constitute the largest proportion of organic fertilizer users. It is possible that using organic fertilizer, in any amount, leads farmers to rate their soil more highly than it
is measured. One pattern that does emerge is that households who rate their soil as being of poorer quality than HWSD measures have the smallest proportion reporting that they engage in any of the three soil quality management practices.
This analysis finds that in general farmer assessments of soil quality as reported in the TZNPS are higher than scientific measurements recorded in the HWSD. We estimate that approximately 33 percent of households report having soil quality higher than HWSD-measured assessments, while approximately 25 percent of households report having soil quality lower than HWSD-measured assessments. It is also found that a large proportion of farmers (about 33 percent) do not recognize soil quality as a constraint on plots where soil scientists would see room for improving soil quality.
While our work is focused on establishing that there is a mismatch, future research directions include fleshing out the “why” and the “what next” if the uptake of new technologies to improve soil quality is really driven by incongruent assessments by farmers and soil experts that limits demand. Our initial contribution to the “why” is the hypothesis that mismatches are driven by the different standards in use by the two groups. As shown by the analysis of variance in
Table 6: Soil Management Activities by Mismatch Category
Table 7: Years of Education and Ownership Status by Mismatch Category
4. Conclusion

64Journal of Natural Resources and Development 2016; 06: 55 - 65DOI number: 10.5027/jnrd.v6i0.06
this article, there is evidence of heterogeneity in the different spatial levels on soil quality assessments, potentially indicating that farmers may be more likely to anchor their assessments of soil quality based on the relative quality of their different plots, or by comparisons to surrounding plots.
The “what next” relies on establishing that management practices are related to reported soil quality assessments, and if so, working to align farmer and scientific assessments. As noted as early as the 1980s, there is often large potential for miscommunication between development professionals and the farmers they work with [26]. Local participatory methods and ethnopedology (the study of local knowledge) may allow agricultural scientists to fill holes in the scientific data and better connect the supply of good technological and management practices to local demand [14].
The authors thank the Bill and Melinda Gates Foundation and the Marc Lindenberg Center at the Daniel J. Evans School of Public Affairs for helping to support this work. The findings and conclusions presented here are those of the authors and do not necessarily reflect positions or policies of the foundation.
[1] P. K. Rono and A. A. Aboud, “The role of popular participation and community work ethic in rural development: the case of Nandi District, Kenya,” J. Soc. Dev. Afr., vol. 18, no. 2, pp. 77–103, Mar. 2003. DOI: http://dx.doi.org/10.4314/jsda.v18i2.23827
[2] D. Knowler and B. Bradshaw, “Farmers’ adoption of conservation agriculture: A review and synthesis of recent research,” Food Policy, vol. 32, no. 1, pp. 25–48, Feb. 2007. DOI: http://dx.doi.org/10.1016/j.foodpol.2006.01.003
[3] D. Gibbon, J. Dixon, and D. Flores, “Beyond Drought Tolerant Maize: Study of Additional Priorities in Maize Report to Generation Challenge Program,” 2007. Available: http://libcatalog.cimmyt.org/download/cim/95403.pdf
[4] L. Anderson, K. Derksen-schrock, M. K. Gugerty, K. Stahley, and E. Slakie, “Tanzania National Panel Survey LSMS-ISA : Maize,” no. 187, 2012.
[5] S. Haggblade, P. B. R. Hazell, and E. Gabre-Madhin, “Challenges for African Agriculture,” in Successes in African agriculture: Lessons for the future, S. Haggblade and P. B. R. Hazell, Eds. Baltimore, M.D.: Published for the International Food Policy Research Institute (IFPRI) by Johns Hopkins University Press, 2010, pp. 3–25. DOI: http://dx.doi.org/10.1007/s10460-014-9478-6
[6] FAO, “Soil and nutrient management in sub-Saharan Africa in support of the soil fertility initiative,” in Proceedings of the Expert Consultation, 1999, p. 376. Available: ftp://ftp.fao.org/agl/agll/docs/misc31.pdf
[7] B. W. Gould, W. E. Saupe, and R. M. Klemme, “Conservation Tillage: The Role of Farm and Operator Characteristics and the Perception of Soil Erosion,” Land Econ., vol. 65, no. 2, pp. 167–182, 1989. DOI: http://dx.doi.org/10.2307/3146791
[8] N. Traore, R. Landry, and N. Amara, “On-farm Adoption of Conservation Practices: The Role of Farm and Farmer Characteristics, Perceptions, and Health Hazards,” Land
Econ., vol. 74, no. 1, pp. 114–127, 1991. DOI: http://dx.doi.org/10.2307/3147217[9] M. Odendo, G. Obare, and B. Salasya, “Farmers’ perceptions and knowledge of soil
fertility degradation in two contrasting sites in western Kenya,” L. Degrad. Dev., vol. 21, no. 6, pp. 557–564, Nov. 2010. DOI: http://dx.doi.org/10.1002/ldr.996
[10] E. K. Dawoe, J. Quashie-Sam, M. E. Isaac, and S. K. Oppong, “Exploring farmers’ local knowledge and perceptions of soil fertility and management in the Ashanti Region of Ghana,” Geoderma, vol. 179–180, pp. 96–103, Jun. 2012. DOI: http://dx.doi.org/10.1016/j.geoderma.2012.02.015
[11] A. Desbiez, R. Matthews, B. Tripathi, and J. Ellis-Jones, “Perceptions and assessment of soil fertility by farmers in the mid-hills of Nepal,” Agric. Ecosyst. Environ., vol. 103, no. 1, pp. 191–206, Jun. 2004. DOI: http://dx.doi.org/10.1016/j.agee.2003.10.003
[12] L. C. Gray and P. Morant, “Reconciling indigenous knowledge with scientific assessment of soil fertility changes in southwestern Burkina Faso,” Geoderma, vol. 111, no. 3–4, pp. 425–437, Feb. 2003. DOI: http://dx.doi.org/10.1016/s0016-7061(02)00275-6
[13] D. L. Karlen, C. a. Ditzler, and S. S. Andrews, “Soil quality: why and how?,” Geoderma, vol. 114, no. 3–4, pp. 145–156, Jun. 2003. DOI: http://dx.doi.org/10.1016/s0016-7061(03)00039-9
[14] E. Barrios, R. J. Delve, M. Bekunda, J. Mowo, J. Agunda, J. Ramisch, M. T. Trejo, and R. J. Thomas, “Indicators of soil quality: A South–South development of a methodological guide for linking local and technical knowledge,” Geoderma, vol. 135, pp. 248–259, Nov. 2006. DOI: http://dx.doi.org/10.1016/j.geoderma.2005.12.007
[15] J. W. Doran and T. B. Parkin, “Defining and Assessing Soil Quality,” in Defining soil quality for sustainable environment, 1994, pp. 3–22. DOI: http://dx.doi.org/10.2136/sssaspecpub35.c1
[16] A. C. R. Lima, W. B. Hoogmoed, L. Brussaard, and F. Sacco dos Anjos, “Farmers’ assessment of soil quality in rice production systems,” NJAS - Wageningen J. Life Sci., vol. 58, no. 1–2, pp. 31–38, Jun. 2011. DOI: http://dx.doi.org/10.1016/j.njas.2010.08.002
[17] M. Van Dang, “Quantitative and qualitative soil quality assessments of tea enterprises in Northern Vietnam,” African J. Agric. Res., vol. 2, no. September, pp. 455–462, 2007. Available: http://www.academicjournals.org/journal/AJAR/article-abstract/7DCB8C133769
[18] J. Berazneva, L. Mcbride, M. Sheahan, and G. David, “Perceived , measured , and estimated soil fertility in east Africa : Implications for farmers and researchers,” in Paper prepared for presentation at the 2016 Agricultural & Applied Economics Association Annual Meeting, 2016, p. 39. Available: http://ageconsearch.umn.edu/bitstream/235466/2/Berazneva-etal-2016_AAEA.pdf
[19] A. Ekbom and T. Sterner, “Production Function Analysis of Soil Properties and Soil Conservation Investments in Tropical Agriculture,” EfD DP 08-20, 2008. Available: http://www.rff.org/files/sharepoint/WorkImages/Download/EfD-DP-08-20.pdf
[20] J. Makoi, “Global Yield Gap Atlas - Tanzania,” Global Yield Gap and Water Productivity Atlas. [Online]. [Accessed: 08-Jul-2016]. Available: http://www.yieldgap.org/tanzania.
[21] National Soil Service, “Rainfed Crop Suitability For Tanzania Mlingano,” Tanga, Tanzania, 2006.
[22] United Republic of Tanzania, “National Sample Census of Agriculture 2007/2008. Volume II: Crop Sector - National Report,” 2012. Available: http://www.kilimo.go.tz/publications/english%20docs/Crops%20National%20Report%20(2008).pdf
[23] FAO/IIASA/ISRIC/ISS-CAS/JRC, “Harmonized World Soil Database Version 1.1,” Rome, Italy and Laxenburg, Austria, 2009. Available: http://webarchive.iiasa.ac.at/Research/LUC/External-World-soil-database/HWSD_Documentation.pdf
[24] G. Fischer, F. Nachtergaele, S. Prieler, H. T. van Velthuizen, L. Verelst, D. Wiberg,
5. Acknowledgements
6. References

65Journal of Natural Resources and Development 2016; 06: 55 - 65DOI number: 10.5027/jnrd.v6i0.06
and D. W. L. Verelst, “Global Agro-ecological Zones Assessment for Agriculture,” Laxenburg, Austria and Rome, Italy, 2008. Available: http://www.fao.org/fileadmin/user_upload/gaez/docs/GAEZ_Model_Documentation.pdf
[25] C. A. Edwards, Sustainable agricultural systems. Ankeny, IA: Soil and Water
Conservation Society, 1990. ISBN: 093573421X[26] L. Chatterton and B. Chatterton, “Failures in technology transfer Are farmers
overlooked ?,” Food Policy, vol. 7, no. 2, pp. 141–155, 1982. DOI: http://dx.doi.org/10.1016/0306-9192(82)90047-1


![Hydroxyapatite of natural origin - zirconia composites ... 34 03.pdfProcessing and Applicationof Ceramics 10 [4] (2016)219–225 DOI: 10.2298/PAC1604219B Hydroxyapatite of natural](https://img.pdfslide.net/doc/110x75/5aaa956e7f8b9a9a188e6959/hydroxyapatite-of-natural-origin-zirconia-composites-34-03pdfprocessing-and.jpg)