Embed Size (px)
Citation preview
DOLE RO7 Planning Tool Performance Scorecard
(as of SEPTEMBER 2016)
G u i d i n g R a t e 8 2 %
PAPs/ Indicators 2016 Target
Accomplishment 2016Budget
Allocation
Budget Utilization
Actual % Signal Utilized % Signal
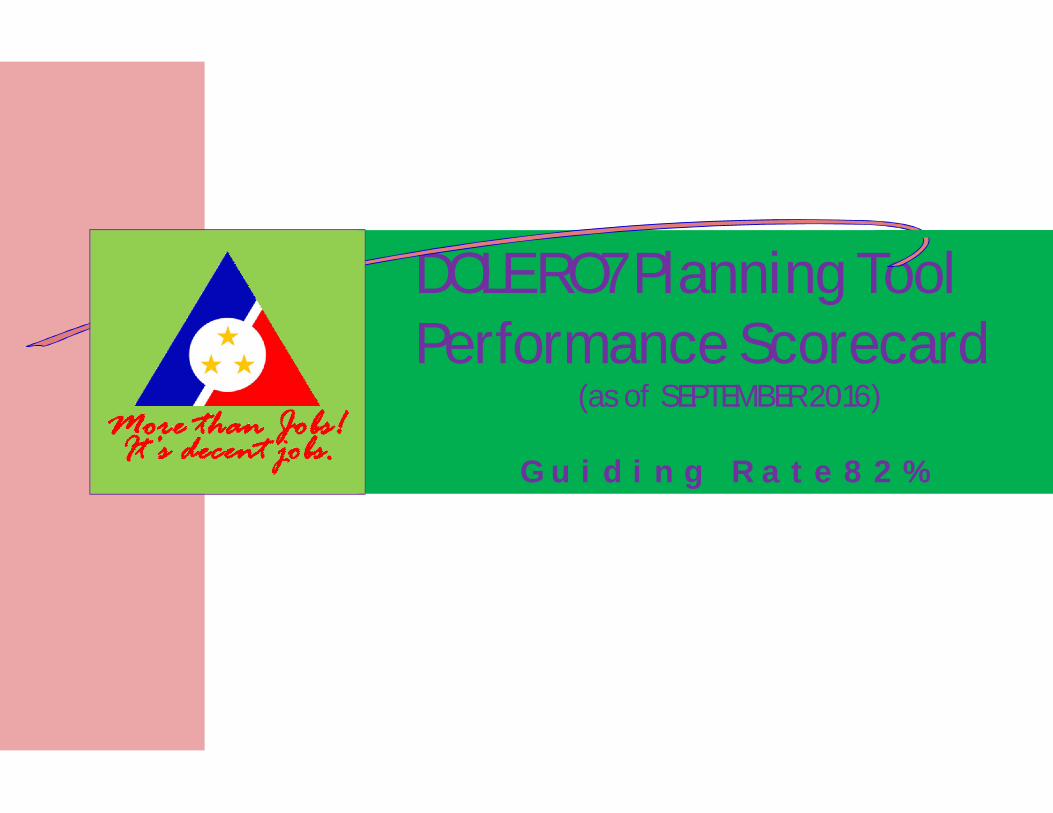
Outcome 1: Enhanced Employability of Workers and Competitiveness of EnterprisesSpecial Program for Employment of Students (SPES)
No. of youth beneficiaries
RO 7 Reformulate
d Target14,878 13,719 92.21%
W/ NIR (19,219) 13,719 71.82%
Government Internship Program (GIP)
No. of youth beneficiaries
ProposedTarget Variable/
100%2,339 100%
BLE Given target 940 2,339 248.83%
Labor Market Information (LMI)
No. of individuals reached
RO 7 180,000 170,445 94.69%
W/ NIR (235,000) 170,445 72.53%
PAPs/ Indicators 2016 Target
Accomplishment 2016Budget
Allocation
Budget Utilization
Actual % Signal Utilized % Signal
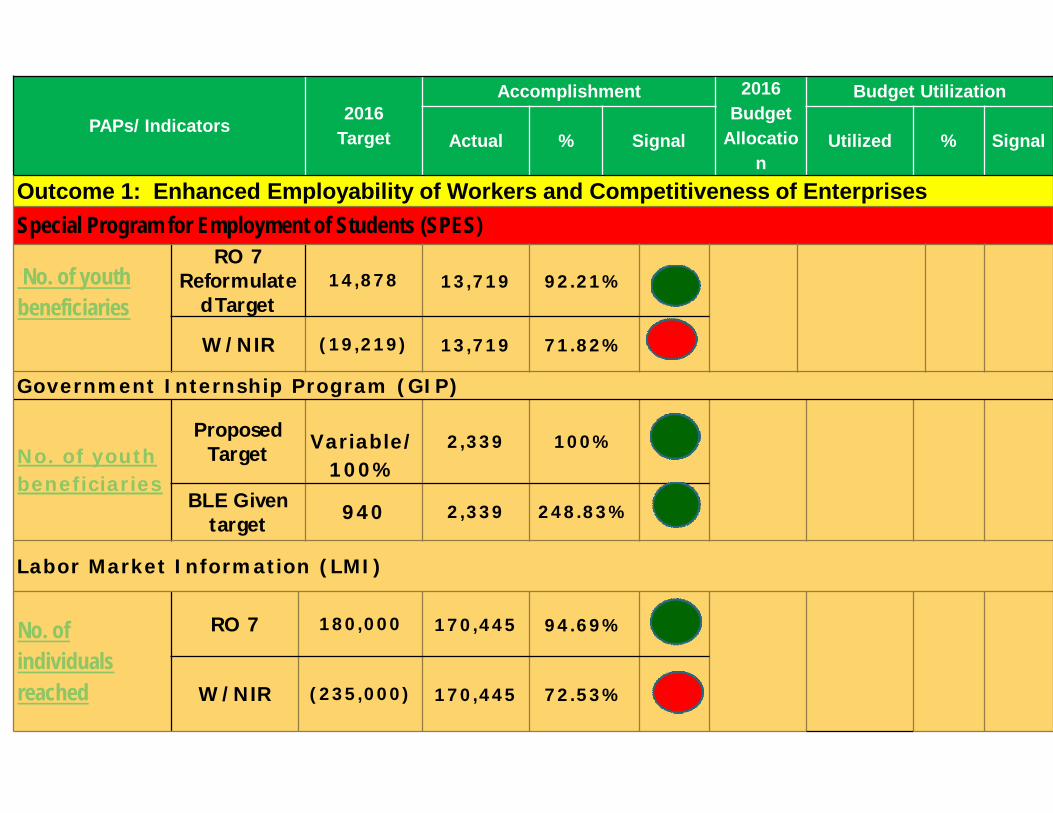
Outcome 1: Enhanced Employability of Workers and Competitiveness of EnterprisesSpecial Program for Employment of Students (SPES)Labor Market Information (LMI)
No. of institutions reached
RO 7
1,800 1,685 93.61%
W/NIR
(2,200) 1,685 76.59%
Public Employment Services
No. of qualified jobseekers referred for placement
RO 7
78,595 100,238 127.54%
W/NIR
(120,915) 100,238 82.89%
Productivity Toolbox – MSMEs Assisted ( as of May)
750 623 83.07%
PAPs/ Indicators2016
Target
Accomplishment 2016Budget
Allocation
Budget Utilization
Actual % Signal Utilized % Signal
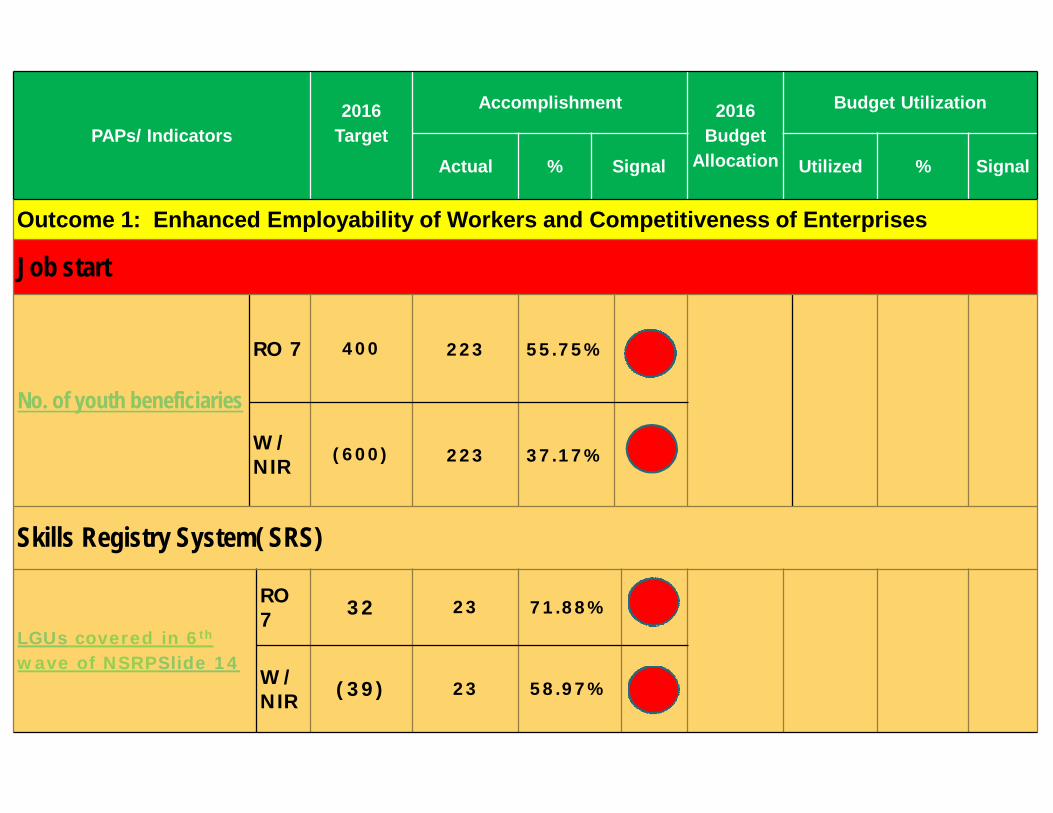
Outcome 1: Enhanced Employability of Workers and Competitiveness of Enterprises
Job start
No. of youth beneficiaries
RO 7 400 223 55.75%
W/ NIR
(600) 223 37.17%
Skills Registry System( SRS)
LGUs covered in 6th
wave of NSRPSlide 14
RO 7 32 23 71.88%
W/ NIR (39) 23 58.97%
PAPs/ Indicators2016
Target
Accomplishment2016
BudgetAllocation
Budget Utilization
Actual % Signal Utilized % Signal
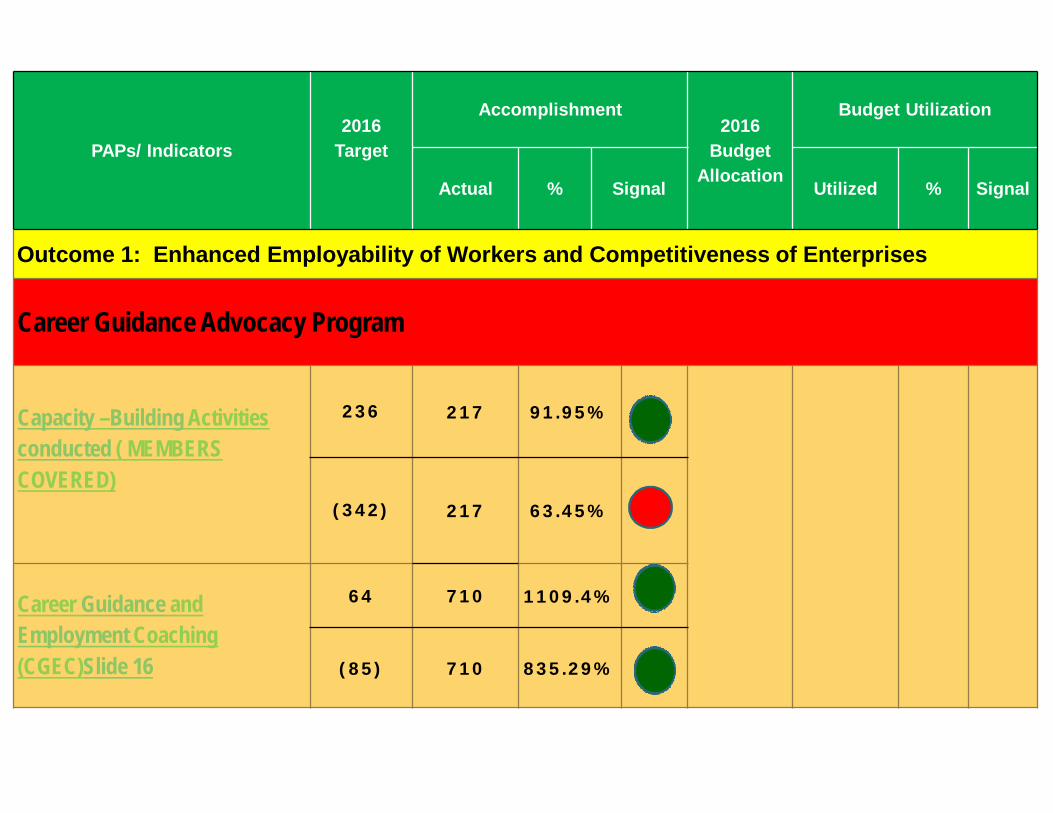
Outcome 1: Enhanced Employability of Workers and Competitiveness of Enterprises
Career Guidance Advocacy Program
Capacity –Building Activities conducted ( MEMBERSCOVERED)
236 217 91.95%
(342) 217 63.45%
Career Guidance and Employment Coaching (CGEC)Slide 16
64 710 1109.4%
(85) 710 835.29%
2016 Target
Accomplishment2016 BudgetAllocation
Budget Utilization
Actual % Signal Utilized % Signal
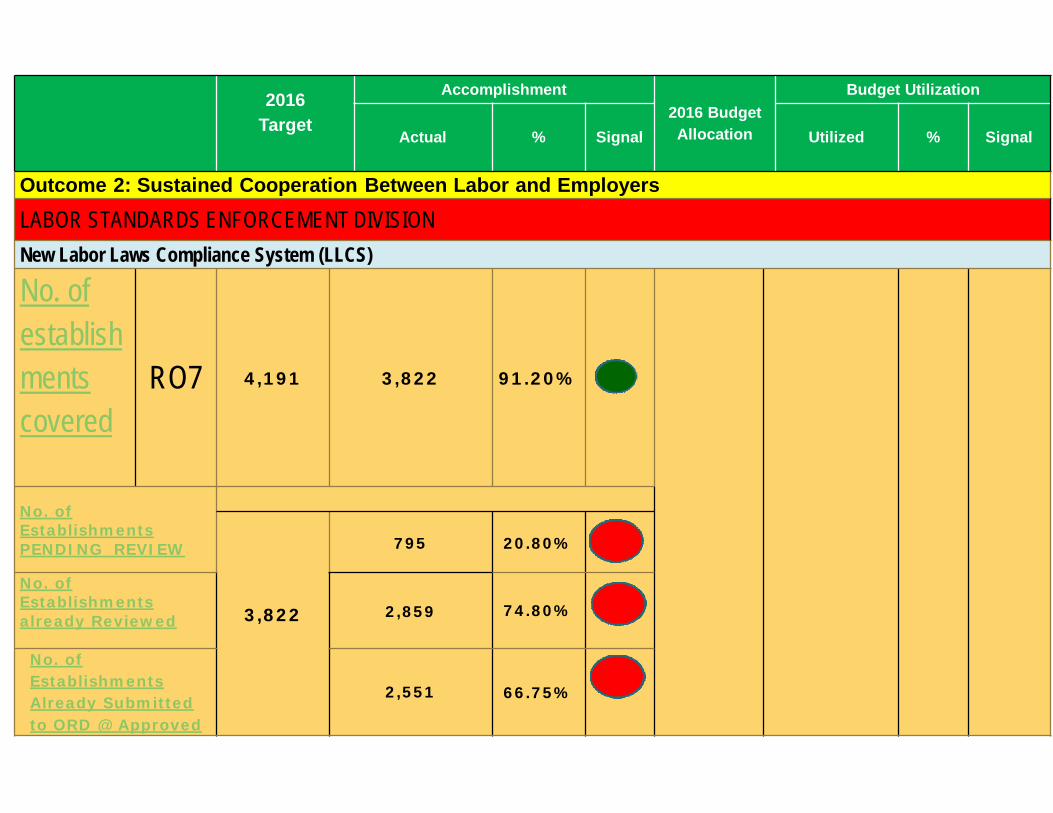
Outcome 2: Sustained Cooperation Between Labor and EmployersLABOR STANDARDS ENFORCEMENT DIVISIONNew Labor Laws Compliance System (LLCS)
No. of establishments covered
RO7 4,191 3,822 91.20%
No. of EstablishmentsPENDING REVIEW
3,822
795 20.80%
No. of Establishments already Reviewed 2,859 74.80%
No. of EstablishmentsAlready Submitted to ORD @ Approved
2,551 66.75%
PAPs/Indicators 2016 Target
Initial Compliance Rate Compliance Rates After Correction
Actual % Signal Actual % Signal
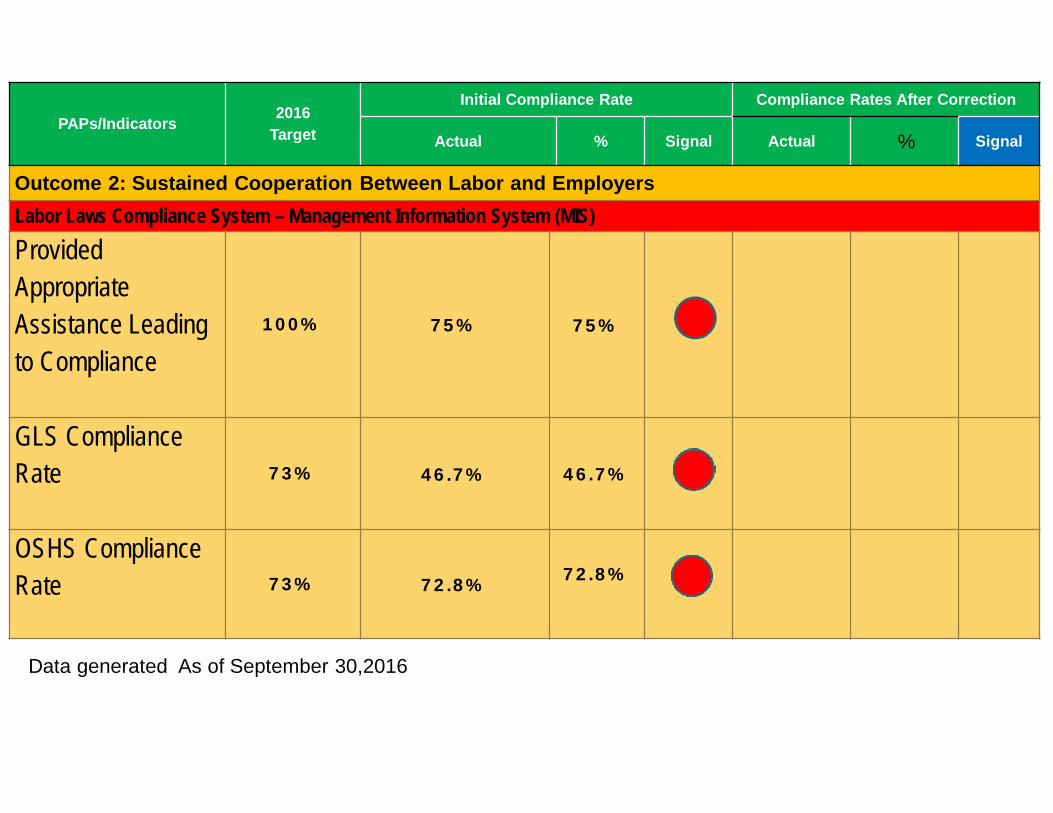
Outcome 2: Sustained Cooperation Between Labor and EmployersLabor Laws Compliance System – Management Information System (MIS)
Provided Appropriate Assistance Leadingto Compliance
100% 75% 75%
GLS ComplianceRate 73% 46.7% 46.7%
OSHS Compliance Rate 73% 72.8% 72.8%
Data generated As of September 30,2016
PAPs/ Indicators2016
Target
Accomplishment2016 Budget
Allocation
Budget Utilization
Actual % Signal Utilized % Signal
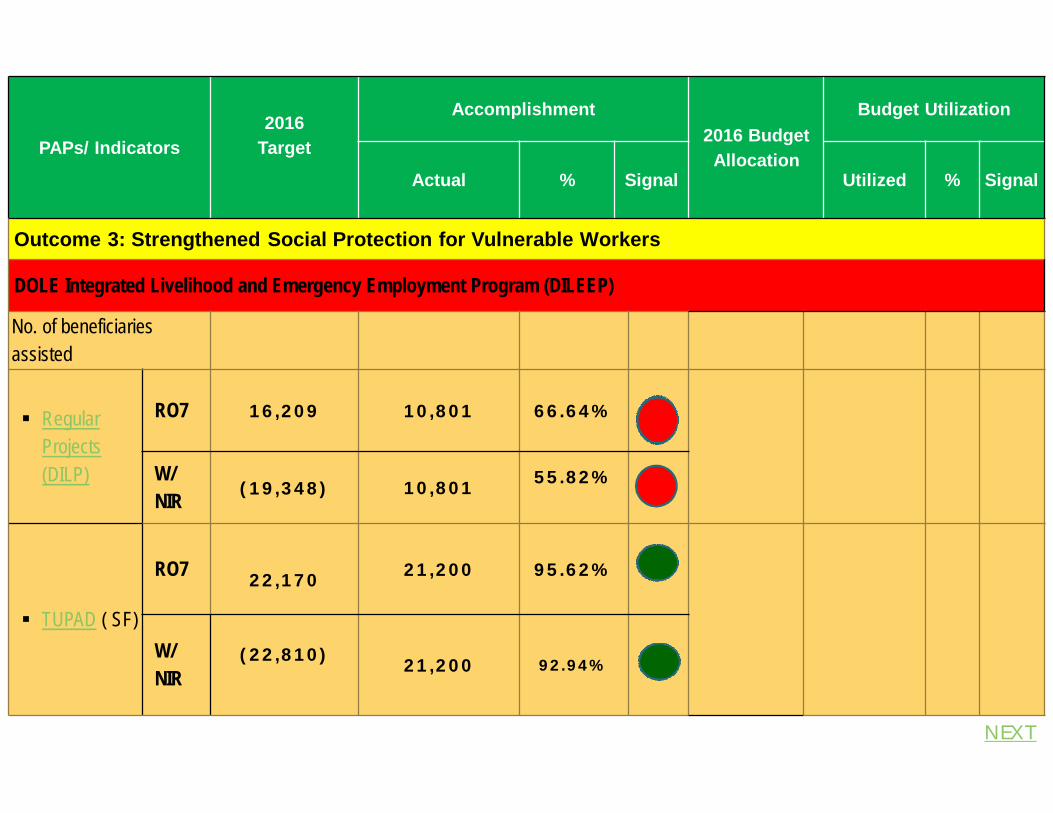
Outcome 3: Strengthened Social Protection for Vulnerable Workers
DOLE Integrated Livelihood and Emergency Employment Program (DILEEP)
No. of beneficiaries assisted
Regular Projects (DILP)
RO7 16,209 10,801 66.64%
W/ NIR (19,348) 10,801 55.82%
TUPAD ( SF)
RO7 22,170 21,200 95.62%
W/ NIR
(22,810) 21,200 92.94%
NEXT
PAPs/ Indicators2016
Target Included NOFO
Accomplishment
Actual % Signal
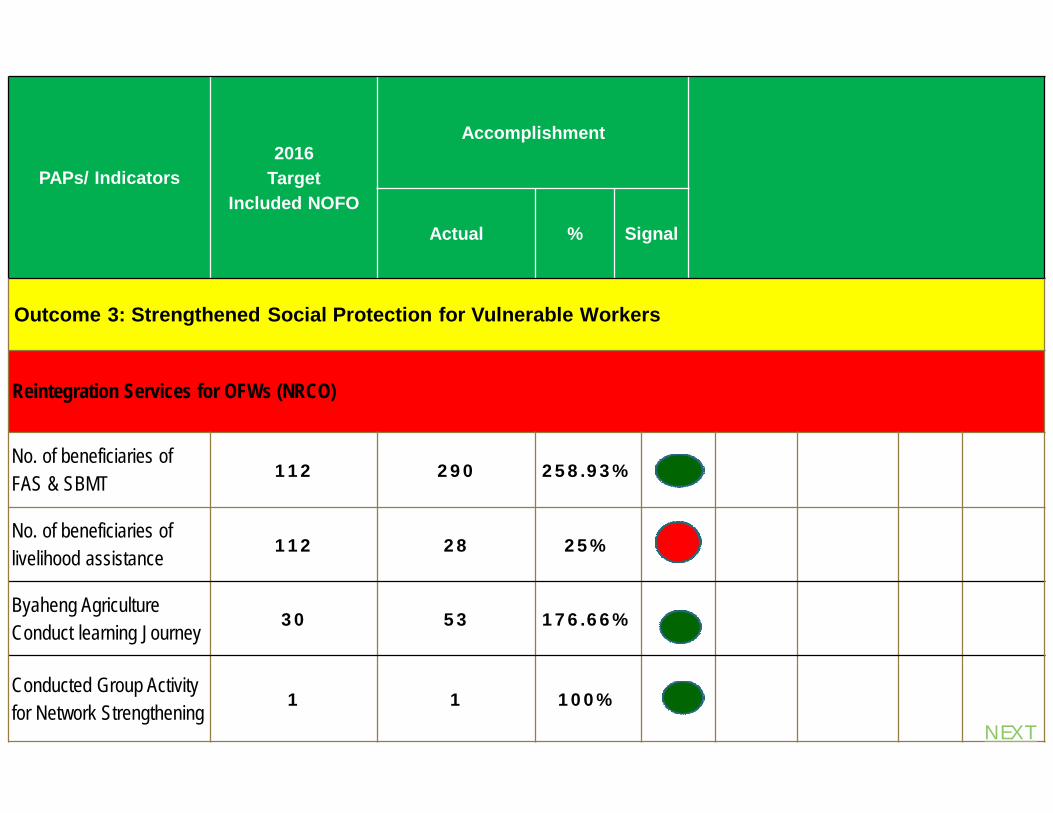
Outcome 3: Strengthened Social Protection for Vulnerable Workers
Reintegration Services for OFWs (NRCO)
No. of beneficiaries of FAS & SBMT 112 290 258.93%
No. of beneficiaries of livelihood assistance 112 28 25%
Byaheng Agriculture Conduct learning Journey
30 53 176.66%
Conducted Group Activity for Network Strengthening
1 1 100%
NEXT
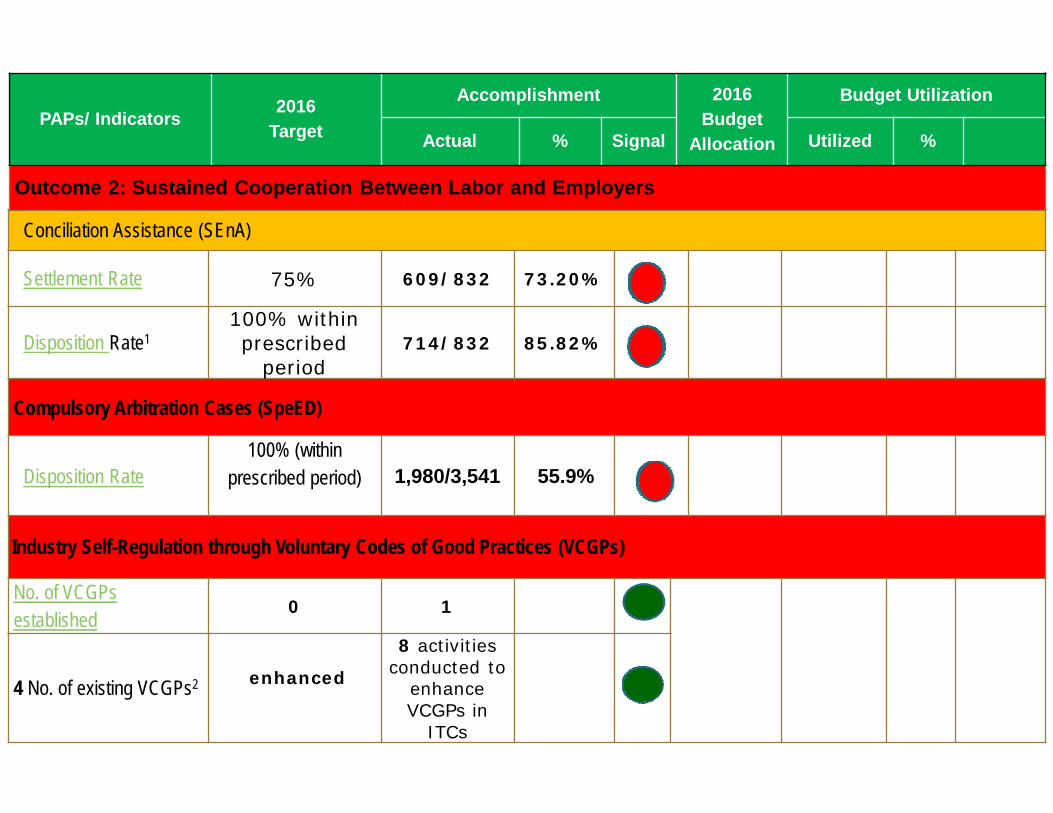
Conciliation Assistance (SEnA)
Settlement Rate 75% 609/832 73.20%
Disposition Rate1100% within prescribed
period714/832 85.82%
Compulsory Arbitration Cases (SpeED)
Disposition Rate100% (within
prescribed period) 1,980/3,541 55.9%
Industry Self-Regulation through Voluntary Codes of Good Practices (VCGPs)
No. of VCGPs established
0 1
4 No. of existing VCGPs2 enhanced
8 activities conducted to
enhanceVCGPs in
ITCs
PAPs/ Indicators 2016 Target
Accomplishment 2016Budget
Allocation
Budget Utilization
Actual % Signal Utilized %
Outcome 2: Sustained Cooperation Between Labor and Employers
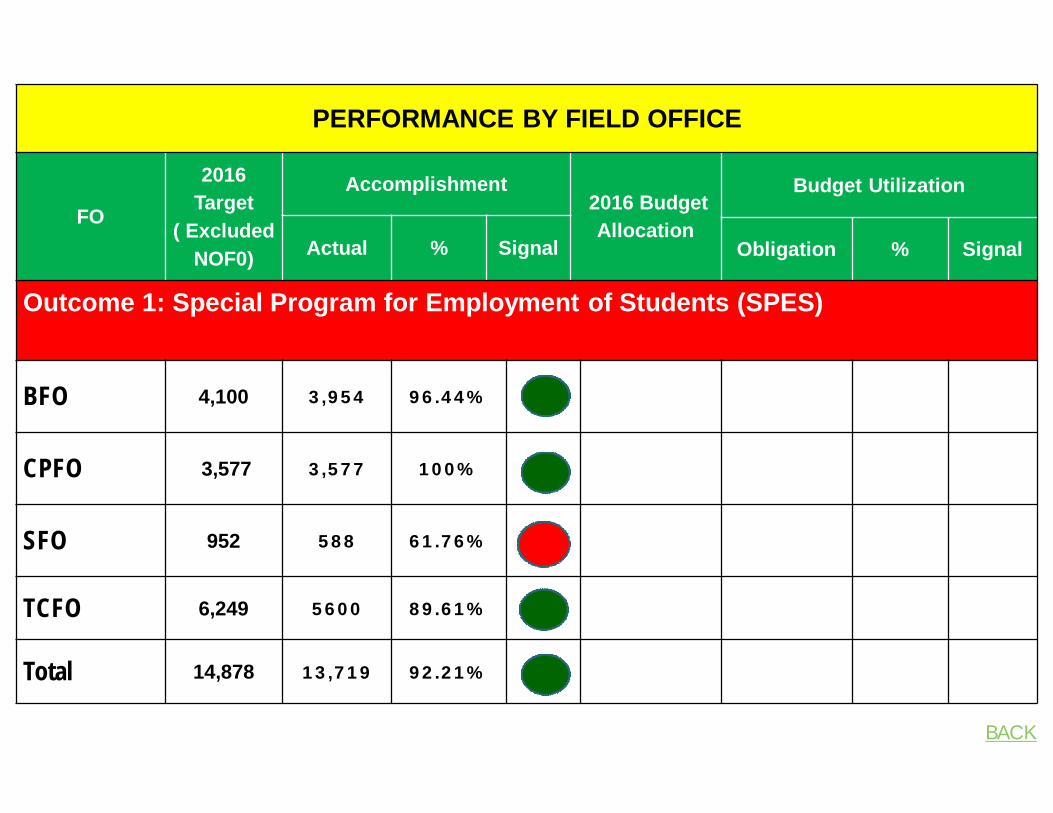
PERFORMANCE BY FIELD OFFICE
FO
2016 Target
( Excluded NOF0)
Accomplishment2016 Budget Allocation
Budget Utilization
Actual % Signal Obligation % Signal
Outcome 1: Special Program for Employment of Students (SPES)
BFO 4,100 3,954 96.44%
CPFO 3,577 3,577 100%
SFO 952 588 61.76%
TCFO 6,249 5600 89.61%
Total 14,878 13,719 92.21%
BACK
PERFORMANCE BY FIELD OFFICE
FO 2016 Target
Accomplishment 2016 Budget
Allocation
Budget Utilization
Actual % Signal Obligation % Signal
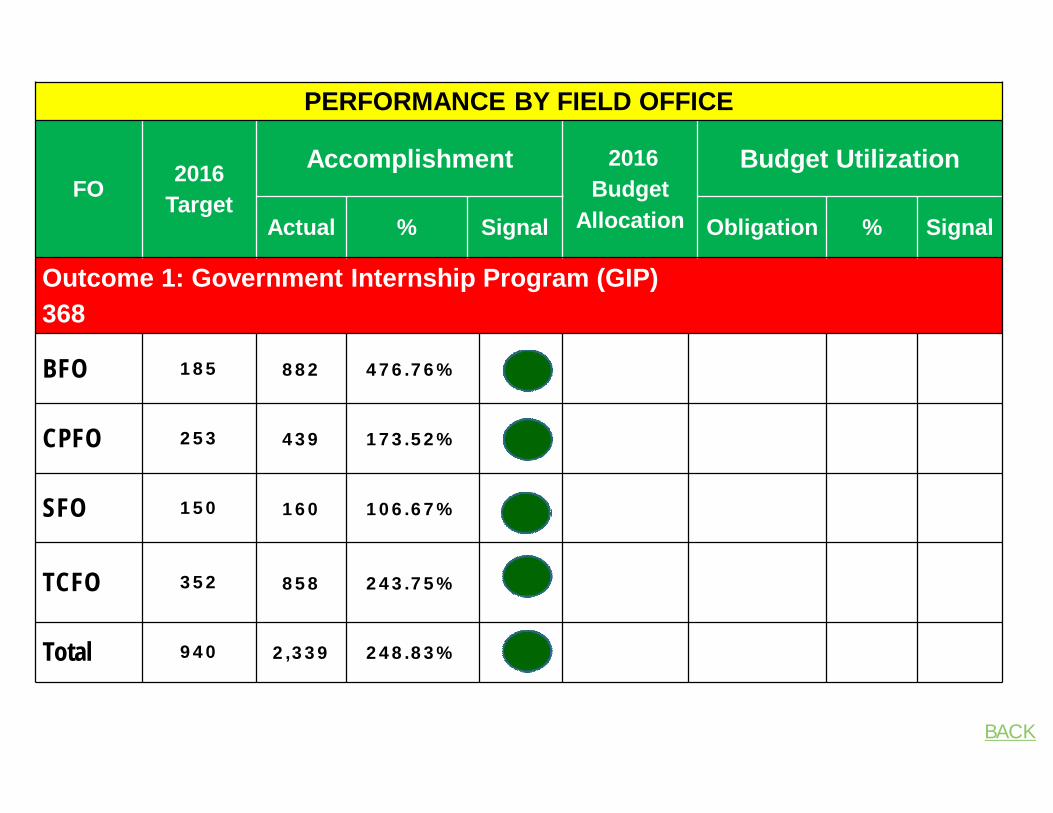
Outcome 1: Government Internship Program (GIP)368
BFO 185 882 476.76%
CPFO 253 439 173.52%
SFO 150 160 106.67%
TCFO 352 858 243.75%
Total 940 2,339 248.83%
BACK
PERFORMANCE BY FIELD OFFICE
FO
2016 Target
Excluded NOFO
Accomplishment 2016 Budget
Allocation
Budget Utilization
Actual % Signal Obligation % Signal
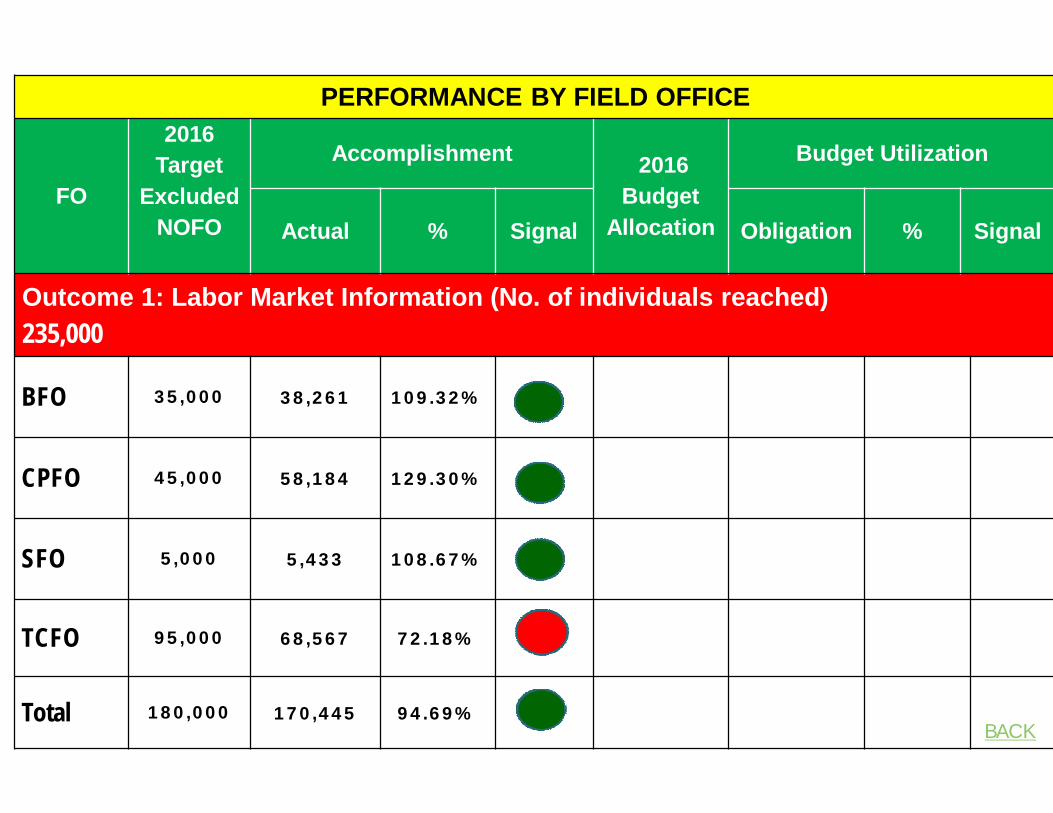
Outcome 1: Labor Market Information (No. of individuals reached)235,000
BFO 35,000 38,261 109.32%
CPFO 45,000 58,184 129.30%
SFO 5,000 5,433 108.67%
TCFO 95,000 68,567 72.18%
Total 180,000 170,445 94.69%BACK
PERFORMANCE BY FIELD OFFICE
FO
2016 Target
Excluded NOFO
Accomplishment 2016 Budget
Allocation
Budget Utilization
Actual % Signal Obligation % Signal
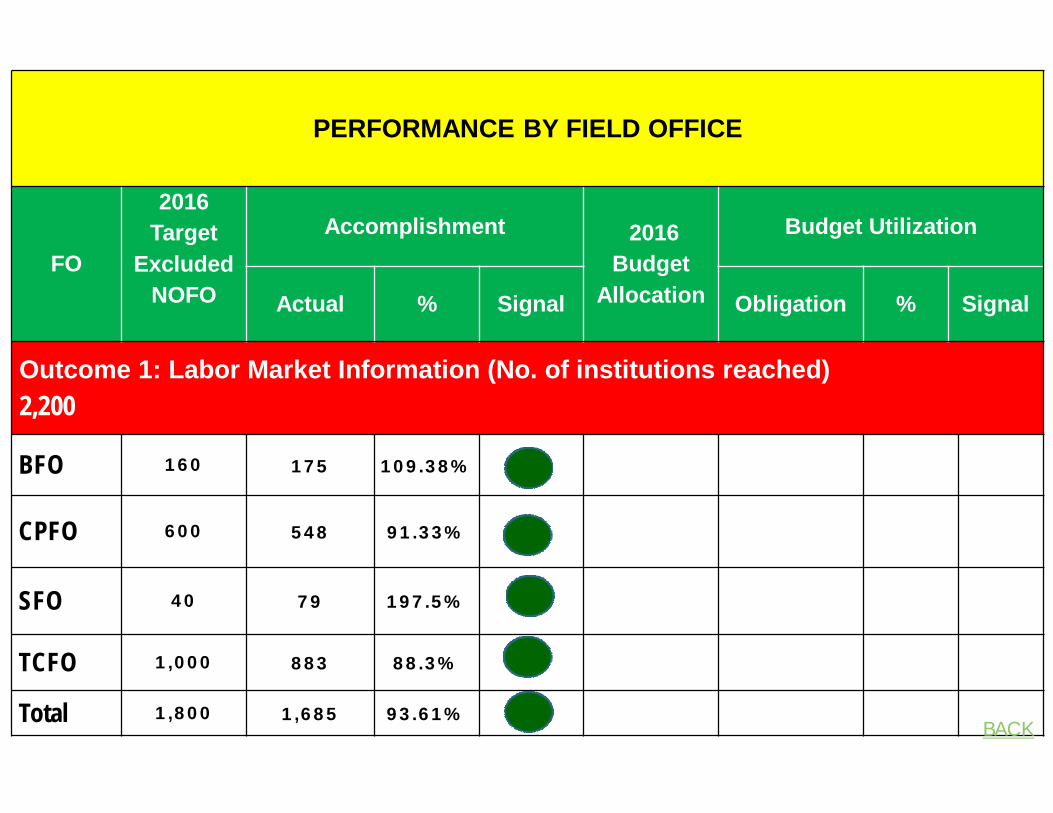
Outcome 1: Labor Market Information (No. of institutions reached)2,200
BFO 160 175 109.38%
CPFO 600 548 91.33%
SFO 40 79 197.5%
TCFO 1,000 883 88.3%
Total 1,800 1,685 93.61%BACK
PERFORMANCE BY FIELD OFFICE
FO
2016 Target
Excluded NOFO
Accomplishment 2016 Budget
Allocation
Budget Utilization
Actual % Signal Obligation % Signal
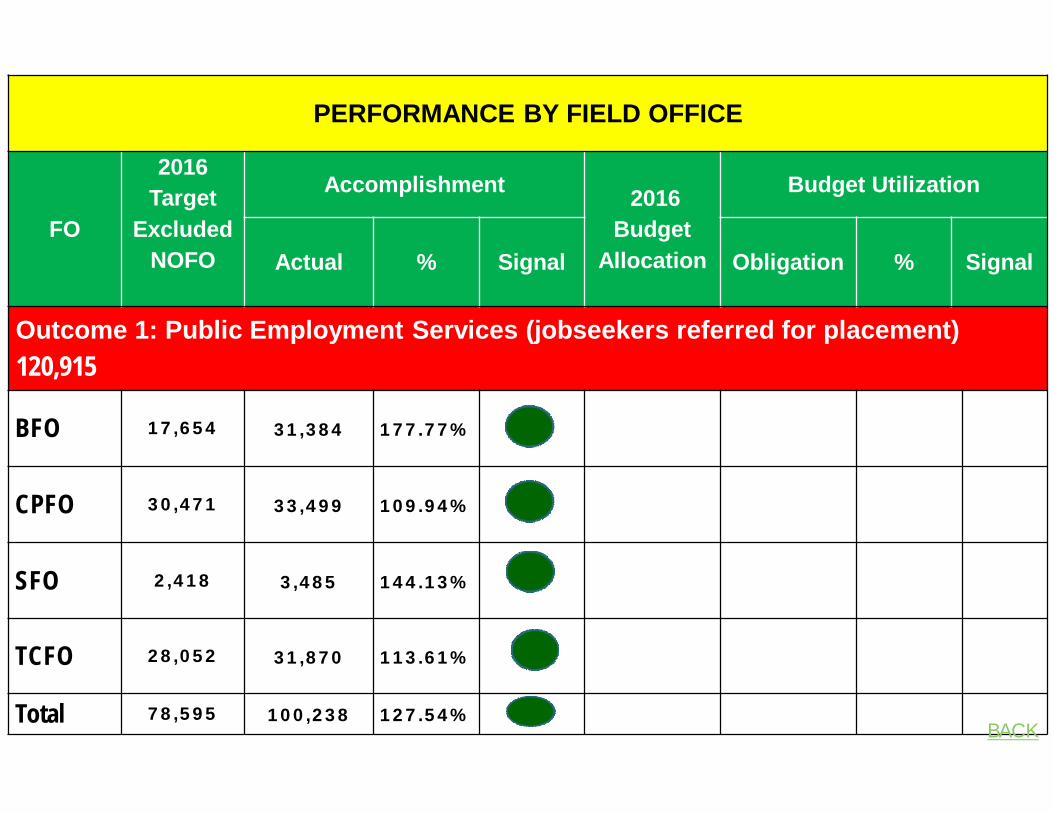
Outcome 1: Public Employment Services (jobseekers referred for placement)120,915
BFO 17,654 31,384 177.77%
CPFO 30,471 33,499 109.94%
SFO 2,418 3,485 144.13%
TCFO 28,052 31,870 113.61%
Total 78,595 100,238 127.54%BACK
PERFORMANCE BY FIELD OFFICE
FO
2016 Target
Excluded NOFO
Accomplishment 2016 Budget
Allocation
Budget Utilization
Actual % Signal Obligation % Signal
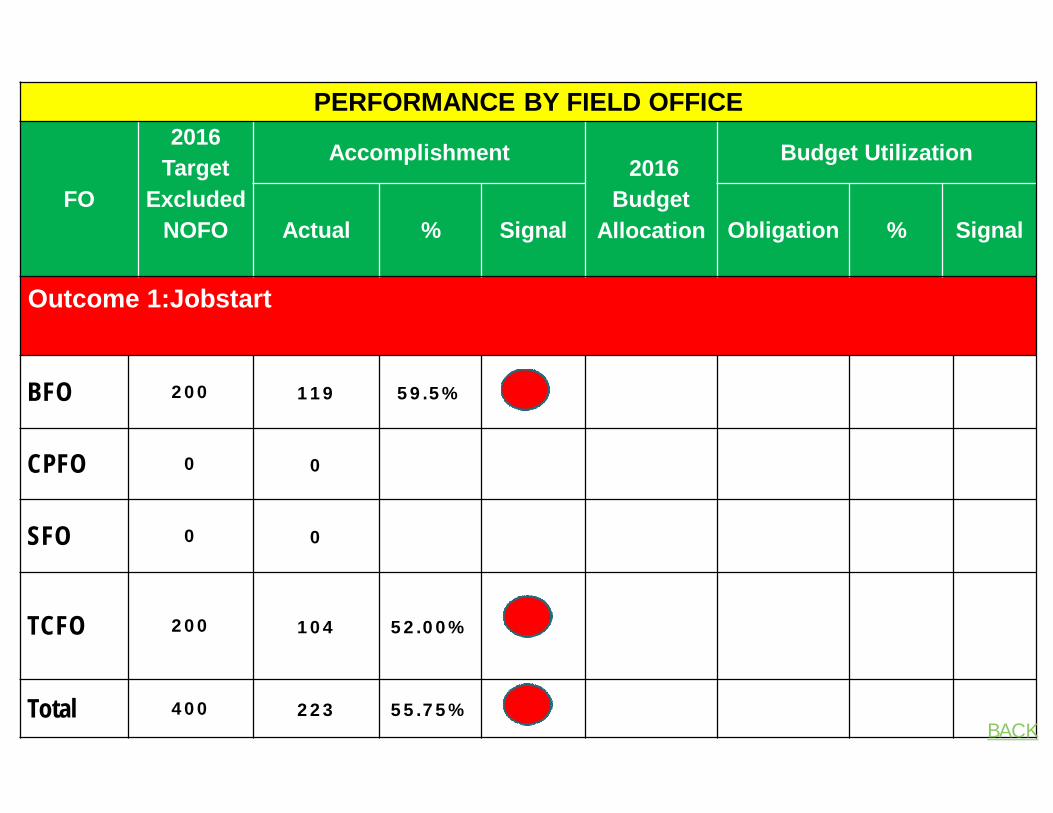
Outcome 1:Jobstart
BFO 200 119 59.5%
CPFO 0 0
SFO 0 0
TCFO 200 104 52.00%
Total 400 223 55.75%BACK
PERFORMANCE BY FIELD OFFICE
FO
2016 Target
Excluded NOFO
Accomplishment 2016 Budget
Allocation
Budget Utilization
Actual % Signal Obligation % Signal
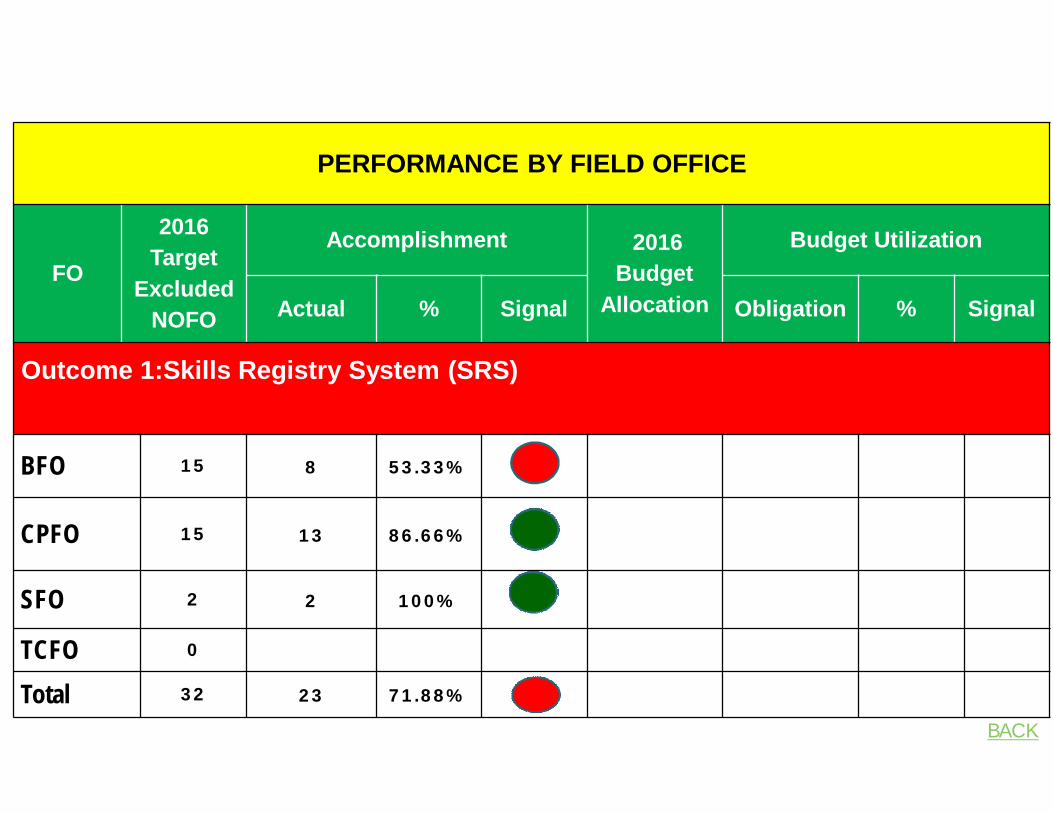
Outcome 1:Skills Registry System (SRS)
BFO 15 8 53.33%
CPFO 15 13 86.66%
SFO 2 2 100%
TCFO 0
Total 32 23 71.88%
BACK
PERFORMANCE BY FIELD OFFICE
FO
2016 Target
ExcludedNOFO
Accomplishment 2016 Budget
Allocation
Budget Utilization
Actual % Signal Obligation % Signal
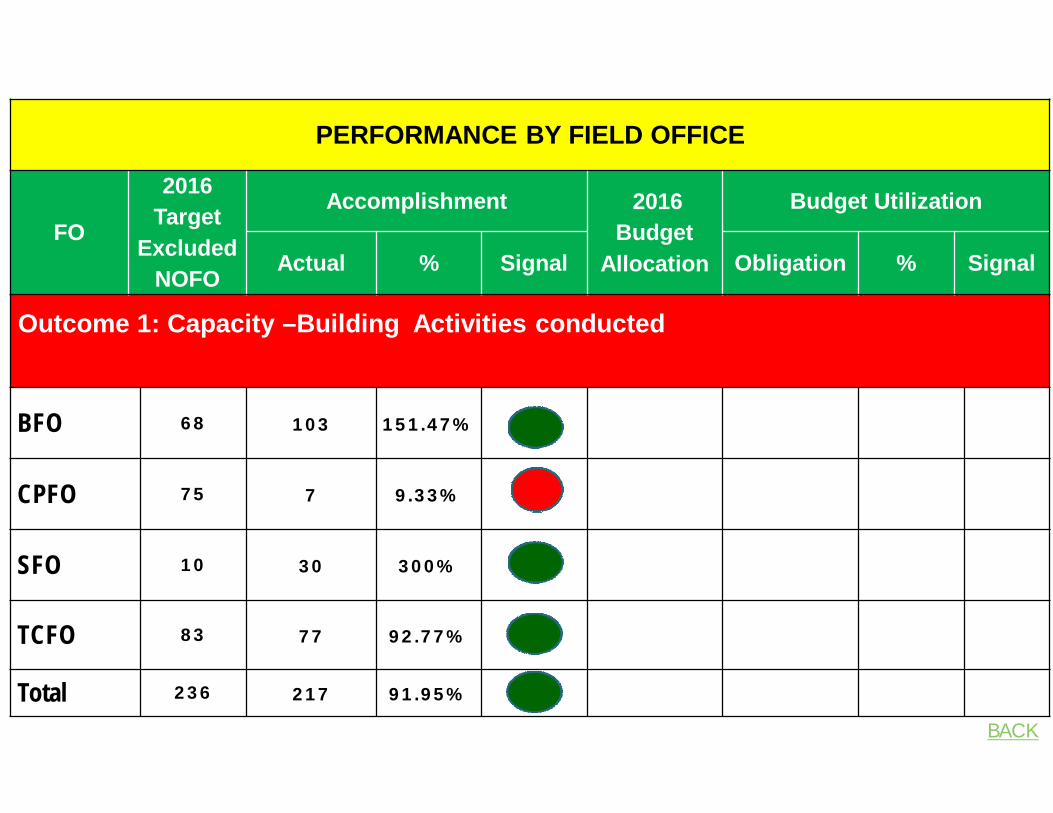
Outcome 1: Capacity –Building Activities conducted
BFO 68 103 151.47%
CPFO 75 7 9.33%
SFO 10 30 300%
TCFO 83 77 92.77%
Total 236 217 91.95%
BACK
PERFORMANCE BY FIELD OFFICE
FO 2016 Target
Accomplishment 2016 Budget
Allocation
Budget Utilization
Actual % Signal Obligation % Signal
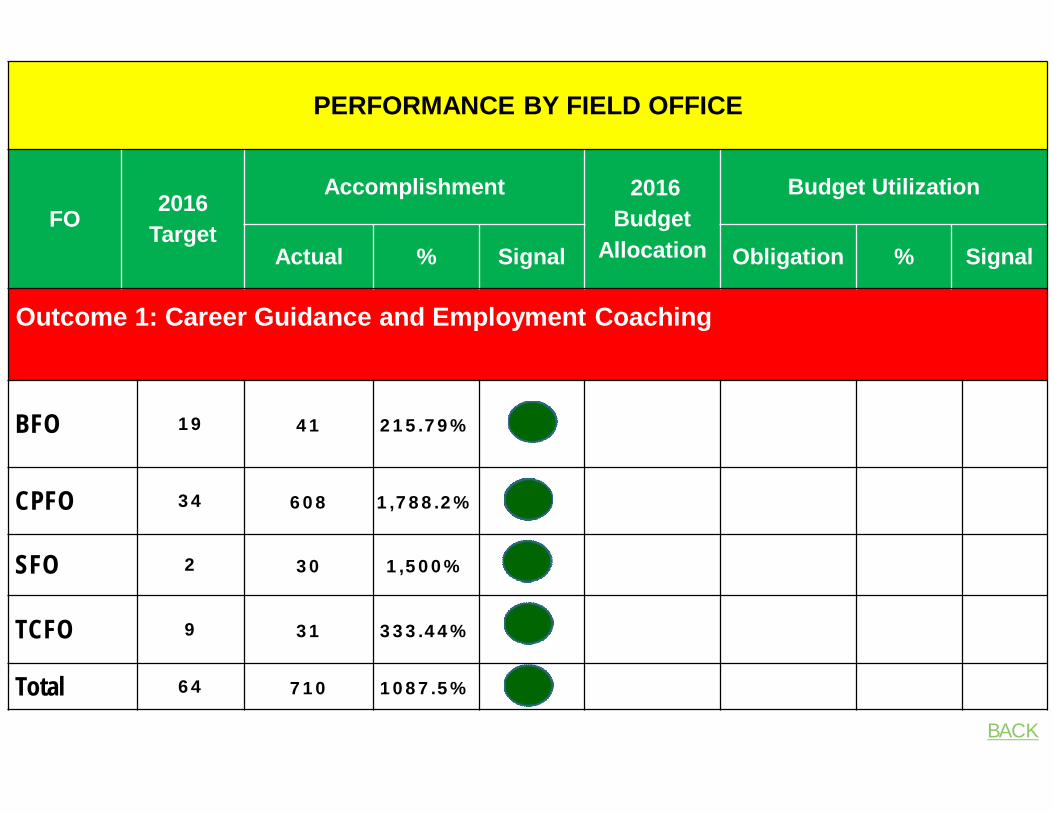
Outcome 1: Career Guidance and Employment Coaching
BFO 19 41 215.79%
CPFO 34 608 1,788.2%
SFO 2 30 1,500%
TCFO 9 31 333.44%
Total 64 710 1087.5%
BACK
PERFORMANCE BY FIELD OFFICE
FO
2016 Target
Excluded NOFO
Accomplishment 2016 Budget
Allocation
Budget Utilization
Actual % Signal Obligation % Signal
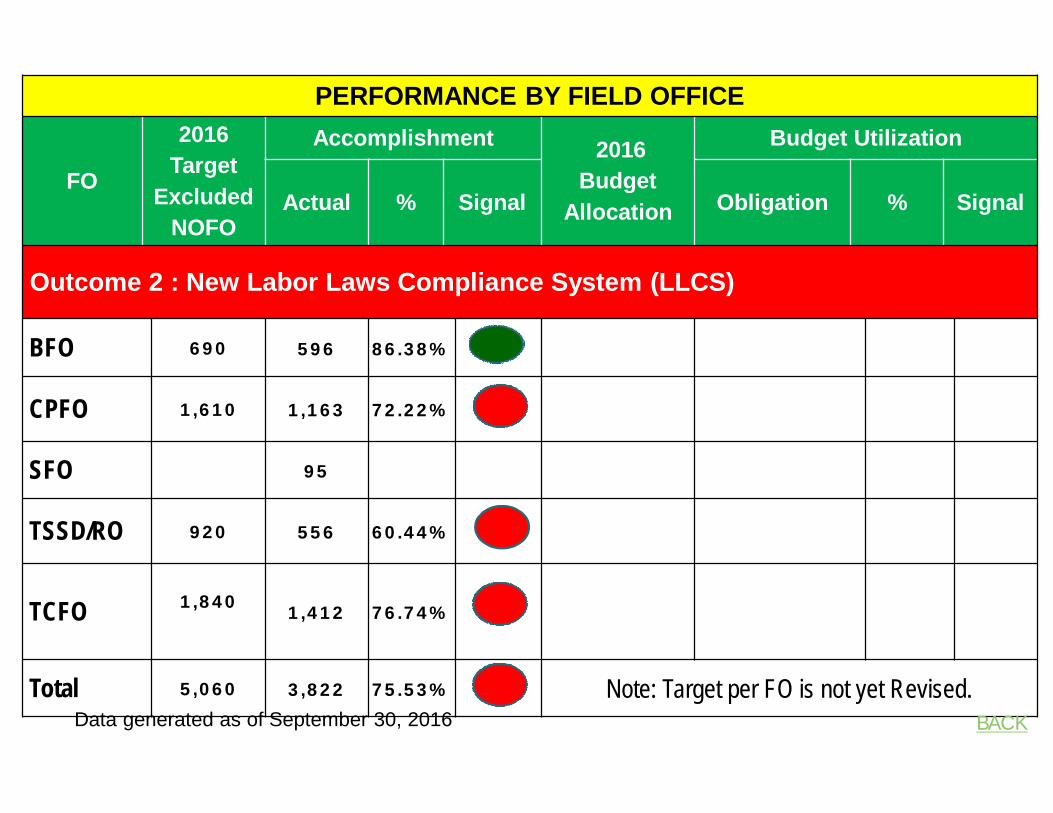
Outcome 2 : New Labor Laws Compliance System (LLCS)
BFO 690 596 86.38%
CPFO 1,610 1,163 72.22%
SFO 95
TSSD/RO 920 556 60.44%
TCFO 1,840 1,412 76.74%
Total 5,060 3,822 75.53% Note: Target per FO is not yet Revised.BACKData generated as of September 30, 2016
PERFORMANCE BY FIELD OFFICE
FO
No. Ofestablish
ment covered
Accomplishment 2016 Budget
Allocation
Budget Utilization
Actual % Signal Obligation % Signal
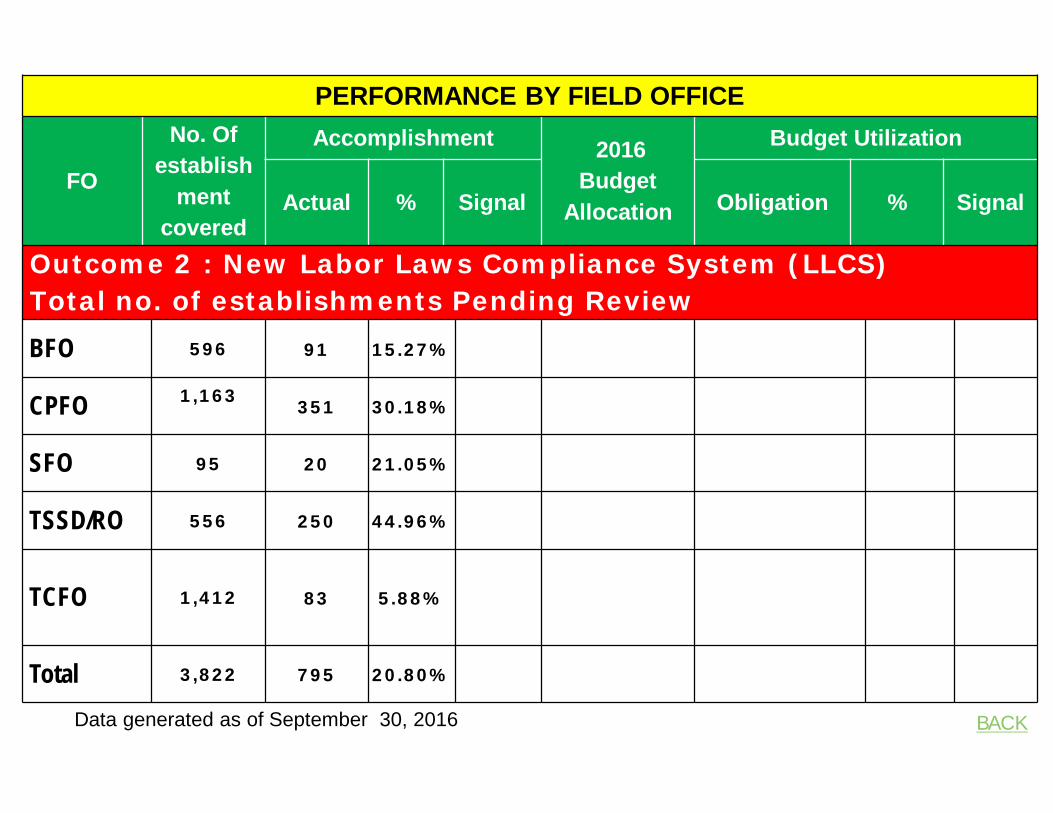
Outcome 2 : New Labor Laws Compliance System (LLCS)Total no. of establishments Pending Review
BFO 596 91 15.27%
CPFO 1,163 351 30.18%
SFO 95 20 21.05%
TSSD/RO 556 250 44.96%
TCFO 1,412 83 5.88%
Total 3,822 795 20.80%
BACKData generated as of September 30, 2016
PERFORMANCE BY FIELD OFFICE
FO
No. Ofestablish
ment covered
Accomplishment 2016 Budget
Allocation
Budget Utilization
Actual % Signal Obligation % Signal
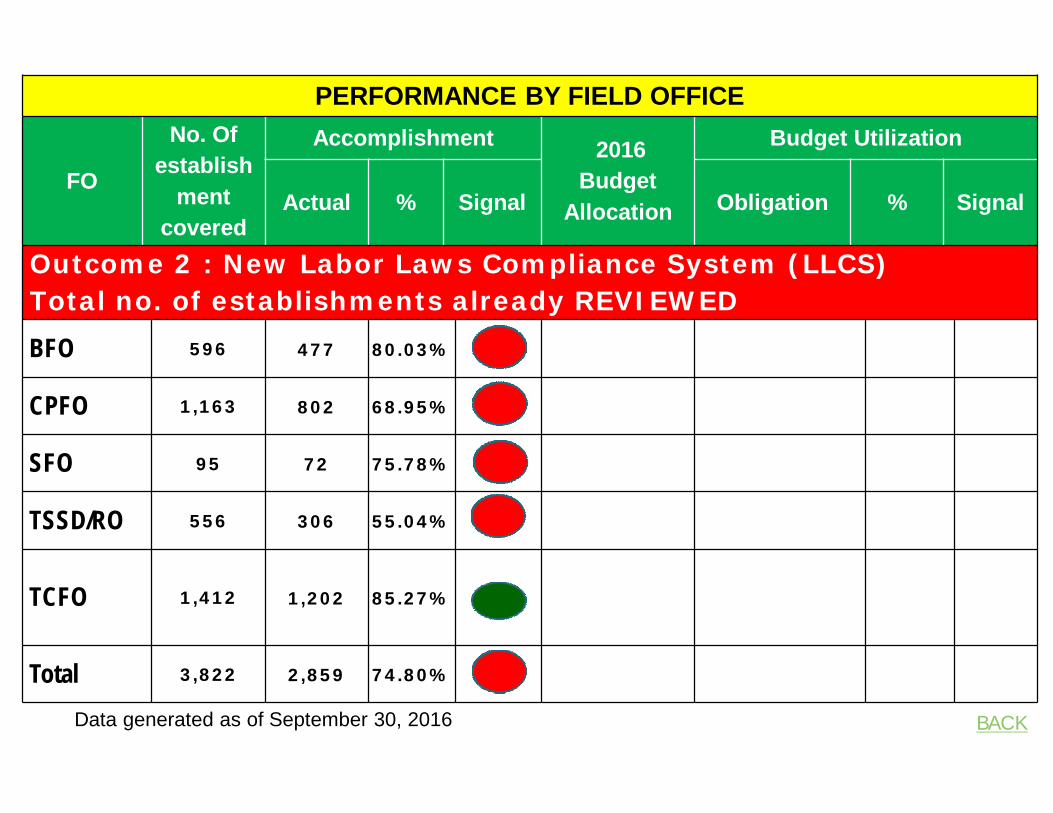
Outcome 2 : New Labor Laws Compliance System (LLCS)Total no. of establishments already REVIEWED
BFO 596 477 80.03%
CPFO 1,163 802 68.95%
SFO 95 72 75.78%
TSSD/RO 556 306 55.04%
TCFO 1,412 1,202 85.27%
Total 3,822 2,859 74.80%
BACKData generated as of September 30, 2016
PERFORMANCE BY FIELD OFFICE
FO
No. Ofestablishment
covered
Accomplishment2016
Budget Allocation
Budget Utilization
Actual % Signal Obligation % Signal
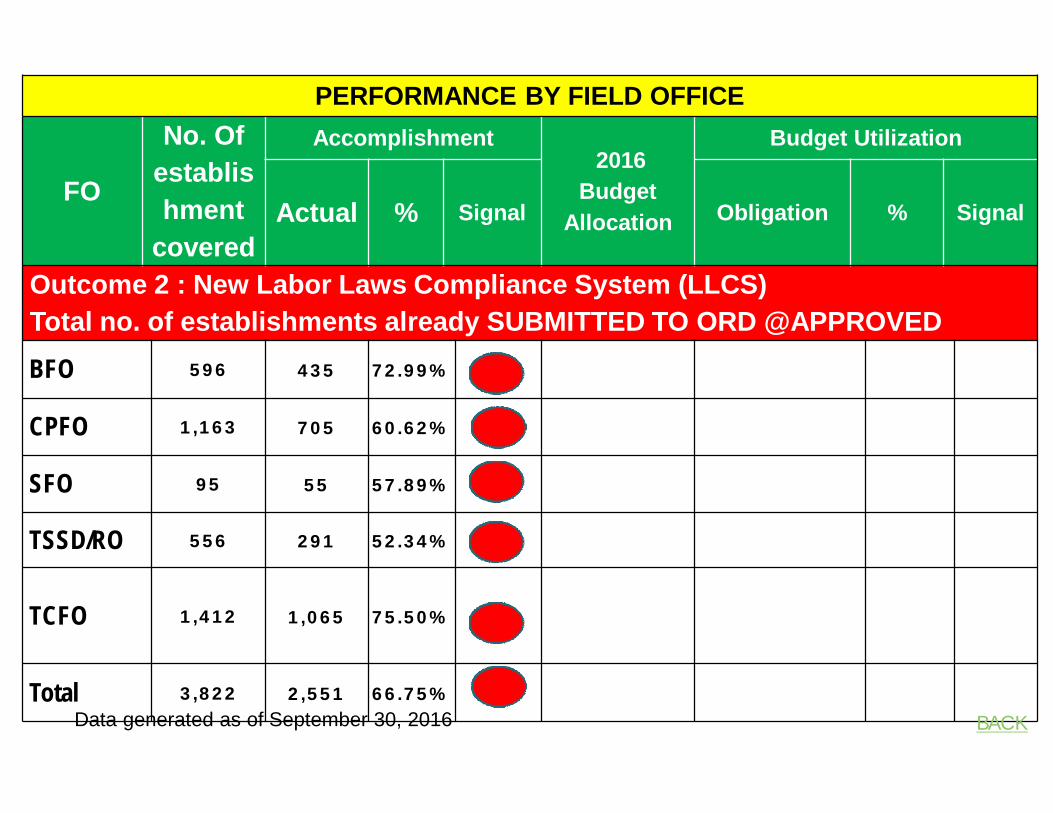
Outcome 2 : New Labor Laws Compliance System (LLCS)Total no. of establishments already SUBMITTED TO ORD @APPROVEDBFO 596 435 72.99%
CPFO 1,163 705 60.62%
SFO 95 55 57.89%
TSSD/RO 556 291 52.34%
TCFO 1,412 1,065 75.50%
Total 3,822 2,551 66.75%BACKData generated as of September 30, 2016
PERFORMANCE BY FIELD OFFICE
FO 2016 Target
Accomplishment 2016 Budget
Allocation
Budget Utilization
Actual % Signal Obligation % Signal
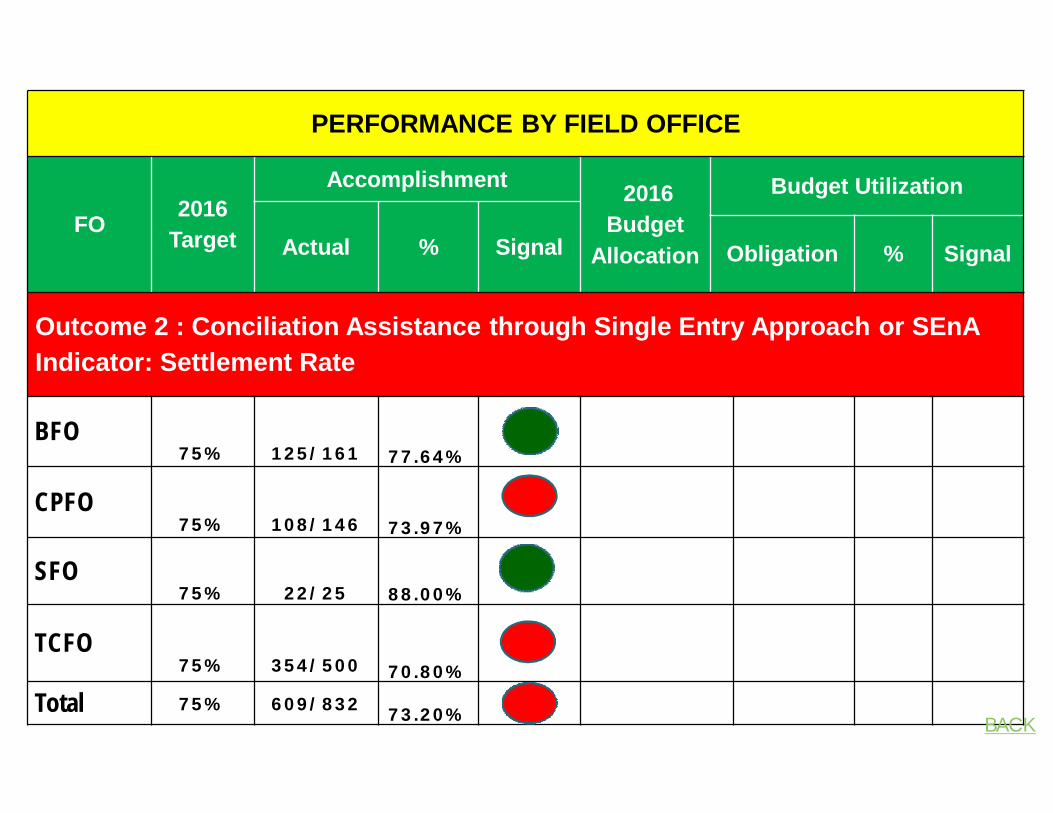
Outcome 2 : Conciliation Assistance through Single Entry Approach or SEnAIndicator: Settlement Rate
BFO75% 125/161 77.64%
CPFO75% 108/146 73.97%
SFO75% 22/25 88.00%
TCFO75% 354/500 70.80%
Total 75% 609/832 73.20% BACK
PERFORMANCE BY FIELD OFFICE
FO 2016 Target
Accomplishment 2016 Budget
Allocation
Budget Utilization
Actual % Signal Obligation % Signal
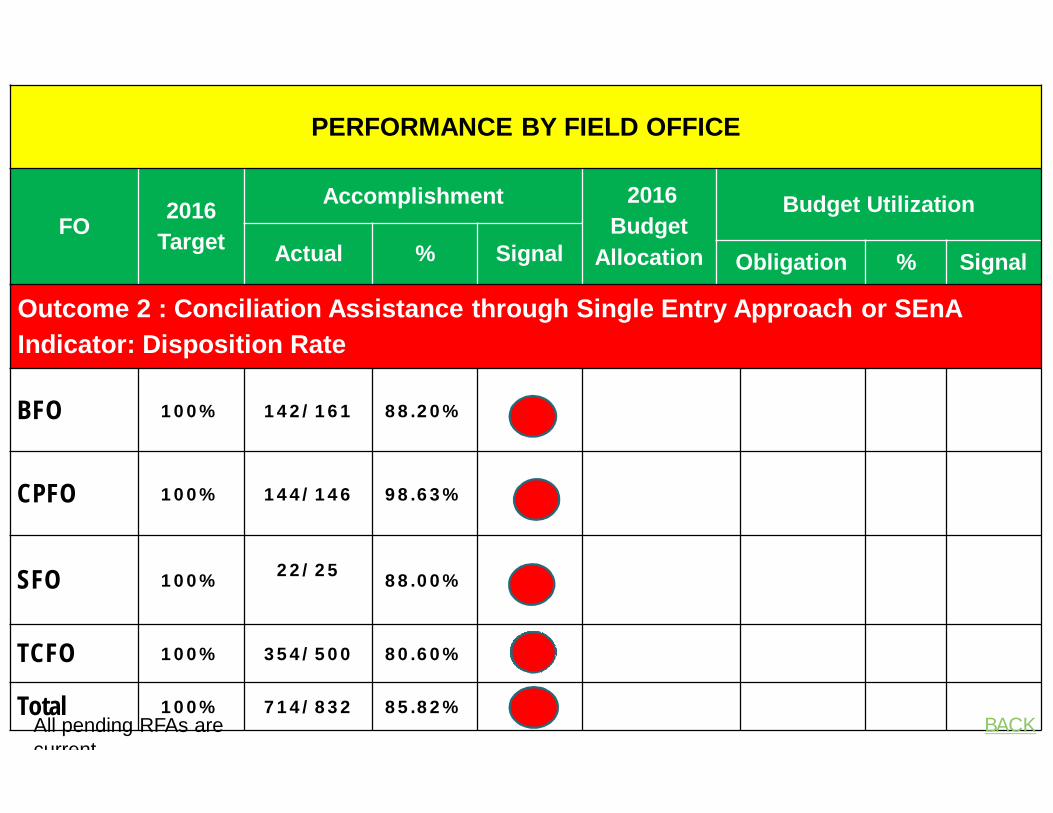
Outcome 2 : Conciliation Assistance through Single Entry Approach or SEnAIndicator: Disposition Rate
BFO 100% 142/161 88.20%
CPFO 100% 144/146 98.63%
SFO 100% 22/25 88.00%
TCFO 100% 354/500 80.60%
Total 100% 714/832 85.82%BACKAll pending RFAs are
current.
PERFORMANCE BY FIELD OFFICE
FO
2016Target
Excluded NOFO
Accomplishment 2016 Budget
Allocation
Budget Utilization
Actual % Signal Obligation % Signal
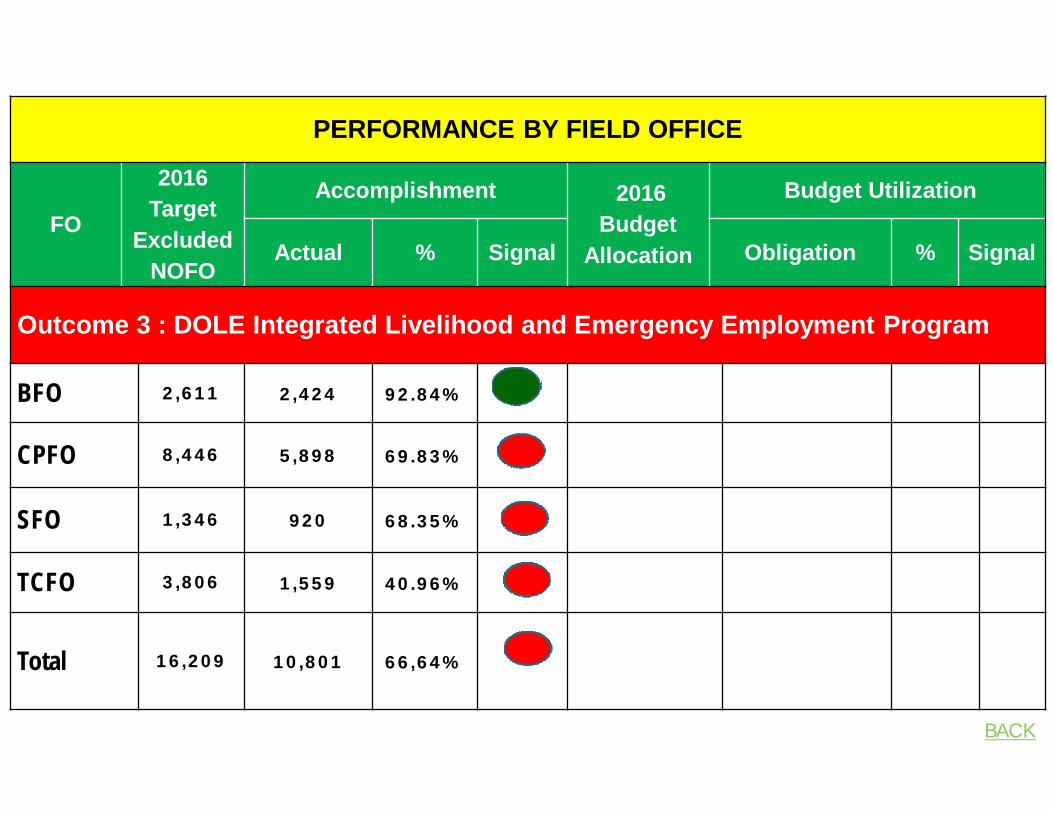
Outcome 3 : DOLE Integrated Livelihood and Emergency Employment Program
BFO 2,611 2,424 92.84%
CPFO 8,446 5,898 69.83%
SFO 1,346 920 68.35%
TCFO 3,806 1,559 40.96%
Total 16,209 10,801 66,64%
BACK
PERFORMANCE BY FIELD OFFICE
FO
2016Target
Excluded NOFO
Accomplishment 2016 Budget
Allocation
Budget Utilization
Actual % Signal Obligation % Signal
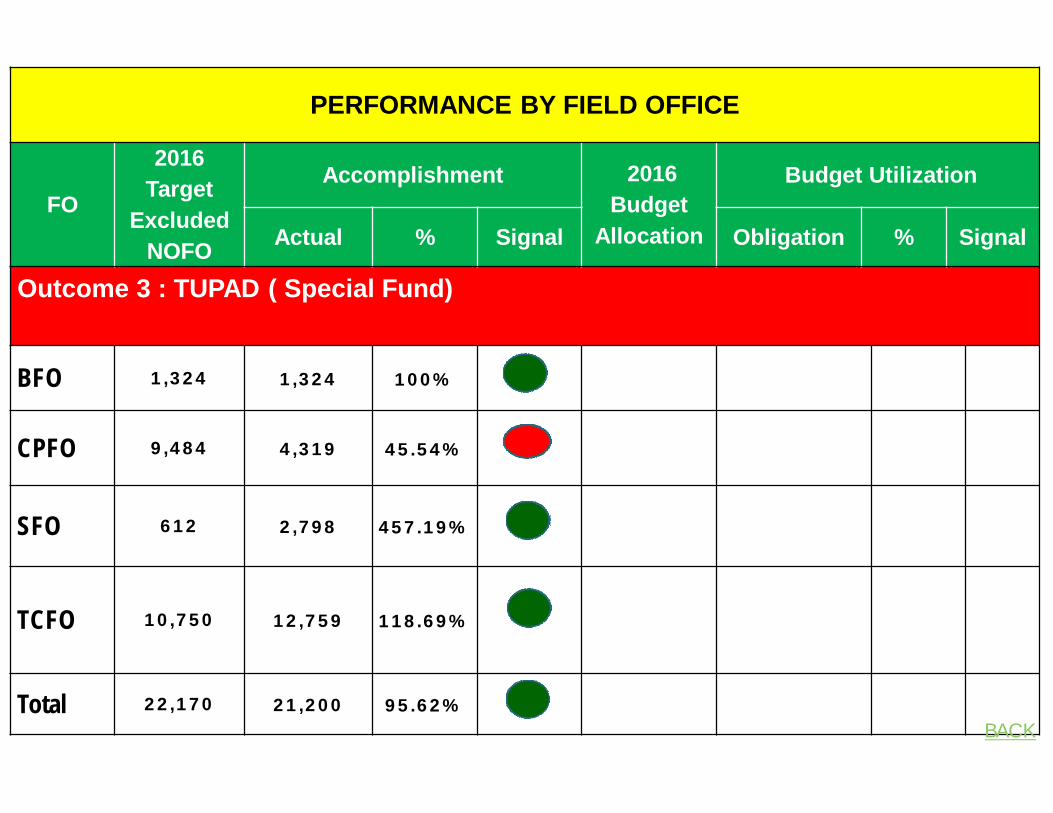
Outcome 3 : TUPAD ( Special Fund)
BFO 1,324 1,324 100%
CPFO 9,484 4,319 45.54%
SFO 612 2,798 457.19%
TCFO 10,750 12,759 118.69%
Total 22,170 21,200 95.62%BACK
DOLE RO7 Planning Tool Performance Scorecard
(as of September 2016)G u i d i n g R a t e 8 2 %
2016 Target
Accomplishment 2016Budget
Allocation
Budget Utilization
Actual % Signal Utilized % Signal
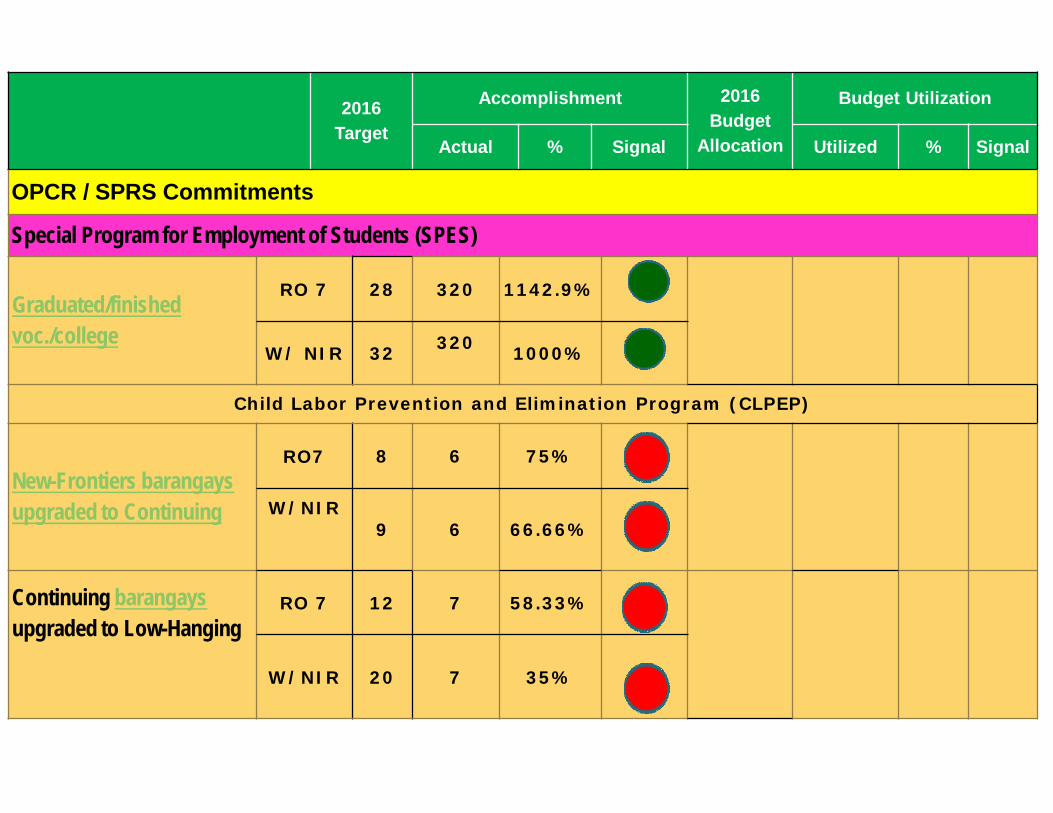
OPCR / SPRS Commitments
Special Program for Employment of Students (SPES)
Graduated/finishedvoc./college
RO 7 28 320 1142.9%
W/ NIR 32 320 1000%
Child Labor Prevention and Elimination Program (CLPEP)
New-Frontiers barangays upgraded to Continuing
RO7 8 6 75%
W/NIR9 6 66.66%
Continuing barangaysupgraded to Low-Hanging
RO 7 12 7 58.33%
W/NIR 20 7 35%
PAPs/ Indicators 2016 Target
Accomplishment 2016Budget
Allocation
Budget Utilization
Actual % Signal Utilized % Signal
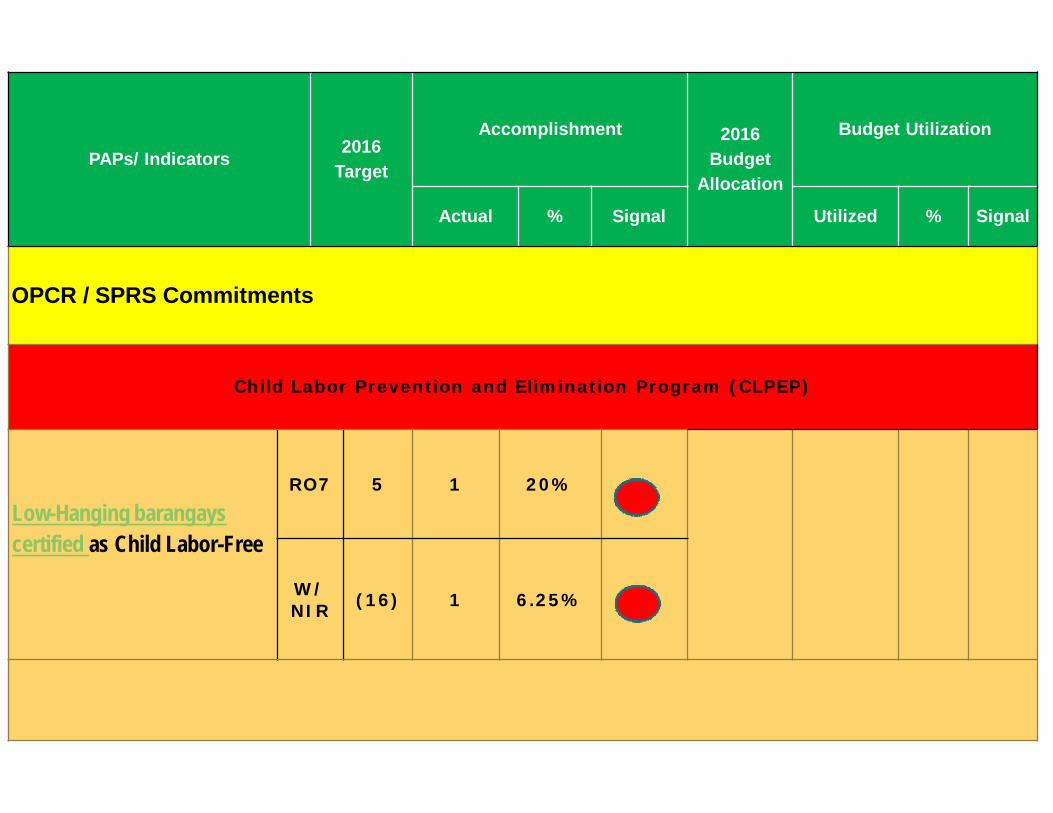
OPCR / SPRS Commitments
Child Labor Prevention and Elimination Program (CLPEP)
Low-Hanging barangayscertified as Child Labor-Free
RO7 5 1 20%
W/ NIR (16) 1 6.25%
2016 Target
Accomplishment 2016Budget
Allocation
Budget Utilization
Actual % Signal Utilized % Signal
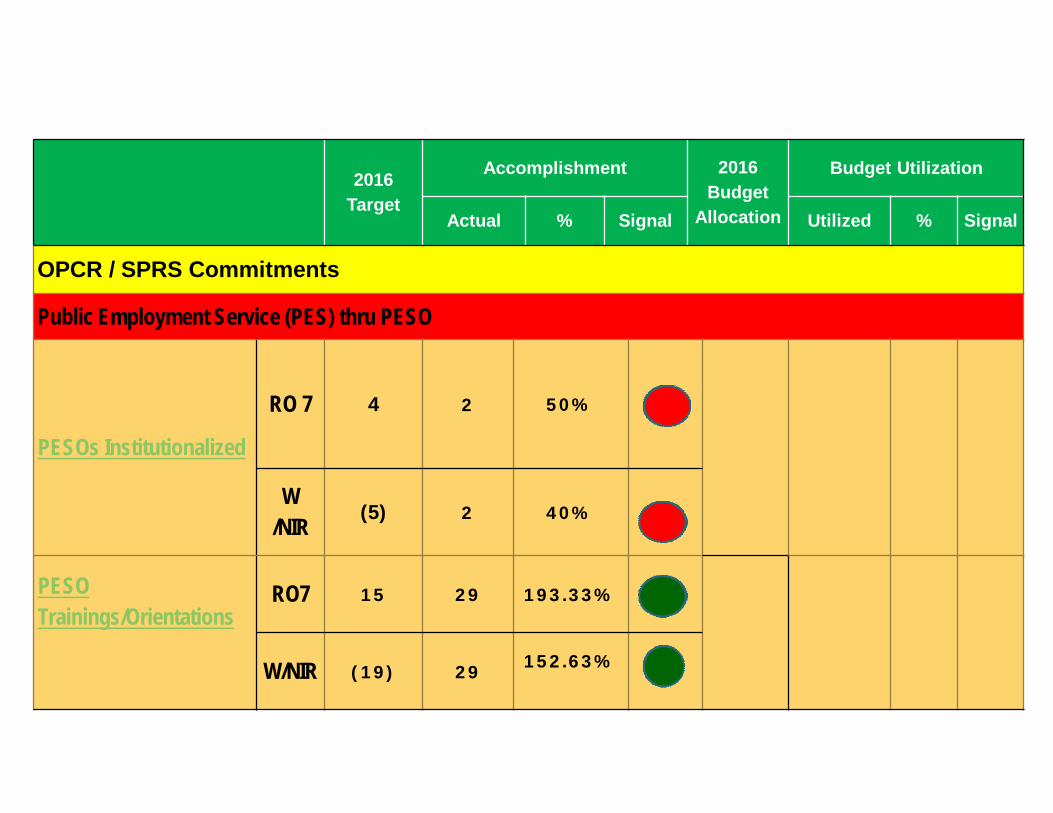
OPCR / SPRS Commitments
Public Employment Service (PES) thru PESO
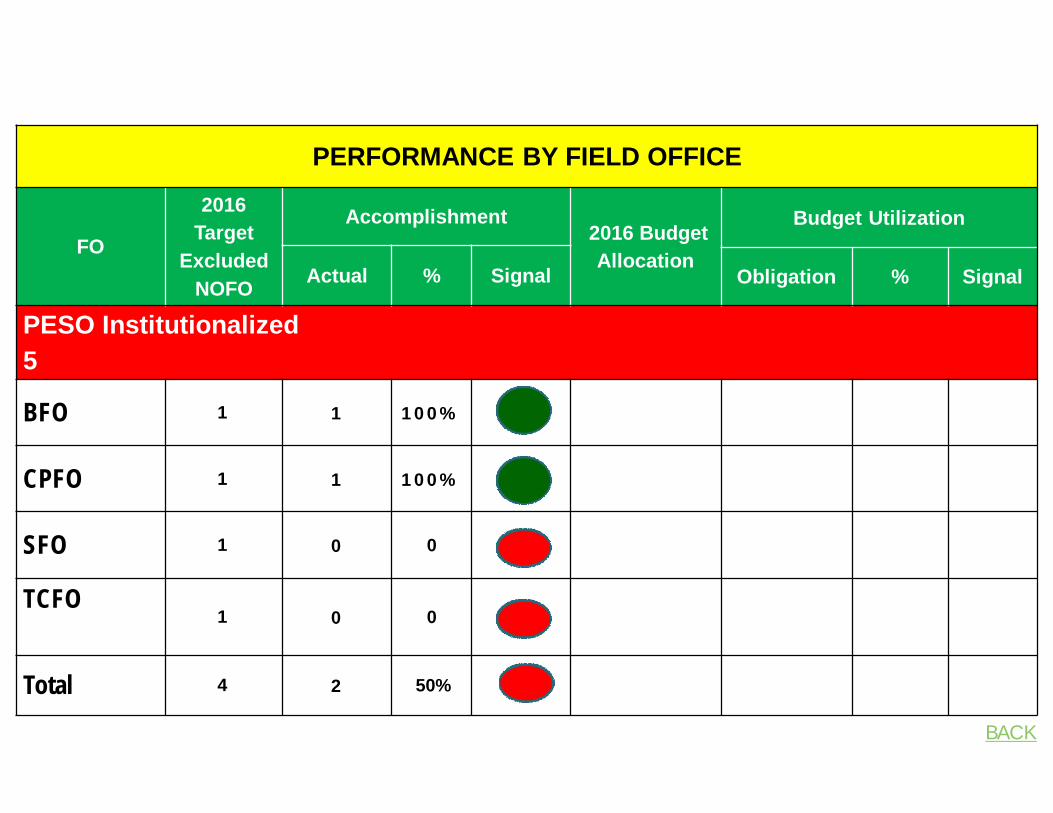
PESOs Institutionalized
RO 7 4 2 50%
W/NIR (5) 2 40%
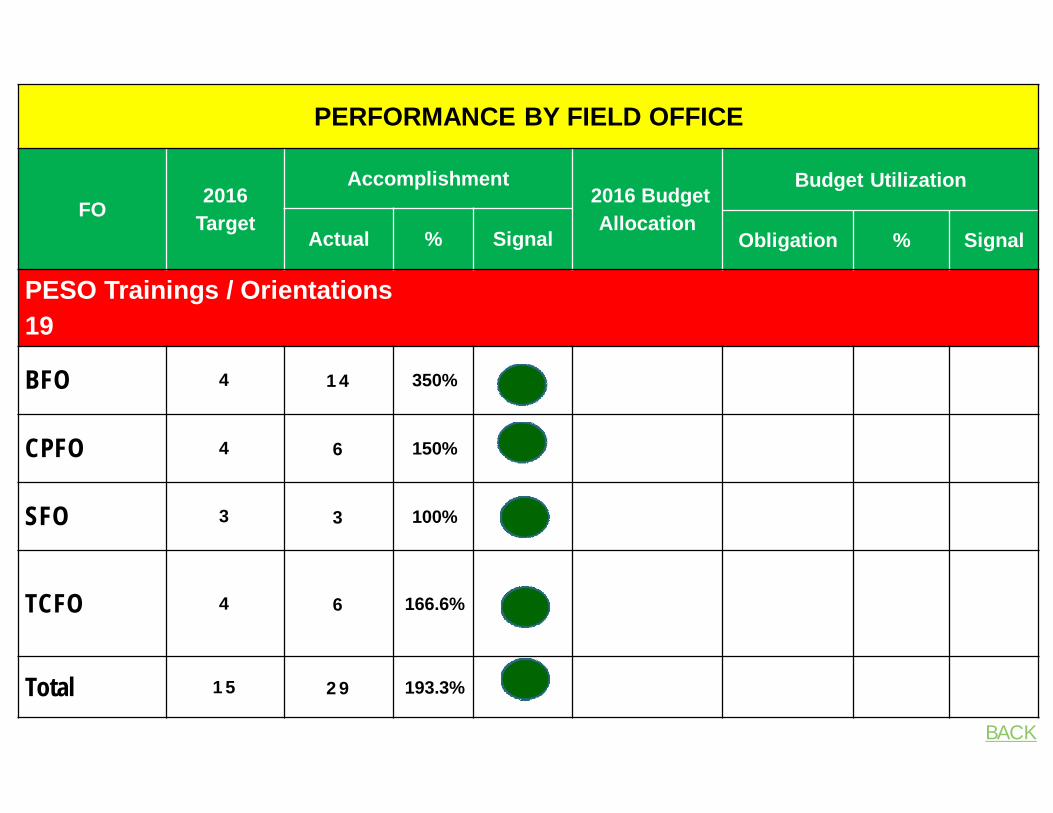
PESO Trainings/Orientations
RO7 15 29 193.33%
W/NIR (19) 29 152.63%
2016 Target
Accomplishment 2016Budget
Allocation
Budget Utilization
Actual % Signal Utilized % Signal
OPCR / SPRS Commitments
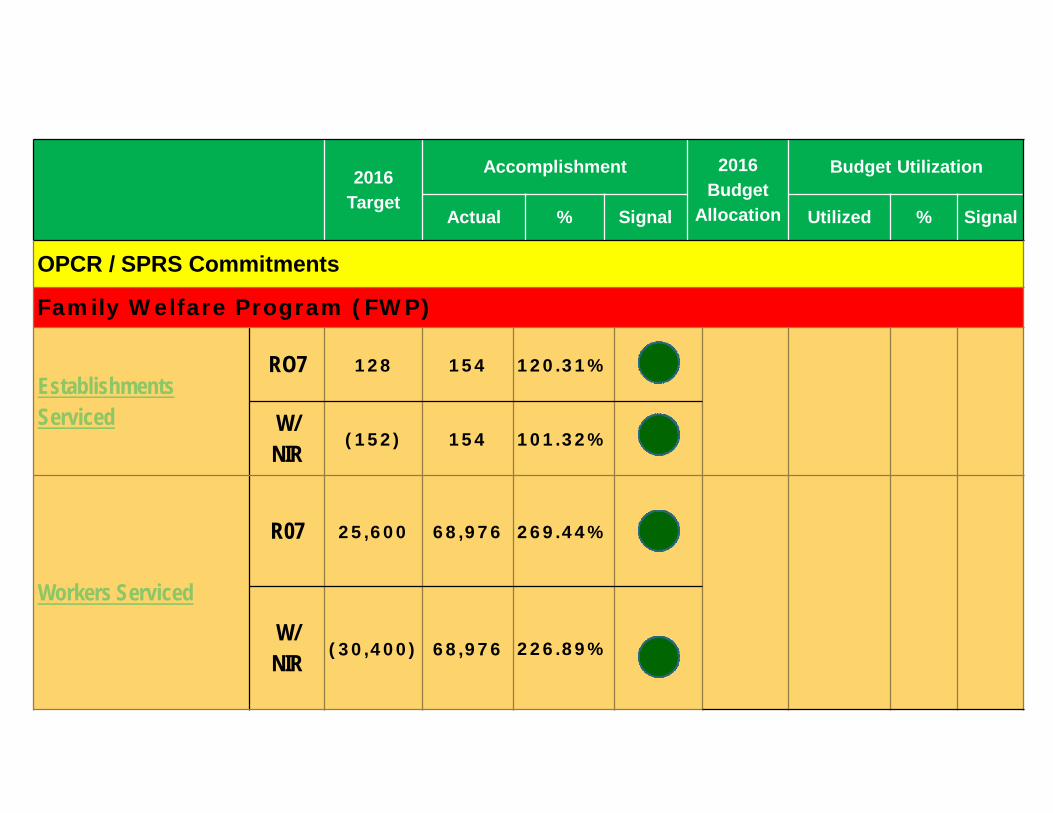
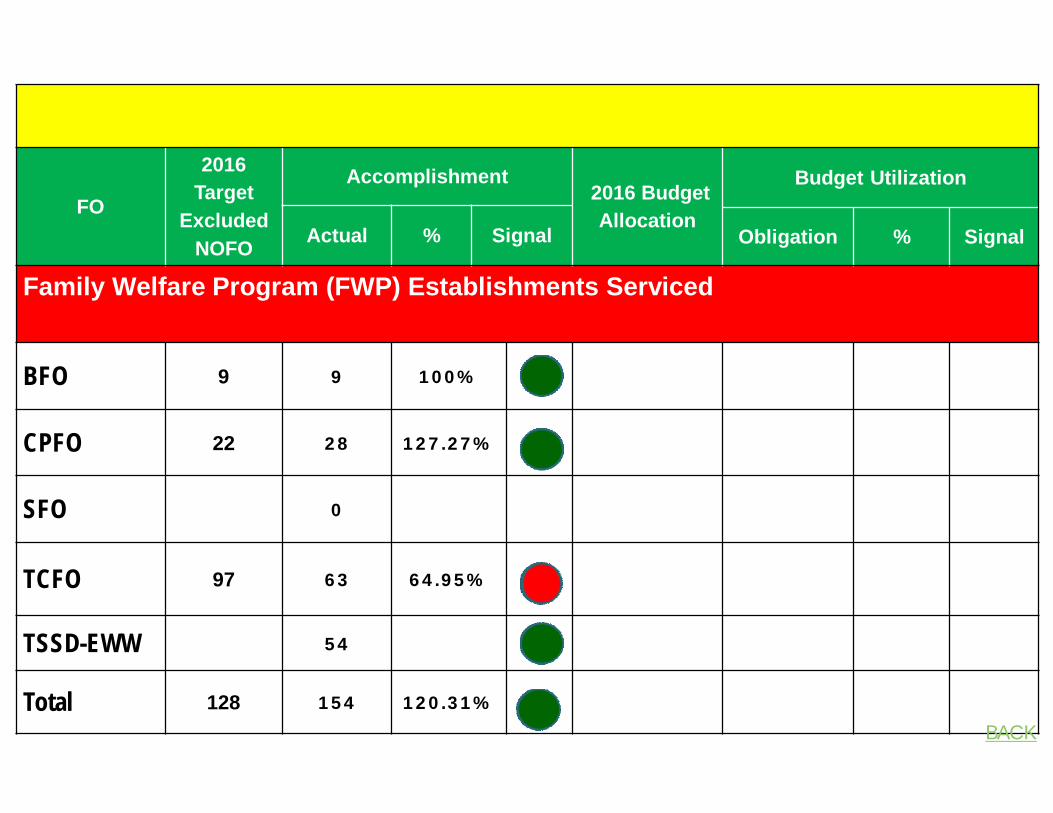
Family Welfare Program (FWP)
Establishments Serviced
RO7 128 154 120.31%
W/NIR
(152) 154 101.32%
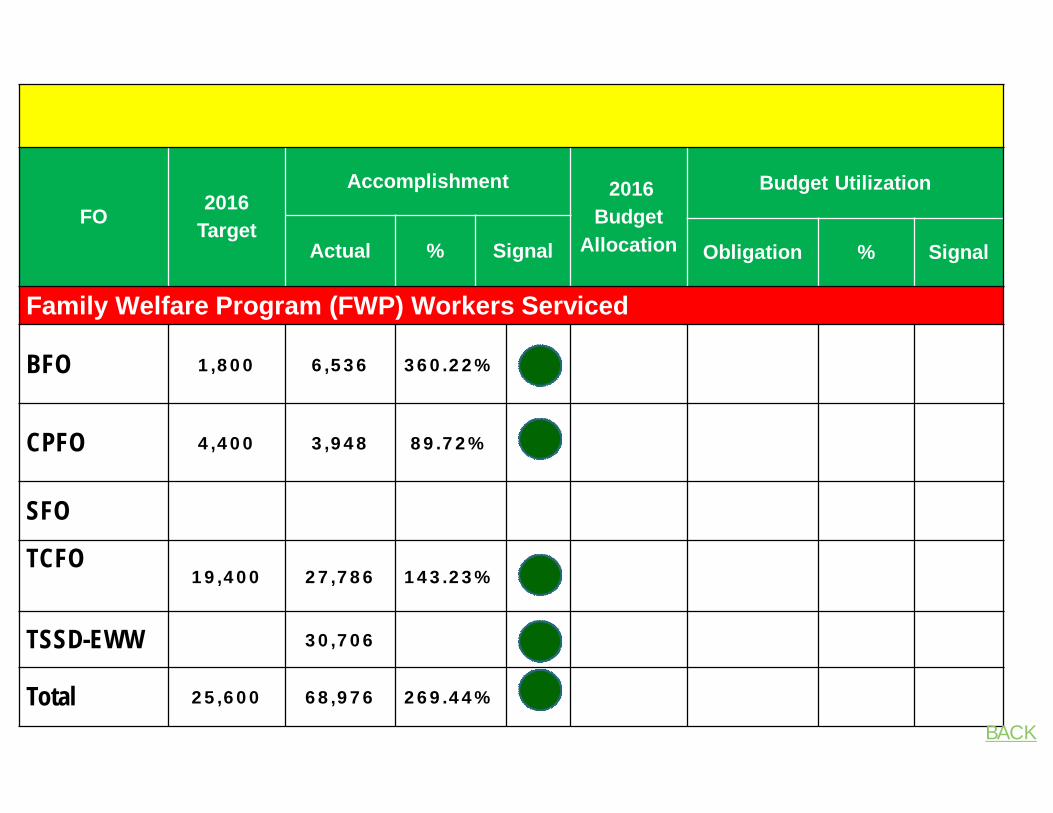
Workers Serviced
R07 25,600 68,976 269.44%
W/NIR (30,400) 68,976 226.89%
PAPs/ Indicators 2016 Target
Accomplishment 2016Budget
Allocation
Budget Utilization
Actual % Signal Utilized % Signal
OPCR / SPRS Commitments
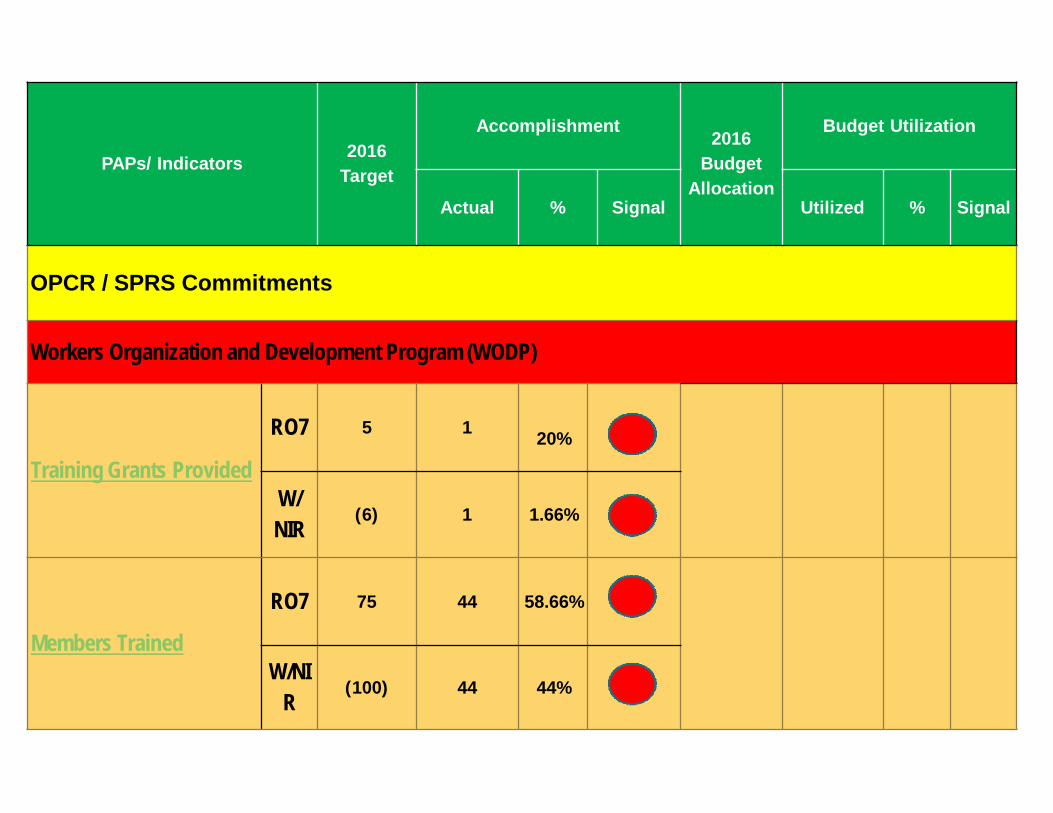
Workers Organization and Development Program (WODP)
Training Grants Provided
RO7 5 1 20%
W/NIR
(6) 1 1.66%
Members Trained
RO7 75 44 58.66%
W/NIR
(100) 44 44%
PAPs/ Indicators 2016 Target
Accomplishment2016
BudgetAllocation
Budget Utilization
Actual % Signal Utilized % Signal
OPCR / SPRS Commitments
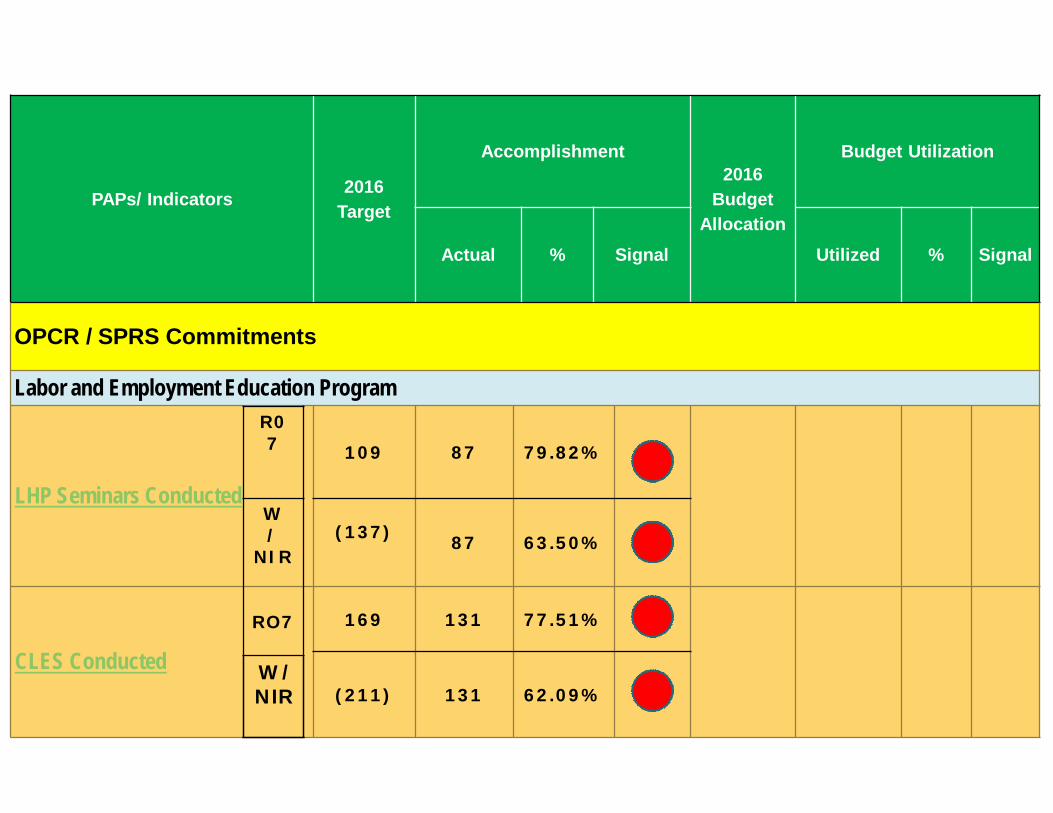
Labor and Employment Education Program
LHP Seminars Conducted
109 87 79.82%
(137) 87 63.50%
CLES Conducted
169 131 77.51%
(211) 131 62.09%
R07
W/
NIR
RO7
W/ NIR
PAPs/ Indicators 2016 Target
Accomplishment 2016 Budget
Allocation
Budget Utilization
Actual % Signal Utilized % Signal
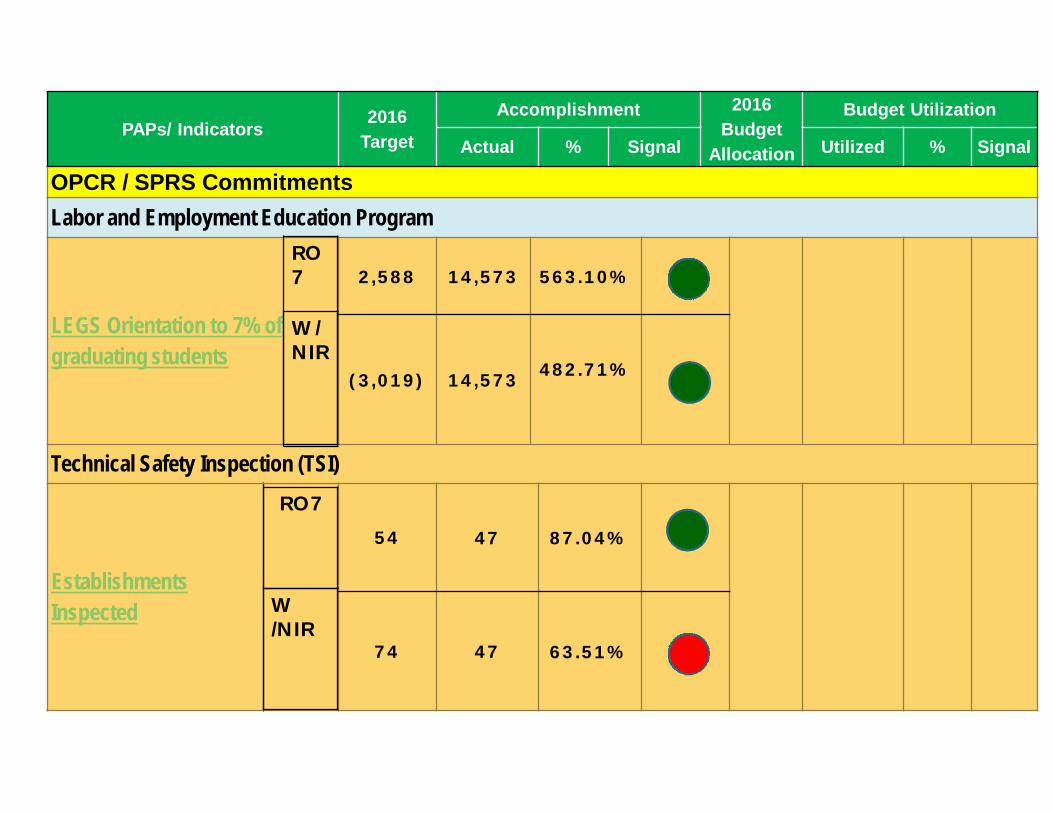
OPCR / SPRS CommitmentsLabor and Employment Education Program
LEGS Orientation to 7% of graduating students
2,588 14,573 563.10%
(3,019) 14,573 482.71%
Technical Safety Inspection (TSI)
Establishments Inspected
54 47 87.04%
74 47 63.51%
RO 7
W/NIR
W /NIR
RO7
PERFORMANCE BY FIELD OFFICE
FO
2016 Target
ExcludedNOFO
Accomplishment 2016 Budget
Allocation
Budget Utilization
Actual % Signal Obligation % Signal
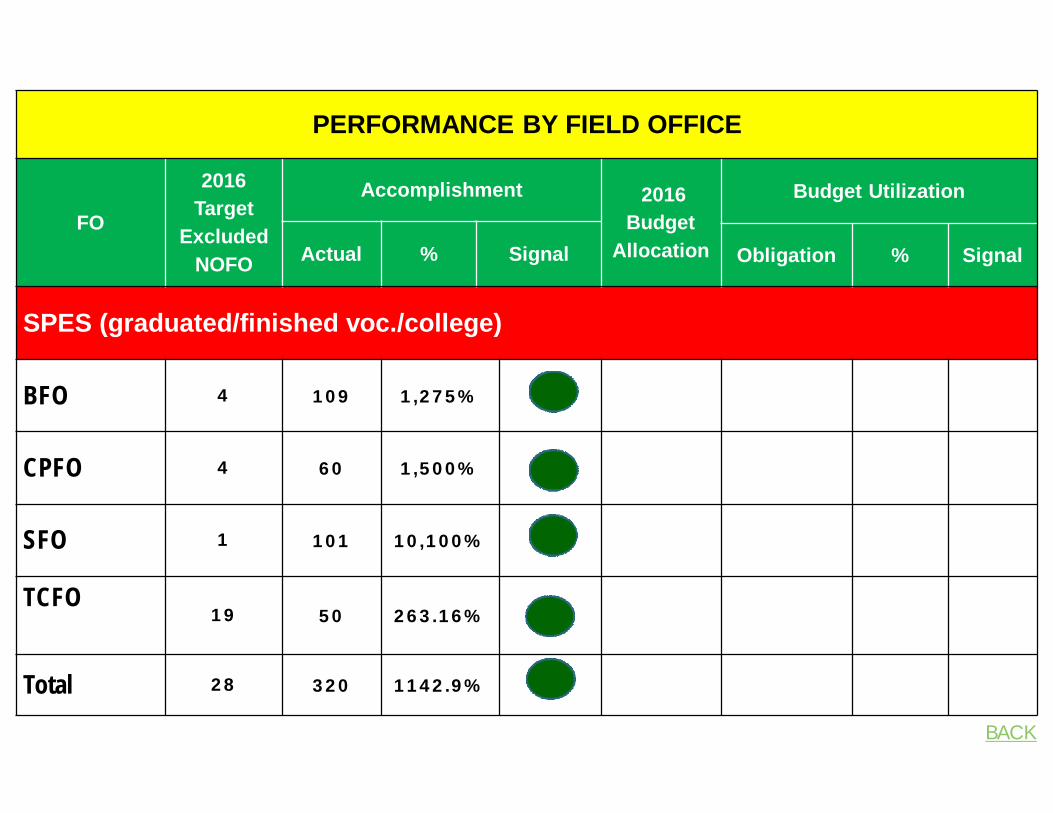
SPES (graduated/finished voc./college)
BFO 4 109 1,275%
CPFO 4 60 1,500%
SFO 1 101 10,100%
TCFO19 50 263.16%
Total 28 320 1142.9%
BACK
FO
2016 Target
ExcludedNOFO
Accomplishment2015 Budget Allocation
Budget Utilization
Actual % Signal Obligation % Signal
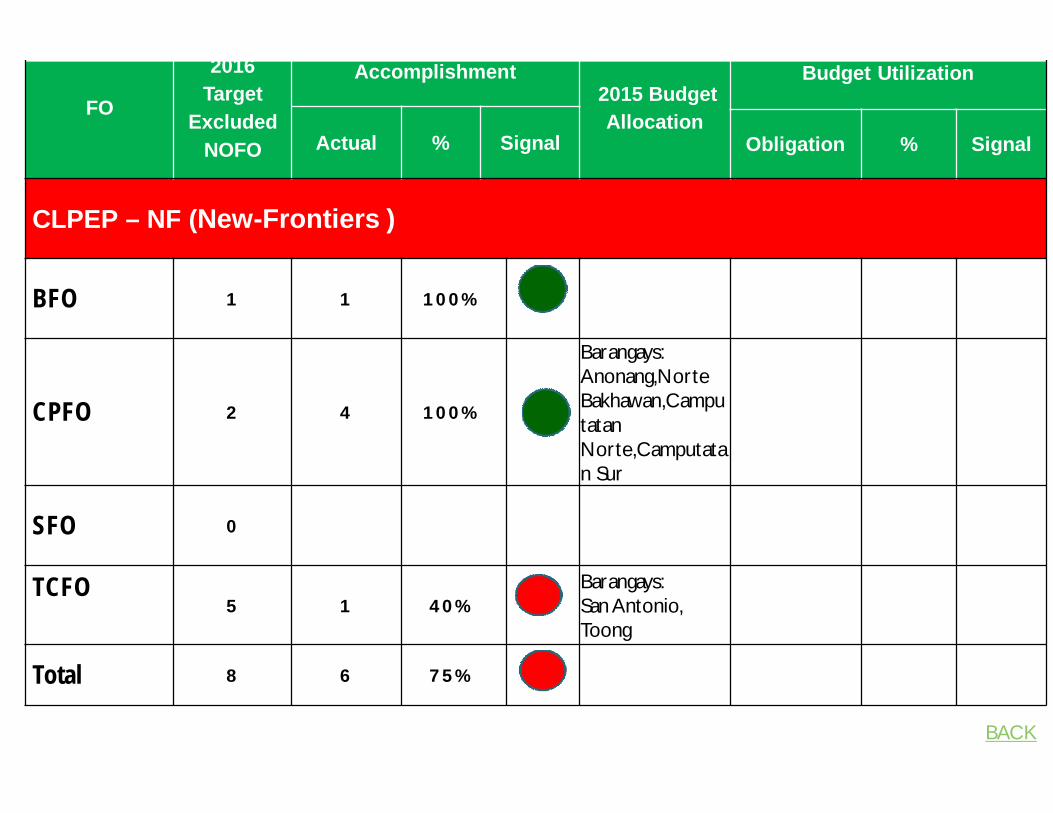
CLPEP – NF (New-Frontiers )
BFO 1 1 100%
CPFO 2 4 100%
Barangays: Anonang,NorteBakhawan,CamputatanNorte,Camputatan Sur
SFO 0
TCFO5 1 40%
Barangays: San Antonio, Toong
Total 8 6 75%
BACK
PERFORMANCE BY FIELD OFFICE
FO
2016 Target
Excluded NOFO
Accomplishment2016 Budget Allocation
Budget Utilization
Actual % Signal Obligation % Signal
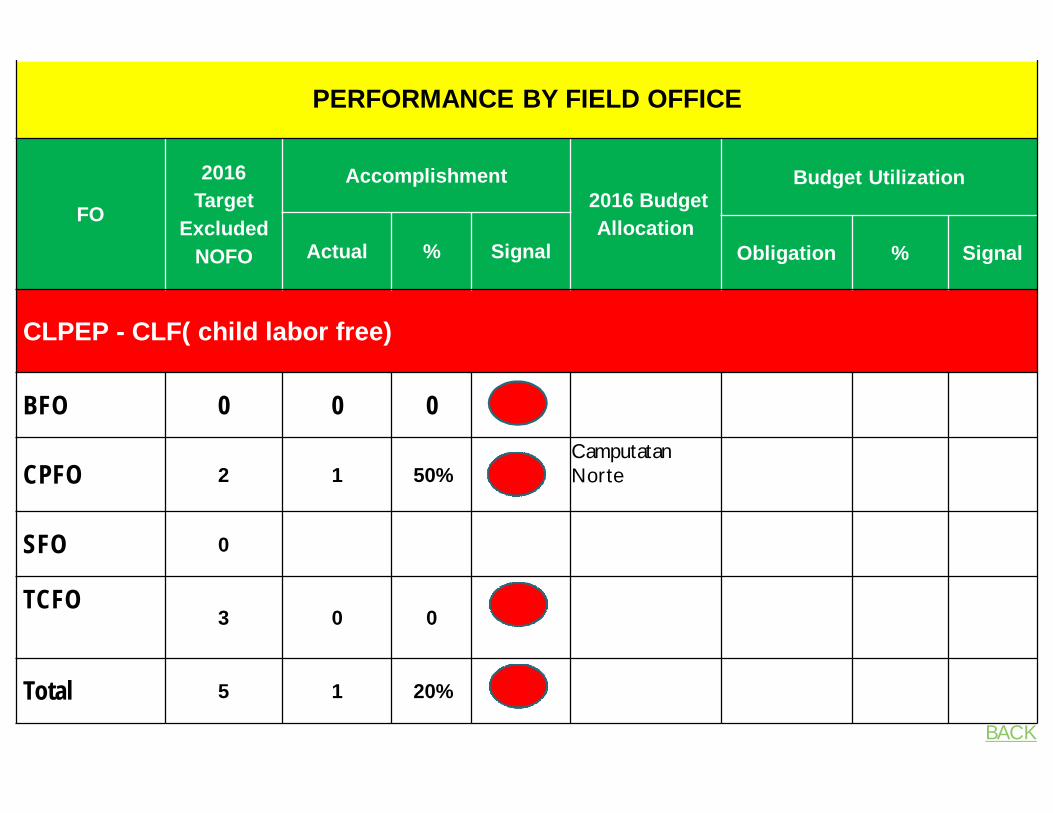
CLPEP - CLF( child labor free)
BFO 0 0 0
CPFO 2 1 50%CamputatanNorte
SFO 0
TCFO3 0 0
Total 5 1 20%
BACK
PERFORMANCE BY FIELD OFFICE
FO
2016 Target
ExcludedNOFO
Accomplishment 2016 Budget
Allocation
Budget Utilization
Actual % Signal Obligation % Signal
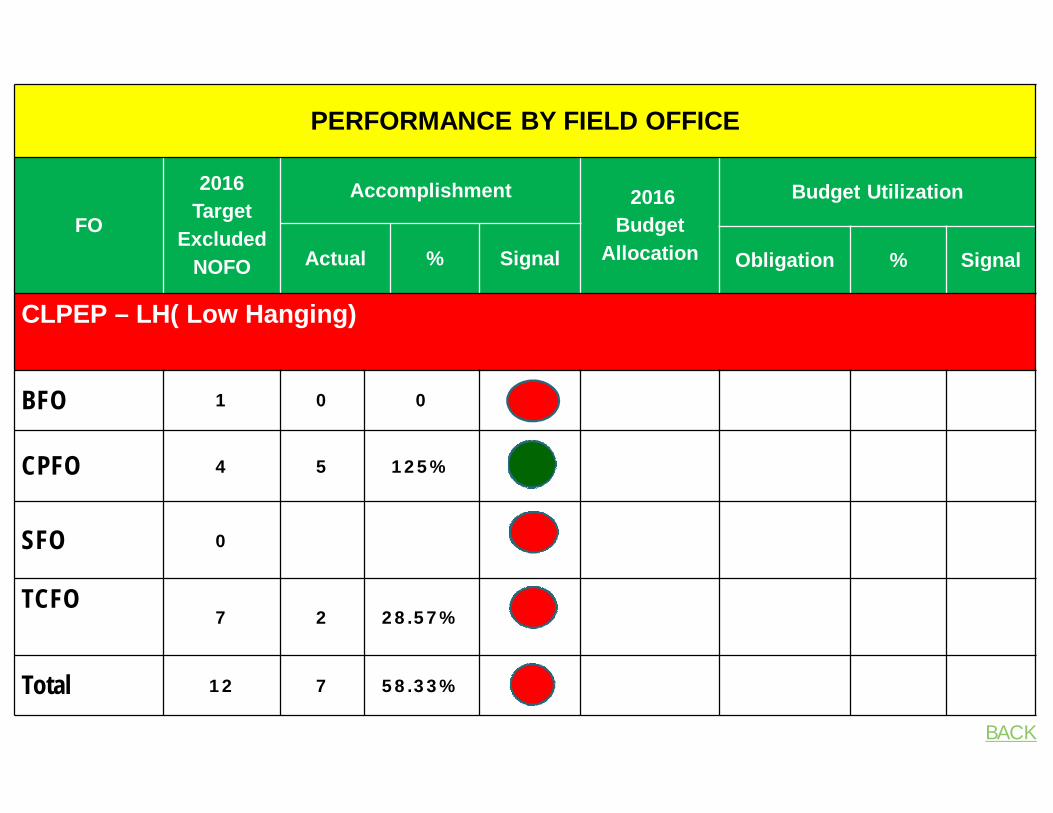
CLPEP – LH( Low Hanging)
BFO 1 0 0
CPFO 4 5 125%
SFO 0
TCFO7 2 28.57%
Total 12 7 58.33%
BACK
PERFORMANCE BY FIELD OFFICE
FO
2016 Target
ExcludedNOFO
Accomplishment2016 Budget Allocation
Budget Utilization
Actual % Signal Obligation % Signal
PESO Institutionalized 5
BFO 1 1 100%
CPFO 1 1 100%
SFO 1 0 0
TCFO1 0 0
Total 4 2 50%
BACK
PERFORMANCE BY FIELD OFFICE
FO 2016 Target
Accomplishment2016 Budget Allocation
Budget Utilization
Actual % Signal Obligation % Signal
PESO Trainings / Orientations19
BFO 4 14 350%
CPFO 4 6 150%
SFO 3 3 100%
TCFO 4 6 166.6%
Total 15 29 193.3%
BACK
FO
2016 Target
ExcludedNOFO
Accomplishment2016 Budget Allocation
Budget Utilization
Actual % Signal Obligation % Signal
Family Welfare Program (FWP) Establishments Serviced
BFO 9 9 100%
CPFO 22 28 127.27%
SFO 0
TCFO 97 63 64.95%
TSSD-EWW 54
Total 128 154 120.31%BACK
FO 2016 Target
Accomplishment 2016 Budget
Allocation
Budget Utilization
Actual % Signal Obligation % Signal
Family Welfare Program (FWP) Workers Serviced
BFO 1,800 6,536 360.22%
CPFO 4,400 3,948 89.72%
SFO
TCFO19,400 27,786 143.23%
TSSD-EWW 30,706
Total 25,600 68,976 269.44%
BACK
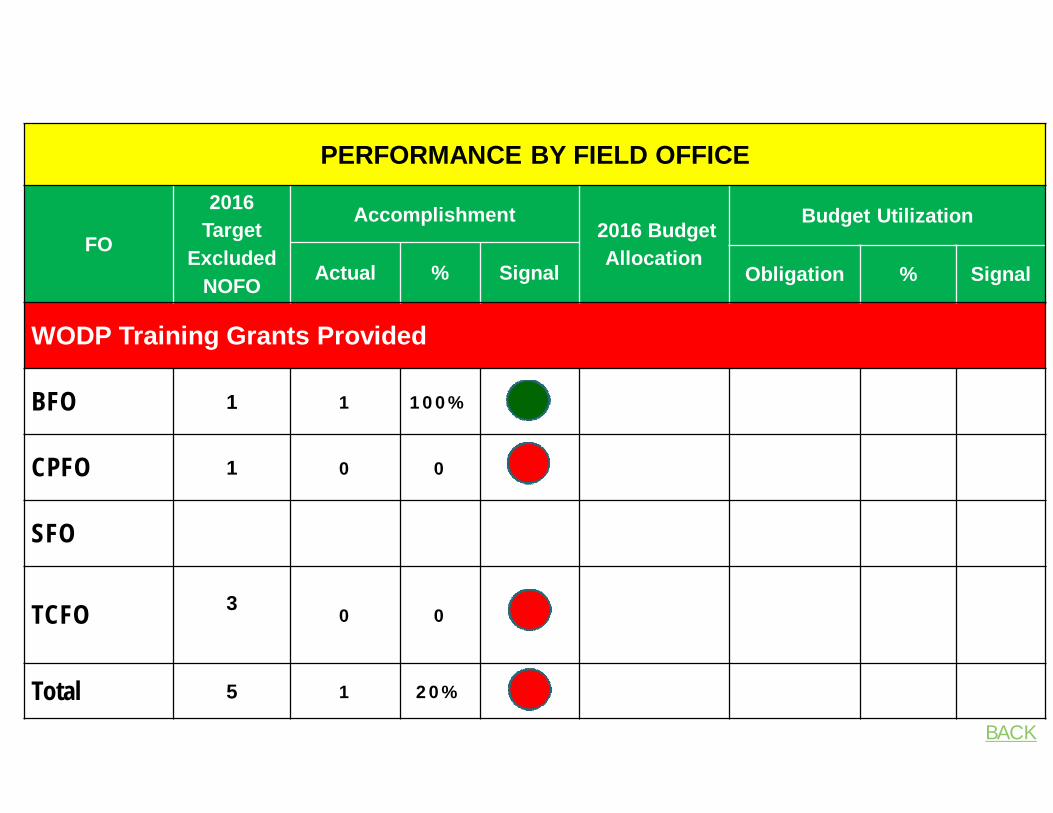
PERFORMANCE BY FIELD OFFICE
FO
2016 Target
Excluded NOFO
Accomplishment2016 Budget Allocation
Budget Utilization
Actual % Signal Obligation % Signal
WODP Training Grants Provided
BFO 1 1 100%
CPFO 1 0 0
SFO
TCFO 3 0 0
Total 5 1 20%
BACK
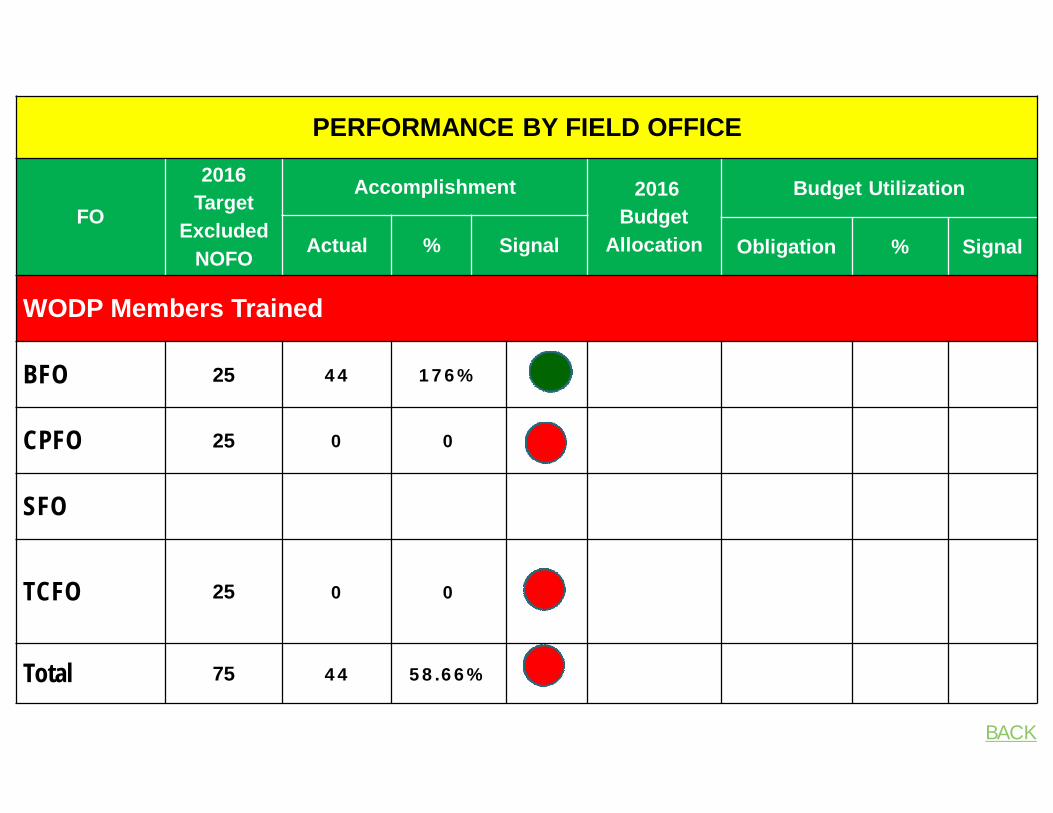
PERFORMANCE BY FIELD OFFICE
FO
2016 Target
Excluded NOFO
Accomplishment 2016 Budget
Allocation
Budget Utilization
Actual % Signal Obligation % Signal
WODP Members Trained
BFO 25 44 176%
CPFO 25 0 0
SFO
TCFO 25 0 0
Total 75 44 58.66%
BACK

“Wisdom is the sunlight of the soul”. German Proverb
PERFORMANCE BY FIELD OFFICE
FO
2016 Target
ExcludedNOFO
Accomplishment2016 Budget Allocation
Budget Utilization
Actual % Signal Obligation % Signal
LHP Seminars Conducted137
BFO 20 15 75%
CPFO 35 19 54.29%
SFO 4 19 475%
TCFO50 34 68.00%
Total 109 87 79.82%
BACK
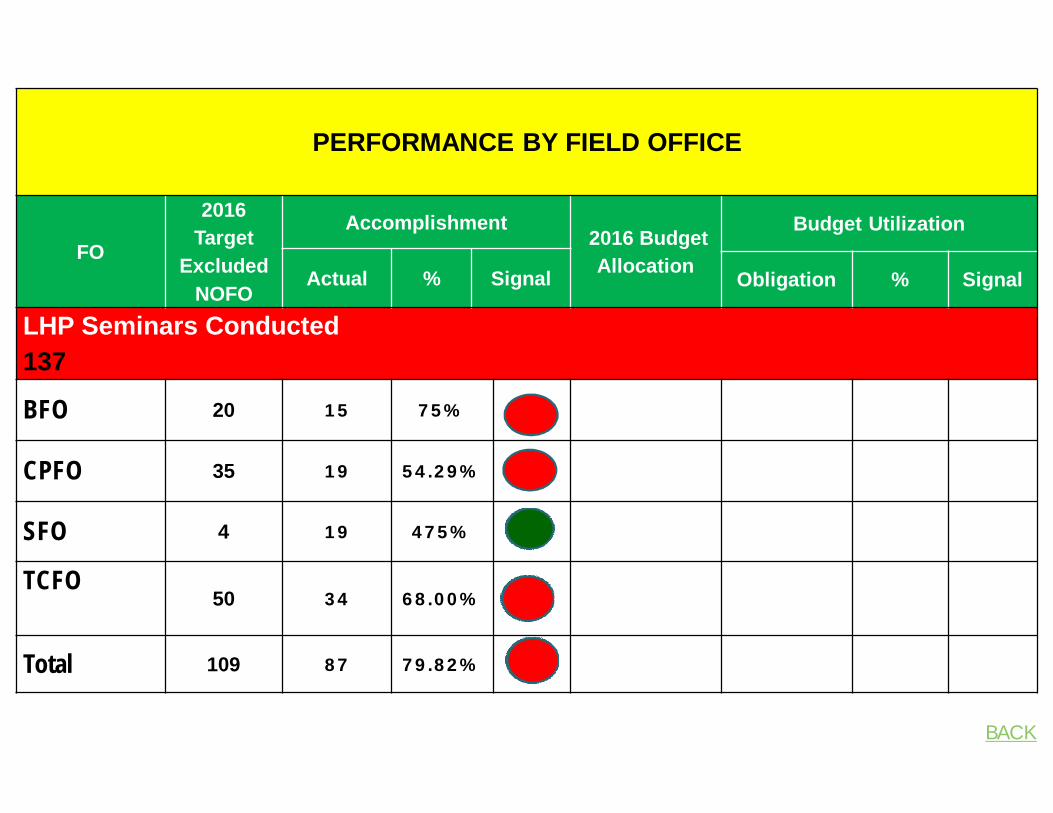
PERFORMANCE BY FIELD OFFICE
FO
2016 Target
ExcludedNOFO
Accomplishment2016 Budget Allocation
Budget Utilization
Actual % Signal Obligation % Signal
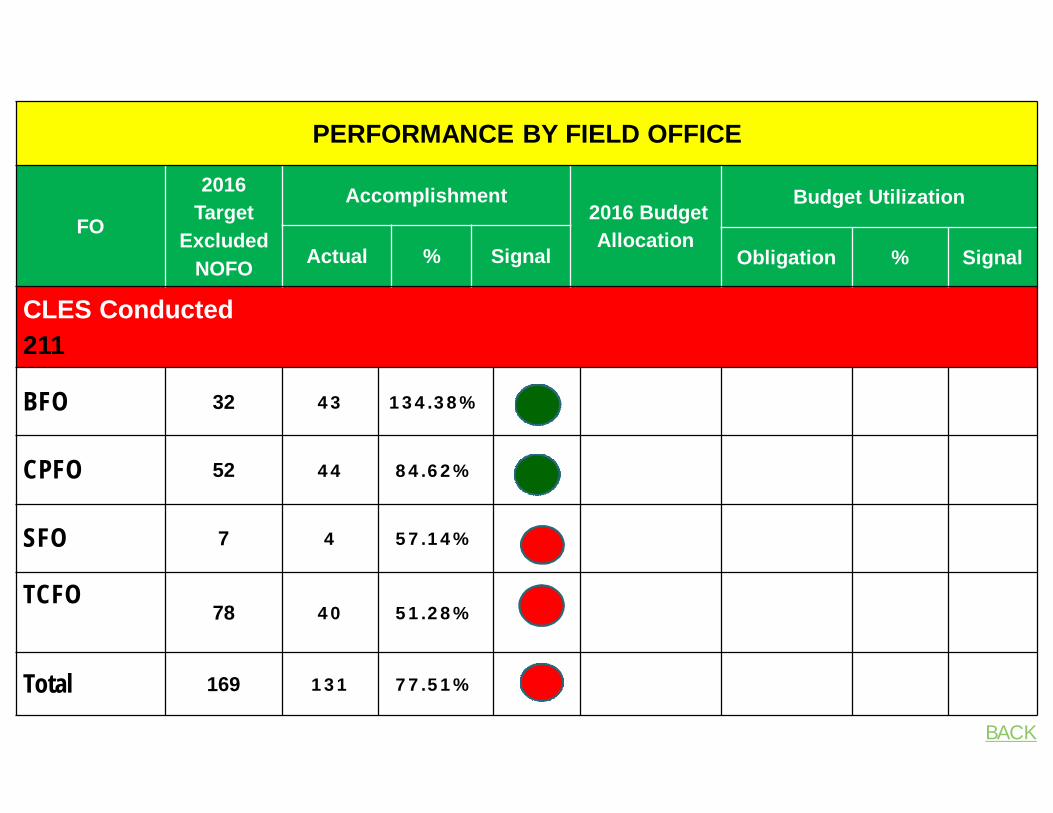
CLES Conducted211
BFO 32 43 134.38%
CPFO 52 44 84.62%
SFO 7 4 57.14%
TCFO78 40 51.28%
Total 169 131 77.51%
BACK
PERFORMANCE BY FIELD OFFICE
FO
2016 Target
Excluded NOFO
AccomplishmentSeminar/School
Budget Utilization
Actual % Signal Obligation % Signal
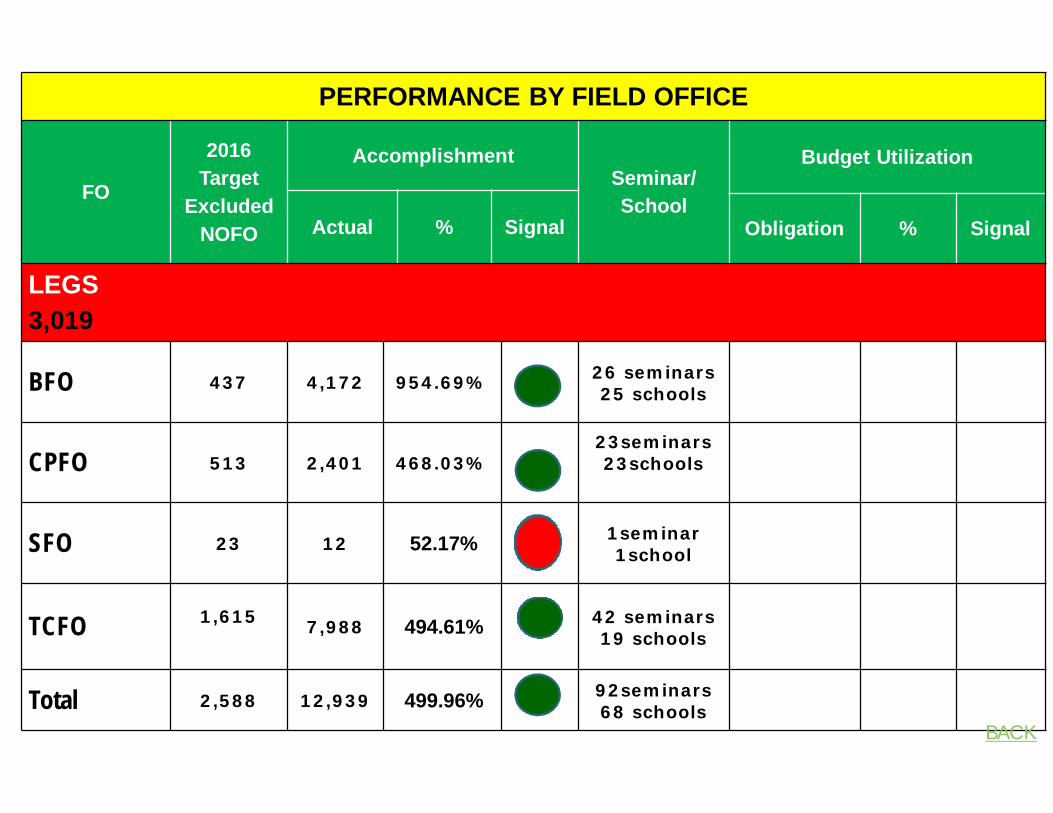
LEGS3,019
BFO 437 4,172 954.69% 26 seminars25 schools
CPFO 513 2,401 468.03%23seminars23schools
SFO 23 12 52.17% 1seminar1school
TCFO 1,615 7,988 494.61% 42 seminars19 schools
Total 2,588 12,939 499.96% 92seminars68 schools
BACK
PERFORMANCE BY FIELD OFFICE
FO
2016 Target
Excluded NOFO
Accomplishment2016 Budget Allocation
Budget Utilization
Actual % Signal Obligation % Signal
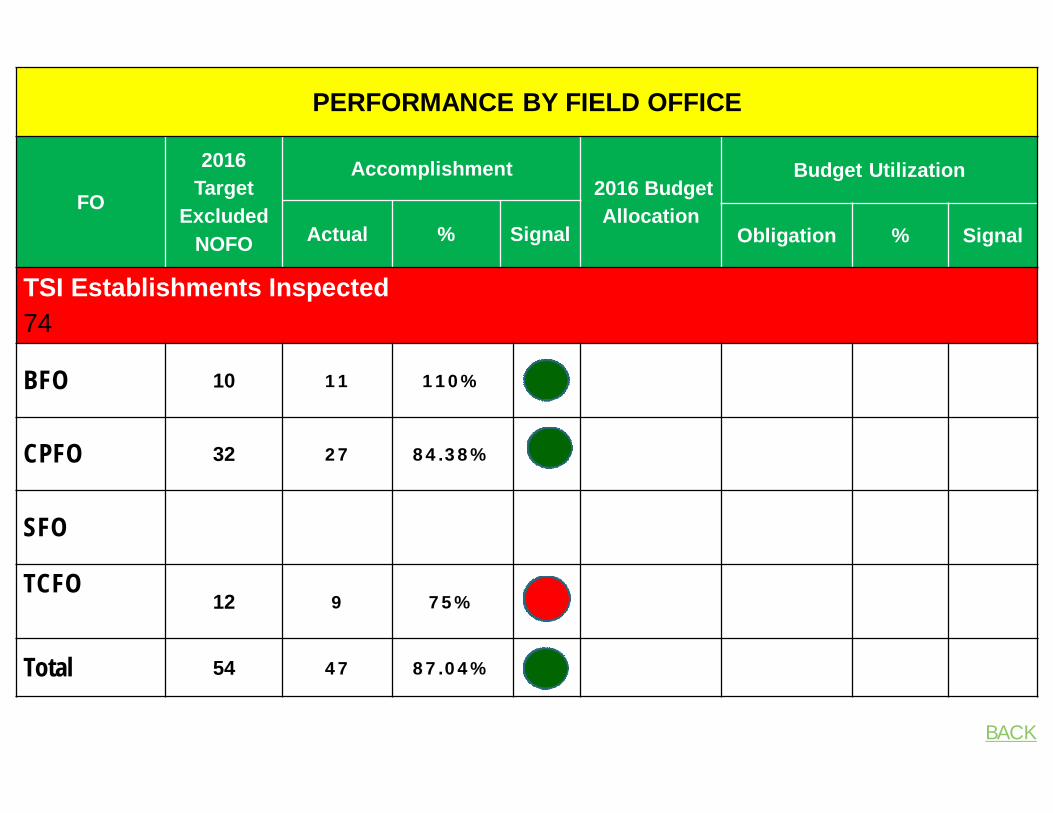
TSI Establishments Inspected74
BFO 10 11 110%
CPFO 32 27 84.38%
SFO
TCFO12 9 75%
Total 54 47 87.04%
BACK