Embed Size (px)
Citation preview

DOMESTIC OPEN MARKET OPERATIONS
DURING 2013
April 2014

DOMESTIC OPEN MARKET OPERATIONS DURING 2013
FEDERAL RESERVE BANK OF NEW YORK MARKETS GROUP
This report, presented to the Federal Open Market Committee by Simon Potter, Executive Vice President, Federal Reserve
Bank of New York, and Manager of the System Open Market Account, describes domestic open market operations of the
Federal Reserve System for the calendar year 2013. Samuel Cheun, J. Benson Durham, Melanie Huryn, and Deborah Leonard
were primarily responsible for preparation of the report.
OVERVIEW ..................................................................... 1
DOMESTIC OPEN MARKET OPERATIONS .................... 3
Domestic Securities Holdings ........................... 3
Characteristics of Portfolio Holdings ............ 4
SOMA Income and Federal
Reserve Remittances ...................................... 7
Income Projections ......................................... 8
Permanent Operations ................................... 11
Treasury Securities Operations .................... 11
Agency Mortgage-Backed
Securities Operations ................................... 15
Agency Debt Operations ............................. 19
Temporary Operations and Funding Markets ............................................................ 19
Money Market Operations ..........................19
Money Market Developments..................... 20
Operational Readiness and Flexibility ........... 21
Operating Tools ............................................ 21
Operational Capacity ................................... 24
THE SUPPLY OF RESERVES ........................................... 26
Reserve Balances ............................................. 26
Autonomous Factors ....................................... 26
Federal Reserve Notes.................................. 27
Treasury Balances ......................................... 27
Other Autonomous Factors ......................... 28
Additional Federal Reserve Activity Affecting Reserves .......................................... 28
Primary Credit Facility .................................. 28
Central Bank Liquidity Swaps ...................... 29
CONCLUDING OBSERVATIONS ................................. 30
APPENDIXES ................................................................. 31
Appendix 1: Authorization for Domestic Open Market Operations ............... 31
Appendix 2: Resolutions Authorizing Fixed-Rate, Overnight Reverse Repurchase Operations ................................... 33
Appendix 3: Guidelines for the Conduct of System Open Market Operations in Federal-Agency Issues ................................. 34
Appendix 4: Domestic Policy Directives Issued to the Federal Reserve Bank of New York..................................................... 35
Appendix 5: Federal Reserve Bank of New York Counterparties for Domestic Open Market Operations ............................... 39
ENDNOTES................................................................... 41
INDEX OF CHARTS AND TABLES ................................ 47
CONTENTS

FEDERAL RESERVE BANK OF NEW YORK 1 MARKETS GROUP
DOMESTIC OPEN MARKET OPERATIONS DURING 2013
The Federal Open Market Committee (FOMC)
continued to provide additional policy accommoda-
tion to support a stronger economic recovery in the
context of price stability in 2013. While maintaining
its target range for the federal funds rate at 0 to
¼ percent throughout the year, the FOMC supplied
accommodation through two tools: adjustments in
the size and composition of the Federal Reserve’s
balance sheet, and forward guidance on short-
term interest rates. Throughout the year, the FOMC
undertook additional purchases of $45 billion per
month of longer-term U.S. Treasury securities and
$40 billion per month of agency mortgage-backed
securities (MBS), while also continuing to reinvest
principal payments from agency debt and MBS in
MBS. These balance sheet actions were designed
to put downward pressure on longer-term interest
rates, to support mortgage markets, and to help fos-
ter more accommodative financial conditions. Addi-
tionally, throughout the year, the FOMC reaffirmed
its threshold-based forward guidance describing the
economic conditions under which it anticipated that
the current exceptionally low target range would
remain appropriate, and in December, made a quali-
tative modification to its rate guidance.
The FOMC’s balance sheet actions resulted in
cumulative additional purchases of $1,020 billion of
longer-term securities in 2013, boosting the total size
of the domestic securities portfolio of the System
Open Market Account (SOMA) to about $3.8 tril-
lion.1 The allocation of the portfolio’s holdings
between Treasury securities and non-Treasury securi-
ties changed little, on balance, over 2013. Because
the FOMC had sold nearly all of its shorter-dated
Treasury holdings during the Maturity Extension
Program (MEP) in late 2011 and 2012, the maturity
distribution of Treasury security holdings remained
weighted toward longer-term securities; meanwhile,
the coupon composition of the agency MBS portfo-
lio shifted lower compared with year-ago levels.
The execution of the FOMC’s policy directives
required the conduct of extensive permanent open
market operations throughout the year by the
Open Market Trading Desk (the Desk) at the Federal
Reserve Bank of New York (New York Fed). In carry-
ing out the operations, the Desk closely monitored
market conditions. Market functioning indicators
suggested no significant adverse effects from the
Desk’s activity; markets appeared to absorb the vol-
ume of the Desk’s asset purchases without disrup-
tion. Nevertheless, financial markets experienced
an unexpectedly sharp rise in longer-term interest
rates and volatility in the late spring and through-
out the summer in part as investors reportedly per-
ceived communications from Federal Reserve offi-
cials as signaling a somewhat earlier withdrawal of
policy accommodation than previously expected.
This rise in interest rates prompted the SOMA
domestic securities portfolio’s unrealized gains to
drop to a loss position. The sensitivity of the market
value of the portfolio to interest rate movements
is in part a reflection of the interest rate risk that
the Federal Reserve has moved onto its balance
sheet and away from private investors—a key chan-
nel through which its asset purchase programs are
OvERvIEw

FEDERAL RESERVE BANK OF NEW YORK 2 MARKETS GROUP
DOMESTIC OPEN MARKET OPERATIONS DURING 2013
believed to provide policy accommodation. More-
over, absent any actual sales of assets from the Fed-
eral Reserve’s portfolio, unrealized gains and losses
have no effect on the portfolio’s income or the
Federal Reserve’s remittances to the U.S. Treasury
Department. In fact, the large size of the SOMA
portfolio, its considerable holdings of longer-term
securities, and the low interest rates paid on the
Federal Reserve’s interest-bearing liabilities contin-
ued to generate high portfolio net income, which
totaled $84 billion in 2013. Of course, changes in
the size and composition of the portfolio were
intended to promote the FOMC’s monetary policy
objectives of maximum employment and price sta-
bility, not to produce a financial return.
A projection exercise illustrates how the portfo-
lio’s net income is expected to decline from the ele-
vated levels of recent years as interest rates eventu-
ally rise and the stance of policy and the size of the
portfolio are normalized. However, based on cur-
rent survey-based expectations for the paths of the
portfolio and interest rates, as well as discussions by
the FOMC in June 2013 suggesting that agency MBS
sales during the normalization process are unlikely,
SOMA net income is projected to remain higher
than pre-crisis levels, on average, through 2025 in
the current baseline projection and many alterna-
tive scenarios.
In line with the substantial increase in the size of
the SOMA portfolio, reserve balances increased to
$2.5 trillion—a historical high—at the end of 2013.
During the year, elevated reserve balances and the
interest rate paid on excess reserves kept the effec-
tive federal funds rate within its target range, with
no need for the Desk to conduct temporary open
market operations. Although the current operat-
ing framework for monetary policy meant that
the Desk did not actively manage the supply of
reserves in 2013, as a matter of prudent planning,
it continued to test and develop a range of tools
that the FOMC could consider for managing short-
term interest rates or providing additional liquid-
ity to meet potential future policy objectives. Of
note, in September, the Desk initiated a technical
exercise to explore the use of overnight, fixed-rate
reverse repurchase agreements (reverse repos, or
RRPs) with same-day settlement as a possible tool
for strengthening the FOMC’s ability to keep short-
term interest rates at levels it deems appropriate to
achieving its macroeconomic objectives.
This report summarizes characteristics of the
domestic securities portfolio and how they changed
in 2013, including projections about the possible
evolution of the portfolio’s net income under a
range of illustrative scenarios. It then describes the
Desk’s domestic open market operations in 2013,
outlines the policies governing those actions, and
discusses an array of recent initiatives related to the
Desk’s operating systems, arrangements, and tools
that have enhanced its technical efficiency, flexibil-
ity, and resiliency. The report also discusses devel-
opments in overnight funding markets and factors
that affect the level of reserve balances.2 Underly-
ing data for the charts in this report are provided
on the New York Fed’s website.3

FEDERAL RESERVE BANK OF NEW YORK 3 MARKETS GROUP
DOMESTIC OPEN MARKET OPERATIONS DURING 2013
DOMESTIC OPEN MARKET OPERATIONS
The FOMC authorizes and directs the New York Fed
to conduct permanent and temporary operations,
as necessary, to implement its domestic policy direc-
tives (Appendixes 1-4). The Desk conducts these
operations in the open market with a range of
counterparties (Appendix 5). The domestic SOMA
includes dollar-denominated assets and liabilities
acquired through open market operations in the
course of implementing monetary policy directives.
Domestic securities HolDings
From the beginning of January 2013, the FOMC
directed the Desk to purchase U.S. Treasury securities
and agency MBS at a pace of $45 billion and $40 bil-
lion per month, respectively, and reaffirmed that pace
of purchases throughout the year.4 As a result, the
total level of SOMA holdings of domestic securities
increased steadily over the course of the year, from
almost $2.8 trillion to about $3.8 trillion (Chart 1). The
mix of Treasury and non-Treasury assets in the portfo-
lio was relatively constant after a modest shift in com-
position toward agency MBS in 2012.
The Desk’s purchases of Treasury securities and
agency MBS were designed to advance the Commit-
tee’s objectives in part by moving some of the risks
that would otherwise have been borne by private
investors onto the Federal Reserve’s balance sheet.5
In doing so, these actions help to make broader
financial conditions more accommodative and hence
promote a stronger economic recovery and help to
ensure that inflation is consistent with the FOMC’s
dual mandate over time. The sizeable amount and
relatively long duration of Treasury holdings in the
SOMA securities portfolio should, by removing dura-
tion risk from the market, maintain downward pres-
sure on longer-term interest rates and reduce private
sector borrowing costs relative to levels that would
otherwise prevail. The large amount of agency MBS
holdings also removes duration risk from the mar-
ket, as well as the prepayment risk associated with
the uncertain timing of principal cash flows, given
the fact that homeowners can prepay their mort-
gages at any time. Consequently, SOMA purchases
of agency MBS should also contribute to downward
pressure on long-term rates and, all else equal, lower
MBS rates, thereby helping to reduce primary mort-
gage rates, ease broader financial conditions, and
ultimately stimulate demand for housing.6
Chart 1 SIZE AND COMPOSITION OF SOMA DOMESTICSECURITIES HOLDINGS
Billions of U.S. dollars
Source: Federal Reserve Bank of New York.
Notes: Figures are weekly averages of daily �gures. They includeunsettled holdings.
0
500
1,000
1,500
2,000
2,500
3,000
3,500
4,000
Agency MBS
Agency debt
Treasury securities
20132012201120102009
FEDERAL RESERVE BANK OF NEW YORK 4 MARKETS GROUP
DOMESTIC OPEN MARKET OPERATIONS DURING 2013
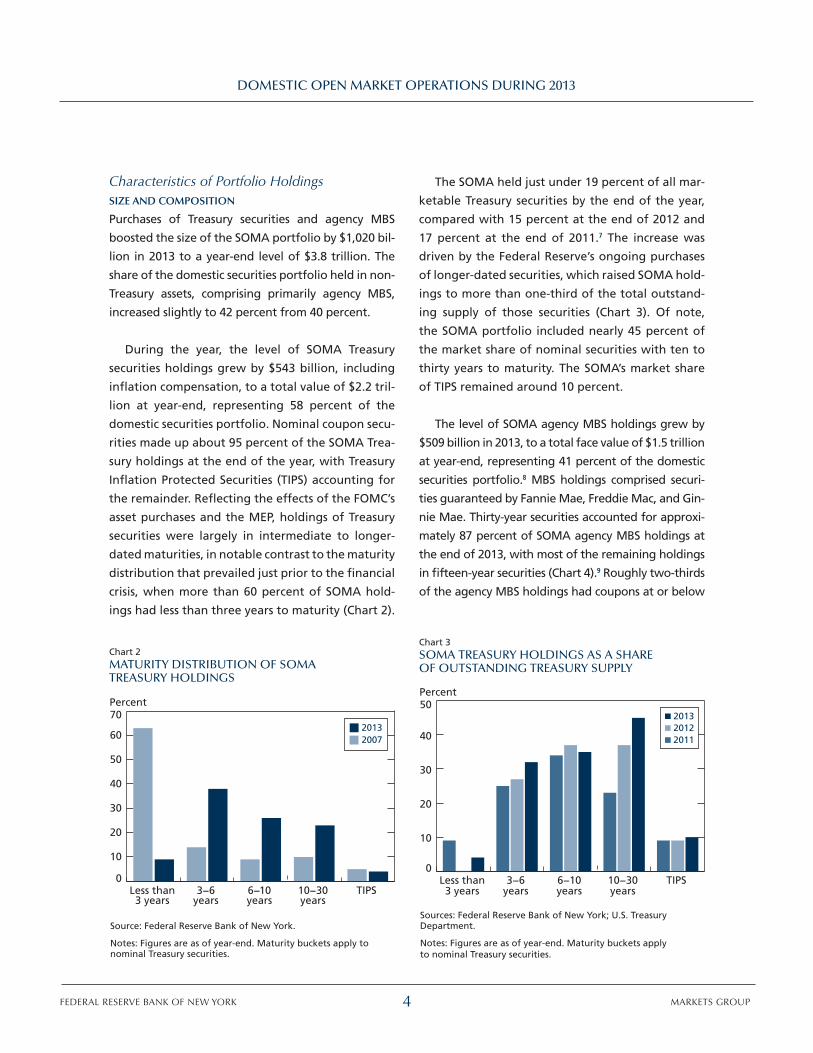
Characteristics of Portfolio HoldingsSIZE AND COMPOSITION
Purchases of Treasury securities and agency MBS
boosted the size of the SOMA portfolio by $1,020 bil-
lion in 2013 to a year-end level of $3.8 trillion. The
share of the domestic securities portfolio held in non-
Treasury assets, comprising primarily agency MBS,
increased slightly to 42 percent from 40 percent.
During the year, the level of SOMA Treasury
securities holdings grew by $543 billion, including
inflation compensation, to a total value of $2.2 tril-
lion at year-end, representing 58 percent of the
domestic securities portfolio. Nominal coupon secu-
rities made up about 95 percent of the SOMA Trea-
sury holdings at the end of the year, with Treasury
Inflation Protected Securities (TIPS) accounting for
the remainder. Reflecting the effects of the FOMC’s
asset purchases and the MEP, holdings of Treasury
securities were largely in intermediate to longer-
dated maturities, in notable contrast to the maturity
distribution that prevailed just prior to the financial
crisis, when more than 60 percent of SOMA hold-
ings had less than three years to maturity (Chart 2).
The SOMA held just under 19 percent of all mar-
ketable Treasury securities by the end of the year,
compared with 15 percent at the end of 2012 and
17 percent at the end of 2011.7 The increase was
driven by the Federal Reserve’s ongoing purchases
of longer-dated securities, which raised SOMA hold-
ings to more than one-third of the total outstand-
ing supply of those securities (Chart 3). Of note,
the SOMA portfolio included nearly 45 percent of
the market share of nominal securities with ten to
thirty years to maturity. The SOMA’s market share
of TIPS remained around 10 percent.
The level of SOMA agency MBS holdings grew by
$509 billion in 2013, to a total face value of $1.5 trillion
at year-end, representing 41 percent of the domestic
securities portfolio.8 MBS holdings comprised securi-
ties guaranteed by Fannie Mae, Freddie Mac, and Gin-
nie Mae. Thirty-year securities accounted for approxi-
mately 87 percent of SOMA agency MBS holdings at
the end of 2013, with most of the remaining holdings
in fifteen-year securities (Chart 4).9 Roughly two-thirds
of the agency MBS holdings had coupons at or below
Chart 2 MATURITY DISTRIBUTION OF SOMATREASURY HOLDINGS
Percent
Source: Federal Reserve Bank of New York.
Notes: Figures are as of year-end. Maturity buckets apply tonominal Treasury securities.
0
10
20
30
40
50
60
7020132007
TIPS10−30years
6−10years
3−6years
Less than3 years
Chart 3 SOMA TREASURY HOLDINGS AS A SHAREOF OUTSTANDING TREASURY SUPPLY
Percent
Sources: Federal Reserve Bank of New York; U.S. TreasuryDepartment.
Notes: Figures are as of year-end. Maturity buckets applyto nominal Treasury securities.
0
10
20
30
40
50201320122011
TIPS10−30years
6−10years
3−6years
Less than3 years

FEDERAL RESERVE BANK OF NEW YORK 5 MARKETS GROUP
DOMESTIC OPEN MARKET OPERATIONS DURING 2013
3.5 percent, as the coupon distribution of portfolio
holdings continued to shift lower compared with the
distribution in the prior two years (Chart 5). In total,
at the end of 2013, the SOMA held approximately
28 percent of outstanding fixed-rate agency MBS, up
from 19 percent at the end of 2012.
The level of SOMA agency debt holdings fell by
$20 billion in 2013, to a total face value of $57 billion
at year-end as the Desk reinvested maturing pro-
ceeds into agency MBS. At that level, holdings of
direct obligations of Fannie Mae, Freddie Mac, and
the Federal Home Loan Banks represented about
2 percent of the domestic securities portfolio. All
but approximately $2 billion of the agency debt
portfolio were in securities with less than five years
left to maturity (Chart 6).
Chart 4 DISTRIBUTION OF SOMA AGENCY MBS HOLDINGS
Percent
Source: Federal Reserve Bank of New York.
Notes: Figures are as of December 31, 2013. Holdings total $1,490 billion, and consist of settled holdings only.
1Less than 1% of holdings are 10- and 20-year agency MBS, which may be delivered into 15- and 30-year TBA contracts, respectively.
Fannie Mae Freddie Mac Ginnie Mae
30-year 15-year
≤ 2.5% 3.0% 3.5% 4.0% ≥ 4.5%
Pre-2009
2009 2010 2011 2012 2013
0 20 40 60 80 100
Vintage
Coupon
Term1
Issuer
Chart 5 COUPON DISTRIBUTION OF SOMA AGENCYMBS HOLDINGS
Billions of U.S. dollars
Coupon (percent)
Source: Federal Reserve Bank of New York.
Note: Figures are as of year-end.
0
100
200
300
400
500
600201320122011
6.56.05.55.04.54.03.53.02.52.0
Chart 6 MATURITY DISTRIBUTION OF SOMA AGENCYDEBT HOLDINGS
Billions of U.S. dollars
Source: Federal Reserve Bank of New York.
Note: Figures are as of December 31, 2013.
0
10
20
30
40
More than10 years
5−10years
1−5years
3 months−1 year
Less than3 months

FEDERAL RESERVE BANK OF NEW YORK 6 MARKETS GROUP
DOMESTIC OPEN MARKET OPERATIONS DURING 2013
Duration
The SOMA portfolio’s duration, which captures the
weighted average term to maturity of the cash flows
from the portfolio or, alternatively, the portfolio’s
sensitivity to interest rate changes, edged up from
6.3 years to 6.8 years over the course of 2013, driven
by a notable increase in the effective duration of the
agency MBS portfolio (Chart 7).10 The effective dura-
tion of the agency MBS portfolio nearly doubled in
2013, from 2.9 to around 5.7 years, reflecting two
developments.11 First, the notable rise in interest
rates during 2013 lowered borrowers’ incentives to
refinance their mortgages and thereby lengthened
the period of time over which investors receive the
principal cash flows of agency MBS. Second, through-
out 2013, the Desk continued to purchase and to
reinvest in relatively low-coupon MBS, which are less
likely to prepay in the future and will thereby extend
the portfolio’s duration.
Meanwhile, the duration of the Treasury port-
folio declined from 8.2 years to 7.6 years as the
routine aging of the existing portfolio outweighed
the addition of relatively long-duration Treasury
securities to the portfolio from new purchases.12 It
is notable that the average duration of the Trea-
sury portfolio remains more than twice that of the
remainder of Treasury debt outstanding (Chart 8).
Moreover, the average duration of the Treasury
securities held by the private sector edged lower
even as the average duration of the total outstand-
ing Treasury supply largely remained constant, con-
sistent in part with the notion that SOMA purchases
remove duration from the market.
Another gauge of the degree to which the
growing SOMA portfolio supported the Commit-
tee’s directive to provide additional accommodation
is the ten-year-equivalent measure of the portfolio.
This dollar-weighted duration measure in effect
incorporates both the size and the average duration
of aggregate holdings and illustrates the amount of
ten-year Treasury notes that an investor would have
to hold to be exposed to the same degree of overall
interest rate risk in the SOMA portfolio. Although
the SOMA portfolio’s total weighted average dura-
tion increased only modestly in 2013, its ten-year-
equivalent measure continued to rise, reaching an
equivalent of $3.0 trillion by the end of 2013, from
about $1.9 at the start of the year (Chart 9). The
Chart 7AVERAGE DURATION OF SOMA HOLDINGS
Years
Source: Federal Reserve Bank of New York.
Note: Figures are monthly.
01
2
3
4
5
6
7
89
Agency MBS
Agency debt
Treasury securities
Total SOMA
20132012201120102009
Treasuries outstanding (ex-SOMA) 0
500
1,000
1,500
2,000
2,500
Chart 8 SOMA TREASURY HOLDINGS ANDTREASURY DURATION
Duration in years Billions of U.S. dollars
Sources: Federal Reserve Bank of New York; U.S. TreasuryDepartment.
Note: Figures are monthly.
0
2
4
6
8
10
Treasuries outstanding (ex-SOMA)
Treasuriesoutstanding (total)
SOMA Treasury portfolio
20132012201120102009
SOMA Treasuryholdings

FEDERAL RESERVE BANK OF NEW YORK 7 MARKETS GROUP
DOMESTIC OPEN MARKET OPERATIONS DURING 2013
increase stemmed not only from increases in the
size and duration of agency MBS holdings but also
from the increase in the level of holdings of Treasury
securities, even though the weighted average dura-
tion of Treasury holdings declined over the year.13
SOMA Income and Federal Reserve Remittances
The FOMC’s directives in recent years to alter the
size and composition of the SOMA portfolio have
aimed to promote its dual mandate to foster maxi-
mum employment and price stability; thus, portfolio
changes have been motivated by monetary policy
objectives rather than profit. Nevertheless, as has
been the case in recent years, the large size of the
portfolio, its concentration in longer-term securities,
and the current low interest rates paid on interest-
bearing liabilities have continued to generate sig-
nificant portfolio income and large remittances
to the Treasury. In 2013, total SOMA income was
$89 billion, derived primarily from interest income
on its domestic securities holdings (Chart 10).14,15
SOMA net income takes into account the costs of
funding the portfolio, namely the interest paid on
reserve balance liabilities created by SOMA assets in
amounts in excess of Federal Reserve notes outstand-
ing.16 Those reserve balance liabilities have grown
with the ongoing expansion of the SOMA portfo-
lio and, in 2013, generated more than $5 billion of
interest expense. On balance, the SOMA portfolio’s
net income of $84 billion for the year remained high.
Overall, this figure represents a decline in SOMA
net income compared with 2012, when realized
capital gains from sales of shorter-dated Treasury
securities under the MEP further boosted the SOMA
portfolio’s income. With no sales of assets from the
SOMA portfolio in 2013, there were no such realized
gains. However, unrealized gains, defined as the dif-
ference between the market value of the portfolio
and its accounting or book value (which reflects
amortized cost), dropped to an unrealized loss of
$53 billion at the end of 2013, down from $215 bil-
lion at the end of 2012. Unrealized gains reached a
2013 month-end peak of $221 billion in April amid
declines in longer-term interest rates that were
driven by a deterioration in global economic data
and market expectations for global monetary policy
to remain accommodative. From late spring through
Chart 9 SOMA PORTFOLIO IN TEN-YEAR EQUIVALENTS
Billions of U.S. dollars
Source: Federal Reserve Bank of New York.
Note: Figures are monthly.
0
500
1,000
1,500
2,000
2,500
3,000
AgencyMBS
Agency debt
Treasurysecurities
Total SOMA
20132012201120102009
Chart 10 SOMA NET INCOME AND FEDERAL RESERVEREMITTANCES TO TREASURY
Billions of U.S. dollars
Source: Federal Reserve Bank of New York.
0
20
40
60
80
100
RemittancesSOMA net income
13121110090807060504032002

FEDERAL RESERVE BANK OF NEW YORK 8 MARKETS GROUP
DOMESTIC OPEN MARKET OPERATIONS DURING 2013
the summer, however, interest rates rose, in part as
investors perceived Fed communication as signaling
a somewhat earlier-than-expected withdrawal of
policy accommodation. The rise in longer-term rates
consequently reduced the market value of securi-
ties held in the SOMA portfolio. Carrying unrealized
losses is not unprecedented for the portfolio.17 More-
over, the portfolio’s sensitivity to interest rate move-
ments is indeed to a large extent a predictable result
of the FOMC’s large-scale asset purchases, which in
part are intended to absorb interest rate risk from
the market. Unless the Federal Reserve sells assets
from its portfolio, unrealized gains or losses have
no direct impact on actual SOMA income or Federal
Reserve remittances to the Treasury Department.
Primarily as a result of net income from the
domestic SOMA portfolio, Federal Reserve remit-
tances to the Treasury were almost $78 billion in
2013, high by historical standards but down from
more than $88 billion in 2012.18 On a cumula-
tive basis, remittances from 2008 to 2013 totaled
$400 billion, about $250 billion more than the
cumulative amount suggested by the average
pre-crisis pace of about $25 billion per year, and a
reflection of elevated portfolio income associated
with policy measures taken to respond to the crisis
and to strengthen the recovery.
Income ProjectionsAlthough SOMA net income has been elevated in
recent years, it is likely to decline from its unusu-
ally high levels when the stance of monetary pol-
icy is eventually normalized and interest rates rise
in keeping with the evolving economic outlook.
Even so, average levels of income are expected to
be close to or higher than pre-crisis averages. The
actual path of future income will ultimately be
determined by a number of factors, some within
the control of the Federal Reserve and others not.
A projection exercise based on publicly available
financial forecasts and expectations for policy, as
well as the FOMC’s communications about its antici-
pated approach to policy normalization, illustrates
the sensitivity of the portfolio’s income profile to
changes in some of these factors.19
In the baseline scenario that follows, the assumed
paths of the target federal funds rate and longer-
term interest rates were taken from the “Survey of
Primary Dealers” conducted by the Desk before the
January 2014 FOMC meeting.20 The survey’s results
show median dealer expectations for the federal
funds target rate beginning to rise from the cur-
rent range in the fourth quarter of 2015 and reach-
ing a level of 4 percent over the long run. Median
expectations are for the ten-year Treasury yield and
the thirty-year fixed primary mortgage rate to rise
gradually to almost 5 percent and slightly more
than 6 percent, respectively, by the end of 2018.
The projected evolution of the SOMA portfolio
starts with actual holdings as of December 31, 2013,
plus assumptions about additional asset purchases
drawn from the Desk’s January 2014 “Survey of
Primary Dealers.” Survey results suggest a median
expectation for roughly $450 billion in additional
asset purchases in 2014, comprising $250 billion of
Treasury securities and $200 billion of agency MBS.
The pace of purchases in each asset class is expected
to decline by $5 billion after each FOMC meeting
starting in January 2014, with purchases ending alto-
gether at the end of October 2014. The portfolio is
then assumed to evolve in a manner consistent with
the discussion of guidelines for policy normalization
at the June 2013 FOMC meeting. That meeting’s
minutes indicate that participants viewed the broad
exit principles set out in June 2011 as still applicable,
but that most participants now anticipated that the
Committee would not sell agency MBS securities as
part of the normalization process.21 For the purpose
of these projections, portfolio normalization steps
are assumed to begin with the FOMC ceasing to

FEDERAL RESERVE BANK OF NEW YORK 9 MARKETS GROUP
DOMESTIC OPEN MARKET OPERATIONS DURING 2013
reinvest payments of principal on the SOMA’s securi-
ties holdings two quarters prior to the first increase
in the federal funds target rate. For simplicity, no
explicit assumption is made about the use of liabil-
ity management tools, and reserve balances are
assumed to return to their pre-crisis levels.
Based on these assumptions, the size of the
SOMA portfolio is projected to grow from its year-
end 2013 level to a peak of about $4.2 trillion in
late 2014. Portfolio balances would remain rela-
tively unchanged through early 2015, as principal
payments from portfolio holdings continued to be
reinvested according to the current policy directives,
before then declining steadily for more than seven
years during the normalization period. Reserve bal-
ances peak at $3.0 trillion at the end of 2014 before
gradually declining in line with the passive wind-
down of the portfolio. The size of the portfolio
normalizes in early 2022. At that point, purchases
of Treasury securities resume in order to offset the
ongoing runoff of agency debt and MBS holdings
and to support normal balance sheet growth. By the
end of the projection period in 2025, the portfolio
composition is estimated to be 70 percent Treasury
securities and 30 percent agency MBS.
Under this baseline scenario, SOMA net income
is projected to remain at historically elevated lev-
els through 2015, boosted by interest income from
the large size of the domestic securities portfolio
(Chart 11). However, as interest rates rise and SOMA
portfolio holdings decline during the normalization
process, SOMA net income is projected to fall begin-
ning in 2016, reaching a trough of about $30 billion
in 2018, a level roughly in line with pre-crisis averages.
The declines are driven by rising interest rates, which
require higher interest payments on reserve balances.
Although the impact of this interest expense dimin-
ishes over time as the level of reserves shrinks, inter-
est income also declines as the size of the portfolio
returns to lower levels. As the size of the portfolio
normalizes and purchases of Treasury securities even-
tually resume in a higher interest rate environment,
SOMA net income is projected to rebound from
this trough. Rising interest rates during the nor-
malization process are also expected to amplify the
portfolio’s unrealized losses, which are sensitive to
interest rate changes, but unrealized losses steadily
shrink as holdings of securities purchased during
the low-rate environment, particularly agency MBS
holdings, decline. Nevertheless, even if unrealized
losses become large, they will affect income only if
and when assets are sold from the portfolio.
Because the baseline scenario in Domestic Open
Market Operations during 2012, last year’s annual
report, assumed that agency MBS would be sold dur-
ing the normalization process, it is not comparable
to the current baseline scenario. However, last year’s
report also presented, as part of its sensitivity analysis,
a “buy-and-hold” portfolio strategy in which assets
were not sold. The new baseline scenario, which also
assumes that assets are not sold during normalization,
exhibits contours for SOMA net income that are gen-
erally similar to those in the buy-and-hold strategy
Chart 11 PROJECTED SOMA NET INCOME:BASELINE VS. 2012 BUY-AND-HOLD STRATEGY
Billions of U.S. dollars
Source: Federal Reserve Bank of New York.
Notes: Figures for 2010-13 (shaded area) are realized returns for thecurrent baseline. Projected �gures are rounded.
0
20
40
60
80
100
120
2012 buy-and-holdstrategy
Currentbaseline
2524232221201918171615141312112010

FEDERAL RESERVE BANK OF NEW YORK 10 MARKETS GROUP
DOMESTIC OPEN MARKET OPERATIONS DURING 2013
from last year’s report. However, the current baseline
is projected to generate higher SOMA net income
in the near to medium term because of changes in
several underlying assumptions: first, a larger and
longer-lasting purchase program that results in a
larger portfolio; and second, a longer reinvestment
period associated with a later liftoff of the federal
funds target rate. As in the 2012 buy-and-hold sce-
nario, net income is then expected to fall as fund-
ing costs increase. However, it rebounds at a slightly
slower pace from its trough, as the larger size of the
portfolio prolongs normalization and the resumption
of Treasury purchases by more than a year.22
To demonstrate the sensitivity of the projections
to changes in other underlying assumptions, pro-
files for SOMA net income are also projected under
a set of alternative scenarios. One set of alterna-
tive projections considers the sensitivity to interest
rate changes (Chart 12).23 A higher-rate scenario
incurs a sharper reduction in net income through
the normalization period, driven by higher interest
expense relative to the baseline. After normaliza-
tion, however, net income is projected to be higher
than it is in the baseline because Treasuries are pur-
chased at higher yields in the future steady state. In
contrast, a lower-rate scenario sees a more muted
decline in net income during the normalization
period, but net income grows at a slower pace after
normalization is complete.
The composition of liabilities on the Federal
Reserve’s balance sheet can also alter portfolio and
income projection results.24 Currency is particularly
important, as the Federal Reserve pays zero inter-
est on it, and its level affects the level of reserves.25
Compared with the baseline, a slower pace of cur-
rency growth causes a higher level of projected
reserve balances; this in turn increases interest
costs, pushes out the portfolio normalization date,
and results in lower portfolio net income over the
projection period (Chart 13). The reverse holds for
a faster pace of currency growth, in which the level
of reserves is lower relative to the baseline projec-
tion; in this case, interest costs decline, the portfo-
lio normalizes earlier, and portfolio net income is
higher over the projection period.
Chart 12 PROJECTED SOMA NET INCOME:ALTERNATIVE INTEREST RATE PATHS
Billions of U.S. dollars
Source: Federal Reserve Bank of New York.
Notes: Figures for 2010-13 (shaded area) are realized returns.Projected �gures are rounded. Higher- and lower-rate scenariosuse baseline interest rates plus or minus 100 basis points.
0
20
40
60
80
100
120
Higher rates
Lower rates
Baseline
2524232221201918171615141312112010
Chart 13 PROJECTED SOMA NET INCOME:ALTERNATIVE CURRENCY GROWTH SCENARIOS
Billions of U.S. dollars
Source: Federal Reserve Bank of New York.
Notes: Figures for 2010-13 (shaded area) are realized returns.Projected �gures are rounded. Higher and lower currency growthscenarios use baseline annualized growth rates plus or minus3 percentage points.
0
20
40
60
80
100
120Higher currency
growth
Lower currencygrowth
Baseline
2524232221201918171615141312112010

FEDERAL RESERVE BANK OF NEW YORK 11 MARKETS GROUP
DOMESTIC OPEN MARKET OPERATIONS DURING 2013
These projections are, of course, merely illustrative.
Actual future income will be influenced by a number
of factors, including the total size of the asset pur-
chase program, which depends on the evolution of the
economy and the FOMC’s evaluation of the purchase
program’s efficacy and costs, as well as other balance
sheet, interest rate, and economic developments. It is
important to reiterate that the high income that the
SOMA portfolio has generated in recent years reflects
the FOMC’s unprecedented efforts to promote its stat-
utory dual mandate in the face of an exceptional finan-
cial crisis and subsequent tepid economic recovery. As
these projections suggest, annual SOMA net income
is likely to decline noticeably as the outlook for the
economy and monetary policy normalizes. However,
on a cumulative basis, net income earned from the
Federal Reserve’s balance sheet policies is very likely
to remain quite high over the projection period, with
SOMA net income exceeding pre-crisis levels, even
under many alternative scenarios. Moreover, cumu-
lative net income over the entire projection period is
expected to be significantly higher than it would have
been had large-scale asset purchases not been con-
ducted.26 A temporary reduction in net income, even
if large enough to prompt a halt to remittances to the
Treasury, would not affect the Desk’s capacity to con-
duct open market operations or the FOMC’s ability to
manage short-term interest rates.
PERMANENT OPERATIONS
Treasury Securities OperationsPURCHASES, SALES, AND REDEMPTIONS
The SOMA portfolio’s $543 billion increase in U.S.
Treasury holdings in 2013 stemmed almost entirely
from steady purchases of longer-term Treasury secu-
rities under the FOMC’s directives to purchase $45 bil-
lion of additional Treasury securities per month.
These purchases started in January 2013, immediately
following the conclusion of the Maturity Extension
Program at the end of 2012.27 They were conducted
in the secondary market through a series of 216 oper-
ations across nominal securities and TIPS with at least
four years to maturity. The largest number of opera-
tions and the total share of purchases were concen-
trated in the seven- to ten-year and the twenty- to
thirty-year nominal maturity sectors (Table 1).
Table 1
TREASURY OPERATIONS IN 2013
Number of OperationsPar Amount Purchased (Billions of U.S. Dollars) Percentage of Total
Nominal Coupon Securities by Maturity Range
4–4¾ years 12 60 11
4¾–5¾ years 12 65 12
5¾–7 years 24 89 16
7–10 years 48 155 29
10–20 years 12 11 2
20–30 years 96 144 27
TIPS 12 17 3
Total 216 540 100
Source: Federal Reserve Bank of New York.
Note: Figures may not sum to totals because of rounding.

FEDERAL RESERVE BANK OF NEW YORK 12 MARKETS GROUP
DOMESTIC OPEN MARKET OPERATIONS DURING 2013
The Desk did not sell any Treasury securities in
2013. Also, after halting reinvestments under the
MEP in the second half of 2012, the FOMC directed
the Desk to resume rolling over maturing Treasury
securities into new issues at auction.28 However, for
operational efficiency, when the proceeds received
by the SOMA from maturing Treasury securities on
a given day totaled less than $2 million, the Desk
allowed those securities to mature without rein-
vestment.29 Owing to the sale of nearly all short-
term holdings in the SOMA during the MEP, this
daily threshold was not reached in 2013, and the
Desk therefore redeemed about $21 million of
maturing Treasury securities without reinvestment.
OPERATIONAL APPROACH
The December 2012 FOMC statement indicated
that Treasury purchases would continue at a pace
of $45 billion per month following the conclusion
of the MEP at the end of the year. The Desk sub-
sequently conducted additional open market pur-
chases of Treasury securities in 2013 according to
the operating policy released soon after that FOMC
announcement. The policy stipulated the planned
maturity distribution of the securities to be pur-
chased (shown in Table 1) and other operational
details through an official statement and a set of
FAQs posted to the Federal Reserve Bank of New
York’s website.30
As in previous purchase programs, near the
end of each month the Desk announced a tenta-
tive schedule of operations for the month ahead,
including the expected date, eligible sector, and
expected range of the size of each operation. The
Desk also released pricing information for purchases
in the prior month, including the weighted average
accepted price for each security at every operation,
the highest accepted price, and the percentage of
propositions filled at the highest accepted price.31
As in past operations, the Desk refrained from
purchasing securities that traded with heightened
scarcity value in the repurchase agreement mar-
ket for specific collateral or that were the cheap-
est to deliver into Treasury futures contracts. The
Desk also did not purchase STRIPS or securities that
traded in the when-issued market. At the start of
each operation, the Desk announced specific issues
to be excluded from consideration.
The Desk also maintained its framework of
purchase and holding limits, which have been in
place since November 2010 to avoid acquiring an
excessive concentration of specific securities. This
framework stipulates that holdings are limited to
70 percent of the outstanding supply of any single
Treasury security. Once holdings of an individual
security reach 30 percent, further purchases are
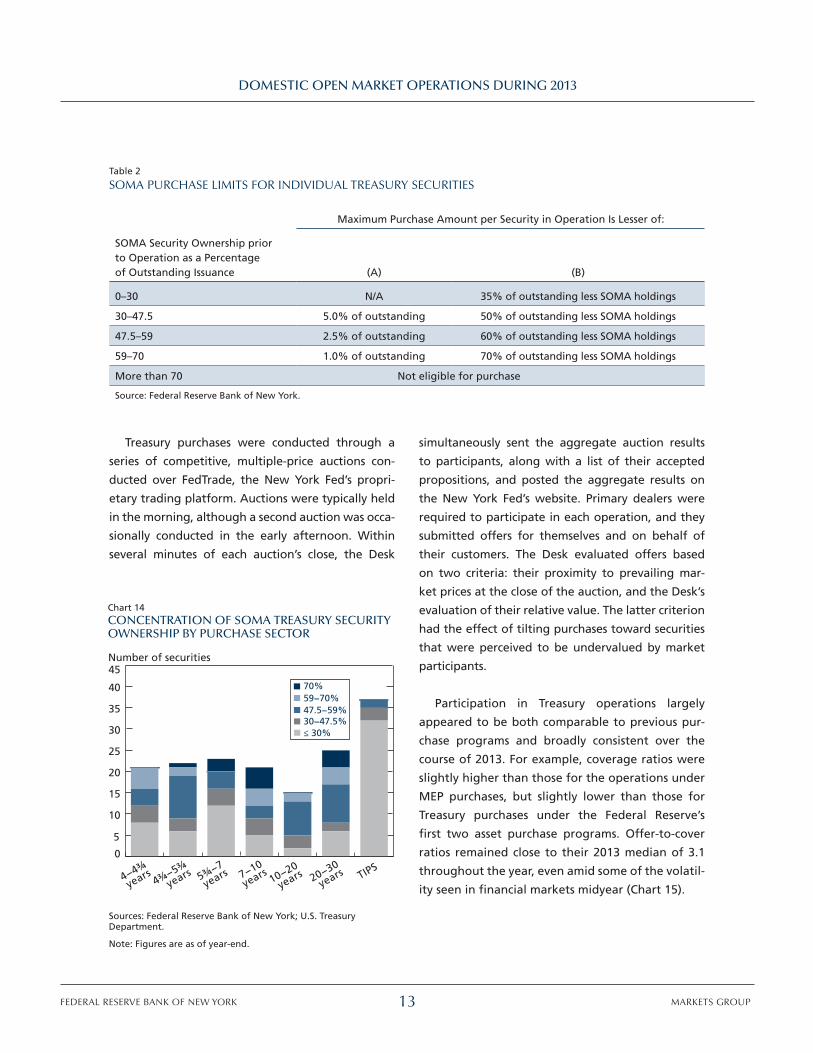
allowed only in modest increments (Table 2). This
practice moderates the pace at which holdings
of individual securities are accumulated to avoid
the risk of market disruption. At the end of 2013,
SOMA holdings of thirteen securities were at the
maximum limit of 70 percent of outstanding supply,
compared with eight at the maximum in 2012. The
seven- to ten-year and the twenty- to thirty-year
maturity sectors had the largest numbers of indi-
vidual securities for which the purchase limit had
been reached (Chart 14).
Consistent with prior practices, the Desk con-
ducted its purchases in the secondary market with
primary dealers. Additionally, in July 2013, the Desk
launched the Treasury Operations Counterparty
Pilot Program (TOC), a one-year initiative in which
a few small firms were selected to act as counter-
parties—along with primary dealers—in second-
ary market Treasury operations conducted for the
SOMA.32 Additional information about the TOC is
presented in the “Operational Readiness and Flexi-
bility” section and Appendix 5 of this report.
FEDERAL RESERVE BANK OF NEW YORK 13 MARKETS GROUP
DOMESTIC OPEN MARKET OPERATIONS DURING 2013
Treasury purchases were conducted through a
series of competitive, multiple-price auctions con-
ducted over FedTrade, the New York Fed’s propri-
etary trading platform. Auctions were typically held
in the morning, although a second auction was occa-
sionally conducted in the early afternoon. Within
several minutes of each auction’s close, the Desk
simultaneously sent the aggregate auction results
to participants, along with a list of their accepted
propositions, and posted the aggregate results on
the New York Fed’s website. Primary dealers were
required to participate in each operation, and they
submitted offers for themselves and on behalf of
their customers. The Desk evaluated offers based
on two criteria: their proximity to prevailing mar-
ket prices at the close of the auction, and the Desk’s
evaluation of their relative value. The latter criterion
had the effect of tilting purchases toward securities
that were perceived to be undervalued by market
participants.
Participation in Treasury operations largely
appeared to be both comparable to previous pur-
chase programs and broadly consistent over the
course of 2013. For example, coverage ratios were
slightly higher than those for the operations under
MEP purchases, but slightly lower than those for
Treasury purchases under the Federal Reserve’s
first two asset purchase programs. Offer-to-cover
ratios remained close to their 2013 median of 3.1
throughout the year, even amid some of the volatil-
ity seen in financial markets midyear (Chart 15).
Table 2
SOMA PURCHASE LIMITS FOR INDIVIDUAL TREASURY SECURITIES
Maximum Purchase Amount per Security in Operation Is Lesser of:
SOMA Security Ownership prior to Operation as a Percentage of Outstanding Issuance (A) (B)
0–30 N/A 35% of outstanding less SOMA holdings
30–47.5 5.0% of outstanding 50% of outstanding less SOMA holdings
47.5–59 2.5% of outstanding 60% of outstanding less SOMA holdings
59–70 1.0% of outstanding 70% of outstanding less SOMA holdings
More than 70 Not eligible for purchase
Source: Federal Reserve Bank of New York.
Chart 14 CONCENTRATION OF SOMA TREASURY SECURITYOWNERSHIP BY PURCHASE SECTOR
Number of securities
Sources: Federal Reserve Bank of New York; U.S. TreasuryDepartment.
Note: Figures are as of year-end.
0
5
10
15
20
25
30
35
40
45
70%59−70%47.5−59%30−47.5%≤ 30%
TIPS20−30
years10−20
years7−10
years5¾−7
years4¾−5¾
years4−4¾
years

FEDERAL RESERVE BANK OF NEW YORK 14 MARKETS GROUP
DOMESTIC OPEN MARKET OPERATIONS DURING 2013
MARKET FUNCTIONING AND SECURITIES LENDING
The Desk closely monitored market functioning and
liquidity as it significantly increased its holdings of
Treasury securities, and conditions in the market for
Treasury coupon securities remained robust accord-
ing to both anecdotal reports and market-based
measures. Market participants suggested that pur-
chases of Treasury securities had limited adverse
effects on market functioning, even as interest rates
rose sharply and general financial market volatility
increased during the late spring and summer.
Bid-ask spreads, quote sizes, and trading vol-
umes generally remained within historical ranges
throughout the year, and the overnight repo rate
on most specific issues generally traded near the
Treasury general collateral (GC) repo rate (Chart 16).
The par value of Treasury market settlement fails
rose somewhat relative to levels seen in the last
several years, driven in large part by a greater num-
ber of fails in off-the-run securities. Meanwhile,
on-the-run securities continued to experience occa-
sional fails of much larger size, in line with typical
auction-cycle dynamics and concentrated in sectors
in which investors reportedly had large short posi-
tions. Aggregate fails rose most sharply alongside
the midyear rise in Treasury yields and market vola-
tility, though this trend ebbed later in the fall as
yields leveled off and volatility subsided.
Most of the affected securities were those for
which SOMA did not have significant ownership.
Although SOMA purchases decrease private market
Chart 15COVERAGE OF SOMA TREASURY PURCHASEOPERATIONS
Ratio
Source: Federal Reserve Bank of New York.
0
1
2
3
4
5
6
One-monthmoving average
2013
Offer-to-cover ratio
Cents per $100 par Billions of U.S. dollars
100
200
300
400
500
600
700
800Overall tradingvolume
2013201220112010
Source: Federal Reserve Bank of New York, based on non-unattributed data from BrokerTec.
Notes: The chart shows the one-week average of the on-the-run 10-year Treasury bid-ask spread and the two-week moving average of primary dealer Treasury transaction volume (excluding TIPS). Dotted horizontal lines represent average levels since 2010. Shaded areas represent periods around year-ends.
Chart 16 TREASURY MARKET LIQUIDITY MEASURES
0
0.5
1.0
1.5
2.0
2.5
3.0
3.5
10-year bid-ask spread

FEDERAL RESERVE BANK OF NEW YORK 15 MARKETS GROUP
DOMESTIC OPEN MARKET OPERATIONS DURING 2013
holdings, the availability of specific issues held by
SOMA through the Desk’s securities lending opera-
tions can help mitigate periods of extreme special-
ness or elevated fails.33 Such pressures tend to take
place in the on-the-run securities that have a small
concentration in the SOMA portfolio. On average,
primary dealers borrowed $14 billion in Treasury
securities each day from the SOMA portfolio in
2013, an increase over the daily average of $11 bil-
lion in 2012 (Chart 17).
Agency Mortgage-Backed Securities OperationsPURCHASES AND PRINCIPAL PAYMENTS
The Desk conducted transactions in agency MBS
throughout 2013 under the FOMC’s directives to
purchase $40 billion of additional agency MBS per
month as a continuation of the purchase program
that was initiated in September 2012.34 The Desk
was also directed to maintain its policy of rein-
vesting principal payments from agency debt and
agency MBS in agency MBS, a practice that began
in September 2011. Under these directives, the Desk
purchased a total of $783 billion of agency MBS in
2013, of which $480 billion, or about 61 percent,
were associated with the additional purchases,
while the remaining $303 billion were purchased
in accordance with reinvestments (Chart 18).35 The
Desk did not sell any agency MBS outright, but did
engage in sales through dollar roll transactions as
necessary to facilitate settlement of the Federal
Reserve’s agency MBS transactions.36
The average monthly pace of principal payments
on agency MBS in the SOMA portfolio averaged
$28 billion in the first half of 2013, similar to the
average pace seen throughout 2012. However, the
pace declined to $17 billion per month in the sec-
ond half of the year as refinancing activity slowed
when primary mortgage rates increased along
with the rise in other longer-term interest rates
(Chart 19). Agency MBS in the SOMA portfolio pre-
paid faster than the broader agency MBS market,
in part reflecting the fact that SOMA holdings are
concentrated in securities issued after 2010, which
tend to exhibit faster prepayments, and that coun-
terparties in the types of agency MBS transactions
conducted by the Desk deliver pools with the great-
est prepayment risk, all else equal.37
Chart 17 SOMA SECURITIES LENDING IN TREASURIES
Billions of U.S. dollars
Source: Federal Reserve Bank of New York.
Note: Figures are monthly averages.
0
5
10
15
20
25
20132012201120102009
Chart 18 SOMA AGENCY MBS PURCHASES
Billions of U.S. dollars
Source: Federal Reserve Bank of New York.
Note: Figures are monthly.
0
20
40
60
80
100
120
140
20132012201120102009
Reinvestments
Additional purchases
First large-scale assetpurchase program

FEDERAL RESERVE BANK OF NEW YORK 16 MARKETS GROUP
DOMESTIC OPEN MARKET OPERATIONS DURING 2013
Eighty-four percent of purchases were concen-
trated in thirty-year as opposed to fifteen-year
securities, while the vast majority of securities pur-
chased had coupons of 3.0, 3.5, and 4.0 percent. As
refinancing activity slowed midyear amid the gen-
eralized rise in longer-term interest rates, the Desk’s
purchases, along with anticipated issuance, shifted
toward higher coupon securities (Chart 20).
operational approacH
The Desk’s approach to purchases in 2013 con-
formed to the practices established in prior years,
and the operating policy for these purchases was
released soon after the FOMC announced agency
MBS operations in September 2012.38 These com-
munications provided an overview of the planned
operational approach.
Around the eighth business day of each month,
the Desk announced its planned amount of pur-
chases associated with the reinvestment of princi-
pal payments that it expected to receive from the
agency debt and agency MBS between the middle
of the current month and the middle of the follow-
ing month. At the end of the month, the Desk also
confirmed the monthly purchase amount related
to the agency MBS purchase program. On a weekly
basis, the Desk published a summary of its opera-
tional activity with respect to agency, coupon rate,
and term, and settled agency MBS holdings at the
security level. On a monthly basis, the Desk made
additional detailed transaction information publicly
available, including price, trade amount, agency,
coupon, term, and settlement date.39
Purchases were executed in the “to-be-announced”
(TBA) market.40 In a TBA trade, the buyer and seller of
MBS agree on a set of basic characteristics, including
the price, face value, coupon rate, issuer, term, and set-
tlement date. At the settlement date, TBA sellers have
the option to deliver any agency MBS that meet the
contract requirements. This trading convention per-
mits a heterogeneous market consisting of thousands
of different MBS backed by millions of individual mort-
gages to be reduced to only a few highly liquid, stan-
dardized contracts—an outcome conducive to imple-
menting the Federal Reserve’s large-scale purchases.41
Within the TBA market, the Desk concentrated its
Chart 19 SOMA AGENCY MBS PRINCIPAL PAYMENTSAND PRIMARY MORTGAGE RATE
Billions of U.S. dollars Percent
Sources: Federal Reserve Bank of New York; Federal Home LoanMortgage Corporation.
Note: Figures are monthly.
0
5
10
15
20
25
30
35
3.0
3.5
4.0
4.5
5.0
5.5
6.0
6.5
Primary mortgagerate
20132012201120102009
Principal payments on SOMA agency MBS
Chart 20 SOMA PURCHASES OF AGENCY MBS BY COUPON
Percent
0
20
40
60
80
100
20132012
4.5%4.0%3.5%3.0%2.5%
Source: Federal Reserve Bank of New York.
Notes: Figures are monthly and consist of 30-year purchases only.
FEDERAL RESERVE BANK OF NEW YORK 17 MARKETS GROUP
DOMESTIC OPEN MARKET OPERATIONS DURING 2013
purchases in newly issued agency MBS because these
securities have greater liquidity and are closely tied to
primary mortgage rates, features that in turn further
the FOMC’s objective of providing additional accom-
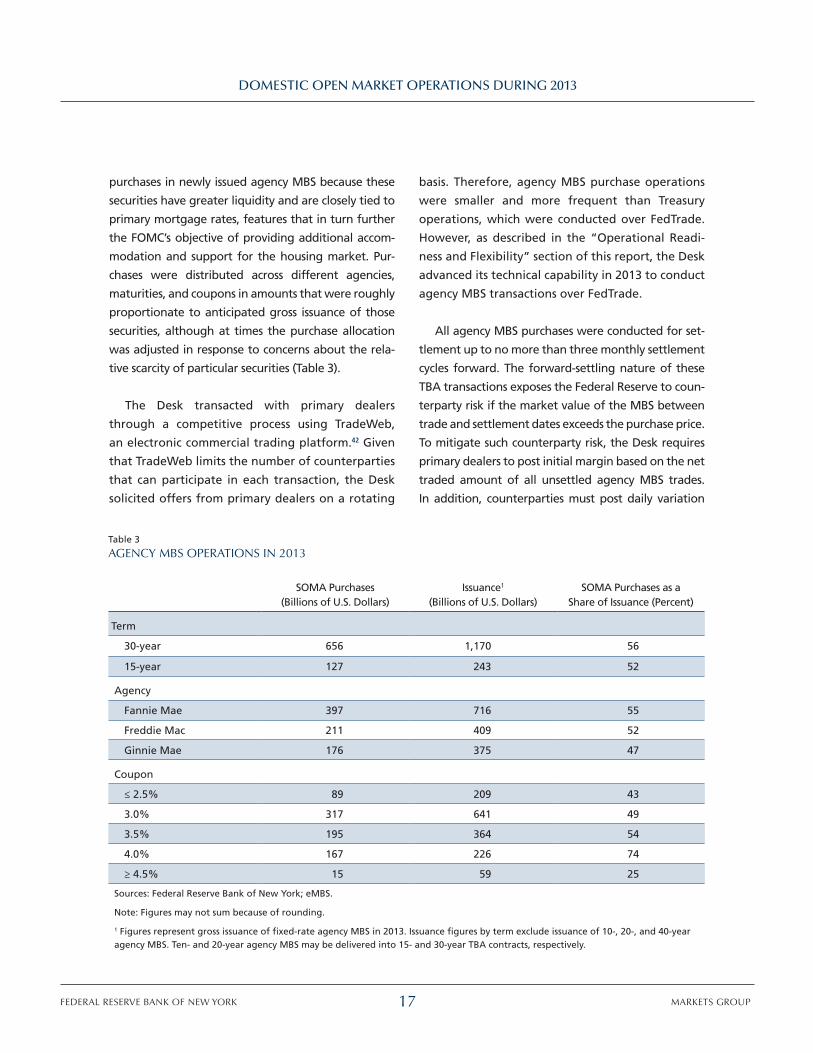
modation and support for the housing market. Pur-
chases were distributed across different agencies,
maturities, and coupons in amounts that were roughly
proportionate to anticipated gross issuance of those
securities, although at times the purchase allocation
was adjusted in response to concerns about the rela-
tive scarcity of particular securities (Table 3).
The Desk transacted with primary dealers
through a competitive process using TradeWeb,
an electronic commercial trading platform.42 Given
that TradeWeb limits the number of counterparties
that can participate in each transaction, the Desk
solicited offers from primary dealers on a rotating
basis. Therefore, agency MBS purchase operations
were smaller and more frequent than Treasury
operations, which were conducted over FedTrade.
However, as described in the “Operational Readi-
ness and Flexibility” section of this report, the Desk
advanced its technical capability in 2013 to conduct
agency MBS transactions over FedTrade.
All agency MBS purchases were conducted for set-
tlement up to no more than three monthly settlement
cycles forward. The forward-settling nature of these
TBA transactions exposes the Federal Reserve to coun-
terparty risk if the market value of the MBS between
trade and settlement dates exceeds the purchase price.
To mitigate such counterparty risk, the Desk requires
primary dealers to post initial margin based on the net
traded amount of all unsettled agency MBS trades.
In addition, counterparties must post daily variation
Table 3
AGENCY MBS OPERATIONS IN 2013
SOMA Purchases (Billions of U.S. Dollars)
Issuance1 (Billions of U.S. Dollars)
SOMA Purchases as a Share of Issuance (Percent)
Term
30-year 656 1,170 56
15-year 127 243 52
Agency
Fannie Mae 397 716 55
Freddie Mac 211 409 52
Ginnie Mae 176 375 47
Coupon
≤ 2.5% 89 209 43
3.0% 317 641 49
3.5% 195 364 54
4.0% 167 226 74
≥ 4.5% 15 59 25
Sources: Federal Reserve Bank of New York; eMBS.
Note: Figures may not sum because of rounding.
1 Figures represent gross issuance of fixed-rate agency MBS in 2013. Issuance figures by term exclude issuance of 10-, 20-, and 40-year agency MBS. Ten- and 20-year agency MBS may be delivered into 15- and 30-year TBA contracts, respectively.

FEDERAL RESERVE BANK OF NEW YORK 18 MARKETS GROUP
DOMESTIC OPEN MARKET OPERATIONS DURING 2013
margin if the New York Fed’s replacement cost exceeds
the value of collateral already posted.43 Over 2013, the
market made significant progress toward the adop-
tion of the Treasury Market Practices Group’s best-
practice recommendation to margin forward-settling
agency MBS transactions.44
market Functioning, liquiDity, anD Dollar rolls
The Desk closely monitored market functioning and
liquidity as it increased its holdings of agency MBS.
Common market functioning indicators suggested
that market liquidity was stable early in the year,
but deteriorated in late spring and through the
summer with the notable increase in interest rate
volatility across financial markets. It then improved
somewhat in the fourth quarter. Trading volume
declined in June and subsequently recovered, albeit
not to long-term averages, likely owing to a sig-
nificant decline in mortgage originations resulting
from the declines in refinancing activity (Chart 21).
The market appeared to absorb the volume
of the Desk’s agency MBS operations without
significant disruptions. On balance, the size of
SOMA purchases represented over half of the gross
issuance of thirty-year and fifteen-year fixed-rate
agency MBS over the year, but this share rose mark-
edly as new issuance declined around the middle of
the year while the monthly pace of additional pur-
chases remained constant (Chart 22). The size of pur-
chases of certain TBA contracts at times exceeded
the size of monthly issuance, as was sometimes
the case during the Federal Reserve’s first asset
purchase program. Even so, there were few signs
of significant market disruptions in 2013, in part
because investors are able to deliver not only new-
production but also more seasoned MBS into TBA
obligations. As the Desk’s purchases increased rela-
tive to gross issuance in the second half of the year,
the outstanding stock of seasoned MBS remained
abundant in the contracts in which the Desk concen-
trated its purchases. Indeed, agency MBS settlement
fails declined throughout the year and remained at
multi year lows, indicating few large-scale scarcity
issues in trade settlement (Chart 23).
Throughout 2013, the FOMC directed the Desk
to engage in dollar roll transactions as necessary to
Chart 21TOTAL AGENCY MBS TRANSACTION VOLUME
Billions of U.S. dollars
100
200
300
400
500
20132012201120102009
Source: Federal Reserve Bank of New York.
Note: Figures are the par value, four-week moving average oftotal weekly transactions of primary dealers.
Chart 22 SOMA AGENCY MBS PURCHASES AS A SHAREOF GROSS FIXED-RATE ISSUANCE
Percent
2011 2012 2013
Sources: Federal Reserve Bank of New York; eMBS.
Note: Figures are monthly.
0
10
20
30
40
50
60
70
80

FEDERAL RESERVE BANK OF NEW YORK 19 MARKETS GROUP
DOMESTIC OPEN MARKET OPERATIONS DURING 2013
facilitate settlement associated with its unsettled
agency MBS purchases. In 2013, dollar roll sales
were conducted as needed, effectively postponing
settlement of previously executed agency MBS pur-
chase transactions, when implied financing rates for
specific contracts were notably below the general
level of short-term interest rates, as such conditions
likely signaled a shortage of supply available for
settlement. On net, dollar roll sales represented an
average of roughly 5 percent of the Desk’s expected
agency MBS settlements over 2013, down from an
average of 7 percent in 2012 (Chart 24). The Desk
did not purchase any dollar rolls during the year.
Agency Debt OperationsIn 2013, the Desk did not purchase or sell any direct
obligations of the housing-related government-
sponsored enterprises (GSEs). About $20 billion of
agency debt holdings matured in 2013, and pro-
ceeds were reinvested in agency MBS throughout
the year. Agency debt securities in the SOMA were
added to the Desk’s securities lending program in
2009, and average lending volumes of agency debt
securities were less than $1 billion per day in 2013,
relatively unchanged from 2012 levels.45
temporary operations anD
FunDing markets
Money Market OperationsThe FOMC continued to maintain its target for the
federal funds rate in a range of 0 to ¼ percent
throughout 2013. Additionally, it offered guidance
that the target would be appropriate at least as
long as the unemployment rate remained above
6½ percent, inflation between one and two years
ahead was projected to be no more than a half per-
centage point above the Committee’s 2 percent
longer-run goal, and longer-term inflation expecta-
tions continued to be well anchored. In December,
the Committee added that it would likely be appro-
priate to maintain the current target range well
past the time that the unemployment rate declined
below 6½ percent, especially if projected inflation
continued to run below the Committee’s 2 percent
longer-run goal.46
Chart 23 GROSS AGENCY MBS FAILS
Billions of U.S. dollars
Source: Federal Reserve Bank of New York.
Note: Figures are the par value, four-week moving average oftotal gross weekly fails.
0
500
1,000
1,500
2,000
20132012201120102009
Chart 24 SOMA DOLLAR ROLL SALES
Billions of U.S. dollars
2011 2012 2013
Percent
Source: Federal Reserve Bank of New York.
Note: Figures are monthly by settlement month.
0
5
10
15
0
10
20
30
Share of expectedsettlements
Total

FEDERAL RESERVE BANK OF NEW YORK 20 MARKETS GROUP
DOMESTIC OPEN MARKET OPERATIONS DURING 2013
Throughout 2013, the FOMC directed the Desk
to undertake open market operations to maintain
conditions in reserve markets such that federal
funds traded in a range of 0 to ¼ percent. How-
ever, an elevated level of reserve balances and
the payment of interest on excess reserves (IOER)
continued to keep the federal funds effective rate
(FFER) within the target range without a need for
any temporary open market operations. The FFER
was 0.11 percent on average in 2013, after declin-
ing from an average of 0.13 percent during the first
half of the year to an average of 0.09 percent dur-
ing the second half (Chart 25).
Money Market DevelopmentsDaily trading volumes and volatility in the federal
funds market remained at relatively low levels. In
general, the FFER was pulled lower during 2013
by downward pressures on rates in other over-
night funding markets, particularly those in over-
night repo markets used by securities dealers and
others to finance general collateral Treasury hold-
ings. Overnight GC Treasury repo rates declined in
2013 to an average of 0.16 percent in 2013 from
an average of 0.21 percent in 2012 (Chart 25).47
This downward shift in money market rates likely
reflected an easing of prior upward pressures asso-
ciated with the Federal Reserve’s sales of short-term
Treasury securities under the Maturity Extension
Program, which ended in December 2012, as well as
the rising level of reserves.
The trend toward low and generally stable
money market rates was interrupted briefly in late
September and the first half of October, ahead of
the October 17 date by which the Treasury stated
it could exhaust its borrowing authority under the
statutory federal debt limit. A sharp rise in volatil-
ity and rates on short-term Treasury GC repo agree-
ments and certain Treasury bills reflected market
participants’ mounting desire to avoid risk as the
deadline approached.48 Money market rates began
to return to their prior levels after Congress passed
legislation on October 16 suspending the debt limit
until early February 2014.
The payment of IOER remains an important
policy instrument that has likely helped to keep
money market rates at positive levels in an operat-
ing environment with an elevated level of excess
reserves. Without it, short-term interest rates could
fall to zero or negative levels. Because interest on
excess reserves represents the rate of return on a
riskless overnight deposit for depository institutions
(banks) with accounts at the Federal Reserve, it
represents the opportunity cost of making an alter-
native investment, such as a loan or the purchase
of a security. Theoretically, it should therefore set
a minimum rate (or “floor”) on the rates at which
institutions with access to earning IOER are willing
to lend in financial markets. This floor could addi-
tionally extend further, to all counterparties in the
market, not just to those with access to the facility.
Banks eligible to earn IOER could borrow funds or
take deposits from institutions that cannot and then
hold those funds at the Federal Reserve, earning the
Chart 25OVERNIGHT MONEY MARKET RATES
Percent
Sources: Federal Reserve Bank of New York; The Depository Trust& Clearing Corporation.
Note: Figures are daily.
-0.2
-0.1
0
0.1
0.2
0.3
0.4
0.5
0.6
Treasuries − DTCC GCF Repo Index®
Federal fundseffective rate
20132012201120102009
Interest onexcess reserves

FEDERAL RESERVE BANK OF NEW YORK 21 MARKETS GROUP
DOMESTIC OPEN MARKET OPERATIONS DURING 2013
spread between the rate they paid for the funds and
the IOER rate. Competition among banks to conduct
such arbitrage activities should pull up other money
market rates, close to the IOER rate, until there is no
longer an economic benefit from doing so.
However, overnight money market rates have
traded consistently at levels well below the 25 basis
point IOER rate, suggesting in part that IOER has not
provided as hard a floor for comparable overnight
instruments as theory would suggest. Many lenders
in money markets, such as government-sponsored
enterprises and money market funds, do not have
access to the IOER rate, either because they can-
not earn interest on Federal Reserve account bal-
ances or do not have Federal Reserve accounts. As
a result, they may be willing to place funds in the
market at sub-IOER rates. Uncertain or rising bal-
ance sheet costs—related in part to regulatory
changes in recent years, including higher capital
requirements, leverage and liquidity requirements,
and changes in the fee assessment calculation for
FDIC deposit insurance—may have exhausted the
economic benefit of arbitraging the differences
among rates, despite the high spread between
market rates and the IOER rate.49 Further, if there
is not strong competition among banks with access
to IOER to hold those excess balances, the rates
offered in the market for short-term deposits may
remain lower still. These factors have shaped U.S.
dollar money market dynamics in an environment
with abundant reserves.
OPERATIONAL READINESS AND FLEXIBILITY
Over the course of 2013, an array of initiatives
enhanced the Desk’s technical flexibility, efficiency,
and resilience. Improvements in the Desk’s operating
tools and capacity supported its ability to structure
and execute open market operations to achieve the
current and future objectives of policymakers.
Operating ToolsAlthough the Desk did not actively manage the supply
of reserves in 2013, as a matter of prudent planning,
it continued to test and develop a range of tools that
the FOMC could consider for managing short-term
interest rates or providing additional liquidity in order
to meet potential future policy needs.
SMALL-VALUE OPERATIONS
Drawing on provisions in its Authorization for
Domestic Open Market Operations, the Desk con-
tinued to enhance its operational readiness to con-
duct various types of already-approved operations
through technical exercises that are limited in size
and scope (Appendix 1).
As it has done since 2010, the Federal Reserve
continued to conduct periodic exercises of tools
that could eventually be used for the large-scale
draining of reserves. In April and August of 2013,
the Desk conducted a series of tri-party reverse
repo exercises. These operations involved the pri-
mary dealers and the expanded set of reverse repo
counterparties, offered all three types of SOMA col-
lateral, and had maturities ranging from overnight
to five days. Operations took the form of fixed-
quantity, multiple-price auctions, with $5 billion
being the largest outstanding amount.
As part of the ongoing testing of its Term Deposit
Facility, the Federal Reserve conducted bi-monthly
auctions of term deposits to eligible depository
institutions throughout 2013.50 The January and
March operations were conducted as competitive,
single-price, fixed-quantity auctions offering $3 bil-
lion of twenty-eight-day term deposits. In contrast,
the four operations executed between May and
November were conducted as fixed-rate offer-
ings with full allotment of tenders. These opera-
tions offered twenty-eight-day term deposits with
an interest rate of 0.26 percent and a maximum

FEDERAL RESERVE BANK OF NEW YORK 22 MARKETS GROUP
DOMESTIC OPEN MARKET OPERATIONS DURING 2013
tender amount of $1.25 billion per institution. The
fixed-rate operations, on average, awarded total
amounts of about $12 billion, and saw an average
of twenty-seven institutions participate.
The Desk also conducted small-value exercises of
tools that would allow it to add reserves through
temporary operations. In order to maintain opera-
tional readiness in light of changes to support tri-
party reform, the Desk undertook a series of tri-party
repo exercises in January and June 2013. These oper-
ations involved only the primary dealers, accepted
all three types of collateral eligible for open market
operations, and had maturities ranging from over-
night to five days. Operations took the form of fixed-
quantity, multiple-price auctions, with $610 million
being the largest outstanding amount.
Additionally, the Desk conducted the first of what
are expected to become periodic, pre-arranged,
small-value exercises that test the operational
readi ness of standing liquidity swap arrangements
the Federal Reserve now maintains with some for-
eign central banks.51 On December 12, 2013, the
Bank of England and Swiss National Bank drew on
their U.S. dollar liquidity swap lines in the amount
of $500 thousand each for an overnight term with
an annualized interest rate of 0.58 percent. Addi-
tional information about U.S. dollar liquidity swap
lines is found in the “Additional Federal Reserve
Activity Affecting Reserves” section of this report.
OVERNIGHT FIXED-RATE REVERSE
REPURCHASE AGREEMENTS
In support of its longer-run planning for improve-
ments in the technical execution of monetary policy,
the FOMC in 2013 began to consider a further use of
reverse repurchase agreement operations—in this
case, overnight, fixed-rate reverse repos (ON RRPs)
with same-day settlement—as an additional tool
for managing money market interest rates. Reverse
repos are an operation in which eligible counterpar-
ties place cash temporarily at the Federal Reserve in
exchange for securities from the SOMA portfolio,
economically the same as a collateralized deposit. In
theory, conducting fixed-rate ON RRPs would allow
the FOMC to offer an overnight, risk-free invest-
ment directly to a broader range of money market
participants, including certain types of nonbank
financial institutions. For such counterparties, the
ability to invest funds in reverse repos at a fixed
rate might widen the universe of counterparties
that should generally be unwilling to lend at rates
below those available from the central bank. In this
way, ON RRPs might complement IOER and help
support a floor on short-term interest rates, ulti-
mately improving the FOMC’s ability to keep short-
term market rates at levels it deems appropriate to
achieve its macroeconomic objectives.
In order to gain operational experience with
larger transaction flows associated with these opera-
tions and to investigate how ON RRPs might improve
interest rate control regardless of the size of the
Federal Reserve’s balance sheet, on September 17,
2013, the FOMC approved a resolution authoriz-
ing the Desk to conduct a limited technical exercise
consisting of a series of daily overnight, fixed-rate
RRP operations (Appendix 2).52 The exercise began
on September 23 and was authorized to run until
January 29, 2014.53 This exercise, like other technical
exercises conducted by the Desk, was not intended
to signal any change in the Committee’s views about
policy going forward or to materially affect the cur-
rent level of short-term interest rates. Maximum bid
amounts per counterparty and the fixed interest rate
offered by the New York Fed for ON RRP operations
were therefore capped by the FOMC, but allowed to
vary within the pre-established, narrow limits.54
ON RRP operations were conducted via FedTrade
with the Desk’s expanded set of reverse repo
counterparties and primary dealers. Terms for the

FEDERAL RESERVE BANK OF NEW YORK 23 MARKETS GROUP
DOMESTIC OPEN MARKET OPERATIONS DURING 2013
operations were published in advance, with opera-
tions occurring daily in the late morning. The oper-
ations initially began with a fixed rate of 1 basis
point and a counterparty bid cap of $500 million.
Through the course of the exercise in 2013, the
rates and counterparty bid caps were adjusted
numerous times in order to test operational capa-
bilities with varying levels of usage, and to gain
additional information about how such operations
might improve interest rate control (Table 4).
The ON RRP exercise provided the Desk, its coun-
terparties, and the tri-party clearing banks with the
opportunity to utilize and process overnight opera-
tions with same-day settlement. It also provided
some insight on factors influencing demand for ON
RRPs, which included priced-based factors as well
as nonprice factors such as dealer balance sheet
capacity to offer competing investments to Federal
Reserve counterparties. Exercise results, outside of
usage around month-ends, generally showed that
participation levels increased on days when mar-
ket rates were relatively low compared with the
fixed rate offered on ON RRPs (Chart 26). Participa-
tion also tended to be higher at month-ends, and
particularly at quarter-ends, when access to over-
night secured investments is generally more limited
and lower unsecured overnight rates increase the
attractiveness of the Fed’s ON RRP operations. This
effect was particularly evident on the 2013 year-
end date, when—according to anecdotal reports—
the availability of overnight investments through
ON RRP operations supported market functioning
in overnight money markets by reducing the likeli-
hood of more pervasive negative short-term inter-
est rates trading in a low-rate environment.
Through the end of December 2013, daily awards
in the Desk’s operations averaged $15 billion from
24 counterparties. Quarter-end financial statement
dates, when investors generally have less certain
access to secured and unsecured investments, experi-
enced the largest levels of participation; for example,
the September quarter-end saw substantial volume
as 87 counterparties bid a total of $58 billion, com-
pared with a daily average of 60 counterparties and
$11 billion in take-up earlier that month (Chart 27).
Table 4
TERMS OF OVERNIGHT FIXED-RATE REVERSE REPO OPERATIONAL EXERCISE
Fixed Rate (Basis Points)
Maximum Allotment per Counterparty
(Billions of U.S. Dollars)
09.23.13–09.26.13 1 0.5
09.27.13–10.20.13 1 1.0
10.21.13–11.03.13 2 1.0
11.04.13–11.11.13 3 1.0
11.12.13–11.18.13 4 1.0
11.19.13–12.22.13 5 1.0
12.23.13–01.29.14 3 3.0
Source: Federal Reserve Bank of New York.
Chart 26 OVERNIGHT FIXED-RATE REVERSE REPOOPERATIONAL EXERCISE ALLOTMENTVS. RATE SPREAD IN 2013
Billions of U.S. dollars
Treasuries — DTCC GCF Repo Index®
less �xed rate (basis points)
09.30.13
11.29.13
10.31.13
-5 0 5 10 15 20 25 300
50
100
150
200
Sources: Federal Reserve Bank of New York; The Depository Trust & Clearing Corporation.
Note: Figures are daily.
12.31.13

FEDERAL RESERVE BANK OF NEW YORK 24 MARKETS GROUP
DOMESTIC OPEN MARKET OPERATIONS DURING 2013
Leading up to and including the year-end, partici-
pation and the total amount awarded increased
steadily, from $29 billion across 31 counterparties
on December 23 to $103 billion across 75 counter-
parties on December 30. Usage peaked at $198 bil-
lion on December 31 with participation across
102 counterparties. Excluding month-ends, daily
awards averaged $11 billion from 22 counterparties
from the start of the exercise through December. In
general, money funds have been the largest partici-
pants in the exercise.
Operational CapacityOver the course of the year, the Desk further
enhanced its operating systems and arrangements,
including counterparty relationships and geo-
graphic dispersion of resources, in ways that contin-
ued to expand its operational capacity.
On November 18, 2013, the Desk announced that
it had developed the technical capability to con-
duct agency MBS transactions over its proprietary
FedTrade trading platform. At the same time, the
Desk published a schedule for testing this capability
through an exercise consisting of a series of small-
value purchase and sale operations of agency MBS
and running through January 2014.55 The opera-
tions conducted as part of the exercise did not
exceed a total of $500 million and were conducted
under the Desk’s authorization to conduct domestic
open market operations for the purpose of testing
operational readiness; they did not count as part of
the monthly agency MBS additional purchases and
reinvestments being conducted under the FOMC’s
policy directives. The Desk completed four small-
value agency MBS purchase operations in both
multiple- and single-price auction formats over
FedTrade for a total of $237 million in 2013. Results
were published following the completion of each
operation.
The Desk also continued to broaden its opera-
tional capacity by expanding its set of trading
counterparties for several types of open market
operations (Appendix 5). In January 2013, the New
York Fed added several more banks, government-
sponsored enterprises, and money funds to its list
of reverse repo counterparties. By the end of 2013,
the list totaled 139 counterparties, including the
primary dealers.
Additionally, in February 2013, the Desk
announced the Treasury Operations Counterparty
Pilot Program, through which a few small firms
would be selected to act as counterparties in sec-
ondary market Treasury operations conducted for
the SOMA, along with primary dealers.56 The year-
long pilot program, which was launched in July
2013 and is expected to run until July 2014, was
initiated to explore ways to broaden access to mon-
etary policy operations and to determine the extent
to which additional counterparties can augment
the New York Fed’s resiliency in its monetary policy
operations. The Desk therefore aimed to select a
small subset of firms that was diverse in size, geo-
graphic reach, and other characteristics in order to
Allotment
Billions of U.S. dollars
0
50
100
150
200
250
Allotment in month-end operation
Chart 27 OVERNIGHT FIXED-RATE REVERSE REPOOPERATIONAL EXERCISE RESULTS IN 2013
Number
Source: Federal Reserve Bank of New York.
Note: Figures are daily.
0
25
50
75
100
125
Number of bidders
DecNovOctSep

FEDERAL RESERVE BANK OF NEW YORK 25 MARKETS GROUP
DOMESTIC OPEN MARKET OPERATIONS DURING 2013
maximize the information to be gained from the
pilot. On June 6, 2013, following an application and
evaluation period, the New York Fed announced
that four firms would participate in the pilot pro-
gram.57 Pilot program participants are expected to
meet a range of business requirements—including
the observance of standards for operational par-
ticipation, trade execution, and competitive pric-
ing; adherence to responsible trading practices; and
proactive provision of useful information on Trea-
sury market developments—as well as other opera-
tional, financial, and compliance requirements. In
2013, the Desk accepted a total of $395 million in
propositions in Treasury purchase operations from
program participants.
Significantly, the New York Fed, with the sup-
port of the Federal Reserve System more broadly,
continues to invest in a range of flexible operating
arrangements and staffing plans that will ensure
business continuity. As of the end of 2013, the Mar-
kets Group had expanded the geographic disper-
sion of resources for supporting various aspects of
its operations across five locations throughout the
Federal Reserve System, including the establishment
of an on-site Desk presence at another Reserve Bank
in 2013. This split operation is intended to provide
resilience for the execution of all of the Desk’s criti-
cal operations and analytical activities should a con-
tingency scenario affect the greater New York area.
Over the course of the year, the Desk seamlessly
executed numerous domestic open market opera-
tions under this arrangement.

FEDERAL RESERVE BANK OF NEW YORK 26 MARKETS GROUP
DOMESTIC OPEN MARKET OPERATIONS DURING 2013
Reserve balance liabilities increased to historically
elevated levels during 2013, driven by the FOMC’s
decisions to expand the Federal Reserve’s balance
sheet in order to provide additional monetary pol-
icy accommodation. Throughout the year, the level
of reserve balances grew roughly in line with the
increase in the size of the SOMA portfolio. How-
ever, reserve balances did not increase to quite the
same extent as SOMA assets, because of offsetting
changes in the Federal Reserve’s consolidated bal-
ance sheet.
RESERVE BALANCES
On a biweekly average basis, reserve balances
increased steadily from $1.5 trillion in early January
to $2.5 trillion at the end of December (Chart 28).
Most of the additional reserve balances were excess
reserves, which increased from $1.5 trillion in early
January to $2.4 trillion at the end of year.58
Reserve balance requirements grew by 19.7 per-
cent to $72 billion owing to a significant increase
in the quantity of transaction deposits for which
depository institutions are required to hold reserves.
Market commentators had anticipated a signifi-
cant decrease in transaction deposits following the
December 31, 2012, expiration of the FDIC’s Transac-
tion Account Guarantee program as mandated by
the Dodd-Frank Wall Street Reform and Consumer
Protection Act. That decrease never materialized,
however, and transaction deposits grew during
2013 by $137 billion (8.7 percent).
AUTONOMOUS FACTORS
Reserve balances are affected by a number of
“autonomous factors” that are outside the direct
control of the Federal Reserve. Prior to the 2008
financial crisis, the ability to forecast accurately
the net value of these factors over short time hori-
zons was important for maintaining the supply of
reserves in a narrow band that was consistent with
the targeted federal funds rate. In recent years,
such control over the supply of reserves has been
less critical, partly because of the introduction of
IOER in 2008 and the shift from a targeted rate to
a range of rates, developments that changed the
operating environment for monetary policy.
THE SUPPLY OF RESERVES
Chart 28 RESERVE BALANCES
Billions of U.S. dollars
0
500
1,000
1,500
2,000
2,500
Excess balances
Reserve balance requirements
20132012201120102009
Source: Board of Governors of the Federal Reserve System.
Notes: Figures are biweekly. Data prior to June 27, 2013, are reserve balance requirements and excess balances. Data beginning June 27, 2013, are balances maintained to satisfy reserve balance requirements and balances that exceed the upper bound of the penalty-free band.

FEDERAL RESERVE BANK OF NEW YORK 27 MARKETS GROUP
DOMESTIC OPEN MARKET OPERATIONS DURING 2013
Federal Reserve NotesThe largest autonomous factor is the quantity
of Federal Reserve notes outstanding.59 Federal
Reserve notes increased $71 billion in 2013 to a
year-end level of $1.2 trillion, representing an
annual growth rate of 6.3 percent (Chart 29). The
pace of currency growth slowed throughout 2013
owing to reduced demand for U.S. currency abroad
amid decreasing global economic and financial
uncertainty. New restrictions introduced by several
foreign governments on U.S. currency imports also
slowed the pace of Federal Reserve note growth
during 2013.60
Treasury BalancesAlthough smaller in size than Federal Reserve notes
outstanding, other factors frequently play a larger
role in determining short-run swings in the supply
of reserves. The Treasury’s cash balances held at the
Federal Reserve have been one of the most volatile
autonomous factors since late 2008, when the Trea-
sury ceased targeting a fixed level of cash balances
at the Federal Reserve and investing the excess in
various short-term programs. Prompted by the very
low rates of return available on alternative invest-
ments, the Treasury began keeping almost all of its
funds at the Federal Reserve.
Throughout 2013, as in the previous year, the
Treasury made no use of its short-term investment
tools. As a result, the Treasury General Account (TGA)
at the Federal Reserve absorbed all of the Treasury’s
cash flow volatility, typically swelling when auctions
of Treasury securities settled and on tax payment
dates and declining when large payouts were made
(Chart 30).61 Treasury balances ranged from $12 bil-
lion to $214 billion during 2013 and ended the year
at around $162 billion. The average balance during
2013 was $61 billion, which was $4 billion lower
than the average during 2012.62
Despite disruption to the operation of various
federal agencies, the partial government shutdown
in October had only a minimal effect on the TGA,
causing some categories of Treasury spending to be
lighter during the first part of October and heavier
during the end of the month.
700
800
900
1,000
1,100
1,200
1,300
Level
0
2
4
6
8
10
12
Annual growth rate
2012 2013201120102009
Chart 29FEDERAL RESERVE NOTES OUTSTANDING
Billions of U.S. dollars Percent
Source: Board of Governors of the Federal Reserve System.
Note: Figures are weekly, net of holdings of Federal Reserve Banks.
Chart 30TREASURY GENERAL ACCOUNT
Billions of U.S. dollars
0
50
100
150
200
20132012201120102009
Source: Board of Governors of the Federal Reserve System.
Note: Figures are weekly averages.

FEDERAL RESERVE BANK OF NEW YORK 28 MARKETS GROUP
DOMESTIC OPEN MARKET OPERATIONS DURING 2013
Other Autonomous FactorsChanges in other autonomous factors marginally
reduced reserve balances on net during 2013. These
factors are driven by activity in a number of accounts
the New York Fed maintains for certain nondeposi-
tory institutions, such as foreign official institutions
and U.S. government-sponsored enterprises.63
An overnight reverse repo facility (the “for-
eign repo pool”) has long existed as an invest-
ment vehicle for foreign central banks and
international accounts that hold dollars in their
accounts at the New York Fed.64, 65 Investments in
this facility are pooled, giving each participant
an undivided interest, proportional to its invest-
ment, in an identified pool of domestic securi-
ties held in the SOMA portfolio. The daily rate
offered on investments in the facility is derived
from comparable market-based rates. This facil-
ity is unrelated to the fixed-rate, reverse repo
exercise that was introduced in September 2013
for the purpose of exploring improvements in
the technical execution of monetary policy. The
foreign repo pool increased to a weekly average
of $96 billion in 2013 from an average of $92 bil-
lion in 2012. Separately, foreign official depos-
its increased to an average of $9 billion from
an average of $3 billion, while average “other
deposits,” including balances held by GSEs, were
roughly unchanged at $36 billion (Chart 31).66
ADDITIONAL FEDERAL RESERVE ACTIVITY
AFFECTING RESERVES
While open market operations are the principal
tool for implementing monetary policy, the Primary
Credit Facility (PCF) and central bank liquidity swap
arrangements are also tools for providing liquidity to
relieve pressures in short-term money markets. Activ-
ities in these facilities represent additional types of
autonomous factors that affect reserve balances.
Primary Credit FacilityThe Primary Credit Facility serves as a backup source
of liquidity for depository institutions in generally
sound financial condition and with appropriate col-
lateral pledged to a Reserve Bank. Loans are gener-
ally limited to overnight maturities and are initiated
by depository institutions and approved by Reserve
Banks. The facility is intended to limit upward pres-
sure on overnight interest rates, including the federal
funds rate, which might develop when there is a net
reserve shortage or a disruption to payment flows.
The borrowing rate for primary credit loans
remained at 75 basis points throughout 2013,
50 basis points above the upper limit of the tar-
get range for the federal funds rate. Borrowing
activity remained low throughout the year as the
elevated level of excess reserves held by banks
and an improvement in funding conditions since
the financial crisis restrained demand by banks
to borrow from the PCF. Average and peak daily
loan balances were both lower than levels seen
in the recent past and in the pre-crisis period
(Table 5). Nevertheless, the total number of loans
Chart 31 SELECT AUTONOMOUS FACTORS
Billions of U.S. dollars
0
20
40
60
80
100
120
Other deposits
Foreign repo pool
20132012201120102009
Source: Board of Governors of the Federal Reserve System.
Note: Figures are weekly averages.

FEDERAL RESERVE BANK OF NEW YORK 29 MARKETS GROUP
DOMESTIC OPEN MARKET OPERATIONS DURING 2013
edged higher in 2013 as test loan activity contin-
ued to increase, a trend driven by banks’ efforts to
strengthen their backup liquidity arrangements in
the wake of the financial crisis.67
Central Bank Liquidity SwapsCentral bank liquidity swaps are designed to
improve conditions in global money markets and to
minimize the risk that strains abroad could spread
to U.S. markets. Through a temporary exchange
of currencies between central banks under these
arrangements, foreign central banks have the
capacity to deliver U.S. dollar funding to institu-
tions in their jurisdictions, and the Federal Reserve
has the capacity to deliver foreign currency to U.S.
institutions if conditions warrant.
Since May 2010, the Federal Reserve has main-
tained dollar liquidity swap lines with the Bank of
Canada, Bank of England, European Central Bank,
Bank of Japan, and Swiss National Bank. In addi-
tion, since November 2011, the Federal Reserve has
maintained foreign currency swap lines with the
same institutions. On October 31, 2013, the FOMC
announced the conversion of existing temporary
currency swap lines to standing arrangements that
will remain in place until further notice.68
The use of dollar liquidity swap lines was almost
$9 billion at the start of 2013 and declined through-
out the year (Chart 32). Outstanding swaps, which
were almost entirely attributable to drawings by
the European Central Bank, totaled $300 million
at year-end, the lowest level since September 2011.
Actions taken by European policymakers in 2012
and 2013 boosted broader market sentiment and
eased near-term liquidity and funding stresses,
resulting in the low level of usage during the year.
Throughout 2013, the rate on the swap arrange-
ments remained at the U.S. dollar overnight index
swap rate for the relevant tenor plus 50 basis points.
The Fed did not draw on its foreign currency liquid-
ity swap lines.
Chart 32CENTRAL BANK LIQUIDITY SWAPS OUTSTANDING
Billions of U.S. dollars
Source: Federal Reserve Bank of New York.
Note: Figures are weekly.
0
20
40
60
80
100
120
2013201220112010
Table 5
PRIMARY CREDIT FACILITY: DAILY AGGREGATE LOAN BALANCES (MILLIONS OF U.S. DOLLARS)
Year Average Peak
2006 59 3,676
2007 552 8,620
2008 32,179 113,709
2009 40,165 93,769
2010 4,364 19,697
2011 26 900
2012 22 314
2013 13 105
Source: Federal Reserve System.

FEDERAL RESERVE BANK OF NEW YORK 30 MARKETS GROUP
DOMESTIC OPEN MARKET OPERATIONS DURING 2013
CONCLUDING OBSERVATIONS
In addition to providing forward guidance regard-
ing the future path of the federal funds rate, the
FOMC continued to purchase longer-term Treasury
security and agency MBS assets at a combined pace
of $85 billion per month and to reinvest princi-
pal payments from agency debt and MBS in MBS.
This use of the size and composition of the SOMA
portfolio to implement monetary policy was under-
taken in support of the Federal Reserve’s dual man-
date of maximum employment and price stability.
Over the course of 2013, $1,020 billion in additional
asset purchases boosted the size of the portfolio to
a year-end level of $3.8 trillion, which generated
a further increase in the level of reserve balances
and continued to contribute to elevated portfolio
income. These policy actions were designed to put
downward pressure on longer-term interest rates,
to support mortgage markets, and to help make
broader financial conditions more accommodative.
The execution of the FOMC’s policy directives
required the Desk to conduct an intensive schedule
of permanent open market operations through-
out the year. The Desk closely monitored market
conditions, and despite a notable increase in the
level of interest rates and a rise in general financial
market volatility starting in late spring and last-
ing throughout the summer, its activities did not
appear to affect market functioning adversely. No
temporary operations were required to maintain
the federal funds rate within the FOMC’s target
range of 0 to ¼ percent, given the elevated level
of reserves that has resulted from policy actions
taken in recent years and the payment of interest
on excess reserves.
Over the course of 2013, the Desk undertook
an array of initiatives to enhance its technical effi-
ciency and resiliency. Although the Desk did not
actively manage the supply of reserves in 2013, it
maintained and expanded its readiness to conduct
a range of operations in short-term money markets
to meet the FOMC’s current and future policy objec-
tives. To this end, the Desk began conducting an
overnight, fixed-rate reverse repo exercise to gain
operational experience and explore the potential
impact of such operations in helping to manage
short-term interest rates.

FEDERAL RESERVE BANK OF NEW YORK 31 MARKETS GROUP
DOMESTIC OPEN MARKET OPERATIONS DURING 2013
On January 29, 2013, by unanimous vote, the FOMC
approved the Authorization for Domestic Open
Market Operations with two amendments. The
first broadened the actions that the Open Market
Desk may take, at the Chairman’s instruction during
an intermeeting period, to include transactions to
address temporary disruptions of an operational
or highly unusual nature in U.S. dollar funding
markets. Consistent with Committee practice,
the Chairman, if feasible, would consult with the
Committee before making any such instruction.
The second amendment harmonized the language
referring to the Committee’s longer-run objectives
with that in the Committee’s Statement on Longer-
Run Goals and Monetary Policy Strategy.
AUTHORIZATION FOR DOMESTIC OPEN
MARKET OPERATIONS
As amended effective January 29, 2013
1. The Federal Open Market Committee authorizes and directs the Federal Reserve Bank of New York, to the extent necessary to carry out the most recent domestic policy directive adopted at a meeting of the Committee:
A. To buy or sell U.S. government securities, including securities of the Federal Financing Bank, and securities that are direct obligations of, or fully guaranteed as to principal and interest by, any agency of the United States in the open market, from or to securities dealers and foreign and international accounts maintained at the Federal Reserve Bank of New York, on a cash, regular, or deferred delivery basis, for the System Open Market Account at market prices, and, for such Account, to exchange maturing U.S. government and federal agency securities with the Treasury or the individual agencies or to allow them to mature without replacement; and
B. To buy or sell in the open market U.S. government securities, and securities that are direct obligations of, or fully guaranteed as to principal and interest by, any agency of the United States, for the System Open Market Account under agreements to resell or repurchase such securities or obligations (including such transactions as are commonly referred to as repo and reverse repo transactions) in 65 business days or less, at rates that, unless otherwise expressly authorized by the Committee, shall be determined by competitive bidding, after applying reasonable limitations on the volume of agreements with individual counterparties.
2. The Federal Open Market Committee authorizes the Federal Reserve Bank of New York to undertake transactions of the type described in paragraphs 1.A and 1.B from time to time for the purpose of testing operational readiness. The aggregate par value of such transactions of the type described in paragraph 1.A shall not exceed $5 billion per calendar year. The outstanding amount of such transactions of the type described in paragraph 1.B shall not exceed $5 billion at any given time. These transactions shall be conducted with prior notice to the Committee.
3. In order to ensure the effective conduct of open market operations, the Federal Open Market Committee authorizes the Federal Reserve Bank of New York to use agents in agency MBS-related transactions.
4. In order to ensure the effective conduct of open market operations, the Federal Open Market Committee authorizes the Federal Reserve Bank of New York to lend on an overnight basis U.S. government securities and securities that are direct obligations of any agency of the United States, held in the System Open Market Account, to dealers at rates that shall
APPENDIX 1:
AUTHORIZATION FOR DOMESTIC OPEN MARKET OPERATIONS

FEDERAL RESERVE BANK OF NEW YORK 32 MARKETS GROUP
DOMESTIC OPEN MARKET OPERATIONS DURING 2013
be determined by competitive bidding. The Federal Reserve Bank of New York shall set a minimum lending fee consistent with the objectives of the program and apply reasonable limitations on the total amount of a specific issue that may be auctioned and on the amount of securities that each dealer may borrow. The Federal Reserve Bank of New York may reject bids that could facilitate a dealer’s ability to control a single issue as determined solely by the Federal Reserve Bank of New York. The Federal Reserve Bank of New York may lend securities on longer than an overnight basis to accommodate weekend, holiday, and similar trading conventions.
5. In order to ensure the effective conduct of open market operations, while assisting in the provision of short-term investments or other authorized services for foreign and international accounts maintained at the Federal Reserve Bank of New York and accounts maintained at the Federal Reserve Bank of New York as fiscal agent of the United States pursuant to section 15 of the Federal Reserve Act, the Federal Open Market Committee authorizes and directs the Federal Reserve Bank of New York:
A. For the System Open Market Account, to sell U.S. government securities and securities that are direct obligations of, or fully guaranteed as to principal and interest by, any agency of the United States to such accounts on the bases set forth in paragraph 1.A under agreements providing for the resale by such accounts of those securities in 65 business days or less on terms comparable to those available on such transactions in the market;
B. For the New York Bank account, when appropriate, to undertake with dealers, subject to the conditions imposed on purchases and sales of securities in paragraph l.B, repurchase agreements in U.S. government securities and securities that are direct obligations of, or fully guaranteed as to principal and interest by, any agency of the United States, and to
arrange corresponding sale and repurchase agreements between its own account and such foreign, international, and fiscal agency accounts maintained at the Bank; and
C. For the New York Bank account, when appropriate, to buy U.S. government securities and obligations that are direct obligations of, or fully guaranteed as to principal and interest by, any agency of the United States from such foreign and international accounts maintained at the Bank under agreements providing for the repurchase by such accounts of those securities on the same business day.
Transactions undertaken with such accounts under the provisions of this paragraph may provide for a service fee when appropriate.
6. In the execution of the Committee’s decision regarding policy during any intermeeting period, the Committee authorizes and directs the Federal Reserve Bank of New York, upon the instruction of the Chairman of the Committee, to (i) adjust somewhat in exceptional circumstances the degree of pressure on reserve positions and hence the intended federal funds rate and to take actions that result in material changes in the composition and size of the assets in the System Open Market Account other than those anticipated by the Committee at its most recent meeting or (ii) undertake transactions of the type described in paragraphs 1.A and 1.B in order to appropriately address temporary disruptions of an operational or highly unusual nature in U.S. dollar funding markets. Any such adjustment as described in clause (i) shall be made in the context of the Committee’s discussion and decision at its most recent meeting and the Committee’s long-run objectives to foster maximum employment and price stability, and shall be based on economic, financial, and monetary developments during the intermeeting period. Consistent with Committee practice, the Chairman, if feasible, will consult with the Committee before making any instruction under this paragraph.

FEDERAL RESERVE BANK OF NEW YORK 33 MARKETS GROUP
DOMESTIC OPEN MARKET OPERATIONS DURING 2013
On September 17, 2013, by unanimous vote, the
FOMC approved a resolution providing the Desk
with the authority to conduct an exercise of fixed-
rate overnight reverse repurchase operations
through January 29, 2014. An additional resolution
was unanimously approved on December 17, 2013,
to increase the maximum allotment cap per
counterparty in the operations.
RESOLUTION APPROVED ON SEPTEMBER 17, 2013
The Federal Open Market Committee (FOMC)
authorizes the Federal Reserve Bank of New York
to conduct a series of fixed-rate, overnight reverse
repurchase operations involving U.S. Government
securities, and securities that are direct obligations
of, or fully guaranteed as to principal and interest
by, any agency of the United States, for the
purpose of assessing operational readiness. The
reverse repurchase operations authorized by this
resolution shall be (i) offered at a fixed rate that
may vary from zero to five basis points, (ii) offered
at up to a capped allotment per counterparty of
$1 billion per day and (iii) for an overnight term, or
such longer term as is warranted to accommodate
weekend, holiday, and similar trading conventions.
The System Open Market Account Manager will
inform the FOMC in advance of the terms of the
planned operations. These operations may be
announced when authorized by the Chairman, may
begin when authorized by the Chairman on or
after September 23, 2013, and shall be authorized
through the FOMC meeting that ends on Janu-
ary 29, 2014.
RESOLUTON APPROVED ON DECEMBER 17, 2013
The Federal Open Market Committee authorizes
an increase in the maximum allotment cap for the
series of fixed-rate, overnight reverse repurchase
operations approved on September 17, 2013, to
$3 billion per counterparty per day from its previous
level of $1 billion per counterparty per day. All other
aspects of the resolution remain unchanged.
APPENDIX 2:
RESOLUTIONS AUTHORIZING FIXED-RATE, OVERNIGHT
REVERSE REPURCHASE OPERATIONS

FEDERAL RESERVE BANK OF NEW YORK 34 MARKETS GROUP
DOMESTIC OPEN MARKET OPERATIONS DURING 2013
The Guidelines for the Conduct of System Open
Market Operations in Federal-Agency Issues, which
were temporarily suspended on January 27, 2009,
remain suspended.
APPENDIX 3:
GUIDELINES FOR THE CONDUCT OF SYSTEM OPEN MARKET
OPERATIONS IN FEDERAL-AGENCY ISSUES

FEDERAL RESERVE BANK OF NEW YORK 35 MARKETS GROUP
DOMESTIC OPEN MARKET OPERATIONS DURING 2013
In 2013, the FOMC directed the Federal Reserve
Bank of New York to execute transactions in the
System Open Market Account in accordance with
the following domestic policy directives:
DIRECTIVE ISSUED ON JANUARY 30
Consistent with its statutory mandate, the Federal
Open Market Committee seeks monetary and
financial conditions that will foster maximum
employment and price stability. In particular, the
Committee seeks conditions in reserve markets
consistent with federal funds trading in a range
from 0 to ¼ percent. The Committee directs the Desk
to undertake open market operations as necessary
to maintain such conditions. The Desk is directed to
continue purchasing longer-term Treasury securities
at a pace of about $45 billion per month and to
continue purchasing agency mortgage-backed
securities at a pace of about $40 billion per month.
The Committee also directs the Desk to engage
in dollar roll and coupon swap transactions as
necessary to facilitate settlement of the Federal
Reserve’s agency MBS transactions. The Committee
directs the Desk to maintain its policy of rolling
over maturing Treasury securities into new issues
and its policy of reinvesting principal payments
on all agency debt and agency mortgage-backed
securities in agency mortgage-backed securities.
The System Open Market Account Manager and
the Secretary will keep the Committee informed
of ongoing developments regarding the System’s
balance sheet that could affect the attainment over
time of the Committee’s objectives of maximum
employment and price stability.
DIRECTIVE ISSUED ON MARCH 20
Consistent with its statutory mandate, the Federal
Open Market Committee seeks monetary and
financial conditions that will foster maximum
employment and price stability. In particular, the
Committee seeks conditions in reserve markets
consistent with federal funds trading in a range
from 0 to ¼ percent. The Committee directs the
Desk to undertake open market operations as
necessary to maintain such conditions. The Desk
is directed to continue purchasing longer-term
Treasury securities at a pace of about $45 billion
per month and to continue purchasing agency
mortgage-backed securities at a pace of about
$40 billion per month. The Committee also directs
the Desk to engage in dollar roll and coupon swap
transactions as necessary to facilitate settlement
of the Federal Reserve’s agency mortgage-backed
securities transactions. The Committee directs the
Desk to maintain its policy of rolling over maturing
Treasury securities into new issues and its policy
of reinvesting principal payments on all agency
debt and agency mortgage-backed securities in
agency mortgage-backed securities. The System
Open Market Account Manager and the Secretary
will keep the Committee informed of ongoing
developments regarding the System’s balance sheet
that could affect the attainment over time of the
Committee’s objectives of maximum employment
and price stability.
DIRECTIVE ISSUED ON MAY 1
Consistent with its statutory mandate, the Federal
Open Market Committee seeks monetary and
financial conditions that will foster maximum
employment and price stability. In particular, the
APPENDIX 4:
DOMESTIC POLICY DIRECTIVES ISSUED TO
THE FEDERAL RESERVE BANK OF NEW YORK

FEDERAL RESERVE BANK OF NEW YORK 36 MARKETS GROUP
DOMESTIC OPEN MARKET OPERATIONS DURING 2013
Committee seeks conditions in reserve markets
consistent with federal funds trading in a range
from 0 to ¼ percent. The Committee directs the
Desk to undertake open market operations as
necessary to maintain such conditions. The Desk
is directed to continue purchasing longer-term
Treasury securities at a pace of about $45 billion
per month and to continue purchasing agency
mortgage-backed securities at a pace of about
$40 billion per month. The Committee also directs
the Desk to engage in dollar roll and coupon swap
transactions as necessary to facilitate settlement
of the Federal Reserve’s agency mortgage-backed
securities transactions. The Committee directs the
Desk to maintain its policy of rolling over maturing
Treasury securities into new issues and its policy
of reinvesting principal payments on all agency
debt and agency mortgage-backed securities in
agency mortgage-backed securities. The System
Open Market Account Manager and the Secretary
will keep the Committee informed of ongoing
developments regarding the System’s balance sheet
that could affect the attainment over time of the
Committee’s objectives of maximum employment
and price stability.
DIRECTIVE ISSUED ON JUNE 19
Consistent with its statutory mandate, the Federal
Open Market Committee seeks monetary and
financial conditions that will foster maximum
employment and price stability. In particular, the
Committee seeks conditions in reserve markets
consistent with federal funds trading in a range
from 0 to ¼ percent. The Committee directs the
Desk to undertake open market operations as
necessary to maintain such conditions. The Desk
is directed to continue purchasing longer-term
Treasury securities at a pace of about $45 billion
per month and to continue purchasing agency
mortgage-backed securities at a pace of about
$40 billion per month. The Committee also directs
the Desk to engage in dollar roll and coupon swap
transactions as necessary to facilitate settlement
of the Federal Reserve’s agency mortgage-backed
securities transactions. The Committee directs the
Desk to maintain its policy of rolling over maturing
Treasury securities into new issues and its policy
of reinvesting principal payments on all agency
debt and agency mortgage-backed securities in
agency mortgage-backed securities. The System
Open Market Account Manager and the Secretary
will keep the Committee informed of ongoing
developments regarding the System’s balance sheet
that could affect the attainment over time of the
Committee’s objectives of maximum employment
and price stability.
DIRECTIVE ISSUED ON JULY 31
Consistent with its statutory mandate, the Federal
Open Market Committee seeks monetary and
financial conditions that will foster maximum
employment and price stability. In particular, the
Committee seeks conditions in reserve markets
consistent with federal funds trading in a range
from 0 to ¼ percent. The Committee directs the
Desk to undertake open market operations as
necessary to maintain such conditions. The Desk
is directed to continue purchasing longer-term
Treasury securities at a pace of about $45 billion
per month and to continue purchasing agency
mortgage-backed securities at a pace of about
$40 billion per month. The Committee also directs
the Desk to engage in dollar roll and coupon swap
transactions as necessary to facilitate settlement
of the Federal Reserve’s agency mortgage-backed
securities transactions. The Committee directs the
Desk to maintain its policy of rolling over maturing
Treasury securities into new issues and its policy
of reinvesting principal payments on all agency
debt and agency mortgage-backed securities in
agency mortgage-backed securities. The System
Open Market Account Manager and the Secretary
will keep the Committee informed of ongoing
developments regarding the System’s balance sheet

FEDERAL RESERVE BANK OF NEW YORK 37 MARKETS GROUP
DOMESTIC OPEN MARKET OPERATIONS DURING 2013
that could affect the attainment over time of the
Committee’s objectives of maximum employment
and price stability.
DIRECTIVE ISSUED ON SEPTEMBER 18
Consistent with its statutory mandate, the Federal
Open Market Committee seeks monetary and
financial conditions that will foster maximum
employment and price stability. In particular, the
Committee seeks conditions in reserve markets
consistent with federal funds trading in a range
from 0 to ¼ percent. The Committee directs the
Desk to undertake open market operations as
necessary to maintain such conditions. The Desk
is directed to continue purchasing longer-term
Treasury securities at a pace of about $45 billion
per month and to continue purchasing agency
mortgage-backed securities at a pace of about
$40 billion per month. The Committee also directs
the Desk to engage in dollar roll and coupon swap
transactions as necessary to facilitate settlement
of the Federal Reserve’s agency mortgage-backed
securities transactions. The Committee directs the
Desk to maintain its policy of rolling over maturing
Treasury securities into new issues and its policy
of reinvesting principal payments on all agency
debt and agency mortgage-backed securities in
agency mortgage-backed securities. The System
Open Market Account Manager and the Secretary
will keep the Committee informed of ongoing
developments regarding the System’s balance sheet
that could affect the attainment over time of the
Committee’s objectives of maximum employment
and price stability.
DIRECTIVE ISSUED ON OCTOBER 30
Consistent with its statutory mandate, the Federal
Open Market Committee seeks monetary and
financial conditions that will foster maximum
employment and price stability. In particular, the
Committee seeks conditions in reserve markets
consistent with federal funds trading in a range
from 0 to ¼ percent. The Committee directs the
Desk to undertake open market operations as
necessary to maintain such conditions. The Desk
is directed to continue purchasing longer-term
Treasury securities at a pace of about $45 billion
per month and to continue purchasing agency
mortgage-backed securities at a pace of about
$40 billion per month. The Committee also directs
the Desk to engage in dollar roll and coupon swap
transactions as necessary to facilitate settlement
of the Federal Reserve’s agency mortgage-backed
securities transactions. The Committee directs the
Desk to maintain its policy of rolling over maturing
Treasury securities into new issues and its policy
of reinvesting principal payments on all agency
debt and agency mortgage-backed securities in
agency mortgage-backed securities. The System
Open Market Account Manager and the Secretary
will keep the Committee informed of ongoing
developments regarding the System’s balance sheet
that could affect the attainment over time of the
Committee’s objectives of maximum employment
and price stability.
DIRECTIVE ISSUED ON DECEMBER 18
Consistent with its statutory mandate, the Federal
Open Market Committee seeks monetary and
financial conditions that will foster maximum
employment and price stability. In particular, the
Committee seeks conditions in reserve markets
consistent with federal funds trading in a range
from 0 to 1/4 percent. The Committee directs the
Desk to undertake open market operations as
necessary to maintain such conditions. Beginning
in January, the Desk is directed to purchase
longer-term Treasury securities at a pace of about
$40 billion per month and to purchase agency
mortgage-backed securities at a pace of about
$35 billion per month. The Committee also directs
the Desk to engage in dollar roll and coupon swap
transactions as necessary to facilitate settlement

FEDERAL RESERVE BANK OF NEW YORK 38 MARKETS GROUP
DOMESTIC OPEN MARKET OPERATIONS DURING 2013
of the Federal Reserve’s agency mortgage-backed
securities transactions. The Committee directs the
Desk to maintain its policy of rolling over maturing
Treasury securities into new issues and its policy
of reinvesting principal payments on all agency
debt and agency mortgage-backed securities in
agency mortgage-backed securities. The System
Open Market Account Manager and the Secretary
will keep the Committee informed of ongoing
developments regarding the System’s balance sheet
that could affect the attainment over time of the
Committee’s objectives of maximum employment
and price stability.

FEDERAL RESERVE BANK OF NEW YORK 39 MARKETS GROUP
DOMESTIC OPEN MARKET OPERATIONS DURING 2013
The Open Market Trading Desk requires a robust
network of trading counterparties in order to
provide the necessary operational capacity for the
implementation of monetary policy. As of the end
of 2013, there were two categories of standing
counterparties for the conduct of domestic open
market operations. In addition, in July 2013, the
Desk established trading relationships with several
small firms in certain Treasury market operations
under a pilot program that is expected to run
through mid-2014.
PRIMARY DEALERS
The New York Fed trades U.S. government and
other securities with designated primary dealers,
which include banks and securities broker-dealers.
The role of the primary dealer includes the
obligations to: (i) participate consistently as a
counterparty to the New York Fed in its execution of
open market operations to carry out U.S. monetary
policy pursuant to the direction of the FOMC;
(ii) provide the Desk with market information and
analysis helpful in the formulation and implementation
of monetary policy; (iii) participate in all auctions of
U.S. government debt; and (iv) make reasonable
markets for the New York Fed when it transacts on
behalf of its foreign official account holders.
Primary dealer relationships are administered
through an operating policy that sets standards that
must be met initially and on an ongoing basis.69
These include business standards, which define the
expectations of primary dealers in carrying out their
responsibility as counterparties, including minimum
participation requirements in U.S. government debt
auctions, as well as expectations that the primary
dealers act as responsible market participants in their
overall conduct and support of market efficiency and
liquidity. Primary dealers are also expected to meet
certain minimum capital requirements and maintain a
robust compliance program under the standards.
As of December 31, 2013, there were twenty-one
primary dealers. There were no changes to the list
of primary dealers in 2013.70
REVERSE REPO COUNTERPARTIES
To prepare for the potential need to conduct large-
scale reverse repurchase agreement transactions, the
New York Fed has been developing arrangements
with an expanded set of counterparties with
whom it can conduct just these transactions. These
counterparties augment the existing set of primary
dealer counterparties with whom the Federal Reserve
can already conduct reverse repurchase agreements.
The expanded set of reverse repo counterparties
are also eligible to participate in the New York Fed’s
overnight, fixed-rate reverse repo exercise.
As of December 31, 2013, there were 118
reverse repo expanded counter parties—18 banks,
6 government-sponsored enterprises, and 94 money
funds (representing 25 fund families)—and the
21 primary dealers, bringing the total number of
reverse repo counterparties to 139.71
TREASURY OPERATIONS COUNTERPARTY
PILOT PROGRAM
On February 20, 2013, the New York Fed announced
a pilot program for a few small firms to act as
counterparties in Treasury market operations it
conducts for the SOMA portfolio.72 The intent in
APPENDIX 5:
FEDERAL RESERVE BANK OF NEW YORK COUNTERPARTIES
FOR DOMESTIC OPEN MARKET OPERATIONS

FEDERAL RESERVE BANK OF NEW YORK 40 MARKETS GROUP
DOMESTIC OPEN MARKET OPERATIONS DURING 2013
conducting the Treasury Operations Counterparty
(TOC) pilot program is to explore ways to
broaden access to open market operations, and
to determine the extent to which firms beyond
the primary dealer community can augment the
New York Fed’s operational capacity and resilience
in its monetary policy operations. The year-long
program launched in July 2013 and is expected to
run until the end of July 2014.
Pilot program participants take part in Desk
operations to conduct secondary market outright
purchases or sales of U.S. Treasury securities,
along with primary dealers. They are subject to
appropriate size limitations on aggregate daily bids
and unsettled awards, determined by the New York
Fed, commensurate with the firm’s capital position.
Participation in the pilot program does not mean
that a firm has been designated as a primary dealer,
and does not guarantee the ability to participate
in any permanent program the New York Fed may
establish in the future.
Participants in the pilot program were expected
to meet a range of business, operational, financial,
and compliance requirements. In order to maximize
the information to be gained from the pilot, the
New York Fed aimed to select a small subset of
eligible firms that was diverse with respect to
characteristics such as size and geographic reach.
Following an application and evaluation period
for eligibility, on June 6, 2013, the New York Fed
announced that four firms would participate in
the TOC pilot program.73 The small number of
firms in the pilot program was intended to keep
the New York Fed’s operational costs relatively
low and reduce the time needed to onboard new
counterparties.

ENDNOTES
DOMESTIC OPEN MARKET OPERATIONS DURING 2013
FEDERAL RESERVE BANK OF NEW YORK 41 MARKETS GROUP
1Unless otherwise stated, all dollar values of securities held in the domestic SOMA portfolio refer to par (face) values and include both settled and unsettled amounts. Values of agency MBS refer to the current face value of the securities (that is, the remaining principal balance of the underlying securities). The Federal Reserve reports SOMA securities holdings at par (face) value and any unamortized premiums or discounts separately in its weekly statistical release on the balance sheet. For financial statement reporting purposes, SOMA securities holdings are reported at amortized cost, and gains and losses resulting from sales of securities are determined by specific issue based on average cost.
2Activities affecting foreign reserves held in the SOMA are reported separately. See http://www .newyorkfed.org/markets/quar_reports.html.
3See http://www.newyorkfed.org/markets/omo/omo2013.xlsx.
4The Committee decided to reduce the pace of purchases at its December 2013 meeting, but the new purchase pace only became effective in January 2014.
5A number of studies in recent years address the mechanisms through which the Federal Reserve’s asset purchase programs may affect financial variables and the real economy. For example, see Canlin Li and Min Wei, “Term Structure Modelling with Supply Factors and the Federal Reserve’s Large-Scale Asset Purchase Programs,” Board of Governors of the Federal Reserve System Finance and Economics Discussion Series, no. 2012-37, May 2012; Joseph Gagnon, Matthew Raskin, Julie Remache, and Brian Sack, “Large-Scale Asset Purchases by the Federal Reserve: Did They Work?” Federal Reserve Bank of New York Staff Reports, no. 441, March 2010; Arvind Krishnamurthy and Annette Vissing-Jorgensen, “The Ins and Outs of LSAPs,” Federal Reserve Bank of Kansas City Economic Policy Symposium, Jackson Hole; and Jonathan H. Wright, “What Does Monetary Policy Do to Long-Term Interest Rates at the Zero Lower Bound?” NBER Working Paper no. 17154, June 2012.
6For further analyses on agency MBS purchases, see Diana Hancock and Wayne Passmore, “Did the Federal Reserve’s MBS Purchase Program Lower Mortgage Rates?” Journal of Monetary Economics 58, July 2011: 498-514. See also http://www.newyorkfed.org/newsevents/speeches/2013/pot130301.html and http://www.newyorkfed.org/newsevents/speeches/2009/sac091202.html.
7As of December 31, 2013, $11.8 trillion (excluding intragovernmental holdings) of outstanding marketable bills, notes, bonds, and Treasury inflation-protected securities (TIPS) had been issued by the Treasury, up from $11.0 trillion at the end of 2012.
8These totals include unsettled commitments of $58 billion as of year-end associated with forward-settling purchase transactions. Unsettled commitments at the end of 2012 were $112 billion. The SOMA’s settled agency MBS holdings increased by $564 billion over 2013, resulting in a year-end level of $1.5 trillion.
9About $7 million of SOMA agency MBS holdings are of ten- and twenty-year securities.
10Duration is generally greater for longer-maturity and lower-coupon securities. Duration measures differ across instruments. For Treasury and agency debt securities, which have fixed cash flows, “modified duration” approximates the price sensitivity of an asset to a parallel shift in the yield curve. For agency MBS, “effective duration” also approximates the percentage change in price for a parallel shift but, in addition, incorporates the fact that cash flows vary as interest rates change because of the embedded option in MBS. Nonetheless, effective duration is an incomplete estimate of the price sensitivity of MBS because it does not fully account for the changes in cash flows attributable to changes in borrowers’ prepayment behavior.
11The effective duration numbers for agency MBS cited in this report are computed by BlackRock Solutions, which provides to the New York Fed daily analysis of the SOMA agency MBS portfolio.

FEDERAL RESERVE BANK OF NEW YORK 42 MARKETS GROUP
DOMESTIC OPEN MARKET OPERATIONS DURING 2013
Effective duration estimates are subject to frequent model changes, and those changes can cause significant variations in duration estimates.
12Trends during 2013 in the weighted-average maturity of SOMA holdings largely reflected the general patterns in duration. For example, the weighted average life of SOMA agency MBS holdings, which requires subjective assumptions about the prepayment behavior of the underlying mortgages in the portfolio, increased from 3.3 to 6.5 years amid changes in interest rates and the existing composition of the portfolio. Also, the weighted-average maturity of Treasury holdings edged down from 10.4 to 10.1 years, as new purchases of longer-dated securities offset only in part the natural aging of the existing portfolio of Treasury securities.
13The ten-year-equivalent measure for MBS fluctuates because the duration of MBS is highly sensitive to interest rates.
14SOMA income reflects the interest income earned on outright holdings of domestic securities, as well as other earnings (including interest income from foreign-currency-denominated assets and central bank liquidity swaps, any realized capital gains or losses, foreign currency translation gains or losses, and noninterest sources of income), less direct interest expenses, such as interest paid on reverse repurchase agreements associated with the SOMA portfolio. SOMA net income is SOMA income less the interest paid on the reserve balance liabilities created by some SOMA assets. See http://www.federalreserve.gov/newsevents/press/other/20140314a.htm.
15SOMA income in 2013 included, among other line items, $90 billion of interest income generated by its domestic securities portfolio and $60 million of interest expense, which includes $56 million related to reverse repos conducted with foreign official and international accounts and $1 million related to tri-party reverse repos conducted with primary dealers and expanded counterparties.
16Federal Reserve notes (currency) represent another large liability category on the Federal Reserve’s balance sheet. Although the Federal Reserve pays no interest on these notes, Reserve
Banks pay expenses incidental to the issuance and retirement of currency (such as costs related to manufacturing, shipping, issuance, retirement, educational services, and research and development). These expenses do not vary with the level of interest rates, unlike certain other liabilities. Currency costs were $705 million in 2013, down from $721 million in 2012.
17The SOMA has at times reflected periods of unrealized losses, particularly in the early 1980s when interest rates were high and volatile as the FOMC followed policies to reduce inflation and stabilize inflation expectations. Remittances to the Treasury were not affected. See http://libertystreeteconomics.newyorkfed.org/2014/04/just-released-the-2013-soma-annual-report-in-a-historical-context.html.
18Remittances to the Treasury are generated by net SOMA income as well as by proceeds from other Federal Reserve accounts, and reflect all Federal Reserve earnings in excess of those needed for operating costs, dividends, and capital maintenance.
19A similar projection exercise for various scenarios and more detail on the modeling approach and other balance sheet assumptions can be found in Seth B. Carpenter, Jane E. Ihrig, Elizabeth C. Klee, Daniel W. Quinn, and Alexander H. Boote, “The Federal Reserve’s Balance Sheet and Earnings: A Primer and Projections,” Board of Governors of the Federal Reserve System Finance and Economics Discussion Series, no. 2013-01, January 2013 (revised in September 2013 to reflect the FOMC’s June 2013 change in portfolio normalization guidance).
20See http://www.newyorkfed.org/markets/survey/2014/January_result.pdf.
21See http://www.federalreserve.gov/monetarypolicy/files/fomcminutes20130619.pdf.
22Compared with the 2012 report’s baseline scenario, which assumed that agency MBS would be sold during normalization, the current baseline is projected to generate a higher level of SOMA net income throughout most of the normalization period. The shift to a passive roll-off of the

FEDERAL RESERVE BANK OF NEW YORK 43 MARKETS GROUP
DOMESTIC OPEN MARKET OPERATIONS DURING 2013
agency MBS portfolio keeps the size of the portfolio elevated. Although this increases funding costs at a time when interest rates are rising, it increases interest income from the holdings and eliminates the realization of losses from asset sales.
23The higher- and lower-rate scenarios assume that all interest rates are 1 percentage point (100 basis points) higher or lower, respectively, than the rates used in the baseline scenario. The shocks are phased in over two quarters, beginning in the fourth quarter of 2015 when the federal funds target rate is assumed to rise above its current level. In both cases, all other assumptions, including changes in the size and composition of the portfolio, were held constant.
24Projection results are also sensitive to assumptions about future portfolio management strategies. The effect on projected income of the FOMC’s June 2013 guidance suggesting a reduced likelihood of agency MBS sales during normalization can be seen by comparing results from the current baseline scenario (which assumes such sales) with an alternative scenario that actively reduces the size of the portfolio through agency MBS asset sales, while keeping all other assumptions the same. With asset sales, the size of the portfolio is normalized approximately two years sooner than in the baseline. While this portfolio normalization strategy reduces funding costs, the lower coupon income associated with lower portfolio balances and the realization of capital losses from asset sales reduces SOMA net income to a trough close to zero. Data associated with this scenario can be found at http://www .newyorkfed.org/markets/omo/omo2013.xlsx.
25In the baseline, growth of Federal Reserve notes in the near term is forecasted to be in line with recent trends. In the medium and longer term, it is assumed to grow in line with nominal GDP growth. The higher and lower currency growth scenarios apply 3 percentage point annualized shocks across the entire forecast period in the construction of the scenario.
26Additional discussion of income projections under a counterfactual scenario can be found at http://libertystreeteconomics.newyorkfed.
org/2014/04/just-released-the-2013-soma-annual-report-in-a-historical-context.html.
27The FOMC reaffirmed the pace of $45 billion per month in Treasury security purchases throughout 2013, but on December 18, 2013, announced that the pace of additional purchases would decline to $40 billion per month starting in January 2014.
28In accordance with long-standing practice, rollovers are accomplished by placing bids at Treasury auctions as noncompetitive tenders, treated as add-ons to announced auction sizes and equal in par amount to the value of the maturing holdings on the issue date of the new security.
29See http://www.newyorkfed.org/markets/longertermtreas_faq.html.
30See http://www.newyorkfed.org/markets/opolicy/operating_policy_121212.html and http://www.newyorkfed.org/markets/longertermtreas _faq_12122012.html, respectively.
31In addition to the monthly information on prices paid, in accordance with Section 1103 of the Dodd-Frank Wall Street Reform and Consumer Protection Act of 2010, complete details of individual open market transactions—including transactions in Treasury securities, agency MBS, repo and reverse repo agreements, and securities lending—as well as discount window advances, are published quarterly, approximately two years after the transactions were conducted. Details include the date and amount of the transaction, the counterparty to the transaction, the price or interest rate at which the transaction was conducted, and other relevant terms. See http://www.federalreserve.gov/newsevents/reform _quarterly_transaction.htm.
32See http://www.newyorkfed.org/markets/toc _announcement.html.
33The program offers specific Treasury and agency debt securities for loan from the SOMA portfolio under specified terms and conditions. Securities loans are awarded to primary dealers for a fee, based on competitive bidding in an auction held each business day at noon. All securities loans

FEDERAL RESERVE BANK OF NEW YORK 44 MARKETS GROUP
DOMESTIC OPEN MARKET OPERATIONS DURING 2013
are margined and collateralized with Treasury securities. The “Agency Debt” section of this report discusses agency debt securities lending activity in 2013.
34The FOMC reaffirmed a pace for agency MBS purchases of $40 billion per month throughout 2013, but on December 18, 2013, announced that the pace of additional purchases would decline to $35 billion per month starting in January 2014.
35Together, these operations, along with dollar roll transactions, resulted in 5,030 agency MBS transactions in 2013, compared with about 3,100 in 2012. This number includes both outright purchases and dollar roll transactions.
36A dollar roll is a transaction that generally involves the purchase or sale of agency MBS for delivery in the current month, with the simultaneous agreement to sell or purchase substantially similar (although not necessarily the same) securities on a specified future date. Selling dollar rolls effectively postpones the settlement of outstanding forward purchase commitments, while purchasing dollar rolls effectively brings settlement forward.
37In the “to-be-announced” (TBA) transactions that the Desk typically conducts, sellers have an incentive to identify securities that are the most economical to deliver while also meeting an agreed-upon set of basic characteristics. (See the “Operational Approach” discussion of this report for more information about the TBA market.) These so-called “cheapest-to-deliver” agency MBS are generally the least valuable because their underlying mortgages tend to have higher prepayment risk. Of course, buyers in a TBA transaction understand that sellers will look to exercise their option of delivering these relatively less valuable pools, and the price of the TBA contract will reflect the expected value of these securities.
38See http://www.newyorkfed.org/markets/opolicy/operating_policy_120913.html.
39See http://www.newyorkfed.org/markets/ambs/.
40Only fixed-rate agency MBS securities guaranteed by Fannie Mae, Freddie Mac, or Ginnie Mae are
eligible for purchase. Eligible assets include, but are not limited to, thirty- and fifteen-year securities of the issuers. Collateralized mortgage obligations, real estate mortgage investment conduits, trust interest-only securities/trust principal-only securities, and other mortgage derivatives or cash equivalents are excluded under the additional purchase program and reinvestments.
41For more information about the TBA market, see James Vickery and Joshua Wright, “TBA Trading and Liquidity in the Agency MBS Market,” Federal Reserve Bank of New York Staff Reports, no. 468, August 2010.
42Settlement services were provided by Wellington Management. JPMorgan Chase provided custodial and administrative support.
43The New York Fed established margin agreements with all primary dealers with whom it trades agency MBS in November 2011. Sales transactions, such as dollar roll sales, are also included in the New York Fed’s daily variation margin calculation because their forward settlement generates counterparty risk if the market value (replacement cost) is below the transaction price.
44See http://www.newyorkfed.org/tmpg/bestpractices_052313.pdf.
45The Desk accepts Treasury securities as collateral for these transactions.
46See http://www.federalreserve.gov/newsevents/press/monetary/20131218a.htm.
47The rates cited in this report use as an indicator the General Collateral Finance (GCF) Treasury Repo Index®, a weighted average of the interest rates paid each day on GCF repurchase agreements for Treasury securities, calculated by The Depository Trust & Clearing Corporation.
48On October 16, the FOMC met by video-conference to discuss contingency issues in the event the Treasury was temporarily unable to meet its obligations because the debt limit was not raised. Meeting participants saw no legal or operational need in the event of delayed payments on Treasury securities to make changes

FEDERAL RESERVE BANK OF NEW YORK 45 MARKETS GROUP
DOMESTIC OPEN MARKET OPERATIONS DURING 2013
in the conduct or procedures employed in then-authorized Desk operations. They also noted that under certain circumstances, the Desk might act to facilitate the smooth transmission of monetary policy through money markets and to address disruptions in market functioning and liquidity. See http://www.federalreserve.gov/monetarypolicy/files/fomcminutes20131030.pdf.
49See http://www.newyorkfed.org/newsevents/speeches/2013/pot131202.html.
50See http://www.federalreserve.gov/monetarypolicy/tdf_2013.htm.
51The New York Fed’s authority to maintain standing dollar liquidity swap arrangements with designated foreign central banks and to undertake small-value exercises in them for the purpose of testing operational readiness is granted by the FOMC in a separate authorization for foreign currency operations. See http://federalreserve.gov/monetarypolicy/files/FOMC _ForeignAuthorization.pdf.
52See http://www.federalreserve.gov/monetarypolicy/files/fomcminutes20130918.pdf and http://www.newyorkfed.org/markets/opolicy/operating_policy_130920.html.
53At its January 2014 meeting, the FOMC subsequently authorized an extension of the fixed-rate ON RRP exercise through January 30, 2015.
54The FOMC’s September 17, 2013, resolution specified that the per-counterparty bid limit would be no more than $1 billion and that the allowable range for the fixed rate offered on ON RRPs was 0 to 5 basis points. On December 17, 2013, the FOMC amended the original resolution to allow the per-counterparty bid limit to be increased to no more than $3 billion. Details on operational changes can be found at http://www .newyorkfed.org/markets/op_policies.html.
55See http://www.newyorkfed.org/markets/opolicy/operating_policy_131118a.html.
56See http://www.newyorkfed.org/markets/toc _announcement.html.
57See http://www.newyorkfed.org/markets/toc _announcement_130606.html.
58The definition of excess reserve balances changed on June 27, 2013, as a consequence of revisions to Federal Reserve Regulation D, which governs the administration of reserve requirements. Prior to June 27, excess reserves were defined as the difference between actual reserve balances held by depository institutions and their reserve balance requirements. Effective June 27, changes to Regulation D introduced penalty-free bands around reserve requirements. In light of this change, the excess balances listed by the Federal Reserve Board in its weekly H.3 report since June 27 have been the sums of balances exceeding the upper bound of depository institutions’ penalty-free bands. At the end of 2013, balances exceeding the upper bound of the penalty-free bands were $7 billion lower than the simple difference between reserve balances and reserve balance requirements.
59In this discussion, the term “Federal Reserve notes outstanding” refers to Federal Reserve notes net of Federal Reserve Bank holdings.
60Beginning in 2011, Argentina enacted a series of laws that slowed the importation of U.S. currency during 2013. Egypt, Nigeria, and Uzbekistan also enacted measures that curbed imports of U.S. currency in 2013.
61Daily TGA balances data are available at http://www.fms.treas.gov/dts/index.html.
62The Treasury holds another account at the Federal Reserve associated with its Supplementary Financing Program, which was started during the financial crisis to absorb excess reserves. This account has had a zero balance since mid-2011.
63An increase in the level of balances in any of these accounts drains reserve balances from the banking system as account owners move money from a depository institution to their accounts with the New York Fed.
64The size of the foreign repo pool is itemized in the Board of Governors’ weekly H.4.1 statistical

FEDERAL RESERVE BANK OF NEW YORK 46 MARKETS GROUP
DOMESTIC OPEN MARKET OPERATIONS DURING 2013
release of factors affecting reserve balances. See http://www.federalreserve.gov/releases/h41/.
65Separately, in 2013, the New York Fed initiated the conduct of intraday repurchase agreement transactions with foreign and international accounts to prevent daylight overdrafts in those accounts.
66Foreign official deposits comprise balances of foreign official and international accounts held at the New York Fed. “Other deposits” include balances held by other entities such as GSEs, which use their accounts to receive and make payments, including proceeds from debt issuance and payments made for redeeming maturing debt. An increase in foreign official or other deposits typically reflects a transfer of funds from depository institutions to one or more of these organizations; thus, an increase ordinarily coincides with a reduction in reserve deposits.
67A test loan is an actual PCF loan initiated by the requesting bank. A test loan is typically for a nominal amount of $10,000 or less, but can be for a larger amount depending on the bank’s preference. Banks regularly take out test loans to
ensure that they are operationally prepared to have ready access to the PCF.
68See http://www.federalreserve.gov/newsevents/press/monetary/20131031a.htm.
69Information on the New York Fed’s administration of its relationships with primary dealers—including requirements for business standards, financial condition and supervision, and compliance and controls—is available at http://www.newyorkfed.org/markets/pridealers _policies.html and http://www.newyorkfed.org/markets/pridealers_faq_100111.html.
70See http://www.newyorkfed.org/markets/pridealers_current.html.
71See http://www.newyorkfed.org/markets/expanded_counterparties.html.
72See http://www.newyorkfed.org/markets/toc _announcement.html.
73See http://www.newyorkfed.org/markets/toc _announcement_130606.html.

FEDERAL RESERVE BANK OF NEW YORK 47 MARKETS GROUP
DOMESTIC OPEN MARKET OPERATIONS DURING 2013
CHARTS
1. Size and Composition of SOMA Domestic Securities Holdings ........................... 3
2. Maturity Distribution of SOMA Treasury Holdings .............................................. 4
3. SOMA Treasury Holdings as a Share of Outstanding Treasury Supply ....................... 4
4. Distribution of SOMA Agency MBS Holdings .................................................... 5
5. Coupon Distribution of SOMA Agency MBS Holdings ....................................... 5
6. Maturity Distribution of SOMA Agency Debt Holdings ...................................... 5
7. Average Duration of SOMA Holdings ............. 6
8. SOMA Treasury Holdings and Treasury Duration ............................................. 6
9. SOMA Portfolio in Ten-Year Equivalents ......... 7
10. SOMA Net Income and Federal Reserve Remittances to Treasury ...................... 7
11. Projected SOMA Net Income: Baseline vs. 2012 Buy-and-Hold Strategy ........ 9
12. Projected SOMA Net Income: Alternative Interest Rate Paths ...................... 10
13. Projected SOMA Net Income: Alternative Currency Growth Scenarios ........ 10
14. Concentration of SOMA Treasury Security Ownership by Purchase Sector ....................... 13
15. Coverage of SOMA Treasury Purchase Operations ....................................... 14
16. Treasury Market Liquidity Measures .............. 14
17. SOMA Securities Lending in Treasuries .......... 15
18. SOMA Agency MBS Purchases ........................ 15
19. SOMA Agency MBS Principal Payments and Primary Mortgage Rate .................................. 16
20. SOMA Purchases of Agency MBS by Coupon ....................................................... 16
21. Total Agency MBS Transaction Volume ......... 18
22. SOMA Agency MBS Purchases as a Share of Gross Fixed-Rate Issuance .......................... 18
23. Gross Agency MBS Fails .................................. 19
24. SOMA Dollar Roll Sales ................................... 19
25. Overnight Money Market Rates ..................... 20
26. Overnight Fixed-Rate Reverse Repo Operational Exercise Allotment vs. Rate Spread in 2013 ................................... 23
27. Overnight Fixed-Rate Reverse Repo Operational Exercise Results in 2013 ............. 24
28. Reserve Balances ............................................. 26
29. Federal Reserve Notes Outstanding ............... 27
30. Treasury General Account .............................. 27
31. Select Autonomous Factors ............................ 28
32. Central Bank Liquidity Swaps Outstanding ......................................... 29
TABLES
1. Treasury Operations in 2013 ........................... 11
2. SOMA Purchase Limits for Individual Treasury Securities ........................................... 13
3. Agency MBS Operations in 2013 .................... 17
4. Terms of Overnight Fixed-Rate Reverse Repo Operational Exercise ....................................... 23
5. Primary Credit Facility: Daily Aggregate Loan Balances .................................................. 29
INDEX OF CHARTS AND TABLES