Embed Size (px)
Citation preview

DOMESTIC OPEN MARKET OPERATIONS
DURING 2011
A Report Prepared for the Federal Open Market Committee by
the Markets Group of the Federal Reserve Bank of New York
March 2012

DOMESTIC OPEN MARKET OPERATIONS DURING 2011
FEDERAL RESERVE BANK OF NEW YORK, MARKETS GROUP
I. OVERVIEW ............................................................................................................................. 1
II. SOMA DOMESTIC ASSET HOLDINGS ............................................................................... 3
A. Treasury Securities.............................................................................................................. 3
Maturity Structure and Composition ............................................................................ 3
Purchases and Sales ...................................................................................................... 5
Operational Approach ................................................................................................... 7
Purchase and Holding Limits ........................................................................................ 9
Securities Lending of Treasury Securities .................................................................. 10
B. Agency Mortgage-Backed Securities ............................................................................... 11
Holdings and Purchases .............................................................................................. 11
Operational Approach ................................................................................................. 13
Dollar Rolls ................................................................................................................. 14
CUSIP Aggregation .................................................................................................... 14
C. Agency Debt ..................................................................................................................... 15
D. Portfolio Characteristics.................................................................................................... 16
III. FEDERAL RESERVE LENDING ACTIVITY ..................................................................... 22
A. Short-Term Liquidity Provisions ...................................................................................... 22
Primary Credit Facility ............................................................................................... 22
Central Bank Liquidity Swap Lines ............................................................................ 22
B. Term Asset-Backed Securities Loan Facility (TALF) ...................................................... 24
C. Assets Associated with Lending to Specific Institutions .................................................. 25
Maiden Lane LLC ....................................................................................................... 26
AIG, Maiden Lane II LLC, and Maiden Lane III LLC .............................................. 26
IV. THE SUPPLY OF RESERVES .............................................................................................. 27
A. Required and Excess Reserves.......................................................................................... 27
B. Autonomous Factors Affecting Reserve Balances ........................................................... 29
Federal Reserve Notes ................................................................................................ 29
Treasury Balances ....................................................................................................... 30

Other Autonomous Factors ......................................................................................... 31
C. Reserve Draining Tools .................................................................................................... 32
V. OVERNIGHT FUNDING MARKETS IN 2011 .................................................................... 33
VI. CONCLUDING OBSERVATIONS ....................................................................................... 35
Appendix 1: Authorization for Domestic Open Market Operations ............................................ 37
Appendix 2: Guidelines for the Conduct of System Open Market Operations in Federal Agency
Securities ....................................................................................................................................... 39
Appendix 3: Domestic Policy Directives issued to the Federal Reserve Bank of New York ..... 40
Appendix 4: Primary Dealers....................................................................................................... 43
Page 1 of 43
DOMESTIC OPEN MARKET OPERATIONS DURING 2011
I. OVERVIEW
Domestic open market operations in 2011 were shaped by continuing efforts of the Federal Open
Market Committee (FOMC) to provide additional policy accommodation by adjusting the size
and composition of the Federal Reserve‘s balance sheet. These adjustments were designed to
promote a stronger recovery by putting downward pressure on longer-term interest rates and
making broader financial conditions more supportive of economic growth.
In the first half of 2011, the balance sheet expanded through purchases of Treasury securities to
complete the large-scale asset purchase (LSAP) program announced in November 2010.
Through this LSAP program, $600 billion in longer-term Treasury securities were added to the
System Open Market Account (SOMA) portfolio between late 2010 and the end of June 2011.1
The purchases kept the quantity of Treasury securities held by the private sector lower than it
would have otherwise been in order to put downward pressure on longer-term interest rates.
In the second half of the year, the composition of the balance sheet was affected by decisions of
the FOMC at its September 2011 meeting to shift reinvestments of maturing agency debt and
agency mortgage-backed securities (MBS) into MBS and to extend the average maturity of
Treasury holdings by selling shorter-term securities and purchasing longer-term ones. Through
September, principal payments on agency debt and MBS had been reinvested in longer-term
Treasury securities, to avoid a passive reduction in the portfolio that could put upward pressure
on longer-term interest rates. The decision to redirect those reinvestments from longer-term
Treasury securities into MBS was intended to help support conditions in mortgage markets. The
decision to extend the average maturity of the Treasury portfolio involved purchases of $400
billion of longer-dated Treasury securities and sales of the same amount of shorter-dated
1 Throughout this report, the dollar values for programs refer to par values unless otherwise stated.

Page 2 of 43
Treasury securities, to be completed by the end of June 2012.2 As with the earlier LSAP
programs, this program was intended to reduce private sector holdings of longer-term securities,
putting downward pressure on longer-term interest rates.
These three balance sheet programs required intensive open market operations by the Trading
Desk (the ―Desk‖) at the Federal Reserve Bank of New York (FRBNY) in 2011. In contrast, the
Desk did not have to conduct any open market operations to keep the federal funds rate within
the target range set by the FOMC of zero to ¼ percent over the year.
While implementing these portfolio programs, the FOMC continued to consider how the balance
sheet might evolve over the longer run. In June, the Committee described the key elements of
the strategy that it expects to follow when it becomes appropriate to begin normalizing the stance
of monetary policy and the size and composition of the SOMA portfolio.3 In addition, work
continued throughout the year to prepare for reserve draining operations that policymakers may
wish to employ as part of the strategy for normalizing the balance sheet. Preparations included
operational improvements and regular testing of reverse repurchase agreement (RRP)
transactions and term deposit facility (TDF) auctions and an expansion of counterparties for
those operations.
This report summarizes the evolution of the domestic assets held in the SOMA portfolio over
2011 and describes the open market operations that were implemented by the Desk to manage
the portfolio.4 It also presents projections of the possible evolution of the portfolio under a set of
illustrative assumptions about future policy decisions and the path of interest rates.
Developments in Federal Reserve lending arrangements and the behavior of other factors that
affect the size of the balance sheet and the level of reserve balances are also discussed. In
addition, the report includes a review of conditions in key short-term funding markets.
2 Since sales and purchases were specified in par amounts and since the market value of purchased securities have
tended to be higher than the market value of securities sold, the program has led to a modest rise in the level of
reserves. 3 Minutes of the Federal Open Market Committee, June 21-22, 2011, page 3. See
http://www.federalreserve.gov/monetarypolicy/files/fomcminutes20110622.pdf. 4 Activities affecting foreign assets held in the SOMA are reported separately. See
http://www.newyorkfed.org/markets/quar_reports.html.

Page 3 of 43
II. SOMA DOMESTIC ASSET HOLDINGS
SOMA holdings of domestic securities grew from $2.2 trillion at the beginning of the year to
$2.6 trillion at year-end, and the share of Treasury securities in the portfolio rose to 64 percent at
year-end compared to 47 percent at the start of the year. These changes were largely driven by
the purchases under the LSAP program that were completed in June. Afterwards, Treasury
holdings as a share of the total portfolio continued to increase modestly for a time because of the
Committee‘s decision in 2010 to continue to reinvest principal payments received from agency
debt and MBS into Treasury securities. The portfolio composition largely stabilized following
the FOMC‘s decision at its September meeting to redirect principal payments on agency debt and
MBS into MBS (Figure 1).
Figure 1: Size and Composition of Domestic Assets Held in the SOMA
A. Treasury Securities
Maturity Structure and Composition
In total, the combination of LSAP and reinvestment purchases drove the level of Treasury
securities holdings from $1.0 trillion at the end of 2010 to $1.7 trillion by the end of September
2011, where they remained through the rest of the year. In addition, the maturity characteristics
of the portfolio have evolved. Prior to the financial crisis, SOMA holdings of Treasury securities
were skewed towards the shorter end of the maturity spectrum. The series of balance sheet
-
500
1,000
1,500
2,000
2,500
3,000
Jan-07 Jan-08 Jan-09 Jan-10 Jan-11
USD, billion
Treasury Securities MBS Agency Debt
Source: FRBNY

Page 4 of 43
actions taken since 2007 have shifted the Treasury securities held in the SOMA portfolio towards
longer-term securities (Figure 2). This pattern was reinforced by the purchases and sales
associated with the maturity extension program in the last quarter of 2011. As a result, security
holdings with maturities beyond three years were a higher share of the total portfolio at the end
of 2011 than in 2010.
Figure 2: Maturity Distribution of SOMA Treasury Holdings
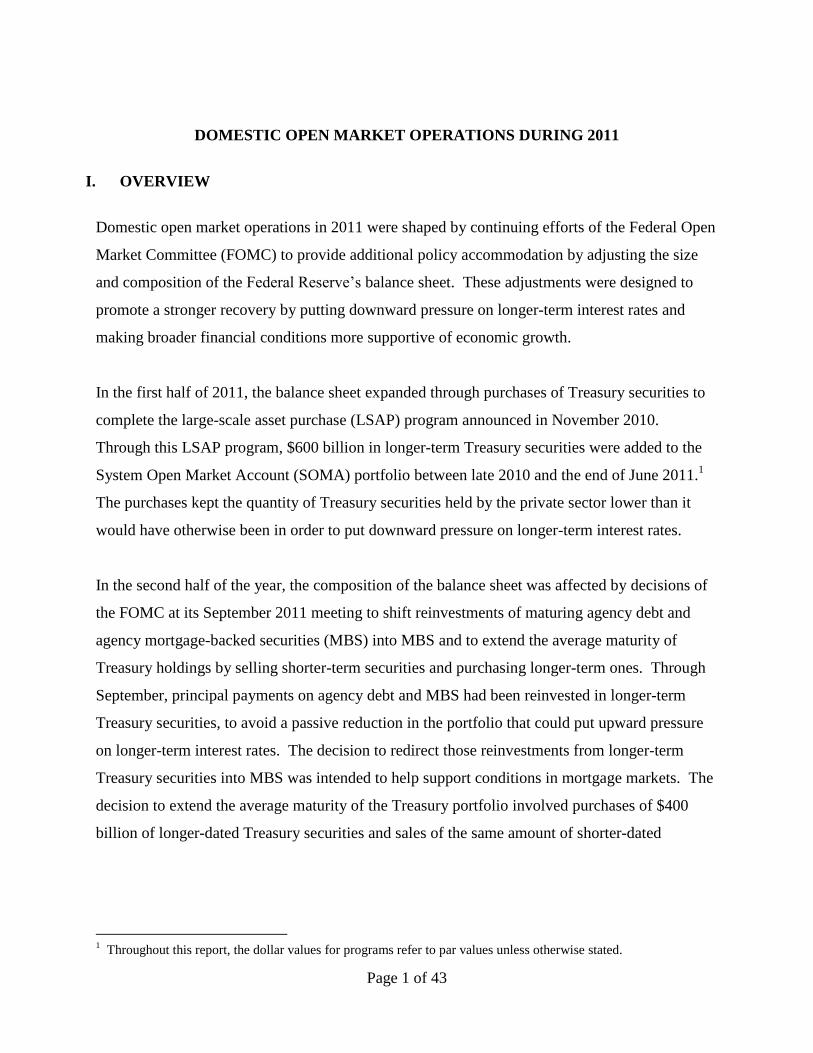
At the end of 2011, the SOMA held 18 percent of all marketable Treasury securities. Except for
the shortest dated securities, market shares by maturity sector have risen since the onset of the
financial crisis (Figure 3). In 2011, the SOMA market shares of Treasury securities with less
than three years to maturity and of TIPS were little changed at just less than ten percent. The
market share of longer-term Treasury securities, however, rose significantly. In maturity sectors
between 3 and 30 years, the SOMA portfolio holdings averaged between 25 and 35 percent of
outstanding Treasury securities at the end of the year.
0
10
20
30
40
50
60
70
< 3 yrs 3 - 6 yrs 6 - 10 yrs 10 - 30 yrs TIPS
Percent
2007 2010 2011
Source: FRBNY
Page 5 of 43
Figure 3: SOMA Holdings as a Share of Outstanding Treasury Supply
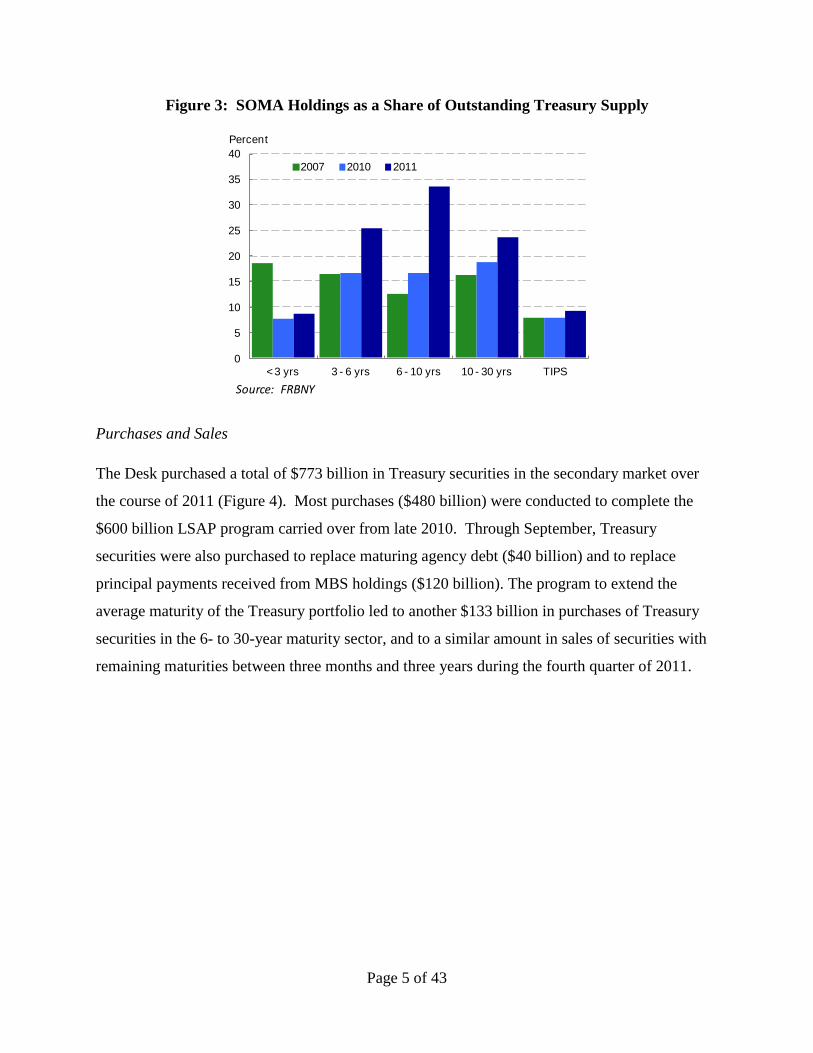
Purchases and Sales
The Desk purchased a total of $773 billion in Treasury securities in the secondary market over
the course of 2011 (Figure 4). Most purchases ($480 billion) were conducted to complete the
$600 billion LSAP program carried over from late 2010. Through September, Treasury
securities were also purchased to replace maturing agency debt ($40 billion) and to replace
principal payments received from MBS holdings ($120 billion). The program to extend the
average maturity of the Treasury portfolio led to another $133 billion in purchases of Treasury
securities in the 6- to 30-year maturity sector, and to a similar amount in sales of securities with
remaining maturities between three months and three years during the fourth quarter of 2011.
0
5
10
15
20
25
30
35
40
< 3 yrs 3 - 6 yrs 6 - 10 yrs 10 - 30 yrs TIPS
Percent
2007 2010 2011
Source: FRBNY

Page 6 of 43
Figure 4: SOMA Purchases and Sales of Treasury Securities in 2011
For the operations through September, the Desk purchased securities with maturities between 1.5
and 30 years, focusing primarily on securities in the 2- to 10-year maturity sector. Purchases
associated with the maturity extension program, however, were solely of securities with
remaining maturities of six years or greater (Figure 5). While all these programs were motivated
by a similar intent to lower long-term rates by reducing the amount of longer-term securities held
by the private sector, the maturity extension program focused purchases on longer maturity
securities than was the case in the previous purchase programs, leading to a much larger impact
on the average maturity of the securities held in the SOMA.5
5 One also has to take into consideration the future Treasury issuance patterns arising from the maturity extension
program. The Federal Reserve normally replaces maturing Treasury debt with new issues. As a result of the
maturity extension program, less debt held by the SOMA will mature between 2012 and the first half of 2015, so
the Treasury will issue more debt to the public than it would have otherwise done. To the extent that the Treasury
increases issuance of longer-maturity securities, this would offset some of the downward pressure on longer-term
interest rates from the program. For a more detailed description of the program and its effects, see
http://www.newyorkfed.org/newsevents/speeches/2011/sac111024.html.
-75
-50
-25
0
25
50
75
100
125
150
Jan Feb Mar Apr May Jun Jul Aug Sep Oct Nov Dec
USD, billion
Sales Purchases
Source: FRBNY

Page 7 of 43
Figure 5: SOMA Purchases and Sales of Treasury Securities in 2011
by Remaining Maturity
Throughout the year, the Desk continued to roll over maturing Treasury security holdings by
replacing maturing holdings with newly issued debt at Treasury security auctions. The Desk
reinvested $67 billion of maturing Treasury coupon securities, including TIPS, and routinely
rolled over the $18 billion of 4-week Treasury bills in the SOMA. These reinvestment purchases
were accomplished by placing bids for the SOMA at Treasury auctions, equal in par amount to
the value of the maturing holdings on the issue date of a new security.6
Operational Approach
The Desk arranged purchases and sales of Treasury securities according to operating policies that
were released by the Desk soon after the FOMC announced the launch of each program.7 These
communications outlined various aspects of the program, including the timing of operations and
the planned maturity distribution of the securities to be purchased or sold. To ensure
transparency, the Desk published a schedule each month that included the anticipated amount of
total purchases and sales over the upcoming monthly interval, operation dates, the maturity range
of eligible issues and the expected size range for each operation. At the end of each monthly
interval, the Desk released the prices paid on individual operations over the preceding period,
6 Bids were placed as non-competitive tenders and were treated as add-ons to announced auction sizes.
7 See http://www.newyorkfed.org/markets/opolicy/operating_policy_101103.html,
http://www.newyorkfed.org/markets/opolicy/operating_policy_110622.html and
http://www.newyorkfed.org/markets/opolicy/operating_policy_110921.html.
-200
-150
-100
-50
0
50
100
150
200
250
300
0 - 3 3 - 6 6 - 10 10 -30 TIPS
USD, billion
LSAP/Reinvestment (Jan-Jun)
Reinvestment (Jul-Sep)
Maturity Extension (Oct-Dec)
Source: FRBNY
Page 8 of 43
including the weighted average accepted price, and depending on whether the Desk was
purchasing or selling securities, the highest or lowest accepted prices and the proportions
accepted of each proposition submitted at the highest or lowest accepted prices.
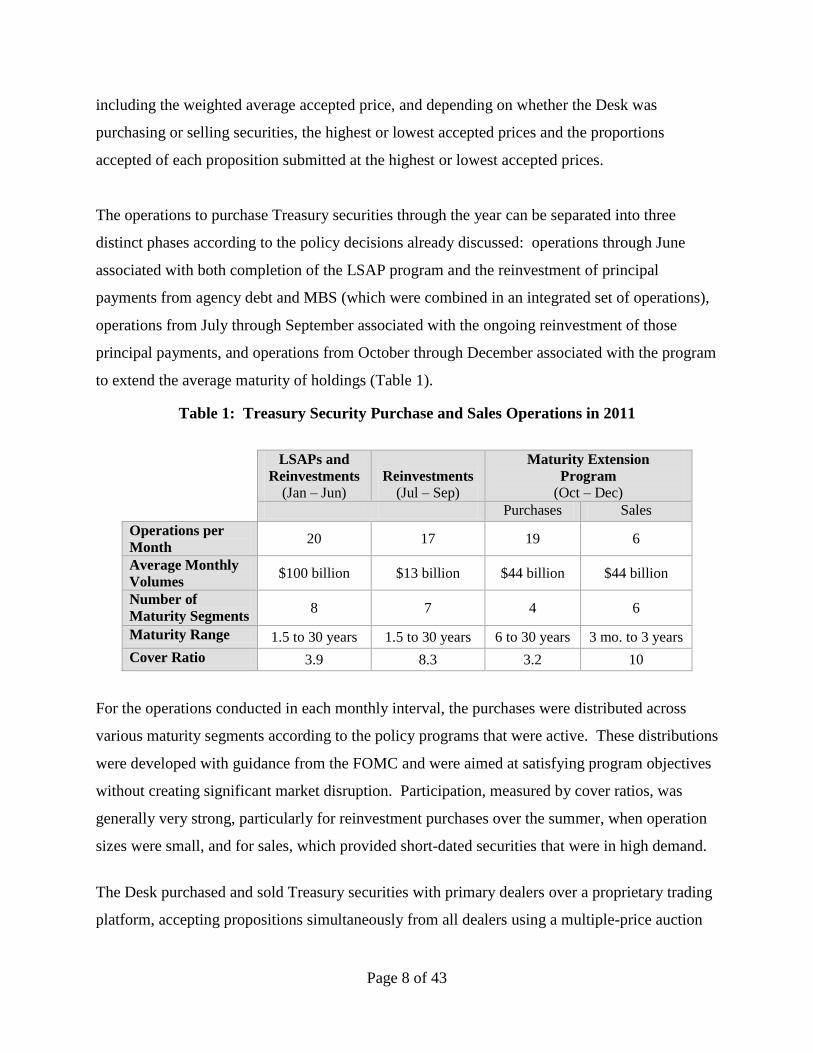
The operations to purchase Treasury securities through the year can be separated into three
distinct phases according to the policy decisions already discussed: operations through June
associated with both completion of the LSAP program and the reinvestment of principal
payments from agency debt and MBS (which were combined in an integrated set of operations),
operations from July through September associated with the ongoing reinvestment of those
principal payments, and operations from October through December associated with the program
to extend the average maturity of holdings (Table 1).
Table 1: Treasury Security Purchase and Sales Operations in 2011
LSAPs and
Reinvestments
(Jan – Jun) Reinvestments
(Jul – Sep)
Maturity Extension
Program
(Oct – Dec)
Purchases Sales
Operations per
Month 20 17 19 6
Average Monthly
Volumes $100 billion $13 billion $44 billion $44 billion
Number of
Maturity Segments 8 7 4 6
Maturity Range 1.5 to 30 years 1.5 to 30 years 6 to 30 years 3 mo. to 3 years
Cover Ratio 3.9 8.3 3.2 10
For the operations conducted in each monthly interval, the purchases were distributed across
various maturity segments according to the policy programs that were active. These distributions
were developed with guidance from the FOMC and were aimed at satisfying program objectives
without creating significant market disruption. Participation, measured by cover ratios, was
generally very strong, particularly for reinvestment purchases over the summer, when operation
sizes were small, and for sales, which provided short-dated securities that were in high demand.
The Desk purchased and sold Treasury securities with primary dealers over a proprietary trading
platform, accepting propositions simultaneously from all dealers using a multiple-price auction

Page 9 of 43
format.8 Primary dealers were expected to submit bids and offers for themselves and to facilitate
submissions on behalf of their customers. Offers in purchase operations were evaluated relative
to an internal assessment of the fair value of securities as well as market prices, to tilt purchases
towards securities that were perceived to be undervalued by market participants. Bids in sales
operations were evaluated only relative to prevailing market prices at the close of the auction.9
Purchase and Holding Limits
The Desk has placed limits on its holdings of individual issues for many years to avoid excessive
concentration of holdings of specific securities. In November 2010, in consultation with the
FOMC, the Desk temporarily increased those limits from 35 percent to 70 percent for any single
issue. This action was taken because of the substantial increases in SOMA holdings as a
percentage of outstanding supply and was intended to ensure that the Desk was able to purchase
the most attractive securities on a relative-value basis. At the same time, the Desk imposed
limits on the amount of any individual security that it would purchase in a single operation to
avoid building up those holdings too quickly. Those limits, shown in Table 2, reduced the
amount that the Desk would purchase in an operation as holdings of a security rose above
particular thresholds. The Desk operated under these guidelines throughout 2011.
Table 2: Secondary Market Purchase Limits for Individual Treasury Securities
(in percentages of outstanding supply)
SOMA Holdings Prior to
Operation Maximum Purchase Amount is the Lesser of:
0-30% N/A 35% less SOMA holdings (%)
30%-47.5% 5% 50% less SOMA holdings (%)
47.5%-59% 2.5% 60% less SOMA holdings (%)
59%-70% 1% 70% less SOMA holdings (%)
Above 70% Not Eligible for Purchase
8 Consistent with longstanding practice, securities that were trading with heightened scarcity value in the repo
market for specific collateral, or that were cheapest–to-deliver into active Treasury futures contracts, were
excluded from purchases. 9 One reason for this difference in approach was that under the maturity extension program most short-dated
holdings are expected to be sold. The benefit of making a relative value assessment in choosing which securities
to sell in any particular operation is diminished so long as differences in relative values persist.
Page 10 of 43
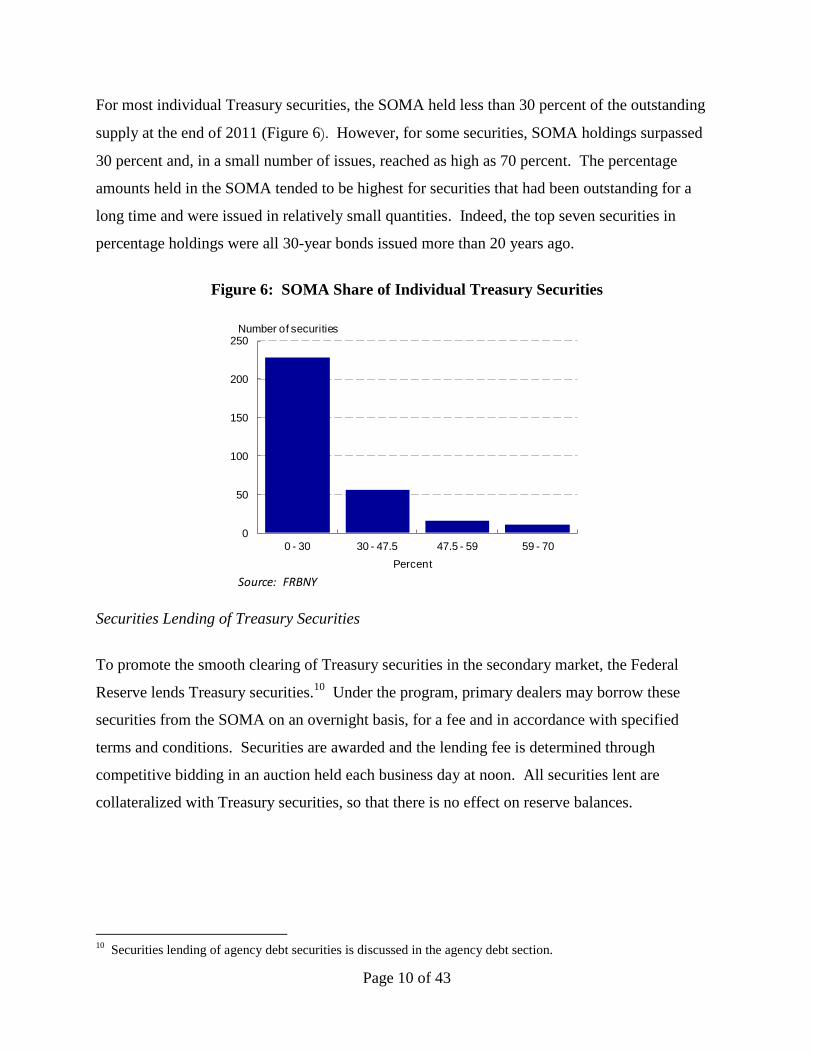
For most individual Treasury securities, the SOMA held less than 30 percent of the outstanding
supply at the end of 2011 (Figure 6). However, for some securities, SOMA holdings surpassed
30 percent and, in a small number of issues, reached as high as 70 percent. The percentage
amounts held in the SOMA tended to be highest for securities that had been outstanding for a
long time and were issued in relatively small quantities. Indeed, the top seven securities in
percentage holdings were all 30-year bonds issued more than 20 years ago.
Figure 6: SOMA Share of Individual Treasury Securities
Securities Lending of Treasury Securities
To promote the smooth clearing of Treasury securities in the secondary market, the Federal
Reserve lends Treasury securities.10
Under the program, primary dealers may borrow these
securities from the SOMA on an overnight basis, for a fee and in accordance with specified
terms and conditions. Securities are awarded and the lending fee is determined through
competitive bidding in an auction held each business day at noon. All securities lent are
collateralized with Treasury securities, so that there is no effect on reserve balances.
10
Securities lending of agency debt securities is discussed in the agency debt section.
0
50
100
150
200
250
0 - 30 30 - 47.5 47.5 - 59 59 - 70
Percent
Source: FRBNY
Number of securities

Page 11 of 43
Figure 7: Securities Lending in Treasury Securities (monthly averages)
Program terms and conditions were generally unchanged in 2011: the minimum lending fee was
0.05 percent, dealers could borrow no more than 25 percent of any issue and individual dealers
were limited to no more than $5 billion aggregate borrowing outstanding at any time. In
recognition of larger SOMA holdings and larger Treasury issuance amounts, the Desk removed
the $750 million per-issue limit on what a dealer could borrow on June 9, 2011.11
Securities
lending volumes increased and peaked in June at $21 billion due to quarter-end demand and then
declined through the summer (Figure 7). Overall, securities lending activity remained elevated
relative to pre-crisis levels, attributable at least in part to the low minimum lending fee and the
larger amount of securities held by the SOMA.
B. Agency Mortgage-Backed Securities
Holdings and Purchases
The MBS holdings in the SOMA declined from a balance of $992 billion at the end of 2010 to
$871 billion at the end of September 2011, reflecting the effects of principal payments. Principal
payments led to especially large declines in holdings of MBS with 4.5 percent and 5 percent
coupons, purchased in 2009 and 2010 (Figure 8).
11
Following the change, individual dealers borrowed more than $750 million of a single security 88 times in 2011.
0
5
10
15
20
25
Jan-06 Jan-07 Jan-08 Jan-09 Jan-10 Jan-11
USD, billion
Source: FRBNY

Page 12 of 43
From October through the end of 2011, the Desk reinvested $77 billion of principal payments on
agency debt and MBS into MBS, leaving total MBS holdings at $874 billion at year-end.12
Reinvestment purchases in the final quarter of the year were concentrated in recently originated
30-year fixed-rate MBS with coupons of 3.5 percent and 4.0 percent.
Figure 8: Coupon Distribution of SOMA MBS Holdings
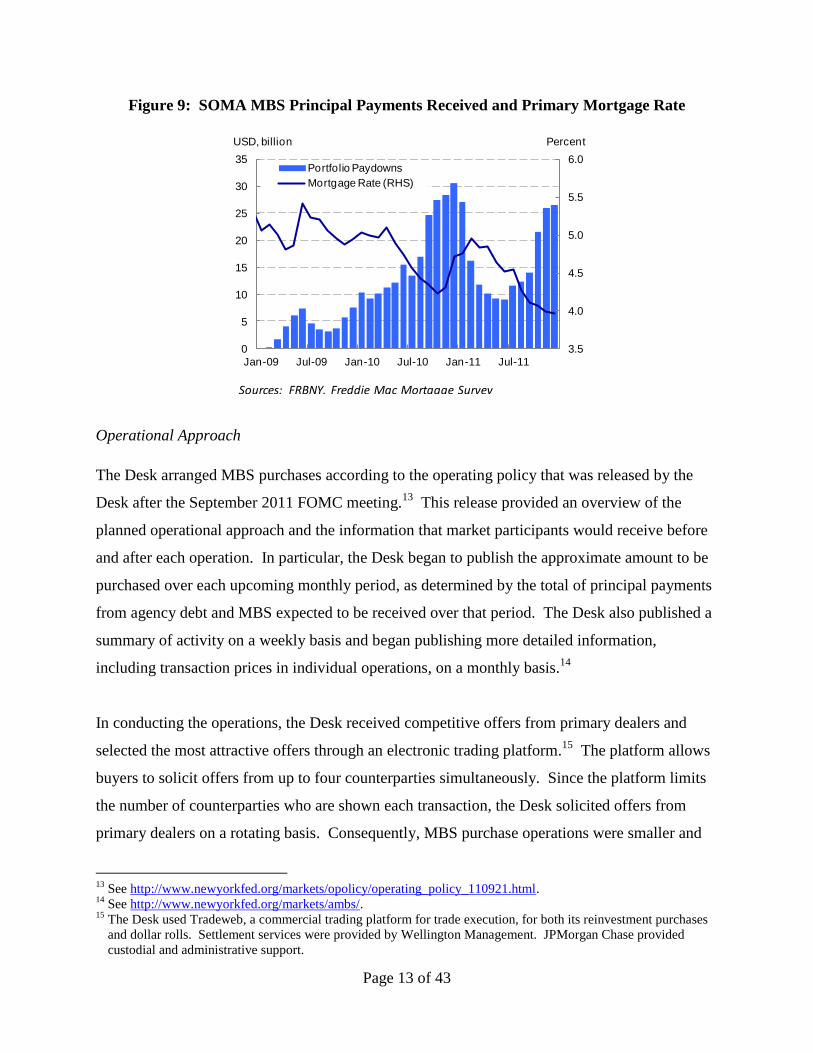
In total, principal payments of MBS in the SOMA portfolio were $195 billion in 2011. The pace
of monthly prepayments fell in the first half of the year, reaching a low of $9 billion in June
following an increase in mortgage rates from late 2010 into the spring of 2011. Prepayments
accelerated during the second half of the year as the primary mortgage rate declined to record
lows by year-end (Figure 9).
12
This amount included net unsettled commitments of $36 billion.
0
100
200
300
400
500
600
3.0% 3.5% 4.0% 4.5% 5.0% 5.5% 6.0% 6.5%
USD, billion
2010 2011
Source: FRBNYCoupon
Page 13 of 43
Figure 9: SOMA MBS Principal Payments Received and Primary Mortgage Rate
Operational Approach
The Desk arranged MBS purchases according to the operating policy that was released by the
Desk after the September 2011 FOMC meeting.13
This release provided an overview of the
planned operational approach and the information that market participants would receive before
and after each operation. In particular, the Desk began to publish the approximate amount to be
purchased over each upcoming monthly period, as determined by the total of principal payments
from agency debt and MBS expected to be received over that period. The Desk also published a
summary of activity on a weekly basis and began publishing more detailed information,
including transaction prices in individual operations, on a monthly basis.14
In conducting the operations, the Desk received competitive offers from primary dealers and
selected the most attractive offers through an electronic trading platform.15
The platform allows
buyers to solicit offers from up to four counterparties simultaneously. Since the platform limits
the number of counterparties who are shown each transaction, the Desk solicited offers from
primary dealers on a rotating basis. Consequently, MBS purchase operations were smaller and
13
See http://www.newyorkfed.org/markets/opolicy/operating_policy_110921.html. 14
See http://www.newyorkfed.org/markets/ambs/. 15
The Desk used Tradeweb, a commercial trading platform for trade execution, for both its reinvestment purchases
and dollar rolls. Settlement services were provided by Wellington Management. JPMorgan Chase provided
custodial and administrative support.
3.5
4.0
4.5
5.0
5.5
6.0
0
5
10
15
20
25
30
35
Jan-09 Jul-09 Jan-10 Jul-10 Jan-11 Jul-11
PercentUSD, billion
Portfolio Paydowns
Mortgage Rate (RHS)
Sources: FRBNY, Freddie Mac Mortgage Survey
Page 14 of 43
more frequent than Treasury purchase operations, which were conducted over a proprietary
system that allows all primary dealers to participate in each operation.
All MBS purchases were conducted in the to-be-announced (TBA) market, in which transactions
are generally settled one or more months forward. To cover the counterparty exposure owing
from any unsettled transactions, FRBNY's agreement with each primary dealer with which it was
conducting MBS transactions was supplemented in November 2011 to require the posting of
margin to cover FRBNY's exposure to that dealer. Prior to that time FRBNY did not generally
require such margin.16
Dollar Rolls
The FOMC directed the Desk to engage in dollar roll transactions as necessary to facilitate the
settlement of its MBS purchases.17
The Desk engages in such transactions when market pricing
signals notable imbalances of supply available for settlement. These conditions were evident late
in 2011. The Desk sold $400 million of dollar rolls in 15-year MBS with 3.0 percent coupons,
effectively delaying settlement of purchases originally scheduled for December until January,
and it purchased $4.4 billion of dollar rolls in 30-year MBS with 3.5 percent coupons, effectively
accelerating settlement from future months to December.
CUSIP Aggregation
On January 10, the Desk announced it would streamline the administration of MBS holdings in
the SOMA by consolidating many of these individual securities into fewer and larger aggregated
securities through aggregation services offered by Fannie Mae and Freddie Mac.18
The
aggregations combined securities that had similar attributes—such as the coupon rate and the
original term to maturity—to ensure that the new securities would have well-defined
characteristics.
16
FRBNY first established a margin requirement in late October for MF Global, Inc. in response to its deteriorating
financial condition, and thereafter deemed it prudent to establish a similar requirement on each primary dealer
with which it conducted MBS transactions. 17
Dollar rolls are transactions in which MBS for delivery on one date are purchased (or sold) with a simultaneous
agreement to sell (or purchase) substantially similar securities on a specified future date. 18
See http://www.newyorkfed.org/markets/Agency_MBS_CUSIP_Aggregation_faqs.html.

Page 15 of 43
After the completion of the MBS purchase program in 2010, the SOMA portfolio held more than
44,000 distinct MBS issues, each with a unique security identifier (referred to as a ―CUSIP‖).19
Through aggregation, the Desk reduced the total number of its individual CUSIP holdings to
fewer than 10,000 by the end of 2011. CUSIP aggregation reduced operational risk and
custodial service costs.
The CUSIP aggregation of MBS in the SOMA has resulted in the creation of some of the largest
MBS in the market. At the end of 2011, the 48 largest CUSIPs outstanding were ones held in the
SOMA. The SOMA holdings are also very large from a historical perspective on the MBS
market. Indeed, the aggregation process produced 14 of the 20 largest MBS CUSIPs ever
created in the MBS market (Figure 10).
Figure 10: Largest CUSIPs by Original Issuance Amount
C. Agency Debt
The Desk did not purchase or sell agency debt in 2011. Roughly $44 billion of agency debt
holdings in the SOMA matured in 2011, reducing total holdings to $104 billion at the end of
2011. Maturing principal payments were reinvested in Treasury securities until the end of
September ($40 billion) and then in MBS ($4 billion) for the rest of the year. In contrast to
19
A CUSIP is a nine character, alphanumeric identifier issued by Standard & Poor‘s on behalf of the American
Bankers Association that provides a standard for security identification in the U.S. and Canada.
0
5
10
15
20
25
30
3138E
HB
H4
3138E
HB
L5
3128M
8W
R1
3138E
HC
X8
3128M
8W
B6
3138E
GW
75
3128M
8X
K5
31402C
VZ
2
3138E
GV
V3
3128M
8X
82
3138E
GN
T7
31385X
EC
7
31416B
K72
31402R
JV
2
31410K
JY
1
3128M
8R
L0
3128M
8X
58
3138E
GV
35
31385JJC
3
3138E
GF
25
USD, billion
Source: FRBNY, eMBS
Dark bars represent CUSIPs held in SOMA
Note: This only includes MBS that were eligible for purchase or sale in the TBA market.

Page 16 of 43
Treasury securities held by the SOMA, holdings of agency debt were concentrated in securities
with less than five years to maturity at the end of 2011, with only $16 billion maturing after
2016.
Agency debt securities in the SOMA were added to the Desk‘s securities lending program in
2009. Lending volumes of agency debt securities decreased from an average of $1.2 billion in
2010 to $0.8 billion in 2011, reflecting in part the decrease in SOMA agency debt holdings.
D. Portfolio Characteristics
Policy actions taken in response to the financial crisis produced a larger SOMA portfolio that
was more heavily weighted towards holdings of non-Treasury and longer-term securities than in
pre-crisis years. At the beginning of 2011, SOMA activity continued to increase the size of the
portfolio, but shifted its composition back towards a heavier concentration in Treasury securities,
both through LSAPs and through reinvestment of agency debt and MBS principal payments into
longer-term Treasury securities, without significantly changing the average maturity of holdings.
Later in the year, the portfolio size and composition was stable, but the maturity extension
program increased the average maturity of the portfolio.20
The average maturity of Treasury securities held in the SOMA portfolio increased from 78
months at the end of 2010 to 86 months at the end of 2011 as a result of the purchases and sales
associated with the maturity extension program. The average maturity is expected to rise further
to about 100 months by the end of the program in June 2012.
The weighted average remaining life of MBS held in the SOMA at the end of 2011 was
estimated to be approximately 2½ years, much less than the weighted average life of
approximately four years at the end of 2010. This decline mostly reflected the impact that lower
interest rates in 2011 had on the expected pace of principal prepayments on MBS. By the end of
2011, most mortgages underlying SOMA MBS holdings could be refinanced at lower rates so
the expected average life was lower.
20
Because of the reinvestment of agency debt into MBS, there was a slight compositional shift towards MBS as
agency debt matured.

Page 17 of 43
The average maturity or weighted average life of these securities has an effect on their duration,
which measures the sensitivity of the price of a security to changes in interest rates.21
Duration is
generally greater for longer maturity and lower coupon securities. Prior to the crisis, the duration
of the Treasury portfolio was between 2½ and 3 (Figure 11). Early in the crisis, the duration of
the Treasury portfolio rose, largely reflecting the sale of short-term bills from the SOMA in
2008, and then stabilized at a little more than five. The maturity extension program announced
in September led to a further rise in duration to almost six by year-end. In contrast, the effective
duration of MBS holdings in the SOMA fell sharply in 2011 in response to declining interest
rates, from four at the beginning of 2011 to less than 1½ at year-end.22
This decline in duration
occurred because, by year-end, most of the mortgages underlying the MBS portfolio had strong
financial incentives to prepay and therefore relatively more accelerated timing for expected cash
flows.
Figure 11: Weighted Average Duration Measures for SOMA Holdings
21
Measures of duration vary depending on the type of security; for fixed cash flow securities such as Treasury or
agency debt instruments, ―modified duration‖ may be calculated based on a single interest rate (rather than a yield
curve) that is consistent with current market prices, while for MBS, ―effective duration‖ is calculated by adding or
subtracting a fixed amount (typically 50 bps or 100bps) across all interest rate paths used to price the cash flows
of the security. Effective duration, by itself, is an incomplete estimate of MBS price sensitivity because it does
not fully account for the changes in cash flows from changes in prepayment behavior. 22
The effective duration numbers cited in this report were computed by BlackRock Solutions, which provides daily
analysis on the SOMA MBS portfolio. Duration estimates have been rounded to avoid conveying a false sense of
precision. Note that effective duration estimates are subject to frequent model changes and those changes can
cause significant changes in duration estimates.
0
1
2
3
4
5
6
7
Jan-04 Jan-05 Jan-06 Jan-07 Jan-08 Jan-09 Jan-10 Jan-11
Treasury MBS Agency Debt
Source: FRBNY, BlackRock Solutions

Page 18 of 43
The asset purchase programs and other changes to the balance sheet were intended to promote
the economic mandate of the FOMC rather than to produce a financial return. Nonetheless, the
expanded size of the SOMA portfolio and the concentration of holdings in longer-term securities
continued to generate substantial SOMA income and large remittances to the Treasury in 2011
(Figure 12). SOMA income was $86 billion in 2011, well above the typical levels that were
observed ahead of the financial crisis. Adjusting for the interest expense of the reserves that
were created by those purchases, SOMA net income was still very high, at $83 billion, reflecting
the current low level of the interest rate on reserve liabilities.23
Primarily as a result of the income from the SOMA portfolio, remittances to the Treasury were
$75 billion in 2011, well above the average of $25 billion per year observed over the ten years
through 2007.24
Since remittances can fluctuate on a year-to-year basis, it is more meaningful to
look at remittances over a multi-year period. Over the period from 2008 to 2011, the cumulative
amount of remittances to the Treasury was about $230 billion, or about $130 billion above the
cumulative amount suggested by the average pre-crisis pace (before the portfolio was strongly
influenced by the extraordinary policy actions that the Federal Reserve took in response to the
financial crisis).
23
The primary component of SOMA income is the interest income earned on the outright holdings of domestic
securities. SOMA income also reflects other earnings (including interest income on foreign currency
denominated assets) and is reduced by direct interest expenses (such as interest paid on reverse repurchase
agreements) associated with the SOMA portfolio. SOMA net income is measured net of the interest paid on
reserve balance liabilities created by SOMA assets. Remittances to the Treasury, which include proceeds from
other accounts such as the Maiden Lane LLCs, reflect all Federal Reserve earnings in excess of those needed for
operating costs, dividends and capital maintenance. 24
Remittances in 2011 were less than the prior year largely because 2010 remittances included higher non-interest
income, primarily related to the consolidated variable interest entities, including the Maiden Lane LLCs discussed
in section III.

Page 19 of 43
Figure 12: SOMA Net Income and Remittances to the Treasury
Going forward, as the stance of monetary policy is normalized, SOMA net income will decline
from its recent levels towards more normal levels. The exact path of future income is uncertain
and will be determined by a number of factors, including changes in the portfolio size and
composition, the evolution of both short- and long-term interest rates, and changes in the market
value of any securities that might be sold. Nevertheless, projections of SOMA net income can be
made under a set of assumptions to provide some indication of how remittances to the Treasury
might evolve going forward and to illustrate the sensitivity of those remittances to the future path
of interest rates. To generate such projections, assumptions are needed about the future policy
decisions that will govern the evolution of the size and composition of the portfolio and about the
future course of interest rates.
Estimates of SOMA net income through 2020 have been calculated using a set of illustrative
assumptions based on private sector forecasts. Specifically, interest rates were assumed to
follow the consensus expectation reported in the March 2012 Blue Chip Survey.25
Those
expectations imply that the federal funds target rate begins to increase towards the end of 2013
and eventually rises to a level of roughly four percent by the first quarter of 2018. The 10-year
Treasury yield increases gradually to almost five percent by the first quarter of 2017.
25
These assumptions are based on consensus interest rate projections from ―Blue Chip Economic Indicators,‖ Vol.
37, No. 3, March 10, 2012.
0
10
20
30
40
50
60
70
80
90
2002 2003 2004 2005 2006 2007 2008 2009 2010 2011
USD, billion
SOMA Net Income Remittances
Source: FRBNY

Page 20 of 43
The balance sheet was assumed to evolve according to the general principles that the FOMC
described in the minutes from its June 2011 meeting. For this particular example, balance sheet
normalization steps were assumed to begin with redemptions of all maturing SOMA holdings
two quarters before the first increase in the federal funds target rate. MBS sales were assumed to
begin two quarters after the increase in the federal funds target rate and to proceed at a steady
pace over five years.26
Based on these assumptions, SOMA holdings would remain stable at about $2.6 trillion until
mid-2013. SOMA holdings would then fall steadily over about four years through a combination
of redemptions and asset sales, bringing the balance sheet to a normalized size, consistent with a
pre-crisis level of reserve balances close to $25 billion, by early 2017. At that point, purchases
of Treasury securities would resume, offsetting continued MBS sales and supporting normal
balance sheet growth. By mid-2019, the portfolio would return to all Treasury securities.
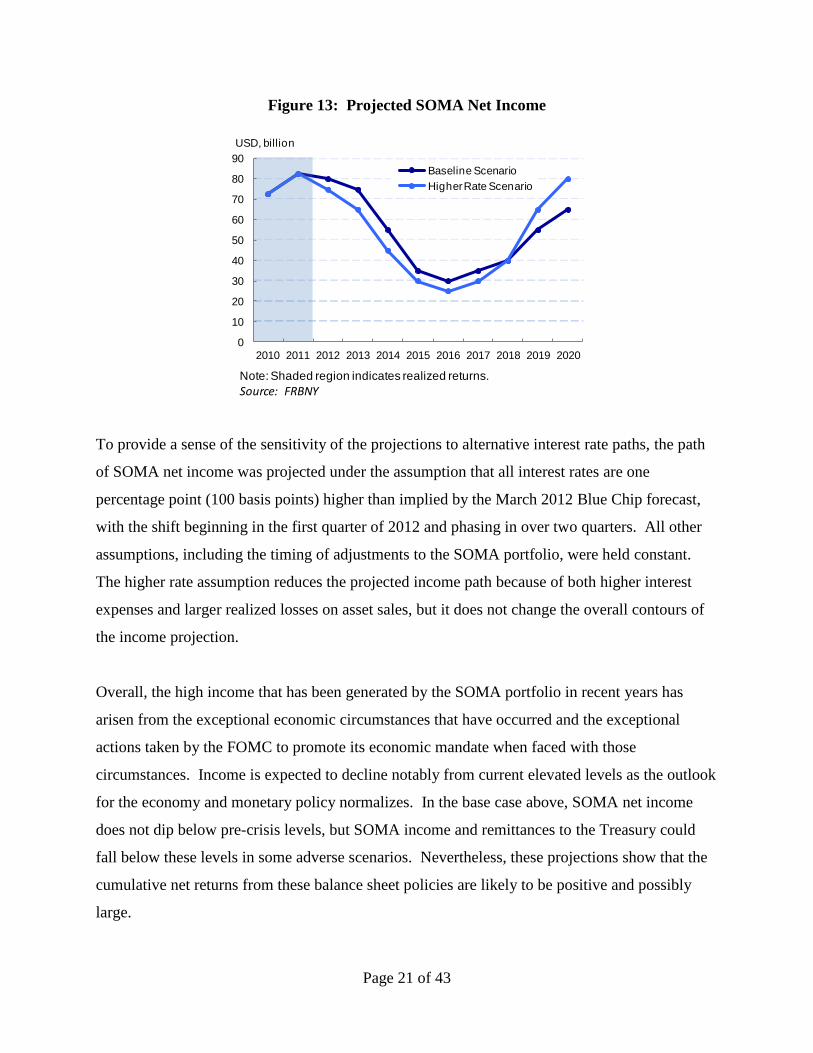
SOMA net income under these assumptions is projected to remain near its recent levels in 2012
and 2013 and then decline for several years to a trough in 2016, before rising in 2017 and later
years (Figure 13). The decline in income from 2013 to 2016 results primarily from the assumed
rise in interest rates and the decline in SOMA holdings. The rise in interest rates would reduce
SOMA net income by increasing interest payments on reserve balances, although this effect
declines over time since reserves shrink as the size of the SOMA falls. In addition, coupon
income decreases as the size of the SOMA portfolio returns to lower levels. Moreover, the
assumed sales of securities occur in a higher interest rate environment and generate realized
losses, further reducing income.
26
The principles from the June 2011 FOMC minutes indicated the order of policy actions but not the time between
each step. In this exercise, policies are implemented stepwise in six-month intervals. In addition, those principles
do not specify what the steady-state level of reserve balances will be under a future monetary policy framework.
For simplicity, this exercise assumes that reserve balances return to their pre-crisis levels.
Page 21 of 43
Figure 13: Projected SOMA Net Income
To provide a sense of the sensitivity of the projections to alternative interest rate paths, the path
of SOMA net income was projected under the assumption that all interest rates are one
percentage point (100 basis points) higher than implied by the March 2012 Blue Chip forecast,
with the shift beginning in the first quarter of 2012 and phasing in over two quarters. All other
assumptions, including the timing of adjustments to the SOMA portfolio, were held constant.
The higher rate assumption reduces the projected income path because of both higher interest
expenses and larger realized losses on asset sales, but it does not change the overall contours of
the income projection.
Overall, the high income that has been generated by the SOMA portfolio in recent years has
arisen from the exceptional economic circumstances that have occurred and the exceptional
actions taken by the FOMC to promote its economic mandate when faced with those
circumstances. Income is expected to decline notably from current elevated levels as the outlook
for the economy and monetary policy normalizes. In the base case above, SOMA net income
does not dip below pre-crisis levels, but SOMA income and remittances to the Treasury could
fall below these levels in some adverse scenarios. Nevertheless, these projections show that the
cumulative net returns from these balance sheet policies are likely to be positive and possibly
large.
0
10
20
30
40
50
60
70
80
90
2010 2011 2012 2013 2014 2015 2016 2017 2018 2019 2020
USD, billion
Baseline Scenario
Higher Rate Scenario
Source: FRBNYNote: Shaded region indicates realized returns.
Page 22 of 43
III. FEDERAL RESERVE LENDING ACTIVITY
A. Short-Term Liquidity Provisions
Of the temporary short-term liquidity programs first established during the financial crisis, only
the liquidity swap lines with foreign central banks were still active in 2011. There were no
programmatic changes made during the year to the primary credit facility (PCF), the Federal
Reserve‘s traditional short-term lending facility for depository institutions.27
Primary Credit Facility
The PCF serves as a backup source of liquidity for depository institutions in generally sound
financial condition and with appropriate collateral pledged to a Reserve Bank. Loans are
generally limited to overnight maturities and are initiated by depository institutions and approved
by Reserve Banks. The facility is intended to limit upward pressure on overnight interest rates,
including the federal funds rate, that might develop when there is a net reserve shortage or a
disruption to payment flows.
The borrowing rate for primary credit loans remained at 75 basis points, 50 basis points above
the top end of the target range for the federal funds rate, throughout 2011. Borrowing activity
was relatively limited throughout the year, averaging $24 million per day in 2011, generally
consistent with levels observed prior to the financial crisis.28
Central Bank Liquidity Swap Lines
U.S. dollar liquidity swap lines with other central banks were used during the financial crisis to
reduce the likelihood that domestic financial markets would be disrupted by liquidity conditions
in global dollar funding markets. Under these temporary arrangements, the Federal Reserve
engages in a swap transaction with a foreign central bank, exchanging dollars for foreign
27 Two other standing short-term discount window lending programs that are not discussed in this section are the
secondary credit and the seasonal credit programs. The spread between the secondary credit and primary credit
rates was maintained at 50 basis points throughout the year, and secondary credit borrowing activity remained
small. For more information about discount window programs, see http://www.frbdiscountwindow.org. 28
The high levels of excess reserves held by many depository institutions since 2008 have reduced the likelihood
that banks will need to borrow compared to the pre-crisis period.

Page 23 of 43
currency, and the foreign central bank uses the dollars to lend to local financial institutions. At
the start of the year, such agreements were in place with the Bank of Canada, the Bank of
England, the European Central Bank, the Swiss National Bank, and the Bank of Japan. On June
29, the FOMC extended the expiration of these lines by one year to August 1, 2012, and then
again by a further six months on November 30. The swap lines are currently authorized through
February 1, 2013.
In addition, the Federal Reserve and its counterparties lowered the lending rates on these
arrangements to the U.S. dollar overnight index swap (OIS) rate plus 50 basis points (from OIS
plus 100 basis points) on November 30 and established temporary bilateral liquidity swap
arrangements so that liquidity could be provided in each jurisdiction in any of their currencies
should market conditions so warrant. These actions were intended to foster economic activity by
easing strains in financial markets and mitigating the effects of such strains on the supply of
credit to households and businesses. The financial risks to the Federal Reserve in such swap
transactions are extraordinarily low, as usage of the swap lines creates no exchange rate or
interest rate risk, the counterparty exposure is to the foreign central bank and is fully
collateralized, and the foreign central bank takes on all the credit risk associated with its lending
to local financial institutions.
At the start of 2011, the Federal Reserve‘s only outstanding currency swaps were with the
European Central Bank for $0.1 billion. Outstanding swaps increased significantly late in the
year following increased pressures in offshore U.S. dollar funding markets and the coordinated
central bank actions to enhance their liquidity support to the global financial system.
Outstanding swaps totaled $100 billion at year-end, of which $85 billion was with the European
Central Bank, $14 billion with the Bank of Japan, and $0.4 billion with the Swiss National
Bank.29
29
As funding pressures eased in early 2012, the demand for swaps declined. By March 14, 2012, outstanding swaps
had fallen by $35 billion.
Page 24 of 43
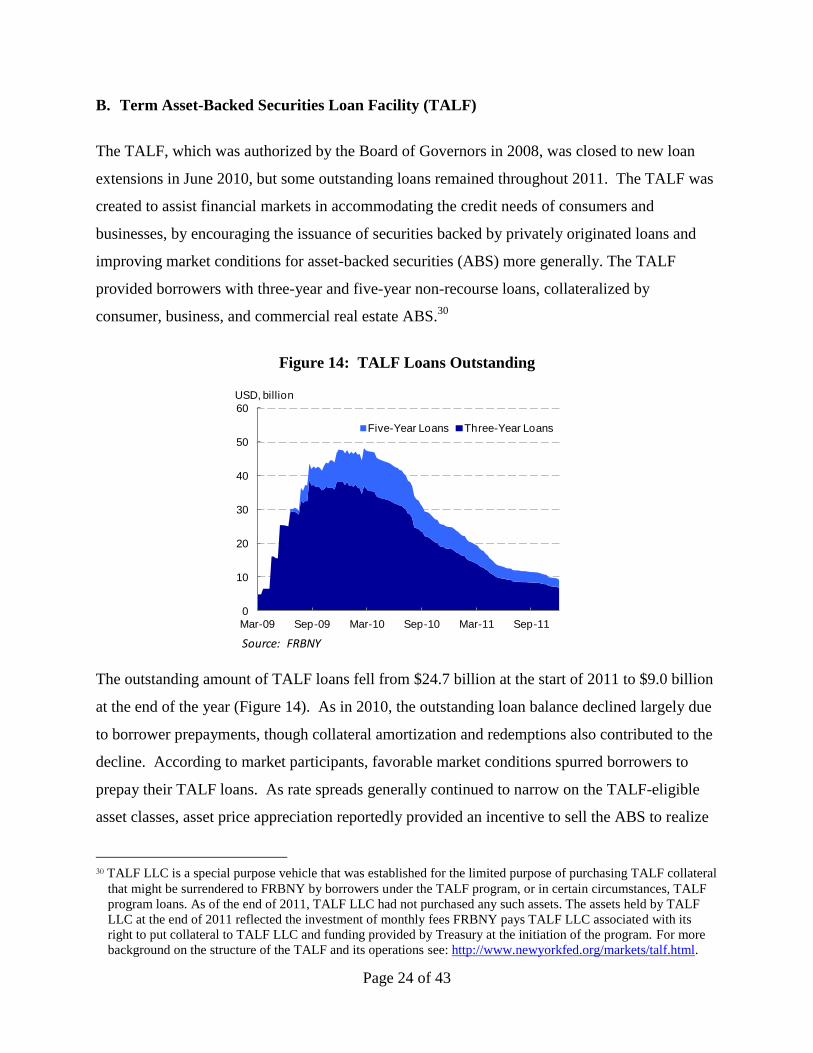
B. Term Asset-Backed Securities Loan Facility (TALF)
The TALF, which was authorized by the Board of Governors in 2008, was closed to new loan
extensions in June 2010, but some outstanding loans remained throughout 2011. The TALF was
created to assist financial markets in accommodating the credit needs of consumers and
businesses, by encouraging the issuance of securities backed by privately originated loans and
improving market conditions for asset-backed securities (ABS) more generally. The TALF
provided borrowers with three-year and five-year non-recourse loans, collateralized by
consumer, business, and commercial real estate ABS.30
Figure 14: TALF Loans Outstanding
The outstanding amount of TALF loans fell from $24.7 billion at the start of 2011 to $9.0 billion
at the end of the year (Figure 14). As in 2010, the outstanding loan balance declined largely due
to borrower prepayments, though collateral amortization and redemptions also contributed to the
decline. According to market participants, favorable market conditions spurred borrowers to
prepay their TALF loans. As rate spreads generally continued to narrow on the TALF-eligible
asset classes, asset price appreciation reportedly provided an incentive to sell the ABS to realize
30 TALF LLC is a special purpose vehicle that was established for the limited purpose of purchasing TALF collateral
that might be surrendered to FRBNY by borrowers under the TALF program, or in certain circumstances, TALF
program loans. As of the end of 2011, TALF LLC had not purchased any such assets. The assets held by TALF
LLC at the end of 2011 reflected the investment of monthly fees FRBNY pays TALF LLC associated with its
right to put collateral to TALF LLC and funding provided by Treasury at the initiation of the program. For more
background on the structure of the TALF and its operations see: http://www.newyorkfed.org/markets/talf.html.
0
10
20
30
40
50
60
Mar-09 Sep-09 Mar-10 Sep-10 Mar-11 Sep-11
USD, billion
Five-Year Loans Three-Year Loans
Source: FRBNY

Page 25 of 43
gains. As of the end of 2011, all collateral pledged against outstanding TALF loans maintained
their ‗AAA‘ ratings, and all TALF loans were performing as scheduled. The protection for
TALF that the Treasury provided to the Federal Reserve under the Troubled Asset Relief
Program remained at $4.3 billion in 2011.31
C. Assets Associated with Lending to Specific Institutions
The FRBNY helped form and establish an interest in three Limited Liability Companies (LLCs)
associated with lending to facilitate the acquisition of Bear Stearns Companies Inc. and facilities
in support of American International Group, Inc.32
The FRBNY provided AIG a revolving credit
facility and acquired preferred equity interests in two wholly owned subsidiaries: AIA Group
Limited and American Life Insurance Company. Across these programs, FRBNY received
$79.4 billion in principal, interest, fees and dividends in 2011. At the end of 2011, the fair
market value remaining in portfolios held by these LLCs was $34.2 billion.
Figure 15: Maiden Lane LLCs and AIG Assistance
31 See http://www.federalreserve.gov/newsevents/press/monetary/20100720a.htm. 32
More detail on the three Maiden Lane facilities described in this section, including facility structure, transaction
history and financial information, is available at: www.newyorkfed.org/markets/maidenlane.html. More detail on
other activities related to financial assistance to AIG is available at:
http://www.newyorkfed.org/aboutthefed/aig/index.html.
0
20
40
60
80
100
120
Jul-08 Jul-09 Jul-10 Jul-11
USD, billion
ALICO Holdings
AIA Holdings
AIG Credit Facility
ML III
ML II
ML
Source: FRBNY
Page 26 of 43
Maiden Lane LLC
The Maiden Lane LLC sold assets from its portfolio through transactions in the open market
resulting in a considerable reduction in portfolio size in 2011. Proceeds from sales in
conjunction with cash flows from the assets in the portfolio were used to repay the loan extended
by the FRBNY in accordance with the LLC‘s stated investment objective. As a result, the
principal balance of this loan, including accrued interest, was $4.9 billion as of December 30,
about $20.9 billion less than one year earlier. The estimated fair value of the portfolio of assets
as of December 30 was $7.2 billion.33
AIG, Maiden Lane II LLC, and Maiden Lane III LLC
On January 14, AIG, the Treasury, and the FRBNY closed the comprehensive recapitalization
plan, initially announced on September 30, 2010, to restructure the assistance provided by the
U.S. government to AIG.34
As a result of the closing of the AIG recapitalization plan, the
revolving credit facility was fully repaid, the FRBNY's preferred interests in AIA Group Limited
and American Life Insurance Company were redeemed and any commitment to lend any further
funds to AIG was terminated.
On March 30, the FRBNY announced that through its investment manager, BlackRock
Solutions, it would sell the assets in the Maiden Lane II LLC portfolio individually and in
segments over time as market conditions warrant through a competitive sales process. In the
second quarter of 2011, asset sales reduced the face amount of the Maiden Lane II LLC portfolio
by about one-third and significantly accelerated the repayment of the loan extended by the
FRBNY. Due to market conditions, asset sales were subsequently put on hold after the June 9,
2011, auction.35
The principal balance of the FRBNY loan to Maiden Lane II, including accrued
interest, was approximately $6.8 billion as of December 30, about $6.7 billion less than one year
earlier. The estimated fair value of the assets held by Maiden Lane II LLC was approximately
$9.3 billion as of December 30.
33
Throughout this section, fair market values for the end of 2011 reflect prices as of September 30 applied to
portfolio holdings as of December 30. 34
See http://www.aigcorporate.com/newsroom/2010_September/AIGAnnouncesPlantoRepay30Sept2010.pdf. 35
Following the receipt of unsolicited offers to purchase large parcels of the portfolio, asset sales recommenced in
January 2012, and all remaining securities in the LLC were sold in the first quarter of 2012.

Page 27 of 43
The principal balance of the FRBNY loan to Maiden Lane III, including accrued interest, was
approximately $9.8 billion as of December 30, about $4.3 billion less than one year earlier. The
estimated fair value of the assets held by Maiden Lane III LLC was approximately $17.7 billion
as of December 30.
IV. THE SUPPLY OF RESERVES
Policy actions that increased SOMA asset holdings in 2011 led to historically high levels of
reserve balance liabilities.36
While temporary open market operations were not needed in 2011
to maintain the federal funds rate in its target range, reserve balances continued to be affected by
changes in other balance sheet items. In addition, work continued on building the capacity to
drain reserves on a large scale if needed in the future.
A. Required and Excess Reserves
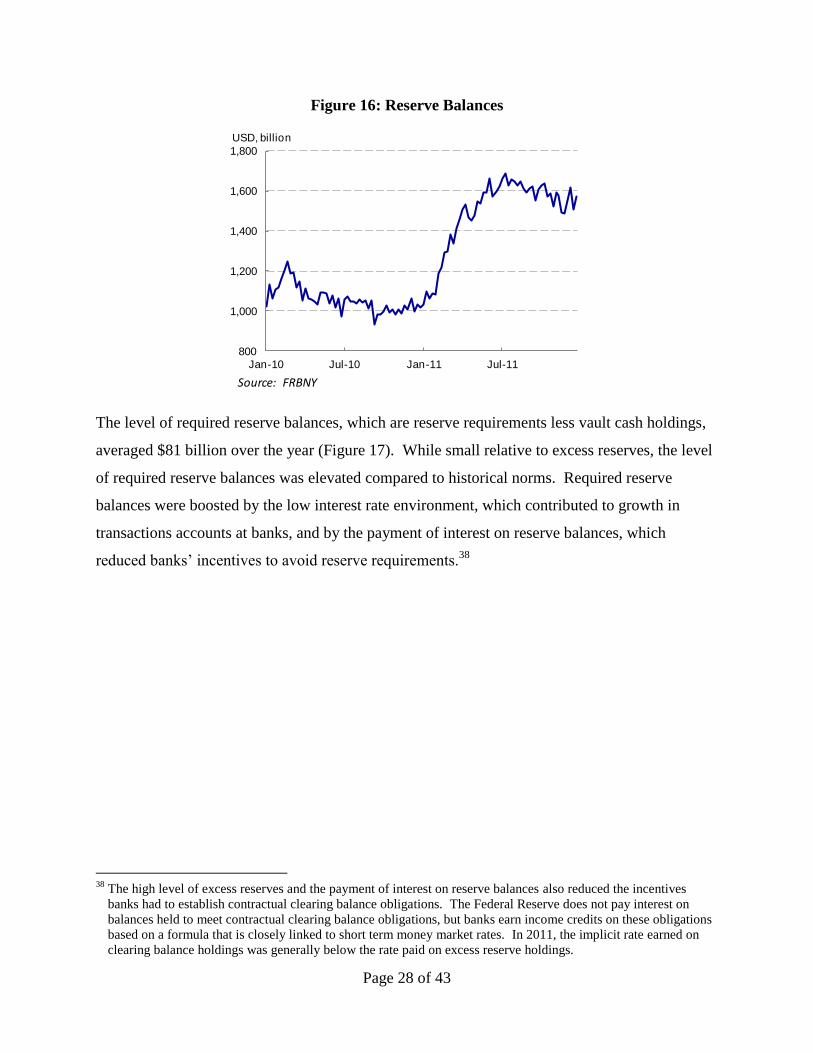
Reserve balances rose from $1.0 trillion at the end of 2010 to just over $1.7 trillion in early July,
mainly as a consequence of the purchases of Treasury securities in the first half of the year.
Reserve balances then gradually declined by year-end to $1.6 trillion due to small increases
across factors reducing reserves discussed below (Figure 16). Most reserve balances in 2011
were in the form of excess reserves.37
36
Initially, historically elevated levels of reserves beginning in 2008 were mostly a byproduct of lending through
various short-term liquidity facilities, but almost all of this lending has now unwound. 37
Excess reserve balances in the banking system are balances not needed to meet required operating balances.
Required operating balances are those balances that banks need to meet reserve requirements and to meet
contractual clearing balance obligations less vault cash holdings. Contractual clearing balance obligations were
negligible and vault cash holdings were fairly stable throughout 2011.
Page 28 of 43
Figure 16: Reserve Balances
The level of required reserve balances, which are reserve requirements less vault cash holdings,
averaged $81 billion over the year (Figure 17). While small relative to excess reserves, the level
of required reserve balances was elevated compared to historical norms. Required reserve
balances were boosted by the low interest rate environment, which contributed to growth in
transactions accounts at banks, and by the payment of interest on reserve balances, which
reduced banks‘ incentives to avoid reserve requirements.38
38
The high level of excess reserves and the payment of interest on reserve balances also reduced the incentives
banks had to establish contractual clearing balance obligations. The Federal Reserve does not pay interest on
balances held to meet contractual clearing balance obligations, but banks earn income credits on these obligations
based on a formula that is closely linked to short term money market rates. In 2011, the implicit rate earned on
clearing balance holdings was generally below the rate paid on excess reserve holdings.
800
1,000
1,200
1,400
1,600
1,800
Jan-10 Jul-10 Jan-11 Jul-11
USD, billion
Source: FRBNY

Page 29 of 43
Figure 17: Required Reserve Balances
B. Autonomous Factors Affecting Reserve Balances
Reserve balances are affected by a number of factors that are outside the direct influence of
Federal Reserve policymakers or the Desk‘s operations, which are referred to as ―autonomous
factors.‖ Historically, being able to forecast accurately the net value of all autonomous factors
over short time horizons was crucial for operating procedures that required maintaining the
supply of reserves within a relatively narrow band to control the federal funds rate. The largest
autonomous factor is Federal Reserve notes and one of the most volatile is the level of balances
held at the Federal Reserve by the Treasury in the Treasury General Account (TGA).
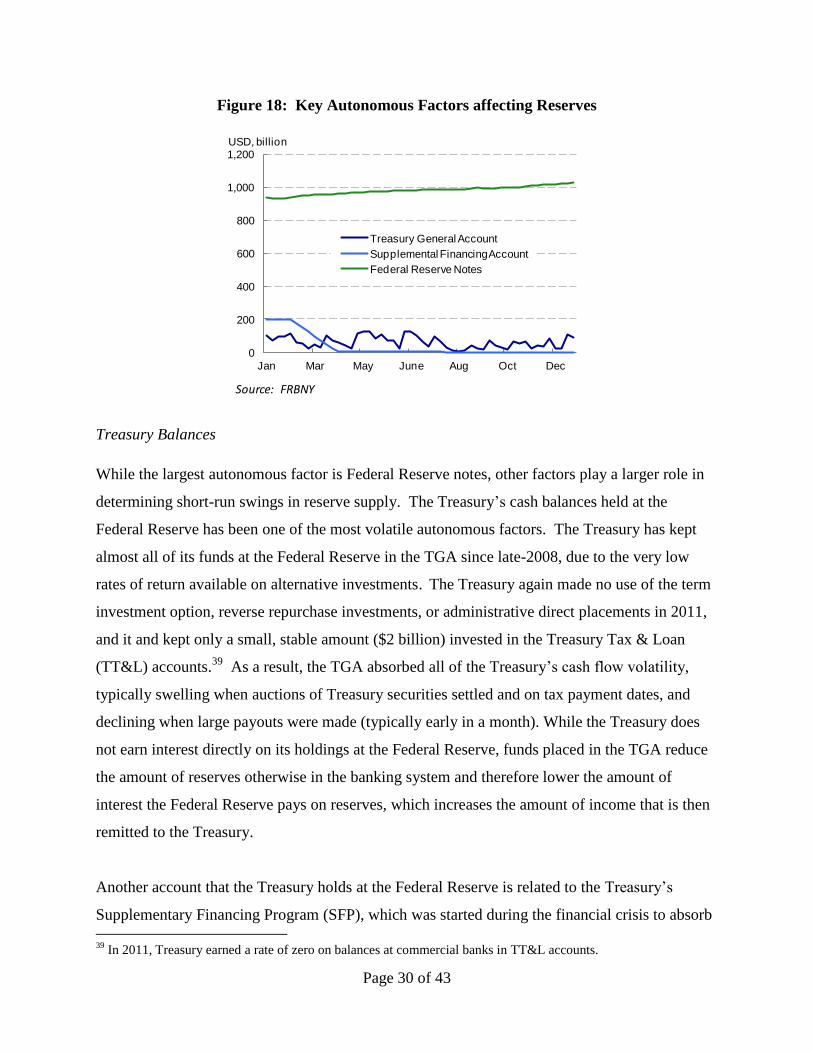
Federal Reserve Notes
Federal Reserve note liabilities reduce the level of reserve balances and are by far the largest
single autonomous factor (Figure 18). Federal Reserve notes continued to expand at a robust
pace in 2011, increasing by $92 billion, or by about ten percent. At the end of the year, total
currency outstanding stood at $1.0 trillion.
0
20
40
60
80
100
120
Jan-10 Jul-10 Jan-11 Jul-11
USD, billion
Source: FRBNY
Page 30 of 43
Figure 18: Key Autonomous Factors affecting Reserves
Treasury Balances
While the largest autonomous factor is Federal Reserve notes, other factors play a larger role in
determining short-run swings in reserve supply. The Treasury‘s cash balances held at the
Federal Reserve has been one of the most volatile autonomous factors. The Treasury has kept
almost all of its funds at the Federal Reserve in the TGA since late-2008, due to the very low
rates of return available on alternative investments. The Treasury again made no use of the term
investment option, reverse repurchase investments, or administrative direct placements in 2011,
and it and kept only a small, stable amount ($2 billion) invested in the Treasury Tax & Loan
(TT&L) accounts.39
As a result, the TGA absorbed all of the Treasury‘s cash flow volatility,
typically swelling when auctions of Treasury securities settled and on tax payment dates, and
declining when large payouts were made (typically early in a month). While the Treasury does
not earn interest directly on its holdings at the Federal Reserve, funds placed in the TGA reduce
the amount of reserves otherwise in the banking system and therefore lower the amount of
interest the Federal Reserve pays on reserves, which increases the amount of income that is then
remitted to the Treasury.
Another account that the Treasury holds at the Federal Reserve is related to the Treasury‘s
Supplementary Financing Program (SFP), which was started during the financial crisis to absorb
39
In 2011, Treasury earned a rate of zero on balances at commercial banks in TT&L accounts.
0
200
400
600
800
1,000
1,200
Jan Mar May June Aug Oct Dec
USD, billion
Treasury General Account
Supplemental Financing Account
Federal Reserve Notes
Source: FRBNY

Page 31 of 43
excess reserves. The program consisted of Treasury bills issued to fund the Supplementary
Financing Account (SFA), a Treasury account at the Federal Reserve that is separate from the
TGA. The Treasury gradually decreased the balance of the SFA from $200 billion at the
beginning of February to $5 billion in April to preserve debt management flexibility as the
amount of Treasury debt neared its statutory limit. The balance was subsequently brought to
zero in late July and was not increased following resolution of the debt ceiling impasse although
the SFA remained open.
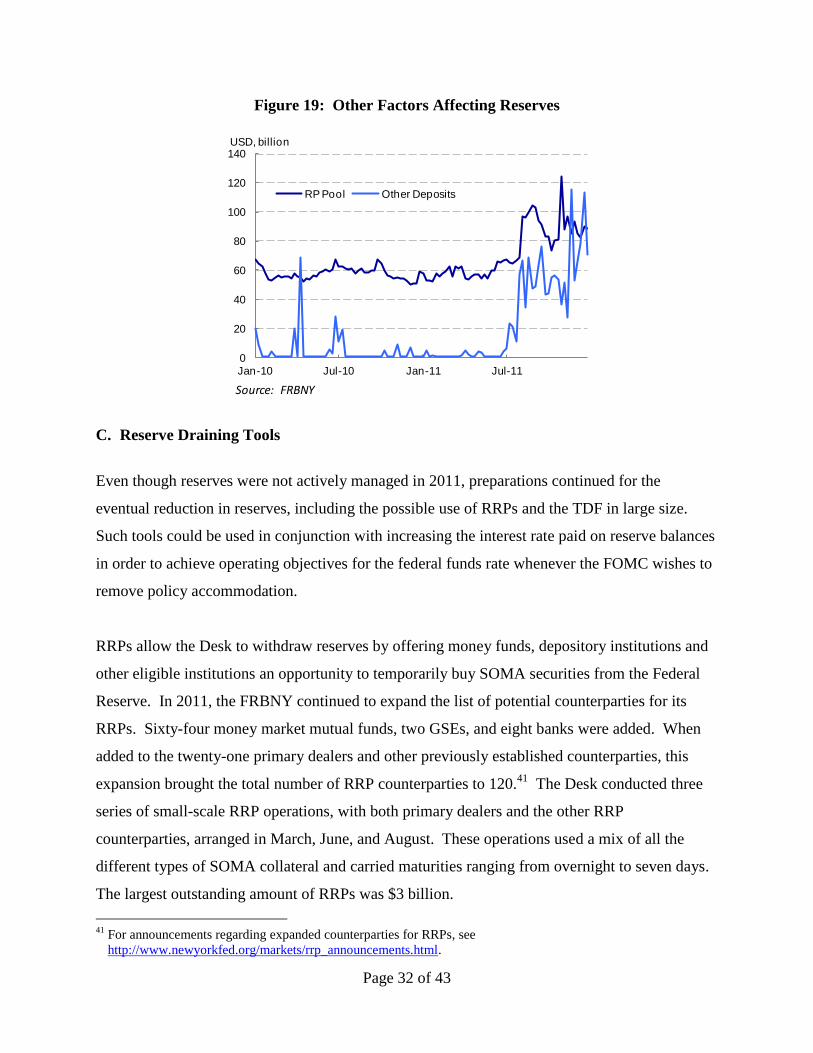
Other Autonomous Factors
Increases in several other autonomous factor liabilities reduced the level of reserves modestly in
2011. The foreign RP pool, which comprises overnight repurchase agreements between the
FRBNY and its foreign central bank and international customers, grew notably over the year.
The average size of the foreign RP pool liabilities was $36 billion higher in December 2011 than
it was in December 2010. Reserves were reduced further, particularly in the second half of the
year, by increases in the ―Other Deposit‖ category of liabilities.40
Movements in this category
were dominated by changes in balances held by the GSEs at the Federal Reserve. Other
Deposits rose in August and remained high through the rest of the year, with average balances in
December 2011 $75 billion higher than in December 2010 (Figure 19).
40
―Other Deposits‖ includes balances of various organizations such as the International Monetary Fund, the United
Nations, the World Bank, and government-sponsored enterprises (GSEs). Some of these organizations, like the
GSEs, use their accounts to receive and make payments, which include receipts from issuing debt and payments
for redeeming maturing debt. An increase in "Other Deposits" typically reflects a transfer of funds from
depository institutions to one or more of these organizations; thus, an increase ordinarily is matched by a
reduction in reserve deposits at the Federal Reserve held by depository institutions.
Page 32 of 43
Figure 19: Other Factors Affecting Reserves
C. Reserve Draining Tools
Even though reserves were not actively managed in 2011, preparations continued for the
eventual reduction in reserves, including the possible use of RRPs and the TDF in large size.
Such tools could be used in conjunction with increasing the interest rate paid on reserve balances
in order to achieve operating objectives for the federal funds rate whenever the FOMC wishes to
remove policy accommodation.
RRPs allow the Desk to withdraw reserves by offering money funds, depository institutions and
other eligible institutions an opportunity to temporarily buy SOMA securities from the Federal
Reserve. In 2011, the FRBNY continued to expand the list of potential counterparties for its
RRPs. Sixty-four money market mutual funds, two GSEs, and eight banks were added. When
added to the twenty-one primary dealers and other previously established counterparties, this
expansion brought the total number of RRP counterparties to 120.41
The Desk conducted three
series of small-scale RRP operations, with both primary dealers and the other RRP
counterparties, arranged in March, June, and August. These operations used a mix of all the
different types of SOMA collateral and carried maturities ranging from overnight to seven days.
The largest outstanding amount of RRPs was $3 billion.
41
For announcements regarding expanded counterparties for RRPs, see
http://www.newyorkfed.org/markets/rrp_announcements.html.
0
20
40
60
80
100
120
140
Jan-10 Jul-10 Jan-11 Jul-11
USD, billion
RP Pool Other Deposits
Source: FRBNY

Page 33 of 43
The TDF expands the investment options for eligible depository institutions. Created in April
2010, the TDF offers fixed quantities of term deposits for specified maturity dates through
competitive auctions, with a noncompetitive tender option for smaller bidders. Any institution
eligible to receive interest on reserve balances maintained at a Federal Reserve Bank can
participate in TDF auctions, upon completing certain necessary set up steps and with the
approval of its Reserve Bank. As of the end of 2011, almost 600 depository institutions had
signed up for the TDF. To ensure operational readiness and to provide eligible institutions with
an opportunity to gain familiarity with TDF procedures, the Federal Reserve arranged six small-
value auctions of term deposits in 2011, all for $5 billion and with a term of twenty-eight days.42
V. OVERNIGHT FUNDING MARKETS IN 2011
The high level of reserves, along with the ¼ percent interest rate paid on excess reserves, helped
to keep the effective federal funds rate within its target range of zero to ¼ percent in 2011
without a need for any temporary open market operations.43
Broad movements in different
overnight funding rates generally remained correlated with one another during the year, although
there were frequent temporary swings in rate spreads between secured and unsecured funding
markets as a result of shifts in risk perceptions associated with uncollateralized lending or in the
supply of collateral in need of financing (Figure 20).44
42
Operations under the TDF are authorized by the Board of Governors, and staff at the Board of Governors and at
the Federal Reserve Bank of St. Louis have operational responsibility. For information about TDF arrangements,
including operation announcements and results, see
http://www.frbservices.org/centralbank/term_deposit_facility.html. 43
Other factors also help explain why the federal funds and other overnight market rates were generally below the
interest rate paid by the Federal Reserve on reserve balances, including the fact that most lenders in these markets
were institutions not eligible to hold interest bearing reserve balances at the Fed. 44
Late in the year, correlations between daily changes in the federal funds rate and other overnight funding rates fell
sharply, which were associated with declines in the trading volume in the federal funds market that are described
below, but correlations in changes over longer time horizons remained strong.

Page 34 of 43
Figure 20: Overnight Money Market Rates
Even with the high level of reserves, a negative relationship between the federal funds rate and
the level of reserves was still apparent in 2011. However, even large changes in reserve levels
seemed to induce only small movements in the funds rate (Figure 21). On average in 2011, an
increase of $166 billion in reserves was associated with just a one basis point decline in the
federal funds rate – a level of sensitivity far below the historical relationship when excess
reserves were near zero.
Figure 21: Reserve Balances and the Federal Funds Rate
(weekly averages, 2009-2011)
-0.10
-0.05
0.00
0.05
0.10
0.15
0.20
0.25
0.30
Jan-11 Mar-11 May-11 Jul-11 Sep-11 Nov-11
Percent
Effective Federal Funds Rate
Treasury General Collateral Repo Rate
Sources: FRBNY, DTCC GCF Index
0.00
0.05
0.10
0.15
0.20
0.25
0.30
500 1,000 1,500 2,000Bank reserves(USD billions)
Federal funds rate(percent)
Sources: H.15, H.4.1
Page 35 of 43
In the first quarter of 2011, overnight funding market rates declined gradually, partly reflecting
rising reserve levels stemming from the ongoing LSAPs and the reduction of the SFP. On April
1, overnight funding rates fell after the Federal Deposit Insurance Corporation (FDIC) expanded
its deposit insurance assessment base. Some domestic depository institutions responded by
reducing their borrowing in the federal funds market and the general collateral repo market,
putting downward pressure on rates. The normal decline of Treasury issuance following the
April tax date also pressured overnight funding rates lower in the second quarter of 2011.
Overnight funding rates rose sharply as money market investors became increasingly concerned
about the U.S. statutory debt limit, which was projected to be exhausted on August 2. However,
rates subsequently retraced after the debt limit was increased and remained relatively low over
the remainder of the year.
Trading volumes in the federal funds market, which had fallen significantly soon after reserve
balances rose and the Federal Reserve began to pay interest on excess reserves in 2008, fell
further in 2011. This decline was driven by several factors. The changes in the FDIC
assessment base and the increase in deposit levels at domestic banks reduced banks‘ demand for
funds in the federal funds market. Trading volume also declined when some GSE lenders
limited their participation in the federal funds market as they sought to reduce unsecured credit
exposure at low interest rates.
VI. CONCLUDING OBSERVATIONS
Domestic open market operations in 2011 continued to be shaped by policy directives that
adjusted the size and composition of the SOMA portfolio in order to provide policy
accommodation. These policy initiatives included the completion of the LSAP program that was
begun in 2010, the implementation of a program to purchase longer-term Treasury securities and
sell a similar amount of shorter-term Treasury securities, and the redirection of the reinvestment
of all principal payments on agency debt and MBS holdings into MBS. As in recent years, no
operations were required to maintain the federal funds rate within its target range of zero to ¼
percent, because of the high levels of reserves that have resulted from policy actions taken since
2008 and the maintenance of the interest rate paid on reserves at ¼ percent.

Page 36 of 43
The conduct of operations for arranging outright transactions in Treasury securities and
purchases of MBS was similar to that of recent years. While specific procedures differed
according to operation type, all operations utilized an auction format to ensure fair pricing
through competitive bidding. Information about operational plans was provided to improve
prospects for competitive participation, and operations were designed to minimize any impact on
market functioning while meeting the policy objectives of the programs. Information about
operation results was released on a regular basis to enhance transparency.
The cumulative effects of policy actions since 2008 have resulted in a portfolio that is larger in
size and longer in average duration and maturity compared to historical norms. These changes
have also resulted in an elevated level of reserve balances in the banking system. The smooth
removal of policy accommodation and re-normalization of the balance sheet at the appropriate
time may require use of new types of open market operations, including large-scale use of
temporary draining tools to manage reserve levels while the portfolio remains elevated. In 2011,
work continued on the development of the Desk‘s capabilities for arranging these types of
operations.
Page 37 of 43
Appendix 1: Authorization for Domestic Open Market Operations
On January 25, 2011 the Committee approved the following Authorization for Domestic Open Market
Operations
1. The Federal Open Market Committee authorizes and directs the Federal Reserve Bank of New York,
to the extent necessary to carry out the most recent domestic policy directive adopted at a meeting of the
Committee:
A. To buy or sell U.S. government securities, including securities of the Federal Financing Bank, and
securities that are direct obligations of, or fully guaranteed as to principal and interest by, any agency of
the United States in the open market, from or to securities dealers and foreign and international
accounts maintained at the Federal Reserve Bank of New York, on a cash, regular, or deferred delivery
basis, for the System Open Market Account at market prices, and, for such Account, to exchange
maturing U.S. government and federal agency securities with the Treasury or the individual agencies or
to allow them to mature without replacement; and
B. To buy or sell in the open market U.S. government securities, and securities that are direct
obligations of, or fully guaranteed as to principal and interest by, any agency of the United States, for
the System Open Market Account under agreements to resell or repurchase such securities or
obligations (including such transactions as are commonly referred to as repo and reverse repo
transactions) in 65 business days or less, at rates that, unless otherwise expressly authorized by the
Committee, shall be determined by competitive bidding, after applying reasonable limitations on the
volume of agreements with individual counterparties.
2. In order to ensure the effective conduct of open market operations, the Federal Open Market
Committee authorizes the Federal Reserve Bank of New York to use agents in agency MBS-related
transactions.
3. In order to ensure the effective conduct of open market operations, the Federal Open Market
Committee authorizes the Federal Reserve Bank of New York to lend on an overnight basis U.S.
government securities and securities that are direct obligations of any agency of the United States, held in
the System Open Market Account, to dealers at rates that shall be determined by competitive bidding.
The Federal Reserve Bank of New York shall set a minimum lending fee consistent with the objectives of
the program and apply reasonable limitations on the total amount of a specific issue that may be auctioned
and on the amount of securities that each dealer may borrow. The Federal Reserve Bank of New York
may reject bids that could facilitate a dealer‘s ability to control a single issue as determined solely by the
Federal Reserve Bank of New York.
4. In order to ensure the effective conduct of open market operations, while assisting in the provision of
short-term investments for foreign and international accounts maintained at the Federal Reserve Bank of
New York and accounts maintained at the Federal Reserve Bank of New York as fiscal agent of the
United States pursuant to section 15 of the Federal Reserve Act, the Federal Open Market Committee
authorizes and directs the Federal Reserve Bank of New York:
Page 38 of 43
A. For the System Open Market Account, to sell U.S. government securities and securities that are
direct obligations of, or fully guaranteed as to principal and interest by, any agency of the United States
to such accounts on the bases set forth in paragraph 1.A under agreements providing for the resale by
such accounts of those securities in 65 business days or less on terms comparable to those available on
such transactions in the market; and
B. For the New York Bank account, when appropriate, to undertake with dealers, subject to the
conditions imposed on purchases and sales of securities in paragraph l.B, repurchase agreements in U.S.
government securities and securities that are direct obligations of, or fully guaranteed as to principal
and interest by, any agency of the United States, and to arrange corresponding sale and repurchase
agreements between its own account and such foreign, international, and fiscal agency accounts
maintained at the Bank. Transactions undertaken with such accounts under the provisions of this
paragraph may provide for a service fee when appropriate.
5. In the execution of the Committee‘s decision regarding policy during any intermeeting period, the
Committee authorizes and directs the Federal Reserve Bank of New York, upon the instruction of the
Chairman of the Committee, to adjust somewhat in exceptional circumstances the degree of pressure on
reserve positions and hence the intended federal funds rate and to take actions that result in material
changes in the composition and size of the assets in the System Open Market Account other than those
anticipated by the Committee at its most recent meeting. Any such adjustment shall be made in the
context of the Committee‘s discussion and decision at its most recent meeting and the Committee‘s long-
run objectives for price stability and sustainable economic growth, and shall be based on economic,
financial, and monetary developments during the intermeeting period. Consistent with Committee
practice, the Chairman, if feasible, will consult with the Committee before making any adjustment.

Page 39 of 43
Appendix 2: Guidelines for the Conduct of System Open Market Operations in Federal
Agency Securities
The Guidelines for the Conduct of System Open Market Operations in Federal-Agency Issues,
which were temporarily suspended on January 26, 2009, remained suspended.
Page 40 of 43
Appendix 3: Domestic Policy Directives issued to the Federal Reserve Bank of New York
In 2011, the Committee directed the Federal Reserve Bank of New York to execute transactions in the
SOMA in accordance with the following domestic policy directives:
Directive issued on January 26
The Federal Open Market Committee seeks monetary and financial conditions that will foster price
stability and promote sustainable growth in output. To further its long-run objectives, the Committee
seeks conditions in reserve markets consistent with federal funds trading in a range from 0 to ¼ percent.
The Committee directs the Desk to execute purchases of longer-term Treasury securities in order to
increase the total face value of domestic securities held in the System Open Market Account to
approximately $2.6 trillion by the end of June 2011. The Committee also directs the Desk to reinvest
principal payments from agency debt and agency mortgage-backed securities in longer-term Treasury
securities. The System Open Market Account Manager and the Secretary will keep the Committee
informed of ongoing developments regarding the System‘s balance sheet that could affect the attainment
over time of the Committee‘s objectives of maximum employment and price stability.
Directive issued on March 15
The Federal Open Market Committee seeks monetary and financial conditions that will foster price
stability and promote sustainable growth in output. To further its long-run objectives, the Committee
seeks conditions in reserve markets consistent with federal funds trading in a range from 0 to ¼ percent.
The Committee directs the Desk to execute purchases of longer-term Treasury securities in order to
increase the total face value of domestic securities held in the System Open Market Account to
approximately $2.6 trillion by the end of June 2011. The Committee also directs the Desk to reinvest
principal payments from agency debt and agency mortgage-backed securities in longer-term Treasury
securities. The System Open Market Account Manager and the Secretary will keep the Committee
informed of ongoing developments regarding the System‘s balance sheet that could affect the attainment
over time of the Committee‘s objectives of maximum employment and price stability.
Directive issued on April 27
The Federal Open Market Committee seeks monetary and financial conditions that will foster price
stability and promote sustainable growth in output. To further its long-run objectives, the Committee
seeks conditions in reserve markets consistent with federal funds trading in a range from 0 to ¼ percent.
The Committee directs the Desk to execute purchases of longer-term Treasury securities in order to
increase the total face value of domestic securities held in the System Open Market Account to
approximately $2.6 trillion by the end of June 2011. The Committee also directs the Desk to reinvest
principal payments from agency debt and agency mortgage-backed securities in longer-term Treasury
securities. The System Open Market Account Manager and the Secretary will keep the Committee
informed of ongoing developments regarding the System‘s balance sheet that could affect the attainment
over time of the Committee‘s objectives of maximum employment and price stability.
Page 41 of 43
Directive issued on June 22
The Federal Open Market Committee seeks monetary and financial conditions that will foster price
stability and promote sustainable growth in output. To further its long-run objectives, the Committee
seeks conditions in reserve markets consistent with federal funds trading in a range from 0 to ¼ percent.
The Committee directs the Desk to complete purchases of $600 billion of longer-term Treasury securities
by the end of this month. The Committee also directs the Desk to maintain its existing policy of
reinvesting principal payments on all domestic securities in the System Open Market Account in Treasury
securities in order to maintain the total face value of domestic securities at approximately $2.6 trillion.
The System Open Market Account Manager and the Secretary will keep the Committee informed of
ongoing developments regarding the System‘s balance sheet that could affect the attainment over time of
the Committee‘s objectives of maximum employment and price stability.
Directive issued on August 9
The Federal Open Market Committee seeks monetary and financial conditions that will foster price
stability and promote sustainable growth in output. To further its long-run objectives, the Committee
seeks conditions in reserve markets consistent with federal funds trading in a range from 0 to ¼ percent.
The Committee also directs the Desk to maintain its existing policy of reinvesting principal payments on
all domestic securities in the System Open Market Account in Treasury securities in order to maintain the
total face value of domestic securities at approximately $2.6 trillion. The System Open Market Account
Manager and the Secretary will keep the Committee informed of ongoing developments regarding the
System‘s balance sheet that could affect the attainment over time of the Committee‘s objectives of
maximum employment and price stability.
Directive issued on September 21
The Federal Open Market Committee seeks monetary and financial conditions that will foster price
stability and promote sustainable growth in output. To further its long-run objectives, the Committee
seeks conditions in reserve markets consistent with federal funds trading in a range from 0 to ¼ percent.
The Committee directs the Desk to purchase, by the end of June 2012, Treasury securities with remaining
maturities of approximately 6 years to 30 years with a total face value of $400 billion, and to sell Treasury
securities with remaining maturities of 3 years or less with a total face value of $400 billion. The
Committee also directs the Desk to maintain its existing policy of rolling over maturing Treasury
securities into new issues and to reinvest principal payments on all agency debt and agency mortgage-
backed securities in the System Open Market Account in agency mortgage-backed securities in order to
maintain the total face value of domestic securities at approximately $2.6 trillion. The Committee directs
the Desk to engage in dollar roll transactions as necessary to facilitate settlement of the Federal Reserve‘s
agency MBS transactions. The System Open Market Account Manager and the Secretary will keep the
Committee informed of ongoing developments regarding the System‘s balance sheet that could affect the
attainment over time of the Committee‘s objectives of maximum employment and price stability.
Directive issued on November 2
The Federal Open Market Committee seeks monetary and financial conditions that will foster price
stability and promote sustainable growth in output. To further its long-run objectives, the Committee

Page 42 of 43
seeks conditions in reserve markets consistent with federal funds trading in a range from 0 to ¼ percent.
The Committee directs the Desk to continue the maturity extension program it began in September to
purchase, by the end of June 2012, Treasury securities with remaining maturities of approximately 6 years
to 30 years with a total face value of $400 billion, and to sell Treasury securities with remaining
maturities of 3 years or less with a total face value of $400 billion. The Committee also directs the Desk
to maintain its existing policies of rolling over maturing Treasury securities into new issues and of
reinvesting principal payments on all agency debt and agency mortgage-backed securities in the System
Open Market Account in agency mortgage-backed securities in order to maintain the total face value of
domestic securities at approximately $2.6 trillion. The Committee directs the Desk to engage in dollar
roll transactions as necessary to facilitate settlement of the Federal Reserve‘s agency MBS transactions.
The System Open Market Account Manager and the Secretary will keep the Committee informed of
ongoing developments regarding the System‘s balance sheet that could affect the attainment over time of
the Committee‘s objectives of maximum employment and price stability.
Directive issued on December 13
The Federal Open Market Committee seeks monetary and financial conditions that will foster price
stability and promote sustainable growth in output. To further its long-run objectives, the Committee
seeks conditions in reserve markets consistent with federal funds trading in a range from 0 to ¼ percent.
The Committee directs the Desk to continue the maturity extension program it began in September to
purchase, by the end of June 2012, Treasury securities with remaining maturities of approximately 6 years
to 30 years with a total face value of $400 billion, and to sell Treasury securities with remaining
maturities of 3 years or less with a total face value of $400 billion. The Committee also directs the Desk
to maintain its existing policies of rolling over maturing Treasury securities into new issues and of
reinvesting principal payments on all agency debt and agency mortgage-backed securities in the System
Open Market Account in agency mortgage-backed securities in order to maintain the total face value of
domestic securities at approximately $2.6 trillion. The Committee directs the Desk to engage in dollar
roll transactions as necessary to facilitate settlement of the Federal Reserve‘s agency MBS transactions.
The System Open Market Account Manager and the Secretary will keep the Committee informed of
ongoing developments regarding the System‘s balance sheet that could affect the attainment over time of
the Committee‘s objectives of maximum employment and price stability.

Page 43 of 43
Appendix 4: Primary Dealers
FRBNY‘s counterparties in domestic financial market transactions are designated as primary dealers. The
role of the primary dealer includes the obligations to: (i) participate consistently as a counterparty to the
Federal Reserve in its execution of open market operations as directed by the FOMC, and (ii) provide the
Desk with market information and analysis helpful in the formulation of monetary policy. Primary
dealers are also required to participate meaningfully in all auctions of U.S. government debt, including an
underwriting commitment and to make reasonable markets for the Federal Reserve when it transacts on
behalf of its foreign official account-holders.45
In February 2011, two primary dealers, MF Global Inc. and SG Americas Securities, LLC, were added.
In October 2011, two more primary dealers, BMO Capital Markets Corp. and Bank of Nova Scotia, New
York Agency, were added. At the end of October 2011, the FRBNY ended its counterparty relationship
with MF Global and terminated its primary dealer status. The total number of primary dealers at end of
2011 was twenty-one.46
In November 2011, the FRBNY established margin agreements with all primary dealers to protect against
net forward exposure across all MBS transactions with the Federal Reserve. This step is in line with the
Treasury Market Practices Group (TMPG) best practices on prudent risk management in the MBS
market.47
45
For general information see http://www.newyorkfed.org/markets/primarydealers.html. 46
The current list of primary dealers can be found at http://www.newyorkfed.org/markets/pridealers_current.html. 47
The TMPG Best Practices document can be found at http://newyorkfed.org/tmpg/bestpractice_09142010.pdf.