Embed Size (px)
Citation preview
research for a fairer world
Domestic Resource Mobilization in Sub-Saharan Africa:The Case of Tanzaniaby Nehemiah E. Osoro
The views expressed in this research paper are the author’s alone and are not necessarily the views of The North South Institute or the funders of this research project.
Summer 2010

This paper is produced in collaboration with The North-South Institute (NSI), Ottawa, Canada. It is part of NSI’s larger research project, Domestic Resource Mobilization in Sub-Saharan Africa. The project was made possible through the generous financial support of the African Development Bank (AfDB), the Canadian Interna-tional Development Agency (CIDA), Canada’s International Develop-ment Research Centre (IDRC), and UKaid from the Department for International Development (DFID).
Introduction
Domestic resource mobilization (DRM) may be defined as the generation of savings from
domestic resources and their investment in socially productive activities. In a broad sense, DRM
entails the mobilization of both human and financial resources. The public and private sectors
both have important roles in DRM. The public sector mobilizes domestic resources through
taxation and public revenue generation and invests them in social services and infrastructure. In
contrast, the private sector mobilizes the savings of the households and firms through financial
intermediaries, who allocate resources to investment in productive activities. Thus, enhancing
DRM in poor countries entails increasing the fiscal capacity of the country and improving the
social rate of return to public investments. It must also involve deepening financial markets to
enable them to attract a growing portion of domestic savings and to allocate them to
commercially productive uses (Culpeper 2008, p.1).
There are convincing reasons for enhancing DRM (Culpeper 2008). First and foremost, greater
reliance on DRM is vital to economic growth, poverty reduction, and sustained development.
High-growth economies typically save at least 20–30 per cent of their income to finance public
and private investment. Second, DRM is more conducive to domestic ownership than external
funding. Foreign (aid) resources invariably have conditions attached to their use. Foreign direct
investment (FDI) is oriented toward the commercial objectives of the investor, not the
development priorities of the host country. Finally, DRM is more predictable and less volatile
than aid, export earnings, or FDI.
However, in developing countries, such as Tanzania, where poverty is widespread, mobilizing
domestic resources is a challenge. This has led these countries to rely on foreign aid, FDI, export
earnings, and other external resources.
Like most developing countries, Tanzania has been running both fiscal and balance-of-payment
deficits. A large portion of its fiscal budget (about 40 per cent) is foreign financed. Poverty
reduction is at the top of the political agenda. Other development initiatives, such as improving
the economic infrastructure and, above all, growth, require adequate financial resources.
Although the government has indicated its intention to reduce dependence on foreign sources of
finance, this is easier said than done and the extent to which this intention has been realized
is questionable.
Beyond the ongoing need to improve social services — in terms of both quantity and quality —
and the productive sectors in general, the spending needs of Tanzania are increasing more
rapidly than the foreign resources available to meet them. Therefore, the country must seek ways
to mobilize more domestic financial resources.
Although revenue collection as a percentage of gross domestic product (GDP) has recently
increased, from 11.8 per cent in fiscal year (FY) 2004–05 to 15 per cent in FY 2008–09, there is
still a shortfall. Domestic revenue was expected to contribute 66 per cent to the total revenue in
FY 2009–10, with 34 per cent coming as foreign grants and loans. To increase its share of the
total budget and as its percentage of GDP, domestic revenues must be increased as part and
parcel of the national strategy for growth and reduction of poverty (MKUKUTA II 2010) for the
next five years. This is a matter of concern, as the major sources of revenue have remained the
same for a number of years.
The objective of this study is five-fold:
• to assess Tanzania’s performance in terms of mobilizing savings
• to examine constraints to mobilization of savings in Tanzania
• to examine opportunities for enhancing mobilization of savings
• to discuss strategies for national policymakers and foreign donors to enhance DRM
• to make policy recommendations
We hope this study will help the government design policies that will enable it to mobilize
domestic resources.
Macroeconomic Performance
Macroeconomic and Fiscal Objectives
The government’s macroeconomic objectives were to achieve real GDP growth of 8 per cent by
2010, reduce inflation to 7 per cent, and increase growth of domestic revenues to at least 18.5 per
cent in FY 2008–09 and to 20 per cent by FY 2010–11. It wants to maintain international
reserves of at least 5 months of imports and ensure resources to finance private-sector
development and for major infrastructure investment (OECD 2009) However, most of these
objectives have not been realized. Currently, the growth rate is below 7 per cent, the rate of
inflation is 12 per cent, and the tax-to-GDP ratio is 16 per cent.
GDP Growth
Tanzania’s GDP grew by 7.1 per cent in 2007, up from 6.7 per cent in 2006. This is attributable
to good performance in the services and construction sectors as well as recovery of the
agricultural and industrial sectors. Because of the global economic crisis, GDP growth in 2008
was estimated to be about 0.5 per cent below the government’s hoped for 7.3 per cent. The crisis
was projected to have more serious effects in 2009, as foreign capital inflow and tourism slowed
and export earnings declined. In the last quarter of 2008, tourism firms were already reporting
reductions in receipts of 7–18 per cent. Global prices for such crops as coffee, tea, and sisal are
falling. However, the sharp decline in global oil prices, combined with corrective domestic
policies, is expected to help avert a sharp reduction in growth. The 2009 projection for GDP
growth was 5.5–6.5 per cent and the growth rate was expected to continue to exceed 6.5 per cent,
depending on global and domestic economic stimulus packages (OECD 2009).
Fiscal Policy
Government Revenue: Public finances have improved significantly over the last decade.
Measured as a share of GDP, revenues rose by 7.3 per cent between 1999–2000 and FY 2007–
08. In FY 2007–08, government revenue from taxes was 15 per cent of GDP, up 2 percentage
points compared with 2006–07 and up 6.1 percentage points compared with 1999–2000 (Table
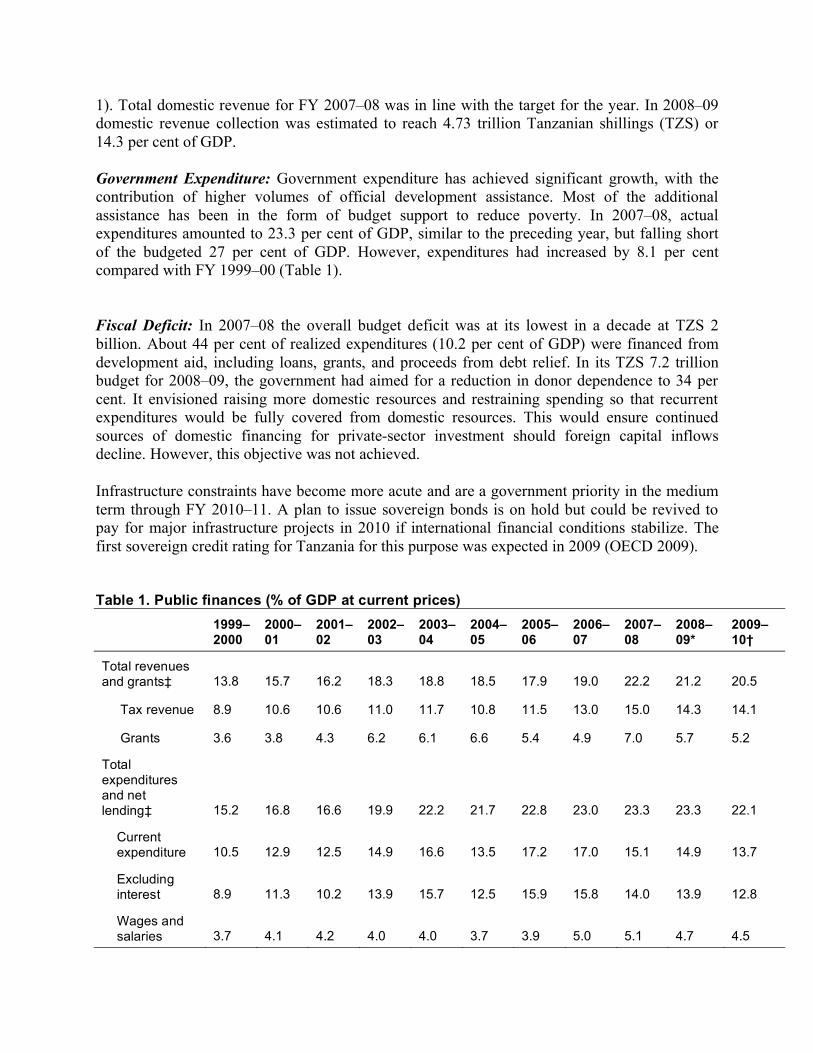
1). Total domestic revenue for FY 2007–08 was in line with the target for the year. In 2008–09
domestic revenue collection was estimated to reach 4.73 trillion Tanzanian shillings (TZS) or
14.3 per cent of GDP.
Government Expenditure: Government expenditure has achieved significant growth, with the
contribution of higher volumes of official development assistance. Most of the additional
assistance has been in the form of budget support to reduce poverty. In 2007–08, actual
expenditures amounted to 23.3 per cent of GDP, similar to the preceding year, but falling short
of the budgeted 27 per cent of GDP. However, expenditures had increased by 8.1 per cent
compared with FY 1999–00 (Table 1).
Fiscal Deficit: In 2007–08 the overall budget deficit was at its lowest in a decade at TZS 2
billion. About 44 per cent of realized expenditures (10.2 per cent of GDP) were financed from
development aid, including loans, grants, and proceeds from debt relief. In its TZS 7.2 trillion
budget for 2008–09, the government had aimed for a reduction in donor dependence to 34 per
cent. It envisioned raising more domestic resources and restraining spending so that recurrent
expenditures would be fully covered from domestic resources. This would ensure continued
sources of domestic financing for private-sector investment should foreign capital inflows
decline. However, this objective was not achieved.
Infrastructure constraints have become more acute and are a government priority in the medium
term through FY 2010–11. A plan to issue sovereign bonds is on hold but could be revived to
pay for major infrastructure projects in 2010 if international financial conditions stabilize. The
first sovereign credit rating for Tanzania for this purpose was expected in 2009 (OECD 2009).
Table 1. Public finances (% of GDP at current prices)
1999–2000
2000–01
2001–02
2002–03
2003–04
2004–05
2005–06
2006–07
2007–08
2008–09*
2009–10†
Total revenues and grants‡ 13.8 15.7 16.2 18.3 18.8 18.5 17.9 19.0 22.2 21.2 20.5
Tax revenue 8.9 10.6 10.6 11.0 11.7 10.8 11.5 13.0 15.0 14.3 14.1
Grants 3.6 3.8 4.3 6.2 6.1 6.6 5.4 4.9 7.0 5.7 5.2
Total expenditures and net lending‡ 15.2 16.8 16.6 19.9 22.2 21.7 22.8 23.0 23.3 23.3 22.1
Current expenditure 10.5 12.9 12.5 14.9 16.6 13.5 17.2 17.0 15.1 14.9 13.7
Excluding interest 8.9 11.3 10.2 13.9 15.7 12.5 15.9 15.8 14.0 13.9 12.8
Wages and salaries 3.7 4.1 4.2 4.0 4.0 3.7 3.9 5.0 5.1 4.7 4.5
Interest 1.7 1.6 2.3 1.0 0.9 1.0 1.3 1.1 1.2 1.0 0.9
Capital expenditure 4.7 3.7 3.9 5.0 5.6 8.2 5.6 6.1 8.1 8.3 8.3
Primary balance 0.2 0.6 1.9 0.6 2.5 2.3 3.6 2.9 1.2 1.1 0.7
Overall balance 1.4 1.1 0.4 1.6 3.5 3.2 4.9 4.0 0.0 2.1 1.5
*Estimates based on OECD (2009, Table 1). †Projections based on AEO (2009, Table 1). ‡Only major items are reported Source: Ministry of Finance and Economy data, OECD (2009).
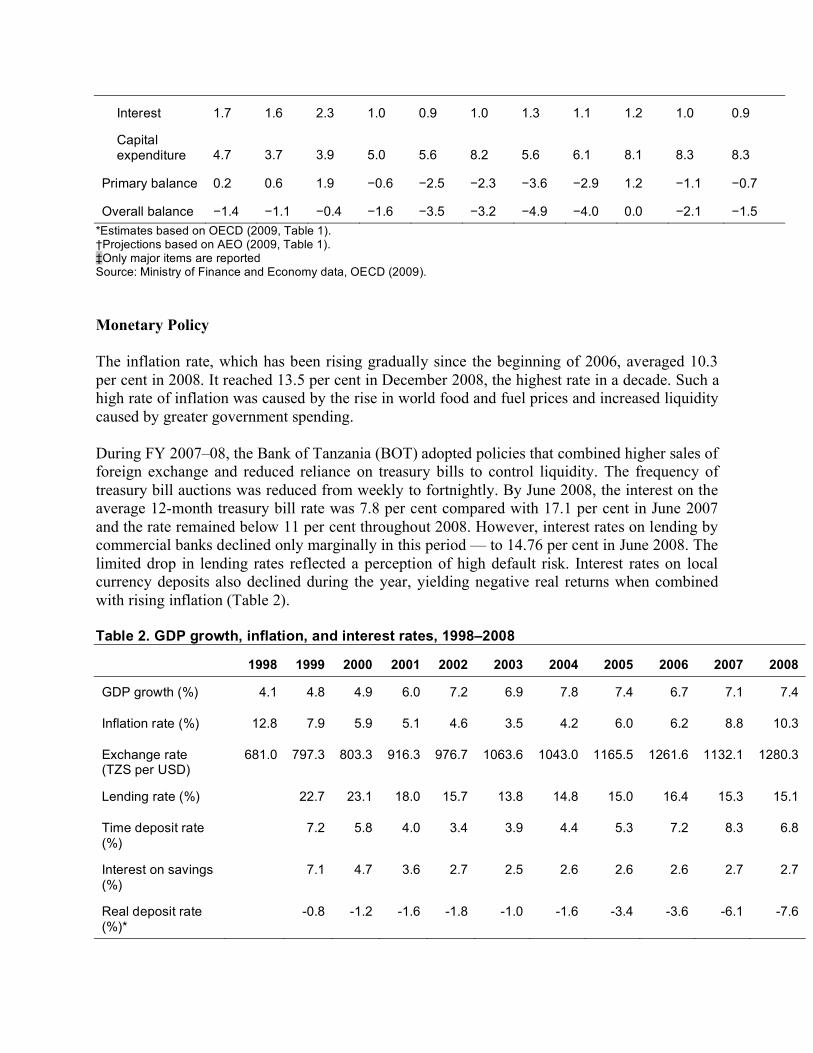
Monetary Policy
The inflation rate, which has been rising gradually since the beginning of 2006, averaged 10.3
per cent in 2008. It reached 13.5 per cent in December 2008, the highest rate in a decade. Such a
high rate of inflation was caused by the rise in world food and fuel prices and increased liquidity
caused by greater government spending.
During FY 2007–08, the Bank of Tanzania (BOT) adopted policies that combined higher sales of
foreign exchange and reduced reliance on treasury bills to control liquidity. The frequency of
treasury bill auctions was reduced from weekly to fortnightly. By June 2008, the interest on the
average 12-month treasury bill rate was 7.8 per cent compared with 17.1 per cent in June 2007
and the rate remained below 11 per cent throughout 2008. However, interest rates on lending by
commercial banks declined only marginally in this period — to 14.76 per cent in June 2008. The
limited drop in lending rates reflected a perception of high default risk. Interest rates on local
currency deposits also declined during the year, yielding negative real returns when combined
with rising inflation (Table 2).
Table 2. GDP growth, inflation, and interest rates, 1998–2008
1998 1999 2000 2001 2002 2003 2004 2005 2006 2007 2008
GDP growth (%) 4.1 4.8 4.9 6.0 7.2 6.9 7.8 7.4 6.7 7.1 7.4
Inflation rate (%) 12.8 7.9 5.9 5.1 4.6 3.5 4.2 6.0 6.2 8.8 10.3
Exchange rate (TZS per USD)
681.0 797.3 803.3 916.3 976.7 1063.6 1043.0 1165.5 1261.6 1132.1 1280.3
Lending rate (%) 22.7 23.1 18.0 15.7 13.8 14.8 15.0 16.4 15.3 15.1
Time deposit rate (%)
7.2 5.8 4.0 3.4 3.9 4.4 5.3 7.2 8.3 6.8
Interest on savings (%)
7.1 4.7 3.6 2.7 2.5 2.6 2.6 2.6 2.7 2.7
Real deposit rate (%)*
-0.8 -1.2 -1.6 -1.8 -1.0 -1.6 -3.4 -3.6 -6.1 -7.6
Interest rate spread (%)†
15.6 18.4 14.5 13.0 11.4 12.2 12.4 13.8 12.6 12.4
M3‡ to GDP ratio 13.2 14.9 16.3 18.0 21.0 22.9 25.3 32.6 37.3 42.2 30.0
M2‡ to GDP ratio 10.8 11.9 12.7 13.6 15.5 16.5 18.2 23.3 24.8 29.8 22.1
Source: Bank of Tanzania *Interest rate adjusted for inflation. † Difference between deposit interest and lending rate.
‡
The reduction in the frequency of treasury bill auctions, combined with a sharp increase in
spending toward the end of the fiscal year, led to a huge increase in liquidity at the end of June
2008 as a large number of treasury bills matured. In addition, an appreciation of the shilling led
to a rise in domestic currency-denominated deposits. These two developments fueled a growth in
money supply in excess of the target for FY 2007–08: 30.8 per cent over the 12 months ending in
June 2008 compared with the target rate of 24.2 per cent for the year. Lending to the private
sector grew substantially over the year reflecting a shift of resources away from treasury bills as
their rates fell: credit to the private sector expanded to 44.6 per cent compared with the BOT’s
target of 39.8 per cent. The bank aimed for credit expansion of 22 per cent for FY 2008–09.
During 2008, the rate of exchange for the Tanzanian shilling fluctuated widely, depreciating in
the second half of the year. In December 2008, the monthly average exchange rate was TZS
1273.6 per USD in the interbank foreign exchange market compared with TZS 1158.9 per USD
in December 2007. However, based on annual averages, the shilling appreciated by 4 per cent in
2008 to TZS 1196 per USD. The BOT planned to continue to use foreign exchange sales in
2008–09 to manage liquidity, although sales would be smaller (Table 2). The current exchange
rate is above TZS 1400 per USD.
Tanzania’s financial soundness indicators continue to be favourable, and its financial sector is
well capitalized and liquid. In 2008, the ratio of liquid assets to total assets was 41.3 per cent
compared with 48.1 per cent in 2007 and the stock of non-performing loans to gross loans
remained stable at 6.3 per cent. The BOT stated that the financial sector remains well protected
from the international financial crisis, but it is looking for ways to mitigate the risk of any
worsening of the crisis. In March 2009, Tanzania and the International Monetary Fund (IMF)
jointly organized an international conference to find ways to maintain development gains by
Tanzania and other African countries in the face of the economic crisis (OECD 2009, p. 22).
External Position
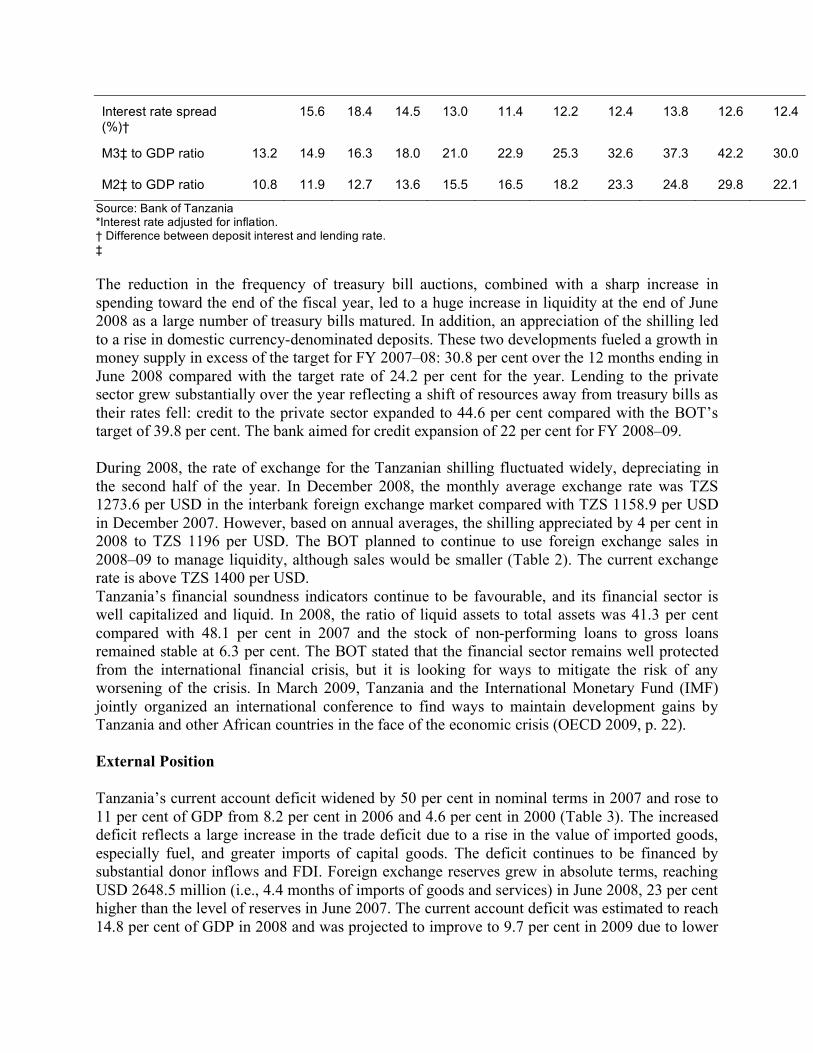
Tanzania’s current account deficit widened by 50 per cent in nominal terms in 2007 and rose to
11 per cent of GDP from 8.2 per cent in 2006 and 4.6 per cent in 2000 (Table 3). The increased
deficit reflects a large increase in the trade deficit due to a rise in the value of imported goods,
especially fuel, and greater imports of capital goods. The deficit continues to be financed by
substantial donor inflows and FDI. Foreign exchange reserves grew in absolute terms, reaching
USD 2648.5 million (i.e., 4.4 months of imports of goods and services) in June 2008, 23 per cent
higher than the level of reserves in June 2007. The current account deficit was estimated to reach
14.8 per cent of GDP in 2008 and was projected to improve to 9.7 per cent in 2009 due to lower
oil prices (Table 3). The BOT wished to increase foreign exchange reserves to 5 months of
imports by June 2009 if official aid levels were not reduced (OECD 2009, p. 22).
Exports increased by 13 per cent in 2007, substantially less than the 23 per cent growth rate in
2006, but their contribution to GDP reached 13.2 per cent compared with 13.4 per cent in 2006
and 6.5 per cent in 2000. Service exports rose dramatically with receipts increasing by 34 per
cent (Table 3). Growth in the value of merchandise exports was supported by increased exports
of manufactured goods and higher volumes of traditional exports, especially cotton, tea, and
sisal. Because of higher gold prices, the value of mineral exports increased despite a reduction in
the volume during 2007. In the same period, imports rose to 34.4 per cent, driven by increases in
the value of intermediate and capital goods imports. For 2008 and 2009, imports were expected
to remain high, although their cost was expected to be cushioned by falling prices of
imported fuel.
Although export promotion measures continue to yield results, declines in world demand
because of the global financial crisis could have a negative effect. Efforts to promote Tanzania as
a tourist destination are being intensified, especially in the Middle East and Far East. Increased
cooperation with the East Africa Community (EAC) and the Southern Africa Development
Cooperation (SADC) could boost the market for Tanzanian exports. In 2008, heads of state met
in Kampala to discuss an initiative to merge the EAC, SADC, and the Common Market for
Eastern and Southern Africa into one regional bloc. In the meantime, the EAC is implementing a
roads project to connect its member countries and is stepping up plans to create an EAC common
market and eventually monetary union. Signing of the protocol for a common market was set for
April 2009 (OECD 2009, p. 23).
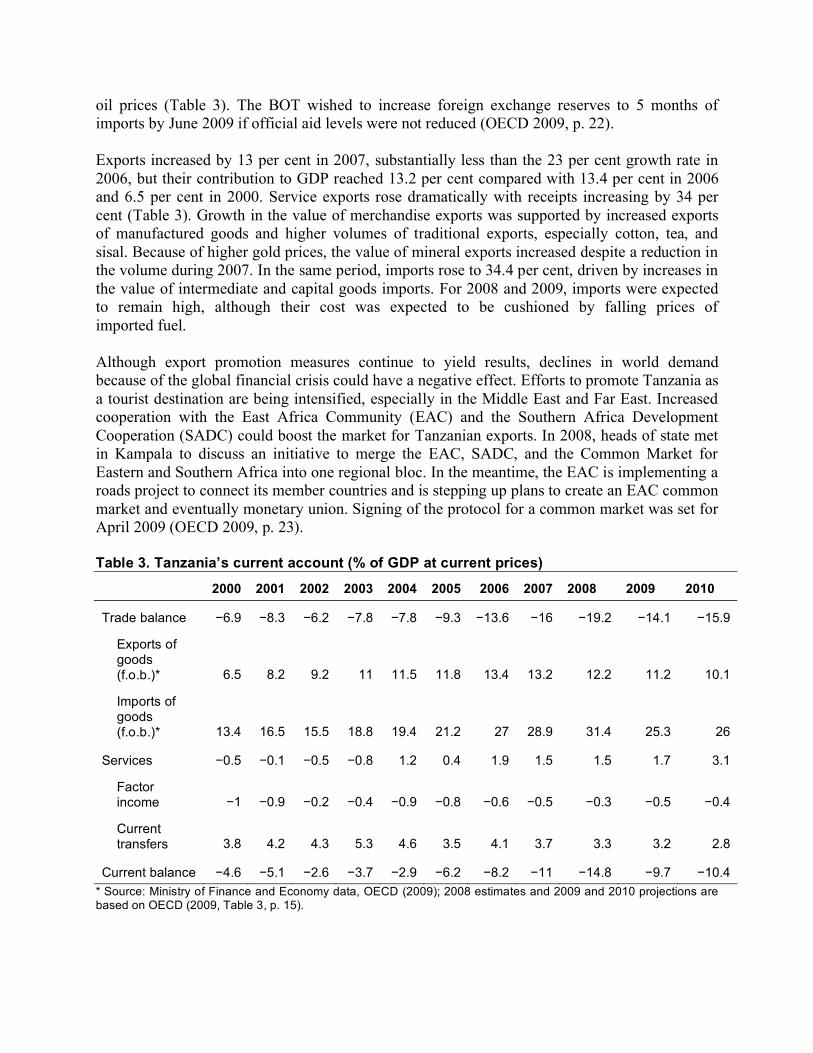
Table 3. Tanzania’s current account (% of GDP at current prices)
2000 2001 2002 2003 2004 2005 2006 2007 2008 2009 2010
Trade balance 6.9 8.3 6.2 7.8 7.8 9.3 13.6 16 19.2 14.1 15.9
Exports of goods (f.o.b.)* 6.5 8.2 9.2 11 11.5 11.8 13.4 13.2 12.2 11.2 10.1
Imports of goods (f.o.b.)* 13.4 16.5 15.5 18.8 19.4 21.2 27 28.9 31.4 25.3 26
Services 0.5 0.1 0.5 0.8 1.2 0.4 1.9 1.5 1.5 1.7 3.1
Factor income 1 0.9 0.2 0.4 0.9 0.8 0.6 0.5 0.3 0.5 0.4
Current transfers 3.8 4.2 4.3 5.3 4.6 3.5 4.1 3.7 3.3 3.2 2.8
Current balance 4.6 5.1 2.6 3.7 2.9 6.2 8.2 11 14.8 9.7 10.4
* Source: Ministry of Finance and Economy data, OECD (2009); 2008 estimates and 2009 and 2010 projections are based on OECD (2009, Table 3, p. 15).
Tanzania is planning to liberalize her capital account further in an effort to attract capital and
harmonize with the other EAC countries. However, the government intends to adopt a gradual
approach to safeguard capital flows and ensure adequate time to establish the necessary
regulatory procedures. The central bank has been formulating an action plan on liberalization to
be completed in 2009. Priority was placed on long-term investment securities and bonds.
Tanzania’s debt sustainability indicators have remained favourable due to massive debt relief
obtained through the Highly Indebted Poor Country Initiative (HIPC) and the Multilateral Debt
Relief Initiative (MDRI). However, new borrowing and the accumulation of debt service arrears
increased Tanzania’s external debt to USD 5.8 billion (31 per cent of GDP) by the end of June
2008 — up from USD 4.9 billion (30.3 per cent of GDP) at the end of June 2007. In FY 2007–
08, service payments on this external debt amounted to 2.2 per cent of exports of goods and
services, compared with 1.2 per cent the previous year. Although the government depends on
concessional lending for deficit financing, a potential risk to debt sustainability could come from
the planned issuance of sovereign bonds to finance infrastructure, which entails borrowing at
commercial rates. To safeguard against an accumulation of debt, a cost–benefit analysis of
planned infrastructure projects will be undertaken to ensure that the investments are worth the
cost of servicing the associated debt. Furthermore, the government should first exhaust all
possible concessional borrowing sources before borrowing at commercial rates.
Savings Mobilization Performance
Public Savings
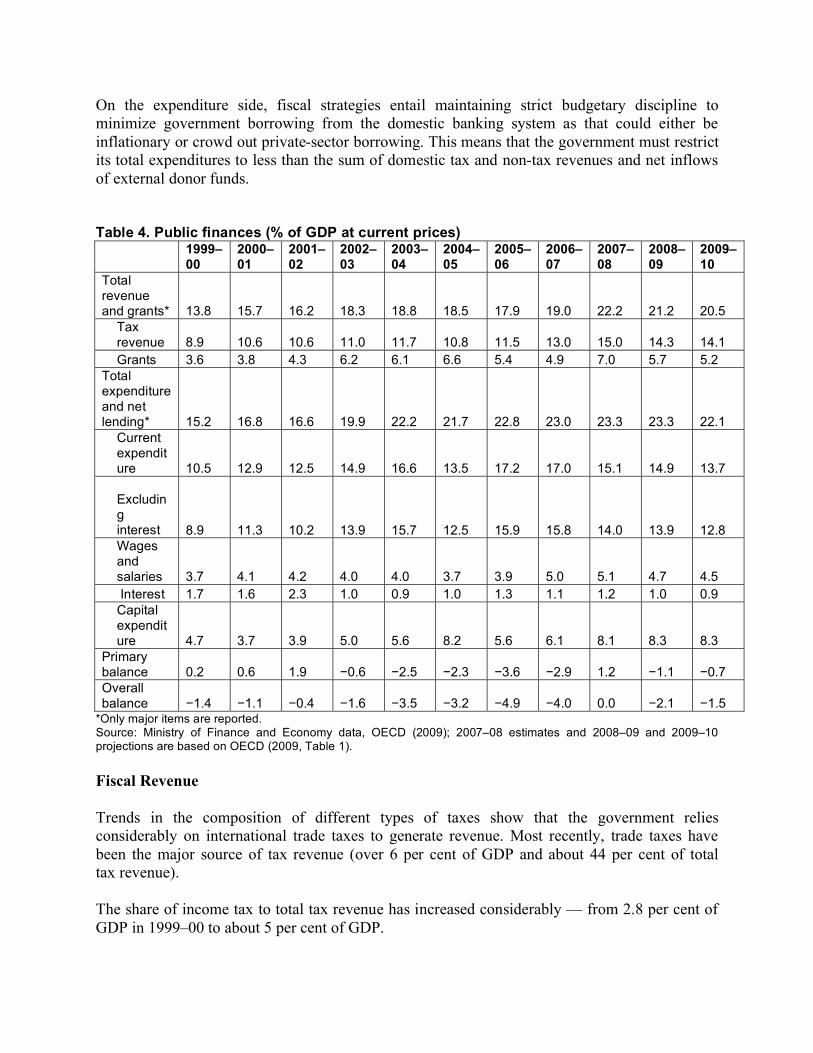
Table 4 summarizes the main components of public finances as a per cent of GDP. In FY 2007–
08, total revenue and grants constituted 22.2 per cent of GDP. Of this, tax revenue was 15 per
cent of GDP, making the country dependent on external budgetary assistance. In the same fiscal
year, grants constituted 7 per cent of GDP — about a third of total taxes collected that year.
However, because disbursement of external budgetary assistance is unreliable, domestic
borrowing has often been necessary. This contributes to the high levels of domestic interest rates.
In contrast with the poor performance of government revenue, public expenditures have, on
average, been rising steadily, from 15 per cent of GDP in FY 1999–2000 to 23.3 per cent in
2007–08. The primary balance has improved considerably from 0.2 per cent in 1999–2000 to 1.2
per cent in 2007–08. In contrast, the overall fiscal deficit has worsened: it grew from 1.4 per
cent of GDP in 1990–2000 to 4.9 per cent of GDP in 2005–06, then improved to 4 per cent the
following year (Table 4). This is an indication of low public savings.
On the revenue side, the government’s fiscal strategies have targeted raising revenues as a
percentage of GDP substantially to finance part of the public expenditures. Unfortunately, the
country still suffers from lack of tax collection capacity and there is almost no scope for raising
existing tax rates without distorting resource allocation and undermining voluntary taxpayer
compliance. Thus, the government has implemented reforms to strengthen tax administration,
improve its internal systems, enhance training of personnel, and increase taxpayer compliance.
However, despite these measures, tax collection capacity is still inadequate.
On the expenditure side, fiscal strategies entail maintaining strict budgetary discipline to
minimize government borrowing from the domestic banking system as that could either be
inflationary or crowd out private-sector borrowing. This means that the government must restrict
its total expenditures to less than the sum of domestic tax and non-tax revenues and net inflows
of external donor funds.
Table 4. Public finances (% of GDP at current prices)
1999–00
2000–01
2001–02
2002–03
2003–04
2004–05
2005–06
2006–07
2007–08
2008–09
2009–10
Total revenue and grants* 13.8 15.7 16.2 18.3 18.8 18.5 17.9 19.0 22.2 21.2 20.5
Tax revenue 8.9 10.6 10.6 11.0 11.7 10.8 11.5 13.0 15.0 14.3 14.1
Grants 3.6 3.8 4.3 6.2 6.1 6.6 5.4 4.9 7.0 5.7 5.2
Total expenditure and net lending* 15.2 16.8 16.6 19.9 22.2 21.7 22.8 23.0 23.3 23.3 22.1
Current expenditure 10.5 12.9 12.5 14.9 16.6 13.5 17.2 17.0 15.1 14.9 13.7
Excluding interest 8.9 11.3 10.2 13.9 15.7 12.5 15.9 15.8 14.0 13.9 12.8
Wages and salaries 3.7 4.1 4.2 4.0 4.0 3.7 3.9 5.0 5.1 4.7 4.5
Interest 1.7 1.6 2.3 1.0 0.9 1.0 1.3 1.1 1.2 1.0 0.9
Capital expenditure 4.7 3.7 3.9 5.0 5.6 8.2 5.6 6.1 8.1 8.3 8.3
Primary balance 0.2 0.6 1.9 0.6 2.5 2.3 3.6 2.9 1.2 1.1 0.7
Overall balance 1.4 1.1 0.4 1.6 3.5 3.2 4.9 4.0 0.0 2.1 1.5
*Only major items are reported. Source: Ministry of Finance and Economy data, OECD (2009); 2007–08 estimates and 2008–09 and 2009–10 projections are based on OECD (2009, Table 1).
Fiscal Revenue
Trends in the composition of different types of taxes show that the government relies
considerably on international trade taxes to generate revenue. Most recently, trade taxes have
been the major source of tax revenue (over 6 per cent of GDP and about 44 per cent of total
tax revenue).
The share of income tax to total tax revenue has increased considerably — from 2.8 per cent of
GDP in 1999–00 to about 5 per cent of GDP.
Tanzanian tax structure has also evolved over time in response to changing fiscal needs. Table 5
shows that there are two major sources of tax revenue: direct taxes and indirect taxes. Direct
taxes comprise pay as you earn (PAYE) taxes, and individual and corporation income taxes.
Indirect taxes comprise taxes on domestic goods and services and taxes on imports; more
specifically, they consist of excise taxes on domestic consumption, excise tax on imports, value-
added tax (VAT) on domestic consumption, and VAT on imports.
Total tax revenue as a percentage of GDP grew from about 9 per cent in 1999–2000 to about 15
per cent in 2008–09 or 0.6 per cent a year. The Tanzania’s tax-to-GDP ratio is below the average
for sub-Saharan Africa of 18 per cent.
Direct taxes contribute about 5 per cent of GDP (or 33 per cent of total tax revenue). The
contribution of this tax category increased from 2.8 per cent in 1999–2000 to 4.9 per cent in
2008–09. The observed growth in contribution of this tax category was attributable to an increase
in PAYE relative to corporation income tax.
Table 5. Itemized tax-to-GDP ratios
1999–2000
2000–01
2001–02
2002–03
2003–04
2004–05
2005–06
2006–07
2007–08
2008–09
Total Tax Revenue 8.9 9.7 9.6 9.8 10.3 10.9 11.6 13.3 14.6 14.7
Direct taxes 2.8 2.5 2.6 2.8 3.1 3.4 3.8 4.4 4.8 4.9
PAYE 1.0 1.1 1.2 1.2 1.4 1.6 1.7 2.1 2.2 2.4
B. skills and dev. levy
— 0.2 0.3 0.3 0.3 0.3 0.3
0.3 0.3 0.3
Individual taxes 0.2 0.1 0.1 0.1 0.1 0.2 0.2 0.2 0.2 0.2
Corporate taxes 0.7 0.5 0.6 0.7 0.8 1.0 1.2 1.4 1.6 1.5
Other 0.9 0.6 0.4 0.4 0.4 0.4 0.4 0.4 0.5 0.5
Indirect taxes 6.5 7.5 7.4 7.4 7.7 7.8 8.2 9.1 10.2 10.2
Domestic 2.5 2.4 2.4 2.5 2.6 2.7 2.8 3.1 3.3 3.6
Excise tax 0.9 0.8 0.7 0.8 0.7 0.7 0.8 0.9 1.0 1.0
VAT on domestic consumption 1.7 1.6 1.7 1.8 1.9 1.9 2.0 2.2 2.4 2.5
Other 0.8 0.3 0.3 0.2 0.2 0.2 0.2 0.2 0.3 0.3
International trade taxes 3.1 4.8 4.7 4.6 4.8 5.0 5.2 5.8 6.5 6.4
Import duties 1.2 1.1 0.9 1.0 1.0 0.7 1.0 1.3 1.4 1.4
Excise duties on imports 0.3 1.0 1.1 0.9 0.9 0.9 0.7 1.6 1.9 1.7
VAT on imports 1.4 2.1 2.1 2.2 2.4 2.9 3.0 2.4 2.4 2.3
Other 0.3 0.6 0.5 0.5 0.5 0.6 0.8 1.1 1.1 1.1
Total VAT 3.1 3.7 3.8 4.0 4.3 4.8 4.9 4.6 4.8 4.8
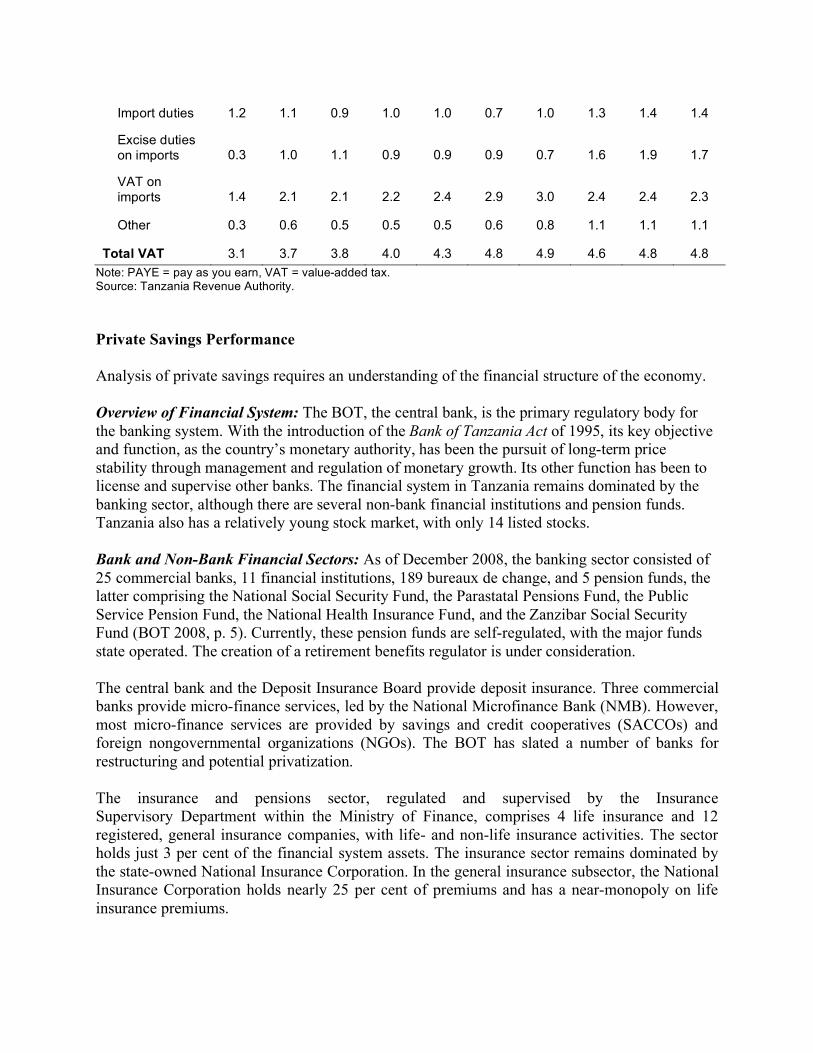
Note: PAYE = pay as you earn, VAT = value-added tax. Source: Tanzania Revenue Authority.
Private Savings Performance
Analysis of private savings requires an understanding of the financial structure of the economy.
Overview of Financial System: The BOT, the central bank, is the primary regulatory body for
the banking system. With the introduction of the Bank of Tanzania Act of 1995, its key objective
and function, as the country’s monetary authority, has been the pursuit of long-term price
stability through management and regulation of monetary growth. Its other function has been to
license and supervise other banks. The financial system in Tanzania remains dominated by the
banking sector, although there are several non-bank financial institutions and pension funds.
Tanzania also has a relatively young stock market, with only 14 listed stocks.
Bank and Non-Bank Financial Sectors: As of December 2008, the banking sector consisted of
25 commercial banks, 11 financial institutions, 189 bureaux de change, and 5 pension funds, the
latter comprising the National Social Security Fund, the Parastatal Pensions Fund, the Public
Service Pension Fund, the National Health Insurance Fund, and the Zanzibar Social Security
Fund (BOT 2008, p. 5). Currently, these pension funds are self-regulated, with the major funds
state operated. The creation of a retirement benefits regulator is under consideration.
The central bank and the Deposit Insurance Board provide deposit insurance. Three commercial
banks provide micro-finance services, led by the National Microfinance Bank (NMB). However,
most micro-finance services are provided by savings and credit cooperatives (SACCOs) and
foreign nongovernmental organizations (NGOs). The BOT has slated a number of banks for
restructuring and potential privatization.
The insurance and pensions sector, regulated and supervised by the Insurance
Supervisory Department within the Ministry of Finance, comprises 4 life insurance and 12
registered, general insurance companies, with life- and non-life insurance activities. The sector
holds just 3 per cent of the financial system assets. The insurance sector remains dominated by
the state-owned National Insurance Corporation. In the general insurance subsector, the National
Insurance Corporation holds nearly 25 per cent of premiums and has a near-monopoly on life
insurance premiums.
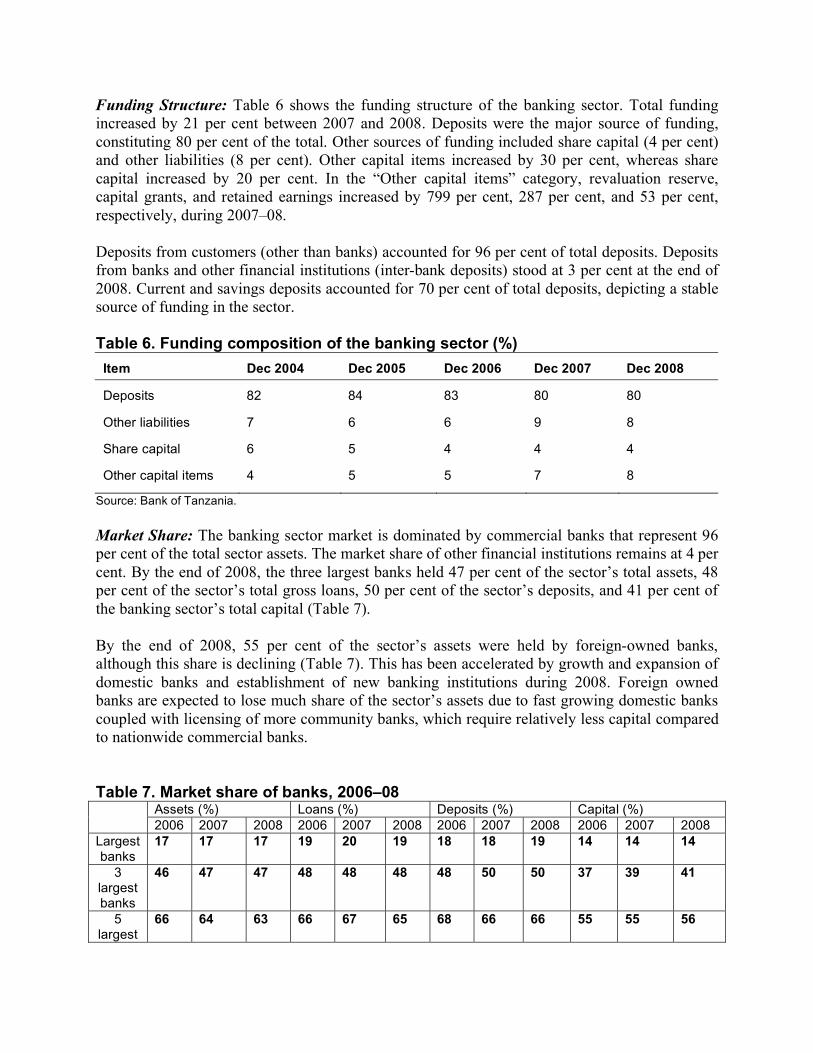
Funding Structure: Table 6 shows the funding structure of the banking sector. Total funding
increased by 21 per cent between 2007 and 2008. Deposits were the major source of funding,
constituting 80 per cent of the total. Other sources of funding included share capital (4 per cent)
and other liabilities (8 per cent). Other capital items increased by 30 per cent, whereas share
capital increased by 20 per cent. In the “Other capital items” category, revaluation reserve,
capital grants, and retained earnings increased by 799 per cent, 287 per cent, and 53 per cent,
respectively, during 2007–08.
Deposits from customers (other than banks) accounted for 96 per cent of total deposits. Deposits
from banks and other financial institutions (inter-bank deposits) stood at 3 per cent at the end of
2008. Current and savings deposits accounted for 70 per cent of total deposits, depicting a stable
source of funding in the sector.
Table 6. Funding composition of the banking sector (%)
Item Dec 2004 Dec 2005 Dec 2006 Dec 2007 Dec 2008
Deposits 82 84 83 80 80
Other liabilities 7 6 6 9 8
Share capital 6 5 4 4 4
Other capital items 4 5 5 7 8
Source: Bank of Tanzania.
Market Share: The banking sector market is dominated by commercial banks that represent 96
per cent of the total sector assets. The market share of other financial institutions remains at 4 per
cent. By the end of 2008, the three largest banks held 47 per cent of the sector’s total assets, 48
per cent of the sector’s total gross loans, 50 per cent of the sector’s deposits, and 41 per cent of
the banking sector’s total capital (Table 7).
By the end of 2008, 55 per cent of the sector’s assets were held by foreign-owned banks,
although this share is declining (Table 7). This has been accelerated by growth and expansion of
domestic banks and establishment of new banking institutions during 2008. Foreign owned
banks are expected to lose much share of the sector’s assets due to fast growing domestic banks
coupled with licensing of more community banks, which require relatively less capital compared
to nationwide commercial banks.
Table 7. Market share of banks, 2006–08 Assets (%) Loans (%) Deposits (%) Capital (%)
2006 2007 2008 2006 2007 2008 2006 2007 2008 2006 2007 2008
Largest banks
17 17 17 19 20 19 18 18 19 14 14 14
3 largest banks
46 47 47 48 48 48 48 50 50 37 39 41
5 largest
66 64 63 66 67 65 68 66 66 55 55 56
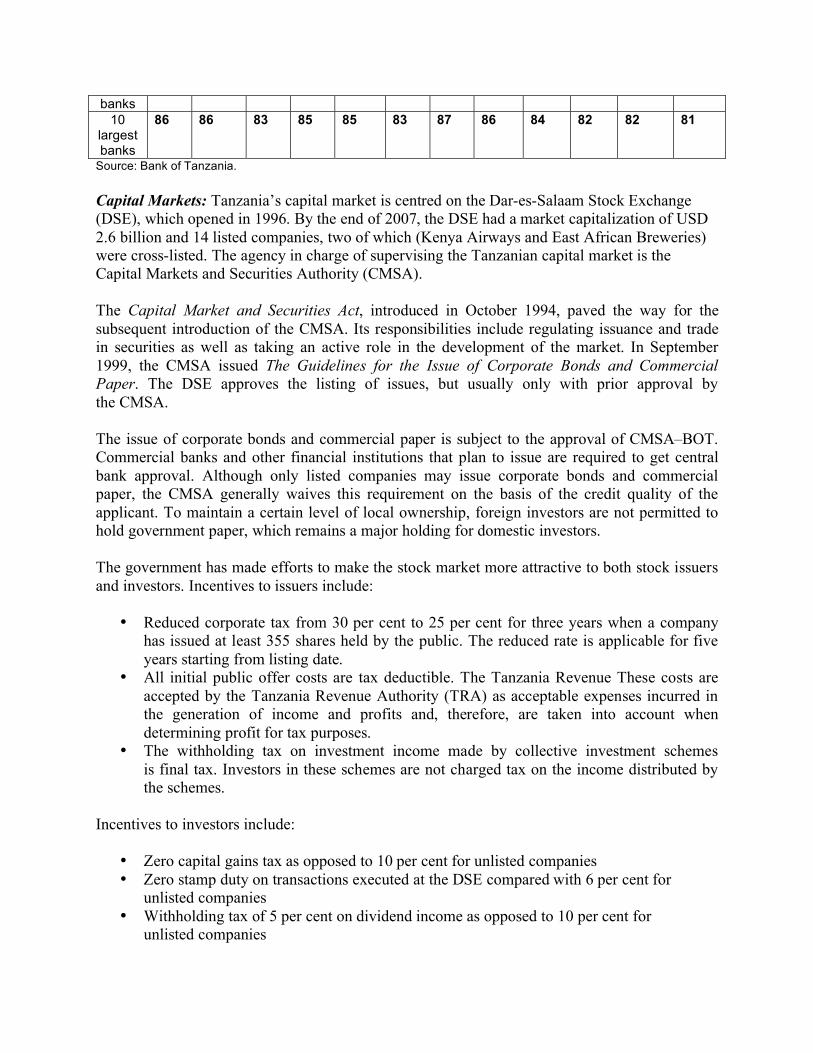
banks
10 largest banks
86 86 83 85 85 83 87 86 84 82 82 81
Source: Bank of Tanzania.
Capital Markets: Tanzania’s capital market is centred on the Dar-es-Salaam Stock Exchange
(DSE), which opened in 1996. By the end of 2007, the DSE had a market capitalization of USD
2.6 billion and 14 listed companies, two of which (Kenya Airways and East African Breweries)
were cross-listed. The agency in charge of supervising the Tanzanian capital market is the
Capital Markets and Securities Authority (CMSA).
The Capital Market and Securities Act, introduced in October 1994, paved the way for the
subsequent introduction of the CMSA. Its responsibilities include regulating issuance and trade
in securities as well as taking an active role in the development of the market. In September
1999, the CMSA issued The Guidelines for the Issue of Corporate Bonds and Commercial
Paper. The DSE approves the listing of issues, but usually only with prior approval by
the CMSA.
The issue of corporate bonds and commercial paper is subject to the approval of CMSA–BOT.
Commercial banks and other financial institutions that plan to issue are required to get central
bank approval. Although only listed companies may issue corporate bonds and commercial
paper, the CMSA generally waives this requirement on the basis of the credit quality of the
applicant. To maintain a certain level of local ownership, foreign investors are not permitted to
hold government paper, which remains a major holding for domestic investors.
The government has made efforts to make the stock market more attractive to both stock issuers
and investors. Incentives to issuers include:
• Reduced corporate tax from 30 per cent to 25 per cent for three years when a company
has issued at least 355 shares held by the public. The reduced rate is applicable for five
years starting from listing date.
• All initial public offer costs are tax deductible. The Tanzania Revenue These costs are
accepted by the Tanzania Revenue Authority (TRA) as acceptable expenses incurred in
the generation of income and profits and, therefore, are taken into account when
determining profit for tax purposes.
• The withholding tax on investment income made by collective investment schemes
is final tax. Investors in these schemes are not charged tax on the income distributed by
the schemes.
Incentives to investors include:
• Zero capital gains tax as opposed to 10 per cent for unlisted companies
• Zero stamp duty on transactions executed at the DSE compared with 6 per cent for
unlisted companies
• Withholding tax of 5 per cent on dividend income as opposed to 10 per cent for
unlisted companies
• Zero withholding tax on interest income from listed bonds maturing in three years
or more
• Exemptions of withholding tax on income accruing to fidelity funds maintained by DSE
for investor protection
• Income received from collective investment schemes is tax exempt
Fixed Income Markets: Treasury bills maturing in 35, 91, 182, and 364 days, as well as 2-, 5-,
7-, and 10-year treasury bonds are all issued regularly by the BOT on behalf of the government.
They are sold in a multiple price system, with treasury bill auctions held weekly. Treasury bond
auctions, usually monthly, are announced in advance via a quarterly calendar, published by the
BOT. All treasury bonds are listed on the DSE. Although primary dealers are active in the
market, investors are also permitted to submit bids to the BOT directly. The yield curve extends
to 10 years, and each of the existing benchmark issues, made up of 2-, 5-, 7,- and 10-year bonds,
is regularly auctioned by the BOT.
Tania Government Yield Curve (End 2006)
In the absence of dedicated market makers, there is very little activity in the secondary market.
Delivery and settlement of bonds is conducted through the DSE, on a T+2 basis for treasury
bills and T+1 for treasury bonds. The day count convention used for treasury securities is
actually 365.
Private Savings: The level of domestic savings is very low in sub-Saharan Africa. In 2003, gross
national savings as a ratio of gross national income was only about 17 per cent, compared with
23.1 per cent in all low-income countries. Gross national savings equals gross national income
minus private and public consumption plus net current transfers. Another measure of savings,
which takes into account the impact of the depreciation of fixed capital, is net national savings.
Gross domestic savings as a percentage of GDP averaged around 16 per cent.
It is generally acknowledged that savings rates in Africa, especially in sub-Saharan Africa, are
lower than in any other region in the world. In eastern Africa, they range between 10 and 15 per
cent of GDP. In Tanzania, gross domestic savings rate remained more or less constant from 2000
to 2005, averaging 16.3 per cent. This is far above the average for eastern African countries,
which improved from 5.3 per cent in 2000 to 7.5 per cent in 2005, but slightly below that for
sub-Saharan Africa (17.6 per cent in 2005).
However, Tanzania’s high savings rate relative to other eastern African countries should be
viewed with caution. Perhaps a close look at money growth, GDP growth, and inflation will be
useful. Normally, the sum of the rate of inflation and GDP growth is equal or close to money
growth, as money growth is meant to finance both GDP growth and inflation. In the case of
Tanzania, there is a big gap between the sum of GDP growth and inflation and money growth
(Table 8) signaling a potential problem. A possible issue is that in computing GDP, the non-
monetary component is omitted resulting in an underestimate of GDP and, thus, an overestimate
of savings rate.
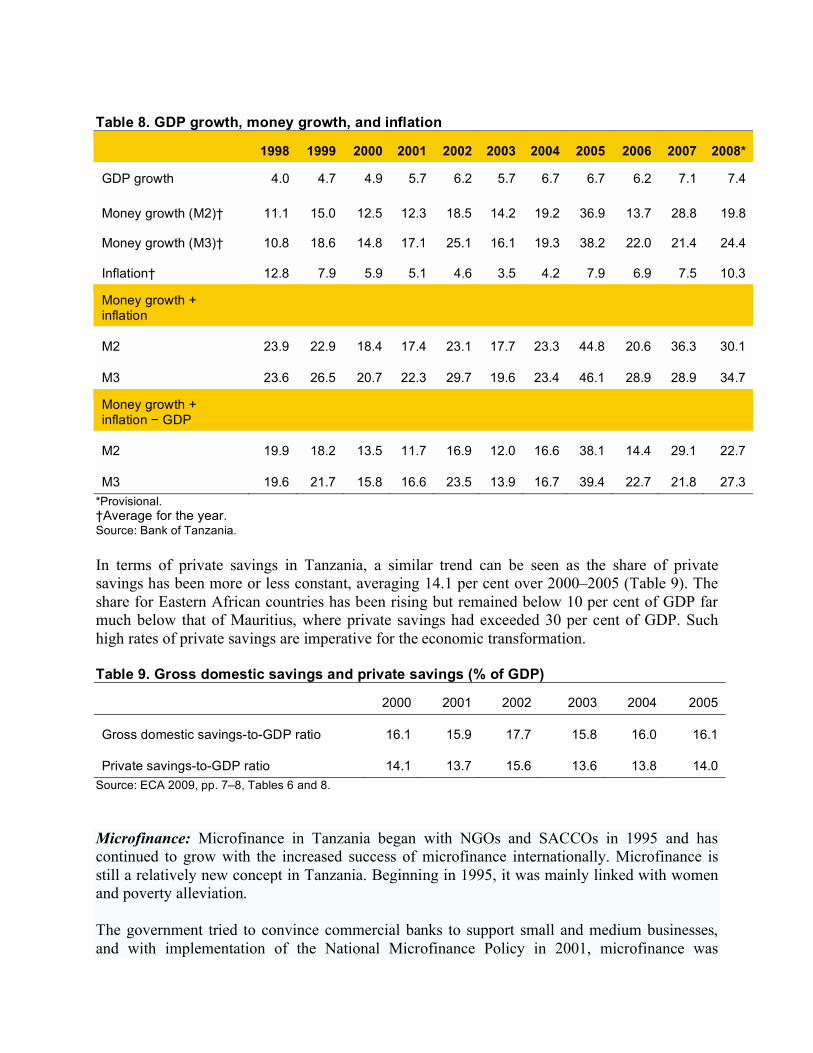
Table 8. GDP growth, money growth, and inflation
1998 1999 2000 2001 2002 2003 2004 2005 2006 2007 2008*
GDP growth 4.0 4.7 4.9 5.7 6.2 5.7 6.7 6.7 6.2 7.1 7.4
Money growth (M2)† 11.1 15.0 12.5 12.3 18.5 14.2 19.2 36.9 13.7 28.8 19.8
Money growth (M3)† 10.8 18.6 14.8 17.1 25.1 16.1 19.3 38.2 22.0 21.4 24.4
Inflation† 12.8 7.9 5.9 5.1 4.6 3.5 4.2 7.9 6.9 7.5 10.3
Money growth + inflation
M2 23.9 22.9 18.4 17.4 23.1 17.7 23.3 44.8 20.6 36.3 30.1
M3 23.6 26.5 20.7 22.3 29.7 19.6 23.4 46.1 28.9 28.9 34.7
Money growth + inflation GDP
M2 19.9 18.2 13.5 11.7 16.9 12.0 16.6 38.1 14.4 29.1 22.7
M3 19.6 21.7 15.8 16.6 23.5 13.9 16.7 39.4 22.7 21.8 27.3
*Provisional.
†Average for the year. Source: Bank of Tanzania.
In terms of private savings in Tanzania, a similar trend can be seen as the share of private
savings has been more or less constant, averaging 14.1 per cent over 2000–2005 (Table 9). The
share for Eastern African countries has been rising but remained below 10 per cent of GDP far
much below that of Mauritius, where private savings had exceeded 30 per cent of GDP. Such
high rates of private savings are imperative for the economic transformation.
Table 9. Gross domestic savings and private savings (% of GDP)
2000 2001 2002 2003 2004 2005
Gross domestic savings-to-GDP ratio 16.1 15.9 17.7 15.8 16.0 16.1
Private savings-to-GDP ratio 14.1 13.7 15.6 13.6 13.8 14.0
Source: ECA 2009, pp. 7–8, Tables 6 and 8.
Microfinance: Microfinance in Tanzania began with NGOs and SACCOs in 1995 and has
continued to grow with the increased success of microfinance internationally. Microfinance is
still a relatively new concept in Tanzania. Beginning in 1995, it was mainly linked with women
and poverty alleviation.
The government tried to convince commercial banks to support small and medium businesses,
and with implementation of the National Microfinance Policy in 2001, microfinance was
officially recognized as a tool for poverty eradication. With increased use and exposure to the
concept, banks have taken an interest in offering microfinance. The NMB is an institutional
provider of microfinance services, and the Akiba Commercial Bank and Cooperative and Rural
Development Bank (CRDB) are also strong supporters of microfinance. Other organizations
involved in microfinance include FINCA, Promotion of Rural Initiative and Development
Enterprises (PRIDE), and the Small Enterprise Development Agency (SEDA), and the Tanzania
Postal Bank. Community and other small banks have taken an interest in this area, as well as
many NGOs and non-profit organizations.
A 2005 survey carried out by the BOT (the overseer of microfinance under the Ministry of
Finance) updated the directory of microfinance practitioners and included basic information on
microfinance institutions (MFIs), including commercial banks, financial institutions, financial
NGOs, SACCOs, and Savings and Credit Associations (SACAs). The directory lists a total of 8
banks, 45 community-based organizations, 2 companies, 95 government programs, 1620
SACCOs, 48 SACAs, and 62 NGOs.
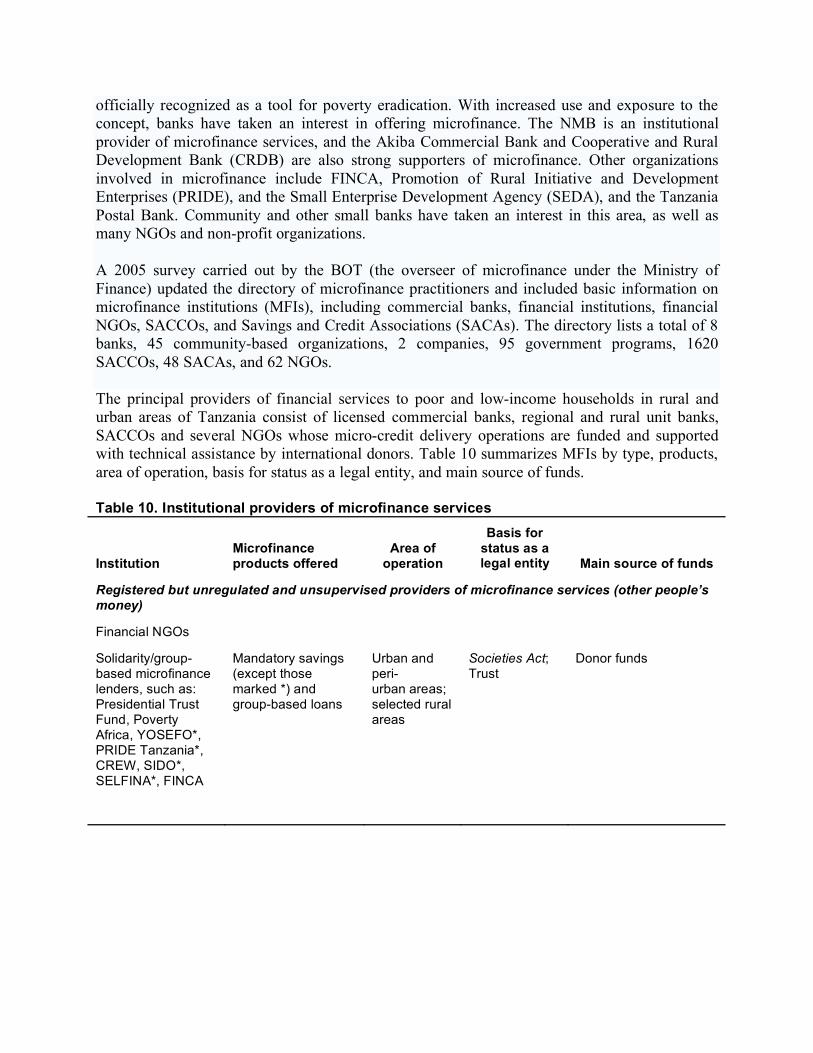
The principal providers of financial services to poor and low-income households in rural and
urban areas of Tanzania consist of licensed commercial banks, regional and rural unit banks,
SACCOs and several NGOs whose micro-credit delivery operations are funded and supported
with technical assistance by international donors. Table 10 summarizes MFIs by type, products,
area of operation, basis for status as a legal entity, and main source of funds.
Table 10. Institutional providers of microfinance services
Institution Microfinance products offered
Area of operation
Basis for status as a legal entity Main source of funds
Registered but unregulated and unsupervised providers of microfinance services (other people’s money)
Financial NGOs
Solidarity/group-based microfinance lenders, such as: Presidential Trust Fund, Poverty Africa, YOSEFO*, PRIDE Tanzania*, CREW, SIDO*, SELFINA*, FINCA
Mandatory savings (except those marked *) and group-based loans
Urban and peri- urban areas; selected rural areas
Societies Act; Trust
Donor funds
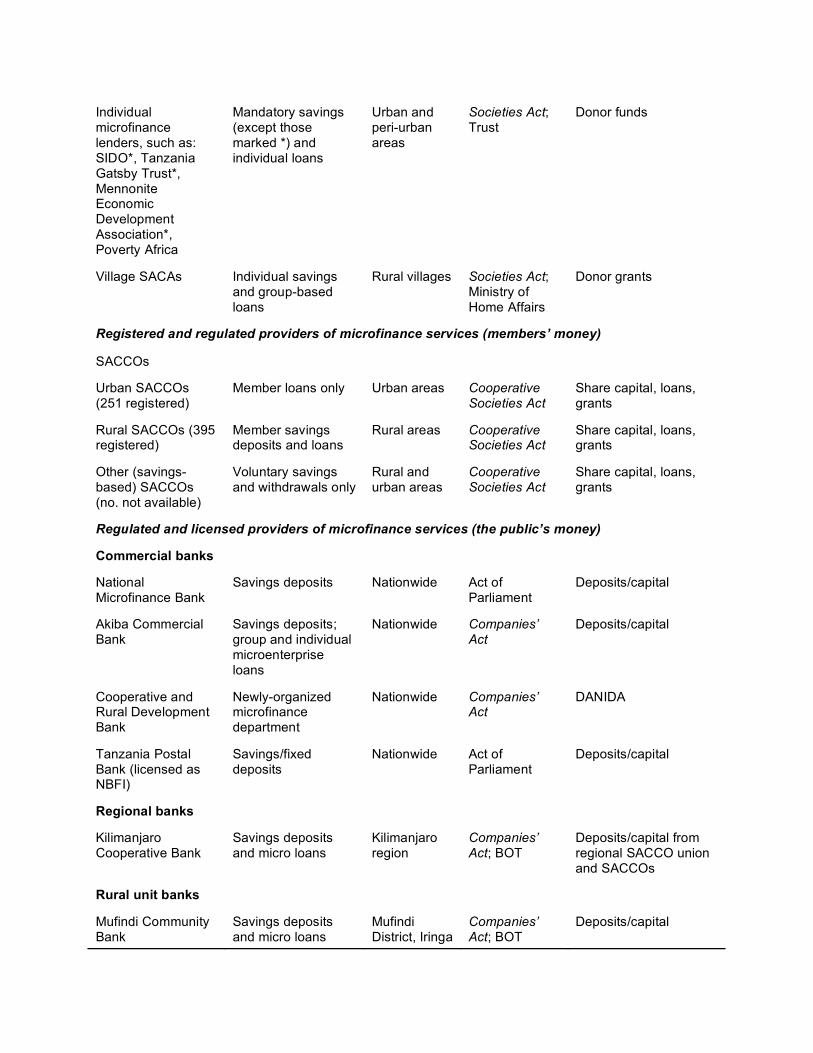
Individual microfinance lenders, such as: SIDO*, Tanzania Gatsby Trust*, Mennonite Economic Development Association*, Poverty Africa
Mandatory savings (except those marked *) and individual loans
Urban and peri-urban areas
Societies Act; Trust
Donor funds
Village SACAs Individual savings and group-based loans
Rural villages Societies Act; Ministry of Home Affairs
Donor grants
Registered and regulated providers of microfinance services (members’ money)
SACCOs
Urban SACCOs (251 registered)
Member loans only Urban areas Cooperative
Societies Act
Share capital, loans, grants
Rural SACCOs (395 registered)
Member savings deposits and loans
Rural areas Cooperative Societies Act
Share capital, loans, grants
Other (savings-based) SACCOs (no. not available)
Voluntary savings and withdrawals only
Rural and urban areas
Cooperative
Societies Act
Share capital, loans, grants
Regulated and licensed providers of microfinance services (the public’s money)
Commercial banks
National Microfinance Bank
Savings deposits Nationwide Act of Parliament
Deposits/capital
Akiba Commercial Bank
Savings deposits; group and individual microenterprise loans
Nationwide Companies’
Act
Deposits/capital
Cooperative and Rural Development Bank
Newly-organized microfinance department
Nationwide Companies’ Act
DANIDA
Tanzania Postal Bank (licensed as NBFI)
Savings/fixed deposits
Nationwide Act of Parliament
Deposits/capital
Regional banks
Kilimanjaro Cooperative Bank
Savings deposits and micro loans
Kilimanjaro region
Companies’
Act; BOT Deposits/capital from regional SACCO union and SACCOs
Rural unit banks
Mufindi Community Bank
Savings deposits and micro loans
Mufindi District, Iringa
Companies’
Act; BOT Deposits/capital
Region
Mwanga Rural Community Bank
Savings deposits and micro loans
Pare District, Kilimanjaro
Companies’
Act; BOT Deposits/capital
Note: BOT = Bank of Tanzania, DANIDA = Danish International Development Agency, PRIDE = Promotion of Rural Initiative and Development Enterprises, SACAs = savings and credit associations, SACCOs = savings and credit cooperatives, SIDO = Small Industries Development Organization. Source: Randhawa and Gallardo (2003, Table 1, p. 7).
Tanzania illustrates the success of MFIs in mobilizing deposits, although the outreach of the
banking sector remains limited. Only about 6 per cent of the population has a bank account (4
per cent in rural areas). MFIs have a total of about 2 million deposit accounts (6 per cent of
population). They hold about 60 per cent and 11 per cent of total commercial bank deposits and
credit, respectively (2002 data). The primary sources of microfinance services are about 650
SACCOs with 130 000 members (0.4 per cent of the population) and NGOs relying on foreign
donor assistance. There are three commercial (or deposit) banks — the NMB, the CRDB, and the
Akiba Commercial Bank — which are relatively new entrants into the microfinance sector. In
addition, there are a few regional and rural banks engaged in deposit-based microfinance
operations, but these have been limited in scope because they lack a branch network. Among
nonbank financial institutions, the Tanzania Postal Bank has used its country-wide network of
post offices to promote and mobilize savings, provide transfer and remittance services, and
extend a loan guarantee service to small borrowers to cover part of the security requirement for
their loans.
MFIs and commercial banks work together to provide financial services. In a number of African
countries, they have cooperated to extend their outreach and achieve economies of scale. Branch
networks are seen as effective in servicing a larger client base while containing costs. In
Tanzania, the example of the CRDB developing banking relationships with savings and credit
cooperatives to channel funds for micro-lending is illustrative. Cooperation also entails
channeling credit from banks and MFIs to clients with obvious business synergies. The NMB is
developing relations between credit to its large corporate clients and credit to micro-enterprises
that supply inputs and distribute the products of the former. The NMB lends money to micro-
enterprises to finance their purchases and inventories and provides large corporate clients with
collection and payment services to and from micro-enterprises.
Constraints on Mobilization of Savings
Constraints to savings mobilization can be classified as constitutional constraints, financial and
monetary constraints, fiscal constraints, and others.
Constitutional/Legal Constraints
The legislative “power of the purse” is said to be fundamentally important to democratic
government. Yet, even a cursory comparison of legislative arrangements for financial scrutiny
has to conclude that legislatures differ widely in the way with which they exercise this power
(Wehner 2005). For example, the United States Congress has broad constitutional powers in
financial matters, makes budgetary decisions through a complex system of specialized
committees of both houses, and has access to extensive analytical support in the Congressional
Budget Office. In contrast, the United Kingdom’s Parliament has abdicated the right to take
financial initiatives to its executive, does not have a specialized budget committee, and has no
parliamentary budget office to provide analytical support.
Given that the authorization of taxes and public expenditures is a primary function of the
legislature in any democratic system, such variation is perplexing. East African Parliaments
follow the United Kingdom’s model, commonly referred to as the Commonwealth Parliament
Model. However, several modifications have been made in some cases. For instance, in Uganda,
the role of Parliament in public finances was enhanced by the Budget Act 2001, which assigned it
roles similar to those of the United States’ system. The Parliament of Uganda has power not only
to make budgetary decisions, but also to mobilize domestic resources. Like the United States’
system, it also has access to technical analytical support in the Parliamentary Budget Office.
There are indications that other parliaments of the region are in the process of adopting the
Ugandan model. Indeed the Parliaments of Rwanda, Kenya, and Southern Sudan are at different
stages of reforming their roles. The additional powers give Parliament an important part in DRM.
The Tanzanian Parliament has very limited constitutional powers in financial matters. Its
constitution is weak pertaining to financial and particularly to taxation matters. In the entire
constitution, there are only two articles on taxation: articles 99 and 138. According to article 99:
(1) Parliament will not involve itself in any of the matters relating to this paragraph except if
the President has recommended that a particular matter be dealt with by Parliament, and if
the President's recommendation has been submitted to Parliament by a Minister.
(2) Issues involved in this paragraph are as follows:-
(a) A bill or any changes in a bill in respect of any of the following matters;
(i) Imposing taxes or modifying taxes in any other way other than reducing it;
(ii) Ordering that expenditure or spending be done from the Treasury of the
Government or any other Government Fund, or to change the ceiling in any way other
than reducing it;
(iii) Ordering that expenditure or spending of money be done from the Treasury of the
Government of from any other Fund when it is clear that no funds were reserved for
such expenditure or spending, or to order that payments or spending from these funds
be increased;
(iv) To withdraw or cancel any loan owed to the Government of the Union;
(b) A motion or any changes in a motion in respect of any of the things mentioned in sub-
section (a) of this sub-paragraph.
(3) The conditions of this paragraph will not apply to a bill submitted to Parliament or any
motion submitted to Parliament by a Minister or Deputy Minister.
Article 138(1) states, “No tax of any kind shall be imposed save in accordance with a law
enacted by Parliament or pursuant to a procedure lawfully prescribed and having the force of law
by virtue of a law enacted by Parliament.” This weakness limits the scope of the Parliament in
contributing to DRM.
In contrast, Brazil’s and Ethiopia’s constitutions are rich in taxation and expenditure issues; they
have more provisions related to fiscal issues than most developing countries. Uganda’s
constitution comes next.
According to article 152 of the Ugandan constitution, “no tax shall be imposed except under the
authority of an Act of Parliament.” In addition, if a tax is waived under the same law, the
waiving authority is obliged to report back to Parliament. The executive presents the finance bill
to Parliament annually, signifying changes in tax policy and rates, tax bases, and tax
administration policy. With the guidance of technical analysis within Parliament, the legislature
is mandated to scrutinize these proposals, make necessary amendments, and pass them into law.
Here Parliament plays an important role in domestic tax mobilization. It can propose ways to
increase tax mobilization, remove or introduce a new tax, alter the rates imposed, and propose
tax administration reforms. In Tanzania, tax reforms must be initiated by the executive.
The ultimate power of government to borrow rests with Parliament. Indeed, Article 159(2) of the
Ugandan constitution states, “Government shall not borrow, guarantee, or raise a loan on behalf
of itself or any public institution, authority or person except as authorized by or under an Act of
Parliament.” Under this law, domestic loan mobilization powers are embedded within
Parliament. This is not the case in Tanzania. In addition resources can be expended on the
consolidated fund only with approval from Parliament. Resources mobilized directly by
government borrowing from the central bank fall into this category.
In Uganda, under Section 4 of the Budget Act 2001, the executive is obliged to submit to
Parliament a macro-economic plan and indicative framework (in which revenue estimates are
included) for the upcoming budget. Under the macro-economic plan, DRM is influenced from
the monetary policy perspective. Parliament is expected to propose revisions and recommend
alternatives. Again technical capacity withstanding, Parliament can play an important role in the
way government will mobilize resources from inflationary financing of the budget.
Parliament oversight provides for a monitoring role and supervision of executive organs under
which domestic revenue collecting functions fall. Parliament is expected to monitor the
performance of government programs, including DRM. In Uganda, for example, Parliament
periodically receives reports on the performance of domestic revenues, both tax and non-tax.
Thus Parliament can play a role in ensuring government performs well in DRM and can make
recommendations and influence DRM performance. However, its role hinges mainly on the level
of separation of powers and respect for the various functions of each arm of government by the
various players.
Financial Constraints
There are many reasons for Africa’s low savings rates: inadequate financial services, physical
distance from banking institutions, and high minimum deposit and balance requirements, among
others. These factors make it difficult for most of the population to obtain access to banking
services. As a result, only 20 per cent of African families have bank accounts (Dovi 2008, p.3).
Ethiopia, Uganda, and Tanzania have fewer than one bank branch per 100 000 people. The ratio
is better for some southern African countries; Namibia, for example, has more than four,
Zimbabwe more than three, and Botswana nearly four (Dovi 2008, p. 3).
Banks’ minimum balance requirements and the cost of maintaining an account are too high for
many people in Tanzania. Opening a bank account in one of the largest commercial banks, the
National Bank of Commerce Limited, requires a TZS 50 000 deposit (USD 40), a sum greater
than the annual income of many Tanzanians.
Many banks also insist on considerable documentation to open an account — at least three
documents, including an identity card, voter’s registration card, or passport, a letter of
recommendation, and proof of address. In a country where many people work in the informal
sector and more than 80 per cent live in rural areas, gathering such documents can be
a challenge.
In the face of this, even people with extra money may have little incentive to save. In Tanzania,
the interest on savings is about 3 per cent, while the annual interest rate on loans ranges from 12
to 26 per cent. Thus considering the current rate of inflation of around 13 per cent, real interest
ranges from 10 to 23 per cent — too low by any standards.
A low level of formal savings deposits means that banks have limited funds to lend and forces
them to charge high interest rates. However, in Tanzania, the situation is different. Banks have
excess liquidity and, hence, excess money to lend. The source of this liquidity emanates from a
myriad of bank charges on account holders (Table 11) and because banks do not make many
loans because of the stringent collateral requirements and high rate of rejection of applications.
In Kenya, the collateral requirement is high, but the rejection rate is low compared
with Tanzania’s.
Stock Markets: In Tanzania, the stock market is small and not very active. With only 14
companies listed, an average of 95 622 shares are traded daily at an average value of USD 2.03
and the DSE index was 1081.5 in FY 2006–07. In the same year, the DSE registered a loss of
USD 9400, compared with its profit of USD 12 359 in the previous year, possibly because of the
global economic and financial crisis.
The number of listed companies is small for a number of reasons.
• The need for disclosure: Many private companies are reluctant to list because they
fear public scrutiny, preferring to keep company information to themselves. They don’t
see a significant benefit of listing on the DSE and the fiscal incentives, outlined above,
are not sufficient.
• Investors’ lack of knowledge: Few Tanzanians, even educated ones, understand the
operation of stock markets.
• Lack of awareness: Many people are uninformed about stock market activities.
• Management of the stock market: Insider trading: As market capitalization is small and
only a few companies are listed, it is possible for an individual to obtain information
about future changes in share prices.
• Few buyers compared with sellers in the secondary market: The supply of shares in
the secondary market is much higher than the demand for them. Thus, it is difficult to
sell shares.
The DSE will remain small unless the government takes drastic measures to stimulate
the market. There is real need to undertake such measures as the stock market is a major vehicle
for DRM.
Interest Rates: Interest rates continue to be market determined. Policy efforts have been directed
toward narrowing the spread between lending and deposit rates in commercial banks, as well as
maintaining positive real interest rates. Between 2002 and 2008, the weighted average interest
rate on term deposits increased from 3.4 per cent to 6.8 per cent (Table 11). However, the real
deposit rate remained negative. The overall commercial bank lending rate dropped from 22.7 per
cent in 1999 to 15.1 per cent in 2008. The margin between overall lending rate and interest on
savings declined from 15.6 per cent in 1999 to 12.4 per cent in 2008. This spread, which is one
of the major constraints to access to credit, remained more or less constant averaging about 12.5
per cent in 2003–08. The real deposit rate declined from 0.8 per cent in 1999 to 7.6 in 2008.
Financial Policies: Accordingly, the financial liberalization record has not been stellar. Its
impact has been neither pro-growth nor pro-poor. In response to liberalization, commercial banks
in Tanzania have concentrated their activities in major urban areas. Although aggregate statistics
indicate improvement, access to credit has become, if anything, more unequal. The rural
population remains deprived of credit and is likely worse off compared with the access to credit
that state-owned agricultural banks, such as the old CRDB, had previously provided.
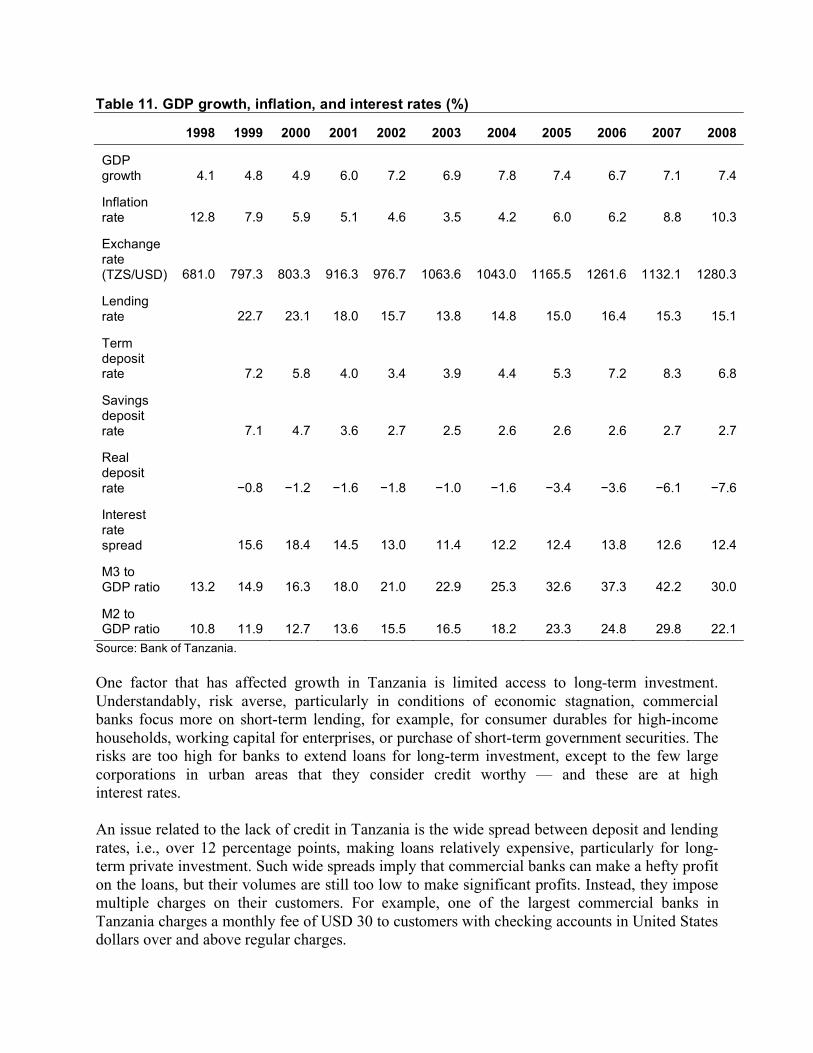
Table 11. GDP growth, inflation, and interest rates (%)
1998 1999 2000 2001 2002 2003 2004 2005 2006 2007 2008
GDP growth 4.1 4.8 4.9 6.0 7.2 6.9 7.8 7.4 6.7 7.1 7.4
Inflation rate 12.8 7.9 5.9 5.1 4.6 3.5 4.2 6.0 6.2 8.8 10.3
Exchange rate (TZS/USD) 681.0 797.3 803.3 916.3 976.7 1063.6 1043.0 1165.5 1261.6 1132.1 1280.3
Lending rate 22.7 23.1 18.0 15.7 13.8 14.8 15.0 16.4 15.3 15.1
Term deposit rate 7.2 5.8 4.0 3.4 3.9 4.4 5.3 7.2 8.3 6.8
Savings deposit rate 7.1 4.7 3.6 2.7 2.5 2.6 2.6 2.6 2.7 2.7
Real deposit rate 0.8 1.2 1.6 1.8 1.0 1.6 3.4 3.6 6.1 7.6
Interest rate spread 15.6 18.4 14.5 13.0 11.4 12.2 12.4 13.8 12.6 12.4
M3 to GDP ratio 13.2 14.9 16.3 18.0 21.0 22.9 25.3 32.6 37.3 42.2 30.0
M2 to GDP ratio 10.8 11.9 12.7 13.6 15.5 16.5 18.2 23.3 24.8 29.8 22.1
Source: Bank of Tanzania.
One factor that has affected growth in Tanzania is limited access to long-term investment.
Understandably, risk averse, particularly in conditions of economic stagnation, commercial
banks focus more on short-term lending, for example, for consumer durables for high-income
households, working capital for enterprises, or purchase of short-term government securities. The
risks are too high for banks to extend loans for long-term investment, except to the few large
corporations in urban areas that they consider credit worthy — and these are at high
interest rates.
An issue related to the lack of credit in Tanzania is the wide spread between deposit and lending
rates, i.e., over 12 percentage points, making loans relatively expensive, particularly for long-
term private investment. Such wide spreads imply that commercial banks can make a hefty profit
on the loans, but their volumes are still too low to make significant profits. Instead, they impose
multiple charges on their customers. For example, one of the largest commercial banks in
Tanzania charges a monthly fee of USD 30 to customers with checking accounts in United States
dollars over and above regular charges.
Low Incomes: Most Tanzanians are poor. Even after four decades of independence, Tanzania
remains one of the poorest countries in the world. In 2006, its GDP per capita was USD 329, far
below the average for sub-Saharan Africa (USD 500) and East Asia (USD 970). Poverty remains
widespread with half of Tanzanians living in conditions of deprivation. Poverty is concentrated
in rural areas where over 80 per cent of Tanzanians live (Randhawa and Gallardo 2003). When
incomes are low, a large portion must be devoted to “survival consumption.” In other words,
Tanzanians are too poor to save. Yet poor countries in other regions of the world, particularly in
East Asia, have succeeded in saving money, accumulating capital, and developing. What is
preventing Tanzania from doing so?
Lack of Financial Institutions: Tanzania lacks institutions that that can mobilize and monetize
domestic savings, particularly in rural areas. In 2003, banking sector credit as a ratio of GDP was
about 75 per cent in sub-Saharan Africa compared with about 45 per cent in all low-income
countries. Of course, the ratio for South Africa was about 158 per cent, which affects the
aggregate for Africa. However, lack of credit is not the only problem; very little credit seems to
be financing productive investment in Tanzania.
Lack of Investment Opportunities: Yet another explanation for low savings is the lack of
investment opportunities in Tanzania. Some forms of investment, such as buying land, are also a
form of saving. According to Keynesian economics, investment creates its own savings through
the multiplier–accelerator model (Pollin 2002). This approach emerged in opposition to the pre-
Keynesian view that the savings rate is the main determinant of investment. However, the
Keynesian model does not explain how the first burst of autonomous investment, which initiates
the multiplier–accelerator process can be financed (Pollin 2002, p. 4).
When savings are low, it might be difficult to jumpstart the initial phase of self-sustaining capital
accumulation. The state might have to intervene, not only to generate an initial pool of national
savings, but also to direct it to long-term productive investment. This strategy appears to be one
of the explanations for the rapid economic progress of some East Asian economies.
Fiscal Constraints
Tax Policies: Public revenue is low in Tanzania. The domestic resource base is small. A
widespread “small government ideology” has masked the reality that many governments do not
command the resources necessary to finance many essential public services. To put this into
perspective, for all developing countries, tax-to-GDP is only 18 per cent — for Tanzania, it is
about 16 per cent — compared with 30 per cent in industrial countries (Tanzi and Zee 2001).
Thus, it is important for Tanzania to find ways to boost its revenue base to achieve a 20 per cent
or even 25 per cent tax-to-GDP ratio over the long-term. This will not be easy, however.
Although Tanzania has recently been successful in maintaining satisfactory rates of economic
growth, it has not been able to translate this success into self-sustaining development.
Apart from the low tax-to-GDP ratio, the current Tanzania tax structure indicates that the country
is still much dependant on trade taxes, which is not healthy and, possibly, a serious constraint on
DRM in the public sector.
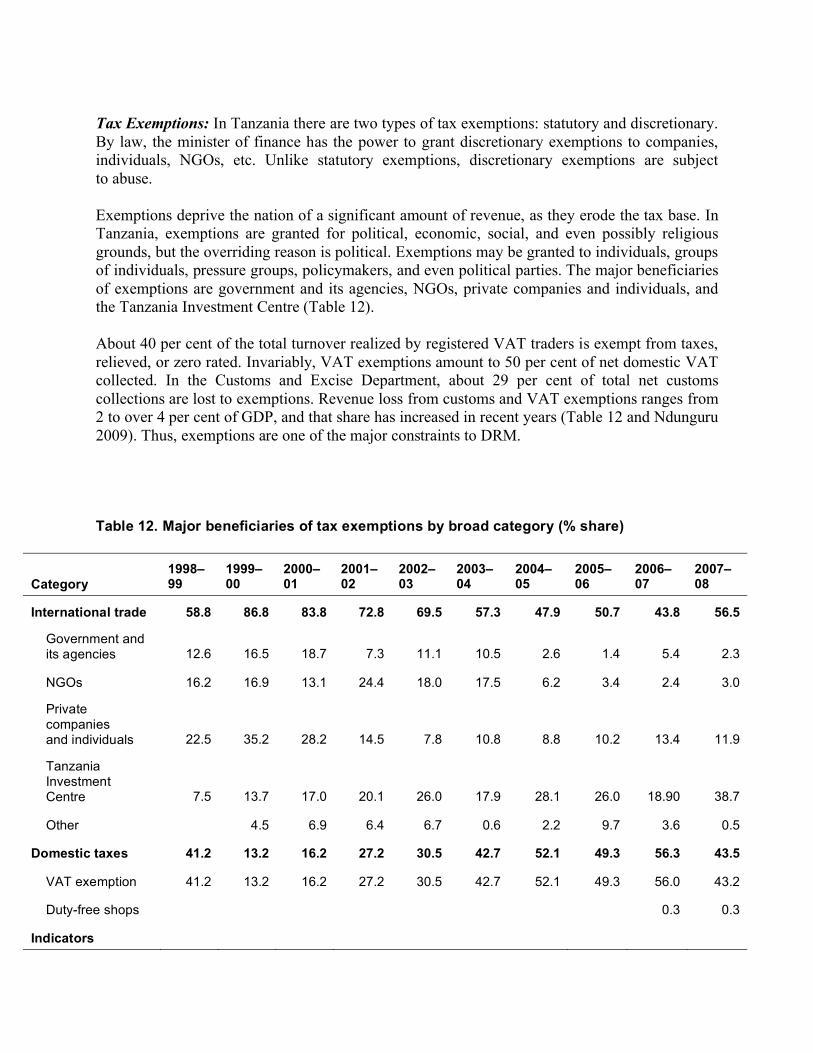
Tax Exemptions: In Tanzania there are two types of tax exemptions: statutory and discretionary.
By law, the minister of finance has the power to grant discretionary exemptions to companies,
individuals, NGOs, etc. Unlike statutory exemptions, discretionary exemptions are subject
to abuse.
Exemptions deprive the nation of a significant amount of revenue, as they erode the tax base. In
Tanzania, exemptions are granted for political, economic, social, and even possibly religious
grounds, but the overriding reason is political. Exemptions may be granted to individuals, groups
of individuals, pressure groups, policymakers, and even political parties. The major beneficiaries
of exemptions are government and its agencies, NGOs, private companies and individuals, and
the Tanzania Investment Centre (Table 12).
About 40 per cent of the total turnover realized by registered VAT traders is exempt from taxes,
relieved, or zero rated. Invariably, VAT exemptions amount to 50 per cent of net domestic VAT
collected. In the Customs and Excise Department, about 29 per cent of total net customs
collections are lost to exemptions. Revenue loss from customs and VAT exemptions ranges from
2 to over 4 per cent of GDP, and that share has increased in recent years (Table 12 and Ndunguru
2009). Thus, exemptions are one of the major constraints to DRM.
Table 12. Major beneficiaries of tax exemptions by broad category (% share)
Category 1998–99
1999–00
2000–01
2001–02
2002–03
2003–04
2004–05
2005–06
2006–07
2007–08
International trade 58.8 86.8 83.8 72.8 69.5 57.3 47.9 50.7 43.8 56.5
Government and its agencies 12.6 16.5 18.7 7.3 11.1 10.5 2.6 1.4 5.4 2.3
NGOs 16.2 16.9 13.1 24.4 18.0 17.5 6.2 3.4 2.4 3.0
Private companies and individuals 22.5 35.2 28.2 14.5 7.8 10.8 8.8 10.2 13.4 11.9
Tanzania Investment Centre 7.5 13.7 17.0 20.1 26.0 17.9 28.1 26.0 18.90 38.7
Other 4.5 6.9 6.4 6.7 0.6 2.2 9.7 3.6 0.5
Domestic taxes 41.2 13.2 16.2 27.2 30.5 42.7 52.1 49.3 56.3 43.5
VAT exemption 41.2 13.2 16.2 27.2 30.5 42.7 52.1 49.3 56.0 43.2
Duty-free shops 0.3 0.3
Indicators
Exemptions as % of GDP 4.5 3.1 2.3 2.5 2.0 2.4 3.0 4.5 4.3 3.6
Exemptions as % of tax revenues 43.7 30.9 23.6 26.2 20.4 23.5 27.6 38.6 31.8 23.9
Tax revenues as % of GDP 10.3 9.0 9.7 9.6 9.8 10.1 10.9 11.7 13.4 14.9
Memorandum items
GDP mp (TZS trillion) 6.00 6.85 8.65 9.77 11.27 13.03 14.96 16.84 19.25 22.34
Tax revenue (TZS trillion) 0.62 0.69 0.83 0.94 1.11 1.32 1.63 1.97 2.58 33.00
Source: Maliyamkono et al. (2009, chapter 3).
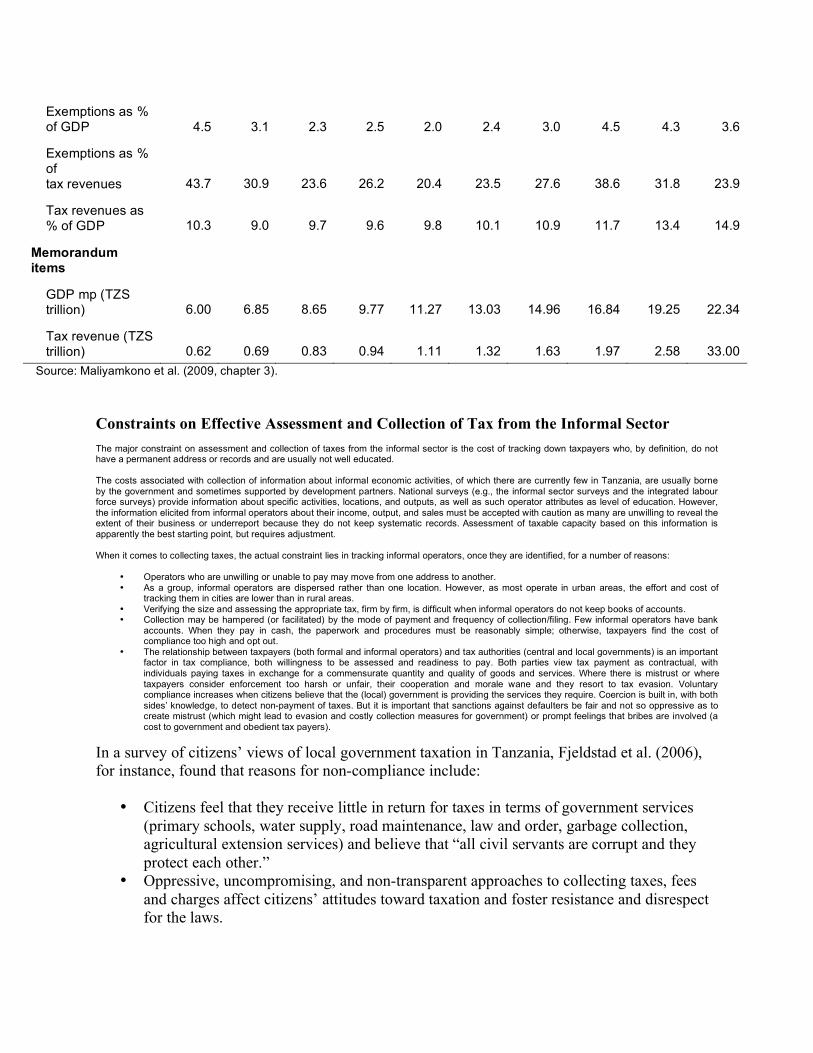
Constraints on Effective Assessment and Collection of Tax from the Informal Sector The major constraint on assessment and collection of taxes from the informal sector is the cost of tracking down taxpayers who, by definition, do not have a permanent address or records and are usually not well educated. The costs associated with collection of information about informal economic activities, of which there are currently few in Tanzania, are usually borne by the government and sometimes supported by development partners. National surveys (e.g., the informal sector surveys and the integrated labour force surveys) provide information about specific activities, locations, and outputs, as well as such operator attributes as level of education. However, the information elicited from informal operators about their income, output, and sales must be accepted with caution as many are unwilling to reveal the extent of their business or underreport because they do not keep systematic records. Assessment of taxable capacity based on this information is apparently the best starting point, but requires adjustment. When it comes to collecting taxes, the actual constraint lies in tracking informal operators, once they are identified, for a number of reasons:
• Operators who are unwilling or unable to pay may move from one address to another. • As a group, informal operators are dispersed rather than one location. However, as most operate in urban areas, the effort and cost of
tracking them in cities are lower than in rural areas. • Verifying the size and assessing the appropriate tax, firm by firm, is difficult when informal operators do not keep books of accounts. • Collection may be hampered (or facilitated) by the mode of payment and frequency of collection/filing. Few informal operators have bank
accounts. When they pay in cash, the paperwork and procedures must be reasonably simple; otherwise, taxpayers find the cost of compliance too high and opt out.
• The relationship between taxpayers (both formal and informal operators) and tax authorities (central and local governments) is an important factor in tax compliance, both willingness to be assessed and readiness to pay. Both parties view tax payment as contractual, with individuals paying taxes in exchange for a commensurate quantity and quality of goods and services. Where there is mistrust or where taxpayers consider enforcement too harsh or unfair, their cooperation and morale wane and they resort to tax evasion. Voluntary compliance increases when citizens believe that the (local) government is providing the services they require. Coercion is built in, with both sides’ knowledge, to detect non-payment of taxes. But it is important that sanctions against defaulters be fair and not so oppressive as to create mistrust (which might lead to evasion and costly collection measures for government) or prompt feelings that bribes are involved (a cost to government and obedient tax payers).
In a survey of citizens’ views of local government taxation in Tanzania, Fjeldstad et al. (2006),
for instance, found that reasons for non-compliance include:
• Citizens feel that they receive little in return for taxes in terms of government services
(primary schools, water supply, road maintenance, law and order, garbage collection,
agricultural extension services) and believe that “all civil servants are corrupt and they
protect each other.”
• Oppressive, uncompromising, and non-transparent approaches to collecting taxes, fees
and charges affect citizens’ attitudes toward taxation and foster resistance and disrespect
for the laws.
• Citizens’ lack of access to information about taxes and how revenues are spent inhibits
accountability, transparency, and participatory governance. Few respondents had seen
any information about local government finances. This discouraged taxpayer interest.
These three reasons apply to all taxpayers, but especially to those in small and medium-sized enterprises (SMEs) and informal-sector operators, who are usually targeted by authorities as the most likely offenders. Informal operators find themselves in constant fear and, hence, are ready to exploit any loophole to evade or avoid taxes. It is often easier for an informal sector firm to give up attempts to grow into a formal SME and even for an SME to slide back into the shadows of the informal economy. When confronted with suspicion and distrust, informal-sector operators seek to exploit tax loopholes or stay out of the mainstream tax system altogether. Such situations arise because of differential tax treatment across activities and groups of taxpayers or over time. Loopholes, as discussed by Mogoya (2009), are important for the development of nascent firms in the informal sector, firms that aim to grow. Authorities, thus, have to keep an eye on incentives provided for business start up (e.g., treatment of incorporated and unincorporated business with the former paying a further 10 per cent tax on profits, while the unincorporated business does not have to pay). In addition, formal interventions would be welfare-blind or anti-welfare if authorities focused on tax revenues and did not consider the working conditions of employees in the informal sector. Workers in the informal sector are underpaid not because they are less productive or less educated or trained than their counterparts in the formal sector, but often because the operator wants to avoid taxes or costs related to hiring labour. The government incurs the cost of enforcing regulations that protect labour, such as minimum-wage legislation and employer contributions to workers’ social security. At the macro-level, authorities also need to weigh the cost of “formalization incentive packages” in terms of what it takes to design and deliver business support programs to informal businesses (if these are not provided by volunteer organizations) and determine whether the targeted informal operators use these services.
Other Constraints
Inequality: The low rate of saving in Tanzania might also be related to the very uneven
distribution of wealth, which may result in wasteful consumption by the elite, instead of high
savings rates (the latter being what conventional wisdom assumes).
An extension of this argument is be that the rich in Tanzania are causing substantial capital
flight. Some analysts have argued, for instance, that far from being heavily indebted, many sub-
Saharan African countries are net creditors to the rest of the world (Boyce and Ndikumana
2000). Although the governments of these countries might be net debtors, the countries
themselves are net creditors because well-to-do Africans spirit much of their wealth out of the
continent. Boyce and Ndikumana estimate, for example, that cumulative capital flight totaled
about USD 285 billion (including imputed interest earnings) for 25 sub-Saharan African
countries between 1970 and 1996. This was about 1.6 times their total external debt. Capital
flight is undoubtedly a significant factor in explaining the relatively low domestic savings rates
in Africa.
Global Financial and Economic Crisis: The impact of the global financial and economic crisis
can be examined from two perspectives: its impact on the financial sector in Tanzania and its
impact on the performance of the economy (Ndulu 2009).
Impact on the Financial Sector: Tanzania’s financial markets have not been significantly
affected by the crisis for four main reasons: their level of integration with international capital
and financial markets is low; the foreign assets component of the commercial bank system is
only 11 per cent of total commercial bank assets; its commercial banks are licensed, regulated,
and supervised under law and do not operate as branches of parent banks abroad; and the system
had little exposure to the crisis because it is involved in a limited amount of foreign borrowing
and holds no securities of the international banks that were affected by the crisis.
Thus Tanzania’s financial sector remains safe and sound. This is supported by various indicators
Ndulu 2009):
• adequate capital — 31 of the 34 banks meet the minimum core capital requirements,
17 per cent capital compared with the required 10 per cent
• adequate liquidity to meet payments — average liquidity is 42 per cent compared with
the required 20 per cent
• appropriate balance between loans and deposits — 68 per cent, which is below the upper
limit of 80 per cent)
• interbank payments and settlements continue to be liquid and efficient
• the interbank cash market continues to be liquid and stable
• lending to the private sector increased by 47 per cent during the year ending in
December 2008
• the ratio of non-performing loans to total loans (6.3 per cent) was far below the
acceptable limit of 10 per cent
• return on capital averaged TZS 23.5 for TZS 100 invested
However, the interbank foreign exchange market was affected by the crisis. After consistently
appreciating over a year beginning in November 2007, the shilling depreciated by about 15 per
cent over the following three months. This depreciation is attributable to the turmoil in the global
financial markets, which caused the business community to believe that the supply of foreign
exchange would dry up, thus triggering a buying frenzy, and caused speculators to drive the
market with their profit taking.
Foreign exchange earnings are set to decline. Although export earnings increased by 22 per cent,
in 2008, some major foreign exchange earning sectors, including agriculture and tourism, are
under pressure as demand declines with the global economic slowdown. Depreciation of the
shilling has, in part, helped to offset the impact of the decline in world commodity prices; made
tourism cheaper; and increased the value of the shilling in terms of donor aid, thus enhancing the
government’s revenue position.
Impact on the Economy: As the global economy sinks into depression, prices of key exports are
bound to fall further as consumer demand in advanced countries continues to decline. Revenue
from the tourist sector is also bound to decline somewhat as fewer people take holidays.
Prospecting for minerals will decline with the reduction in FDI as investors fail to source new
funding from the capital markets.
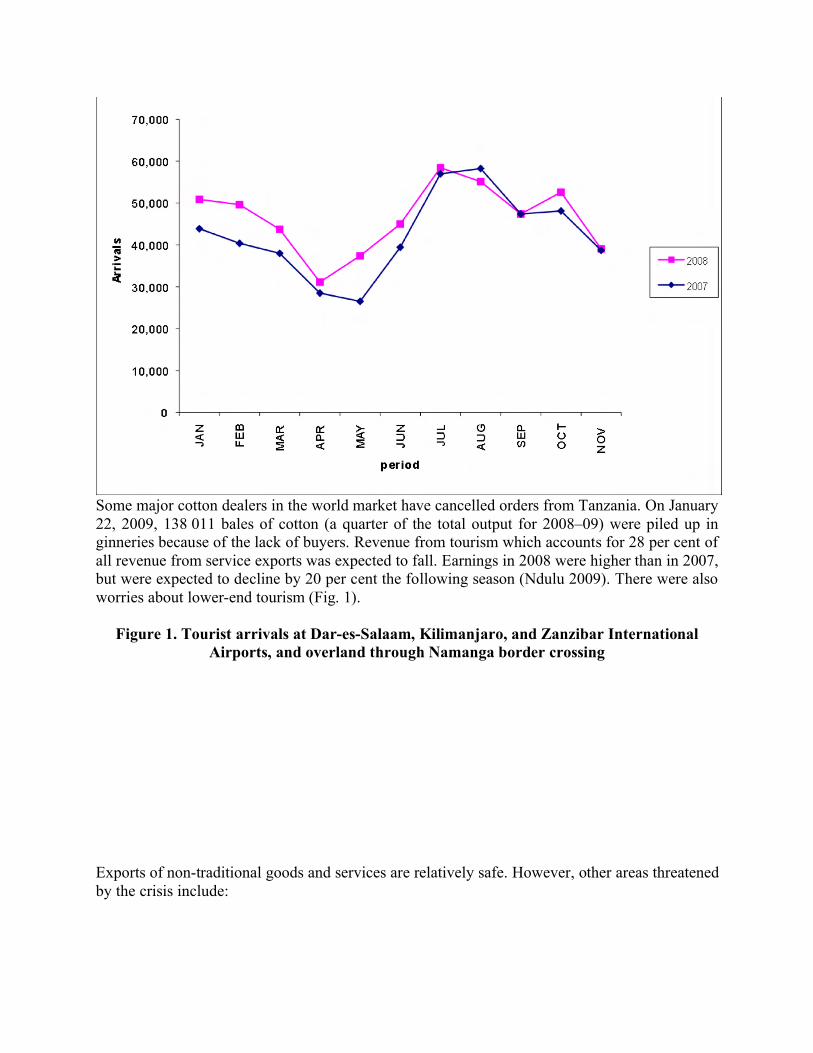
Some major cotton dealers in the world market have cancelled orders from Tanzania. On January
22, 2009, 138 011 bales of cotton (a quarter of the total output for 2008–09) were piled up in
ginneries because of the lack of buyers. Revenue from tourism which accounts for 28 per cent of
all revenue from service exports was expected to fall. Earnings in 2008 were higher than in 2007,
but were expected to decline by 20 per cent the following season (Ndulu 2009). There were also
worries about lower-end tourism (Fig. 1).
Figure 1. Tourist arrivals at Dar-es-Salaam, Kilimanjaro, and Zanzibar International
Airports, and overland through Namanga border crossing
Exports of non-traditional goods and services are relatively safe. However, other areas threatened
by the crisis include:
• remittances from the diaspora, which may be affected as some Tanzanians working
abroad may lose employment. However, remittances account for only 3 per cent of
foreign exchange earnings.
• FDI — a roll back in investment in mineral exploration has been seen. Such financing has
become difficult to raise from banks, which have been severely affected by the crisis
• ODA flows have been under pressure, despite commitments, as donor countries spend
colossal amounts of money to save their economies. But there is some hope as developed
countries have indicated a willingness to support MDGs and countries with huge
surpluses, such as China, have opened their doors to lending to developing countries.
Opportunities for Enhancing Savings Mobilization
Private Savings
In Tanzania, as in the rest of Africa, many economic activities are carried out in the informal
sector. Although many households have notable savings, they are held in non-financial forms
and are not being significantly channeled into productive investments (Dovi 2008, p. 4). Like
most Africans, many Tanzanians keep most of their savings in the form of livestock, stockpiles
of goods for trading, grain, jewelry, or construction material. Data are limited, but some experts
estimate that about 80 per cent of all household assets in rural Africa are in non-financial forms.
To tap into such assets, it is necessary to “introduce new financial products or instruments that
respond to the saving needs of households,” says Mr. Gayi of UNCTAD Savings that “permit
easy access and allow for “small transactions at frequent intervals” would encourage households
to shift to the formal system, thereby making such assets available for productive investments,
he says.
The role of financial intermediation is to provide the crucial link between savings and
investment. Despite households’ demand for adequate savings instruments and firms’ need for
credit, the financial sector in Tanzania performs poorly as an intermediary. The formal sector
suffers from poor risk-management capacity. Its activities are regulated by government and a
small number of formal sector reforms. Most commercial banks in Tanzania have excess
liquidity. Unfortunately, their resources are dominated by short-term deposits that cannot be
invested in long-term projects (ECA 2009, p. 10). How can these resources be used for long-term
investments? There are opportunities for enhancing savings mobilization by improving financial
intermediation.
The informal sector is able to mobilize considerable resources from households and small
business. However, its institutions do not make these resources available for further investment.
To promote MFIs in the semi-formal sector and enhance them by providing new information
technologies that lower the cost of providing services to rural and poor areas would create a good
opportunity for enhancing savings mobilization.
High risk and generally poor business environment are key determinants of low investments in
Tanzania. Poor infrastructure discourages investment as it increases production costs. Countries
in eastern Africa are ranked low in the World Bank’s report, Doing business 2009. The main
barriers to private investment include labour market constraints, poor investment protection, high
taxes and a cumbersome tax system, and lack of long-term credit for investment. These barriers
explain why the FDI is still low in many countries of the region.
Public Savings
Informal Sector: Seven key characteristics of informal sector activity include:
• low entry costs and general ease of entry
• unregulated and competitive markets
• reliance on indigenous resources
• family ownership of enterprises and small-scale operation
• labour intensive and simple technology
• skills acquired outside the formal school system
Informal activities include vending, hawking, petty trading, small and micro-scale enterprises,
food manufacturing, carpentry, hairdressing, shoe repair, and construction, but also selling
agricultural crops outside the formal market systems and even creating informal networks, for
example, exchanging bureaucratic favours and various forms of corruption.
The informal sector has often been viewed as a marginal and backward part of the national
economy. However, considering the motives for entering the sector, it becomes evident that it is
a lucrative area that is able to supply a sufficient income. Furthermore, the informal economy is
actually a significant component of the national economy.
The size of the informal sector depends on the size of the formal sector. If the formal sector
cannot supply jobs to absorb surplus labour and if real wages are too low, people will seek
employment within the informal sector.
Maliyamkono and Bagachwa (1990) discovered that the informal economy contributes more
than half of the official GDP; figures range from 25 per cent of real official GDP in 1969 to 51
per cent in 1985. Osoro (2009) estimated that the underground economy made up 31 per cent of
GDP in 1990 and 48 per cent in 2006. It is clear that the informal sector is of great importance to
the national economy.
The current financial crisis has created financial difficulties for many developing countries,
because of the lack of liquidity on the international market, and putting into question the
robustness of their development. In this regard, the informal sector seems to be a potential source
for funding and enlarging the tax base. Collecting taxes from the informal sector is undoubtedly
a difficult task, but the potential gains justify thinking about incentives that will improve
commitment to pay tax. Ultimately, long-term policies to bring the informal sector into the
formal sector are inevitable and must be pursued. As a short-term measure, a more flexible and
adaptive tax system, integration of the informal sector into the development process, and a better
supply of public goods could encourage those in the informal sector to help fund productive
public services (Drine 2009).
A possible way to tax the sector is “presumptive assessment,” which may encourage better
accounting practices as assessment is based on “presumptive characteristics,” which may be
contested by the taxpayer. In that case, the assessed would have to submit accounts, which would
be a desirable outcome (Drine 2009).
Property taxes: There is also great potential for property to generate tax revenues. Properties are
not effectively taxed in Tanzania for various reasons. First, large property owners are the rich,
the bureaucrats, and policymakers, who are generally not in favour of a policy that would affect
them. Second, effective taxation of properties requires resources with which to evaluate the
properties.
Strategies to Enhance Domestic Resource Mobilization
Various actors — including donors, government, and NGOs — can play an important role in
enhancing DRM. In this section, we briefly outline what they can do.
Donors
In general, most donors do not attach much importance to enhancing DRM per se. They often
assume that the aid relationship facilitates greater economic growth from which greater domestic
savings, government tax generation, and higher levels of domestically-driven investment will
automatically follow. Thus, donor support for ostensibly growth-oriented macroeconomic
policies can be seen as implicit facilitation of greater DRM. In addition, donors may indirectly
increase DRM through projects aimed at reforming tax policy or tax administration or improving
governance through reform of the medium-term expenditure framework and the budgetary
process.
However, donors may undermine DRM by supporting other policies, such as trade liberalization,
for example, which has been shown to undermine tariff revenues in the poorest countries, a key
source for government revenues in these countries. Likewise, favourable tax treatment and other
incentives to attract FDI entail an opportunity cost in the form of foregone revenues. Other
examples include the shift of aid toward budget support, which may have the unintended
consequence of reducing the incentive for governments to levy and/or collect taxes from citizens.
The Millennium Development Campaign provides a good example of how donor strategies may
unwittingly undermine DRM. Ultimately, unless national authorities are able to shoulder the
continuing initial investment and recurrent costs of these initiatives, they may prove
unsustainable if aid flows are reduced. For donors to play a more active and constructive role in
facilitating DRM, they must first recognize it as an objective in its own right. Such an objective
is entirely consistent with other objectives that are fundamental to donors’ aid programs.
Finally, donors should conceptualize explicit support for DRM as part of an “exit strategy.” In
most cases, aid was never meant to represent an transfer of resources from rich to poor countries.
Although donations should not be time dated, they should be more explicitly linked to DRM in
recipient countries. Given growing “aid fatigue” and skepticism about the effectiveness of aid
programs, a recognition of the need to adopt exit strategies linked to greater autonomy and self-
help among recipient countries would likely be welcomed by taxpayers in donor countries. In a
nutshell, donor support is crucial in facilitating and enhancing DRM initiatives.
Although donors could support MFIs, they could also encourage efforts to build the resource
base through domestic saving mobilization. Emphasizing full intermediation does not necessarily
preclude donor involvement in assisting the MFIs with capacity building (in both physical and
human resources), which will remain essential. The experience of countries in sub-Saharan
Africa suggests that NGOs and donors can play an important role in the dissemination of
international and regional best practices and remain important in building borrowers’
entrepreneurial skills and capacity to graduate to the formal banking sector.
NGOs
In some cases, NGOs have engaged in building local capacity by creating institutions specifically
dedicated to training. NGOs and donors have tended to focus on social programs and services for
which they have particular expertise, including programs aimed at reducing poverty. Sometimes
NGOs have also focused on providing welfare and socially oriented microfinancing, when the
push toward financial sustainability was seen to induce a reorientation of MFI focus from the
very poor to the lower-middle and middle classes. Although NGOs may continue to play an
important role in providing social services to the very poor and to those in more remote areas, it
is debatable whether this is more efficient reducing poverty than direct subsidization of social
services (such as primary education and basic health care).
Government
In several African countries — for example, Ghana, Guinea, Tanzania and Uganda —
governments have relied on state-owned banks to extend rural credit and microfinance services.
In most cases, these banks have incurred large losses and have had to be restructured,
recapitalized, privatized, or liquidated. This experience of failed state-owned banks has led
African governments to focus on financially viable approaches to providing microfinance and on
developing regulatory and supervisory frameworks that are well adapted to supporting such an
effort. In Tanzania, NGOs and donors are heavily involved in staff capacity building and
technology transfer at all levels of the microfinance system, from regulation to rural MFIs. To
mention only one of many examples, the United Kingdom’s Department of International
Development provides funds for capacity building to the Microfinance Capacity Building
Program for Africa and to Micro-save Africa — a joint initiative with the United Nations
Development Programme to provide technical assistance to organizations to strengthen the
development of saving services.
Privatization can be an effective way to improve efficiency. Private firms have a stronger
incentive to build and run infrastructure industries in cost-effective ways and to be more
responsive to end-user needs, as long as privatization goes hand in hand with the development of
market institutions and contracting mechanisms that exert competitive pressure on the private
firms. The extent to which such institutions can be put in place will depend on the types of
services and infrastructure to be provided, as the ability to recover costs varies. Privatization also
encourages and facilitates the imposition of cost-covering tariffs or user fees, thus addressing the
problems of under-pricing that have afflicted many publicly provided infrastructure services.
Greater efficiency and cost recovery allow firms to make investments and provide services that
might not otherwise have been possible. Private firms simultaneously improve efficiency and the
government’s fiscal condition by making available the same quality and quantity of service with
smaller budgetary subsidies. But privatization is not a panacea. Policymakers should consider
both efficiency and equity implications when deciding what and how to privatize.
Strategies to Enhance Public Savings
A big part of DRM effort should concentrate on making tax systems more efficient — starting
with better administration of consumption taxes and eliminating exemptions and loopholes on
income taxes. For example, tax exemptions as a percentage of total tax revenue in Tanzania
averaged over 32 per cent during FY 2006–07, close to 5 per cent of GDP. Annual tax
exemptions as a percentage of total taxes were 27.6 per cent, 38.6 per cent, and 31.8 per cent in
FY 2004–05, 2005–06, and 2006–07, respectively (Mogoya 2009). Direct taxes on income and
wealth tend to be more progressive than indirect taxes, such as the VAT, but tax reforms often
emphasize indirect taxes. This weakens “vertical equity,” namely obliging those with greater
ability to pay taxes to contribute a larger share of their income or wealth. Even with a
progressive tax system, the rich often benefit from the myriad of loopholes, exemptions, and
deductions. They also benefit from poor enforcement of tax laws.
The tax system often allows “powerful vested interests” to escape progressive taxes because
conventional wisdom regards such taxes as an efficient means to redistribute income. This has
led to widespread efforts to lower the top marginal tax rates on personal and corporate incomes.
As a result, for example, taxes on corporate incomes have seen a marked decline in Tanzania,
although, in the past, they have been a source of more revenue than personal income taxes.
Collecting Taxes from the Informal Sector Strategies to collect taxes from the informal sector have necessitated some degree of recognition of informal-sector activities. Informal sector operators may voluntarily begin to organize, usually for the purpose of obtaining some public service or assistance. Taxation then becomes possible through their association(s), as authorities can reach many enterprises or individuals at a reasonable cost. After all, not all informal operators are anti-tax: for many, the reason for remaining in the informal sector is not to avoid taxes but to avoid excessively the complex tax system and unnecessarily harsh enforcement. Everest-Phillips (2008) supports some level of formalization to create “quasi-voluntary compliance” of micro and small enterprises, making them contribute to state-building objectives by broadening the tax base and increasing the scope of institutionalizing state engagement with the sector in the political process. Perceived fairness is relative, but important in inducing formalization and persuading informal operators to see taxation as state-building (Everest-Phillips 2008). Tax administrator attitudes, incentives, and discretion can result in unequal treatment of taxpayer groups. Unequal access to exceptions and the prevalence of bribes make the tax system unpredictable. Stern and Loeprick (2007) propose improvements in the quality of tax administration, introducing simplified options to improve compliance by SMEs, and a simple and fair tax regime (e.g., a single presumptive tax based on turnover or on specific indicators, such as floor space, number of employees, or electricity consumption), with safeguards against abuse. Direct taxation of the informal sector is difficult; the strategy used to tax it should be phased simplification of the taxation system for micro-enterprises and SMEs, so that the informal operators see the benefits of formalizing and paying taxes. Thus the “presumptive assessment” becomes a transitory method, mainly because its imposition may also encourage the adoption of better accounting practices (Drine 2009). A simple taxpayer analysis will reveal the potential yield for an effort directed at the informal sector. Table 13 shows that most taxpayers are small formal enterprises, but what they pay is a maximum of 10 per cent of the total revenue. On the other hand, only a few large taxpayers account for 70 per cent of the total tax revenue. The large tax payer department, which was established in October 2001 with 100 taxpayers, grew to 370 taxpayers in July 2006, contributing about 70 per cent of domestic revenue and 38 per cent of overall TRA collections. The aim has been to ensure that the
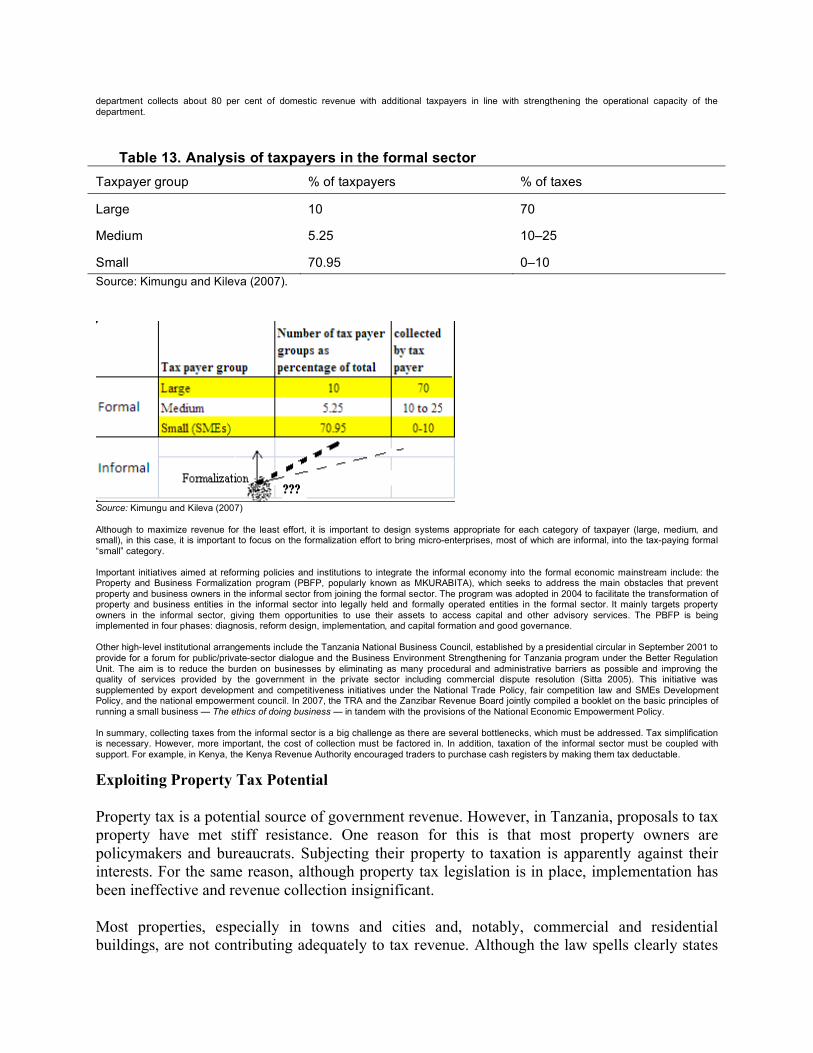
department collects about 80 per cent of domestic revenue with additional taxpayers in line with strengthening the operational capacity of the department.
Table 13. Analysis of taxpayers in the formal sector
Taxpayer group % of taxpayers % of taxes
Large 10 70
Medium 5.25 10–25
Small 70.95 0–10
Source: Kimungu and Kileva (2007).
Source: Kimungu and Kileva (2007) Although to maximize revenue for the least effort, it is important to design systems appropriate for each category of taxpayer (large, medium, and small), in this case, it is important to focus on the formalization effort to bring micro-enterprises, most of which are informal, into the tax-paying formal “small” category. Important initiatives aimed at reforming policies and institutions to integrate the informal economy into the formal economic mainstream include: the Property and Business Formalization program (PBFP, popularly known as MKURABITA), which seeks to address the main obstacles that prevent property and business owners in the informal sector from joining the formal sector. The program was adopted in 2004 to facilitate the transformation of property and business entities in the informal sector into legally held and formally operated entities in the formal sector. It mainly targets property owners in the informal sector, giving them opportunities to use their assets to access capital and other advisory services. The PBFP is being implemented in four phases: diagnosis, reform design, implementation, and capital formation and good governance. Other high-level institutional arrangements include the Tanzania National Business Council, established by a presidential circular in September 2001 to provide for a forum for public/private-sector dialogue and the Business Environment Strengthening for Tanzania program under the Better Regulation Unit. The aim is to reduce the burden on businesses by eliminating as many procedural and administrative barriers as possible and improving the quality of services provided by the government in the private sector including commercial dispute resolution (Sitta 2005). This initiative was supplemented by export development and competitiveness initiatives under the National Trade Policy, fair competition law and SMEs Development Policy, and the national empowerment council. In 2007, the TRA and the Zanzibar Revenue Board jointly compiled a booklet on the basic principles of running a small business — The ethics of doing business — in tandem with the provisions of the National Economic Empowerment Policy. In summary, collecting taxes from the informal sector is a big challenge as there are several bottlenecks, which must be addressed. Tax simplification is necessary. However, more important, the cost of collection must be factored in. In addition, taxation of the informal sector must be coupled with support. For example, in Kenya, the Kenya Revenue Authority encouraged traders to purchase cash registers by making them tax deductable.
Exploiting Property Tax Potential
Property tax is a potential source of government revenue. However, in Tanzania, proposals to tax
property have met stiff resistance. One reason for this is that most property owners are
policymakers and bureaucrats. Subjecting their property to taxation is apparently against their
interests. For the same reason, although property tax legislation is in place, implementation has
been ineffective and revenue collection insignificant.
Most properties, especially in towns and cities and, notably, commercial and residential
buildings, are not contributing adequately to tax revenue. Although the law spells clearly states
that property tax must be collected and that the TRA is mandated to collect, collection effort has
been too low. This may be due to difficulties in locating taxpayers, which increases collection
costs. But taxpayers can be easily motivated to pay property tax by making sure that in return for
payment, they receive noticeable social services, reflecting the use of the collected taxes. For
instance, in residential areas of urban centres, compliance can be strictly enforced when good
roads and sanitary services are provided. This sort of visible return can become an effective
incentive for the taxpayers to comply.
If a house (i.e., property), whether it is within a surveyed plot or not, has access to facilities
or services provided by the government, including overall public good, taxes should be paid on
this property. The tax rate depends on location, benefit principle, and so forth, and these factors
must be considered when assessing the property tax. Effective payment of property tax will give
the government a significant amount of revenue. One means of ensuring compliance will be to
set affordable rates but with effective enforcement to benefit from the economies of scale
in collection.
Meeting the Financing Gap
The global financial and economic crisis discussed above is bound to create a financing gap. To
mitigate this calls for DRM. Thus, strategies include increasing revenue collection effort, and
mobilizing domestic savings including IPOs, syndicating local loans, and issuing sovereign
bonds in local currency (Ndulu 2009).
Interventions to deal with liquidity pressures where these are temporary should be carried out
through financial intermediaries to enhance access and ameliorate the cost of credit by blending
finance and guarantee schemes.
Strategies to enhance private savings
Integrally connected with lack of credit in Tanzania is the large difference between deposit and
lending rates of interest. Interest rate spread averages 13.4 percentage points, making loans
relatively expensive, particularly for long-term private investment. Such large spreads imply that
commercial banks can make a hefty profit on loans, but the volume of loan is too low for this to
be significant. However, in Tanzania, as the amounts the banks lend are far less than their
available financial resources, they do not make much profit from lending. Instead they profit by
imposing multiple charges on their customers.
To counteract this trend, the BOT should lower its prime lending rate about two percentage
points. This reduction should boost growth and employment. Alongside this measure, the
government should moderately increase the fiscal deficit as a stimulus to aggregate demand.
In addition to this strategy, credit at concessionary terms should be provided to sectors of the
economy with above-average employment multipliers. There are three options of doing this:
• expanding the lending activity of the country’s commercial banks
• obliging banks to hold 20 per cent of their assets in loans to employment-intensive
sectors
• expanding the country’s guarantee scheme, which should entail no more than 1–2 per
cent of the government’s fiscal budget.
A related strategy is to expand the banking network by addressing the constraints that currently
discourage commercial banking activities in rural areas. Implementation of this strategy will
require cooperation between the government and commercial banks. The government should also
look into the possibility of supporting the development of the capital market, which is currently
small, not well known among the public, and inactive. Massive education on stock market
activities and the benefits of participation is required. In addition, the government should
undertake reforms that reflect improvement in investment and in particular improvement in
business climate. This can be done by allowing existing businesses to expand and new one ones
to be established. Finally, the government should speed up liberalization of the capital account.
Although such expansionary measures are likely to raise Tanzania’s inflation rate, the increase is
not likely to be more than moderate. If inflation threatens to increase beyond a moderate level,
the government should institute an income policy and weaken the monopolistic pricing power
that exists in some sectors of the economy. As a means to ensure stability of the exchange rate,
capital management techniques are recommended. Such measures will guard against volatility in
capital flows resulting from any precipitous change in the perceptions of portfolio investors.
Conclusions
The importance of DRM cannot be overemphasized. The government has indicated its intention
to reduce dependence on foreign sources of finance. Tanzanian macroeconomic indicators are, in
general, quite encouraging, and public finances have improved over the last decade. However,
domestic savings are still low.
The major constraints to DRM are: negative real deposit rates, high lending rates; the wide
spread between deposit and lending rates, the lack of long-term credit, the lack of formal
financial institutions in rural areas, low investment, the narrow tax base, high tax rates, the
multiplicity of taxes, generous exemptions, the global economic and financial crisis, and
corruption.
Despite these constraints, there are opportunities for enhancing savings mobilization. First, the
existing excess liquidity in the banking system could be used to increase credit to the private
sector. Second, there is a wide scope for widening the tax base through proper and effective
taxation of the informal sector, agriculture, and property.
Various strategies can be mounted to enhance DRM. These include making the tax system more
efficient, a smooth transition from trade taxes to domestic consumption taxes, reducing
corruption in tax administration, and designing ways to enhance the stock market.
Recommendations
Public Savings
• The government should widen the tax base by designing better and more effective ways
of taxing the informal sector. One way to go about this is by imposing presumptive taxes
as a short-term measure. However, in the long run, the government should undertake
measures to attract informal-sector participant into the formal sector.
• The government should widen the tax base by strengthening taxation of property. Most
property owners, especially in towns and cities and notably those who own commercial
or residential building, are not contributing adequately to tax revenue. Although the law
clearly states that property taxes must be collected and the TRA is mandated to collect
them, collection effort has been too low. Provision of services, such as roads and
sanitation, may provide an incentive to taxpayers.
Presumptive taxes can be used as a short-term solution to boost revenue from this source,
but the long-term solution should be for the government to set aside funds for property
assessment. Donors could assist in funding such assessment; for example, the African
Development Bank is currently providing funds to municipalities to finance development.
• The government should widen the tax base by reducing the numerous exemptions. This
can be accomplished by removing all discretionary exemptions. Only a few crucial
exemptions should be retained and they should be statutory to prevent abuse.
• The government should take measures to gradually reduce reliance on trade taxes and
strengthen direct taxation.
• The government should intensify its fight against corruption in the tax system to enhance
revenue collection. This can be accomplished by strengthening tax administration and
plugging tax evasion loopholes, reducing high tax rates, simplifying tax legislation, and
minimizing personal contact between the tax collector and taxpayer.
• The constitution should be amended to accommodate more provisions pertaining to
financial and tax matters. This would empower parliament and parliamentarians to
effectively contribute to DRM.
Private Savings
• There is a need to reduce the interest rate spread. This can be done by either reducing the
lending rate or increasing the deposit interest rate. The financial sector in Tanzania is
fully liberalized and, therefore, interest rates are market determined. However, as lending
rates are extremely high and the banks seem not to be interested in reducing them, there
is a need for the government to intervene.
• In view of existing financial constraints, there is a need to establish development banks,
particularly in rural areas. Setting up these banks will increase people’s access to credit.
• To stimulate stock market performance and increase its size, the government should
impose a threshold above which a company must list. It should also educate people about
stock market activities.
• The government should encourage banks to extend their services to rural areas.
Abbreviations
BOT Bank of Tanzania
CMSA Capital Markets and Securities Authority
CIS collective investment scheme
CRDB Cooperative and Rural Development Bank
DSE Dar-es-Salaam Stock Exchange
DRM domestic resource mobilization
EAC East Africa Community
FDI foreign direct investment
FY fiscal year
GDP gross domestic product
MFI microfinancial institution
NMB National Microfinance Bank
PAYE pay as you earn
PBFP Property and Business Formalization program
SACA savings and credit association
SACCO savings and credit cooperative
SADC Southern Africa Development Cooperation
TRA Tanzania Revenue Authority
VAT value-added tax
References
BOT (Bank of Tanzania). Directorate of banking supervision annual report 2008. Dar es
Salaam: Bank of Tanzania; 2008.
Boyce, James K., and Léonce Ndikumana. Is Africa a net creditor? New estimates of capital
flight from severely indebted sub-Saharan African countries, 1970–1996. Amherst: University of
Massachusetts; 2000. Working papers 2000-01. Available:
www.umass.edu/economics/publications/econ2000_01.pdf (accessed Aug. 26, 2010).
Culpeper, Roy. Enhancing domestic resource mobilization. Ottawa: The North-South Institute;
2008. G-24 policy brief 25.
Dovi, Efam. Boosting domestic savings in Africa. Africa Renewal 2008, 22(3).
Drine, Imed. Informal sector and domestic resource mobilization. Presented at OECD
Development Centre and Development Finance Network Meeting on Domestic Resource
Mobilization for Development: Policy Solutions in Times of Crisis, Paris, Sept. 24, 2009.
ECA (Economic Commission for Africa). 2009.
Everest-Philips, 2008.
Fjeldstad Odd-Helge, Ivar Kolstad, and Knut Nygaard. Bribes, taxes and regulations: business
constraints for micro enterprises in Tanzania. Bergen, Norway: Chr Michelsen Institute; 2006.
Working paper 2006:2. Available: www.cmi.no/publications/file/?2124=bribes-taxes-and-
regulations (accessed Aug. 22, 2010).
Kimungu, H., and E.L Kileva. Challenges of administering small and medium taxpayers:
Tanzania experience. Presented at the International Tax Dialogue Conference on SME Taxation,
Oct. 17–19, 2007, Buenos Aires, Argentina. Available:
www.itdweb.org/smeconference/documents/7%20tanzania.ppt#285,9,Cont (accessed Aug 25,
2010).
Maliyamkono, T.L., and M.S.D. Bagachwa. The second economy in Tanzania. Dar-es-Salaam,
ESAURP; 1990.
Maliyamkono, T.L., H. Mason, A. Ndunguru, N.E. Osoro, A. Ryder (editors). Why pay tax? Dar-
es-Salaam: TEMA Publ.; 2009.
Mogoya, P. Enhancing tax collection. In Maliyamkono, T.L., H. Mason, A. Ndunguru, N.E.
Osoro, A. Ryder (editors). Why pay tax? Dar-es-Salaam: TEMA Publ.; 2009.
MKUKUTA II. National strategy for growth and reduction of poverty. Dar-es-Salaam: Ministry
of Finance and Economic Affairs; March 2010. Available:
www.tzonline.org/pdf/mkukutalldraft.pdf (accessed Aug. 11, 2010).
Ndulu, Benno. The global financial and economic crisis: challenges and responses. Dar-es-
Salaam: Bank of Tanzania; March 2009. Presentation to the East African Business Council.
Available:
eabc.info/files/Bank%20of%20Tanzania%20Presentation%20on%20Global%20Financial%20Cr
isis.ppt (accessed Aug. 22, 2010).
Ndunguru, A. Sources of revenue growth. In Maliyamkoni, T.L, H. Mason, A. Ndunguru, N.E.
Osoro, and A. Ryder (editors.) Why pay tax? Dar-es-Salaam: TEMA Publ.; 2009.
OECD (Organisation for Economic Co-operation and Development). African economic outlook,
2008. Paris: OECD Development Center and African Development Bank; 2008. Available:
www.oecd.org/dataoecd/12/25/40578365.pdf (accessed Aug. 11, 2010).
OECD (Organisation for Economic Co-operation and Development. African economic outlook,
2009. Paris; OECD Development Center and African Development Bank; 2009.
Osoro, N.E. Estimating tax capacity. In Maliyamkoni, T.L, H. Mason, A. Ndunguru, N.E. Osoro,
and A. Ryder (editors.) Why pay tax? Dar-es-Salaam: TEMA Publ.; 2009.
Pollin, Robert. Savings. Amherst: Political Economy Research Institute, University of
Massachusetts; 2002. Working paper 3.
Randhawa, Bikki., and Joselito Gallardo. Microfinance regulations in Tanzania: implications for
development and performance of the industry. Washington: World Bank; 2003. Africa region
working paper series no. 51. Available: www.worldbank.org/afr/wps/wp51.pdf (accessed 20
Aug. 2010).
Sitta 2005.
Stern and Loeprick 2007.
Tanzi, Vito, and Howell Zee (2001), Tax policy for developing countries. Washington DC:
International Monetery Fund; 2001. Available:
www.imf.org/external/pubs/ft/issues/issues27/index.htm (accessed Aug. 22, 2010).
Wehner 2005.
World Bank. Doing business 2009. Washington: World Bank; 2009.