Embed Size (px)
Citation preview
Donor-Acceptor Conjugated Polymers for
Application in Organic Electronic Devices
Dissertation zur Erlangung des
naturwissenschaftlichen Doktorgrades
der Julius-Maximilians-Universität Würzburg
vorgelegt von
Dörte Reitzenstein
aus Heidelberg
Würzburg 2010

Eingereicht am:
bei der Fakultät für Chemie und Pharmazie
1. Gutachter:
2. Gutachter:
der Dissertation
1. Prüfer:
2. Prüfer:
3. Prüfer:
des öffentlichen Promotionskolloquiums
Tag des öffentlichen Promotionskolloquiums:
Doktorurkunde ausgehändigt am:

Die vorliegende Arbeit wurde in der Zeit von Februar 2006 bis November 2010 am
Institut für Organische Chemie der Universität Würzburg angefertigt.
Mein besonderer Dank gilt
Herrn Prof. Dr. Christoph Lambert
für die Vergabe des vielseitigen Themas, die intensive Betreuung und Förderung und
das mit vielen Anregungen und Diskussionen verbundene Interesse an dieser Arbeit.

Contents
1 Introduction ....................................................................................................... 1
1.1 OFET Devices - Assembly, Working Principle and Organic Materials ........... 2
1.2 OLED Devices - Assembly, Working Principle and Organic Materials ......... 14
1.3 OPV Cells - Assembly, Working Principle and Organic Materials................ 18
2 Polycarbazoles ................................................................................................ 26
2.1 Introduction and Aim of the Project .............................................................. 26
2.2 Synthesis ..................................................................................................... 28
2.3 Absorption and Fluorescence Spectroscopy ............................................... 32
2.4 Cyclic Voltammetry ...................................................................................... 39
2.5 Single Layer OLED ...................................................................................... 45
2.6 Conclusions ................................................................................................. 46
3 Low Band Gap Donor-Acceptor Conjugated Polymer ................................. 48
3.1 Introduction and Aim of the Project .............................................................. 48
3.2 Synthesis ..................................................................................................... 51
3.3 Absorption Spectroscopy ............................................................................. 55
3.4 Cyclic Voltammetry ...................................................................................... 58
3.5 Spectroelectrochemistry .............................................................................. 61
3.6 Transient Absorption Spectroscopy ............................................................. 63
3.7 Field-Effect Transistors ................................................................................ 68
3.8 Solar Cells ................................................................................................... 71
3.9 Conclusions ................................................................................................. 74
4 Summary .......................................................................................................... 76
5 Experimental Section ...................................................................................... 78
5.1 Apparatus and Methods .............................................................................. 78
5.2 Syntheses .................................................................................................... 85
5.2.1 Materials .........................................................................................................85
5.2.2 Synthesis of Polycarbazoles ............................................................................86
5.2.3 Synthesis of the Low Band Gap Polymer ........................................................96
6 References ......................................................................................................109
7 Appendix .........................................................................................................119
7.1 Formeltafel..................................................................................................119

7.1.1 Polycarbazoles .............................................................................................. 119
7.1.2 Low Band Gap Polymer ................................................................................ 120
7.2 Zusammenfassung .....................................................................................121
7.3 Danksagung ...............................................................................................123

Abbreviations
AFM atomic force microscopy
BC/BG bottom contact/bottom gate
BC/TG bottom contact/top gate
BHJ bulk heterojunction
CIE Commission Internationale de l‟Éclairage
CT charge transfer
CV cyclic voltammogram
D-A donor-acceptor
DSC differential scanning calorimetry
eq./eqs. equation/equations
EQE external quantum efficiency
ET electron transfer
Fc/Fc+ ferrocene/ferrocenium
GPC gel permeation chromatography
HMDS hexamethyldisilazane
IR infrared
ITO indium tin oxide
IV-CT intervalence charge transfer
MALDI-TOF matrix assisted laser desorption/ionization time-of-flight
NIR near-infrared
OFET organic field-effect transistor
OLED organic light emitting diode
OPVs organic photovoltaic devices
OTS octadecyltrichlorosilane
[60]PCBM [6,6]-phenyl C61 butyric acid methylester
[70]PCBM [6,6]-phenyl C71 butyric acid methylester
PCE power conversion efficiency
PCTM perchlorotriphenylmethane
PDI polydispersity index
PE petrol ether
PEDOT:PSS polyethylenedioxythiophene:poly(styrene sulfonic acid)
P3HT poly(3-hexylthiophene)

PMMA polymethylmethacrylate
PPcB polypropylene-co-1-butene
PVA polyvinylalcohol
rpm revolutions per minute
r. t. room temperature
TBAP tetrabutylammonium perchlorate
TBAPF6 tetrabutylammonium hexafluorophosphate
TC/BG top contact/bottom gate

1
1 Introduction
Conjugated organic polymers exhibit a great variety of technologically relevant
properties as for example absorption and emission of light or electrical1-4 and
photoconductivity5, thus making them useful materials for the application in electronic
devices such as organic field-effect transistors (OFETs)6-9, organic light emitting
diodes (OLEDs)10-12 and organic photovoltaic devices (OPVs)13-16. Organic polymers
typically offer the advantage that they are light-weight and flexible materials which
can be processed from solution by spin coating or inkjet printing17-18 at room
temperature.19 This makes them promising for the production at low cost and for
large-area employments and opens up a new field of applications as for example in
packaging and advertising or in active matrix displays.20 Usually it is distinguished
between organic electronics based on small molecules and those based on
polymers. In general small molecules can be vacuum deposited which causes on the
one hand higher costs and rules large-area applications out but on the other hand
results in better device performance. In contrast solution processing of both small
molecules and polymers is cheaper on the expense of device performance. Thus it
depends on the particular application whether small molecules or polymers are
preferred.
In this work novel donor (D) - acceptor (A) conjugated polymers were to be
synthesized for use in OFETs, OLEDs and OPVs. Donor and acceptor moieties were
chosen in regard to their hole and electron transporting properties, respectively.
Moreover by selection of appropriate donor and acceptor entities the HOMO and
LUMO levels and thus the band gap (= energy difference between HOMO and
LUMO) can be controlled. The knowledge of HOMO and LUMO levels of an organic
material is important for optimized charge injection into or charge extraction out of the
organic layer. The band gap on the other hand determines the absorption edge which
affects among other parameters the amount of harvested light. Since charge
transport in organic materials occurs via charge hopping between neighbouring
orbitals conjugated polymers are preferred for these applications.
In order to enable a better understanding why some organic materials/devices
perform well and others don´t a deeper insight into assembly, working principle and
2
applied organic materials for OFETs (chapter 1.1), OLEDs (chapter 1.2) and OPVs
(chapter 1.3) will be given in the following three sections.
1.1 OFET Devices - Assembly, Working Principle and Organic Materials
Field-effect transistors are the basic elements of integrated circuits and, thus,
technologically important as evident by manifold applications: OFET driven bendable
active matrix displays have already been realized by various research groups.21-23
Several industrial companies have recently joined forces to develop optimized RFID
tags based on printable organic electronics for large-scale production.24 Another such
project (“Polytos”) aims at the development of sensor printed boards.25 An even more
ambitious goal is the realization of so-called smart objects which combine several
organic electronic components like sensors, batteries, displays or switches.26 From a
scientific point of view the investigation of such devices can contribute to a better
understanding of charge transport in organic semiconductors and the factors that
influence it.
Assembly and Working Principle
OFETs consist of a gate electrode, an insulating gate dielectric, source and drain
contacts which enclose the channel of length L and width W and a semiconducting
organic layer (Figure 1). The metal (gate electrode)-insulator-semiconductor (MIS)
configuration is basically a capacitor. When a voltage Vg is applied to the gate
electrode an electric field is generated normal to the semiconductor layer and charge
carriers accumulate at the semiconductor/insulator interface within the channel.
When at the same time a voltage Vd is applied to the drain electrode (the source
electrode is grounded, Vs = 0) the charge carriers can be transported across the
channel. The conductivity of the semiconductor is proportional to the charge carrier
mobility µ and the free charge carrier concentration n, = enµ (e = unit electronic
charge), with n being proportional to the capacitance Ci of the insulator and the
magnitude of the applied electric field.20 The conductivity of the semiconductor can
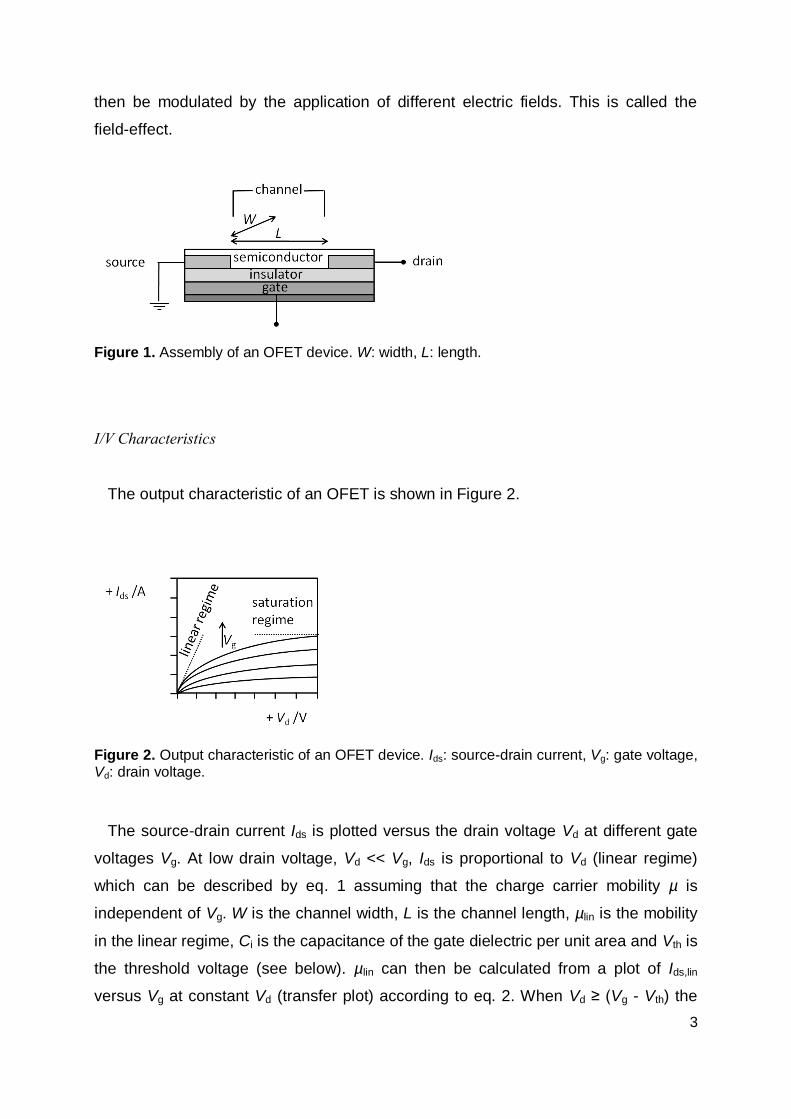
3
then be modulated by the application of different electric fields. This is called the
field-effect.
Figure 1. Assembly of an OFET device. W: width, L: length.
I/V Characteristics
The output characteristic of an OFET is shown in Figure 2.
Figure 2. Output characteristic of an OFET device. Ids: source-drain current, Vg: gate voltage, Vd: drain voltage.
The source-drain current Ids is plotted versus the drain voltage Vd at different gate
voltages Vg. At low drain voltage, Vd << Vg, Ids is proportional to Vd (linear regime)
which can be described by eq. 1 assuming that the charge carrier mobility µ is
independent of Vg. W is the channel width, L is the channel length, µlin is the mobility
in the linear regime, Ci is the capacitance of the gate dielectric per unit area and Vth is
the threshold voltage (see below). µlin can then be calculated from a plot of Ids,lin
versus Vg at constant Vd (transfer plot) according to eq. 2. When Vd ≥ (Vg - Vth) the

4
source-drain current is saturated, that is Ids is not further increased by increasing Vd.
The saturation regime is described by eq. 3 derived from eq. 1 by substitution of Vd
by (Vg - Vth). Assuming µsat to be independent of Vg, µsat is calculated from the plot of
the square root of Ids,sat versus Vg according to eq. 4. Extrapolation of the linear slope
to zero yields Vth. The gate voltage dependent saturation mobility can be calculated
according to eq. 5.
Vd << Vg (1)
(2)
Vd ≥ (Vg-Vth) (3)
(4)
(5)
The performance of an OFET device is characterized by Vth, the ratio Ion/Ioff and by
µ.8 Vth determines the value of the gate voltage Vg above which a source-drain
current Ids can flow. This is because a part of the induced charges will be trapped and
it is only when the trap states are filled that further induced charges will be mobile. So
the effective gate voltage is (Vg - Vth). Thus the power consumption is increased with
increasing Vth. However, Vth can be diminished by enhancement of the gate
capacitance. The ratio Ion/Ioff should be high (106-108)27 in order to obtain a clear
distinction between the states “0” and “1” in electronic circuits.19 Ion is the source-
drain current in the saturation regime at a normal (maximum) gate voltage which
reflects the magnitude of the charge carrier mobility. It is affected by charge injection
barriers and by Ci and Vth.8 Ioff is the leakage current at Vg = 0 which is caused by
alternative conduction pathways or by the bulk conductivity of the semiconductor due
to unintentional doping28-30. Finally, µ is the most important parameter in an OFET
device and should be as high as possible in order to decrease power consumption.
Transport behaviour is influenced by the device geometry, charge injection barriers
and specifically by the gate dielectric and the morphology of the semiconductor layer
as outlined below.

5
Device Configuration
In Figure 3 three different device structures in reference to the position of the gate
and source/drain electrodes relative to the semiconductor layer are depicted.
Figure 3. OFET device configurations. Left: bottom contact/top gate (BC/TG); middle: bottom contact/bottom gate (BC/BG); right: top contact/bottom gate (TC/BG); (—) gate; (—) contacts; (—) semiconductor; (—) substrate; (—) dielectric.
In the bottom contact/top gate (BC/TG) configuration the source/drain electrodes
are directly deposited onto the surface of the substrate followed by the
semiconductor layer and the insulator layer and finally by the gate electrode on top of
the device. In the top contact/bottom gate (TC/BG) configuration the layers are
arranged vice versa and in the bottom contact/bottom gate (BC/BG) configuration the
semiconductor layer is deposited lastly. The type of configuration influences on the
one hand the morphology of the semiconductor layer (deposition on top of the
source/drain contacts/substrate surface/insulator surface) and on the other hand the
charge injection into the semiconductor:8 In the BC/BG structure electrons are
injected directly into the channel through the small electrode area that faces the
channel, whereas in the other two arrangements electrons are also injected through
the electrode area that overlaps with the gate electrode (staggered configuration). In
the latter case more electrons can be injected thus reducing the contact resistance.31
In the TC/BG assembly evaporation of the metal contacts on top of the
semiconductor layer can lead to metal atom diffusion into the semiconductor which
affects electron injection.32 All these factors can lead to different device performances
for the same semiconductor in different device architectures.
Source/Drain Electrodes
The selection of the source/drain electrode material depends primarily on its work
function which should be as close as possible to the HOMO (hole transport) or LUMO

6
(electron transport) or to both energy levels (ambipolar transport, see below) in order
to reduce charge injection barriers. However, the work function is not a definite value
but varies for different surface atomic geometries of the same electrode material.33
Moreover upon semiconductor deposition Fermi level pinning can further change the
work function.34 Another difficulty arises from the low environmental stability of low
work function metals. Frequently used electrode materials are Au (-5.2 eV), Ag (-4.9
eV), Cu (-4.7 eV), Al (-4.0 eV), and Ca (-2.8 eV),35-36 whereas for all-printed devices
doped conducting polymers like polyethylenedioxythiophene:poly(styrene sulfonic
acid) (PEDOT:PSS)37-39 and polyaniline (PANI)40-42 are used.
Gate Dielectrics
A huge impact on the device characteristics is observed by the type of insulator. In
many cases SiO2 (insulator) on top of a silicon wafer (gate) is used due to its ready
availability at high purity, usefulness as substrate, compatibility with subsequent
processing steps and its reasonably high dielectric constant = 3.9.20 The dielectric
constant is related to the capacitance by Ci = 0A/d (0 is the permittivity in vacuum,
A is the contact area and d is the dielectric layer thickness).20 Thus a thin insulator
layer of high results in a high amount of induced charges at the
semiconductor/insulator interface thereby enhancing the conductivity of the
semiconductor. However, if SiO2 was used electron trapping at the
SiO2/semiconductor interface was observed for several semiconductor polymers.43
This could be reduced by treatment of the SiO2 surface with alkyltrichlorosilanes or
hexamethyldisilazane (HMDS) or by the introduction of a hydroxyl free organic buffer
dielectric, which shields the semiconductor from free hydroxyl groups at the surface.
Another group44 observed higher mobilities for polytriarylamines with insulators of low
(polypropylene-co-1-butene (PPcB), polypropylene (PP)) than with insulators of
higher (polyvinylphenol (PVP), polyvinylalcohol (PVA), polymethylmethacrylate
(PMMA)) which was explained by additional energetic disorder induced by the high
insulator at the interface.
7
Morphology
The morphology of the semiconductor layer is the most important factor that affects
mobilities. Thus the highest mobilities (up to 20 cm2 V-1 s-1 in rubrene45-46) among
organic semiconductors were achieved in single crystals due to the absence of grain
boundaries and trap states in these highly pure materials.8 However, single crystals
are not suitable for the application in large-area devices or for processing by printing
techniques thus being delimited to more fundamental studies. The particular
arrangement of semiconductor polymers in a thin film is strongly influenced by the
surface of the underlying substrate (substrate, source/drain electrodes, dielectric)34,
the deposition technique (e.g. vacuum deposition, spin coating, drop casting,
printing)47 and the precise polymer structure (planarity, side chains, molecular shape
and dimensions)48. For example, for spin coated thin films of highly regioregular (>91
%) poly(3-hexylthiophene) (P3HT) of high molecular weight high hole mobilities of
0.05-0.1 cm2 V-1 s-1 were obtained.49 In contrast for less regioregular (81 %) P3HT of
low molecular weight mobilities of only 2 × 10⁻⁴ cm2 V-1 s-1 in spin coated thin films
were achieved. However for the latter sample an almost equally high value (ca. 0.07
cm2 V-1 s-1) was obtained from films formed by slow casting from a dilute solution.49
The higher hole mobilities are caused by a better interchain transport along coplanar
arranged polymer backbones oriented perpendicular to the substrate surface as
compared to the arrangement of the backbones parallel to the substrate surface. For
poly(p-phenylene vinylene)s also a strong influence of the substitution pattern and
the nature of the side chain as well as of the film processing conditions on the charge
carrier mobilities was observed.50-51
p-Channel OFETs
In Chart 1 hole transporting polymer semiconductors used in OFET devices are
depicted. P3HT is among the best investigated materials with which hole mobilities
up to 0.2 cm2 V-1 s-1 are now achievable.52-53 Best results were obtained for highly
regioregular49 P3HT of high molecular weight54-56 when deposited from chloroform
solutions57. One drawback is the high HOMO level of P3HT (-4.9 eV)43 making it
unstable towards oxygen. A lowering of the HOMO level can be obtained by a

8
reduction of the delocalization along the backbone by for example incorporation of
fused rings into the thiophene polymer chain.
Chart 1
This has been realized for PBDT2T58 (Chart 1) giving saturation mobilities of 0.15-
0.25 cm2 V-1 s-1 when measured in ambient conditions with only minor device
degradation upon standing at 20 % relative humidity. Another such example is
PBTTT59 giving the highest reported hole mobilitiy among polymer based OFETs so
far with a maximum saturation mobility of 0.72 cm2 V-1 s-1 in nitrogen atmosphere
thus reaching the mobility of amorphous silicon thin-film transistors (0.5-1 cm2 V-1 s-
1)27. Other high mobility semiconductors are PCPDTBT (µsat,max = 0.17 cm2 V-1 s-1 in
nitrogen atmosphere)60 and PDTP2T (µsat,max = 0.21 cm2 V-1 s-1 measured under
argon)61. Interestingly, in contrast to the highly ordered lamellar structures observed
for P3HT, PBDT2T and PBTTT rather disordered structures were found for
PCPDTBT and PDTP2T which suggests that the lamellar structure is not the
exclusive structure to gain high mobilities. Nevertheless a flat, planar backbone with
small interbackbone distances seems to be important for efficient charge transport.
Thus, polytriarylamines, e.g. PTPA3, show lower hole mobilities up to 0.01 cm2 V-1 s-
1.62 However, they form stable amorphous films and the OFET performance is
impressively stable upon storage and operation in air.44 Moreover, a printed, flexible
OFET device using PTPA3 showed also good device performance.63 Another class
of hole transporting polymers are copolymers comprising fluorene and thiophene, as
for example F8T2 with µsat,max = 0.02 cm2 V-1 s-1 obtained in layers of parallel aligned
polymer chains in printed devices39. The low lying HOMO of F8T2 (-5.5 eV) gives
9
improved operating stability compared to printed P3HT devices, whereas the high
contact resistance in F8T2 devices hampers charge injection into the channel.
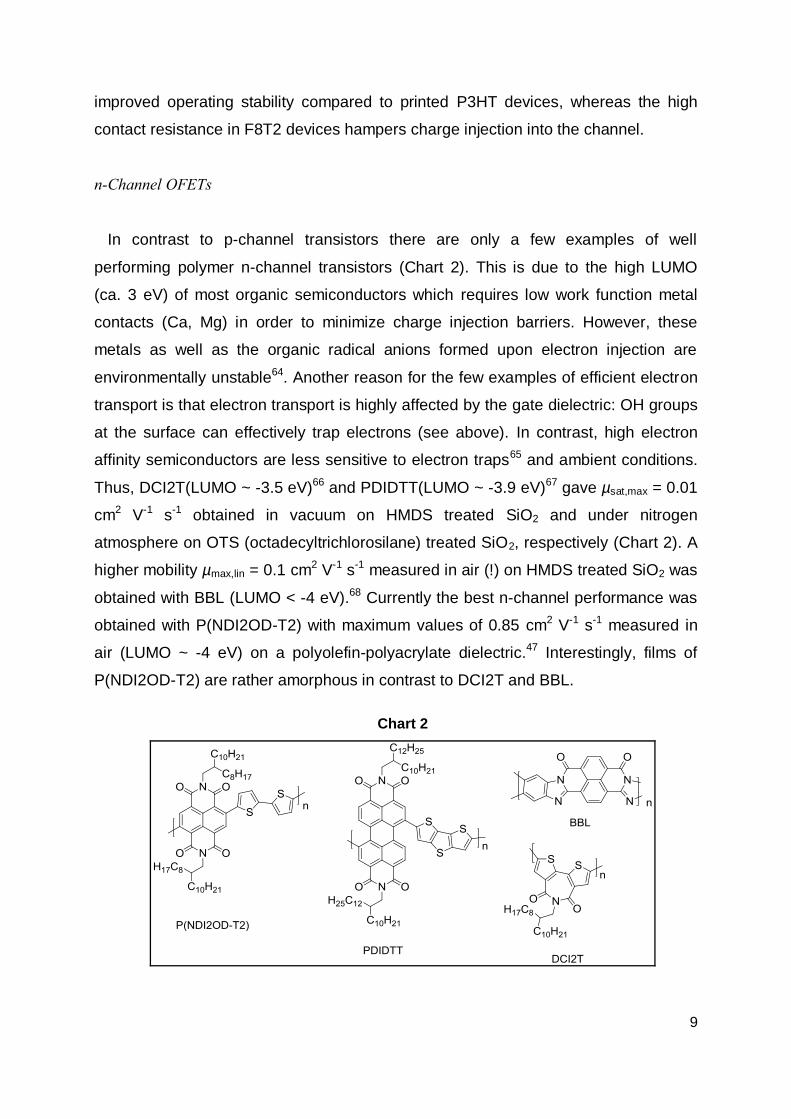
n-Channel OFETs
In contrast to p-channel transistors there are only a few examples of well
performing polymer n-channel transistors (Chart 2). This is due to the high LUMO
(ca. 3 eV) of most organic semiconductors which requires low work function metal
contacts (Ca, Mg) in order to minimize charge injection barriers. However, these
metals as well as the organic radical anions formed upon electron injection are
environmentally unstable64. Another reason for the few examples of efficient electron
transport is that electron transport is highly affected by the gate dielectric: OH groups
at the surface can effectively trap electrons (see above). In contrast, high electron
affinity semiconductors are less sensitive to electron traps65 and ambient conditions.
Thus, DCI2T(LUMO ~ -3.5 eV)66 and PDIDTT(LUMO ~ -3.9 eV)67 gave µsat,max = 0.01
cm2 V-1 s-1 obtained in vacuum on HMDS treated SiO2 and under nitrogen
atmosphere on OTS (octadecyltrichlorosilane) treated SiO2, respectively (Chart 2). A
higher mobility µmax,lin = 0.1 cm2 V-1 s-1 measured in air (!) on HMDS treated SiO2 was
obtained with BBL (LUMO < -4 eV).68 Currently the best n-channel performance was
obtained with P(NDI2OD-T2) with maximum values of 0.85 cm2 V-1 s-1 measured in
air (LUMO ~ -4 eV) on a polyolefin-polyacrylate dielectric.47 Interestingly, films of
P(NDI2OD-T2) are rather amorphous in contrast to DCI2T and BBL.
Chart 2

10
Ambipolar OFETs - I/V Characteristics
It has long been thought that different organic materials are needed for the
construction of organic p- and n-channel transistors. However, a few years ago it has
been demonstrated that organic semiconductors are inherently ambipolar43,69, that is
they can be switched between pure hole, pure electron and ambipolar transport by
altering the voltage offsets between gate, source and drain electrodes provided that
electrode material, gate dielectric and device geometry are suitable.8 One striking
example is pentacene – one of the highest mobility p-channel organic
semiconductors, which reaches hole mobilities up to 5 cm2 V-1 s-1 in sublimed thin
films32: When PVA was used as the gate dielectric and gold electrodes placed on top
of the pentacene film ambipolar transport with hole and electron mobilities of 0.3 and
0.04 cm2 V-1 s-1 were achieved.70
In Figure 4 an ambipolar output characteristic is shown. In contrast to the unipolar
transistor (Figure 2), the ambipolar transistor is not in the off-state when the voltage
polarity of gate and drain electrode is inverted with respect to the source (Vs = 0). In
fact just the same processes occur with the opposite carrier type (compare first and
third quadrant). Furthermore the output characteristic differs from a unipolar
transistor, which can be explained as follows: If we assume a high positive gate
voltage Vg > Vth(electron) and a small positive drain voltage Vd << Vg only electrons
are accumulated in the channel and the output characteristic is similar to the linear
regime of the unipolar transistor (see the curves with Vg > 40 V, Figure 4). If Vg is
reduced such that Vg - Vth(electron) < Vd a reverse electrical field between Vg and Vd
is generated compared to the fields between source and gate and source and drain,
respectively. Thus a depletion region is formed near the drain electrode, which
causes the saturation of the source-drain current similar to the saturation regime of
the unipolar transistor. Further reduction of Vg such that Vg - Vd < Vth(hole) (note, that
Vth(hole) is negative) causes holes to be injected by the drain electrode. This yields a
p/n junction in the channel and thus a diode characteristic (see the curves with Vg ≤
40 V) typical of the ambipolar transport mode. The same explanations can also be
applied to negative Vg and Vd (hole accumulation mode).

11
Figure 4. Output characteristic of an ambipolar OFET device. Ids: source-drain current, Vd: drain voltage, Vg: gate voltage.
The transfer plots (Ids vs. Vg at constant Vd) depicted in Figure 5 show characteristic
v-shaped curves: When a high positive gate voltage is applied only electrons are
present in the channel (right arm), whereas at low positive Vg also holes are present
in the channel (left arm, ambipolar regime). According to the relation Vg - Vd <
Vth(hole) for hole injection by the drain electrode the minima of the v-shaped curves
shift to higher Vg values with increasing Vd. The same interpretations hold for
negative values of Vg and Vd (left part of Figure 5). Mobilities are calculated in the
unipolar regime from eqs. 2, 4 and 5.
Figure 5. Transfer plots of an ambipolar OFET device for different drain voltage values Vd denoted next to the curves. Ids: source-drain current, Vg: gate voltage.
Ambipolar OFETs - Organic Materials
One obstacle for obtaining efficient ambipolar transport is to match both HOMO
and LUMO level to the work function of the charge carrier injecting source and drain
electrodes. Since most organic semiconductors have band gaps of 2-3 eV for at least

12
one carrier type a high injection barrier is to be expected hampering balanced hole
and electron transport. There have been several strategies to overcome this problem.
In bilayer devices a p-channel and an n-channel semiconductor layer are deposited
on top of each other and transport of holes and electrons, respectively, occurs in
separate layers71. This yields high balanced hole and electron transport in vacuum
deposited small molecule bilayer OFETs.72 However, this device structure is difficult
to realize by solution processing of different organic semiconductors since orthogonal
solvents have to be used in order to prevent mixing of the layers and no reports using
this strategy for polymers exist. Liu and Sirringhaus prepared ambipolar bilayer
OFETs by a more complex method depositing the two polymer semiconductors
initially on different substrates before attaching them to each other.73 They observed
ambipolar transport but with a clear deviation from ideal transport characteristics due
to carrier transfer across the bilayer interface.
Another approach is the use of blends of p- and n-channel semiconductors, which
requires an interpenetrating network of the two components. A blend of regioregular
P3HT (Chart 1) and P(NDI2OD-T2) (Chart 2), the best performing p- and n-channel
polymers so far, resulted in balanced hole and electron mobilities of 2-4 × 10⁻³ cm2 V-
1 s-1 being significantly lower than the mobilities of the single polymers.74 Higher
mobilities in blend devices have yet not been achieved.
A third possibility to overcome energy level mismatch is to use different metals for
source and drain contacts, which can be deposited by subsequent angled
evaporation.75-76 However, in case of the wide band gap polymer F8T2 (Chart 1) with
HOMO and LUMO levels at -5.6 eV and -3.2 eV, respectively, no significant
improvement was observable when Ca (-2.8 eV) and Au (-5.2 eV) contacts were
used instead of ITO (-4.8 eV) contacts for source and drain electrodes.43,77 This
indicates that the main obstacle for this material is not the HOMO/LUMO alignment
with the work function of the source/drain electrodes.
The use of single layer devices with an appropriate gate dielectric and adequate,
equal source and drain contacts is the most straightforward device architecture and
recently high balanced hole and electron mobilities of 0.01-0.1 cm2 V-1 s-1 were
obtained when PDPP3T78, BBTDPP179 and F8BT80-81 were used as semiconductors
(Chart 3). Interestingly, a polymer, which differs from PDPP3T only by the absence of
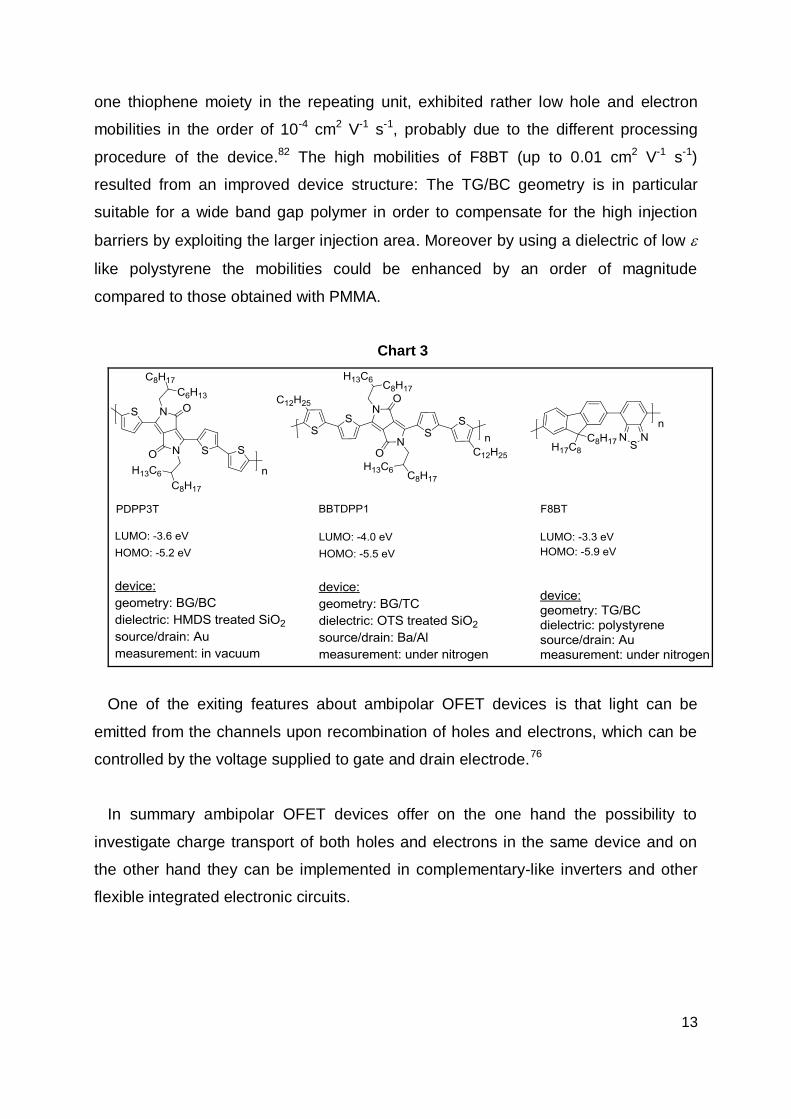
13
one thiophene moiety in the repeating unit, exhibited rather low hole and electron
mobilities in the order of 10-4 cm2 V-1 s-1, probably due to the different processing
procedure of the device.82 The high mobilities of F8BT (up to 0.01 cm2 V-1 s-1)
resulted from an improved device structure: The TG/BC geometry is in particular
suitable for a wide band gap polymer in order to compensate for the high injection
barriers by exploiting the larger injection area. Moreover by using a dielectric of low
like polystyrene the mobilities could be enhanced by an order of magnitude
compared to those obtained with PMMA.
Chart 3
One of the exiting features about ambipolar OFET devices is that light can be
emitted from the channels upon recombination of holes and electrons, which can be
controlled by the voltage supplied to gate and drain electrode.76
In summary ambipolar OFET devices offer on the one hand the possibility to
investigate charge transport of both holes and electrons in the same device and on
the other hand they can be implemented in complementary-like inverters and other
flexible integrated electronic circuits.

14
1.2 OLED Devices - Assembly, Working Principle and Organic Materials
The OLED technology is already present in small displays, e.g. in mobile phones,
MP3-players, digital cameras and watches, and even an OLED TV produced by Sony
is already available.83 The advantages over the common LCD technology are
manifold: background illumination is no longer necessary which saves energy; the
contrast is higher and colours are brilliant; the viewing angle is almost unlimited; the
response time is much faster (1 × 10³) and the displays are extremely flat (3 mm for
the OLED TV XEL-1 by Sony).83 Moreover lifetimes of many OLED displays are now
comparable or better than those of LCD displays: Many of them exceed 50000 h.84 In
the field of lighting applications the Novaled AG recently presented a white light
device with a power efficiency of 30 lm W -1 at an initial luminance of 1000 cd m-2 and
a lifetime exceeding 50000 h.85 On the laboratory scale a power efficiency of 90 lm
W-1 (34 % external quantum efficiency (EQE)) at 1000 cd m-2 for a device of 6.7 mm2
was achieved.86 Philips soon will enter the market with the first commercially
available OLED white light source to be driven with 230 V power supply voltage.87 It
has a power efficiency of 25 lm W -1 and a brightness of 3000 cd m-2 with a lifetime of
10000 h.88 The lit area is 119 mm × 37 mm. In the future even more revolutionary
display and lighting applications will be feasible as for example completely flexible
TVs or mobile phones one can coil up or wall paper, partitions and windows that
illuminate rooms and are transparent in the off-state.
Assembly and Working Principle
The working principles of OLEDs and OPVs are opposed to each other: OLEDs
convert electrical energy into light energy whereas with OPVs it is the other way
around. In the most simple case the organic layer is embedded between two
electrodes of different work function, one of which having to be transparent for the
output/input of light. For this purpose ITO coated glass substrates are frequently
used. As counter electrode aluminium is used mostly. At the electrode surfaces holes
and electrons are injected into (OLEDs) or extracted out (OPVs) of the organic layer.
Upon electron/hole recombination energy can be dissipated by the emission of
photons (OLEDs), whereas in OPV devices photons are absorbed to create excited
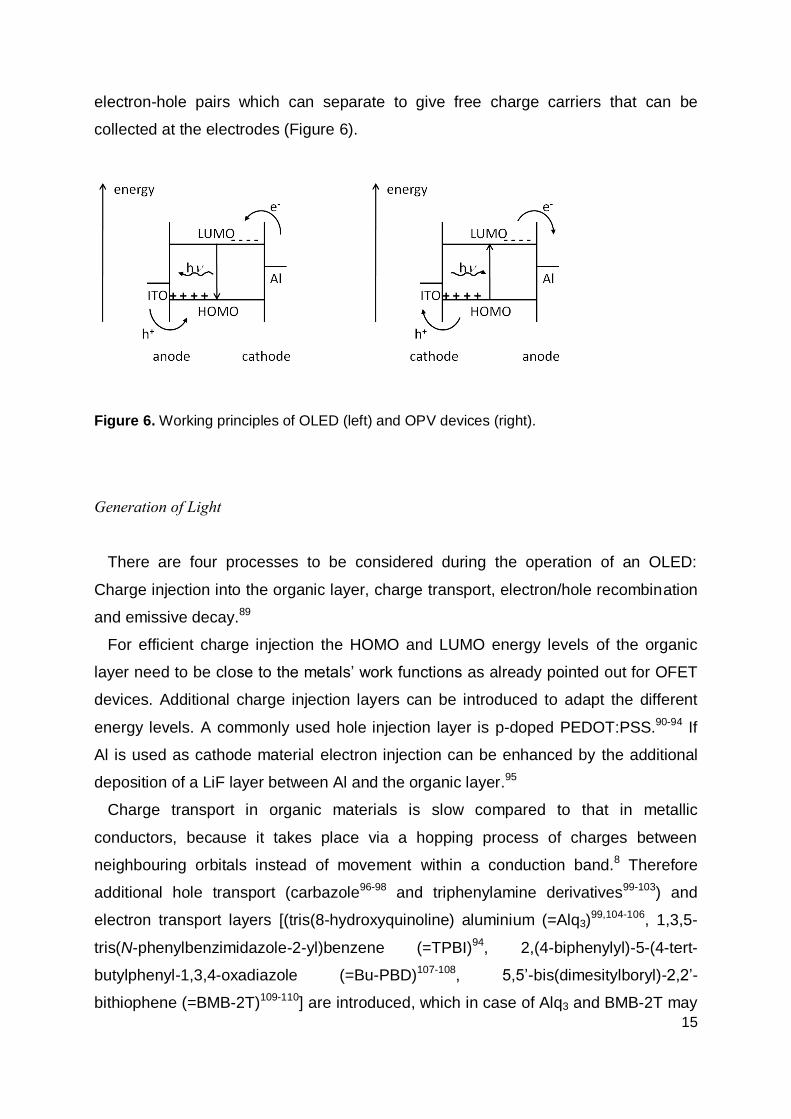
15
electron-hole pairs which can separate to give free charge carriers that can be
collected at the electrodes (Figure 6).
Figure 6. Working principles of OLED (left) and OPV devices (right).
Generation of Light
There are four processes to be considered during the operation of an OLED:
Charge injection into the organic layer, charge transport, electron/hole recombination
and emissive decay.89
For efficient charge injection the HOMO and LUMO energy levels of the organic
layer need to be close to the metals‟ work functions as already pointed out for OFET
devices. Additional charge injection layers can be introduced to adapt the different
energy levels. A commonly used hole injection layer is p-doped PEDOT:PSS.90-94 If
Al is used as cathode material electron injection can be enhanced by the additional
deposition of a LiF layer between Al and the organic layer.95
Charge transport in organic materials is slow compared to that in metallic
conductors, because it takes place via a hopping process of charges between
neighbouring orbitals instead of movement within a conduction band.8 Therefore
additional hole transport (carbazole96-98 and triphenylamine derivatives99-103) and
electron transport layers [(tris(8-hydroxyquinoline) aluminium (=Alq3)99,104-106, 1,3,5-
tris(N-phenylbenzimidazole-2-yl)benzene (=TPBI)94, 2,(4-biphenylyl)-5-(4-tert-
butylphenyl-1,3,4-oxadiazole (=Bu-PBD)107-108, 5,5‟-bis(dimesitylboryl)-2,2‟-
bithiophene (=BMB-2T)109-110] are introduced, which in case of Alq3 and BMB-2T may

16
also serve as emissive layer111-113. In order to avoid charge trapping at defect sides
the organic layer should be of high purity.
High efficiencies require a balanced charge transport. However, often holes are
more efficiently transported in organic semiconductors than electrons (see OFET
devices) which results in holes reaching the cathode without recombination with
electrons. This is prevented in a two- or multilayer device, in which holes concentrate
at layer boundaries because of energy differences which in turn amplify the electric
field in the electron transport layer and, thus, charge transport becomes more
balanced.99
Finally, a highly emissive organic material is needed, which favourably emits a
pure, saturated colour, that is, the CIE coordinates should lie as close as possible to
the outer curved boundary of the gamut.
Organic Materials
Until now small organic molecules are mostly used as the light emitting material
since they are still superior to polymers concerning the quality of the resulting images
and the long-term stability.114 In contrast, the application of polymers reduces costs
and allows for the construction of large-area devices. Therefore better performing
polymers are still needed. The reason for the superior performance of small
molecules is that they can be vacuum deposited which allows for the facile
construction of multi-layer devices. Thus, every single layer can be optimized
independently. Moreover vacuum deposition usually yields very pure layers. Since
polymers are typically deposited from solution, orthogonal solvents would have to be
used for the deposition of consecutive layers in order to avoid dissolution of the
underlying layer which, however, limits the choice of applicable polymers. Hence, the
challenge for the construction of OLEDs based on polymers is to synthesize
polymers which combine all the different requirements, i.e. close match of HOMO
and LUMO levels with the metals‟ work functions, balanced and fast hole and
electron transport, highly efficient emission and long-term stability. This can be
achieved by the synthesis of D - A conjugated polymers, in which the donor acts as
the hole transport layer and the acceptor acts as the electron transport layer and in
which at the same time one of these moieties strongly emits in the desired

17
wavelength region. A range of such D- A conjugated polymers were prepared and
tested in OLED devices for their electroluminescent efficiencies in the past
decade.90,92,94,115-119 A few of them are shown in Chart 4.
Chart 4
18
Shu et al.119 demonstrated that the performance of a double1-layer OLED device
with the configuration ITO/PEDOT:PSS/polymer/Ca/Ag could be more than doubled if
polymer A is used instead of polymer B. The former gives a maximum brightness of
4080 cd m-2 at 12 V (ext = 1.21 %). This is obviously due to the introduced
triarylamine moieties which adjust the HOMO level of the polymer to the Fermi level
of the modified ITO electrode and improve hole transport. Likewise Yuan et al.94
presented with a polymer similar to A incorporated in a triple-layer device a much
better performing OLED in comparison to the same device made from pure poly(9,9-
dioctylfluorene). This again corroborates the importance of the hole (triarylamine) and
electron (oxadiazole) transport moieties in addition to the strongly emitting
polyfluorene backbone. The device ITO/PEDOT:PSS/polymer C/Ba/Al91 using
carbazole as donor and benzothiadiazole as acceptor moiety gave an external
quantum efficiency of 0.48 % and the device ITO/PEDOT:PSS/polymer D/Ca/Ag115
containing a triarylamine donor group, benzothiadiazole and 1,2,4-triazole acceptor
groups and fluorene as the emitting moiety showed a brightness of 696 cd m-2. All of
these devices had a rather low turn-on voltage of about 5 V due to the improved hole
and electron injection.
1.3 OPV Cells - Assembly, Working Principle and Organic Materials
OPV devices have not been brought onto the market up to now with one exception:
Konarka Technologies offers thin (0.5 mm ± 0.05 mm), light (~940 g m-2) and flexible
plastic solar cells for charging batteries of portable electronics. In july 2010 a new
OPV cell power conversion efficiency (PCE) record of 8.13 % was reported.120 The
company that produced the cell120 hopes to reach 10 % efficiency by the end of 2011.
Nevertheless, OPV cells won‟t replace silicon based solar cells due to lower
efficiencies and less stability, but will likely be used for new applications in portable
digital electronic devices or in textiles due to inherent flexibility, light weight and low
production costs. 1 PEDOT:PSS does not cause any problems in device fabrication since it is spin coated from an
aqueous solution thus not being dissolved during spin coating of the polymer layer from an organic solvent. It modifies the work function of the ITO electrode, improves hole injection and smoothes the ITO surface.

19
Assembly and Working Principle
The basic working principle of OPV cells is opposed to that of OLED devices and is
explained at the beginning of chapter 1.2. The common assembly of polymer solar
cells is the following121: A PEDOT:PSS layer is spin coated onto an ITO coated glass
substrate, which smoothes the ITO surface and improves hole extraction. On top a
solution of a donor and an acceptor compound is spin coated. Finally a LiF/Al layer is
deposited under high vacuum as counter electrode. This type of organic solar cell is
called bulk heterojunction (BHJ) solar cell, referring to the interfaces formed between
the donor and the acceptor within the blend.122-123 In order to obtain free charge
carriers, charge transfer from the donor to the acceptor and subsequent charge
separation is necessary which can only take place in close proximity (10-20 nm) to
the D-A interfaces. Therefore a large interfacial area is required. Well-known donor
polymers are MDMO-PPV (poly[2-methoxy-5-(3‟, 7‟-dimethyloctyloxy)-1,4-
phenylenevinylene]) and P3HT.124 As acceptor the fullerenes [6,6]-phenyl C61 butyric
acid methylester ([60]PCBM) and its higher homologue [70]PCBM have turned out to
perform best. This is due to ultrafast photoinduced charge transfer being observed in
several polymer/[60]PCBM systems in the sub-picosecond timescale.125 Moreover
C60 shows an electron mobility of up to 1 cm2 V-1 s-1 70 and [60]PCBM has a LUMO
level close to the Fermi level of the Al electrode (both ~ -4.3 eV)13,126-127. In contrast
to [60]PCBM, [70]PCBM has a considerably higher absorption coefficient thus
contributing significantly to the photocurrent in the visible region.128
I/V Characteristics
From the output characteristic of a solar cell (Figure 7) JSC, FF and VOC are
obtained, from which the power conversion efficiency (PCE) values are calculated
according to eqs. 6 and 7:129
PCE = (JSC × FF × VOC) / IP (6)
FF = (Jmpp × Vmpp) / (JSC × VOC) (7)
20
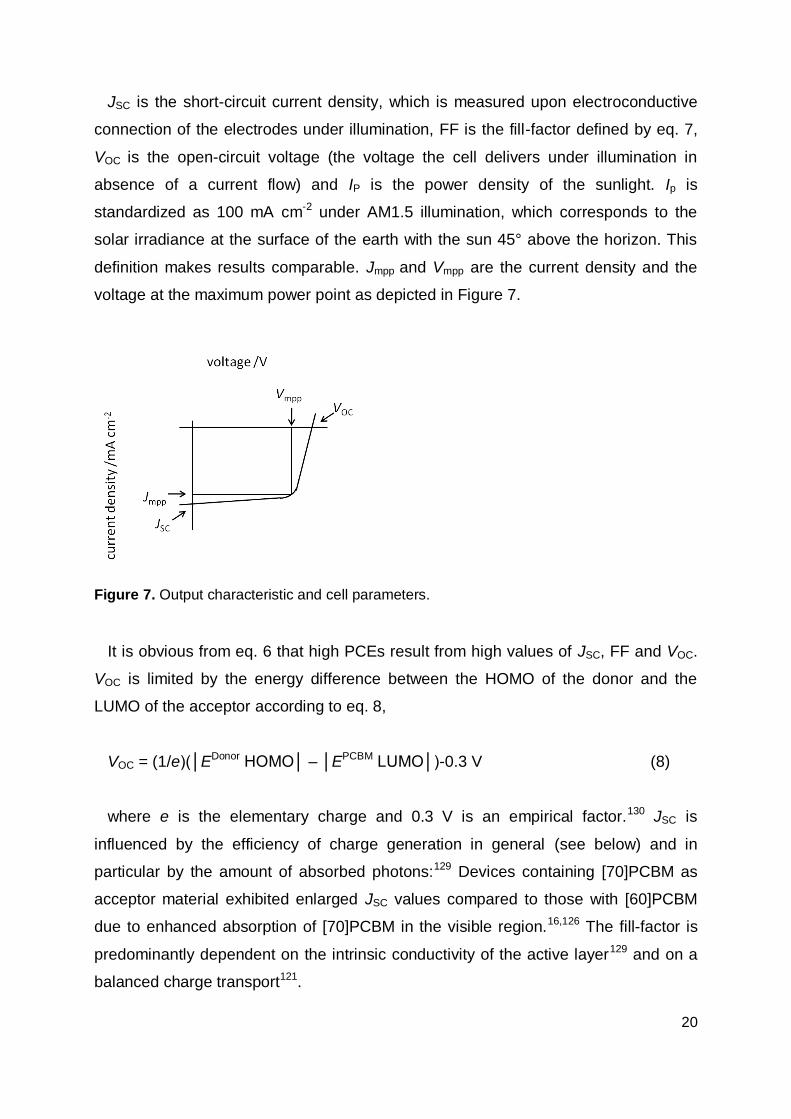
JSC is the short-circuit current density, which is measured upon electroconductive
connection of the electrodes under illumination, FF is the fill-factor defined by eq. 7,
VOC is the open-circuit voltage (the voltage the cell delivers under illumination in
absence of a current flow) and IP is the power density of the sunlight. Ip is
standardized as 100 mA cm-2 under AM1.5 illumination, which corresponds to the
solar irradiance at the surface of the earth with the sun 45° above the horizon. This
definition makes results comparable. Jmpp and Vmpp are the current density and the
voltage at the maximum power point as depicted in Figure 7.
Figure 7. Output characteristic and cell parameters.
It is obvious from eq. 6 that high PCEs result from high values of JSC, FF and VOC.
VOC is limited by the energy difference between the HOMO of the donor and the
LUMO of the acceptor according to eq. 8,
VOC = (1/e)(│EDonor HOMO│ – │EPCBM LUMO│)-0.3 V (8)
where e is the elementary charge and 0.3 V is an empirical factor.130 JSC is
influenced by the efficiency of charge generation in general (see below) and in
particular by the amount of absorbed photons:129 Devices containing [70]PCBM as
acceptor material exhibited enlarged JSC values compared to those with [60]PCBM
due to enhanced absorption of [70]PCBM in the visible region.16,126 The fill-factor is
predominantly dependent on the intrinsic conductivity of the active layer129 and on a
balanced charge transport121.

21
Generation of Free Charge Carriers
The important processes in an organic solar cell are:121,131
1) Absorption of a photon.
2) Diffusion of the exciton to the D-A interface.
3) Charge transfer from the donor to the acceptor.
4) Charge separation of the coloumb-bound [D•+A•-]* state.
5) Charge transport of holes and electrons through donor and acceptor phase,
respectively.
6) Charge extraction at the respective electrodes interfaces.
By light absorption an electron is promoted from the HOMO into the LUMO which
leaves a hole in the HOMO. Thus an excited coloumb-bound electron-hole pair, a so-
called exciton, is formed. The exciton should reach the D-A interface within the
lifetime of the exciton before relaxation occurs. This refers to an exciton diffusion
length of ca. 10-20 nm. For efficient charge transfer from the donor to the acceptor
the LUMO of the acceptor ought to be at least 0.3 eV below the LUMO of the donor
in order to overcome the exciton binding energy.124 This energy offset also slows
down back electron transfer. After charge transfer charge separation from the
coloumb-bound [D•+A•-]* state is achieved thermally and by the electric field built up
by the difference of the work functions of the electrodes.121 Additionally it is promoted
by a reasonably high dielectric constant of the organic layer.132 Note, however, that
charge separation is a reversible step reducing the overall amount of free charge
carriers. In order to suppress charge recombination and to enhance the current
output charge carrier mobilities should be sufficiently high (> 10-3 cm2 V-1 s-1)124 and
balanced. Finally, as already mentioned HOMO and LUMO levels of the blend must
match the work functions of the electrode materials (ITO/PEDOT:PSS ~ -5.0 eV129, Al
~ -4.3 eV127).
22
Absorption of Light and Energy Levels
Absorption of light over a broad range of the solar spectrum, i.e. a good overlap of
the polymer‟s absorption spectrum with the solar spectrum, is also important to
achieve high efficiencies. Unfortunately, most of the organic polymers only absorb
below 650 nm (band gap 1.9 eV), which means that only 22.4 % of the photons
emitted by the sun between 280 and 4000 nm can be harvested at most and the
theoretically available maximum current density thus only amounts to 14.3 mA cm-2.14
Extending the absorption edge to 800 nm, which corresponds to an optical band gap
of Egopt = 1.55 eV, would increase the amount of harvestable photons to 37.3 % and
the maximum current density to 23.8 mA cm-2. However, the band gap cannot be
diminished infinitely, since the HOMO and LUMO levels of the polymer have to be
adjusted to HOMO and LUMO of the acceptor (PCBM) and to the electrode levels.
Moreover the energy difference between the HOMO of the donor and the LUMO of
the acceptor determines the open circuit voltage, VOC (eq. 8), which should be as
high as possible.
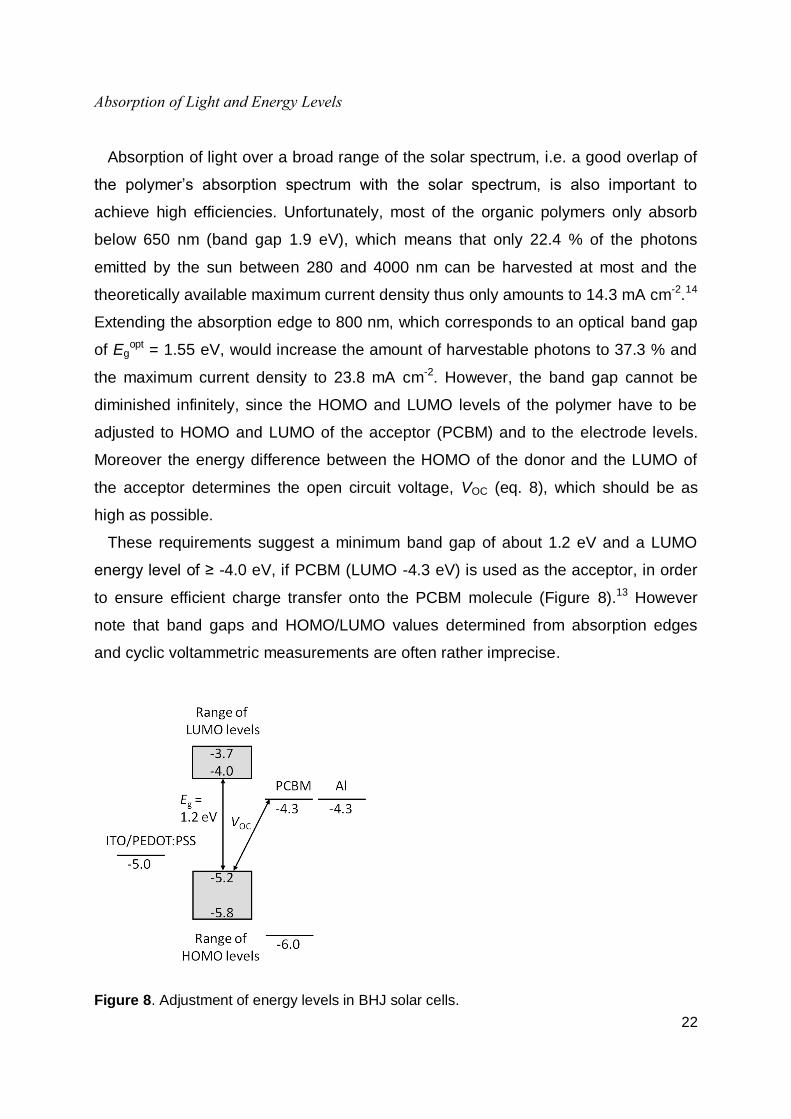
These requirements suggest a minimum band gap of about 1.2 eV and a LUMO
energy level of ≥ -4.0 eV, if PCBM (LUMO -4.3 eV) is used as the acceptor, in order
to ensure efficient charge transfer onto the PCBM molecule (Figure 8).13 However
note that band gaps and HOMO/LUMO values determined from absorption edges
and cyclic voltammetric measurements are often rather imprecise.
Figure 8. Adjustment of energy levels in BHJ solar cells.

23
Low band gaps (< 1.9 eV) can be achieved by different strategies.14,129,133 One is
the synthesis of D-A conjugated polymers134-135: Donor moieties raise the HOMO
level and acceptor moieties lower the LUMO level of the polymer by orbital mixing of
the respective HOMO and LUMO orbitals of donor and acceptor. This effect can be
further increased by enhancement of donor and acceptor strength via the introduction
of electron donating and electron withdrawing substituents. Moreover the alternation
between donor and acceptor moieties induces a more delocalized electronic structure
due to the contribution of the D+═ A- resonance structure (= quinoid structure), which
also decreases the band gap. Another strategy is to design planar, rigid polymer
backbones with hindered rotation in order to get extended -conjugation. However,
such polymers are often less soluble. A further possibility is to enforce a quinoid
structure in the polymer backbone, which has been shown to reduce the band gap of
polyisothianaphthene by 1 eV compared to the aromatic structure of
polythiophene.136-138 Above all the band gap can be reduced by intermolecular
interactions in the solid state.
Organic Materials
During the past decade a huge amount of novel low band gap polymers with
suitable HOMO and LUMO levels have been synthesized and applied in BHJ
cells.13,16,126-127,139-148 However, most of these devices gave rather low PCEs
compared to the state of the art device ITO/PEDOT:PSS/(P3HT/[60]PCBM)/LiF/Al,
which reproducibly gives PCEs of around 5 %149-151, even though the band gap of
P3HT is about 1.9 eV. This is caused by several factors:121 Charge transfer and
charge transport are strongly dependent on the morphology of the active layer. For
efficient charge transfer the mean domain size of donor and acceptor phases should
not exceed the exciton diffusion length. Moreover, both phases need to be highly
ordered and the two phases have to form a bicontinuous network in order to obtain
efficient charge transport towards the electrodes. The formation of such a nanoscale
phase separated bicontinuous network requires good solubility and miscibility of
donor and acceptor in the same solvent so as to avoid the formation of clusters.
Furthermore, it depends on the ratio of donor and acceptor, their intermolecular
interaction, molecular weight and purity of the polymer, the type of solvent and the
24
solvent evaporation rate. All these aforementioned parameters determine a
preliminary order in the active layer. Thermal annealing can further improve the
morphology: P3HT starts to crystallize and [60]PCBM diffuses through the layer,
which finally can give the optimized morphology. All of these fabrication parameters
have been evaluated for the P3HT/[60]PCBM system by many research groups
resulting in numerous publications.149-150,152-156 Since every single donor/acceptor
system is unique, the morphology has to be optimized for each system individually,
which has not been done for most of the new D-A low band gap polymers. Another
reason for the observed low PCEs of solar cells comprising these new polymers is
their low intrinsic charge carrier mobility.142,148 In fact many of the low band gap
polymers strongly absorb in the long wavelength range but at the same time
absorption between 300 and 500 nm is rather weak. 127,142,147
However, some of the novel low band gap donor polymers exhibit promising PCEs
in BHJ cells being even superior to the P3HT cell as can be inferred from Table 1.
The structures of the applied polymers are depicted in Chart 5.
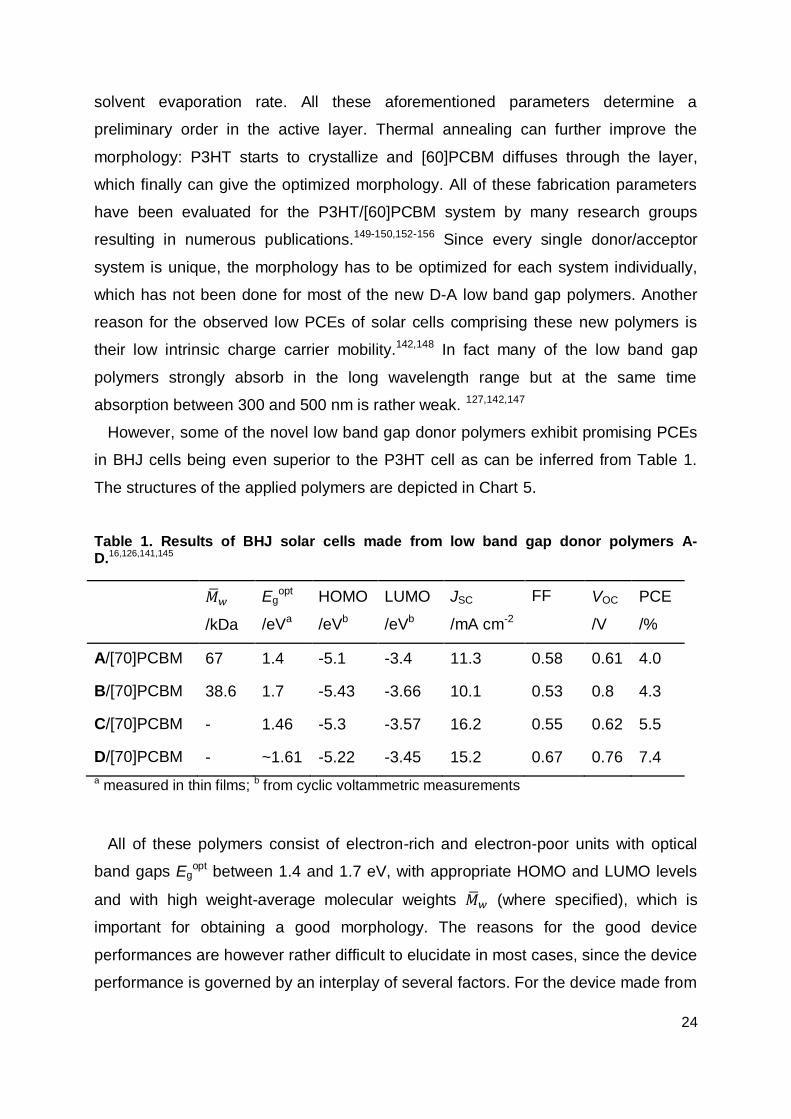
Table 1. Results of BHJ solar cells made from low band gap donor polymers A-D.16,126,141,145
/kDa
Egopt
/eVa
HOMO
/eVb
LUMO
/eVb
JSC
/mA cm-2
FF VOC
/V
PCE
/%
A/[70]PCBM 67 1.4 -5.1 -3.4 11.3 0.58 0.61 4.0
B/[70]PCBM 38.6 1.7 -5.43 -3.66 10.1 0.53 0.8 4.3
C/[70]PCBM - 1.46 -5.3 -3.57 16.2 0.55 0.62 5.5
D/[70]PCBM - ~1.61 -5.22 -3.45 15.2 0.67 0.76 7.4
a measured in thin films; b from cyclic voltammetric measurements
All of these polymers consist of electron-rich and electron-poor units with optical
band gaps Egopt between 1.4 and 1.7 eV, with appropriate HOMO and LUMO levels
and with high weight-average molecular weights (where specified), which is
important for obtaining a good morphology. The reasons for the good device
performances are however rather difficult to elucidate in most cases, since the device
performance is governed by an interplay of several factors. For the device made from

25
polymer A the morphology was optimized by testing different solvents for spin coating
which had a dramatic effect on the device performance.16 Polymer B exhibits a
sufficiently high absorption coefficient in thin films of > 1 × 105 cm-1 between 450 and
650 nm and a reasonable high hole mobility of 3.4 × 10⁻³ cm2 V-1 s-1 as evaluated
from measurements on OFET devices.126 In a BHJ device the maximum EQE
observed was 55 % at 470 nm.126 The EQE is a measure of the overall conversion of
incident photons to extracted electrons at certain wavelengths. About the same peak
value is achieved for a device comprising polymer C. Here the device performance
was improved through altering the BHJ morphology by spin-coating the active layer
from a solution containing not only polymer C and [70]PCBM but also 1,8-
octanedithiole.145 The best device performance was obtained using polymer D, which
gave a maximum EQE of 69 % at 630 nm and an internal quantum efficiency IQE
(absorbed photons to extracted electrons) of 90 % between 400 and 700 nm
confirming the efficient overall photoconversion process.141
Chart 5

26
2 Polycarbazoles
2.1 Introduction and Aim of the Project
Owing to their promising electrical and photophysical properties157 polycarbazoles
are interesting candidates for applications in optoelectronic devices such as OPVs13,
OFETs158 and OLEDs107-108,159-160. Polycarbazoles are strong blue emitters with high
fluorescence quantum yields161-162 and they are excellent hole transport materials
with high thermal stability163 and glass forming properties161. Moreover, depending on
the substitution and connection pattern (3,6- vs. 2,7-linkage, Chart 6) they can closely
match the hole injection energy of ITO electrodes.164-166 The 2,7-linked
polycarbazoles are often favoured to 3,6-linked polycarbazoles because of their
higher fluorescence quantum yields in solution and their extended conjugation over
several monomer units.163,166
Chart 6
This extended conjugation in poly-2,7-carbazoles results from the rigid poly-para-
phenylene motif which is bridged by nitrogen atoms in contrast to the more flexible
1,4-diaminobiphenyl structure of poly-3,6-carbazoles which may be conceived as
nitrogen connected benzidines. However, the preparation of 3,6-disubstituted
carbazoles is much easier than that of their 2,7-analogues and 3,6-polymers are
more soluble than 2,7-polymers due to greater flexibility of the polymer backbone.
Moreover, 3,6-polycarbazoles show higher in situ conductivities than their 2,7-
analogues.167

27
OLEDs have been fabricated from both 2,7107- and 3,6-linked108,159 polycarbazoles.
However, compared to the devices made from D-A conjugated polymers mentioned
above these were rather low performing OLED devices. As an acceptor moiety in D-A
compounds triarylboranes have been successfully used in small molecule OLEDs in
the past decade.104,106,112-113,168 They have been shown to be applicable as electron
transport layer110, hole blocking layer99 and light emitting layer with colours ranging
from blue, over green, yellow to orange depending on the donor and the bridge109,169.
Even white light-emitting devices have been fabricated from triarylborane containing
molecules.93
The aim of this project was to synthesize a 2,7- and a 3,6-linked polycarbazole with
a triarylborane moiety attached to the nitrogen atom of the carbazole (P1 and P2,
Chart 7) and to investigate and compare their spectroscopic and electrochemical
properties as well as their suitability for the application in an OLED device. As a
reference molecule 2,7-linked polycarbazole P3 (Chart 7) containing a triarylmethane
moiety instead of the triarylborane acceptor was to be synthesized.
Chart 7

28
2.2 Synthesis
The synthetic approach to monomers 6a-c is outlined in Scheme 1a. Leclerc et al.
published an efficient two-step synthesis of 2,7-dichlorocarbazole 3a.170 However, the
starting material they used – 4-chlorophenylboronic acid and 1-bromo-4-chloro-2-
nitrobenzene – is rather expensive. Therefore, 3a was prepared in three steps
starting with cheap and commercially available 1-chloro-4-iodobenzene.
Scheme 1a. Synthesis of the monomers 6a-c.
i) Cu, 230-250 °C, 3 h; ii) HNO3, CH3COOH, 110 °C, 1 h; iii) P(OEt)3, 170 °C, 16 h; iv) CuI, K3PO4, trans-1,2-cyclohexanediamine, 1,4-dioxane, 110 °C, 72 h (19 h for 5b); v) 1. tert-butyllithium, diethylether, -68 °C, 3 h 2. dimesitylboron fluoride (FBMes2), diethylether, -68 °C -> r. t. over night
The first step was an Ullmann coupling reaction171 to give 4,4‟-dichlorobiphenyl 1172
in moderate yield, which was then nitrated to afford 2173 in 95 % yield. Finally, a
Cadogan ring closure,174 as it was also used by Leclerc et al.170, gave 3a in 63 %
yield. The 2,7- and 3,6-dichlorocarbazole 3a and 3b175 were then N-arylated by 1,4-
dibromo-3,5-dimethylbenzene 4a176-178 catalyzed by CuI to afford 5a and 5b,

29
respectively.179 The same reaction was applied for the attachment of 1-bromo-4-
(diphenylmethyl)benzene 4b180 to the carbazole-nitrogen of 3a to give the monomer
6c. In case of 5b the reaction time was only 19 h in contrast to 72 h for 5a and 6c
which might have been the reason for the lower yield of 5b. Finally, reaction of
dimesitylboronfluoride with the aryllithium derivatives of 5a and 5b afforded the
monomers 6a and 6b, respectively.179 Polymerization of the monomers 6a-c was
achieved by standard Yamamoto coupling reaction181 with an in situ generated
zerovalent nickel complex as catalyst to give P1, P2 and P3 in acceptable yields
(Scheme 1b).170
Scheme 1b. Polymerization of the monomers 6a-c to give P1-P3.
i) Zn powder, NiCl2, 2,2‟-bipyridyl, PPh3, N,N-dimethylacetamide, 70 °C, 3 d
The 2,7-linked polymers P1 and P3 are only slightly soluble in chloroform,
dichloromethane and THF, whereas the 3,6-linked polymer P2 is more soluble in
these solvents due to its more flexible polymer backbone.
Gel permeation chromatography (GPC) vs. polystyrene standards performed in
THF at 35 °C indicated an average molecular weight of 2300 Da ( = 2100 Da,
PDI = 1.1) for P1, = 6000 Da ( = 4900 Da, PDI = 1.2) for P2 and = 1900
Da ( = 1700 Da, PDI = 1.1) for P3 corresponding to a degree of polymerization of
w = 4,12 and 5, respectively (Table 2).

30
Table 2. GPC measurements in THF at 35 °C.
/Da /Da PDI w
P1 2300 (4000)a 2100 (2300)a 1.1 (1.8)a 4 (8)a
P2 6000 4900 1.2 12
P3 1900 1700 1.1 5
a numbers in brackets correspond to a measurement in 1,2,4-trichlorobenzene at 135 °C performed by S. Seiwald from the group of Prof. K. Müllen, MPI für Polymerforschung, Mainz
The higher of P2 compared to the ‟s of the 2,7-linked polymers P1 and P3
can possibly be attributed to the better solubility of P2 thus allowing the
polymerization reaction to continue even for chains of higher molar mass. Moreover,
it is not possible to obtain a clear solution of P1 and P3 in THF, that is, chains of
higher molar mass might be removed by filtration before injection into the GPC-
columns. This explanation is substantiated by an additional GPC measurement of P1
in 1,2,4-trichlorobenzene at 135 °C which gave an of 4000 Da with a higher PDI
of 1.8. In the latter solvent P1 is more soluble so that chains of higher molar mass are
also injected into the GPC-columns which consequently leads to a broader molecular
weight distribution. Leclerc et al.161 reported an value of 2600 Da (PDI = 1.9) for
poly[N-(2-ethylhexyl)-2,7-carbazole] measured in THF which corresponds to about 9
repeating units. This polymer was obtained by polymerization of N-(2-ethylhexyl)-2,7-
dichlorocarbazole via standard Yamamoto coupling with Ni(1,5-cyclooctadiene)2 as
catalyst. The same reaction method was used by Fu and Bo182 for the polymerization
of N-octyl-2,7-dibromocarbazole to obtain an value of 6400 Da. Even higher
values were obtained for poly[N-(9‟-heptadecanyl)-2,7-carbazole], = 27000 Da,183
and for poly[N-(2-decyltetradecyl)-2,7-carbazole], = 39100 Da,184 using the
standard Yamamoto coupling reaction. This shows that high molecular weight 2,7-
linked polycarbazoles can be obtained depending on the substituent at the nitrogen
atom and the exact reaction conditions. For 3,6-linked polyalkylcarbazoles a high
molecular weight synthesis based on the standard Yamamoto coupling reaction was
developed to yield poly[N-(3,7-dimethyloctyl)-3,6-carbazole] with = 120 kDa using
a reverse order of adding reagents.185 In order to enhance the ‟s of P1-P3 one
would need to optimize the reaction conditions: For example, higher dilution could
31
avoid possible aggregation and precipitation of the resultant polymer chains.186
However, dilute solutions of 3,6- dichlorocarbazole could promote formation of
macrocycles.187 Lowering the reaction temperature could avoid decomposition of the
Ni(II)aryl complex which otherwise would result in termination of the polymerization
process.188 However, solubility decreases with decreasing temperature, too. Maybe
one also has to raise the NiCl2 : monomer ratio for small scale reactions (< 1 mmol of
monomer) or use Ni(1,5-cyclooctadiene)2 instead of generating the active Ni(0)
species in situ from NiCl2 and Zn, since Ni(1,5-cyclooctadiene)2 is mainly used for
this type of polymerization reactions in the literature. Using the dibromo instead of the
dichloro monomers would certainly give better results. To this end one has to modify
the synthesis of the monomers, which would include more synthetic steps, which in
turn is unfavourable for industrial applications. Because optimization of the
polymerization reaction was not the main goal, none of the above mentioned
possibilities was pursued to increase the ‟s of the polymers P1-P3.
MALDI-TOF spectra revealed that not all polymer chains are terminated by
hydrogen atoms. Chains of P1 are mainly terminated by hydrogen atoms. However,
there are additional small mass peaks which can be assigned to chains terminated at
one end by one chlorine atom. For P2 only hydrogen-terminated chains are found.
P3 consists of a mixture of chains terminated by one or two chlorine atoms and
chains without chlorine atoms. These findings can be an indication of the type of
polymerization mechanism taking place here: If the monomer reacts via an
intermolecular catalyst-transfer condensation polymerization (CTCP) mechanism
both ends of the chains should be terminated either by hydrogen or by chlorine
atoms. If they react via an intramolecular CTCP mechanism one end should be
terminated by a chlorine atom and the other end by a hydrogen atom. Therefore one
can conclude that the polymerization of P1 and P2 proceeds mainly via the
intermolecular mechanism whereas the polymerization of P3 proceeds via inter- and
intramolecular CTCP mechanisms. On the first sight, this is in contrast to the very
narrow molecular weight distribution (PDI = 1.1 for P1 and P3 and 1.2 for P2)
observed for the polymers, since the intermolecular CTCP mechanism is expected to
result in a broader molecular weight distribution as opposed to the intramolecular
mechanism.188 However, as stated above, chains of higher molecular weight might

32
be removed by filtration before injection into the GPC-columns and thus the real
molecular weight distribution might be broader at least for P1 and P3.
NMR spectra of the polymers were recorded in chloroform and in THF. Although in
the literature discrete doublets and singlets are found for carbazole protons of high
molecular weight polycarbazoles only broad signals were observed for P1-P3. This is
due to the short polymer chains investigated in the present work which leads to
different chemical shifts for each monomer unit and, thus, to a distribution of
overlapping signals. Due to their low solubility 13C NMR spectra of P1 and P3 could
not be recorded.
2.3 Absorption and Fluorescence Spectroscopy
Absorption Spectra
Absorption and emission spectra of P1-P3 in solution and solid state are displayed
in Figures 9a and 9b, respectively. Absorption maxima are listed in Tables 3
(solution) and 5 (solid state).
(a) (b)
250 300 350 400 450 500 550 600 650 7000,0
0,2
0,4
0,6
0,8
1,0
0,0
0,2
0,4
0,6
0,8
1,0
40000 30000 20000
ab
so
rba
nce
/a
.u.
/nm
P1
P2
P3
/cm-1~
em
issio
n in
ten
sity
/a.u
.
250 300 350 400 450 500 550 600 650 7000,0
0,2
0,4
0,6
0,8
1,0
0,0
0,2
0,4
0,6
0,8
1,0
40000 30000 20000
ab
so
rba
nce
/a
.u.
/nm
em
issio
n in
ten
sity
/a.u
.
/cm-1
P1
P2
P3
~
Figure 9. Absorption spectra (normalized) and emission spectra (normalized to the intensity of the lowest energy absorption band) of dichloromethane solutions of P1-3 (a) and of thin
films spin coated from dichloromethane solutions onto quartz plates (b).

33
The absorption spectra of 2,7-linked polymers P1 and P3 measured in
dichloromethane are similar to each other (Figure 9a) and to other 2,7-linked N-alkyl-
and N-arylcarbazole polymers.162-164,183 This fact nicely demonstrates that the N-
substituents only weakly interact with the polymer backbone. Nevertheless, the
absorption band of the triarylborane moiety cannot be seen, since its molar extinction
coefficient is too small: The absorption maximum of dimesityl(2,6-
dimethylphenyl)borane dissolved in dichloromethane is at = 327 nm (spectrum not
displayed) with = 13300 M-1cm-1. The molar extinction coefficient of P1 dissolved in
dichloromethane is ca. 19100 M-1cm-1 at = 327 nm. Overlaying both spectra shows
that the absorption band of the triarylborane compound is completely covered by the
band of P1. The absorption edge of triphenylmethane is situated at 280 nm.189
Absorption spectra were also recorded of solutions of P1 and P3 in cyclohexane, tert-
butyl-methylether, ethylacetate, 1,4-dioxane and THF. Only minor variations of the
shape of the absorption bands with the solvent were observed, which can be
explained by the fact that different solvents dissolve different weight fractions of the
polymers (the solutions had to be filtered before measurement due to the low
solubility in these solvents). This interpretation is supported by the work by Iraqi et
al.163 and by the fact, that there is no systematic solvatochromism vs. any solvent
polarity function.
Much in contrast, the absorption spectrum of 3,6-linked polymer P2 in
dichloromethane deviates from those of the pentamer and polymer of 3,6-linked N-
alkyl-carbazole158 because it shows an additional low energy band at 365 nm in
dichloromethane arising from a charge transfer (CT) from the carbazole donor to the
triarylborane acceptor. This process causes a reversal of the dipole moment. Thus, a
pronounced negative solvatochromism is observed in the absorption spectra (Figure
10a) and a positive solvatochromism is found in the emission spectra of P2 (Figure
10b). This phenomenon has already been discussed for the monomer analogue of
P2.179

34
(a) (b)
250 300 350 400 450 5000,0
0,2
0,4
0,6
0,8
1,0
27000 26000 25000
ab
so
rba
nce
/a
.u.
/nm
C6H
12
MTBE
EA
dioxane
THF
CH2Cl
2
BuCN
DMAc
DMSO
/cm-1~
250 300 350 400 450 500 550 600 650 7000,0
0,2
0,4
0,6
0,8
1,0
40000 30000 20000
em
issio
n in
ten
sity /a
.u.
/nm
C6H
12
MTBE
EA
dioxane
THF
CH2Cl
2
BuCN
DMAc
DMSO
/cm-1~
Figure 10. Normalized absorption spectra (a) and normalized emission spectra (b) of P2 in different solvents. MTBE: tert-butyl-methylether; EA: ethylacetate; BuCN: butyronitrile; DMAc: N,N-dimethylacetamide.
Emission Spectra
Absorption and emission maxima abs and em, Stokes shifts, fluorescence quantum
yields f, lifetimes , and rate constants kf and knr measured in dichloromethane are
listed in Table 3.
Table 3. Absorption and emission maxima abs and em, Stokes shifts, fluorescence
quantum yields f, lifetimes and rate constants kf and knr measured in dichloromethane.
abs /nm em /nm Stokes shift /cm-1 f /ns kf /108 s-1 knr /108 s-1
P1 261, 353 407 3800 0.80 0.96 8.3 2.1
P2 257, 310, 365 484 6700 0.54 8.5 0.64 0.54
P3 267, 369 410 2800 0.85 0.77 11 1.9
Emission spectra of P1 and P3 are very similar concerning em (407 and 410 nm in
dichloromethane) and the shape of the emission bands (Figure 9a). They are also
very similar to other 2,7-linked N-alkyl and N-aryl-carbazole polymers reported in the
literature.162,161,163 The Stokes shifts are somewhat higher in energy than that of

35
already known 2,7-polycarbazoles (poly[N-(2-ethylhexyl)-2,7-carbazole]: 2300 cm-
1)190 with that of P1 being also higher than that of P3 (3800 cm-1 vs. 2800 cm-1). In
going from cyclohexane to dichloromethane both polymers show small
solvatochromic shifts of about 400 cm-1 (P1) and 700 cm-1 (P3). Therefore,
fluorescence quantum yields f and lifetimes were measured in dichloromethane
only. Rate constants kf and knr are calculated according to eqs. 11 and 12, which can
be derived from combination of eqs. 9 and 10.
(9)
(10)
(11)
(12)
The kf and knr values of P1 are about half of those of poly[N-octyl-2,7-carbazole] (kf
= 17 × 108 s-1; knr = 4.3 × 10⁸ s-1, = 0.48 ns, f = 0.80) while the lifetime is doubled
and the quantum yield is the same.190 The f, , kf and knr values of P3 are similar to
the corresponding values of P1 (Table 3). All these similarities of P1 and P3 and
other 2,7-linked polycarbazoles and the lack of solvatochromic fluorescence of P1
clearly show that the triarylborane substituent does not influence the fluorescence
properties in this type of polymer. Thus, one can conclude that fluorescence in P1
and P3 emanates from the polymer backbone.
Unlike P1 and P3, P2 shows strong solvatochromic fluorescence arising from a low
lying CT state. The energy shift between the emission maxima in cyclohexane and
DMSO is 3800 cm-1. In Table 4 results of time resolved fluorescence measurements
of P2 are listed for solvents of increasing polarity.

36
Table 4. Emission maxima em, Stokes shifts, fluorescence quantum yields f, lifetimes
and rate constants kf and knr of P2 measured in different solvents.
solvent em
/nm
Stokes shift
/cm-1
f
/ns
kf
/108 s-1
knr
/108 s-1
cyclohexane 432 2700 0.37 3.2 1.2 2.0
MTBE 459 4700 0.48 5.3 0.91 0.98
ethylacetate 475 5900 0.44 6.4 0.69 0.88
1,4-dioxane 453 4500 0.62 5.3 1.2 0.72
THF 475 5900 0.54 7.3 0.74 0.63
dichloromethane 484 6700 0.54 8.5 0.64 0.54
butyronitrile 501 7500 0.40 9.9 0.40 0.61
DMAc 509 7800 0.51 13 0.39 0.38
DMSO 514 8100 0.75 – – –
MTBE: tert-butyl-methylether; DMAc: N,N-dimethylacetamide
Except for the values obtained in 1,4-dioxane, emission maxima, band widths and
Stokes shifts increase with increasing solvent polarity as expected for CT transitions.
While the lifetimes of the CT state increase with decreasing fluorescence energy, the
quantum yields do not reveal a clear trend. As expected from the Strickler-Berg
equation191 kf should be proportional to the cubic fluorescence energy. While this is
not exactly fulfilled with the present data set, at least an increase of kf with the
fluorescence energy is clearly visible. According to the gap rule of Siebrand192 the
nonradiative rate constant knr should increase with decreasing fluorescence energy.
However, the opposite trend is observed. This unusual trend together with the same
solvatochromic shifts and somewhat smaller Stokes shifts have also been observed
for the monomer analogue,179 but an explanation for the violation of Siebrand‟s gap
rule is still missing. In comparison to the monomer, lifetimes of P2 are about twice as
high and kf values are about one third of the values of the monomer, whereas knr
values are the same for monomer and polymer. Therefore, the quantum yields of the
polymer are lower than those of the monomer. Thus, counterintuitively, it is not any
additional nonradiative pathway which leads to the decreased fluorescence quantum

37
yield of the polymer compared to the monomer but the smaller fluorescence rate
constant.
Compared to the emission spectra of 3,6-linked N-alkyl-carbazole polymers, which
emit at em = 426 nm in dichloromethane,193 the emission band of P2 is much
broader and is shifted to lower energy (em = 484 nm in dichloromethane) because of
its low lying CT state. The Stokes shift of 6700 cm-1 in dichloromethane is somewhat
smaller than that of N-alkyl-3,6-carbazole polymers.185,187,193 Interestingly,
fluorescence quantum yields are surprisingly high compared for example to poly-[N-
decyl-3,6-carbazole] with f = 0.15 in THF185 and other 3,6-linked N-alkylcarbazole
polymers with f = 0.04 - 0.06 in dichloromethane.193 The reason for the enhanced
quantum yield obviously is the CT character of the fluorescing state. The improved
quantum yield makes P2 a promising candidate as light emitting polymer for the
application in OLEDs.
The most interesting aspect about P1 and P2 is their absorption and emission
properties being completely different (Figure 9a). The fact, that P1 has a higher
fluorescence quantum yield than P2 was to be expected on the basis of the
properties of other poly-N-alkyl-carbazoles. The higher kf value compared to the knr
value of P1 is in accordance with its higher quantum yield. However, polymer P2
shows negative solvatochromic absorption and positive solvatochromic fluorescence
resulting from a low lying CT state. Because the same characteristics are found for
the monomer analogue179 we conclude that the fluorescent CT state in P2 is localized
within the monomer site. Much in contrast, no solvatochromic behaviour is observed
for P1 which fluoresces from a delocalized state of the polymer backbone (Sbackbone).
This is because P1 forms a true conjugated (poly-para-phenylene type) polymer with
low-lying delocalized states while P2 is a polybenzidine with conjugation being
interrupted by the nitrogen atoms. Thus, the state located at the polymer backbone
(Sbackbone) will be high-lying in P2 compared to the localized CT state (Figure 11).

38
Figure 11. Qualitative energy diagram of ground and excited electronic states of P1, P2 and their monomer analogue. Gap energies are taken from the onsets of the absorption spectra of cyclohexane solutions.
While no pronounced solvent effect was visible in P1, a solvent effect was
observed for a 2,7-linked polycarbazole substituted by 4-dioctylamino-benzene at the
nitrogen atom which shows dual fluorescence in polar solvents.164 The dual
fluorescence possibly arises from a fluorescent delocalized state of the polymer
backbone and from a fluorescent intramolecular CT state between the
dioctylaminophenyl substituent and the carbazole moiety. Interestingly, the emission
maximum of the supposed CT emission band and the Stokes shifts between the
absorption maximum and the CT emission band in THF and dichloromethane are
quite close to those observed for P2 in these solvents. In case of P1 such a CT state
might be higher in energy than the delocalized state of the polymer backbone. Thus
no solvent effect is observed for the fluorescence of P1.
Thin Films
Absorption and emission bands recorded of thin films of the polymers cast on
quartz plates are slightly red shifted except for the solid state emission of P2 which
reveals an emission maximum of em = 461 nm which is similar to the one in tert-
butyl-methylether (459 nm) (Figure 9b, Tables 3 and 5). This indicates that the
polymer itself provides a relatively apolar environment. In general, the fluorescence
signals are not much broader in the solid state than in solution which is also
favourable for OLED applications. Optical band gaps Egopt determined from the
onsets of the absorption bands are 3.02, 2.92 and 2.97 eV for P1, P2 and P3. These
values fit well into the range of 2.89-3.2 eV observed for other 2,7-linked
polycarbazoles depending on the conjugation length.161,164,166,183-184 In contrast, the

39
band gap of P2 is considerably smaller compared to other 3,6-linked polycarbazoles
which have Egopt values of about 3.2 eV165-166,194. This is again due to the low lying CT
state.
Table 5. Absorption and emission maxima abs and em, optical band gaps Egopt and
fluorescence quantum yields f of powders and films.
abs(film) /nm em(film) /nm Egopt(film) /eV f(powder) f(film)
P1 260, 363 418 3.02 0.21 0.09
P2 316, 379 461 2.92 0.28 0.15
P3 266, 373 422 2.97 0.23 0.25
Emission quantum yield measurements of powders of P1, P2 and P3 gave values
of 0.21, 0.28 and 0.23, respectively, whereas quantum yields of the films (drop cast)
are 0.09, 0.15 and 0.25 (Table 5). The latter values depend on the film quality and
might be different for spin coated films. Nevertheless, solid state quantum efficiencies
between 0.20 and 0.30 are reasonably high compared to other solid state quantum
efficiencies of conjugated carbazole polymers.164
2.4 Cyclic Voltammetry
Cyclic voltammetric measurements were carried out in acetonitrile
(MeCN)/tetrabutylammonium perchlorate (TBAP) with the polymer being drop cast
onto a Pt-working electrode from a dichloromethane solution. Redox potentials were
referenced vs. ferrocene (Fc/Fc+) and results are listed in Tables 6 and 7.
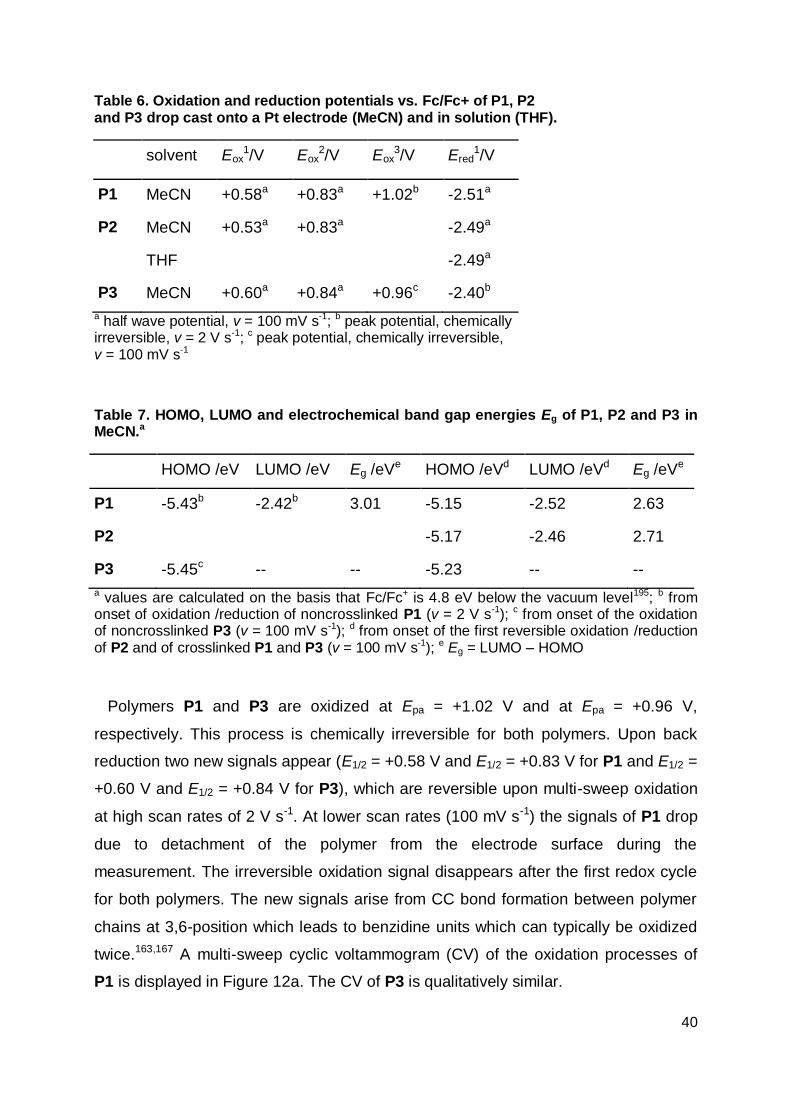
40
Table 6. Oxidation and reduction potentials vs. Fc/Fc+ of P1, P2 and P3 drop cast onto a Pt electrode (MeCN) and in solution (THF).
solvent Eox1/V Eox
2/V Eox3/V Ered
1/V
P1 MeCN +0.58a +0.83a +1.02b -2.51a
P2 MeCN +0.53a +0.83a -2.49a
THF -2.49a
P3 MeCN +0.60a +0.84a +0.96c -2.40b
a half wave potential, v = 100 mV s-1; b peak potential, chemically irreversible, v = 2 V s-1; c peak potential, chemically irreversible, v = 100 mV s-1
Table 7. HOMO, LUMO and electrochemical band gap energies Eg of P1, P2 and P3 in MeCN.a
HOMO /eV LUMO /eV Eg /eVe HOMO /eVd LUMO /eVd Eg /eVe
P1 -5.43b -2.42b 3.01 -5.15 -2.52 2.63
P2 -5.17 -2.46 2.71
P3 -5.45c -- -- -5.23 -- --
a values are calculated on the basis that Fc/Fc+ is 4.8 eV below the vacuum level195; b from onset of oxidation /reduction of noncrosslinked P1 (v = 2 V s-1); c from onset of the oxidation of noncrosslinked P3 (v = 100 mV s-1); d from onset of the first reversible oxidation /reduction of P2 and of crosslinked P1 and P3 (v = 100 mV s-1); e Eg = LUMO – HOMO
Polymers P1 and P3 are oxidized at Epa = +1.02 V and at Epa = +0.96 V,
respectively. This process is chemically irreversible for both polymers. Upon back
reduction two new signals appear (E1/2 = +0.58 V and E1/2 = +0.83 V for P1 and E1/2 =
+0.60 V and E1/2 = +0.84 V for P3), which are reversible upon multi-sweep oxidation
at high scan rates of 2 V s-1. At lower scan rates (100 mV s-1) the signals of P1 drop
due to detachment of the polymer from the electrode surface during the
measurement. The irreversible oxidation signal disappears after the first redox cycle
for both polymers. The new signals arise from CC bond formation between polymer
chains at 3,6-position which leads to benzidine units which can typically be oxidized
twice.163,167 A multi-sweep cyclic voltammogram (CV) of the oxidation processes of
P1 is displayed in Figure 12a. The CV of P3 is qualitatively similar.

41
(a) (b)
300 400 500 600 700 800 900 1000-20
0
20
40
60
80 first cycle
subsequent cycles
I /
A
E /mV
-2400 -1800 -1200 -600 0 600 1200
-20
-16
-12
-8
-4
0
4
I /
A
E /mV
Figure 12. (a) Multi-sweep CV of P1 drop cast onto a Pt-working electrode in MeCN/TBAP, v = 2 V s-1; (b) CV of P2 drop cast onto a Pt-working electrode in MeCN/TBAP, v = 100 mV s-1.
Two reversible oxidation signals similar to the reversible oxidation signals of P1
and P3 are also observed for P2 (E1/2 = +0.53 V and E1/2 = +0.83 V) where the
benzidine units are already present in the polymer backbone (Figure 12b). The
reduction of P2 is at E1/2 = -2.49 V. However, the backoxidation peak is much smaller
than the reduction peak and both peaks drop from one cycle to the next due to
dissolution of the negatively charged polymer (Figure 13a). Therefore, a CV of P2
dissolved in THF/TBAP was recorded additionally. This CV shows a fully reversible
signal at E1/2 = -2.49 V (Figure 13b, Table 6).
(a) (b)
-2800 -2400 -2000 -1600 -1200 -800 -400
-40
-30
-20
-10
0
10
I /
A
E /mV
-2800 -2400 -2000 -1600 -1200 -800 -400-3
-2
-1
0
1
2
I /
A
E /mV
Figure 13. (a) Multi-sweep CV of P2 drop cast onto a Pt-working electrode in MeCN/TBAP, v = 100 mV s-1; (b) CV of P2 dissolved in THF/TBAP, v = 100 mV s-1.
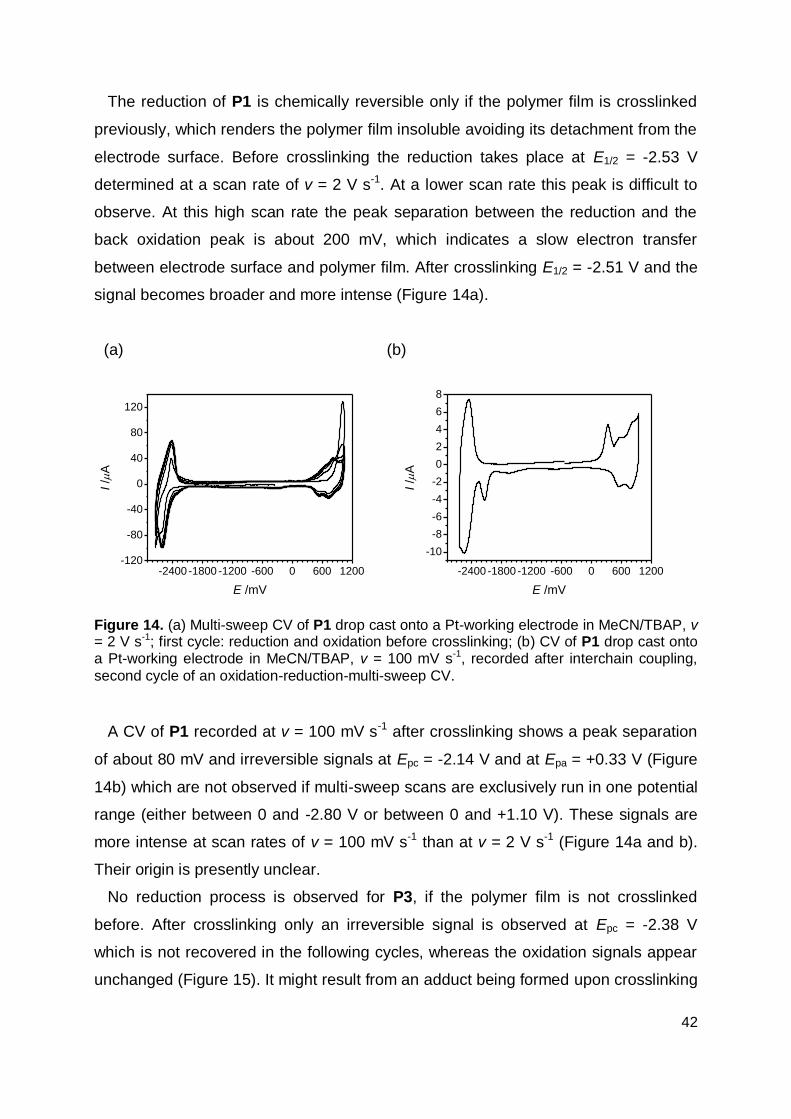
42
The reduction of P1 is chemically reversible only if the polymer film is crosslinked
previously, which renders the polymer film insoluble avoiding its detachment from the
electrode surface. Before crosslinking the reduction takes place at E1/2 = -2.53 V
determined at a scan rate of v = 2 V s-1. At a lower scan rate this peak is difficult to
observe. At this high scan rate the peak separation between the reduction and the
back oxidation peak is about 200 mV, which indicates a slow electron transfer
between electrode surface and polymer film. After crosslinking E1/2 = -2.51 V and the
signal becomes broader and more intense (Figure 14a).
(a) (b)
-2400 -1800 -1200 -600 0 600 1200-120
-80
-40
0
40
80
120
I /
A
E /mV
-2400 -1800 -1200 -600 0 600 1200
-10
-8
-6
-4
-2
0
2
4
6
8
I /
A
E /mV
DN30_7als Film aus DCM,
MeCN/TBAP 0.1 M,
Pt 2mm, normale Zelle,
100 mV/s,
2. Zyklus von verknüpftem Polymer
06.08.08
Figure 14. (a) Multi-sweep CV of P1 drop cast onto a Pt-working electrode in MeCN/TBAP, v = 2 V s-1; first cycle: reduction and oxidation before crosslinking; (b) CV of P1 drop cast onto a Pt-working electrode in MeCN/TBAP, v = 100 mV s-1, recorded after interchain coupling,
second cycle of an oxidation-reduction-multi-sweep CV.
A CV of P1 recorded at v = 100 mV s-1 after crosslinking shows a peak separation
of about 80 mV and irreversible signals at Epc = -2.14 V and at Epa = +0.33 V (Figure
14b) which are not observed if multi-sweep scans are exclusively run in one potential
range (either between 0 and -2.80 V or between 0 and +1.10 V). These signals are
more intense at scan rates of v = 100 mV s-1 than at v = 2 V s-1 (Figure 14a and b).
Their origin is presently unclear.
No reduction process is observed for P3, if the polymer film is not crosslinked
before. After crosslinking only an irreversible signal is observed at Epc = -2.38 V
which is not recovered in the following cycles, whereas the oxidation signals appear
unchanged (Figure 15). It might result from an adduct being formed upon crosslinking

43
of the 2,7-linked carbazole backbone. Similar to P1 there are irreversible signals at
Epc = -2.14 V and at Epa = +0.34 V which are very small if multi-sweep scans are
exclusively run in one potential range (inset of Figure 15).
-2400 -1800 -1200 -600 0 600 1200
-8
-4
0
4
8
12
0 300 600 900-4
-2
0
2
4
6
I /
A
E /mV
I /
A
E /mV
Figure 15. Multi-sweep CV of P3 drop cast onto a Pt-working electrode in MeCN/TBAP, v =
100 mV s-1, recorded after interchain-coupling; inset: two oxidation cycles after interchain-coupling, v = 100 mV s-1.
Since no reversible reduction process is observed for P3, whereas reversible
reductions at E1/2 = -2.59 V vs. Fc/Fc+ (0.7 mM in THF/TBAP 0.3 M, v = 250 mV s-1,
Pt-working electrode) and at E1/2 = -2.48 V vs. Fc/Fc+ (0.6 mM in THF/TBAP 0.3 M, v
= 100 mV s-1, Pt-working electrode) are observed for dimesityl(2,6-
dimethylphenyl)borane and for the monomer analogue, the reduction processes of
P1 and P2 can be ascribed to the reduction of the borane moiety. The reduction of
the carbazole moiety is not seen for any of the three polymers as it seems to be the
case for most polycarbazoles in the literature.183 Only Zotti and coworker167 reported
the reduction of poly(N-octyl-2,7-carbazolediyl) at Ered = -2.68 V vs. Ag/0.1 M AgClO4
in MeCN and Iraqi and coworker196 found a reduction potential of Ered = -2.1 V vs.
Ag/AgNO3 for a drop cast polymer film of poly[3,6-dicyano-N-(2-hexyldecyl)-
carbazole-2,7-diyl].
HOMO and LUMO energies determined from the onset of the first reversible
oxidation and reduction processes of P2 and of the noncrosslinked and crosslinked
polymers P1 and P3 and the corresponding energy band gaps Eg are listed in Table
7. The HOMO energies of noncrosslinked P1 and P3 are -5.43 eV and -5.45 eV,
respectively. HOMO energies of other 2,7-linked polycarbazoles are also around -5.4

44
eV163,182,197. Crosslinking raises the HOMO levels of P1 and P3 resulting in quite
similar HOMO energies for all three polymers (-5.15 eV (P1), -5.17 eV (P2), -5.23 eV
(P3)) which, thus, lie in the range of those of 3,6-linked polycarbazoles (-5.0 eV165, -
5.1 eV193). The lowering of the HOMO energies can be explained by the donating
abilities of the nitrogen atoms arranged para to each other after crosslinking. The
LUMO energy of P1 is only slightly lowered from -2.42 eV before crosslinking to -2.52
eV after crosslinking which has to do with the broadening of the peak after
crosslinking. Note that the half wave potentials of the reduction of P2 and of
noncrosslinked and crosslinked P1 are all more or less the same, which means, that
the reduction is not much affected by the type of carbazole connection and is located
at the borane moiety. The LUMO energy of P3 could not be determined since the
origin of the irreversible reduction signal after crosslinking is unclear and might result
from an adduct. Accordingly, the electrochemical band gap energy Eg of P3
calculated as the difference between HOMO and LUMO energy could not be
determined.50 The band gap energies for P1, noncrosslinked and crosslinked, and for
P2 are Eg = 3.01, 2.63 and 2.71 eV, respectively.
Absorption spectra of polymer films of P1 and P3 on a Pt-working electrode in
MeCN/TBAP before and after crosslinking were recorded additionally, which clearly
reflect the narrowing of Eg upon crosslinking. Unfortunately, the spectra were of a
rather poor quality so that optical band gap energies and shifts of absorption maxima
could not be derived.
Comparison of the electrochemical band gap energies of P2 and noncrosslinked
P1 with the optical band gap energies extracted from the solid state absorption
spectra of thin films on quartz plates (Table 5) reveal nice agreement for P1 (Eg =
3.01 eV and Egopt = 3.02 eV) and a major deviation for P2 (Eg = 2.71 eV and Eg
opt =
2.92 eV). However, it has to be pointed out, that quite some of the HOMO and LUMO
values are rather rough estimates, since the shape of the signals is distorted by
adsorption (sharp signal in Figure 12b), solvent decomposition (steep signal raise,
Figure 14a) and polymer interchain interactions (signal broadening, Figure 14a),
which considerably affects the determination of the onset potentials. However, in
order to make HOMO and LUMO values comparable to literature values which were
also determined from onset potentials inaccuracies due to obscure onset potentials
were accepted.

45
2.5 Single Layer OLED
A single layer OLED was constructed with P2 as active layer in order to prove its
electroluminescent properties: A solution of P2 (6 mg/mL) in chloroform/toluene
(25:1) was spin coated onto ITO coated glass plates and Al contacts (90 nm) were
deposited on top as illustrated in Figure 16b. The electroluminescence spectrum was
recorded at an applied voltage of 8.5 V (Figure 16a). The emission maximum is at
= 463 nm, which is only a 2 nm red-shift compared to that of the photoluminescence
spectrum of the polymer film (Table 5). The CIE coordinates are (0.17, 0.21). R. Liu
and coworkers got CIE coordinates of (0.17, 0.14)198 for a single layer OLED of 2,7-
fluorene-co-3,9-carbazole copolymer which indicates a more saturated colour.
Electroluminescence spectra of P1 and P3 could not be recorded reproducibly. This
is possibly caused by their low solubility which results in very thin polymer layers.
(a) (b)
250 300 350 400 450 500 550 600 650 7000,0
0,2
0,4
0,6
0,8
1,0
40000 30000 20000
~ /cm
-1
/nm
em
issio
n in
ten
sity /
a.u
.
(c)
Figure 16. (a) Electroluminescence spectrum of the device ITO/P2/Al; (b) CIE 1931 (x,y)
chromaticity diagram199; wavelengths in nm are marked in blue; (c) lateral and top view of a single layer OLED of P2.
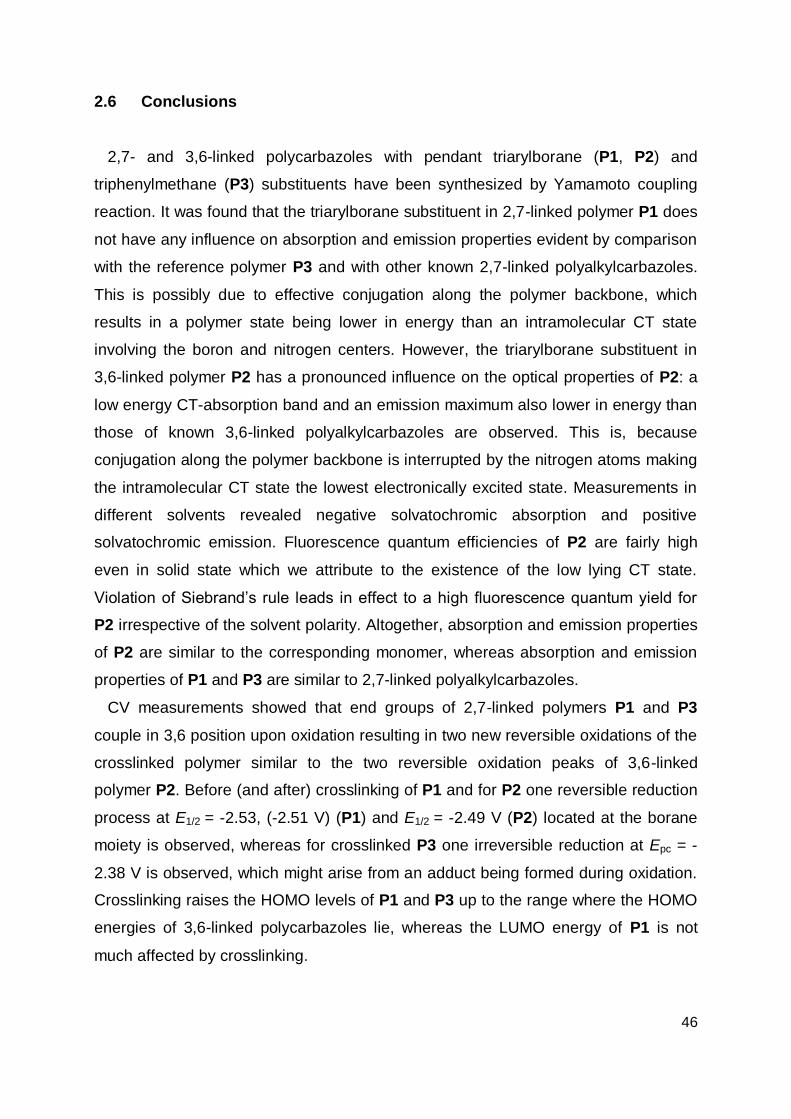
46
2.6 Conclusions
2,7- and 3,6-linked polycarbazoles with pendant triarylborane (P1, P2) and
triphenylmethane (P3) substituents have been synthesized by Yamamoto coupling
reaction. It was found that the triarylborane substituent in 2,7-linked polymer P1 does
not have any influence on absorption and emission properties evident by comparison
with the reference polymer P3 and with other known 2,7-linked polyalkylcarbazoles.
This is possibly due to effective conjugation along the polymer backbone, which
results in a polymer state being lower in energy than an intramolecular CT state
involving the boron and nitrogen centers. However, the triarylborane substituent in
3,6-linked polymer P2 has a pronounced influence on the optical properties of P2: a
low energy CT-absorption band and an emission maximum also lower in energy than
those of known 3,6-linked polyalkylcarbazoles are observed. This is, because
conjugation along the polymer backbone is interrupted by the nitrogen atoms making
the intramolecular CT state the lowest electronically excited state. Measurements in
different solvents revealed negative solvatochromic absorption and positive
solvatochromic emission. Fluorescence quantum efficiencies of P2 are fairly high
even in solid state which we attribute to the existence of the low lying CT state.
Violation of Siebrand‟s rule leads in effect to a high fluorescence quantum yield for
P2 irrespective of the solvent polarity. Altogether, absorption and emission properties
of P2 are similar to the corresponding monomer, whereas absorption and emission
properties of P1 and P3 are similar to 2,7-linked polyalkylcarbazoles.
CV measurements showed that end groups of 2,7-linked polymers P1 and P3
couple in 3,6 position upon oxidation resulting in two new reversible oxidations of the
crosslinked polymer similar to the two reversible oxidation peaks of 3,6-linked
polymer P2. Before (and after) crosslinking of P1 and for P2 one reversible reduction
process at E1/2 = -2.53, (-2.51 V) (P1) and E1/2 = -2.49 V (P2) located at the borane
moiety is observed, whereas for crosslinked P3 one irreversible reduction at Epc = -
2.38 V is observed, which might arise from an adduct being formed during oxidation.
Crosslinking raises the HOMO levels of P1 and P3 up to the range where the HOMO
energies of 3,6-linked polycarbazoles lie, whereas the LUMO energy of P1 is not
much affected by crosslinking.

47
P2 seems to be a promising candidate for the application in OLEDs: It has an
average degree of polymerization of twelve monomer units, it is soluble in common
organic solvents, it consists of hole and electron transporting moieties and it is a blue
emitter with CIE coordinates of (0.17, 0.21) and with a reasonable high quantum yield
in solution and in solid state. Applications of P1 and P3 in organic electronic devices
were not possible due to their low solubilities in common organic solvents.

48
3 Low Band Gap Donor-Acceptor Conjugated Polymer
3.1 Introduction and Aim of the Project
The ultimate goal in preparing low band gap polymers is to achieve intrinsic metal-
like conductivity.200 Infinite delocalization along a polymer backbone would result in a
zero band gap. This is however hampered by the Peierls instability, i.e. the relaxation
of the delocalized electronic structure into a structure of alternating bond lengths.133
One approach to reduce the band gap is to construct D-A conjugated polymers, in
which the resonance structure D+=A- contributes to the electronic delocalization by
planarization of the polymer backbone (see also chapter 1.3).200 D-A conjugated
polysquaraines and polycroconaines prepared by Havinga et al.134 with optical band
gaps of 0.8 and 0.5 eV showed conductivities of 10-7 and 10-5 S cm-1 (four-point
measurement), respectively, which are however far from metallic conductivity. An
even smaller optical band gap of 0.36 eV was obtained for an electropolymerized
thiophene polymer,201 which however is unsuitable for solution processing. Low band
gap polymers are not only expected to be intrinsic conductors but they are also
supposed to show balanced ambipolar charge transport due to low injection barriers
into HOMO and LUMO levels. For example, a soluble spray-processable D-A
polymer with a band gap as small as 0.54 eV exhibited hole and electron mobilities of
1 × 10⁻³ and 6 × 10⁻⁴ in OFET devices.6 However, as explained in chapter 1.1 there
are several more important parameters apart from injection barriers that influence
charge transport in OFETs. Another feature of low band gap polymers is that they
usually absorb over a broad range of the solar spectrum up to the NIR. This has also
been exploited in BHJ solar cells: A PCE of up to 2.7 %202 was achieved for a
polymer with a band gap of 1.13 eV. Since most of the efficient electronic devices
incorporate polymers with band gaps above 1 eV and since no extraordinary
electrical properties were found for very small band gap polymers the search for
“zero” band gap polymers has ceased.
A low band gap monomer with attractive optical and redox properties, prepared and
investigated by Heckmann203-205, is the D-A molecule M (Chart 8): Upon absorption of
light an electron is transferred from the triarylamine donor to the
perchlorotriphenylmethyl (PCTM) radical acceptor, apparent from the intervalence
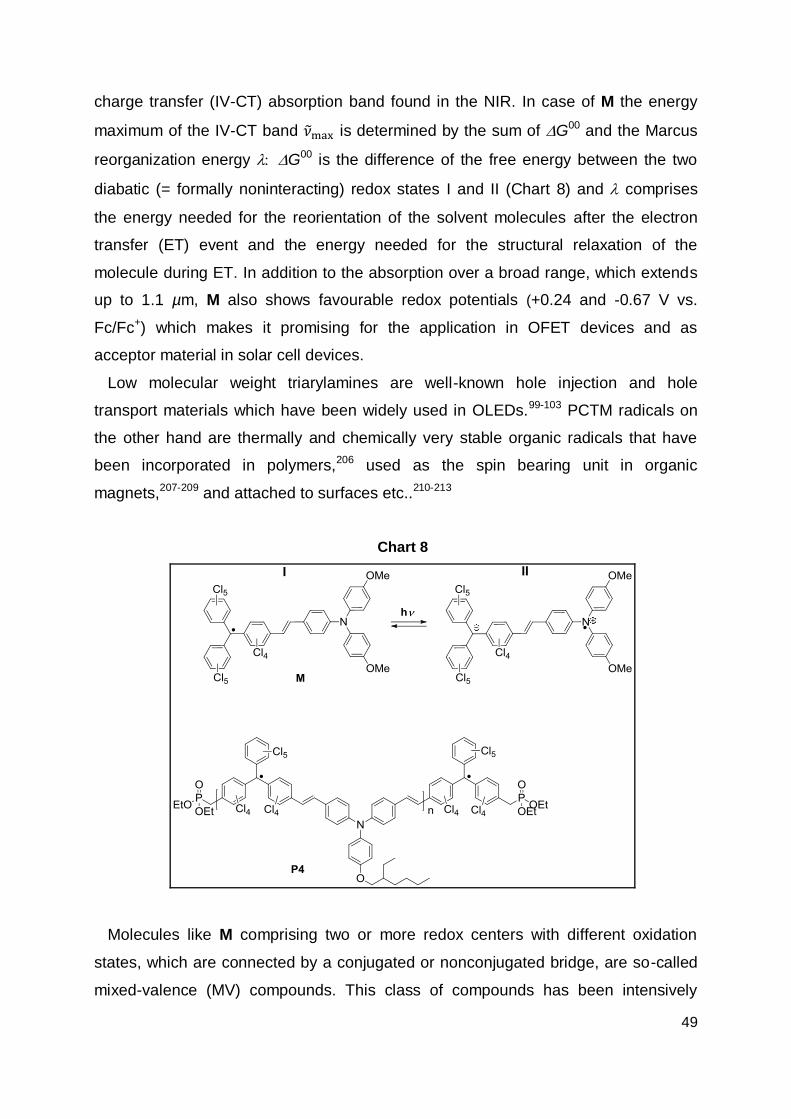
49
charge transfer (IV-CT) absorption band found in the NIR. In case of M the energy
maximum of the IV-CT band is determined by the sum of G00 and the Marcus
reorganization energy G00 is the difference of the free energy between the two
diabatic (= formally noninteracting) redox states I and II (Chart 8) and comprises
the energy needed for the reorientation of the solvent molecules after the electron
transfer (ET) event and the energy needed for the structural relaxation of the
molecule during ET. In addition to the absorption over a broad range, which extends
up to 1.1 µm, M also shows favourable redox potentials (+0.24 and -0.67 V vs.
Fc/Fc+) which makes it promising for the application in OFET devices and as
acceptor material in solar cell devices.
Low molecular weight triarylamines are well-known hole injection and hole
transport materials which have been widely used in OLEDs.99-103 PCTM radicals on
the other hand are thermally and chemically very stable organic radicals that have
been incorporated in polymers,206 used as the spin bearing unit in organic
magnets,207-209 and attached to surfaces etc..210-213
Chart 8
Molecules like M comprising two or more redox centers with different oxidation
states, which are connected by a conjugated or nonconjugated bridge, are so-called
mixed-valence (MV) compounds. This class of compounds has been intensively

50
studied during the past.214-227 However, MV compounds have rarely been used as
optoelectronic materials.228 Since the unsatisfactory film-forming properties of M
hampered the application in electronic devices, the aim of this project was to
synthesize the low band gap polyradical P4 and investigate its optical and
electrochemical properties as well as its applicability in OFET and BHJ solar cell
devices. Furthermore, ET issues should be investigated by transient absorption
spectroscopy in comparison to the monomeric MV compound.

51
3.2 Synthesis
The monomer M was synthesized according to the literature procedure205 except
for the radicalization step: Instead of KOtBu in DMSO an aqueous n-Bu4NOH solution
in THF was used for the deprotonation of the -H atom of the PCTM moiety, which
gives the radical M free of -H precursor impurities. The synthetic approach to P4 is
outlined in Scheme 2. Compound 10 is prepared in analogy to a procedure
established by Veciana et al.226. A Horner-Emmons reaction of 10 and dialdehyde
1292,229 in THF with KOtBu as base yields polymer 17. After the reaction has
completed the reaction mixture was acidified in order to protonate PCTM anions, that
may have formed, since the -H compounds are rather strong acids.230 In the 1H and
13C NMR spectra of polymer 17 no signals corresponding to the aldehyde group were
visible whereas signals corresponding to the –CH2P(O)(OEt)2 group could be
identified. The all-E configuration of the ethylene bridges was confirmed by IR, 1H
and 13C NMR spectroscopy: In the IR spectrum the band at 967 cm-1 indicates E-
configuration231 and in the 1H NMR spectrum no signals at around 6.6 ppm
corresponding to the Z-configuration of the vinylene bridges were visible.226
Furthermore, in the 13C NMR spectra no additional carbon signals, but exactly six
carbon signals corresponding to the 16 tertiary carbon atoms in the repeating unit (2
× 4C and 2 × 2C for the triarylamine moiety, and 2 × 2C for the ethylen bridges) were
found. This contrasts the findings of Veciana et al.226 who obtained a mixture of Z-
and E-isomers by applying the Horner-Emmons reaction to the monophosphonate
analogue of compound 10. In case of polymer 17 the formation of the Z-isomer might
well be suppressed due to steric hindrance.

52
Scheme 2. Synthesis of P4.
i) S2Cl2, AlCl3, SO2Cl2, reflux, 8 h; ii) N-bromosuccinimide, AIBN, CCl4, reflux, 60 h; iii) P(OEt)3, reflux, 2 h; iv) POCl3, DMF, 100 °C, 15 h; v) KOtBu, THF, r. t., 3 h; vi) 1. n-Bu4NOH, THF, r. t., 1 h; 2. p-chloranil, r. t., 21 h

53
Table 8. Ethylene bridge formation.
Previously to the successful preparation of polymer 17, it was attempted to form the
ethylene bridge by reaction of bis(phosphonium) salt 14 and triarylamine-
bis(aldehyde) 16229,232 in refluxing chloroform/aqueous sodium hydroxide (50 %). The
reaction failed in contrast to the successful ethylene bridge formation of M by the
reaction of monophosphonium salt 13 and p-bromobenzaldehyde under the same
experimental conditions (Table 8).203 This is possibly caused by the low solubility of
the expected polymer in this solvent mixture and the lower reactivity of the donor-
substituted aldehyde functionality in 16 as compared to the electron-deficient p-
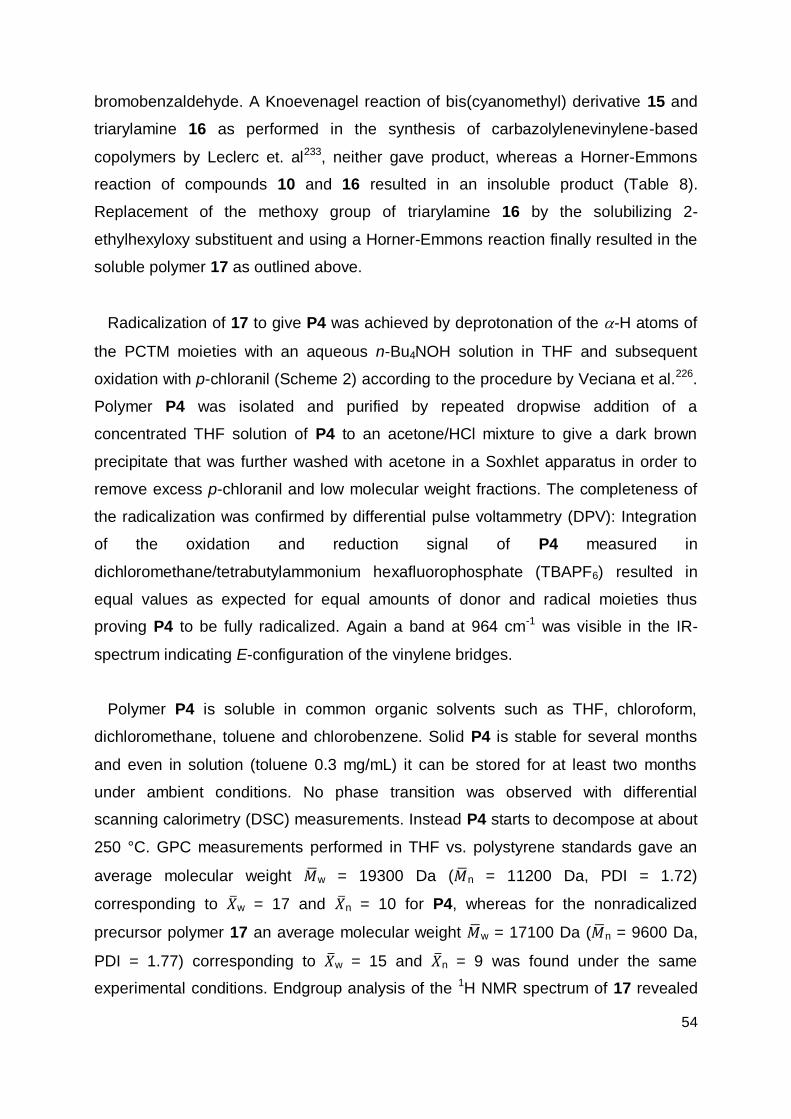
54
bromobenzaldehyde. A Knoevenagel reaction of bis(cyanomethyl) derivative 15 and
triarylamine 16 as performed in the synthesis of carbazolylenevinylene-based
copolymers by Leclerc et. al233, neither gave product, whereas a Horner-Emmons
reaction of compounds 10 and 16 resulted in an insoluble product (Table 8).
Replacement of the methoxy group of triarylamine 16 by the solubilizing 2-
ethylhexyloxy substituent and using a Horner-Emmons reaction finally resulted in the
soluble polymer 17 as outlined above.
Radicalization of 17 to give P4 was achieved by deprotonation of the -H atoms of
the PCTM moieties with an aqueous n-Bu4NOH solution in THF and subsequent
oxidation with p-chloranil (Scheme 2) according to the procedure by Veciana et al.226.
Polymer P4 was isolated and purified by repeated dropwise addition of a
concentrated THF solution of P4 to an acetone/HCl mixture to give a dark brown
precipitate that was further washed with acetone in a Soxhlet apparatus in order to
remove excess p-chloranil and low molecular weight fractions. The completeness of
the radicalization was confirmed by differential pulse voltammetry (DPV): Integration
of the oxidation and reduction signal of P4 measured in
dichloromethane/tetrabutylammonium hexafluorophosphate (TBAPF6) resulted in
equal values as expected for equal amounts of donor and radical moieties thus
proving P4 to be fully radicalized. Again a band at 964 cm-1 was visible in the IR-
spectrum indicating E-configuration of the vinylene bridges.
Polymer P4 is soluble in common organic solvents such as THF, chloroform,
dichloromethane, toluene and chlorobenzene. Solid P4 is stable for several months
and even in solution (toluene 0.3 mg/mL) it can be stored for at least two months
under ambient conditions. No phase transition was observed with differential
scanning calorimetry (DSC) measurements. Instead P4 starts to decompose at about
250 °C. GPC measurements performed in THF vs. polystyrene standards gave an
average molecular weight w = 19300 Da ( n = 11200 Da, PDI = 1.72)
corresponding to w = 17 and n = 10 for P4, whereas for the nonradicalized
precursor polymer 17 an average molecular weight w = 17100 Da ( n = 9600 Da,
PDI = 1.77) corresponding to w = 15 and n = 9 was found under the same
experimental conditions. Endgroup analysis of the 1H NMR spectrum of 17 revealed

55
polymer chains with n = 12 terminated by diethylphosphonate groups on both ends
as depicted in Scheme 2. The latter value seems to be more reliable because with
GPC only rough estimates can be obtained. The small differences between the
molecular weight data of P4 and of 17 show that the radicalization and work-up did
not influence the chain length distribution to a significant extent.
3.3 Absorption Spectroscopy
Absorption spectra of P1 measured in dichloromethane and toluene are displayed
in Figure 17a together with the absorption spectra of the reference molecule M.
Energies of absorption bands and corresponding molar extinction coefficients are
listed in Table 9.
(a) (b)
10000 15000 20000 25000 30000 350000
10000
20000
30000
40000
/M
-1 c
m-1
/cm-1
M in toluene
M in CH2Cl
2
P4 in toluene
P4 in CH2Cl
2
~
/nm1000 700 400
6000 8000 10000 12000 14000 160000
2000
4000
6000
8000 M in toluene
M in CH2Cl
2
P4 in toluene
P4 in CH2Cl
2
/M
-1 c
m-1
/cm-1~
1500 1200 900 600
/nm
Figure 17. (a) Absorption spectra of M and P4 in CH2Cl2 and toluene; (b) enhanced IV-CT
bands of Figure 17a.
Absorption bands of P4 resemble those of M and can be assigned as follows:
Bands around 34500 cm-1 correspond to localized triarylamine transitions234 and
bands between 25600 and 17200 cm-1 belong to the PCTM radical moiety235. The
band of particular interest is the IV-CT band located around 12000 cm-1.205 This
transition is somewhat higher in energy for P4 (12600 cm-1, dichloromethane) than
for M (12100 cm-1, dichloromethane) which can be explained by the weaker donor
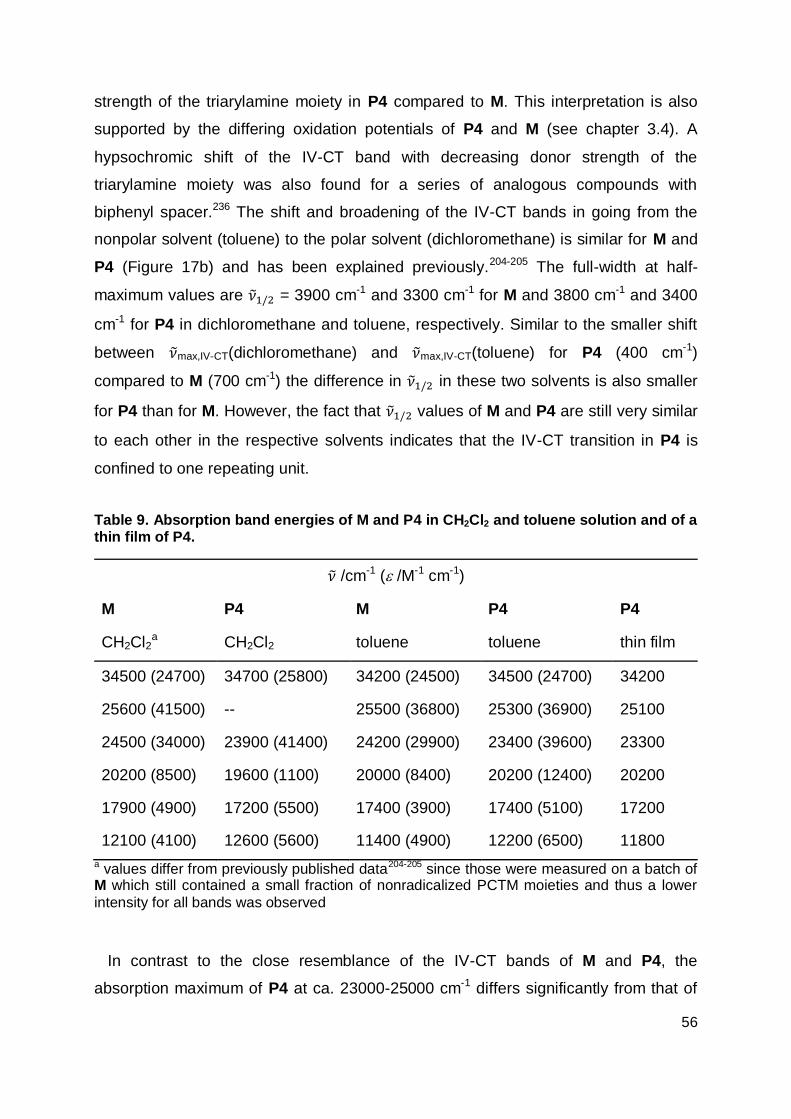
56
strength of the triarylamine moiety in P4 compared to M. This interpretation is also
supported by the differing oxidation potentials of P4 and M (see chapter 3.4). A
hypsochromic shift of the IV-CT band with decreasing donor strength of the
triarylamine moiety was also found for a series of analogous compounds with
biphenyl spacer.236 The shift and broadening of the IV-CT bands in going from the
nonpolar solvent (toluene) to the polar solvent (dichloromethane) is similar for M and
P4 (Figure 17b) and has been explained previously.204-205 The full-width at half-
maximum values are = 3900 cm-1 and 3300 cm-1 for M and 3800 cm-1 and 3400
cm-1 for P4 in dichloromethane and toluene, respectively. Similar to the smaller shift
between max,IV-CT(dichloromethane) and max,IV-CT(toluene) for P4 (400 cm-1)
compared to M (700 cm-1) the difference in in these two solvents is also smaller
for P4 than for M. However, the fact that values of M and P4 are still very similar
to each other in the respective solvents indicates that the IV-CT transition in P4 is
confined to one repeating unit.
Table 9. Absorption band energies of M and P4 in CH2Cl2 and toluene solution and of a thin film of P4.
/cm-1 ( /M-1 cm-1)
M
CH2Cl2a
P4
CH2Cl2
M
toluene
P4
toluene
P4
thin film
34500 (24700) 34700 (25800) 34200 (24500) 34500 (24700) 34200
25600 (41500) -- 25500 (36800) 25300 (36900) 25100
24500 (34000) 23900 (41400) 24200 (29900) 23400 (39600) 23300
20200 (8500) 19600 (1100) 20000 (8400) 20200 (12400) 20200
17900 (4900) 17200 (5500) 17400 (3900) 17400 (5100) 17200
12100 (4100) 12600 (5600) 11400 (4900) 12200 (6500) 11800
a values differ from previously published data204-205 since those were measured on a batch of M which still contained a small fraction of nonradicalized PCTM moieties and thus a lower
intensity for all bands was observed
In contrast to the close resemblance of the IV-CT bands of M and P4, the
absorption maximum of P4 at ca. 23000-25000 cm-1 differs significantly from that of

57
M in that it is broadened and shifted to the red by 1700 cm-1 in dichloromethane. The
seeming contradiction can be explained by exciton splitting, which stems from the
dipole-dipole interaction of transition moments localized on adjacent molecular units
(Figure 18). With increasing band intensity the exciton coupling energy rises,
because it is proportional to the square of the transition moment of the individual
monomer: .237 Since the transitions at 23000-25000 cm-1 have much higher
intensities than the IV-CT band one can qualitatively expect a much higher exciton
coupling of the former transitions and thus a significant broadening of the high energy
bands.
Figure 18. Band broadening due to exciton coupling interactions between adjacent
molecular units in polymers.
The solid state absorption spectrum of P4 spin coated from toluene onto a quartz
plate reveals the same spectral shape as the toluene solution spectrum (Figure 19)
except for a small red shift commonly observed for solid state spectra due to
interchain interactions13,127,144,147 which are, however, weak in films of P4.
10000 15000 20000 25000 30000 350000,0
0,2
0,4
0,6
0,8
1,0 P4 in toluene
P4 thin film
ab
so
rba
nce
/a
. u
.
/ cm-1~
1000 700 400
/ nm
Figure 19. Normalized absorption spectra of P4 in toluene and of a thin film spin coated from
a toluene solution onto a quartz plate.

58
The same solid state spectrum is also obtained, when P4 is spin coated from
chlorobenzene under the same conditions. Annealing of as prepared films in air at
110 °C for 30 minutes did not alter the spectrum significantly. This points to a
pronounced air stability and the amorphous character of the film, since a higher
ordering which can be induced by annealing would shift the absorption edge farther
to the red due to more effective interchain interactions.79,238-239
The optical band gaps Egopt as determined from the onset absorptions (Table 10)
are slightly smaller for M (1.13 eV in dichloromethane, 1.15 eV in toluene) than for P4
(1.19 eV in dichloromethane, 1.23 eV in toluene, 1.17 eV in solid state) consistent
with the higher energy of the IV-CT transition of P4.
Summarizing the optical properties P4 is a low band gap polymer, that forms air
and temperature stable, amorphous films and shows IV-CT characteristics similar to
M.
3.4 Cyclic Voltammetry
Half wave potentials E1/2 of oxidation and reduction processes were determined by
cyclic voltammetry in dichloromethane/TBAPF6 with potentials being referenced
against Fc/Fc+. The oxidation of the amine moiety and the reduction of the PCTM
radical of P4 occur at E1/2ox = +340 mV and at E1/2
red = -690 mV, respectively (Figure
20, Table 10). Both signals are chemically fully reversible as confirmed by multi-
sweep experiments in a thin layer whereupon the signals did not alter significantly.
Under semi-infinite conditions the peak separation Ep decreases during subsequent
scans from 82 mV (oxidation) and 72 mV (reduction) at the beginning to 33 and 32
mV, respectively, after 32 scans. This observation indicates adsorption of P4 on the
surface of the working electrode with increasing number of voltammetric cycles,
which implies a transition from semi-infinite conditions (theoretical value for reversible
one-electron processes at 25 °C: Ep = 58 mV240) to thin-layer conditions (theoretical
value for reversible processes:Ep = 0 mV241). Note that in practice Ep values may
be substantially larger than the theoretical values due to voltage drops of
uncompensated solution resistance. The full-width at half-maximum of the signals

59
determined from DPV measurements are about 100 mV for both P4 and M, which
shows that the redox centers behave as independent units with negligible
inhomogeneous distribution of redox potentials in the polymer P4. In comparison to
the oxidation potential of M (E1/2ox = +240 mV)205 the oxidation of P4 occurs at
considerably higher potential, whereas the reduction potentials are almost identical
(E1/2red (M) = -670 mV)205. These findings agree well with previous results: The
oxidation potentials of triarylamine molecules strongly depend on the donor/acceptor
strength of the substituents,234 whereas the reduction potential of the PCTM radical
moiety is nearly independent of the donor strength of the amine moiety if the two
centers (C• and N) are connected by the same spacer.204 Thus the presence of two
PCTM radical acceptors next to the amine moiety shifts the oxidation of P4 to higher
potentials as compared to M.
-1000-800-600-400-200 0 200 400 600-0,8
-0,6
-0,4
-0,2
0,0
0,2
0,4
0,6
I /µ
A
E /mV
Figure 20. CV of P4 in CH2Cl2/TBAPF6, v = 100 mV s-1.
The important values for the application of P4 in electronic devices are the HOMO
and LUMO values which were determined from the half-wave potentials of the
oxidation and the reduction process, respectively (see experimental section). Even
though usually onset potentials are taken for the estimation of the electrochemical
band gaps of polymers based on the work of Brédas in 1983,242 here the half-wave
potentials are used for the following reason: The half-wave potential is the
thermodynamic quantity that is measured (relative to potentials of reference
electrodes or an internal redox couple such as Fc/Fc+) as the potential needed to
bring the Fermi level of the electrode to the free energy of a 1:1 mixture of reduced

60
and oxidized species (= formal potential). This free energy can be set as the HOMO
(or LUMO) energy provided differences of solvation and reorganizational effects of
reduced and oxidized species are negligible or cancel out. These constrictions are
important to mention since the HOMO/LUMO energies refer to vertical ionization and
electron affinity values while redox potentials refer to adiabatic ionization and electron
affinities.243 In cases where the determination of a half-wave potential is impossible
because of strongly overlapping signals as e.g. in polymers, the onset potential may
be used instead.242 The HOMO and LUMO energies of P4 determined from the half-
wave potentials are -5.50 and -4.47 eV, respectively, resulting in an electrochemical
band gap of Eg = 1.03 eV (Table 10). These values are perfectly suitable for the
application of P4 in an ambipolar OFET device with Au contacts, since the Au work
function (4.7-5.2 eV)8,244 is close to these values and thus charge carrier injection
barriers for both holes and electrons should be small. Moreover the low lying HOMO
and LUMO make P4 stable against redox reactions with wet air.64
Table 10. Oxidation and reduction potentials, HOMO and LUMO values and electrochemical (Eg) and optical (Eg
opt, EgBJ) band gaps of M and P4.
E1/2
ox
/mV
E1/2red
/mV
HOMO
/eV
LUMO
/eV
Eg
/eVb
Egopt
/eVc
EgBJ
/eVd
M
+240a, 205 -670a, 205 -5.40 -4.49 0.91 1.13 1.00 CH2Cl2
toluene 1.15 1.16
P4
CH2Cl2 +340a -690a -5.50 -4.47 1.03 1.19 1.24
toluene 1.23 1.24
a half-wave potentials vs. Fc/Fc+; P4: CH2Cl2/TBAPF6, v = 100 mV s-1; M: CH2Cl2/TBAPF6 (0.1 M), v = 250 mV s-1; b Eg = LUMO - HOMO; c Eg
opt is determined from the onset
absorptions; d EgBJ = G00 (see chapter 3.1) is determined by a Bixon-Jortner band shape
analysis of the IV-CT band, see ref. [204]
For comparison HOMO and LUMO values of M were determined from the CV of
ref. [205] in the same way as it was done for P4 giving -5.40 eV (HOMO) and -4.49
eV (LUMO) (Table 10). For both M and P4 the optical band gap energies Egopt as

61
determined from the absorption onsets245 of the solution spectra (P4: 1.19 eV in
CH2Cl2, M: 1.13 eV in CH2Cl2) are larger than the electrochemical Eg values (Table
10). The deviation is only slightly smaller if the absorption onsets are determined
from the spectra of neutral species recorded during spectroelectrochemical
measurements (see chapter 3.5) under experimental conditions (supporting
electrolyte solution) similar to those of the CV measurements, which gave Egopt =
1.17 eV for P4 and Egopt = 1.13 eV for M. In solid state (thin film on quartz plate) Eg
opt
= 1.17 eV for P4. In general, the spectra in pure CH2Cl2 only marginally deviate from
those with electrolyte. These findings suggest that the deviation between Egopt and Eg
is not caused by medium effects. In theory, one would expect that Egopt is smaller
than Eg because of the exciton binding energy. In M and P4 this energy might be
small because of the explicit CT character of the lowest-energy transition which
already requires a spatial separation of hole and electron. In a previous work the
band gap of M in CH2Cl2 was evaluated by a Bixon-Jortner analysis, in which a
Golden Rule type equation is fitted to the IV-CT band in order to obtain G00 =
EgBJ.204 For M in toluene and for P4 an analogous analysis was performed in this
work which rests on the assumption that the broadening of the IV-CT band of the
polymer due to exciton coupling is negligible (see chapter 3.3). In fact, excellent
agreement between Egopt and Eg
BJ is found for M in toluene and for P4 in both
solvents (see Table 10). This analysis excludes reorganizational effects to be the
source of the deviations between optically and electrochemically determined band
gaps. The major source for the discrepancies might still be ion pairing effects in the
apolar CH2Cl2 solution which lowers the ionization energy and electron affinity in the
electrochemical experiments. The overall good agreement of Egopt and Eg
BJ shows
that the exciton binding energy is small in P4. However, given the systematical
inaccuracy of the methods for determining the band gap we cannot rule out exciton
binding energies in the order of 100-200 mV.
3.5 Spectroelectrochemistry
By spectroelectrochemistry the absorption spectra of oxidized triarylamine donor
D+• and reduced PCTM acceptor A- can be obtained independently. Since the IV-CT

62
band is caused by an ET from the triarylamine to the PCTM radical moiety (see
chapter 3.1), the sum of the spectra of D+• and A- should approximately give the
transient absorption profile of the IV-CT state (lowest excited state), with exception of
those contributions that are due to interactions between D+• and A-, i.e. the IV-CT
band itself. Thus, the spectra obtained by spectroelectrochemistry may help for the
interpretation of transient absorption spectra (see chapter 3.6). In Figure 21 the
absorption spectra of reduced and oxidized M and P4 are displayed together with the
absorption spectra of the neutral species.
(a) (b)
10000 15000 20000 25000 30000 350000
10000
20000
30000
40000
M M reduced
P4 P4 reduced
/M
-1 c
m-1
/cm-1~
1000 700 400
/nm
10000 15000 20000 25000 30000 350000
10000
20000
30000
40000
50000
60000 M
M oxidized
P4
P4 oxidized
/M
-1 c
m-1
/cm-1~
1300900 500
/nm
Figure 21. Absorption spectra of M (0.2 mM) and P4 (0.2 mM) in CH2Cl2/TBAPF6 in their fully reduced (a) and fully oxidized (b) states together with the spectra of the neutral species.
For both, reduced M and reduced P4, an intense broad band (M: 18400 cm-1, =
40100 M-1 cm-1 and P4: 17100 cm-1, = 46000 M-1 cm-1), typical of PCTM
anions204,226,246 is observed (Figure 21a). The radical band of the neutral species at
around 25000 cm-1 decreased and is blue shifted (M: 27000 cm-1, = 25500 M-1 cm-1;
P4: 25800 cm-1, = 30800 M-1 cm-1) in the spectra of the reduced species. In
addition, the IV-CT band is absent, since there is no ET possible upon excitation of
the PCTM anion. The higher intensity of the bands of reduced P4 as compared to
those of M results from the additional PCTM radical moiety attached to each polymer
chain end (Chart 8).
In the spectra of oxidized M and P4 (Figure 21b) a sharp and intense band at
14100 cm-1 (M: = 64700 M-1 cm-1; P4: = 49400 M-1 cm-1) belonging to the

63
triarylamine radical cation204,234 and a new IV-CT band at 9500 cm-1 ( = 27200 M-1
cm-1) for M and at 8900 cm-1 ( = 27500 M-1 cm-1) for P4 is visible. The latter arises
from an ET from the PCTM radical to the triarylamine radical cation center.204 Thus,
donor and acceptor functionalities of the moieties exchange in the oxidized species
and the formerly weaker donor of neutral P4 is now a stronger acceptor compared to
the corresponding moiety of M, which causes the red shift of the IV-CT band of
oxidized P4 relative to the IV-CT band of oxidized M. Similar to the spectra of
reduced M and P4 the radical band of the neutral spectrum at around 25000 cm-1
decreased and is blue shifted (M: 26300 cm-1, = 28300 M-1 cm-1, shoulder at 22900
cm-1; P4: 25900 cm-1, = 22100 M-1 cm-1, shoulder at 22100 cm-1) in the spectra of
the oxidized species.
3.6 Transient Absorption Spectroscopy
In order to investigate the dynamics of photoinduced ET phenomena fs-pump-
probe transient absorption spectroscopy was performed by Martin Kullmann and
Stefan Rützel in the group of Prof. T. Brixner. Polymer P4 and monomer M dissolved
in toluene and dichloromethane were excited at 525 nm and their transient spectra
were recorded with femtosecond time resolution. In toluene the transient spectra of
P4 show two bands at 18300 and 15200 cm-1 (Figure 22a), which correspond to
characteristic transitions of the anion (P4-) and radical cation (P4•+), respectively, as
was proved by comparison with spectroelectrochemistry (Figure 22c) although the
bands in those experiments appear at lower energy (17100 and 14100 cm-1). The
transient band at 15200 cm-1 shifts to 15600 cm-1 at longer delay times. A ground
state bleaching is observed at 23100 cm-1. In dichloromethane initially two bands at
18100 and 15400 cm-1 are observed similar to those in toluene. At longer delay times
the bands in dichloromethane shift to 18500 cm-1 and 15900 cm-1 (Figure 22b). The
reason for the band shifts in both solvents is presently unclear. In dichloromethane
the spectral shape at longer times resembles that of the sum of oxidized (P4•+) and
reduced (P4-) polymer minus three times the ground state absorption of neutral P4
obtained from spectroelectrochemistry (Figure 22c). The enlarged intensity of the
ground state bleaching cannot be explained yet.
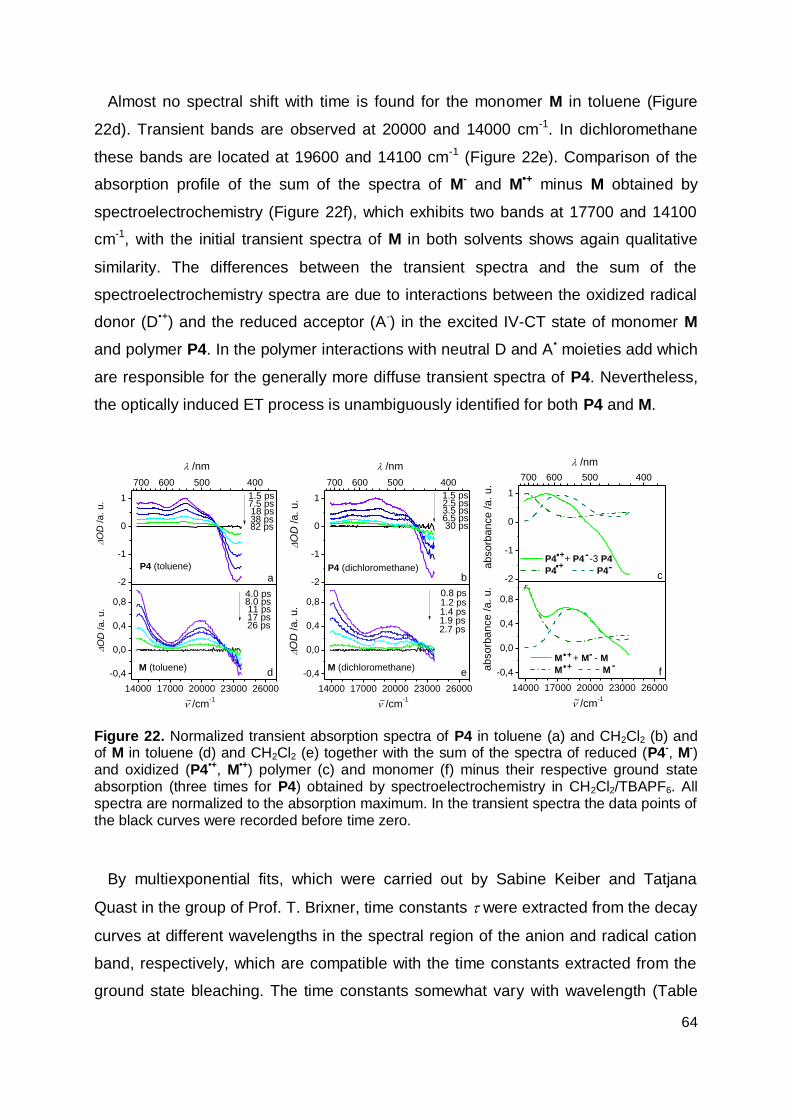
64
Almost no spectral shift with time is found for the monomer M in toluene (Figure
22d). Transient bands are observed at 20000 and 14000 cm-1. In dichloromethane
these bands are located at 19600 and 14100 cm-1 (Figure 22e). Comparison of the
absorption profile of the sum of the spectra of M- and M•+ minus M obtained by
spectroelectrochemistry (Figure 22f), which exhibits two bands at 17700 and 14100
cm-1, with the initial transient spectra of M in both solvents shows again qualitative
similarity. The differences between the transient spectra and the sum of the
spectroelectrochemistry spectra are due to interactions between the oxidized radical
donor (D•+) and the reduced acceptor (A-) in the excited IV-CT state of monomer M
and polymer P4. In the polymer interactions with neutral D and A• moieties add which
are responsible for the generally more diffuse transient spectra of P4. Nevertheless,
the optically induced ET process is unambiguously identified for both P4 and M.
14000 17000 20000 23000 26000
-0,4
0,0
0,4
0,8
O
D /a
. u
.
~ /cm-1
M (toluene)d
-2
-1
0
1
O
D /a
. u
.
P4 (toluene)
/nm
a
700 600 500 400
4.0 ps8.0 ps11 ps17 ps26 ps
1.5 ps7.5 ps18 ps38 ps82 ps
14000 17000 20000 23000 26000
-0,4
0,0
0,4
0,8
2.7 ps1.9 ps1.4 ps1.2 ps
O
D /a
. u
.
~ /cm-1
M (dichloromethane)e
0.8 ps
-2
-1
0
1
O
D /a
. u
.
P4 (dichloromethane)
/nm
b
30 ps6.5 ps3.5 ps2.5 ps1.5 ps
700 600 500 400
14000 17000 20000 23000 26000
-0,4
0,0
0,4
0,8
M + M - M
M M ..
--
+
+
ab
sorb
ance /a
. u
.
~ /cm-1
f
-2
-1
0
1
. P4 + P4 -3 P4
P4 P4
-
-+
+
ab
sorb
ance /a
. u
.
/nm
c
.
700 600 500 400
Figure 22. Normalized transient absorption spectra of P4 in toluene (a) and CH2Cl2 (b) and of M in toluene (d) and CH2Cl2 (e) together with the sum of the spectra of reduced (P4-, M-) and oxidized (P4•+, M•+) polymer (c) and monomer (f) minus their respective ground state absorption (three times for P4) obtained by spectroelectrochemistry in CH2Cl2/TBAPF6. All spectra are normalized to the absorption maximum. In the transient spectra the data points of the black curves were recorded before time zero.
By multiexponential fits, which were carried out by Sabine Keiber and Tatjana
Quast in the group of Prof. T. Brixner, time constants were extracted from the decay
curves at different wavelengths in the spectral region of the anion and radical cation
band, respectively, which are compatible with the time constants extracted from the
ground state bleaching. The time constants somewhat vary with wavelength (Table

65
11) which reflects the error of the measurements and the model used for their
analysis. The decay curves of P4 and M in dichloromethane and toluene are depicted
in Figure 23. For P4 in toluene a biexponential decay with two time constants2 ≈ 20
ps and 3 ≈ 70 ps was found. However, in dichloromethane 2is much smaller (≈ 2.5
ps), whereas the larger time constant 3is hardly affected by the solvent (≈ 70 ps).
This indicates that the smaller time constant is associated with the decay of the IV-
CT state to the ground state. This decay is faster in more polar solvents because of a
Marcus inverted region effect, as was found for a compound very similar to M.247 The
larger time constant probably corresponds to a structural or electronic transformation
within the polymer excited state. Much in contrast, for M only one short time constant,
2 ≈ 13 ps in toluene and 2 ≈ 0.6 ps in dichloromethane is found as well as a time
constant for the rise of the IV-CT state, 1 ≈ 1 ps in toluene and 1 ≈ 0.5 ps in
dichloromethane. The observed rise time likely refers to the solvent dynamic
modulated ET process in good agreement with values obtained recently.247
Table 11. Time constants and amplitudes a for P4 and M at selected wavelengths.
P4 (toluene) P4 (dichloromethane)
540
nm
560
nm
625
nm
665
nm
540
nm
560
nm
625
nm
665
nm
2 /ps 20 21 19 15 2.5 2.6 2.6 2.3
a2 /OD/10-3 19 15 13 13 13 11 9.7 10
3 /ps 69 80 78 60 78 79 51 63
a3 /OD/10-3 9.9 7.3 8.1 9.6 0.75 0.88 0.93 0.46
M (toluene) M (dichloromethane)
500
nm
520
nm
700
nm
720
nm
500
nm
520
nm
700
nm
720
nm
1 /ps 1 0.6 1 1 0.4 0.6 0.5 0.4
2 /ps 13 13 13 12 0.7 0.6 0.6 0.6

66
0
4
8
12
16
20
24
28
P4 (toluene, 540 nm)
2 = 20 ps
3 = 69 ps
0 50 100 150 200 250 300
0
3
6
9
12
P4 (CH2Cl
2, 540 nm)
2 = 2.5 ps
3 = 78 ps
O
D /1
0-3
O
D /10
-3
pump-probe delay /ps
O
D /1
0-3
O
D /10
-3
pump-probe delay /ps
M (toluene, 500 nm)
1 = 1 ps
2 = 13 ps
0 20 40 60 80
pump-probe delay /ps
M (CH2Cl
2, 500 nm)
1 = 0.4 ps
2 = 0.7 ps
pump-probe delay /ps
0 50 100 150 200 250 300
0
1
2
3
4
0 20 40 60 80
0
2
4
6
8
Figure 23. Experimental and fitted decay curves of P4 and M in toluene and
dichloromethane at selected wavelengths at a pump wavelength of 525 nm.
A schematic interpretation of the above results is given in Figure 24: It is assumed
that no bimolecular or multiphotonic processes play a significant role as no influence
of the pump power on the transient spectra dynamics was found. Because of the
polyradical character P4 may adopt different spin multiplicities in the ground and
excited state. For simplicity, the discussion is restricted to the interaction of two spin
bearing units that is to triplets and singlets. However, it is stressed that states of
higher multiplicity might be involved. The spin-spin interaction in the ground state is
expected to be quite weak, because PCTM-bridge-PCTM with shorter bridges than
the triarylamine in P4 already shows weak interactions.206 In State0 (see Figure 24)
the unpaired electrons of the PCTM radical moieties (A•) either have or spin.
Thus in an [A•-D-A•] moiety, where D denotes the triarylamine moiety, the two spins
can either form a triplet state or a singlet state. These states are anticipated to be
almost degenerate. Upon excitation of P4 the IV-CT states - singlet and triplet - are
populated from higher lying excited singlet and triplet states. The transient spectra of
both triplet and singlet IV-CT states are expected to be very similar. The decay of the

67
IV-CT states to the respective ground states (triplet and singlet) occurs approximately
with 2 and no differences in the decay kinetics depending on the different spin states
are expected. Thus, the long time constant 3 cannot result from this kinetic scheme.
For comparison population and decay of the IV-CT state of M is also depicted in
Figure 24 (left side), which exclusively includes doublet states. However, for P4
several transformations of the IV-CT state are conceivable as depicted in the upper
part of Figure 24: The exciton may migrate by electron or hole transfer via an
electron-deficient or electron-rich bridge. In that case ET is identical to an excitation
energy transfer (EET) (processes i). Because these newly formed states are
practically identical to the primarily formed IV-CT state with identical decay dynamics
they cannot account for the third time constant 3. Furthermore, the structure of P4
could undergo structural relaxation into a quinoid form by combination of two
adjacent radicals (process ii), which would result in the planarization of the polymer
backbone. This seems to be less likely due to sterically demanding ortho-chlorine
atoms. Another possible transformation of the IV-CT state could be the hole transfer
from D+• to D (or electron transfer from D to D+•) via neutral A• to give the charge
separated species CS (process iii). While the transient spectra of CS should be quite
similar to those of the IV-CT state State1 (except for the absence of the D+•/A-
interaction) the decay to the State0 should only be possible via back electron transfer,
i.e. via the IV-CT state, thus, making the back electron transfer to the IV-CT state the
rate limiting step. This process is assumed to account for the slow decay component
3 which represents an averaged time constant for back electron transfer from next
nearest neighbors and those even farther apart. While charge separation per se is an
endergonic process, a reduced exciton binding energy in State1(IV-CT) of P4 (see
chapter 3.4) may result in an equilibrium of IV-CT state and CS state. In fact, a kinetic
analysis248 involving the 1[State0], 1[State1(IV-CT)] and 1[CS] species of P4 (1[State1(IV-
CT)]→1[State0],
1[State1(IV-CT)]1[CS]), with the relative amplitudes and lifetimes a2/2
and a3/3 yields the rate constants k2, k3 and k-3 (Figure 24). In toluene k2 is ca. 4 ×
1010 s-1, k3 is ca. 1 × 10¹⁰ s-1 and k-3 is ca. 2 × 10¹⁰ s-1. This gives an excited state
equilibrium constant K = k3/k-3 ≈ 0.5. In dichloromethane k2 is ca. 4 × 10¹¹ s-1, k3 is ca.
2.5 × 10¹⁰ s-1 and k-3 is ca. 2 × 10¹⁰ s-1 giving K ≈ 1.4. The K values in the order of 1
suggest that both the IV-CT state and the CS state have almost the same free energy
which is in agreement with a negligible exciton binding energy. A reason for this

68
might be that in the CS state spin-spin interactions of three adjacent spin bearing
centers (2 × A• and 1 × D+•) lower the free energy of this state which would normally
be expected to be higher in energy than the IV-CT state. Further analysis of model
compounds will be necessary to support the above made hypothesis.
Figure 24. State diagram of M (box on the left side) and of P4. D: triarylamine moiety; A•:
PCTM radical moiety, excitons are marked in green.
3.7 Field-Effect Transistors
OFET devices allow to measure electron and hole mobilities of bulk materials in a
film separately. In order to assess the charge transport properties of polyradical P4
OFETs were fabricated in two different device configurations: For device A, a BC/BG
structure with SiO2 as gate dielectric and Au source/drain contacts was chosen. For
device B a TC/BG structure with an additional organic insulating layer of PPcB placed
upon the SiO2 surface and Au source/drain contacts evaporated on top of the P4
layer was used. The staggered configuration (device B) offers the advantage of

69
enhanced charge injection.31 The use of the PPcB layer aims at the suppression of
electron trapping often encountered at SiO2 surfaces43 and the lowering of energetic
disorder at the semiconductor/insulator interface, which is achieved with low
permittivity materials (2.1 ≤ ≤ 2.3) like PPcB62. Device fabrication, measurements
and calculations of mobilities were carried out by Maria Hammer in the group of Prof.
V. Dyakonov (Physics Department).
Table 12. Device configurations and mobilities of holes µh and electrons µe of devices of P4.
type gate insulator contacts Ta /°C µh /cm2 V-1 s-1 µe /cm2 V-1 s-1
A Si BG SiO2 Au BC 120 1 × 10⁻⁶ 4 × 10⁻⁶
B Si BG SiO2/PPcB Au TC 120 3 × 10⁻⁵ 3 × 10⁻⁵
Ta = annealing temperature
In Table 12 device configurations and mobilities calculated in the saturation regime
are listed. Interestingly, in device A the hole mobility is lower than the electron
mobility in contrast to what is anticipated for semiconductor mobilities measured on
untreated SiO2 surfaces. This is possibly caused by the high electron affinity (EA) of
P4, since materials of high EA (> 4 eV) were found to be less affected by the
presence of electron traps.65 The suppression of the hole transport might originate
from additional energetic disorder induced at the P4/SiO2 interface by the polarity of
the SiO2 surface,62 which according to the charge transport model for disordered
semiconductors proposed by Bässler249, leads to a broadening of the Gaussian
density of states and thus to an enhanced localization of charge carriers44.
The output characteristics of device B in the hole and electron accumulation mode
are displayed in Figures 25a and 25b, respectively, and the corresponding transfer
characteristics are shown in Figure 26.
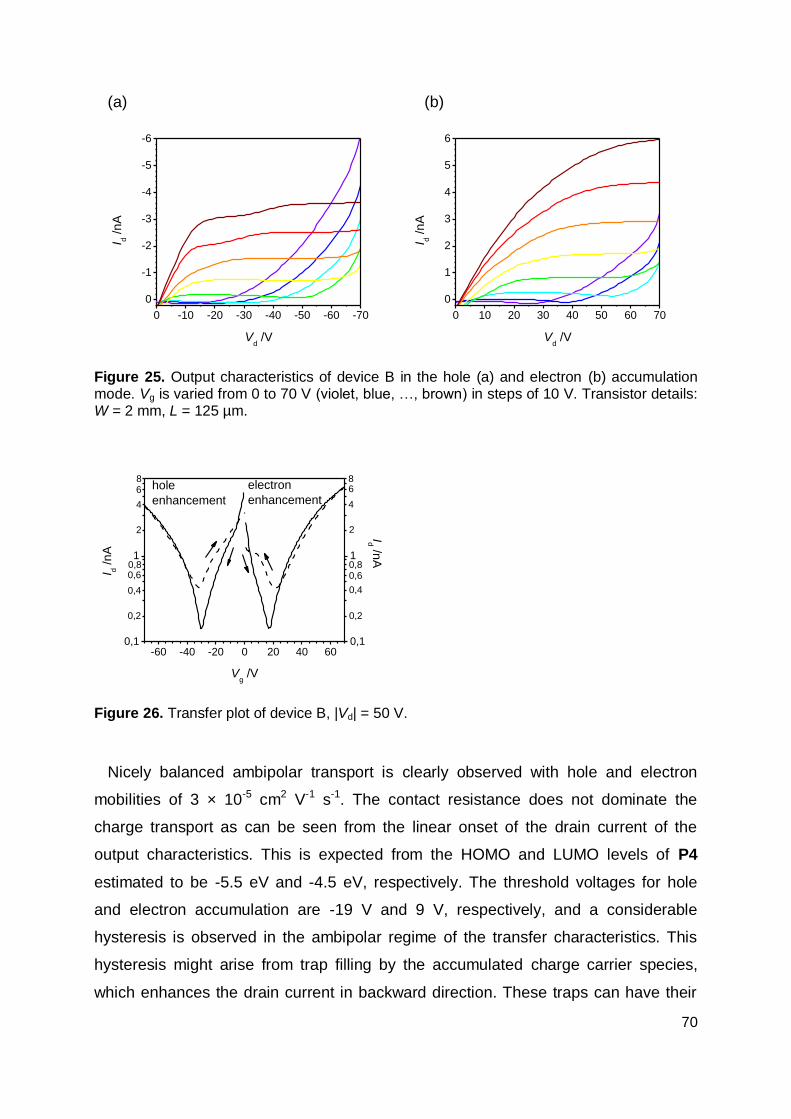
70
(a) (b)
0 -10 -20 -30 -40 -50 -60 -70
0
-1
-2
-3
-4
-5
-6
I d /n
A
Vd /V
0 10 20 30 40 50 60 70
0
1
2
3
4
5
6
I d /n
A
Vd /V
Figure 25. Output characteristics of device B in the hole (a) and electron (b) accumulation mode. Vg is varied from 0 to 70 V (violet, blue, …, brown) in steps of 10 V. Transistor details: W = 2 mm, L = 125 µm.
-60 -40 -20 0 20 40 600,1
1
8 8electron
enhancement
0,80,80,6
0,4
0,2
0,6
0,4
0,2
6
4
2
6
4
Id /nA
I d /
nA
Vg /V
2
hole
enhancement
0,1
1
Figure 26. Transfer plot of device B, |Vd| = 50 V.
Nicely balanced ambipolar transport is clearly observed with hole and electron
mobilities of 3 × 10⁻⁵ cm2 V-1 s-1. The contact resistance does not dominate the
charge transport as can be seen from the linear onset of the drain current of the
output characteristics. This is expected from the HOMO and LUMO levels of P4
estimated to be -5.5 eV and -4.5 eV, respectively. The threshold voltages for hole
and electron accumulation are -19 V and 9 V, respectively, and a considerable
hysteresis is observed in the ambipolar regime of the transfer characteristics. This
hysteresis might arise from trap filling by the accumulated charge carrier species,
which enhances the drain current in backward direction. These traps can have their

71
origin in the tail of the intrinsic density of states distribution, or in Coulomb interaction
with trapped charges of the opposite sign. Also metallic or organic impurities could
limit the charge transport. Another reason for the low mobilities could be a
nonoptimized morphology. However, annealing did neither alter the field-effect
transistor characteristics nor the absorption spectra of thin films of P4 (see chapter
3.3) which points to an amorphous material. Since the film morphology of amorphous
semiconductors is rather independent of processing procedures and the type of
underlying dielectric, as is found for polytriarylamine OFET devices,44 ordering by a
morphology optimization is not expected to be achieved for P4. Note however, that
even amorphous semiconductors (polytriarylamines) may exhibit considerably high
hole mobilities up to 0.01 cm2 V-1 s-1.62 Therefore, comparing the polymer structures
of high mobility semiconductors to that of P4, the low mobility is presumably caused
by the lack of close packing of the polymer chains: In contrast to the flat, planar
backbone structures of diketopyrrolopyrrole based polymers78-79 P4 has a flexible and
twisted backbone structure. The weak intermolecular interactions are also visible by
the close similarity of absorption spectra in solution and in the film which implies the
absence of excitonic interactions in the solid state
3.8 Solar Cells
Due to the high electron affinity (LUMO at -4.5 eV) being higher than that of
[60]PCBM (LUMO at -4.3 eV) and the broad absorption of P4 extending to 1 µm BHJ
all-polymer solar cells with P3HT as donor were fabricated. Device fabrication,
measurements and calculations were carried out by Daniel Rauh in the group of Prof.
V. Dyakonov (Physics Department). P3HT is a well studied donor polymer that yields
PCEs around 5 %149-151 in BHJ solar cells when combined with [60]PCBM and 1.8
%244 in all-polymer solar cells with F8TBT as acceptor, which is among the highest
PCEs reported so far for all-polymer solar cells238,250-255. The HOMO levels of P3HT
(-5.2 eV)256 and P4 (-5.4 eV) are offset by about 0.2 eV thus allowing for the
maximum open-circuit voltage VOC possible with this low band gap polymer to be
achieved (eq. 6). Devices were fabricated with the structure
glass/ITO/PEDOT:PSS/(P3HT/P4)/Ca/Al with five different weight ratios of P3HT/P4,

72
namely 4:1, 2:1, 1:1, 1:2 and 1:4. The best device efficiency was 3.1 × 10⁻³ % (VOC =
0.38 V, JSC = 2.8 × 10⁻² mA cm-2, FF = 0.29) obtained for the 1:4 (P3HT/P4) ratio
(Figure 27a), which is unexpectedly low. Comparing the device characteristics of the
different blends it is found that VOC is enlarged, whereas the short-circuit current JSC
drops when the amount of P4 in the blend is raised. The fill-factor FF does not vary
much with blend ratio. Thus the higher VOC causes the better PCE for the 1:4 blend.
Note, that VOC = 0.38 V is in agreement with the predicted value according to eq. 6.
Even though VOC values of BHJ solar cells comprising low band gap polymers are
inherently low, a PCE of 2.7 % (VOC = 0.38 V, JSC = 14.87 mA cm-2, FF = 0.48) has
recently been reported for a polymer with Egopt (film) = 1.13 eV using [70]PCBM as
acceptor.202 In case of the P3HT/P4 device the very low PCE is clearly caused by the
extraordinarily low value of JSC also being reflected in the EQE spectrum (incident
photon to converted electron, Figure 27b). Note, that the main contribution to the
maximum EQE at 29000 cm-1 stems from P3HT (compare Figure 19). One of the
reasons for the low photoresponse may be attributed to the low charge carrier
mobilities found for P4. However, P3HT/F8TBT devices are among the most efficient
all-polymer solar cells, despite of low and unbalanced mobilities of µh = 9.9 × 10⁻⁵
cm2 V-1 s-1 and µe = 8.9 × 10⁻⁶ cm2 V-1 s-1 found in ITO/TiO2/(P3HT/F8TBT)/MoO3/Au
devices under continuous background illumination by time-of-flight (TOF)
measurements257. Even the mobilities measured on OFET devices of pure F8TBT,
which are an order of magnitude higher (µh = 8 × 10⁻⁴ cm2 V-1 s-1 and µe = 8 × 10⁻⁵
cm2 V-1 s-1)244, are still fairly low.
A more obvious reason for the low photoresponse of the P3HT/P4 devices is
clearly seen on the AFM height images (Figure 28) measured by V. Stepanenko in
the group of Prof. F. Würthner: The P3HT/P4 1:2 and 1:4 blends do not form a
bicontinuous network nor do they exhibit a high density of interfaces between the two
phases necessary for efficient exciton dissociation. For the P3HT/P4 4:1, 2:1 and 1:1
blends the phase separation is on a smaller scale than for the blends with the higher
P4 content, but P4 “drops” of about 1 µm size are also visible in the 2:1 and 1:1
blends. Moreover the high surface roughness discloses the inhomogenity of the
blend layers. The phase separation seems to be smallest for the P3HT/P4 4:1 blend
for which the JSC value is the largest among the different blend ratios. Thus the
improper blend morphology is responsible for the bad device performance.
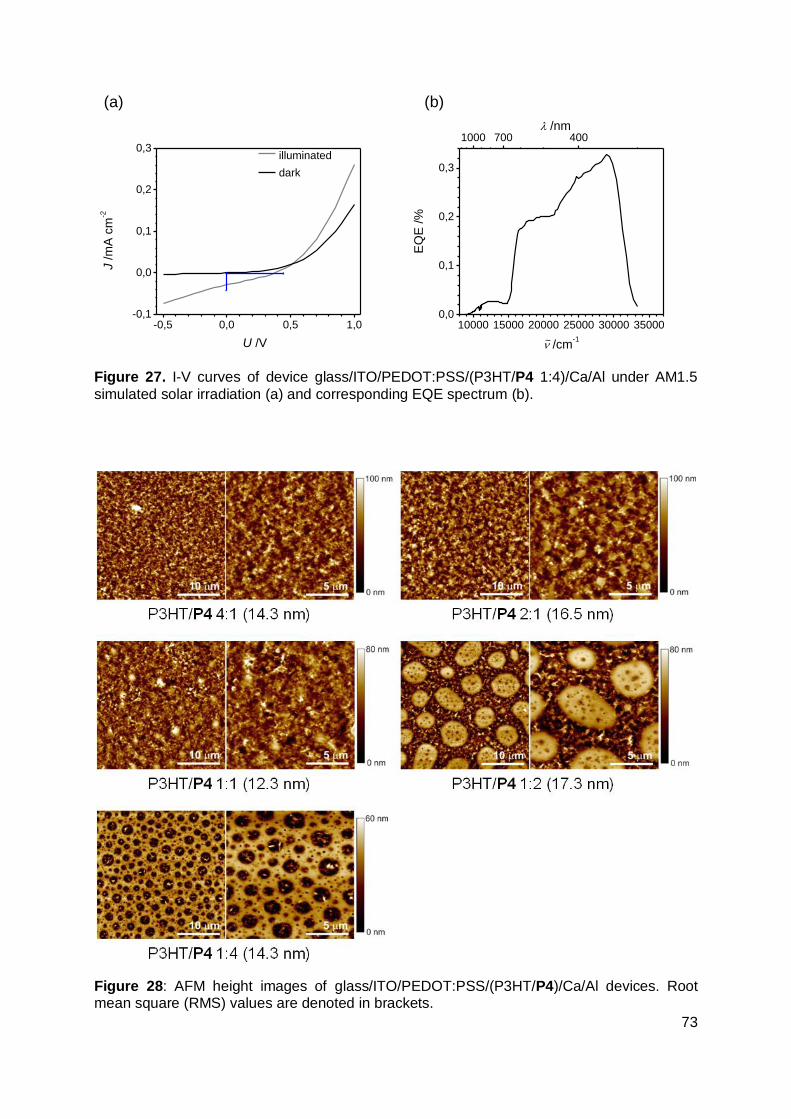
73
(a) (b)
-0,5 0,0 0,5 1,0-0,1
0,0
0,1
0,2
0,3
J /m
A c
m-2
U /V
dark
illuminated
10000 15000 20000 25000 30000 350000,0
0,1
0,2
0,3
EQ
E /%
/cm-1~
1000 700 400
/nm
Figure 27. I-V curves of device glass/ITO/PEDOT:PSS/(P3HT/P4 1:4)/Ca/Al under AM1.5
simulated solar irradiation (a) and corresponding EQE spectrum (b).
Figure 28: AFM height images of glass/ITO/PEDOT:PSS/(P3HT/P4)/Ca/Al devices. Root mean square (RMS) values are denoted in brackets.

74
3.9 Conclusions
The low band gap polyradical P4, containing alternating triarylamine and PCTM
radical moieties, was synthesized by Horner-Emmons reaction to give a polymer with
w = 19300 Da ( n = 11200 Da, PDI = 1.72) corresponding to w = 17 and n = 10.
Comparison with the monomer analogue M shows that the lowest-energy band of P4
can be interpreted as an IV-CT transition that is associated with an optically induced
transfer of an electron from the donor (triarylamine) to the radical acceptor (PCTM)
unit. Despite the connection of repeating units by conjugated bridges the IV-CT
transition of P4 is confined to one donor-acceptor pair which is proved by the close
similarity of polymer and monomer electronic spectra. However, for the more intense,
higher energy transitions a distinct excitonic broadening of bands is observed. The
band gap of the polymer was determined by both optical (1.2 eV) and
electrochemical methods (1.0 eV). The somewhat lower electrochemical band gap
compared to the optical band gap may be explained by ion pairing effects and
indicates a very low exciton binding energy. The major difference between monomer
and polymer is the good film-forming property of P4 which forms amorphous films
that are stable upon annealing at 110 °C in air.
The ET properties of P4 were investigated in solution by fs-pump-probe transient
absorption spectroscopy, which revealed distinct differences between monomer and
polymer. The transient spectra of both systems unequivocally prove a charge
separation in the IV-CT state as evidenced by the results of spectroelectrochemical
measurements. While the monomer shows a single decay time which strongly
depends on the solvent polarity the polymer has a biexponential decay with an
additional - solvent independent - slow decay component. The short-living component
is interpreted as the direct decay from the IV-CT state to the ground state and the
long-living component as an equilibrium formation of the IV-CT state and a
completely charge separated state. This hypothesis is supported by the observation
of a small exciton binding energy as well as by the excited state equilibrium constants
of ca. 0.5 and 1.4 in toluene and dichloromethane, respectively.
Charge carrier mobilities were measured in two different OFET configurations both
for electron and for hole migration. Using an insulating organic PPcB layer increases
the mobilities by one order of magnitude to ca. 3 × 10⁻⁵ cm2 V-1 s-1 for both charge

75
carriers. While the P4 films show a well balanced ambipolar transport promoted by
the small injection barriers into HOMO (-5.5 eV) and LUMO (-4.5 eV) level,
respectively, the overall mobilities are relatively low probably because of less densely
packed polymer chains caused by the propeller-like PCTM and triarylamine moieties.
An improper morphology also caused a very low device performance of P3HT/P4
BHJ solar cells (glass/ITO/PEDOT:PSS/(P3HT/P4)/Ca/Al), which yielded a PCE of
3.1 × 10⁻³ %, VOC = 0.38 V, JSC = 2.8 × 10⁻² mA cm-2 and FF = 0.29 for the 1:4
(P3HT/P4) blend ratio.
In conclusion, while P4 is less suitable for OFET and solar cell applications the
phenomenon of charge migration along the polymer backbone in the excited state as
deduced from the slow solvent independent decay component is worth to be
investigated in more detail.
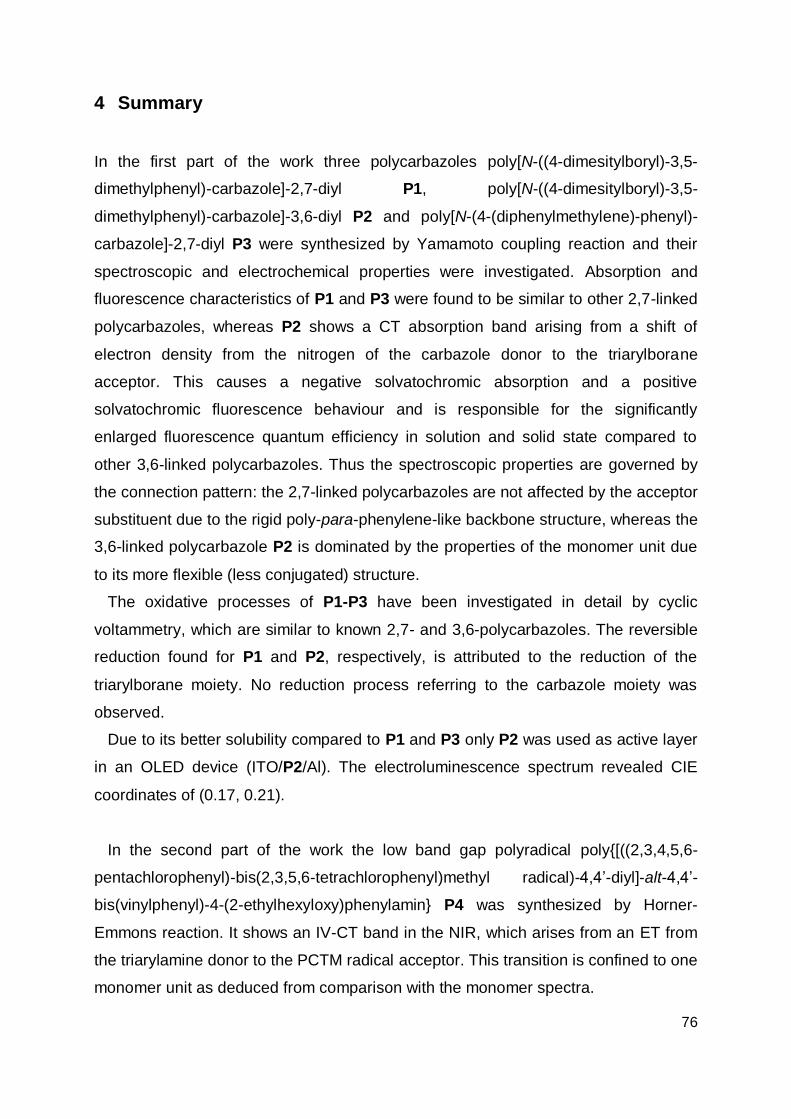
76
4 Summary
In the first part of the work three polycarbazoles poly[N-((4-dimesitylboryl)-3,5-
dimethylphenyl)-carbazole]-2,7-diyl P1, poly[N-((4-dimesitylboryl)-3,5-
dimethylphenyl)-carbazole]-3,6-diyl P2 and poly[N-(4-(diphenylmethylene)-phenyl)-
carbazole]-2,7-diyl P3 were synthesized by Yamamoto coupling reaction and their
spectroscopic and electrochemical properties were investigated. Absorption and
fluorescence characteristics of P1 and P3 were found to be similar to other 2,7-linked
polycarbazoles, whereas P2 shows a CT absorption band arising from a shift of
electron density from the nitrogen of the carbazole donor to the triarylborane
acceptor. This causes a negative solvatochromic absorption and a positive
solvatochromic fluorescence behaviour and is responsible for the significantly
enlarged fluorescence quantum efficiency in solution and solid state compared to
other 3,6-linked polycarbazoles. Thus the spectroscopic properties are governed by
the connection pattern: the 2,7-linked polycarbazoles are not affected by the acceptor
substituent due to the rigid poly-para-phenylene-like backbone structure, whereas the
3,6-linked polycarbazole P2 is dominated by the properties of the monomer unit due
to its more flexible (less conjugated) structure.
The oxidative processes of P1-P3 have been investigated in detail by cyclic
voltammetry, which are similar to known 2,7- and 3,6-polycarbazoles. The reversible
reduction found for P1 and P2, respectively, is attributed to the reduction of the
triarylborane moiety. No reduction process referring to the carbazole moiety was
observed.
Due to its better solubility compared to P1 and P3 only P2 was used as active layer
in an OLED device (ITO/P2/Al). The electroluminescence spectrum revealed CIE
coordinates of (0.17, 0.21).
In the second part of the work the low band gap polyradical poly{[((2,3,4,5,6-
pentachlorophenyl)-bis(2,3,5,6-tetrachlorophenyl)methyl radical)-4,4‟-diyl]-alt-4,4‟-
bis(vinylphenyl)-4-(2-ethylhexyloxy)phenylamin} P4 was synthesized by Horner-
Emmons reaction. It shows an IV-CT band in the NIR, which arises from an ET from
the triarylamine donor to the PCTM radical acceptor. This transition is confined to one
monomer unit as deduced from comparison with the monomer spectra.
77
HOMO and LUMO of P4 determined by cyclic voltammetry are at -5.5 and -4.5 eV,
respectively. The smaller electrochemical band gap (1.0 eV) compared to the optical
band gap (1.2 eV) is probably caused by ion pairing effects in the electrochemical
experiments and indicates a low exciton binding energy.
Femtosecond-pump-probe transient absorption spectroscopy revealed the spectral
features of the oxidized triarylamine donor and the reduced PCTM acceptor similar to
the spectra obtained separately for positive and negative potentials by
spectroelectrochemistry. Thus the ET event causing the IV-CT absorption band could
unambiguously be identified. The decay of the IV-CT state was found to be
biexponential. The fast solvent dependent decay component is ascribed to the direct
decay from the IV-CT state to the ground state, whereas the slow solvent
independent decay component is tentatively attributed to an equilibrium formation of
the IV-CT state and a completely charge separated state formed by charge migration
along the polymer backbone.
Well balanced ambipolar charge transport with hole and electron mobilities of ca. 3
× 10-5 cm2 V-1 s-1 was found in OFET devices (BG/TC structure) comprising an
additional insulating organic PPcB layer.
Polymer/polymer BHJ solar cell devices with the structure
glass/ITO/PEDOT:PSS/(P3HT/P4)/Ca/Al yielded a power conversion efficiency of 3.1
× 10-3 %, VOC = 0.38 V, JSC = 2.8 × 10⁻² mA cm-2 and FF = 0.29 for the 1:4 (P3HT/P4)
blend ratio.
The improper solid state morphology of P4 that causes the unsatisfying
performance of OFET and solar cell devices renders P4 less suitable for these
applications, whereas the hypothesis of charge migration in the excited state is worth
to be investigated in more detail.

78
5 Experimental Section
5.1 Apparatus and Methods
NMR spectra (1H, 13C, 31P) were recorded with either a Bruker AVANCE 400 FT-
NMR spectrometer or a Bruker AVANCE DMX 600 FT-NMR spectrometer at r. t..
Chemical shifts are given in ppm vs. tetramethylsilane. Carbon atoms connected to
chlorine (CCl) were distinguished from those surrounded by only carbon (quart.) by
the observation of a shoulder peak with one-third of the main peak‟s intensity
according to the isotopic distribution of 35Cl and 37Cl.
Mass spectra were recorded with a Finnigan MAT 90 or with a Bruker Daltonics
micrOTOF focus mass spectrometer equipped with an APCI ion source (Agilent
G1947-60101). For calculation of the respective mass values of the isotopic
distribution, the software modul “Bruker Daltonics IsotopePattern” of the software
Compass 1.1 from Bruker Daltonik GmbH, Bremen was used. Due to the isotopic
distribution over a broad m/z region caused by chlorine the signal of monoisotopic
signals was too small for some compounds in intensity for an accurate mass
measurement. In this case, typically the most intense signal (X+n) of this isotopic
distribution was taken and compared with the respective calculated value. Mass
spectra of P1-P3 were recorded with a Bruker Daltonik autoflex II with samples being
embedded in a DCTB matrix [(H3C)3C-p-Ph-CH=C(CH3)-trans-CH=C(CN)2].
GPC measurements were performed with a setup consisting of a dual-plunger,
tandem-flow pump (Shimadzu, LC-10AT), a He-degasser unit (Shimadzu, DGU-10B),
two (P4) or three (P1-P3) SDV columns from PSS/Mainz (Germany) (pore size: 100,
103 and 105 Å; particle size: 5 µm; column length: 300 mm each) and a Gynkotek
model 160 UV detector. The eluent was THF (Acros, HPLC grade) at 35 °C with a
flow rate of 1 mL min-1. The calibration curve was made with a series of
monodisperse polystyrene standards (PSS/Mainz, Germany; concentration: 1
mg/mL). The measurement of P1 in 1,2,4-trichlorobenzene at 135 °C was performed
at the MPI für Polymerforschung in Mainz by S. Seiwald (group of Prof. K. Müllen).
IR spectra were recorded on a JASCO FT/IR 4100 instrument using KBr pellets.

79
DSC measurements were performed on a Mettler-Toledo DSC 823 under nitrogen
atmosphere.
UV/Vis/NIR absorption spectroscopy. Spectra were recorded on a JASCO V-570
UV/Vis/NIR spectrometer in 1 cm quartz cells (Hellma) at r. t.. All solvents were of
spectroscopic grade and used as received. Solutions of P1-P3 had to be filtered
before the measurement which made the determination of the solution concentration
impossible. The concentration of P4 solutions was about 1 × 10⁻⁵ M. For solid state
absorption spectra thin films were prepared by spin coating polymer solutions (P1-
P3: saturated; P4: 5 mg/mL) onto quartz plates (4000 rpm, 60 s). For the
determination of the full-width at half maximum the IV-CT band was fitted with
three (dichloromethane) and four (toluene) Gaussian bands, respectively, and the
sum of the two (dichloromethane) and three (toluene) Gaussian bands with the
lowest energy was used for the determination of .
Steady-state fluorescence spectroscopy. Spectra were recorded on a PTI (Photon
Technology International) fluorescence spectrometer model QM-2000-4 with a cooled
photomultiplier (R928 P) and a 75 W Xenon short arc lamp (UXL-75XE, Ushio). All
spectra were recorded in 1 cm quartz cells (Hellma) in solvents of spectroscopic
grade at r. t.. The fluorescence quantum yields were determined from the absorption
and fluorescence spectra according to eq. 13, in which I( ), OD, and denote the
area below the emission band, the optical density of the solution at the excitation
wavelength, and the refractive index of the solvent, respectively.
(13)
Quinine sulfate dihydrate (Fluka) in 1 N H2SO4 (Acros) was employed as
fluorescence standard (f,ref = 0.546, = 1.3445)258. For absorption measurements
ODs were in the range of 0.01 to 0.045 in order to get sufficiently high signal to noise
ratios.
Special care was taken for the determination of fluorescence quantum yields of P1-
P3: For emission measurements samples were diluted by a factor of 1:10 since at
80
higher concentrations fluorescence quantum yields were quenched. In order to avoid
mistakes arising from dilution, three samples per solvent were prepared. For each
sample its absorption spectrum was recorded, it was diluted and its emission
spectrum was recorded. The OD of the quinine sulfate dihydrate solution was about
0.01 and not altered before the emission measurement. Samples were not degassed
thus avoiding concentration variations of solutions prepared from volatile solvents.
Moreover, fluorescence quantum yields of polymers diluted in DMSO are only slightly
higher when degassed by bubbling argon through the cuvette than that of samples
not treated with an argon gas flow. Samples were excited at = 340, 345 and 350
nm which gave similar values for all three wavelengths for P1 and P3 and slightly
differing values for the three wavelengths for P2. Results are only tabulated for =
345 nm excitation. Solid state emission spectra were recorded on thin films prepared
by dropping saturated CH2Cl2 solutions of the polymers onto quartz plates. Solid
state fluorescence quantum yields were determined on a Hamamatsu Absolute PL
Quantum Yield Measurement System CC9920-02. The system is made up of an
excitation source that uses a 150 W CW Xenon light source, a monochromator (250-
700 nm, FWHM 10 nm), an integrating sphere, and a multi-channel spectrometer
capable of simultaneously measuring multiple wavelengths between 300 and 950 nm
and counting the number of absorbed and emitted photons. With this system the
absolute fluorescence quantum yield of powders and thin films (drop cast, see above)
were determined at r. t. on air upon excitation at = 345 nm.
Time-dependent fluorescence-decay.
Fluorescence lifetimes of P1-P3 were measured with a PTI TM-2/2003 fluorescence-
lifetime spectrometer with a nanosecond flash lamp charged with H2/N2 (1:1). The
instrument response of the nanosecond flash lamp was determined by using colloidal
silica (Ludox) in de-ionized water as a scatterer. The fluorescence-decay curves were
fitted with a single-exponential decay function in order to obtain the corresponding
fluorescence lifetimes. Measurements were performed in 1 cm quartz cells (Hellma)
in solvents of spectroscopic grade at r. t..

81
Cyclic voltammetry. Experiments were carried out with a BAS CV-50 W instrument
(Software Version 2.0). A conventional three-electrode setup consisting of a Pt-disc
working electrode ( = 2 mm), an Ag/AgCl pseudoreference electrode, and a Pt-wire
counter electrode was used. The redox potentials were referenced against the Fc/Fc+
redox couple as an internal standard. Measurements were performed under an argon
atmosphere with TBAP or TBAPF6 as the supporting electrolyte: 0.1 M in MeCN, 0.2
M in CH2Cl2 and 0.3 M in THF. CH2Cl2 (Baker, HPLC grade) and MeCN (Baker,
HPLC grade) were predried over molecular sieves 4 Å (Acros, 8-12 mesh) and 3 Å
(Merck), respectively and distilled over CaH2. THF was predried over KOH and
distilled over sodium/benzophenone. Polymer concentrations of solution
measurements are unknown since the solution had to be filtered due to the low
solubility of the polymers. For thin film measurements a solution of the polymer in
CH2Cl2 was drop cast onto the working electrode and dried in a nitrogen gas flow.
For thin layer measurements (20 ± 5 µm) the working electrode was placed on top of
a flexible hemisphere ( = 8 mm). For P1-P3 HOMO and LUMO values were
determined from the onset potentials and calculated under the assumption that
Fc/Fc+ = -4.8 eV vs. vacuum195 in order to make values comparable to literature data.
For P4 HOMO and LUMO values were determined from the half-wave potentials in
CH2Cl2/TBAPF6 solution and calculated according to E(HOMO/LUMO) = -5.16 eV -
E1/2ox/red. It was assumed that Fc/Fc+ = +0.46 eV vs. SCE (0.1 M TBAPF6 in
CH2Cl2)259 and SCE = 0.24 eV vs. the Standard Hydrogen Electrode (SHE).260 The
absolute potential of SHE was found to be 4.46 eV.261
Differential Pulse Voltammetry (DPV) was carried out with the same instrument and
under identical experimental conditions.
Spectroelectrochemistry. Experiments were performed in a specially designed
sample compartment consisting of a cylindrical quartz cell, a Pt-disc electrode ( = 6
mm), a gold-covered metal (V2A) plate as the counter electrode and an Ag/AgCl
pseudo-reference electrode. Solvents and electrolytes were the same as those used
for CV experiments and measurements were performed under argon atmosphere.
Spectra were recorded with a JASCO V-570 UV/Vis/NIR spectrometer in reflection
mode. The vertical position of the working electrode was adjusted with a micrometer
screw 100 µm above the bottom of the cell. The potential was applied by an EG & G

82
Princeton Applied Research Model 283 potentiostat and was varied in steps of 20–
100 mV.
Transient absorption spectroscopy. The laser system used for the femtosecond
transient absorption measurements consists of an ultrafast Ti:sapphire amplifier
(Spectra Physics Solstice) with a repetition rate of 1 kHz, a central wavelength of 800
nm, and a pulse duration of 100 fs. One part of the output power was used to seed a
noncollinear optical parametric amplifier (Light Conversion TOPAS White) which
produced the pump pulses centered at 525 nm with a duration of about 55 fs as
verified by frequency-resolved optical gating measurements.262 A small fraction of the
Ti:sapphire output was focused into a linearly moving CaF2-plate to produce a
supercontinuum between 390 nm and 750 nm which acted as the probe beam. After
passing the sample the probe pulses were detected via a spectrograph (Acton
SP2558) with a CCD camera (Princeton Instruments Pixis 2k). A mechanical
chopper, working at 500 Hz, blocks every second pump pulse, thus enabling low
noise shot-to-shot-measurements, eliminating the need for a reference beam. By
comparing the transmitted spectral intensity of consecutive pulses [I(,), I0()] the
photoinduced change in the optical density can be directly recorded as:
. For the measurements pump and probe pulses were focused
noncollinearly and spatially overlapped in a 500 µm flow cell with beam diameters of
40 µm and less than 30 µm, respectively, while the polarizations were set to the
magic angle of 54.7°. The pump power was attenuated resulting in pulse energies of
100 nJ (M in toluene and CH2Cl2 and P4 in CH2Cl2) and 260 nJ (P4 in toluene). The
relative temporal delay between pump and probe pulses was varied over a maximum
range of 3.6 ns with a motorized, computer controlled linear stage. The delay interval
between two consecutive data points was 100 fs for small delay times and was
increased up to 30 ps for very large delay times. The data were analyzed by a least
squares fitting algorithm. The nonlinear fit model was a multiexponential function in
combination with a Heaviside step function. In case of the polymer a biexponential
decay was assumed. For the monomer a sum of monoexponential rise and decay
functions was used. Where the coherent artifact263 was observable, selected data
points around time zero were omitted from the fit.

83
OLED Fabrication. An ITO coated glass plate (2.5 × 2.5 cm2, 125 nm, sheet
resistance ~25 Ω, Merck KGaA) was covered with tape except for a bar of about 0.5
cm width. This bar was treated with a Zn/H2O suspension and HCl in order to remove
ITO from the glass plate. The plate was cleaned mechanically with dish liquid and
then with acetone and isopropanol in an ultrasonic bath and subsequently heated to
140 °C for 24 h in order to remove residual solvent. P2 dissolved in CHCl3/toluene
(25:1, 6 mg/mL) was spin coated onto the plate (800 rpm, 60 s). Opposite to the bar
of pure glass, a bar of the polymer layer was scratched off (about 0.5 cm). On top Al
contacts (90 nm, Mateck GmbH) were deposited through a shadow mask
(aluminium) by thermal evaporation at high vacuum (1 × 10⁻⁶ mbar, deposition rate
0.2 nm s-1) in a BOC Edwards Auto 306/500 deposition system. Voltage was applied
by the electrochemical workstation BAS CV-50 W. Spectra were recorded on a PTI
(Photon Technology International) fluorescence spectrometer model QM-2000-4 with
a cooled photomultiplier (R928 P). CIE 1931 (x,y) chromaticity coordinates were
calculated according to eqs. 14 and 15:264
(14)
(15)
The XYZ values are derived from eqs. 16-18:
(16)
(17)
(18)
in which , and are the CIE 1931 XYZ colour matching functions.
is the spectral colour stimulus function ( electroluminescence EL()) and k is a
normalization constant.

84
OFET fabrication. Heavily doped n-type Si substrates as the gate and thermally
grown 200 nm silicon dioxide as the dielectric layer (Si-Mat) were cleaned in an
ultrasonic bath with acetone and isopropanol. For device A (BG/BC structure) first
source and drain electrodes (1 nm Ti adhesion layer/19 nm Au) were patterned using
standard photolithography. Then the semiconductor layer was spin coated (1500
rpm, 60 s) on top from a 1 wt% solution of P4 in chlorobenzene inside a nitrogen-
filled glove box. For device B (BG/TC structure) PPcB (12 wt% 1-butene, Aldrich)
was dissolved in anhydrous decaline (cis/trans mixture, Aldrich) at 190 °C (20
mg/mL) and spin coated in air on top of the SiO2 surface using a preheated copper
chuck (2500 rpm, 60 s). The device was heated for one minute at 200 °C in air and
then transferred to the glove box where P4 was spin coated (1 wt% in
chlorobenzene, 1500 rpm, 60 s) on top. As final layer Au source and drain contacts
(50 nm) were evaporated through a shadow mask. The as prepared devices (A and
B) were heated at 120 °C for 20 h in vacuum prior to the measurements using an
Agilent Parameter Analyzer 4155C. Mobilities µ were calculated from the transfer
curves in the saturation regime at a drain voltage |VD| = 50 V according to eq. 4.
Solar Cell Fabrication. Structured ITO covered glass plates were cleaned with dish
liquid, acetone and isopropanol in an ultrasonic bath prior to spin coating of a
PEDOT:PSS layer (40-50 nm) followed by heating of the substrates at 130 °C for 10
min in a nitrogen-filled glove box. Subsequent processing steps and measurements
were then exclusively performed under inert atmosphere. The blend layer was spin
coated from different ratios of regioregular P3HT (Rieke Metals, 20 mg/mL in
chlorobenzene) and P4 (20 mg/mL in chlorobenzene) with the two solutions being
mixed directly before spin coating. Samples were annealed at 130 °C for 15 min prior
to thermal evaporation of Ca(3 nm)/Al(100 nm) metal contacts. The active area was
3 mm2. Measurements were performed under AM1.5 simulated solar light irradiation
with the light intensity being adjusted by using a Si reference solar cell with an optical
filter.
85
5.2 Syntheses
5.2.1 Materials
Solvents were dried by standard procedures and stored under nitrogen atmosphere.
9H-Carbazole was recrystallized from ethanol. Only fresh batches of dimesitylboron
fluoride were used. CuBr2 and K2CO3 were dried in vacuum above 200 °C and stored
under nitrogen atmosphere. 18-crown-6 was distilled under reduced pressure and
stored under nitrogen atmosphere.
Activation of Cu powder:
Cu powder (2 g) was stirred in acetone (20 mL) with I2 (40.0 mg) for 10 min, filtered
and stirred in conc. HCl/acetone (1:1, 20 mL) for 5 min. The activated Cu powder was
filtered, washed thoroughly with acetone until neutral and dried in vacuum.
Preparation of anhydrous NiCl2:
Under nitrogen atmosphere SOCl2 (183 mmol) was carefully added to NiCl2·6H2O
(24.0 mmol) and the suspension was stirred at 80 °C for 1 h. NiCl2 was filtered off
under nitrogen atmosphere and dried in vacuum to give a rose solid, which turned
yellow upon exposure to air.
All other chemicals and reagents were used as received. For reactions carried out
under nitrogen atmosphere standard Schlenk techniques were used.

86
5.2.2 Synthesis of Polycarbazoles
4,4’-Dichloro-2-nitrobiphenyl 2
CA [192942-45-3]
Synthesis according to lit.173
4,4‟-Dichlorobiphenyl 1172 16.3 g (73.1 mmol)
Glacial acetic acid 343 mL
HNO3 (100 %) 105 mL
H2O 8.6 mL
The reaction mixture was poured onto ice and neutralized by the addition of aqueous
NaOH. The yellow precipitate was collected by filtration, dissolved in CHCl3 and
washed with aqueous NaHCO3 (2 ×) and water (2 ×). The organic phase was dried
over MgSO4, filtered and the solvent was evaporated.
Formula: C12H7Cl2NO2
Yield: 19.3 g (72.0 mmol, 98 %) of a yellow solid.
1H NMR (400 MHz, [D6]acetone): = 8.06 (d, 1H, 4JHH = 2.1 Hz, H1), 7.83 (dd, 1H,
3JHH = 8.3 Hz, 4JHH = 2.1 Hz, H2), 7.61 (d, 1H, 3JHH = 8.3 Hz, H3),
7.52 (AA‟, 2H, H4), 7.41 (BB‟, 2H, H5).
87
4-Bromophenyl-diphenylmethane 4b
CA: [5410-05-9]
Synthesis according to lit.180
To a solution phenylmagnesium bromide (4.68 g, 29.8 mmol) in 63 mL Et2O a
solution of p-bromobenzophenone (4.94 g, 18.9 mmol) in 37 mL Et2O was added
dropwise over a period of 1 h. Subsequently the red reaction mixture was stirred over
night at r. t. upon which it turned brown. Then it was poured onto crushed ice and
acidified with 6 N HCl (pH 3-4). The phases were separated and the aqueous phase
was extracted with Et2O (3 ×). The combined organic extracts were washed with
NaHCO3 (1 ×) and water (3 ×) and dried over MgSO4. After removal of the solvent
formic acid (23.5 mL, 98-100 %) was added and the red-orange mixture was refluxed
for 3 h whereupon it turned red-brown and a yellow solid appeared. Then the mixture
was poured onto crushed ice and after addition of Et2O the aqueous phase was
separated and extracted with Et2O (3 ×). The combined organic phases were washed
with aqueous NaOH (5 %, 6 ×) and dried over MgSO4. The solvent was evaporated
and the oily product was purified by flash chromatography (100 % PE → PE/DCM
3:1) and recrystallized from PE.
.
Formula: C19H15Br
Yield: 4.49 g (13.9 mmol, 73 %) of a slightly yellow solid.
1H NMR (400 MHz, [D6]acetone): = 7.40 (AA‟, 2H, H1), 7.32-7.26 (m, 4H, H4),
7.25-7.20 (m, 2H, H5), 7.11-7.07 (m, 4H, H3), 6.99 (BB‟, 2H, H2),
5.50 (s, 1H, H6).

88
N-(4-Bromo-3,5-dimethylphenyl)-2,7-dichlorocarbazole 5a
Synthesis according to lit.179
3a170 (8.31 g, 35.2 mmol), 4a178 (5.57 g, 21.1 mmol), CuI (224 mg, 1.18 mmol), trans-
1,2-cyclohexanediamine (290 L, 2.41 mmol) and K3PO4 (15.7 g, 74.0 mmol) were
suspended in dry 1,4-dioxane (22 mL) under nitrogen atmosphere and heated at 110
°C for 72 h. The reaction mixture was diluted in CH2Cl2 and washed with water. The
combined aqueous phases were extracted with CH2Cl2 and the CH2Cl2 phases were
dried over MgSO4. The crude product was purified by flash chromatography (PE/
CH2Cl2 10:1).
Formula: C20H14BrCl2N
Yield: 6.52 g (15.6 mmol, 74 %) of a colourless solid.
Melting point: 240-242 °C (PE/CH2Cl2).
1H NMR (400 MHz, [D6]acetone): = 8.22 (dd, 2H, 3JHH = 8.3 Hz, 5JHH = 0.5 Hz, H1),
7.47 (s, 2H, H4), 7.38 (dd, 2H, 4JHH = 1.9 Hz, 5JHH = 0.5 Hz, H3),
7.32 (dd, 2H, 3JHH = 8.3 Hz, 4JHH = 1.9 Hz, H2), 2.56 (s, 6H, H5).
13C NMR (101 MHz, CD2Cl2): = 142.3 (quart.), 141.1 (quart.), 135.3 (quart.), 132.3
(quart.), 127.6 (quart.), 127.0 (CH, C4), 121.7 (quart.), 121.6
(CH, C1), 121.2 (CH, C2), 110.5 (CH, C3), 24.2 (CH3, C5).
APCI positive (high resolution): calcd. for [M]•+ = C20H14BrCl2N•+ 416.96812, found
416.96700, = 2.69 ppm.

89
N-(4-Bromo-3,5-dimethylphenyl)-3,6-dichlorocarbazole 5b
Synthesis according to the preparation of 5a.
3b175 1.00 g (4.24 mmol)
4a178 670 mg (2.54 mmol)
CuI 27.0 mg (142 µmol)
trans-1,2-Cyclohexanediamine 34.9 µL (290 µmol)
K3PO4 1.89 g (8.90 mmol)
1,4-Dioxane (dry) 2.65 mL
The reaction time was 19 h instead of 72 h. The crude product was purified by flash
chromatography (100 % PE).
Formula: C20H14BrCl2N
Yield: 550 mg (1.31 mmol, 52 %) of a colourless solid.
Melting point: 201-203 °C (PE).
1H NMR (400 MHz, CD2Cl2): = 8.06 (dd, 2H, 4JHH = 2.0 Hz, 5JHH = 0.5 Hz, H1), 7.40
(dd, 2H, 3JHH = 8.8 Hz, 4JHH = 2.0 Hz, H2), 7.31 (dd, 2H, 3JHH =
8.7 Hz, 5JHH = 0.5 Hz, H3), 7.25 (s, 2H, H4), 2.52 (s, 6H, H5).
13C NMR (101 MHz, CD2Cl2): = 140.9 (quart.), 140.1 (quart.), 135.7 (quart.), 127.1
(CH, C2), 126.7 (CH, C4), 126.0 (quart.), 123.8 (quart.), 120.5
(CH, C1), 111.6 (CH, C3), 24.2 (CH3, C5), CBr is missing.
APCI positive (high resolution): calcd. for [M]•+ = C20H14BrCl2N•+ 416.96812, found
416.96829, = 0.41 ppm.
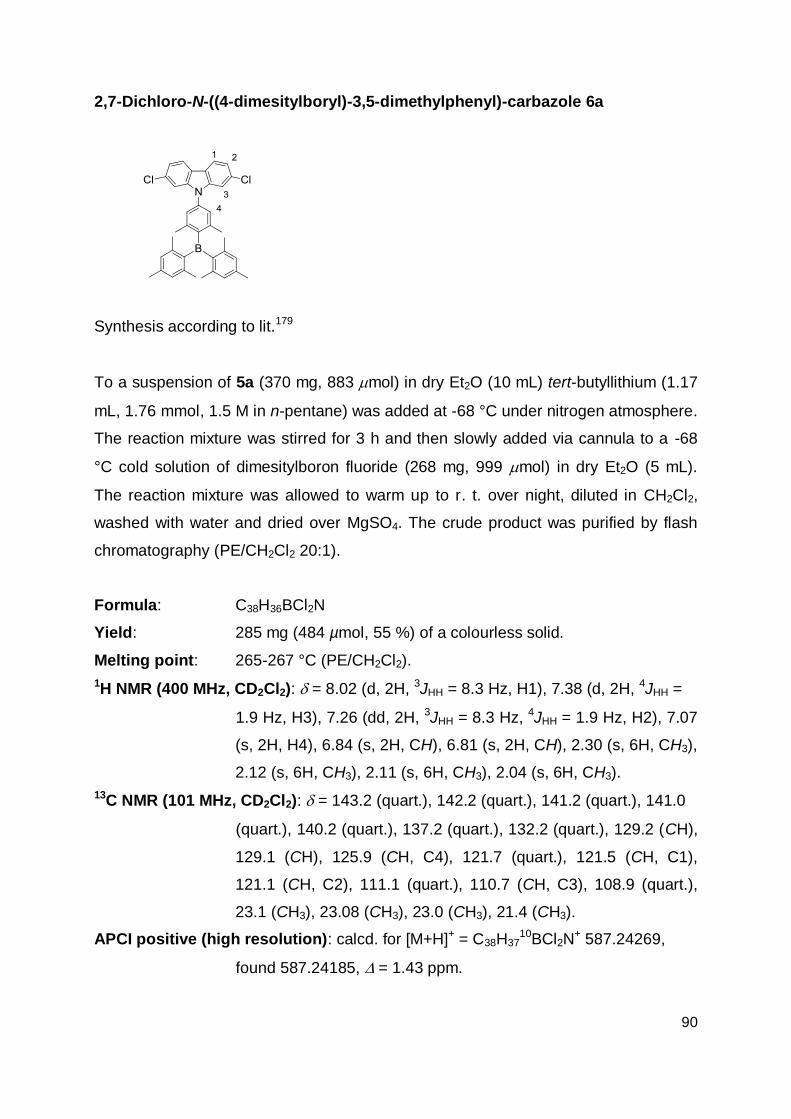
90
2,7-Dichloro-N-((4-dimesitylboryl)-3,5-dimethylphenyl)-carbazole 6a
Synthesis according to lit.179
To a suspension of 5a (370 mg, 883 mol) in dry Et2O (10 mL) tert-butyllithium (1.17
mL, 1.76 mmol, 1.5 M in n-pentane) was added at -68 °C under nitrogen atmosphere.
The reaction mixture was stirred for 3 h and then slowly added via cannula to a -68
°C cold solution of dimesitylboron fluoride (268 mg, 999 mol) in dry Et2O (5 mL).
The reaction mixture was allowed to warm up to r. t. over night, diluted in CH2Cl2,
washed with water and dried over MgSO4. The crude product was purified by flash
chromatography (PE/CH2Cl2 20:1).
Formula: C38H36BCl2N
Yield: 285 mg (484 µmol, 55 %) of a colourless solid.
Melting point: 265-267 °C (PE/CH2Cl2).
1H NMR (400 MHz, CD2Cl2): = 8.02 (d, 2H, 3JHH = 8.3 Hz, H1), 7.38 (d, 2H, 4JHH =
1.9 Hz, H3), 7.26 (dd, 2H, 3JHH = 8.3 Hz, 4JHH = 1.9 Hz, H2), 7.07
(s, 2H, H4), 6.84 (s, 2H, CH), 6.81 (s, 2H, CH), 2.30 (s, 6H, CH3),
2.12 (s, 6H, CH3), 2.11 (s, 6H, CH3), 2.04 (s, 6H, CH3).
13C NMR (101 MHz, CD2Cl2): = 143.2 (quart.), 142.2 (quart.), 141.2 (quart.), 141.0
(quart.), 140.2 (quart.), 137.2 (quart.), 132.2 (quart.), 129.2 (CH),
129.1 (CH), 125.9 (CH, C4), 121.7 (quart.), 121.5 (CH, C1),
121.1 (CH, C2), 111.1 (quart.), 110.7 (CH, C3), 108.9 (quart.),
23.1 (CH3), 23.08 (CH3), 23.0 (CH3), 21.4 (CH3).
APCI positive (high resolution): calcd. for [M+H]+ = C38H3710BCl2N
+ 587.24269,
found 587.24185, = 1.43 ppm.
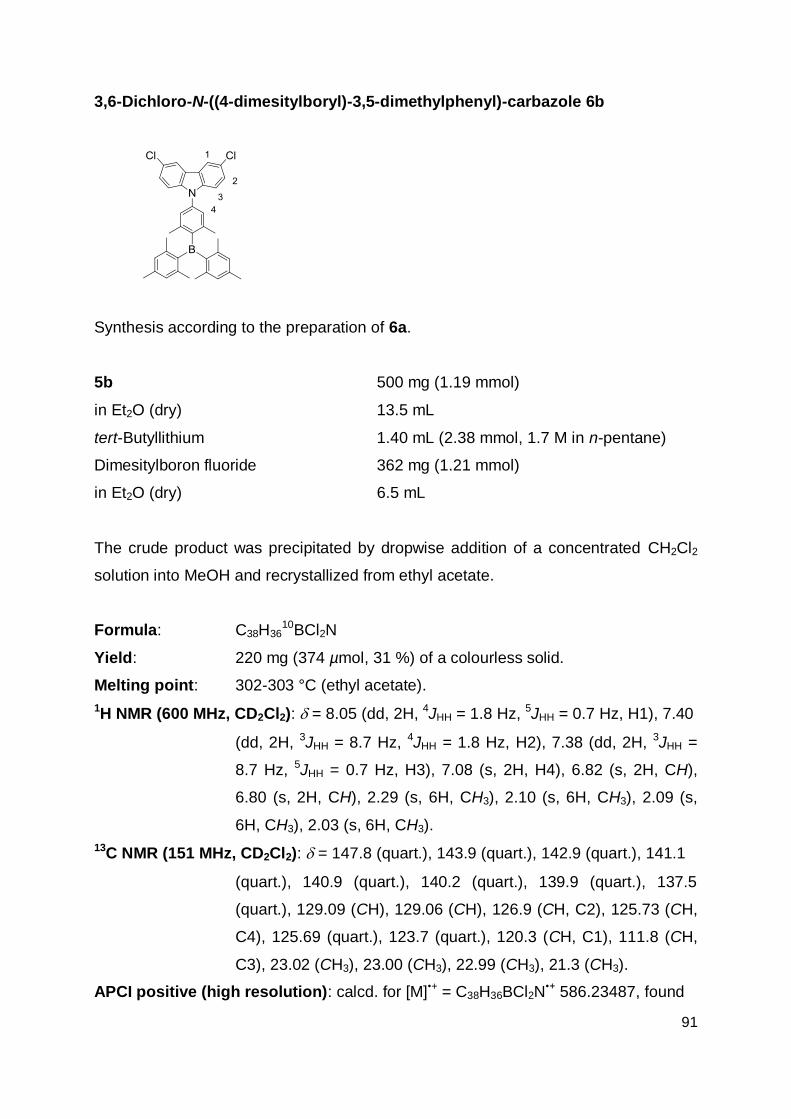
91
3,6-Dichloro-N-((4-dimesitylboryl)-3,5-dimethylphenyl)-carbazole 6b
Synthesis according to the preparation of 6a.
5b 500 mg (1.19 mmol)
in Et2O (dry) 13.5 mL
tert-Butyllithium 1.40 mL (2.38 mmol, 1.7 M in n-pentane)
Dimesitylboron fluoride 362 mg (1.21 mmol)
in Et2O (dry) 6.5 mL
The crude product was precipitated by dropwise addition of a concentrated CH2Cl2
solution into MeOH and recrystallized from ethyl acetate.
Formula: C38H3610BCl2N
Yield: 220 mg (374 µmol, 31 %) of a colourless solid.
Melting point: 302-303 °C (ethyl acetate).
1H NMR (600 MHz, CD2Cl2): = 8.05 (dd, 2H, 4JHH = 1.8 Hz, 5JHH = 0.7 Hz, H1), 7.40
(dd, 2H, 3JHH = 8.7 Hz, 4JHH = 1.8 Hz, H2), 7.38 (dd, 2H, 3JHH =
8.7 Hz, 5JHH = 0.7 Hz, H3), 7.08 (s, 2H, H4), 6.82 (s, 2H, CH),
6.80 (s, 2H, CH), 2.29 (s, 6H, CH3), 2.10 (s, 6H, CH3), 2.09 (s,
6H, CH3), 2.03 (s, 6H, CH3).
13C NMR (151 MHz, CD2Cl2): = 147.8 (quart.), 143.9 (quart.), 142.9 (quart.), 141.1
(quart.), 140.9 (quart.), 140.2 (quart.), 139.9 (quart.), 137.5
(quart.), 129.09 (CH), 129.06 (CH), 126.9 (CH, C2), 125.73 (CH,
C4), 125.69 (quart.), 123.7 (quart.), 120.3 (CH, C1), 111.8 (CH,
C3), 23.02 (CH3), 23.00 (CH3), 22.99 (CH3), 21.3 (CH3).
APCI positive (high resolution): calcd. for [M]•+ = C38H36BCl2N•+ 586.23487, found

92
586.23460, = 0.46 ppm.
2,7-Dichloro-N-(4-(diphenylmethylene)-phenyl)-carbazole 6c
Synthesis according to the prepraration of 5a.
3a170 600 mg (2.54 mmol)
4b 492 mg (1.52 mmol)
CuI 16.2 mg (85.1 µmol)
trans-1,2-Cyclohexanediamine 20.9 µL (174 µmol)
K3PO4 1.13 g (5.32 mmol)
1,4-Dioxane (dry) 1.56 mL
Formula: C31H21Cl2N
Yield: 620 mg (1.30 mmol, 86 %) of a colourless solid.
Melting point: 203-205 °C (PE/CH2Cl2).
1H NMR (400 MHz, CDCl3): = 7.98 (dd, 2H, 3JHH = 8.3 Hz, 5JHH = 0.38 Hz, arom.),
7.44-7.34 (m, 10H, arom.), 7.31-7.21 (m, 8H, arom.), 5.68 (s, 1H,
benzylic).
13C NMR (101 MHz, CD2Cl2): = 144.4 (quart.), 143.5 (quart.), 142.0 (quart.), 134.8
(quart.), 132.2 (quart.), 131.3 (CH), 129.6 (CH), 128.7 (CH),
126.87 (CH), 126.83 (CH), 121.5 (quart.), 121.2 (CH), 121.0
(CH), 110.3 (CH).
EI-MS (high resolution, PI): m/z calcd. for C31H21Cl2N 477.10456, found
477.10449, = 0.14 ppm.
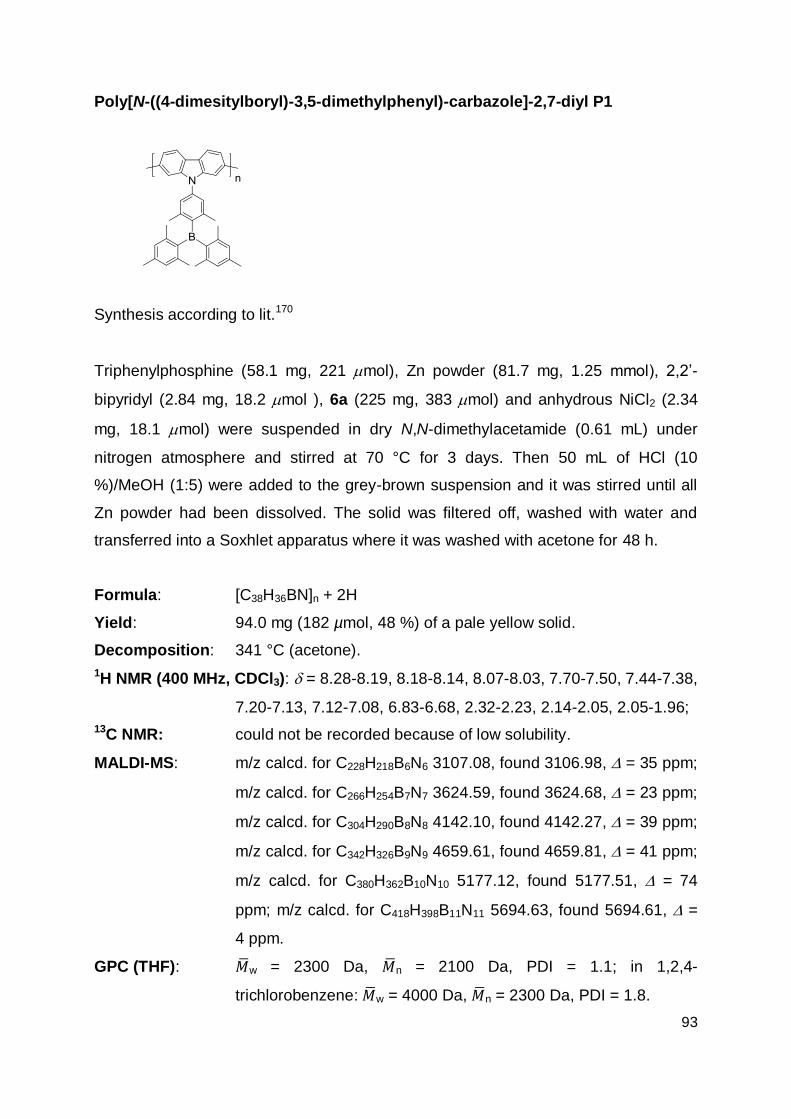
93
Poly[N-((4-dimesitylboryl)-3,5-dimethylphenyl)-carbazole]-2,7-diyl P1
Synthesis according to lit.170
Triphenylphosphine (58.1 mg, 221 mol), Zn powder (81.7 mg, 1.25 mmol), 2,2‟-
bipyridyl (2.84 mg, 18.2 mol ), 6a (225 mg, 383 mol) and anhydrous NiCl2 (2.34
mg, 18.1 mol) were suspended in dry N,N-dimethylacetamide (0.61 mL) under
nitrogen atmosphere and stirred at 70 °C for 3 days. Then 50 mL of HCl (10
%)/MeOH (1:5) were added to the grey-brown suspension and it was stirred until all
Zn powder had been dissolved. The solid was filtered off, washed with water and
transferred into a Soxhlet apparatus where it was washed with acetone for 48 h.
Formula: [C38H36BN]n + 2H
Yield: 94.0 mg (182 µmol, 48 %) of a pale yellow solid.
Decomposition: 341 °C (acetone).
1H NMR (400 MHz, CDCl3): = 8.28-8.19, 8.18-8.14, 8.07-8.03, 7.70-7.50, 7.44-7.38,
7.20-7.13, 7.12-7.08, 6.83-6.68, 2.32-2.23, 2.14-2.05, 2.05-1.96;
13C NMR: could not be recorded because of low solubility.
MALDI-MS: m/z calcd. for C228H218B6N6 3107.08, found 3106.98, = 35 ppm;
m/z calcd. for C266H254B7N7 3624.59, found 3624.68, = 23 ppm;
m/z calcd. for C304H290B8N8 4142.10, found 4142.27, = 39 ppm;
m/z calcd. for C342H326B9N9 4659.61, found 4659.81, = 41 ppm;
m/z calcd. for C380H362B10N10 5177.12, found 5177.51, = 74
ppm; m/z calcd. for C418H398B11N11 5694.63, found 5694.61, =
4 ppm.
GPC (THF): w = 2300 Da, n = 2100 Da, PDI = 1.1; in 1,2,4-
trichlorobenzene: w = 4000 Da, n = 2300 Da, PDI = 1.8.

94
Poly[N-((4-dimesitylboryl)-3,5-dimethylphenyl)-carbazole]-3,6-diyl P2
Synthesis according to the preparation of P1.
Triphenylphosphine 38.5 mg (147 µmol)
Zn powder 54.1 mg (827 µmol)
2,2‟-Bipyridyl 1.88 mg (12.0 µmol)
6b 149 mg (253 µmol)
Anhydrous NiCl2 1.55 mg (12.0 µmol)
N,N-Dimethylacetamide 0.40 mL
Formula: [C38H36BN]n + 2H
Yield: 70.0 mg (135 µmol, 53 %) of a pale yellow solid.
Decomposition: 324 °C (acetone).
1H NMR (600 MHz, [D8]THF): = 8.9-8.1 (2H, arom.), 8.0-7.6 (2H, arom.), 7.6-7.3
(2H, arom.), 7.3-7.0 (2H, arom.), 6.8 (4H, arom.), 2.3-2.2 (6H,
CH3), 2.2-1.9 (18H, CH3).
13C NMR (151 MHz, [D8]THF): = 147.5 (quart.), 144.8 (quart.), 143.5 (quart.), 141.6
(quart.), 141.4 (quart.), 141.1 (quart.), 140.5 (quart.), 139.8
(quart.), 135.3 (quart.), 129.8 (CH), 129.7 (CH), 126.3 (CH),
125.5 (quart.), 119.6 (CH), 111.2 (CH), 22.3 (CH3), 20.4 (CH3).
MALDI-MS: m/z calcd. for C228H218B6N6 3107.08, found 3106.99, = 29 ppm;
m/z calcd. for C266H254B7N7 3624.59, found 3624.64, = 14 ppm;
m/z calcd. for C304H290B8N8 4142.10, found 4142.09, = 2.4
ppm; m/z calcd. for C342H326B9N9 4659.61, found 4659.86, = 54
ppm; m/z calcd. for C380H362B10N10 5177.12, found 5177.29, =
33 ppm; m/z calcd. for C418H398B11N11 5694.63, found 5694.72,

95
= 16 ppm; m/z calcd. for C456H434B12N12 6212.14, found 6212.50,
= 58 ppm; m/z calcd. for C494H470B13N13 6729.65, found
6729.62, = 4.5 ppm; m/z calcd. for C532H506B14N14 7247.16,
found 7247.47, = 43 ppm.
GPC (THF): w = 6000 Da, n = 4900 Da, PDI = 1.2.
Poly[N-(4-(diphenylmethyl)-phenyl)-carbazole]-2,7-diyl P3
Synthesis according to the preparation of P1.
Triphenylphosphine 47.6 mg (182 µmol)
Zn powder 67.1 mg (1.03 mmol)
2,2‟-Bipyridyl 2.33 mg (14.9 µmol)
6c 150 mg (314 µmol)
Anhydrous NiCl2 1.92 mg (14.9 µmol)
N,N-Dimethylacetamide 0.50 mL
Formula: [C31H21N]n + 2H
Yield: 67.0 mg (164 µmol, 52 %) of a yellow solid.
Decomposition: 335 °C (acetone).
1H NMR (400 MHz, CDCl3): = 8.21-8.00 (2H, arom.), 7.68-7.28 (12H, arom.), 7.23-
7.17 (6H, arom.), 5.66-5.58 (1H, benzylic).
13C NMR: could not be recorded because of low solubility.
MALDI-MS: m/z calcd. for C93H65N3 1223.52, found 1223.49, = 24 ppm; m/z
calcd. for C124H86N4 1630.68, found 1630.69, = 4 ppm; m/z
calcd. for C155H107N5 2037.85, found 2037.92, = 35 ppm.
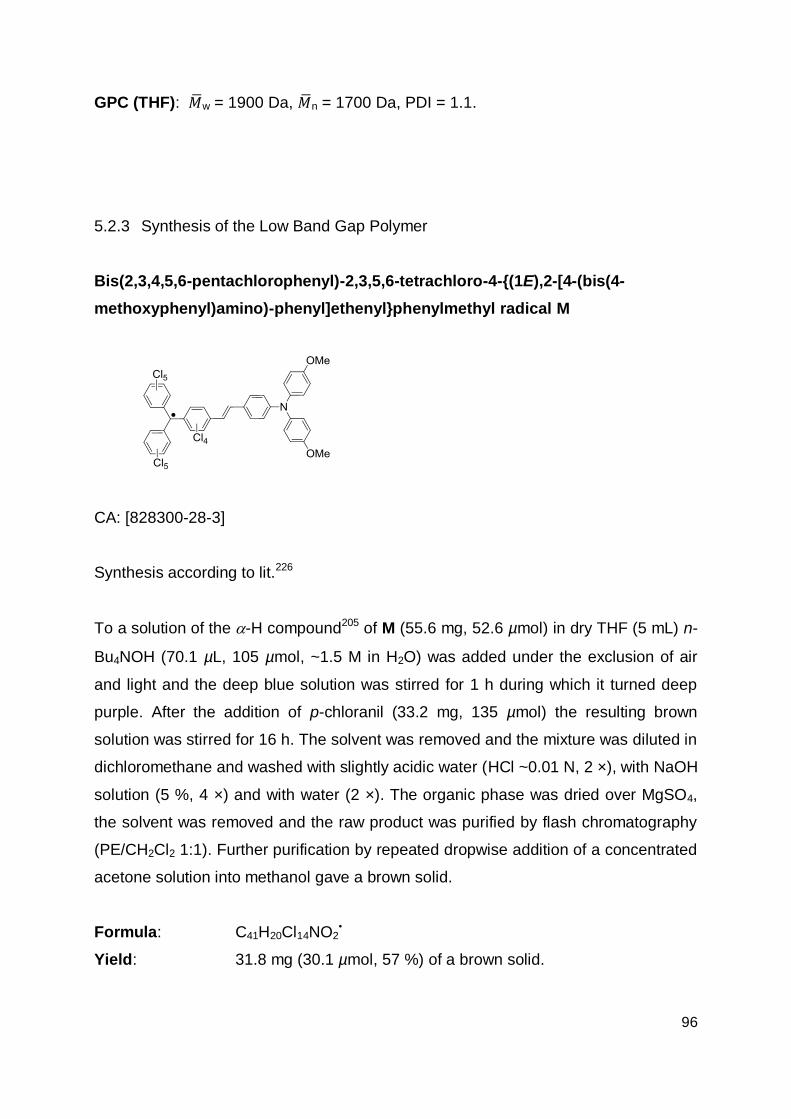
96
GPC (THF): w = 1900 Da, n = 1700 Da, PDI = 1.1.
5.2.3 Synthesis of the Low Band Gap Polymer
Bis(2,3,4,5,6-pentachlorophenyl)-2,3,5,6-tetrachloro-4-{(1E),2-[4-(bis(4-
methoxyphenyl)amino)-phenyl]ethenyl}phenylmethyl radical M
CA: [828300-28-3]
Synthesis according to lit.226
To a solution of the -H compound205 of M (55.6 mg, 52.6 µmol) in dry THF (5 mL) n-
Bu4NOH (70.1 µL, 105 µmol, ~1.5 M in H2O) was added under the exclusion of air
and light and the deep blue solution was stirred for 1 h during which it turned deep
purple. After the addition of p-chloranil (33.2 mg, 135 µmol) the resulting brown
solution was stirred for 16 h. The solvent was removed and the mixture was diluted in
dichloromethane and washed with slightly acidic water (HCl ~0.01 N, 2 ×), with NaOH
solution (5 %, 4 ×) and with water (2 ×). The organic phase was dried over MgSO4,
the solvent was removed and the raw product was purified by flash chromatography
(PE/CH2Cl2 1:1). Further purification by repeated dropwise addition of a concentrated
acetone solution into methanol gave a brown solid.
Formula: C41H20Cl14NO2•
Yield: 31.8 mg (30.1 µmol, 57 %) of a brown solid.

97
UV/vis/NIR(CH2Cl2): /cm-1 (M-1 cm-1) = 34500 (24700), 25600 (41500), 24500
(34000), 20200 (8500), 17900 (4900), 12100 (4100).
4,4’-Dimethyltriphenylmethane 7
CA: [69511-00-8]
Synthesis according to lit.180
To a solution of 4-methylphenylmagnesium bromide (40.6 g, 237 mmol) in 180 mL
diethylether a solution of p-methylbenzophenone (28.1 g, 143 mmol) in 150 mL Et2O
was added dropwise over a period of 1 h. Subsequently the red reaction mixture was
refluxed for 1 h, poured onto crushed ice and acidified with 6 N HCl (pH 3-4). The
phases were separated and the aqueous phase was extracted with Et2O (3 × 100
mL). The combined organic extracts were washed with water (3 × 100 mL) and dried
over MgSO4. After removal of the solvent formic acid (175 mL, 98-100 %) was added
and the dark green mixture was refluxed for 3 h whereupon it turned brown. Then it
was poured onto crushed ice and after addition of diethylether the aqueous phase
was separated and extracted with Et2O (3 × 75 mL). The combined organic phases
were washed with saturated NaHCO3 until neutral and dried over MgSO4.
Evaporation of the solvent and purification by flash chromatography (PE/CH2Cl2 10:1)
gave an oily product, which could be crystallized from n-hexane at -30 °C.
Formula: C21H20
Yield: 22.8 g (83.7 mmol, 59 %) of colourless needles.
1H NMR (400 MHz, CDCl3): = 7.30-7.24 (m, 2H, H2), 7.22-7.17 (m, 1H, H1), 7.13-
7.10 (m, 2H, H3), 7.09 (AA‟, 4H, H4 or H5), 7.00 (BB‟, 4H, H4 or
H5), 5.48 (s, 1H, H6), 2.32 (s, 6H, CH3).

98
[Bis(4-methyl-2,3,5,6-tetrachlorophenyl)-(2,3,4,5,6-pentachlorophenyl)]methane
8
Synthesis according to lit.204
To a hot solution (70 °C) of S2Cl2 (3.42 g, 25.3 mmol) and anhydrous AlCl3 (1.73 g,
13.0 mmol) in SO2Cl2 (400 mL) a solution of 7 (9.07 g, 33.3 mmol) in SO2Cl2 (200
mL) was added dropwise during 1 h. After 8 h of heating during which the reaction
volume was kept constant by addition of further SO2Cl2 the latter was removed by
distillation at atmospheric pressure and then in vacuum. 500 mL of water were then
added and the mixture was made basic by the addition of NaHCO3 whereupon it was
heated to reflux during 1 h. The cooled mixture was acidified with conc. HCl (about
50 mL) and the solid was filtered off and washed with water. The crude product was
repeatedly heated to reflux in n-hexane and filtered off until the n-hexane remained
colourless.
Formula: C21H7Cl13
Yield: 15.0 g (20.8 mmol, 63 %) of a grey solid.
Decomposition: 313 °C (n-hexane).
1H NMR (600 MHz, CDCl3): = 6.99 (s, 1H, CH), 2.62 (s, 6H, CH3).
13C NMR (151 MHz, CDCl3): = 137.2 (quart.), 137.11 (quart.), 137.09 (quart.),
135.53 (quart.), 135.49 (quart.), 135.2 (CCl), 134.3 (CCl),
134.224 (CCl), 134.220 (CCl), 134.1 (CCl), 134.0 (CCl), 133.32
(CCl), 133.25 (CCl), 133.24 (CCl), 133.22 (CCl), 133.11 (CCl),
133.05 (CCl), 132.2 (CCl), 56.4 (CH), 20.633 (CH3), 20.631
(CH3).
APCI neg. (high resolution): calcd. for [M-H+]- = C21H6Cl13- 712.64258, found
712.64225, = 0.47 ppm.
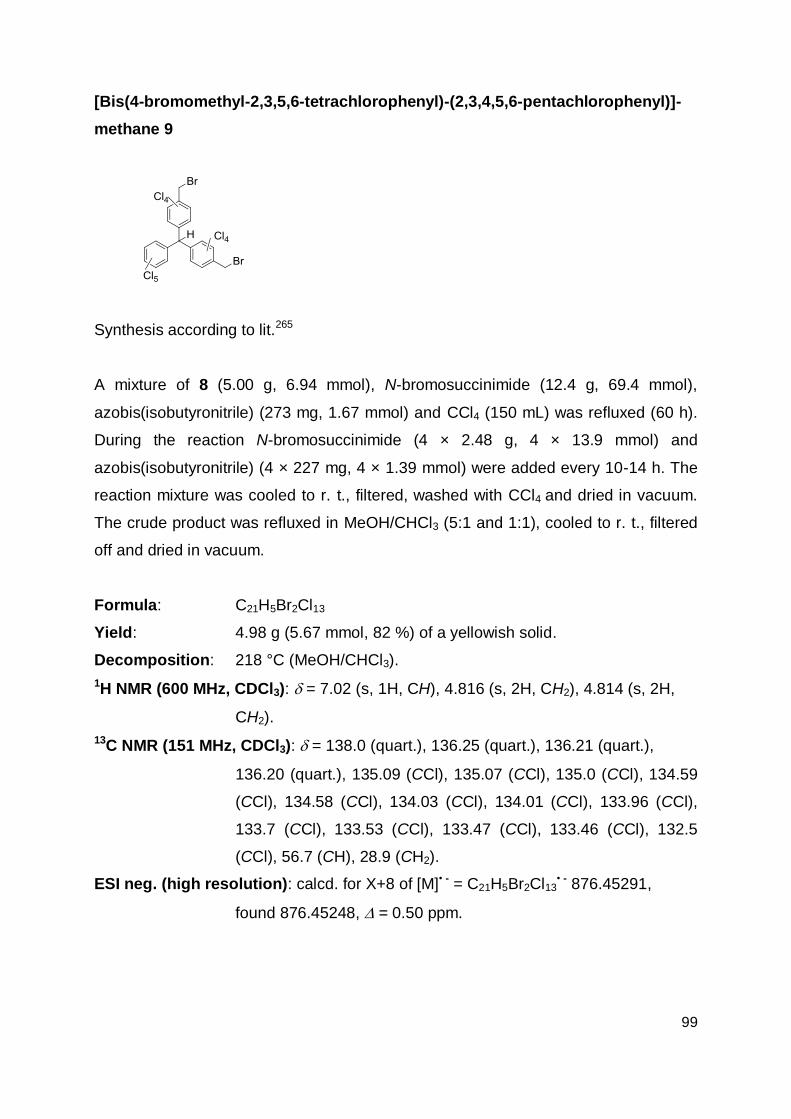
99
[Bis(4-bromomethyl-2,3,5,6-tetrachlorophenyl)-(2,3,4,5,6-pentachlorophenyl)]-
methane 9
Synthesis according to lit.265
A mixture of 8 (5.00 g, 6.94 mmol), N-bromosuccinimide (12.4 g, 69.4 mmol),
azobis(isobutyronitrile) (273 mg, 1.67 mmol) and CCl4 (150 mL) was refluxed (60 h).
During the reaction N-bromosuccinimide (4 × 2.48 g, 4 × 13.9 mmol) and
azobis(isobutyronitrile) (4 × 227 mg, 4 × 1.39 mmol) were added every 10-14 h. The
reaction mixture was cooled to r. t., filtered, washed with CCl4 and dried in vacuum.
The crude product was refluxed in MeOH/CHCl3 (5:1 and 1:1), cooled to r. t., filtered
off and dried in vacuum.
Formula: C21H5Br2Cl13
Yield: 4.98 g (5.67 mmol, 82 %) of a yellowish solid.
Decomposition: 218 °C (MeOH/CHCl3).
1H NMR (600 MHz, CDCl3): = 7.02 (s, 1H, CH), 4.816 (s, 2H, CH2), 4.814 (s, 2H,
CH2).
13C NMR (151 MHz, CDCl3): = 138.0 (quart.), 136.25 (quart.), 136.21 (quart.),
136.20 (quart.), 135.09 (CCl), 135.07 (CCl), 135.0 (CCl), 134.59
(CCl), 134.58 (CCl), 134.03 (CCl), 134.01 (CCl), 133.96 (CCl),
133.7 (CCl), 133.53 (CCl), 133.47 (CCl), 133.46 (CCl), 132.5
(CCl), 56.7 (CH), 28.9 (CH2).
ESI neg. (high resolution): calcd. for X+8 of [M]• - = C21H5Br2Cl13• - 876.45291,
found 876.45248, = 0.50 ppm.
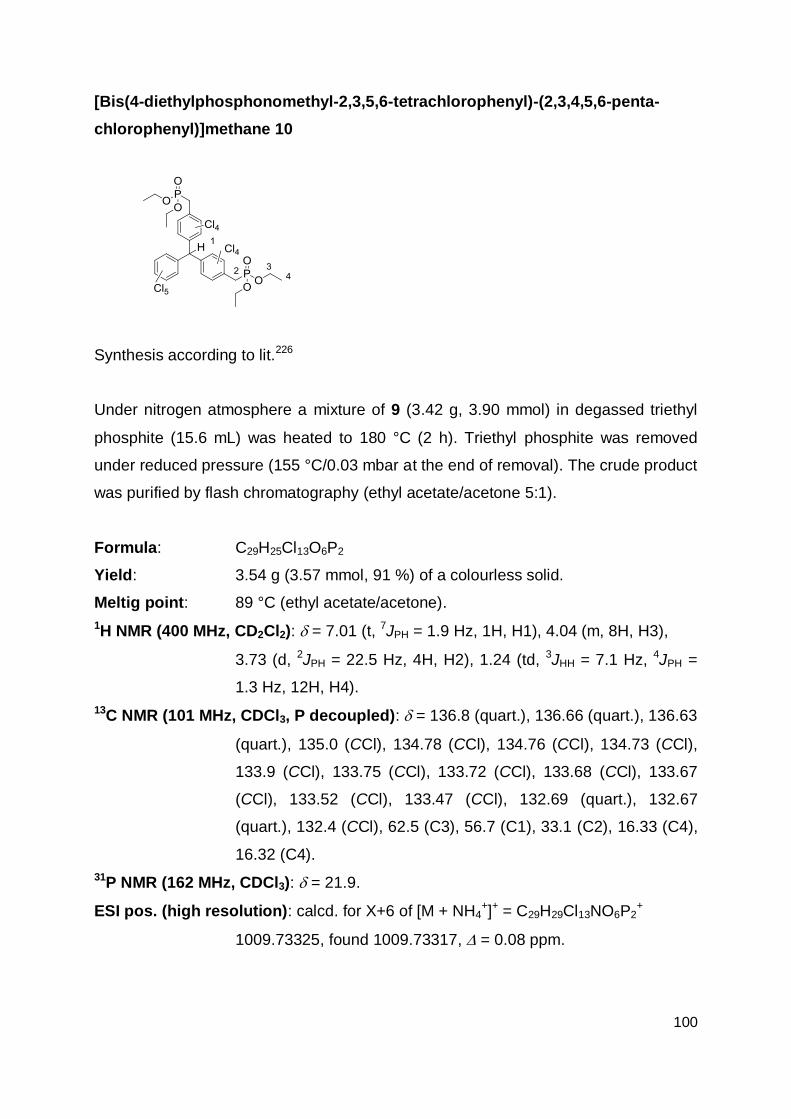
100
[Bis(4-diethylphosphonomethyl-2,3,5,6-tetrachlorophenyl)-(2,3,4,5,6-penta-
chlorophenyl)]methane 10
Synthesis according to lit.226
Under nitrogen atmosphere a mixture of 9 (3.42 g, 3.90 mmol) in degassed triethyl
phosphite (15.6 mL) was heated to 180 °C (2 h). Triethyl phosphite was removed
under reduced pressure (155 °C/0.03 mbar at the end of removal). The crude product
was purified by flash chromatography (ethyl acetate/acetone 5:1).
Formula: C29H25Cl13O6P2
Yield: 3.54 g (3.57 mmol, 91 %) of a colourless solid.
Meltig point: 89 °C (ethyl acetate/acetone).
1H NMR (400 MHz, CD2Cl2): = 7.01 (t, 7JPH = 1.9 Hz, 1H, H1), 4.04 (m, 8H, H3),
3.73 (d, 2JPH = 22.5 Hz, 4H, H2), 1.24 (td, 3JHH = 7.1 Hz, 4JPH =
1.3 Hz, 12H, H4).
13C NMR (101 MHz, CDCl3, P decoupled): = 136.8 (quart.), 136.66 (quart.), 136.63
(quart.), 135.0 (CCl), 134.78 (CCl), 134.76 (CCl), 134.73 (CCl),
133.9 (CCl), 133.75 (CCl), 133.72 (CCl), 133.68 (CCl), 133.67
(CCl), 133.52 (CCl), 133.47 (CCl), 132.69 (quart.), 132.67
(quart.), 132.4 (CCl), 62.5 (C3), 56.7 (C1), 33.1 (C2), 16.33 (C4),
16.32 (C4).
31P NMR (162 MHz, CDCl3): = 21.9.
ESI pos. (high resolution): calcd. for X+6 of [M + NH4+]+ = C29H29Cl13NO6P2
+
1009.73325, found 1009.73317, = 0.08 ppm.

101
[Bis(4-methylene-2,3,5,6-tetrachlorophenyl)-(2,3,4,5,6-pentachlorophenyl)]-
methane bis(triphenyl)phosphonium dibromide 14
Synthesis according to lit.226
A mixture of 9 (3.00 g, 3.42 mmol) and triphenylphosphine (2.86 g, 10.9 mmol) in dry
benzene (78 mL) was refluxed (18 h), cooled to r. t. and then filtered and washed
with benzene. The crude product was refluxed in toluene and filtered off several
times and then the solid was dried at 140 °C/0.1 mbar, whereupon it turned lilac.
After cooling it turned nearly colourless again.
Formula: C57H35Br2Cl13P2
Yield: 3.40 g (2.42 mmol, 71 %) of a slightly lilac solid.
Decomposition: 221 °C (toluene).
1H NMR (400 MHz, [D6]DMSO, P decoupled): = 7.96-7.90 (m, 6H, phenyl), 7.78-
7.68 (m, 24H, phenyl), 6.81 (s, 1H, CH), 5.42 (d, 2JHH = 16.0 Hz,
1H, CH2), 5.41 (d, 2JHH = 15.7 Hz, 1H, CH2), 5.223 (d, 2JHH = 15.7
Hz, 1H, CH2), 5.215 (d, 2JHH = 16.0 Hz, 1H, CH2).
13C NMR (151 MHz, [D6]DMSO): = 137.5 (quart.), 137.42 (quart.), 135.61 (quart.),
135.57 (CHpara), 135.5 (quart.), 135.3 (quart.), 134.5 (quart.),
134.3 (quart. and CHmeta), 134.1 (quart.), 133.6 (quart.), 133.5
(quart.), 133.4 (quart.), 133.1 (quart.), 132.9 (quart.), 131.8
(quart.), 130.3 (CHortho), 130.0 (quart.), 129.9 (quart.), 117.0
(quart., Cipso), 56.3 (CHPCTM), 31.02 (CH2), 31.01 (CH2).
31P NMR (162 MHz, [D6]DMSO): = 20.31, 20.29.
ESI pos. (high resolution): calcd. for [M2+ - H+]+ = C57H34Cl13P2+ 1234.80811, found
1234.80810, = 0.01 ppm.
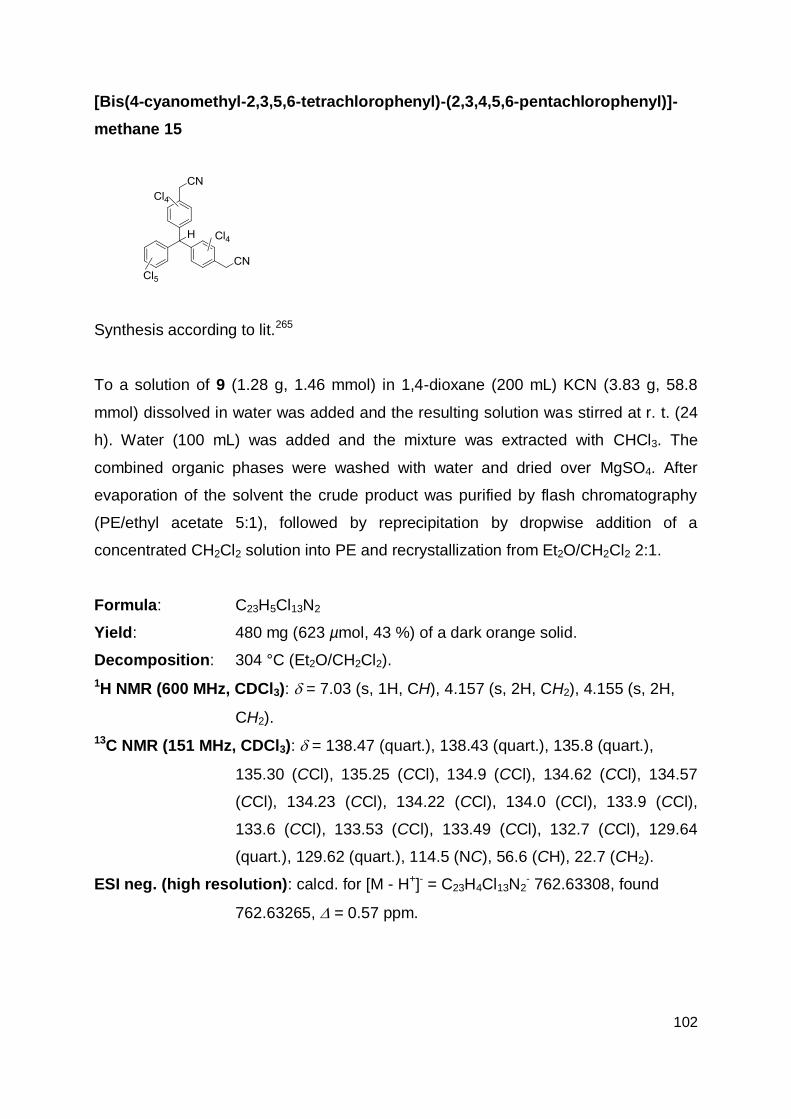
102
[Bis(4-cyanomethyl-2,3,5,6-tetrachlorophenyl)-(2,3,4,5,6-pentachlorophenyl)]-
methane 15
Synthesis according to lit.265
To a solution of 9 (1.28 g, 1.46 mmol) in 1,4-dioxane (200 mL) KCN (3.83 g, 58.8
mmol) dissolved in water was added and the resulting solution was stirred at r. t. (24
h). Water (100 mL) was added and the mixture was extracted with CHCl3. The
combined organic phases were washed with water and dried over MgSO4. After
evaporation of the solvent the crude product was purified by flash chromatography
(PE/ethyl acetate 5:1), followed by reprecipitation by dropwise addition of a
concentrated CH2Cl2 solution into PE and recrystallization from Et2O/CH2Cl2 2:1.
Formula: C23H5Cl13N2
Yield: 480 mg (623 µmol, 43 %) of a dark orange solid.
Decomposition: 304 °C (Et2O/CH2Cl2).
1H NMR (600 MHz, CDCl3): = 7.03 (s, 1H, CH), 4.157 (s, 2H, CH2), 4.155 (s, 2H,
CH2).
13C NMR (151 MHz, CDCl3): = 138.47 (quart.), 138.43 (quart.), 135.8 (quart.),
135.30 (CCl), 135.25 (CCl), 134.9 (CCl), 134.62 (CCl), 134.57
(CCl), 134.23 (CCl), 134.22 (CCl), 134.0 (CCl), 133.9 (CCl),
133.6 (CCl), 133.53 (CCl), 133.49 (CCl), 132.7 (CCl), 129.64
(quart.), 129.62 (quart.), 114.5 (NC), 56.6 (CH), 22.7 (CH2).
ESI neg. (high resolution): calcd. for [M - H+]- = C23H4Cl13N2- 762.63308, found
762.63265, = 0.57 ppm.

103
4’,4’’-diformyl-4-methoxytriphenylamine 16
CA: [149676-16-4]
Synthesis according to lit.229
4-Methoxytriphenylamine232 2.37 g (8.61 mmol)
Phosphoryl chloride 12.7 g (82.9 mmol)
DMF 32 mL
The crude product was dissolved in CH2Cl2 and washed with brine (4 ×). The organic
phase was dried over MgSO4 and the solvent was evaporated to give an oil, which
was purified by flash chromatography (n-hexane/ethyl acetate 4:1).
Formula: C21H17NO3
Yield: 1.06 g (3.20 mmol, 37 %) of a yellow viscous liquid, which
solidified on standing.
1H NMR (400 MHz, CDCl3): = 9.88 (s, 2H, COH), 7.76 (AA‟, 4H, arom.), 7.16 (BB‟,
4H, arom.), 7.11 (AA‟, 2H, arom.), 6.94 (BB‟, 4H, arom.), 3.85 (s,
3H, CH3).

104
4-(2-Ethylhexyloxy)triphenylamine 11
CA: [450944-92-0]
Synthesis according to lit.92
4-[2-(Ethylhexyl)oxy]-1-iodobenzene92 8.00 g (24.1 mmol)
Diphenylamine 2.72 g (16.1 mmol)
K2CO3 11.2 g (81.0 mmol)
Cu powder 2.56 g (40.3 mmol)
18-Crown-6 533 mg (2.02 mmol)
1,2-Dichlorobenzene (dry) 36.0 mL
The reaction time was 4 d.
Formula: C26H31NO
Yield: 3.80 g (10.2 mmol, 63 %) of a colourless, viscous liquid which
solidified on standing.
1H NMR (400 MHz, [D6]acetone): = 7.27-7.19 (m, 4H, arom.), 7.06-6.89 (m, 10H,
arom.), 3.90 (d, 2H, OCH2), 1.77-1.69 (m, 1H, CH), 1.58-1.29 (m,
8H, CH2), 0.98-0.88 (m, 6H, CH3).

105
4’,4’’-diformyl-4-(2-ethylhexyloxy)-triphenylamine 12
CA: [437769-71-6]
Synthesis according to lit.229
11 900 mg (2.41 mmol)
Phosphoryl chloride 3.87 g (25.3 mmol)
DMF 4.74 mL
The crude product was dissolved in CH2Cl2 and washed with brine (4 ×). The organic
phase was dried over MgSO4 and the solvent was evaporated to give an oil, which
was purified by flash chromatography with n-hexane/ethyl acetate 5:1 → 4:1.
Formula: C28H31NO3
Yield: 420 mg (978 µmol, 41 %) of a yellow oil.
1H NMR (400 MHz, [D6]acetone): = 9.91 (s, 2H, COH), 7.83 (AA‟, 4H, arom.), 7.23-
7.16 (broad, 6H, arom.), 7.06 (BB‟, 2H, arom.), 3.96 (d, 2H,
OCH2), 1.80-1.71 (m, 1H, CH), 1.60-1.31 (m, 8H, CH2), 1.01-0.84
(m, 6H, CH3).
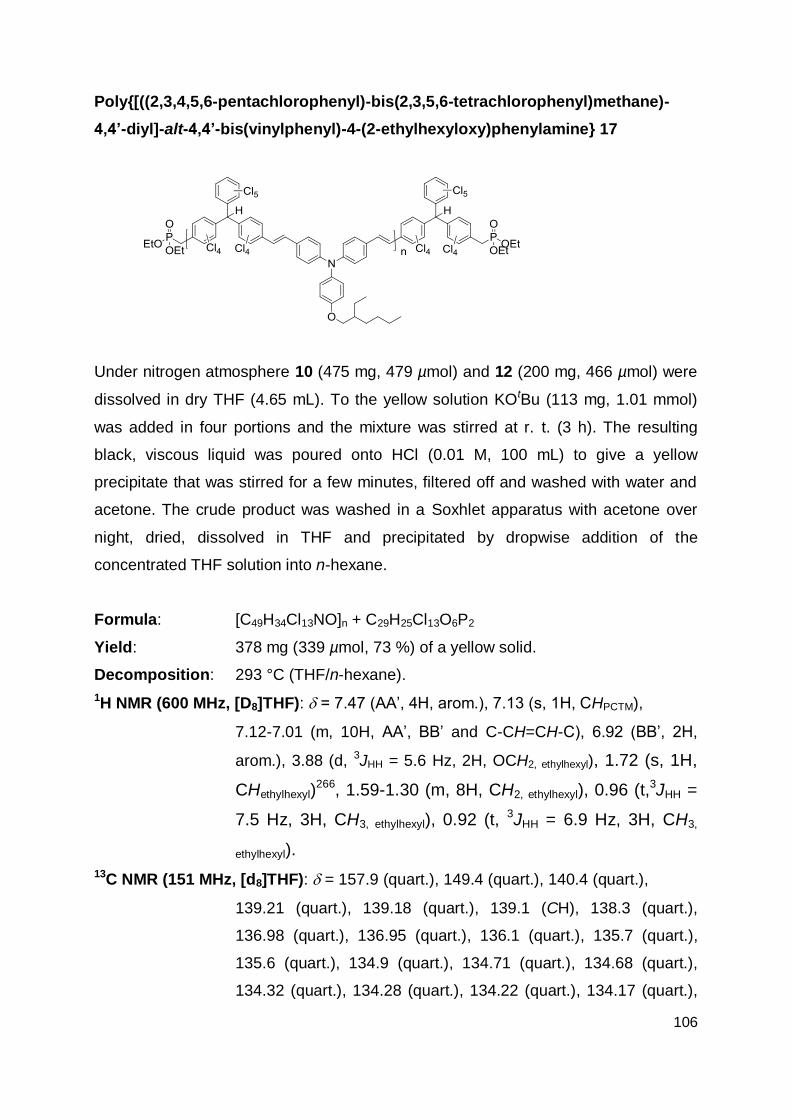
106
Poly{[((2,3,4,5,6-pentachlorophenyl)-bis(2,3,5,6-tetrachlorophenyl)methane)-
4,4’-diyl]-alt-4,4’-bis(vinylphenyl)-4-(2-ethylhexyloxy)phenylamine} 17
Under nitrogen atmosphere 10 (475 mg, 479 µmol) and 12 (200 mg, 466 µmol) were
dissolved in dry THF (4.65 mL). To the yellow solution KOtBu (113 mg, 1.01 mmol)
was added in four portions and the mixture was stirred at r. t. (3 h). The resulting
black, viscous liquid was poured onto HCl (0.01 M, 100 mL) to give a yellow
precipitate that was stirred for a few minutes, filtered off and washed with water and
acetone. The crude product was washed in a Soxhlet apparatus with acetone over
night, dried, dissolved in THF and precipitated by dropwise addition of the
concentrated THF solution into n-hexane.
Formula: [C49H34Cl13NO]n + C29H25Cl13O6P2
Yield: 378 mg (339 µmol, 73 %) of a yellow solid.
Decomposition: 293 °C (THF/n-hexane).
1H NMR (600 MHz, [D8]THF): = 7.47 (AA‟, 4H, arom.), 7.13 (s, 1H, CHPCTM),
7.12-7.01 (m, 10H, AA‟, BB‟ and C-CH=CH-C), 6.92 (BB‟, 2H,
arom.), 3.88 (d, 3JHH = 5.6 Hz, 2H, OCH2, ethylhexyl), 1.72 (s, 1H,
CHethylhexyl)266, 1.59-1.30 (m, 8H, CH2, ethylhexyl), 0.96 (t,3JHH =
7.5 Hz, 3H, CH3, ethylhexyl), 0.92 (t, 3JHH = 6.9 Hz, 3H, CH3,
ethylhexyl).
13C NMR (151 MHz, [d8]THF): = 157.9 (quart.), 149.4 (quart.), 140.4 (quart.),
139.21 (quart.), 139.18 (quart.), 139.1 (CH), 138.3 (quart.),
136.98 (quart.), 136.95 (quart.), 136.1 (quart.), 135.7 (quart.),
135.6 (quart.), 134.9 (quart.), 134.71 (quart.), 134.68 (quart.),
134.32 (quart.), 134.28 (quart.), 134.22 (quart.), 134.17 (quart.),
107
133.2 (quart.), 133.11 (quart.), 133.08 (quart.), 130.8 (quart.),
128.8 (CH), 128.6 (CH), 123.5 (CH), 121.7 (CH), 116.3 (CH),
71.1 (OCH2, ethylhexyl), 57.8 (CHPCTM), 40.6 (CHethylhexyl), 31.5 (CH2,
ethylhexyl), 30.0 (CH2, ethylhexyl), 24.8 (CH2, ethylhexyl), 23.9 (CH2,
ethylhexyl), 14.4 (CH3, ethylhexyl), 11.5 (CH3, ethylhexyl).
GPC (THF): w = 17100 Da, n = 9600 Da, PDI = 1.77.
IR: /cm-1 = 3037 (w), 2956 (m), 2927 (m), 2869 (m), 2860 (m),
1628 (w), 1595 (s), 1540 (w), 1506 (s), 1466 (w), 1365 (m), 1316
(s), 1292 (s), 1269 (v), 1240 (s), 1191 (w), 1178 (m), 1164 (w),
1139 (w), 1105 (w), 1028 (w), 967 (w), 910 (w), 809 (m), 728 (w).
UV/vis(CH2Cl2): /cm-1 (M-1 cm-1) = 34500 (34000), 24500 (42100).

108
Poly{[((2,3,4,5,6-pentachlorophenyl)-bis(2,3,5,6-tetrachlorophenyl)methyl
radical)-4,4’-diyl]-alt-4,4’-bis(vinylphenyl)-4-(2-ethylhexyloxy)phenylamin} P4
Synthesis according to lit.226
Under nitrogen atmosphere polymer 17 (100 mg, 89.8 µmol) was dissolved in dry
THF (4.5 mL). nBu4NOH (125 µL, 188 µmol, ~1.5 M in H2O) was added whereupon
the colour of the reaction mixture immediately changed from yellow to dark blue. After
1 h of stirring at r. t. p-chloranil (57.4 mg, 233 µmol) was added and the dark brown
mixture was further stirred at r. t. (21 h) before it was dropped into a mixture of
acetone (70 mL) and 2 N HCl (0.12 mL) to give a dark brown precipitate which was
separated by centrifugation and washed with MeOH. The product was dissolved in
THF, dropped into acetone (70 mL)/2 N HCl (0.12 mL), centrifuged and washed with
MeOH two more times. Finally it was washed with acetone in a Soxhlet apparatus
over night.
Formula: [C49H33Cl13NO•]n + C29H25Cl13O6P2
Yield: 88.6 mg (79.6 µmol, 89 %) of a dark brown powder.
Decomposition: 250 °C (DSC measurement, acetone).
GPC (THF): w = 19300 Da, n = 11200 Da, PDI = 1.72.
IR: /cm-1 = 3033 (w), 2953 (m), 2924 (m), 2869 (m), 2860 (m),
1592 (s), 1506 (s), 1467 (w), 1426 (w), 1379 (w), 1335 (v), 1323
(s), 1287 (m), 1259 (s), 1239 (s), 1225 (v), 1192 (w), 1178 (s),
1164 (m), 1027 (w), 964 (w), 814 (w), 737 (w), 661 (w).
UV/vis/NIR(CH2Cl2): /cm-1 (M-1 cm-1) = 34700 (28600), 23800 (43300), 20000
(shoulder), 17600 (shoulder), 12600 (6300).

109
6 References
(1) Chiang, C. K.; Druy, M. A.; Gau, S. C.; Heeger, A. J.; Louis, E. J.; MacDiarmid, A. G.; Park, Y. W.; Shirakawa, H. J. Am. Chem. Soc. 1978, 100, 1013-1015.
(2) Heeger, A. J. Angew. Chem. 2001, 113, 2660-2682. (3) MacDiarmid, A. G. Angew. Chem. 2001, 113, 2649-2659. (4) Shirakawa, H. Angew. Chem. 2001, 113, 2642-2648. (5) Moerner, W. E.; Silence, S. M. Chem. Rev. 1994, 94, 127-155. (6) Steckler, T. T.; Zhang, X.; Hwang, J.; Honeyager, R.; Ohira, S.; Zhang, X.-H.;
Grant, A.; Ellinger, S.; Odom, S. A.; Sweat, D.; Tanner, D. B.; Rinzler, A. G.; Barlow, S.; Brédas, J.-L.; Kippelen, B.; Marder, S. R.; Reynolds, J. R. J. Am. Chem. Soc. 2009, 131, 2824-2826.
(7) Usta, H.; Facchetti, A.; Marks, T. J. J. Am. Chem. Soc. 2008, 130, 8580-8581. (8) Zaumseil, J.; Sirringhaus, H. Chem. Rev. 2007, 107, 1296-1323. (9) Zhu, Z.; Waller, D.; Gaudiana, R.; Morana, M.; Mühlbacher, D.; Scharber, M.;
Brabec, C. Macromolecules 2007, 40, 1981-1986. (10) Chen, M. X.; Perzon, E.; Robisson, N.; Jönsson, S. K. M.; Andersson, M. R.;
Fahlman, M.; Berggren, M. Synth. Met. 2004, 146, 233-236.
(11) Gong, X.; Wang, S. Polymer Light-Emitting Diodes: Devices and Materials. In Introduction to Organic Electronic and Optoelectronic Materials and Devices; Sun, S.-S. and Dalton, L. R., Eds.; CRC Press: Boca Raton, 2008.
(12) Kulkarni, A. P.; Kong, X.; Janekhe, S. A. Macromolecules 2006, 39, 8699-
8711. (13) Blouin, N.; Michaud, A.; Gendron, D.; Wakim, S.; Blair, E.; Neagu-Plesu, R.;
Belletête, M.; Durocher, G.; Tao, Y.; Leclerc, M. J. Am. Chem. Soc. 2008, 130, 732-742.
(14) Bundgaard, E.; Krebs, F. C. Sol. Energy Mater. Sol. Cells 2007, 91, 954-985. (15) Sun, S.-S.; Zhang, C. Organic and Polymeric Photovoltaic Materials and
Devices. In Introduction to Organic Electronic and Optoelectronic Materials and Devices; Sun, S.-S. and Dalton, L. R., Eds.; CRC Press: Boca Raton, 2008.
(16) Wienk, M. M.; Turbiez, M.; Gilot, J.; Janssen, R. A. J. Adv. Mater. 2008, 20,
2556-2560. (17) Arias, A. C.; Ready, S. E.; Lujan, R.; Wong, W. S.; Paul, K. E.; Salleo, A.;
Chabinyc, M. L.; Apte, R.; Street, R. A.; Wu, Y.; Liu, P.; Ong, B. Appl. Phys. Lett. 2004, 85, 3304-3306.
(18) de Gans, B.-J.; Duineveld, P. C.; Schubert, U. S. Adv. Mater. 2004, 16, 203-213.
(19) Allard, S.; Forster, M.; Souharce, B.; Thiem, H.; Scherf, U. Angew. Chem. Int. Ed. 2008, 47, 4070-4098.
(20) Sandberg, H. G. O. Polymer Field-Effect Transistors. In Introduction to Organic Electronic and Optoelectronic Materials and Devices; Sun, S.-S. and Dalton, L. R., Eds.; CRC Press: Boca Raton, 2008.
(21) Gelinck, G. H.; Huitema, H. E. A.; van Veenendaal, E.; Cantatore, E.; Schrijnemakers, L.; van der Putten, J. B. P. H.; Geuns, T. C. T.; Beenhakkers, M.; Giesbers, J. B.; Huisman, B.-H.; Meijer, E. J.; Benito, E. M.; Touwslager, F. J.; Marsman, A. W.; van Rens, B. J. E.; de Leeuw, D. M. Nat. Mater. 2004, 3, 106-110.

110
(22) Rogers, J. A.; Bao, Z. J. Polym. Sci. A: Polym. Chem. 2002, 40, 3327-3334.
(23) Sheraw, C. D.; Zhou, L.; Huang, J. R.; Gundlach, D. J.; Jackson, T. N.; Kane, M. G.; Hill, I. G.; Hammond, M. S.; Campi, J.; Greening, B. K.; Francl, J.; West, J. Appl. Phys. Lett. 2002, 80, 1088-1090.
(24) https://projects.imec.be/oricla/. (25) http://www.polyic.com/en/projects.php#. (26) http://www.polyic.com/en/poly-logo.php. (27) Sirringhaus, H. Adv. Mater. 2005, 17, 2411-2425. (28) Arias, A. C.; Endicott, F.; Street, R. A. Adv. Mater. 2006, 18, 2900-2904.
(29) Hoshino, S.; Yoshida, M.; Uemura, S.; Kodzasa, T.; Takada, N.; Kamata, T.; Yase, K. J. Appl. Phys. 2004, 95, 5088-5093.
(30) Russell, D. M.; Kugler, T.; Newsome, C. J.; Li, S. P.; Ishida, M.; Shimoda, T. Synth. Met. 2006, 156, 769-772.
(31) Street, R. A.; Salleo, A. Appl. Phys. Lett. 2002, 81, 2887-2889. (32) Cho, J. H.; Kim, D. H.; Jang, Y.; Lee, W. H.; Ihm, K.; Han, J.-H.; Chung, S.;
Cho, K. Appl. Phys. Lett. 2006, 89, 132101. (33) Gao, Y. Organic/Metal Interface Properties. In Introduction to Organic
Electronic and Optoelectronic Materials and Devices; Sun, S.-S. and Dalton, L. R., Eds.; CRC Press: Boca Raton, 2008.
(34) Cheng, X.; Noh, Y.-Y.; Wang, J.; Tello, M.; Frisch, J.; Blum, R.-P.; Vollmer, A.; Rabe, J. P.; Koch, N.; Sirringhaus, H. Adv. Funct. Mater. 2009, 19, 2407-2415.
(35) Schmechel, R. ; Ahles, M.; von Seggern, H. J. Appl. Phys. 2005, 98, 084511. (36) Bürgi, L.; Richards, T. J.; Friend, R. H.; Sirringhaus, H. J. Appl. Phys. 2003,
94, 6129-6137. (37) Kawase, T.; Shimoda, T.; Newsome, C.; Sirringhaus, H.; Friend, R. H. Thin
Solid Films 2003, 438, 279-287. (38) Sele, C. W.; von Werne, T.; Friend, R. H.; Sirringhaus, H. Adv. Mater. 2005,
17, 997-1001. (39) Sirringhaus, H.; Kawase, T.; Friend, R. H.; Shimoda, T.; Inbasekaran, M.; Wu,
W.; Woo, E. P. Science 2000, 290, 2123-2126. (40) Lefenfeld, M.; Blanchet, G.; Rogers, J. A. Adv. Mater. 2003, 15, 1188-1191.
(41) Mäkelä, T.; Jussila, S.; Kosonen, H. ; Bäcklund, T. G.; Sandberg, H. G. O.; Stubb, H. Synth. Met. 2005, 153, 285-288.
(42) Lee, K. S.; Smith, T. J.; Dickey, K. C.; Yoo, J. E.; Stevenson, K. J.; Loo, Y.-L. Adv. Funct. Mater. 2006, 16, 2409-2414.
(43) Chua, L.-L.; Zaumseil, J.; Chang, J.-F.; Ou, E. C.-W.; Ho, P. K.-H.; Sirringhaus, H.; Friend, R. H. Nature 2005, 434, 194-199.
(44) Veres, J.; Ogier, S. D.; Leeming, S. W.; Cupertino, D. C.; Khaffaf, S. M. Adv. Funct. Mater. 2003, 13, 199-204.
(45) Menard, E.; Podzorov, V.; Hur, S.-H.; Gaur, A.; Gershenson, M. E.; Rogers, J. A. Adv. Mater. 2004, 16, 2097-2101.
(46) Podzorov, V.; Menard, E.; Borissov, A.; Kiryukhin, V.; Rogers, J. A.; Gershenson, M. E. Phys. Rev. Lett. 2004, 93, 086602.
(47) Yan, H.; Chen, Z.; Zheng, Y.; Newman, C.; Quinn, J. R.; Dötz, F.; Kastler, M.; Facchetti, A. Nature 2009, 457, 679-686.
(48) Facchetti, A. Molecular Semiconductors for Organic Field-Effect Transistors. In Introduction to Organic Electronic and Optoelectronic Materials and Devices; Sun, S.-S. and Dalton, L. R., Eds.; CRC Press: Boca Raton, 2008.

111
(49) Sirringhaus, H.; Brown, P. J.; Friend, R. H.; Nielsen, M. M.; Bechgaard, K.; Langeveld-Voss, B. M. W.; Spiering, A. J. H.; Janssen, R. A. J.; Meijer, E. W.; Herwig, P.; de Leeuw, D. M. Nature 1999, 401, 685-688.
(50) Tanase, C.; Wildeman, J.; Blom, P. W. M.; Benito, M. E. M.; de Leeuw, D. M.; van Breemen, A. J. J. M.; Herwig, P. T.; Chlon, C. H. T.; Sweelssen, J.; Schoo, H. F. M. J. Appl. Phys. 2005, 97, 123703.
(51) van Breemen, A. J. J. M.; Herwig, P. T.; Chlon, C. H. T.; Sweelssen, J.; Schoo, H. F. M.; Benito, E. M.; de Leeuw, D. M.; Tanase, C.; Wildeman, J.; Blom, P. W. M. Adv. Funct. Mater. 2005, 15, 872-876.
(52) Ullmann, A.; Ficker, J.; Fix, W.; Rost, H.; Clemens, W.; McCulloch, I.; Giles, M. Mater. Res. Soc. Proc. 2001, 665, C7.5.
(53) Wang, G.; Swensen, J.; Moses, D.; Heeger, A. J. J. Appl. Phys. 2003, 93, 6137-6141.
(54) Kline, R. J.; McGehee, M. D.; Kadnikova, E. N.; Liu, J.; Fréchet, J. M. J. Adv. Mater. 2003, 15, 1519-1522.
(55) Kline, R. J.; McGehee, M. D.; Kadnikova, E. N.; Liu, J.; Fréchet, J. M. J.; Toney, M. F. Macromolecules 2005, 38, 3312-3319.
(56) Zen, A.; Pflaum, J.; Hirschmann, S.; Zhuang, W.; Jaiser, F.; Asawapirom, U.; Rabe, J. P.; Scherf, U.; Neher, D. Adv. Funct. Mater. 2004, 14, 757-764.
(57) Chen, T.-A.; Wu, X.; Rieke, R. D. J. Am. Chem. Soc. 1995, 117, 233-244. (58) Pan, H.; Li, Y.; Wu, Y.; Liu, P.; Ong, B. S.; Zhu, S.; Xu, G. J. Am. Chem. Soc.
2007, 129, 4112-4113. (59) McCulloch, I.; Heeney, M.; Bailey, C.; Genevicius, K.; MacDonald, I.; Shkunov,
M.; Sparrowe, D.; Tierney, S.; Wagner, R.; Zhang, W.; Chabinyc, M. L.; Kline, R. J.; McGehee, M. D.; Toney, M. F. Nat. Mater. 2006, 5, 328-333.
(60) Zhang, M.; Tsao, H. N.; Pisula, W.; Yang, C.; Mishra, A. K.; Müllen, K. J. Am. Chem. Soc. 2007, 129, 3472-3473.
(61) Liu, J.; Zhang, R.; Sauvé, G.; Kowalewski, T.; McCullough, R. D. J. Am. Chem. Soc. 2008, 130, 13167-13176.
(62) Veres, J.; Ogier, S.; Lloyd, G.; de Leeuw, D. Chem. Mater. 2004, 16, 4543-4555.
(63) Zielke, D.; Hübler, A. C.; Hahn, U.; Brandt, N.; Bartzsch, M.; Fügmann, U.; Fischer, T.; Veres, J.; Ogier, S. Appl. Phys. Lett. 2005, 87, 123508.
(64) de Leeuw, D. M.; Simenon, M. M. J.; Brown, A. R.; Einerhand, R. E. F. Synth. Met. 1997, 87, 53-59.
(65) Yoon, M.-H.; Kim, C.; Facchetti, A.; Marks, T. J. J. Am. Chem. Soc. 2006, 128, 12851-12869.
(66) Letizia, J. A.; Salata, M. R.; Tribout, C. M.; Facchetti, A.; Ratner, M. A.; Marks, T. J. J. Am. Chem. Soc. 2008, 130, 9679-9694.
(67) Zhan, X.; Tan, Z.; Domercq, B.; An, Z.; Zhang, X.; Barlow, S.; Li, Y.; Zhu, D.; Kippelen, B.; Marder, S. R. J. Am. Chem. Soc. 2007, 129, 7246-7247.
(68) Babel, A.; Jenekhe, S. A. J. Am. Chem. Soc. 2003, 125, 13656-13657. (69) Meijer, E. J.; de Leeuw, D. M.; Setayesh, S.; van Veenendaal, E.; Huisman,
B.-H.; Blom, P. W. M.; Hummelen, J. C.; Scherf, U.; Klapwijk, T. M. Nat. Mater. 2003, 2, 678-682.
(70) Singh, T. B.; Marjanović, N.; Matt, G. J.; Günes, S.; Sariciftci, N. S.; Montaigne Ramil, A.; Andreev, A.; Sitter, H.; Schwödiauer, R.; Bauer, S. Org. Electron. 2005, 6, 105-110.
(71) Wang, J.; Wang, H.; Yan, X.; Huang, H.; Yan, D. Appl. Phys. Lett. 2005, 87, 093507.

112
(72) Wang, S. D.; Kanai, K.; Ouchi, Y.; Seki, K. Org. Electron. 2006, 7, 457-464. (73) Liu, C.; Sirringhaus, H. Org. Electron. 2010, 11, 558-563. (74) Szendrei, K.; Jarzab, D.; Chen, Z.; Facchetti, A.; Loi, M. A. J. Mater. Chem.
2010, 20, 1317-1321. (75) Swensen, J. S.; Yuen, J.; Gargas, D.; Buratto, S. K.; Heeger, A. J. J. Appl.
Phys. 2007, 102, 013103. (76) Zaumseil, J.; Friend, R. H.; Sirringhaus, H. Nat. Mater. 2006, 5, 69-74. (77) Kajii, H.; Koiwai, K.; Hirose, Y.; Ohmori, Y. Org. Electron. 2010, 11, 509-513. (78) Bijleveld, J. C.; Zoombelt, A. P.; Mathijssen, S. G. J.; Wienk, M. M.; Turbiez,
M.; de Leeuw, D. M.; Janssen, R. A. J. J. Am. Chem. Soc. 2009, 131, 16616-16617.
(79) Bürgi, L.; Turbiez, M.; Pfeiffer, R.; Bienewald, F.; Kirner, H.-J.; Winnewisser, C. Adv. Mater. 2008, 20, 2217-2224.
(80) Zaumseil, J.; Donley, C. L.; Kim, J.-S.; Friend, R. H.; Sirringhaus, H. Adv. Mater. 2006, 18, 2708-2712.
(81) Naber, R. C. G.; Bird, M.; Sirringhaus, H. Appl. Phys. Lett. 2008, 93, 023301. (82) Zoombelt, A. P.; Mathijssen, S. G. J.; Turbiez, M. G. R.; Wienk, M. M.;
Janssen, R. A. J. J. Mater. Chem. 2010, 20, 2240-2246. (83) http://www.oled.at/produkte.htm. (84) http://www.novaled.com/aboutoleds/oledsindisplay.html. (85) http://www.novaled.com/news/2010_05_20_pr.html. (86) Reineke, S.; Lindner, F.; Schwartz, G.; Seidler, N.; Walzer, K.; Lussem, B.;
Leo, K. Nature 2009, 459, 234-U116.
(87) http://www.newscenter.philips.com/de_de/standard/news/lighting/20100913_Philips_praesentiert_weltweit_erstes_Weisslicht_OLED_Modul.wpd.
(88) http://www.lighting.philips.com/main/lightcommunity/trends/led/lumiblade.wpd. (89) Hertel, D.; Müller, C. D.; Meerholz, K. Chem. Unserer Zeit 2005, 39, 336-347. (90) Fu, Y.; Sun, M.; Wu, Y.; Bo, Z.; Ma, D. J. Polym. Sci. A: Polym. Chem. 2008,
46, 1349-1356. (91) Huang, J.; Niu, Y.; Xu, Y.; Hou, Q.; Yang, W.; Mo, Y.; Yuan, M.; Cao, Y. Synth.
Met. 2003, 135-136, 181-182. (92) Karastatiris, P.; Mikroyannidis, J. A.; Spiliopoulos, I. K. J. Polym. Sci. A:
Polym. Chem. 2008, 46, 2367-2378. (93) Mazzeo, M.; Vitale, V.; Della Sala, F.; Anni, M.; Barbarella, G.; Favaretto, L.;
Sotgiu, G.; Cingolani, R.; Gigli, G. Adv. Mater. 2005, 17, 34-39. (94) Yuan, M.-C.; Shih, P.-I.; Chien, C.-H.; Shu, C.-F. J. Polym. Sci. A: Polym.
Chem. 2007, 45, 2925-2937. (95) Conjugated Polymers and Molecular Interfaces. Salaneck, W. R., et al., Eds.;
Marcel Dekker: New York, 2002. (96) Wang, L.; Matson, D. W.; Polikarpov, E.; Swensen, J. S.; Bonham, C. C.;
Cosimbescu, L.; Berry, J. J.; Ginley, D. S.; Gaspar, D. J.; Padmaperuma, A. B. J. Appl. Phys. 2010, 107, 043103.
(97) Matsumoto, N.; Miyazaki, T.; Nishiyama, M.; Adachi, C. J. Phys. Chem. C 2009, 113, 6261-6266.
(98) Kulkami, A. P.; Zhu, Y.; Babel, A.; Wu, P. T.; Jenekhe, S. A. Chem. Mater. 2008, 20, 4212-4223.
(99) Kinoshita, M.; Kita, H.; Shirota, Y. Adv. Funct. Mater. 2002, 12, 780-786. (100) Murata, H.; Kafafi, Z. H.; Uchida, M. Appl. Phys. Lett. 2002, 80, 189-191.

113
(101) Palilis, L. C.; Mäkinen, A. J.; Uchida, M.; Kafafi, Z. H. Appl. Phys. Lett. 2003,
82, 2209-2211. (102) Shirota, Y.; Kuwabara, Y.; Inada, H.; Wakimoto, T.; Nakada, H.; Yonemoto, Y.;
Kawami, S.; Imai, K. Appl. Phys. Lett. 1994, 65, 807-809. (103) van Slyke, S. A.; Chen, C. H.; Tang, C. W. Appl. Phys. Lett. 1996, 69, 2160-
2162. (104) Jia, W. L.; Feng, X. D.; Bai, D. R.; Lu, Z. H.; Wang, S.; Vamvounis, G. Chem.
Mater. 2005, 17, 164-170. (105) Jin, S.-H.; Kim, W.-H.; Song, I.-S.; Kwon, S.-K.; Lee, K.-S.; Han, E.-M. Thin
Solid Films 2000, 363, 255-258. (106) Zhang, H.; Huo, C.; Zhang, J.; Zhang, P.; Tian, W.; Wang, Y. Chem. Commun.
2006, 281-283. (107) Morin, J.-F.; Beaupré, S.; Leclerc, M.; Lévesque, I.; D'Iorio, M. Appl. Phys.
Lett. 2002, 80, 341-343. (108) Romero, D. B.; Schaer, M.; Leclerc, M.; Adès, D.; Siove, A.; Zuppiroli, L.
Synth. Met. 1996, 80, 271-277. (109) Doi, H.; Kinoshita, M.; Okumoto, K.; Shirota, Y. Chem. Mater. 2003, 15, 1080-
1089. (110) Noda, T.; Shirota, Y. J. Am. Chem. Soc. 1998, 120, 9714-9715.
(111) Jia, W. L.; Moran, M. J.; Yuan, Y.-Y.; Lu, Z. H.; Wang, S. J. Mater. Chem. 2005, 15, 3326-3333.
(112) Jia, W.-L.; Bai, D.-R.; McCormick, T.; Liu, Q.-D.; Motala, M.; Wang, R.-Y.; Seward, C.; Tao, Y.; Wang, S. Chem. Eur. J. 2004, 10, 994-1006.
(113) Noda, T.; Shirota, Y. J. Lumin. 2000, 87-89, 1168-1170. (114) http://www.oled.at/oled-herstellung.htm. (115) Huang, S.-T.; Liaw, D.-J.; Hsieh, L.-G.; Chang, C.-C.; Leung, M.-K.; Wang, K.-
L.; Chen, W.-T.; Lee, K.-R.; Lai, J.-Y.; Chan, L.-H.; Chen, C.-T. J. Polym. Sci. A: Polym. Chem. 2009, 47, 6231-6245.
(116) Li, H.; Hu, Y.; Zhang, Y.; Ma, D.; Wang, L.; Jing, X.; Wang, F. J. Polym. Sci. A: Polym. Chem. 2004, 42, 3947-3953.
(117) Peng, Z.; Bao, Z.; Galvin, M. E. Chem. Mater. 1998, 10, 2086-2090. (118) Pu, Y.-J.; Kurata, T.; Soma, M.; Kido, J.; Nishide, H. Synth. Met. 2004, 143,
207-214. (119) Shu, C.-F.; Dodda, R.; Wu, F.-I.; Liu, M. S.; Jen, A. K.-Y. Macromolecules
2003, 36, 6698-6703.
(120) http://www.solarmer.com. (121) Thompson, B. C.; Fréchet, J. M. J. Angew. Chem. Int. Ed. 2008, 47, 58-77. (122) Spanggaard, H.; Krebs, F. C. Sol. Energy Mater. Sol. Cells 2004, 83, 125-146. (123) Yu, G.; Gao, J.; Hummelen, J. C.; Wudl, F.; Heeger, A. J. Science 1995, 270,
1789-1791. (124) Dennler, G.; Scharber, M. C.; Brabec, C. J. Adv. Mater. 2009, 21, 1323-1338.
(125) Brabec, C. J.; Zerza, G.; Cerullo, G.; De Silvestri, S. ; Luzzati, S.; Hummelen, J. C.; Sariciftci, S. Chem. Phys. Lett. 2001, 340, 232-236.
(126) Chen, C.-P.; Chan, S.-H.; Chao, T.-C.; Ting, C.; Ko, B.-T. J. Am. Chem. Soc. 2008, 130, 12828-12833.
(127) Mühlbacher, D.; Scharber, M.; Morana, M.; Zhu, Z.; Waller, D.; Gaudiana, R.; Brabec, C. Adv. Mater. 2006, 18, 2884-2889.
(128) Wienk, M. M.; Kroon, J. M.; Verhees, W. J. H.; Knol, J.; Hummelen, J. C.; van Hal, P. A.; Janssen, R. A. J. Angew. Chem. 2003, 115, 3493-3497.
(129) Winder, C.; Sariciftci, N. S. J. Mater. Chem. 2004, 14, 1077-1086.

114
(130) Scharber, M. C.; Mühlbacher, D.; Koppe, M.; Denk, P.; Waldauf, C.; Heeger, A. J.; Brabec, C. J. Adv. Mater. 2006, 18, 789-794.
(131) Po, R.; Maggini, M.; Camaioni, N. J. Phys. Chem. C 2010, 114, 695-706. (132) Cai, W.; Gong, X.; Cao, Y. Sol. Energy Mater. Sol. Cells 2010, 94, 114-127. (133) Roncali, J. Chem. Rev. 1997, 97, 173-205. (134) Havinga, E. E.; ten Hoeve, W.; Wynberg, H. Polym. Bull. 1992, 29, 119-126. (135) Havinga, E. E. ; ten Hoeve, W. ; Wynberg, H. Synth. Met. 1993, 55, 299-306. (136) Brédas, J. L.; Heeger, A. J.; Wudl, F. J. Chem. Phys. 1986, 85, 4673-4678. (137) Meng, H.; Wudl, F. Macromolecules 2001, 34, 1810-1816. (138) Wudl, F.; Kobayashi, M.; Heeger, A. J. J. Org. Chem. 1984, 49, 3382-3384. (139) Blouin, N.; Michaud, A.; Leclerc, M. Adv. Mater. 2007, 19, 2295-2300.
(140) Boudreault, P.-L. T.; Michaud, A.; Leclerc, M. Macromol. Rapid Commun. 2007, 28, 2176-2179.
(141) Chen, H.-Y.; Hou, J.; Zhang, S.; Liang, Y.; Yang, G.; Yang, Y.; Yu, L.; Wu, Y.; Li, G. Nat. Photon. 2009, 3, 649-653.
(142) Colladet, K.; Fourier, S.; Cleij, T. J.; Lutsen, L.; Gelan, J.; Vanderzande, D. Macromolecules 2007, 40, 65-72.
(143) Liang, Y.; Feng, D.; Wu, Y.; Tsai, S.-T.; Li, G.; Ray, C.; Yu, L. J. Am. Chem. Soc. 2009, 131, 7792-7799.
(144) Mikroyannidis, J. A.; Sharma, G. D.; Sharma, S. S.; Vijay, Y. K. J. Phys. Chem. C 2010, 114, 1520-1527.
(145) Peet, J.; Kim, J. Y.; Coates, N. E.; Ma, W. L.; Moses, D.; Heeger, A. J.; Bazan, G. C. Nat. Mater. 2007, 6, 497-500.
(146) Wong, W.-Y.; Wang, X.-Z.; He, Z.; Djurišić, A. B.; Yip, C.-T.; Cheung, K.-Y.; Wang, H.; Mak, C. S. K.; Chan, W.-K. Nat. Mater. 2007, 6, 521-527.
(147) Yue, W.; Zhao, Y.; Tian, H.; Song, D.; Xie, Z.; Yan, D.; Geng, Y.; Wang, F. Macromolecules 2009, 42, 6510-6518.
(148) Zhang, F.; Mammo, W.; Andersson, L. M.; Admassie, S.; Andersson, M. R.; Inganäs, O. Adv. Mater. 2006, 18, 2169-2173.
(149) Ma, W.; Yang, C.; Gong, X.; Lee, K.; Heeger, A. J. Adv. Funct. Mater. 2005, 15, 1617-1622.
(150) Reyes-Reyes, M.; Kim, K.; Carroll, D. L. Appl. Phys. Lett. 2005, 87, 083506. (151) Reyes-Reyes, M.; Kim, K.; Dewald, J.; López-Sandoval, R.; Avadhanula, A.;
Curran, S.; Carroll, D. L. Org. Lett. 2005, 7, 5749-5752. (152) Al-Ibrahim, M.; Ambacher, O.; Sensfuss, S.; Gobsch, G. Appl. Phys. Lett.
2005, 86, 201120. (153) Chirvase, D.; Parisi, J.; Hummelen, J. C.; Dyakonov, V. Nanotechnol. 2004,
15, 1317-1323. (154) Li, G.; Yao, Y.; Yang, H.; Shrotriya, V.; Yang, G.; Yang, Y. Adv. Funct. Mater.
2007, 17, 1636-1644. (155) Padinger, F.; Rittberger, R. S.; Sariciftci, N. S. Adv. Funct. Mater. 2003, 13,
85-88. (156) Yang, X.; Loos, J.; Veenstra, S. C.; Verhees, W. J. H.; Wienk, M. M.; Kroon, J.
M.; Michels, M. A. J.; Janssen, R. A. J. Nano Lett. 2005, 5, 579-583. (157) Morin, J.-F.; Leclerc, M.; Adès, D.; Siove, A. Macromol. Rapid Commun. 2005,
26, 761-778. (158) Paliulis, O.; Ostrauskaite, J.; Gaidelis, V.; Jankauskas, V.; Strohriegl, P.
Macromol. Chem. Phys. 2003, 204, 1706-1712. (159) Lmimouni, K.; Legrand, C.; Chapoton, A. Synth. Met. 1998, 97, 151-155. (160) Stéphan, O.; Vial, J.-C. Synth. Met. 1999, 106, 115-119.

115
(161) Morin, J.-F.; Leclerc, M. Macromolecules 2002, 35, 8413-8417.
(162) Tirapattur, S.; Belletête, M.; Drolet, N.; Leclerc, M.; Durocher, G. Chem. Phys. Lett. 2003, 370, 799-804.
(163) Iraqi, A.; Wataru, I. Chem. Mater. 2004, 16, 442-448. (164) Iraqi, A.; Simmance, T. G.; Yi, H.; Stevenson, M.; Lidzey, D. G. Chem. Mater.
2006, 18, 5789-5797. (165) Kulasi, A.; Yi, H.; Iraqi, A. J. Polym. Sci. A: Polym. Chem. 2007, 45, 5957-
5967. (166) Sonntag, M.; Strohriegl, P. Chem. Mater. 2004, 16, 4736-4742.
(167) Zotti, G.; Schiavon, G.; Zecchin, S.; Morin, J.-F.; Leclerc, M. Macromolecules 2002, 35, 2122-2128.
(168) Shirota, Y.; Kinoshita, M.; Noda, T.; Okumoto, K.; Ohara, T. J. Am. Chem. Soc. 2000, 122, 11021-11022.
(169) Uchida, M.; Ono, Y.; Yokoi, H.; Nakano, T.; Furukawa, K. J. Photopolym. Sci. Technol. 2001, 14, 305-310.
(170) Morin, J.-F.; Leclerc, M. Macromolecules 2001, 34, 4680-4682. (171) Ullmann, F.; Meyer, G. M.; Loewenthal, O.; Gilli, E. Ann. 1904, 332, 38-81. (172) Hammann, W. C.; Schisla, R. M. J. Chem. Eng. Data 1972, 17, 112-115. (173) Dierschke, F.; Grimsdale, A. C.; Müllen, K. Synthesis 2003, 16, 2470-2472.
(174) Cadogan, J. I. G.; Cameron-Wood, M.; Mackie, R. K.; Searle, R. J. G. J. Chem. Soc. 1965, 4831-4837.
(175) Chmielewski, M. J.; Charon, M.; Jurczak, J. Org. Lett. 2004, 6, 3501-3504. (176) Doyle, M. P.; Siegfried, B.; Dellaria, J. F. J. Org. Chem. 1977, 42, 2426-2431.
(177) de Groot, J. H.; Dillingham, K.; Deuring, H.; Haitjema, H. J.; van Beijma, F. J.; Hodd, K.; Norrby, S. Biomacromolecules 2001, 2, 1271-1278.
(178) Stahl, R. Dissertation 2005, University of Würzburg. (179) Stahl, R.; Lambert, C.; Kaiser, C.; Wortmann, R.; Jakober, R. Chem. Eur. J.
2006, 12, 2358-2370. (180) Brook, A. G.; Gilman, H.; Miller, L. S. J. Am. Chem. Soc. 1953, 75, 4759-4765.
(181) Yamamoto, T.; Morita, A.; Miyazaki, Y.; Maruyama, T.; Wakayama, H.; Zhou, Z.-h.; Nakamura, Y.; Kanbara, T.; Sasaki, S.; Kubota, K. Macromolecules 1992, 25, 1214-1223.
(182) Fu, Y.; Bo, Z. Macromol. Rapid Commun. 2005, 26, 1704-1710.
(183) Wakim, S.; Blouin, N.; Gingras, E.; Tao, Y.; Leclerc, M. Macromol. Rapid Commun. 2007, 28, 1798-1803.
(184) Li, J.; Dierschke, F.; Wu, J.; Grimsdale, A. C.; Müllen, K. J. Mater. Chem. 2006, 16, 96-100.
(185) Zhang, Z.-B.; Fujiki, M.; Tang, H.-Z.; Motonaga, M.; Torimitsu, K. Macromolecules 2002, 35, 1988-1990.
(186) Iovu, M. C.; Sheina, E. E.; Gil, R. R.; McCullough, R. D. Macromolecules 2005, 38, 8649-8656.
(187) Ostrauskaite, J.; Strohriegl, P. Macromol. Chem. Phys. 2003, 204, 1713-1718. (188) Yokozawa, T.; Adachi, I.; Miyakoshi, R.; Yokoyama, A. High Perform. Polym.
2007, 19, 684-699.
(189) Perkampus, H.-H. UV-VIS Atlas of Organic Compounds. VCH: Weinheim, Germany, 1992. 532.
(190) Belletête, M.; Bouchard, J.; Leclerc, M.; Durocher, G. Macromolecules 2005, 38, 880-887.
(191) Strickler, S. J.; Berg, R. A. J. Chem. Phys. 1962, 37, 814-822. (192) Siebrand, W. J. Chem. Phys. 1967, 46, 440-447.

116
(193) Iraqi, A.; Wataru, I. J. Polym. Sci. A: Polym. Chem. 2004, 42, 6041-6051. (194) Iraqi, A.; Wataru, I. Synth. Met. 2001, 119, 159-160. (195) Pommerehne, J.; Vestweber, H.; Guss, W.; Mahrt, R. F.; Bässler, H.; Porsch,
M.; Daub, J. Adv. Mater. 1995, 7, 551-554. (196) Iraqi, A.; Pegington, R. C.; Simmance, T. G. J. Polym. Sci. A: Polym. Chem.
2006, 44, 3336-3342. (197) Iraqi, A.; Pickup, D. F.; Yi, H. Chem. Mater. 2006, 18, 1007-1015.
(198) Liu, R.; Xiong, Y.; Zeng, W.; Wu, Z.; Du, B.; Yang, W.; Sun, M.; Cao, Y. Macromol. Chem. Phys. 2007, 208, 1503-1509.
(199) http://en.wikipedia.org/wiki/CIE_1931_color_space. (200) Ajayaghosh, A. Chem. Soc. Rev. 2003, 32, 181-191. (201) Akoudad, S.; Roncali, J. Chem. Commun. 1998, 2081-2082. (202) Zhou, E.; Wei, Q.; Yamakawa, S.; Zhang, Y.; Tajima, K.; Yang, C.; Hashimoto,
K. Macromolecules 2010, 43, 821-826. (203) Heckmann, A. diploma thesis 2004, University of Würzburg. (204) Heckmann, A.; Lambert, C. J. Am. Chem. Soc. 2007, 129, 5515-5527. (205) Heckmann, A.; Lambert, C.; Goebel, M.; Wortmann, R. Angew. Chem. Int. Ed.
2004, 43, 5851-5856. (206) Domingo, V. M.; Castañer, J.; Riera, J.; Fajarí, L.; Labarta, A. Chem. Mater.
1995, 7, 314-323. (207) Maspoch, D.; Domingo, N.; Ruiz-Molina, D.; Wurst, K.; Tejada, J.; Rovira, C.;
Veciana, J. J. Am. Chem. Soc. 2004, 126, 730-731. (208) Maspoch, D.; Domingo, N.; Ruiz-Molina, D.; Wurst, K.; Vaughan, G.; Tejada,
J.; Rovira, C.; Veciana, J. Angew. Chem. Int. Ed. 2004, 43, 1828-1832. (209) Maspoch, D.; Ruiz-Molina, D.; Wurst, K.; Domingo, N.; Cavallini, M.; Biscarini,
F.; Tejada, J.; Rovira, C.; Veciana, J. Nat. Mater. 2003, 2, 190-195. (210) Crivillers, N.; Mas-Torrent, M.; Perruchas, S.; Roques, N.; Vidal-Gancedo, J.;
Veciana, J.; Rovira, C.; Basabe-Desmonts, L.; Ravoo, B. J.; Crego-Calama, M.; Reinhoudt, D. N. Angew. Chem. Int. Ed. 2007, 46, 2215-2219.
(211) Crivillers, N.; Mas-Torrent, M.; Vidal-Gancedo, J.; Veciana, J.; Rovira, C. J. Am. Chem. Soc. 2008, 130, 5499-5506.
(212) Crivillers, N.; Munuera, C.; Mas-Torrent, M.; Simão, C.; Bromley, S. T.; Ocal, C.; Rovira, C.; Veciana, J. Adv. Mater. 2009, 21, 1177-1181.
(213) Mas-Torrent, M.; Crivillers, N.; Mugnaini, V.; Ratera, I.; Rovira, C.; Veciana, J. J. Mater. Chem. 2009, 19, 1691-1695.
(214) Amthor, S.; Lambert, C. J. Phys. Chem. A 2006, 110, 1177-1189. (215) Coropceanu, V.; Lambert, C.; Nöll, G.; Brédas, J.-L. Chem. Phys. Lett. 2003,
373, 153-160. (216) Lambert, C.; Amthor, S.; Schelter, J. J. Phys. Chem. A 2004, 108, 6474-6486. (217) Lambert, C.; Nöll, G. J. Am. Chem. Soc. 1999, 121, 8434-8442. (218) Lambert, C.; Nöll, G.; Hampel, F. J. Phys. Chem. A 2001, 105, 7751-7758. (219) Lambert, C.; Nöll, G.; Schelter, J. Nat. Mater. 2002, 1, 69-73. (220) Lambert, C.; Risko, C.; Coropceanu, V.; Schelter, J.; Amthor, S.; Gruhn, N. E.;
Durivage, J. C.; Brédas, J.-L. J. Am. Chem. Soc. 2005, 127, 8508-8516.
(221) Lloveras, V.; Vidal-Gancedo, J.; Ruiz-Molina, D.; Figueira-Duarte, T. M.; Nierengarten, J.-F.; Veciana, J.; Rovira, C. Faraday Discuss. 2006, 131, 291-
305. (222) Nelsen, S. F.; Ismagilov, R. F. J. Phys. Chem. A 1999, 103, 5373-5378.
(223) Nelsen, S. F.; Ismagilov, R. F.; Gentile, K. E.; Powell, D. R. J. Am. Chem. Soc. 1999, 121, 7108-7114.

117
(224) Nelsen, S. F.; Tran, H. Q. J. Phys. Chem. A 1999, 103, 8139-8144.
(225) Nelsen, S. F.; Trieber, D. A.; Ismagilov, R. F.; Teki, Y. J. Am. Chem. Soc. 2001, 123, 5684-5694.
(226) Rovira, C.; Ruiz-Molina, D. ; Elsner, O.; Vidal-Gancedo, J.; Bonvoisin, J.; Launay, J.-P. ; Veciana, J. Chem. Eur. J. 2001, 7, 240-250.
(227) Sedó, J.; Ruiz, D.; Vidal-Gancedo, J.; Rovira, C.; Bonvoisin, J.; Launay, J.-P.; Veciana, J. Adv. Mater. 1996, 8, 748-752.
(228) Nishikitani, Y.; Kobayashi, M.; Uchida, S.; Kubo, T. Electrochim. Acta 2001, 46, 2035-2040.
(229) Hua, J.; Meng, F.; Li, J.; Ding, F.; Fan, X.; Tian, H. Eur. Polym. J. 2006, 42, 2686-2694.
(230) Ballester, M.; Riera, J.; Castañer, J.; Badía, C.; Monsó, J. M. J. Am. Chem. Soc. 1971, 93, 2215-2225.
(231) Kang, I.-N.; Hwang, D.-H.; Shim, H.-K.; Zyung, T.; Kim, J.-J. Macromolecules 1996, 29, 165-169.
(232) Patil, N. M.; Kelkar, A. A.; Chaudhari, R. V. J. Mol. Catal. A-Chem. 2004, 223, 45-50.
(233) Morin, J.-F.; Drolet, N.; Tao, Y.; Leclerc, M. Chem. Mater. 2004, 16, 4619-4626.
(234) Amthor, S.; Noller, B.; Lambert, C. Chem. Phys. 2005, 316, 141-152. (235) Ballester, M. Adv. Phys. Org. Chem. 1989, 25, 267-445.
(236) Heckmann, A.; Dümmler, S.; Pauli, J.; Margraf, M.; Köhler, J.; Stich, D.; Lambert, C.; Fischer, I.; Resch-Genger, U. J. Phys. Chem. C 2009, 113,
20958-20966. (237) Kasha, M. Physical Processes in Radiation Biology. Augenstein, L., Mason,
R., and Rosenberg, B., Eds.; Academic Press: New York, 1964. 23-42. (238) Kietzke, T.; Hörhold, H.-H.; Neher, D. Chem. Mater. 2005, 17, 6532-6537.
(239) Völker, S. F.; Uemura, S.; Limpinsel, M.; Mingebach, M.; Deibel, C.; Dyakonov, V.; Lambert, C. Macromol. Chem. Phys. 2010, 211, 1098-1108.
(240) Bard, A. J.; Faulkner, L. R. Electrochemical Methods. 2nd ed.; John Wiley & Sons, Inc.: New York, 2001. 241.
(241) Bard, A. J.; Faulkner, L. R. Electrochemical Methods. 2nd ed.; John Wiley & Sons, Inc.: New York, 2001. 456.
(242) Brédas, J. L.; Silbey, R.; Boudreaux, D. S.; Chance, R. R. J. Am. Chem. Soc. 1983, 105, 6555-6559.
(243) Schmidt, A.; Anderson, M. L.; Armstrong, N. R. J. Appl. Phys. 1995, 78, 5619-5625.
(244) McNeill, C. R.; Abrusci, A.; Zaumseil, J.; Wilson, R.; McKiernan, M. J.; Burroughes, J. H.; Halls, J. J. M.; Greenham, N. C.; Friend, R. H. Appl. Phys. Lett. 2007, 90, 193506.
(245) Gierschner, J.; Cornil, J.; Egelhaaf, H. J. Adv. Mater. 2007, 19, 173-191.
(246) Sporer, C.; Ratera, I.; Ruiz-Molina, D.; Zhao, Y.; Vidal-Gancedo, J.; Wurst, K.; Jaitner, P.; Clays, K.; Persoons, A.; Rovira, C.; Veciana, J. Angew. Chem. Int. Ed. 2004, 43, 5266-5268.
(247) Maksimenka, R.; Margraf, M.; Köhler, J.; Heckmann, A.; Lambert, C.; Fischer, I. Chem. Phys. 2008, 347, 436-445.
(248) Mauser, H. Formale Kinetik. Bertelsmann Universitätsverlag: Düsseldorf, 1974. 74.
(249) Bässler, H. Phys. Status Solidi B 1993, 175, 15-56.
118
(250) Granström, M.; Petritsch, K.; Arias, A. C.; Lux, A.; Andersson, M. R.; Friend, R. H. Nature 1998, 395, 257-260.
(251) Holcombe, T. W.; Woo, C. H.; Kavulak, D. F. J.; Thompson, B. C.; Fréchet, J. M. J. J. Am. Chem. Soc. 2009, 131, 14160-14161.
(252) Koetse, M. M.; Sweelssen, J.; Hoekerd, K. T.; Schoo, H. F. M.; Veenstra, S. C.; Kroon, J. M.; Yang, X.; Loos, J. Appl. Phys. Lett. 2006, 88, 083504.
(253) Sang, G.; Zhou, E.; Huang, Y.; Zou, Y.; Zhao, G.; Li, Y. J. Phys. Chem. C 2009, 113, 5879-5885.
(254) Veenstra, S. C.; Verhees, W. J. H.; Kroon, J. M.; Koetse, M. M.; Sweelssen, J.; Bastiaansen, J. J. A. M.; Schoo, H. F. M.; Yang, X.; Alexeev, A.; Loos, J.; Schubert, U. S.; Wienk, M. M. Chem. Mater. 2004, 16, 2503-2508.
(255) Zhou, E.; Tajima, K.; Yang, C.; Hashimoto, K. J. Mater. Chem. 2010, 20, 2362-2368.
(256) Zoombelt, A. P.; Leenen, M. A. M.; Fonrodona, M.; Wienk, M. M.; Janssen, R. A. J. Thin Solid Films 2008, 516, 7176-7180.
(257) McNeill, C. R.; Greenham, N. C. Appl. Phys. Lett. 2008, 93, 203310. (258) Melhuish, W. H. J. Phys. Chem. 1961, 65, 229-235. (259) Connelly, N. G.; Geiger, W. E. Chem. Rev. 1996, 96, 877-910. (260) Sawyer, D. T.; Roberts, J. L. Experimental Electrochemistry for Chemists.
Wiley-Interscience: New York, 1974. 42. (261) Tsiplakides, D.; Archonta, D.; Vayenas, C. G. Top. Catal. 2007, 44, 469-479.
(262) Trebino, R.; DeLong, K. W.; Fittinghoff, D. N.; Sweetser, J. N.; Krumbügel, M. A.; Richman, B. A.; Kane, D. J. Rev. Sci. Instrum. 1997, 68, 3277-3295.
(263) Ekvall, K.; van der Meulen, P.; Dhollande, C.; Berg, L.-E.; Pommeret, S.; Naskrecki, R.; Mialocq, J.-C. J. Appl. Phys. 2000, 87, 2340-2353.
(264) http://www.gigahertz-optik.de/files/tutorials_doublesideprint.pdf. (265) Ballester, M.; Veciana, J.; Riera, J.; Castañer, J.; Rovira, C.; Armet, O. J. Org.
Chem. 1986, 51, 2472-2480. (266) The signal is hidden below the THF signal as confirmed by comparison with
the spectrum in CD2Cl2.

119
7 Appendix
7.1 Formeltafel
7.1.1 Polycarbazoles
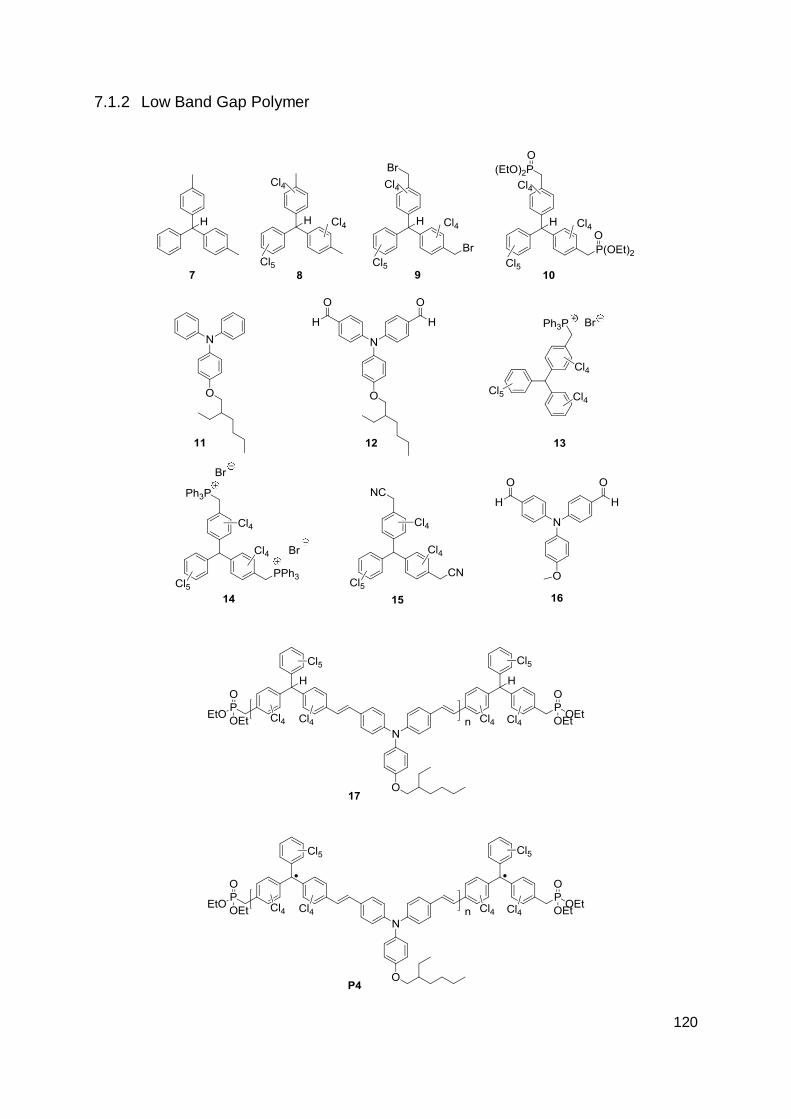
120
7.1.2 Low Band Gap Polymer
121
7.2 Zusammenfassung
Im ersten Teil dieser Arbeit wurden die drei Polycarbazole Poly[N-((4-
dimesitylboryl)-3,5-dimethylphenyl)-carbazol]-2,7-diyl P1, Poly[N-((4-dimesitylboryl)-
3,5-dimethylphenyl)-carbazol]-3,6-diyl P2 und Poly[N-(4-(diphenylmethylen)-phenyl)-
carbazol]-2,7-diyl P3 mittels Yamamoto Kupplung synthetisiert und ihre
spektroskopischen und elektrochemischen Eigenschaften untersucht. Absorptions-
und Fluoreszenzeigenschaften von P1 und P3 sind denen anderer 2,7-verknüpfter
Polycarbazole ähnlich, wohingegen P2 eine CT Absorptionsbande zeigt, die durch
die Verschiebung von Elektronendichte vom Stickstoff des Carbazoldonors zum
Triarylboranakzeptor verursacht wird. Daraus ergeben sich negativ solvatochromes
Absorptions- und positiv solvatochromes Fluoreszenzverhalten und eine deutlich
erhöhte Fluoreszenzquantenausbeute in Lösung und im Festkörper verglichen mit
anderen 3,6-verknüpften Polycarbazolen. Das bedeutet, dass die spektroskopischen
Eigenschaften durch die Art der C-C-Verknüpfung gesteuert werden können: das 2,7-
verknüpfte Polycarbazol P1 wird durch den Akzeptorsubstituenten aufgrund des
starren Polymergerüsts, dem eine poly-para-phenylenartige und damit stärker
delokalisierte Struktur zugrunde liegt, nicht beeinflusst. Im Gegensatz dazu treten
beim 3,6-verknüpften Polycarbazol P2 die Eigenschaften der Monomereinheit
aufgrund der flexibleren 1,4-diaminobiphenyl Struktur in den Vordergrund.
Die Oxidationsprozesse von P1-P3 wurden im Detail mittels Cyclovoltammetrie
untersucht. Die Ergebnisse stimmen mit Literaturwerten überein. Außerdem wurde
bei den Messungen von P1 und P2 ein reversibler Reduktionsprozess, der am
Boranzentrum stattfindet, beobachtet. Eine Reduktion der Carbazoleinheit konnte
hingegen nicht gefunden werden.
Mit der Herstellung von OLEDs der Struktur ITO/P2/Al konnte blaue
Elektrolumineszenz mit den CIE Farbkoordinaten (0.17, 0.21) nachgewiesen werden.
Im zweiten Teil der Arbeit wurde das low band gap Polyradikal Poly{[((2,3,4,5,6-
pentachlorphenyl)-bis(2,3,5,6-tetrachlorphenyl)methyl radical)-4,4„-diyl]-alt-4,4„-
bis(vinylphenyl)-4-(2-ethylhexyloxy)phenylamin} P4 mittels Horner-Emmons Reaktion
synthetisiert. Im NIR beobachtet man eine IV-CT Absorptionsbande, die durch einen
Elektronentransfer vom Triarylamindonor zum PCTM-Radikalakzeptor hervorgerufen

122
wird. Dieser elektronische Übergang ist auf eine Monomereinheit begrenzt wie der
Vergleich mit den Monomerabsorptionsspektren zeigt. HOMO und LUMO Energien
von P4, die anhand der Cyclovoltammogramme bestimmt wurden, liegen bei -5.5 und
-4.5 eV. Die im Vergleich zur optischen Energielücke (1.2 eV) kleinere
elektrochemische Energielücke (1.9 eV) ist wahrscheinlich auf Ionenpaareffekte bei
den elektrochemischen Messungen zurückzuführen, deutet aber auch auf eine
geringe Excitonenbindungsenergie hin.
Transiente Absorptionsspektren zeigen die spektralen Charakteristika von
oxidiertem Triarylamindonor und reduziertem PCTM-Akzeptor vergleichbar mit den
Spektren der spektroelektrochemischen Messungen, bei denen eine Lösung von P4
jeweils nacheinander reduziert und oxidiert wurde. Dadurch konnte der
Elektronentransferprozess, der zur Ausbildung der IV-CT Bande führt, zweifelsfrei
nachgewiesen werden. Der IV-CT Zustand zerfällt biexponentiell. Der schnelle,
lösungsmittelabhängige Zerfall beschreibt den direkten Übergang vom IV-CT
Zustand in den elektronischen Grundzustand. Dagegen wird der langsame,
lösungsmittelunabhängige Zerfall einer Gleichgewichtseinstellung zwischen IV-CT
Zustand und vollständig ladungsgetrenntem Zustand, der durch Ladungswanderung
entlang der Polymerkette erreicht wird, zugeschrieben.
In OFETs mit P4 als Halbleiter und einer zusätzlich isolierenden, organischen
PPcB Schicht wurde ein ausgeglichener, ambipolarer Ladungstransport mit Loch-
und Elektronenbeweglichkeiten von ca. 3 × 10⁻⁵ cm2 V-1 s-1 gefunden.
Polymer/Polymer BHJ Solarzellenmodule mit der Struktur
Glas/ITO/PEDOT:PSS/(P3HT/P4 1:4)/Ca/Al hatten einen Wirkungsgrad von 0.0031
% bei einer Leerlaufspannung VOC = 0.38 V, einem Kurzschlussstrom JSC = 0.028
mA cm-2 und einem Füllfaktor FF = 0.29.
Die ungeeignete Morphologie der P4- und P3HT/P4-Schichten als Ursache für die
unbefriedigende Performance von OFETs und Solarzellen lässt solche
Anwendungen für P4 wenig sinnvoll erscheinen. Dagegen verdient die Hypothese
der Ladungswanderung im angeregten Zustand eine vertiefte Untersuchung.

123
7.3 Danksagung
An dieser Stelle möchte ich mich bei allen bedanken, die zum Gelingen dieser Arbeit
beigetragen haben. Mein besonderer Dank gilt dabei:
Herrn Dr. Matthias Grüne und Frau Elfriede Ruckdeschel für die Aufnahme der NMR
Spektren.
Herrn Dr. Michael Büchner, Herrn Fritz Dadrich und Frau Antje Hautzinger für die
Aufnahme der Massenspektren.
Herrn Michael Ramold für sämtliche Sonderanfertigungen für verschiedene
Messungen.
Herrn Markus Braun für die gut gelaunte und jederzeit bereitwillige Unterstützung bei
technischen Problemen.
Allen Angestellten des Instituts für Organische Chemie: Herrn Dr. Christian Stadler,
Frau Petra Leckert, Frau Anette Krug, Frau Angela Dreher, Frau Ursula Rüppel,
Herrn Matthias Fromm, Herrn Manfred Ludwig, Herrn Frank Förtsch, Herrn Dipl.-Ing.
Brunner.
Frau Liselotte Michels für die Elementaranalysen und DSC Messungen.
Herrn Dr. Rüdiger Bertermann und Frau Marie-Luise Schäfer für die 31P und
phosphorentkoppelten 13C NMR Messungen.
Den Würthner‟s:
Ana-Maria Krause, für den Erfahrungsaustausch in Sachen Cyclovoltammetrie und
für die DSC Messungen.

124
Vladimir Stepanenko, für die AFM-Messungen, die Du trotz hoher Arbeitsbelastung
noch zwischendurch für mich gemacht hast.
Matthias Stolte, für Dein offenes Ohr und deine Hilfestellung bei vielen mit der
Forschung verbundenen Schwierigkeiten, für die Si-Wafer und für die Nutzung des
spin coaters.
Hannah Bürckstümmer, für das zum Bau von Grätzelzellen zur Verfügung gestellte
Material und die Einweisung in die Benutzung des Sonnensimulators.
Den Physikern:
Daniel Rauh und Andreas Baumann, für Bau/Messungen/Auswertungen von
Solarzellen, die Hilfestellung beim Bau von OLEDs und die Hilfe bei allen anderen
die Organic Electronics betreffenden Fragen. Vielen Dank!!
Maria Hammer, für Bau/Messungen/Auswertungen von OFETs und die allgemein
gute Zusammenarbeit.
Den PC‟lern:
Tatjana Quast und Florian Kanal, für Euer Engagement und Durchhaltevermögen bei
den transienten Messungen!!
Sabine Keiber, für Dein Engagement beim Fitten der transienten Spektren und
insbesondere für die postwendend gelieferten Fits!!
Martin Kullmann und Stefan Rützel, für Euren Einsatz bei den transienten
Messungen auch zu später Stunde!!

125
Dr. Patrick Nürnberger, für die Diskussionen über die Interpretation der transienten
Messergebnisse.
Vor allem möchte ich mich aber bei den Mitgliedern des Arbeitskreis Lambert für das
angenehme Arbeitsklima, die schöne Zeit und die Hilfestellung bei der Bewältigung
vieler mit dem Arbeitsalltag im Labor verbundener Probleme bedanken.
Insbesondere bei:
Marco Holzapfel, für deine Unterstützung bei der Auseinandersetzung mit dem
Fluoreszenz- und Lebensdauermessgerät und für dein reges Interesse bei der
Interpretation von Ergebnissen.
Barbara Geiß, für die wirklich gute Zusammenarbeit beim Bau der OLEDs, für die
Organisation von AK-Feiern und für deine super gute Erdbeertorte.
Alexander Heckmann, für die Unterstützung bei den Syntheseprojekten zum
Polyradikal und die damit verbundenen Diskussionen und für die Initiierung des
Kochkreises.
Christian Müller, für die Organisation von AK-Feiern, Geschenken, Chem-Cup T-
shirts etc. – kurz für die Organisation des Schönen Drumherum.
Conrad Kaiser, für deine schönen Geburtstagsfeiern.
Nina Dürrbeck, für deine Hilfe bei Computerproblemen und die schönen Gespräche.
Markus Steeger, für den abenteuerlichen Spaziergang auf der KOPO und die gute
Zusammenarbeit im Messlabor.
Fabian Zieschang, für die gute Abzugnachbarschaft und deine Geduld wenn ich mal
wieder vergessen hatte meinen Kolben vom Roti abzuhängen.

126
Sebastian Völker, für die super gute Musik im Labor. Das hat das Arbeiten im Labor
definitiv noch schöner gemacht.
Johannes Klein, für deine unerschütterlich gute Laune.
Christian Rothgängel, für die Synthesearbeit während deines F-Praktikums.
Harald Ceymann, für das Grillen sämtlichen Grillguts.
Alexander Schmiedel, für die Unterstützung bei mathematisch-physikalischen
Fragestellungen.
Christl Wendinger, für manche Synthesearbeit und insbesondere für die Synthese
der Leitsalze.
Ganz besonders möchte ich mich auch bei meinen Eltern, meinen Schwiegereltern,
meinen Schwestern und bei meinem Basti bedanken für die offenen Ohren, wenn‟s
mal wieder gar nicht lief und die Nachsicht, wenn ich für nichts anderes Zeit hatte.


![[3+2] Annulation of Donor–Acceptor Cyclopropanes with](https://img.pdfslide.net/doc/110x75/619ea2d78ec89a39ad063f3a/32-annulation-of-donoracceptor-cyclopropanes-with-.jpg)