Embed Size (px)
Citation preview
Dosage Determination from Preclinical to Proof-of-Concept Trials,
(Including Toxicology)
Charlie Taylor, PhD
CpTaylor Consulting
Chelsea, MI, USA
2
Choosing Doses for POC:
• Preclinical and early studies that enable dose selection
• Reasons for drug failure in clinical phase 2-3
• Need to choose both low (ineffective) and high (maximum tolerated) doses within dose range
• Biomarkers (one endpoint: animal → human translation)
• PK/PD modeling – EC50 as a target for efficacy or AEs
• Toxicology/toxicokinetics – daily AUC(0-24) as a limit
• Putting it together – visualizing multiple datasets
• Human population PK modeling – determine which doses best fit the constraints
3
Sequence of Studies Needed Prior to Clinical Proof-of-Concept
• Preclinical in vitro studies: action at drug target (pharmacology)
• Preclinical in vivo pain models: indicate treatment of disease
• Safety pharmacology: animal studies for adverse effects
• Preclinical (& human liver microsome) metabolism studies
• Animal toxicology & toxicokinetic studies to identify safety issues
• Clinical Phase I studies of pharmacokinetics and tolerance in healthy human volunteers
• (Optional) Biomarker studies with both animal models and humans to establish proof of pharmacology in vivo (apart from efficacy)
***
*
*
* Requires in vivo unbound plasma drug concentration or dailydrug exposure to help choose human efficacy DOSES
*
4
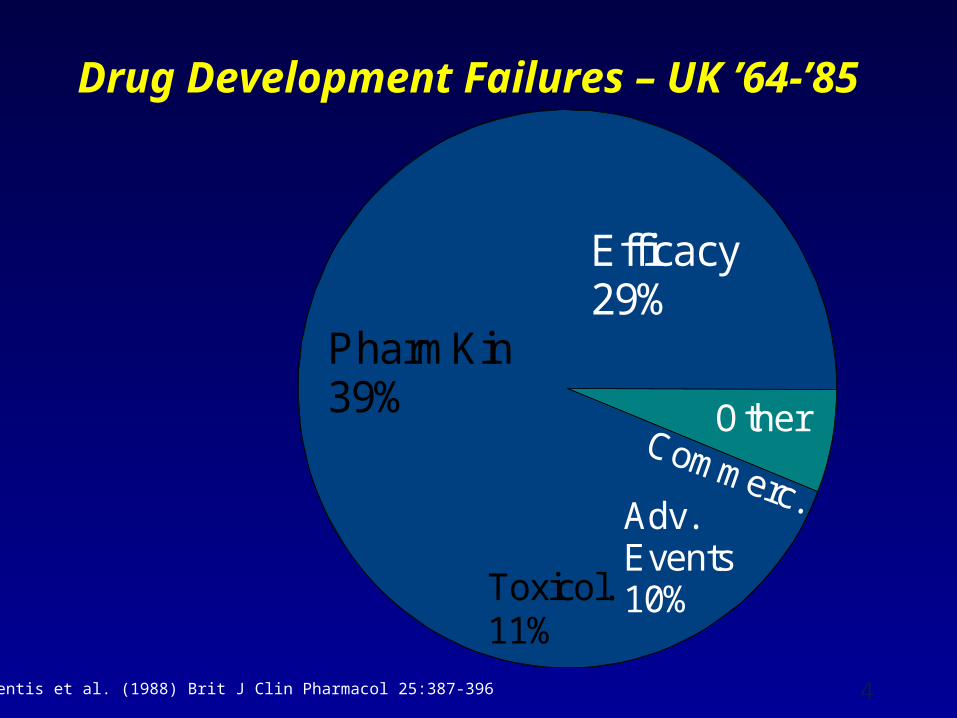
Drug Development Failures – UK ’64-’85
Efficacy29%
Toxicol.11%
PharmKin39%
Adv.Events10%
Other
Prentis et al. (1988) Brit J Clin Pharmacol 25:387-396
5
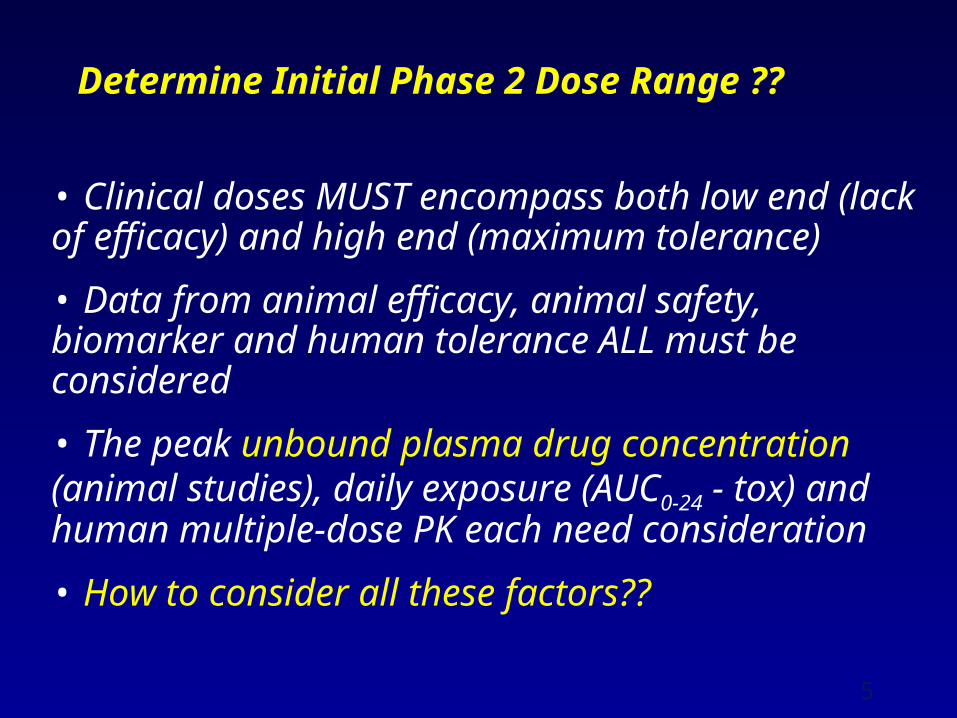
Determine Initial Phase 2 Dose Range ??
• Clinical doses MUST encompass both low end (lack of efficacy) and high end (maximum tolerance)
• Data from animal efficacy, animal safety, biomarker and human tolerance ALL must be considered
• The peak unbound plasma drug concentration (animal studies), daily exposure (AUC0-24 - tox) and human multiple-dose PK each need consideration
• How to consider all these factors??

6
One Approach: Biomarkers – Surrogate HUMAN Endpoints for Efficacy
• Defines drug action in vivo
• Examples: Imaging, Adverse Event or Mechanism
• e.g. PET to measure receptor occupancy in CNS
• e.g. Nystagmus, dizziness, balance platform
• e.g. Experimental pain model w/ volunteers
• e.g. Electrographic response (EEG, retinogram, TMS)
Biomarkers Allow no-go decision prior to proof of efficacy, for example:
• Poor oral drug absorption or lack of CNS penetration
• Lack of receptor occupancy at highest safe dose
7
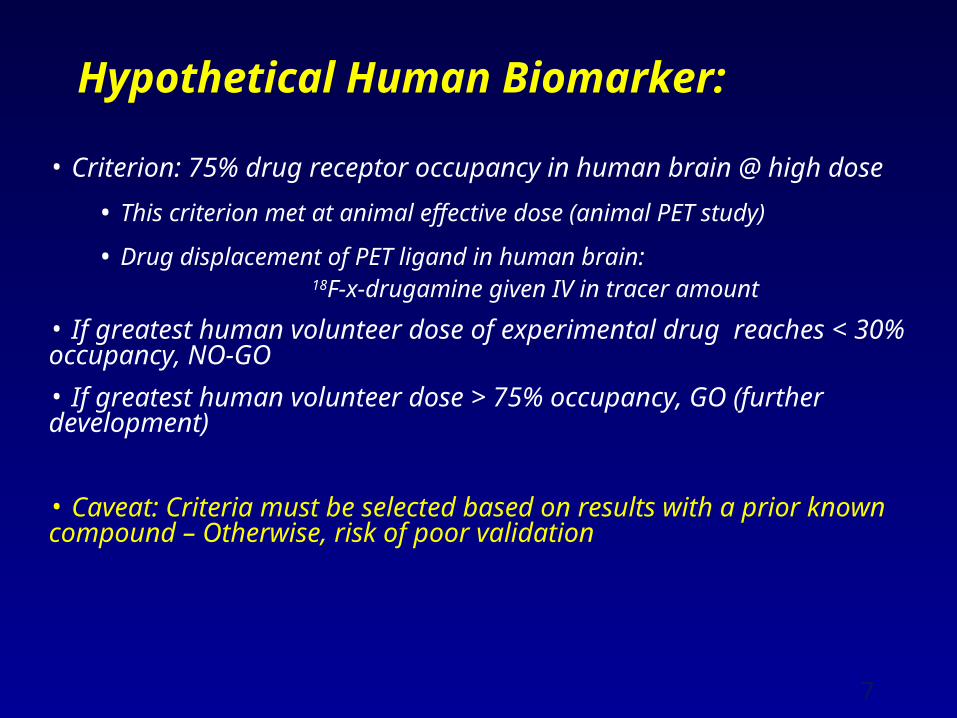
Hypothetical Human Biomarker:
• Criterion: 75% drug receptor occupancy in human brain @ high dose
• This criterion met at animal effective dose (animal PET study)
• Drug displacement of PET ligand in human brain: 18F-x-drugamine given IV in tracer amount
• If greatest human volunteer dose of experimental drug reaches < 30% occupancy, NO-GO
• If greatest human volunteer dose > 75% occupancy, GO (further development)
• Caveat: Criteria must be selected based on results with a prior known compound – Otherwise, risk of poor validation

8
Toxicology Findings (non-pharmacology) are Based on Daily Drug Exposure (AUC0-24)
• Repeated-dose animal tox studies determine lowest toxic dose and greatest no-effect (daily) dose
• Toxicokinetics determine drug exposure (AUC0-24) in g•hr/mL at greatest no-effect dose
• e.g. Drug X has 8 hr half-life; Cmax and AUC are determined from plasma drug samples taken 0, 1, 4, 7, 12, and 24 hr after single oral dose at steady-state
• Similar human pharmacokinetic data and PK modeling determine human drug exposure (AUC0-24) @ doses
• Analysis is adjusted for different drug binding of plasma proteins between species

9
Calculation of Animal Drug Exposure - Toxicokinetic AUC(0-24)
• Samples of drug in plasma of animal tox species — Begin sampling after reaching repeated dose steady state— Orange symbols are mean from n = 8
• Mathematical fit to curves of oral absorption & elimination• Measure area under curve for 0-24 hr = Drug Exposure
Cmax = 10.8 g/mL
Hr After Dose
0 4 8 12 16 20 24Fre
e P
lasm
a D
rug
Co
nc. (
g/m
L)
0
2
4
6
8
10
12
14
AUC(0-24) = 136 g•hr/mLDose =
50 mg/kg/day
10
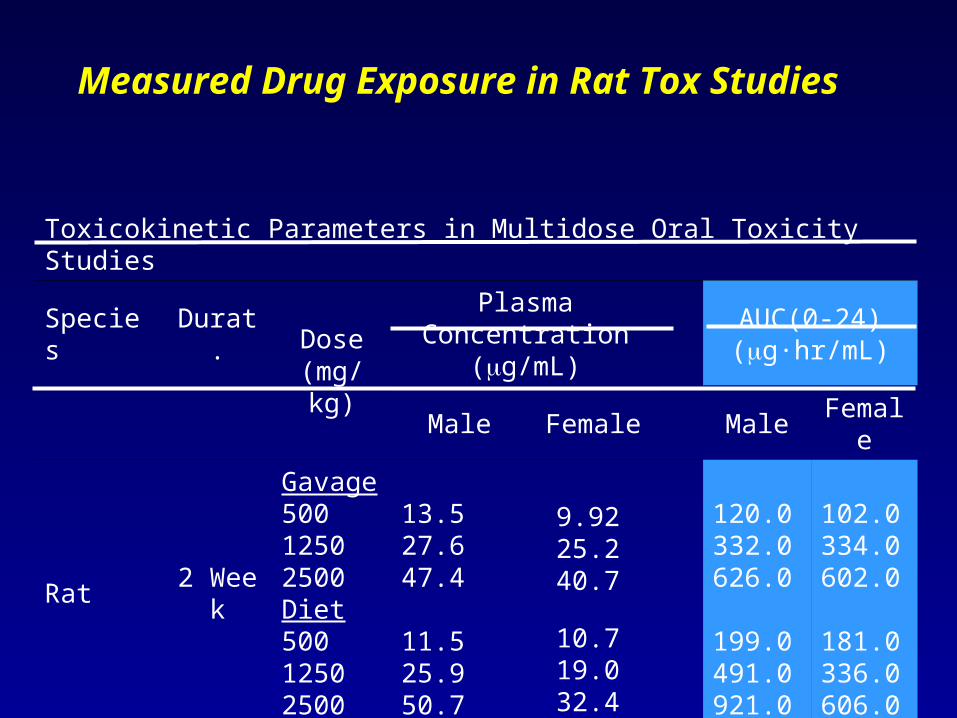
Measured Drug Exposure in Rat Tox Studies
Toxicokinetic Parameters in Multidose Oral Toxicity Studies
Species Durat.Dose
(mg/kg)
Plasma Concentration (g/mL)
AUC(0‑24) (g·hr/mL)
Male Female Male Female
Rat 2 Week
Gavage50012502500Diet50012502500
13.527.647.4
11.525.950.7
9.9225.240.7
10.719.032.4
120.0332.0626.0
199.0491.0921.0
102.0334.0602.0
181.0336.0606.0
11
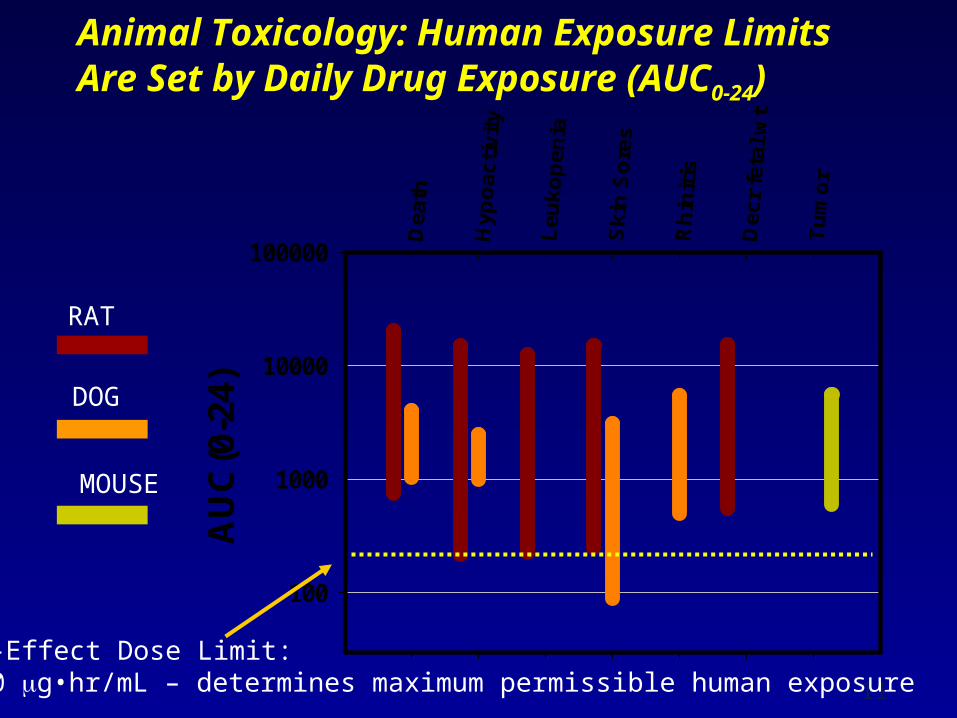
Animal Toxicology: Human Exposure Limits Are Set by Daily Drug Exposure (AUC0-24)
AU
C(0
-24)
100
1000
10000
100000
RAT
DOG
MOUSE
No-Effect Dose Limit:200 g•hr/mL – determines maximum permissible human exposure
12
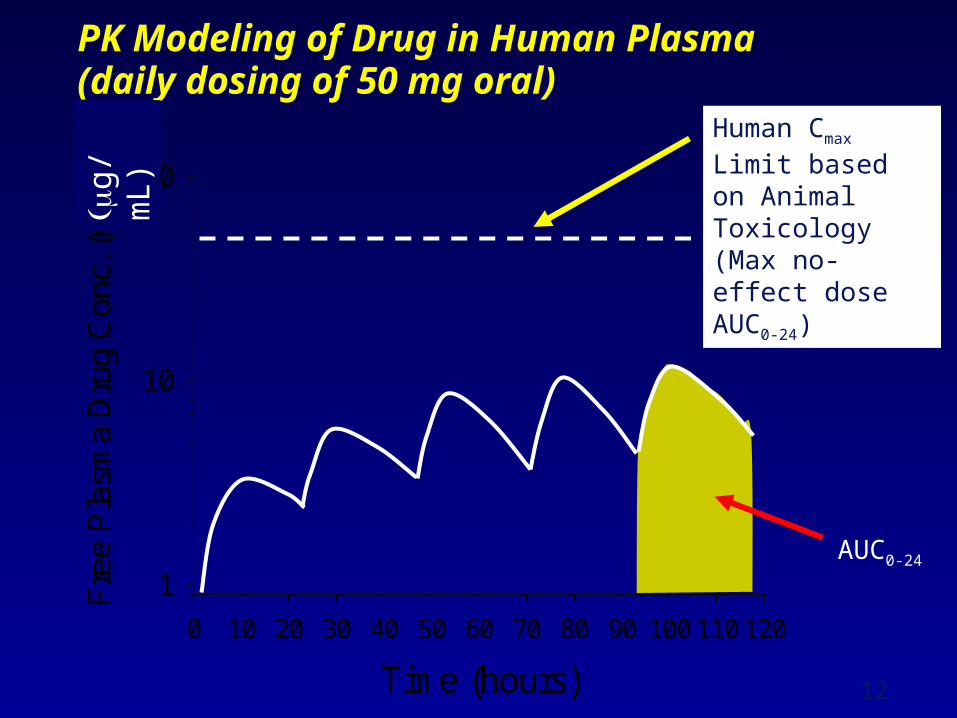
PK Modeling of Drug in Human Plasma (daily dosing of 50 mg oral)
Time (hours)
0 10 20 30 40 50 60 70 80 90 100 110 120
Fre
e P
lasm
a D
rug
Con
c. (
nM)
1
10
100
Human Cmax Limit based on Animal Toxicology(Max no-effect dose AUC0-24)
AUC0-24
g/
mL)
13
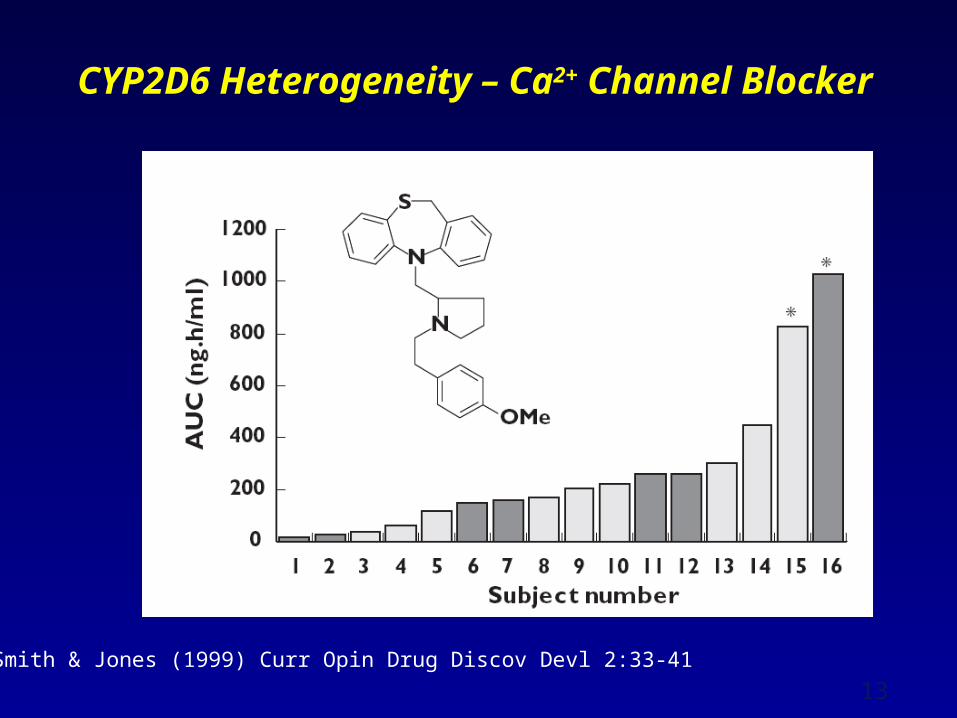
CYP2D6 Heterogeneity – Ca2+ Channel Blocker
Smith & Jones (1999) Curr Opin Drug Discov Devl 2:33-41
14
Q: How to Predict Human Efficacious
and Adverse Drug Doses Based on
Animal Efficacy, Animal AEs and
Human Pharmacokinetic Data??
A: Compare plasma drug Cmax
obtained in animal pharmacology
tests using a Napiergram to human
Pharmacokinetic Cmax data
15
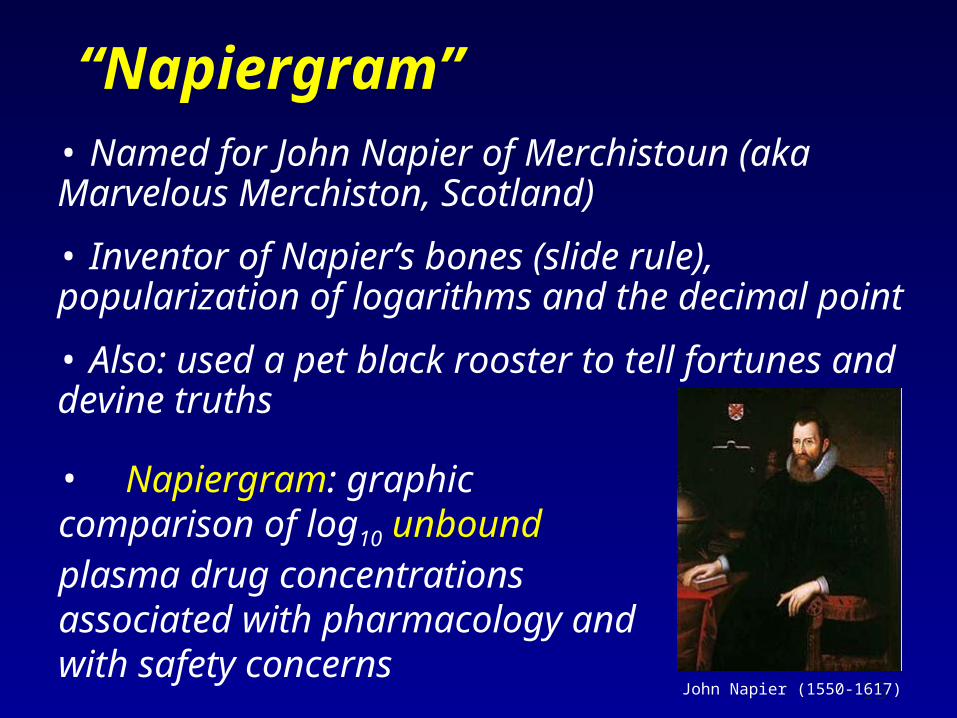
“Napiergram”• Named for John Napier of Merchistoun (aka Marvelous Merchiston, Scotland)
• Inventor of Napier’s bones (slide rule), popularization of logarithms and the decimal point
• Also: used a pet black rooster to tell fortunes and devine truths
John Napier (1550-1617)
• Napiergram: graphic comparison of log10 unbound plasma drug concentrations associated with pharmacology and with safety concerns
16
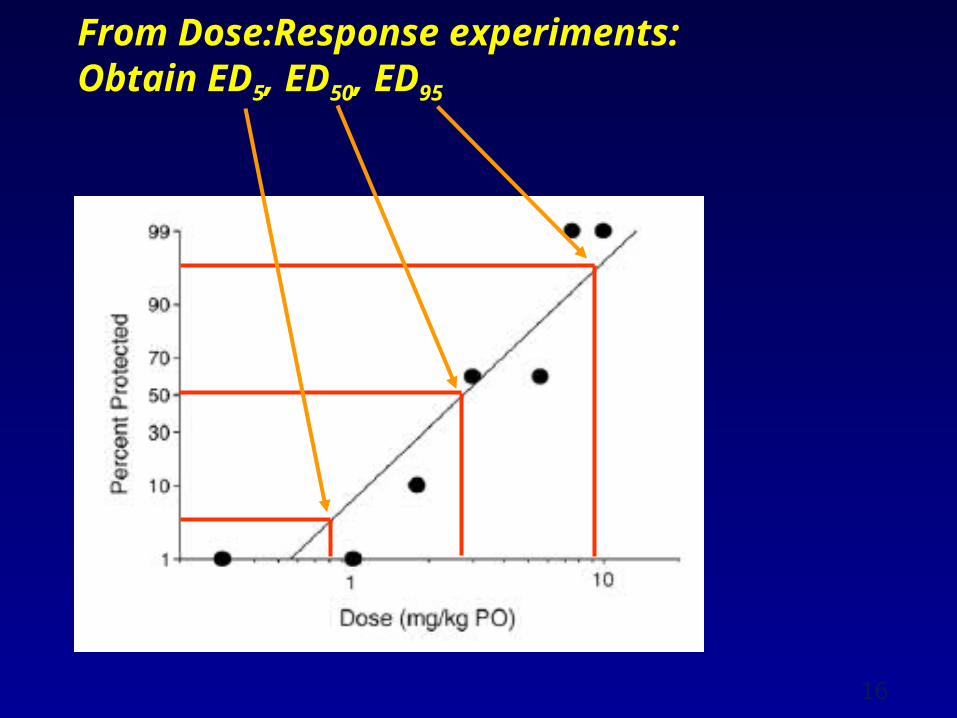
From Dose:Response experiments: Obtain ED5, ED50, ED95
17
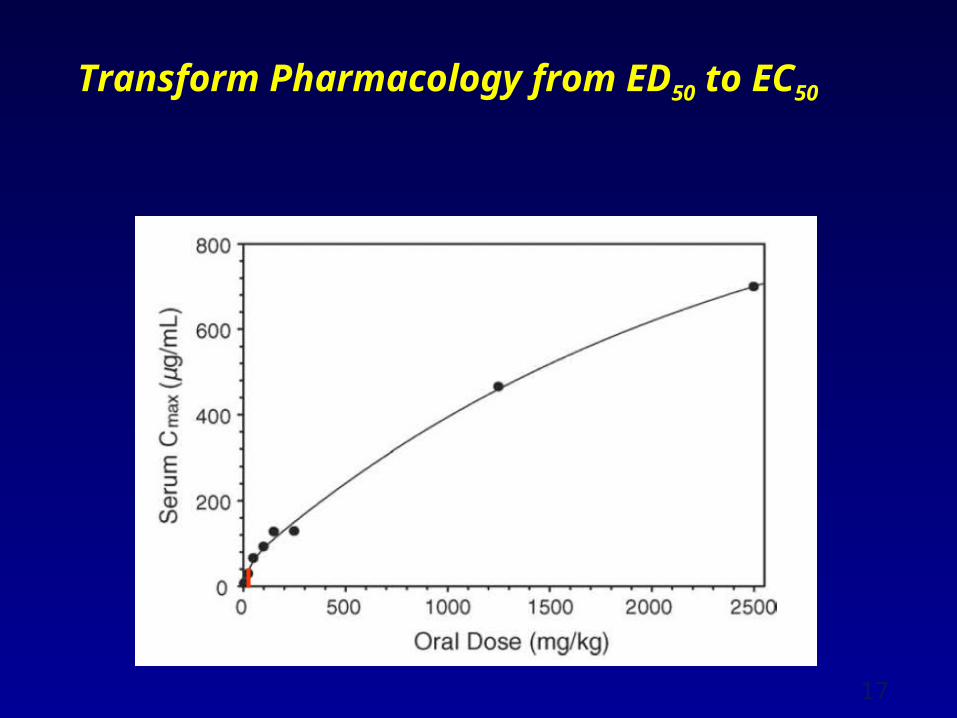
Transform Pharmacology from ED50 to EC50
18
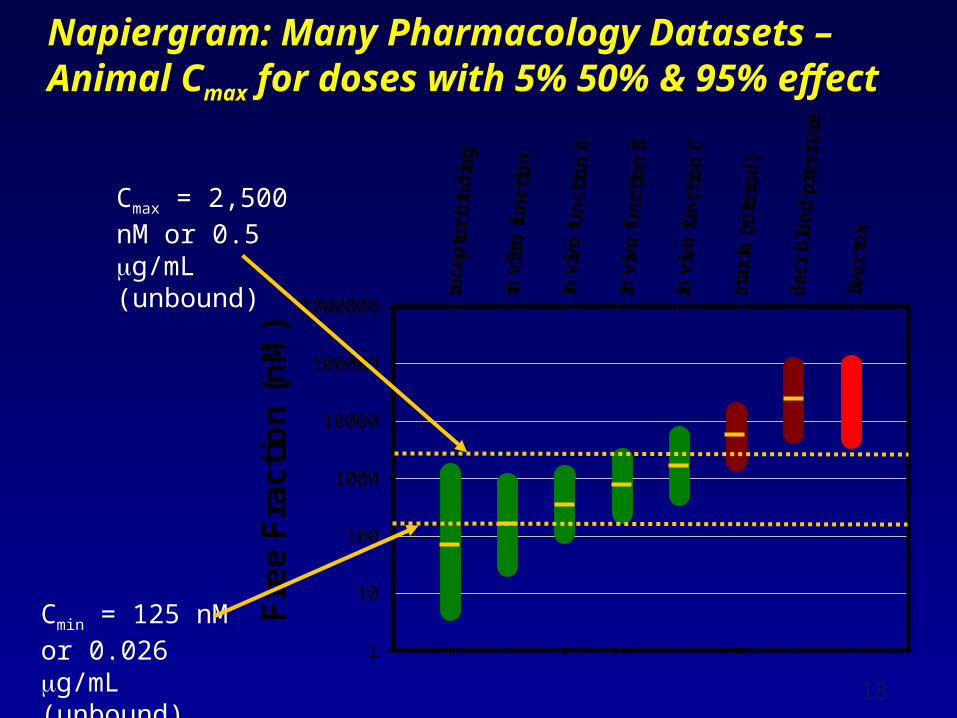
Napiergram: Many Pharmacology Datasets – Animal Cmax for doses with 5% 50% & 95% effect
Fre
e F
rac
tio
n (
nM
)
1
10
100
1000
10000
100000
1000000
Cmax = 2,500 nM or 0.5 g/mL (unbound)
Cmin = 125 nM or 0.026 g/mL (unbound)
19
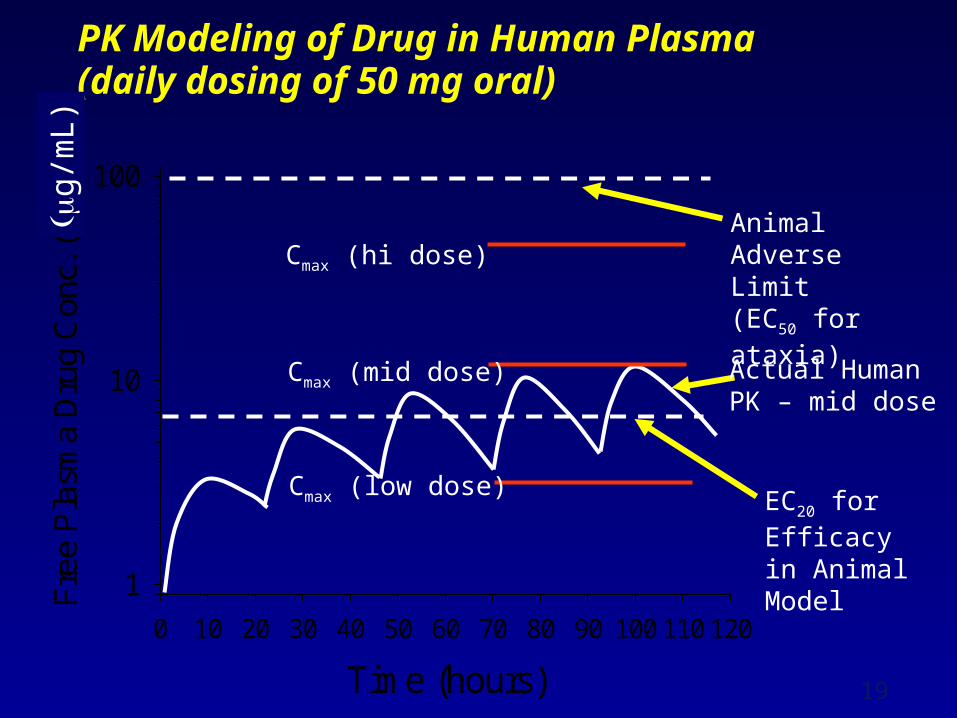
PK Modeling of Drug in Human Plasma (daily dosing of 50 mg oral)
Time (hours)
0 10 20 30 40 50 60 70 80 90 100 110 120
Fre
e P
lasm
a D
rug
Con
c. (
nM)
1
10
100
Animal AdverseLimit (EC50 for ataxia)
EC20 for Efficacy in Animal Model
Cmax (hi dose)
Cmax (mid dose)
Cmax (low dose)
Actual Human PK – mid dose
g/
mL)
20
Phase 2 Dose Selection (final chapter)
• Requires Deliberation from team of experts:
• Animal tox, Pharmacokinetics, PK/PD modeling, Clinical research, Preclinical pharmacology, (Biomarkers)
• Who pays the clinical trial bills? Clinical Research
— Despite planning, dosage and regimen often are readjusted during Phase 2 (toleration, efficacy or new safety findings)
— Dosages MUST continue to include both low (ineffective) and maximal tolerated dosages to provide basis for FDA approval
— Dose toleration may vary between healthy volunteers and patients with serious disease
21
SUMMARY: Preclinical Studies to Determine Phase 2 Dose Selection
• In vitro and in vivo animal pharmacology – target Cmax for therapy and adverse effects
• Animal toxicology & toxicokinetic studies – determines maximal human drug exposure (AUC0-24)
• Phase 1 Clinical trials- determines human pharmacokinetics & drug exposure
• Napiergram – allows consideration of Cmax from multiple animal datasets & compare to human PK
• Phase 2 dose adjustment is common!

22
23
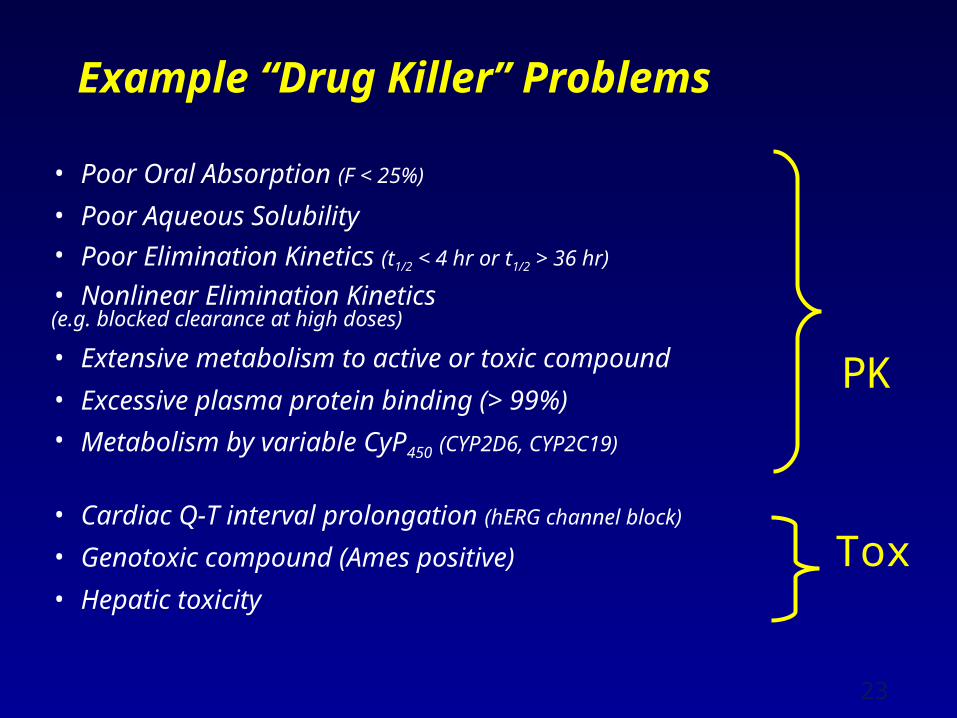
Example “Drug Killer” Problems
• Poor Oral Absorption (F < 25%)
• Poor Aqueous Solubility
• Poor Elimination Kinetics (t1/2 < 4 hr or t1/2 > 36 hr)
• Nonlinear Elimination Kinetics (e.g. blocked clearance at high doses)
• Extensive metabolism to active or toxic compound
• Excessive plasma protein binding (> 99%)
• Metabolism by variable CyP450 (CYP2D6, CYP2C19)
• Cardiac Q-T interval prolongation (hERG channel block)
• Genotoxic compound (Ames positive)
• Hepatic toxicity
PK
Tox