Embed Size (px)
Citation preview


Financial results &
business update
Quarter ended 31 March 201818 April 2018

Disclaimer
Any remarks that we may make about future expectations, plans and
prospects for the company constitute forward-looking statements. Actual
results may differ materially from those indicated by these forward-looking
statements as a result of various factors.
In particular, the forward-looking financial information provided by the
company in the conference call represent the company’s estimates as of 18
April 2018. We anticipate that subsequent events and developments will
cause the company’s estimates to change.
However, while the company may elect to update this forward-looking
financial information at some point in the future, the company specifically
disclaims any obligation to do so. This forward-looking information should
not be relied upon as representing the company’s estimates of its future
financial performance as of any date subsequent to 18 April 2018.
3
Non-IFRS Information
All non-IFRS information in the presentation is under IAS 18, comparable to prior periods.
Readers are cautioned that the supplemental non-IFRS information presented in this presentation is subject to
inherent limitations. It is not based on any comprehensive set of accounting rules or principles and should not
be considered as a substitute for IFRS measurements. Also, the Company’s supplemental non-IFRS financial
information may not be comparable to similarly titled non-IFRS measures used by other companies.
In the tables accompanying this presentation the Company sets forth its supplemental non-IFRS figures for
revenue, operating costs, EBIT, EBITDA, net earnings and earnings per share, which exclude the effect of
adjusting the carrying value of acquired companies’ deferred revenue, the amortization of acquired intangibles,
discontinued activities, acquisition related charges, restructuring costs, and the income tax effect of the non-
IFRS adjustments. The tables also set forth the most comparable IFRS financial measure and reconciliations
of this information with non-IFRS information.
When the Company believes it would be helpful for understanding trends in its business, the Company
provides percentage increases or decreases in its revenue (in both IFRS as well as non-IFRS) to eliminate the
effect of changes in currency values. When trend information is expressed herein "in constant currencies", the
results of the "prior" period have first been recalculated using the average exchange rates of the comparable
period in the current year, and then compared with the results of the comparable period in the current year.
4

1
2
3
4
Agenda
Business update………………………………………..……David Arnott, CEO
Financial update…………………………………….. Max Chuard, CFO, COO
Summary……………………………………………………. David Arnott, CEO
Q&A

Business
update
David Arnott, CEO

Very strong start to 2018
Total software licensing growth of
40%
Total revenues up 20%
EBIT up 33%
Momentum across all tiers and
geographies
Validation of leadership position
Review of Q1 2018
Bank CIOs must go beyond the front office and holistically digitalize processes across the
whole IT stack if they wish to make the digital bank a reality.
Third party validation of Temenos
leadership
#1 best selling Core Banking system
#1 best selling Digital Banking and Channels system
#1 best selling Risk and Compliance system
#2 best selling Payments system
Top vendor for new-name clients and
new and existing clients
Source: Forrester – ‘True Digital Banking Drives Interest In Core Banking’, April 2018. IBS – ‘Annual Sales League Table 2018’. IBS Intelligence, April 2018.
*Gartner ‘Designing Operations and Architectures for the Digital Bank Primer for 2018’, Vittorio D’Orazio, Don Free, January 2018.
Figures are non-IFRS IAS18 growth rates
Gartner*
7

Q1 2018 sales review
Very strong start to 2018 with acceleration across
all geographies and client tiers
18 new customer wins in the quarter, gaining
market share
Competitive deals contributed 54% of software
licensing in the quarter
First strategic deal signed in Australia
Expanding relationships with tier 1 accounts
Openbank selected WealthSuite
Tier 1 European bank selected Temenos for
instant payments solution
Continued investment in sales and marketing
Growth across all markets and client tiers
Strong contribution from competitive deals
Q1 2018 software licensing
54%46%
Competitive deals Add-ons to installed base
8

New markets opening up
Leading Nordic telco bought T24 for financial technology
platform to offer lending and leasing products
Move away from telco-banking partnership model to
direct financial offerings by telcos
Telco-banking represents a new addressable market
opportunity of c.USD75m p.a.
Incremental pressure on incumbent banks from new
market entrants
Continued expansion of addressable market
Payments
Payments margins under pressure from regulation,
competition and new technology
Open banking directly linked to rise of instant payments
which is becoming the new norm
Banks are looking to purchase modern real-time
solutions to capture and retain market share
Extended relationship with tier 1 European bank who
selected Temenos for instant payments solution
Temenos’ integrated payments solution was 2nd best
selling payments system in 2017 with 7 deals
9

22 implementation go-lives in Q1
2018
EFG announced completion of BSI
migration to T24
LTM Services margin of 10%
Key implementations continue to
progress well
Q1 2018 services overview
Strong operational performance
Industrialising training through the
Temenos Learning Community
10

Third party validation of our leadership position
New-name clients:
Top global power seller
for the 12th year
Top vendor in the Forrester 2017 Global Vendor
Pyramid for new-name clients and new and
existing clients
Source: Forrester – ‘True Digital Banking Drives Interest In Core Banking’, April 2018. IBS – ‘Annual Sales League Table 2018’. IBS Intelligence, April 2018
New and existing clients:
Top global player for
the 6th year
#1 best selling
Core Banking systems in 2017 for the 13th year
#1 best selling
Digital Banking and Channels system in 2017
#1 best selling
Risk and Compliance system in 2017
#2 best selling
Payments system in 2017
11
0
10
20
30
40
50
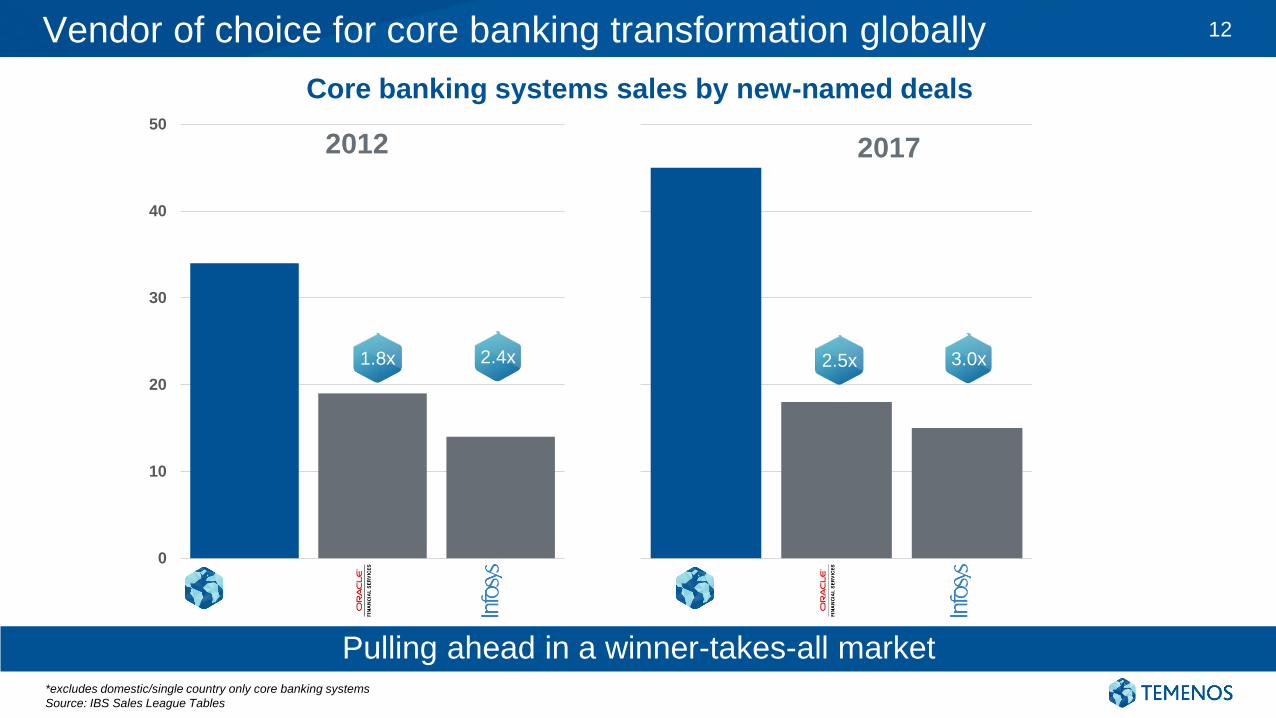
Vendor of choice for core banking transformation globally
Core banking systems sales by new-named deals
2.4x1.8x 3.0x2.5x
2012 2017
Pulling ahead in a winner-takes-all market*excludes domestic/single country only core banking systems
Source: IBS Sales League Tables
12

Looking forward
Industry outlook:
Digital and regulatory pressures are top of mind for banks
Open banking a new driver of opportunity and changing business models
IT renovation is key to banks’ strategy, not discretionary spend
Banks moving to front-to-back digital renovation
Temenos positioning:
Installed base a key driver of growth, selling to clients who understand the value proposition
Market leader, raising barriers to entry and pulling ahead of the competition
Very strong start to Q1 2018, highest ever revenue visibility driven by strong pipeline growth and
committed spend
Leadership position in market with multiple structural drivers
13

Financial
updateMax Chuard, CFO, COO

Q1 2018 non-IFRS (IAS 18) financial highlights
Total software licensing up 40% Y-o-Y
Maintenance growth of 14% Y-o-Y
Total revenue growth of 20% Y-o-Y
EBIT up 33% Y-o-Y, with LTM EBIT margin of 30.4%
EPS growth of 48% Y-o-Y, LTM EPS of USD 2.59
Q1 operating cash flows of USD 46m, DSOs down 10 days Y-o-Y to 117 days
Services margin of 9.8% for Q1 2018 LTM, up 0.2% points
Very strong performance across all KPIs
15
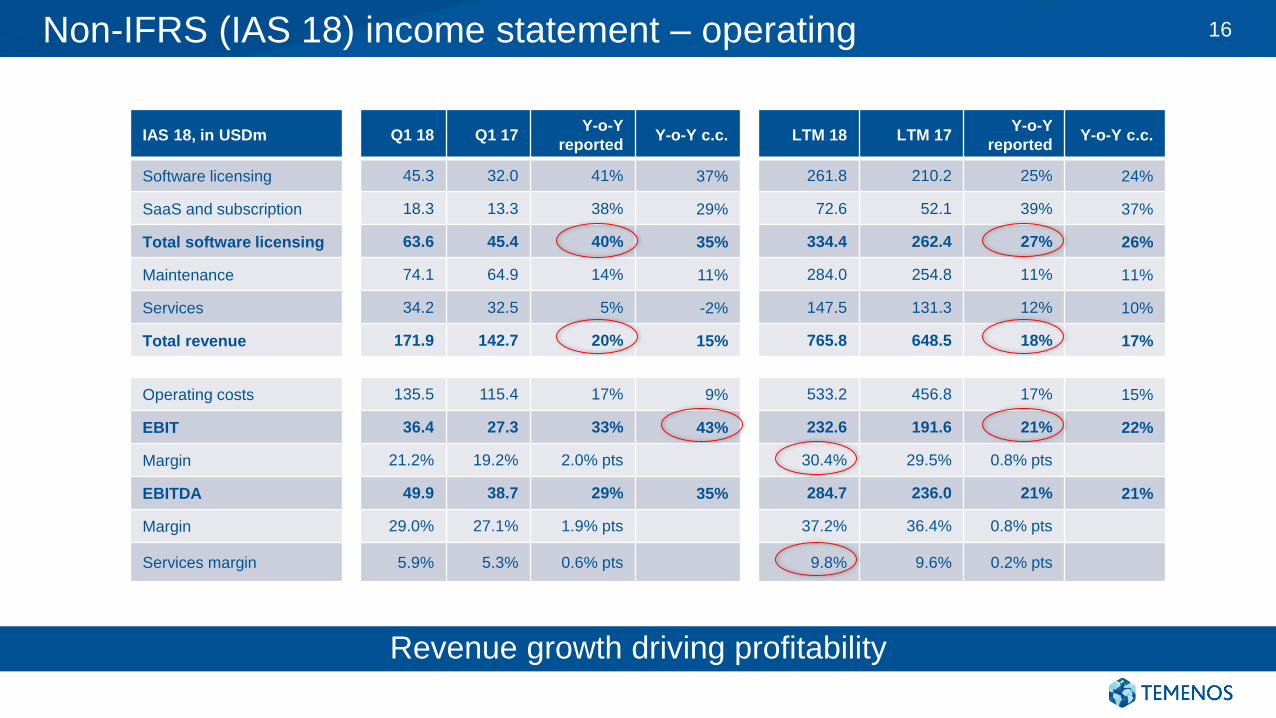
Non-IFRS (IAS 18) income statement – operating
IAS 18, in USDm Q1 18 Q1 17Y-o-Y
reportedY-o-Y c.c. LTM 18 LTM 17
Y-o-Y
reportedY-o-Y c.c.
Software licensing 45.3 32.0 41% 37% 261.8 210.2 25% 24%
SaaS and subscription 18.3 13.3 38% 29% 72.6 52.1 39% 37%
Total software licensing 63.6 45.4 40% 35% 334.4 262.4 27% 26%
Maintenance 74.1 64.9 14% 11% 284.0 254.8 11% 11%
Services 34.2 32.5 5% -2% 147.5 131.3 12% 10%
Total revenue 171.9 142.7 20% 15% 765.8 648.5 18% 17%
Operating costs 135.5 115.4 17% 9% 533.2 456.8 17% 15%
EBIT 36.4 27.3 33% 43% 232.6 191.6 21% 22%
Margin 21.2% 19.2% 2.0% pts 30.4% 29.5% 0.8% pts
EBITDA 49.9 38.7 29% 35% 284.7 236.0 21% 21%
Margin 29.0% 27.1% 1.9% pts 37.2% 36.4% 0.8% pts
Services margin 5.9% 5.3% 0.6% pts 9.8% 9.6% 0.2% pts
Revenue growth driving profitability
16

Like-for-like revenue and costs
0
20
40
60
80
100
120
140
160
180
200
Q1 2017 Q1 2018
USDm
Maintenance Total software licensing Services
+19%
+9%
-4%
0
20
40
60
80
100
120
140
160
Q1 2017 Q1 2018
USDm
+5%
Q1 LFL non-IFRS revenue
Organic product revenue growth of 14%
Q1 LFL non-IFRS costs
17

Non-IFRS (IAS 18) income statement – non-operating
In USDm, except EPS Q1 18 Q1 17 Y-o-Y LTM 18 LTM 17 Y-o-Y
EBIT 36.4 27.3 33% 232.6 191.6 21%
Net finance charge -3.5 -3.9 -11% -14.4 -16.2 -11%
FX gain / (loss) 0.6 -0.8 NA -1.2 -0.3 NA
Tax -4.8 -3.0 59% -29.4 -21.1 39%
Net profit 28.7 19.7 46% 187.6 154.0 22%
EPS (USD) 0.40 0.27 48% 2.59 2.15 20%
Continued strong growth in profit and EPS
18

IFRS (IAS 18) cash conversion
Cash conversion remains significantly above target of 100%
0
50
100
150
200
250
300
LTM Q1 2016 LTM Q1 2017 LTM Q1 2018
USDm
EBITDA Operating cashflow
131% 117% 113%
19
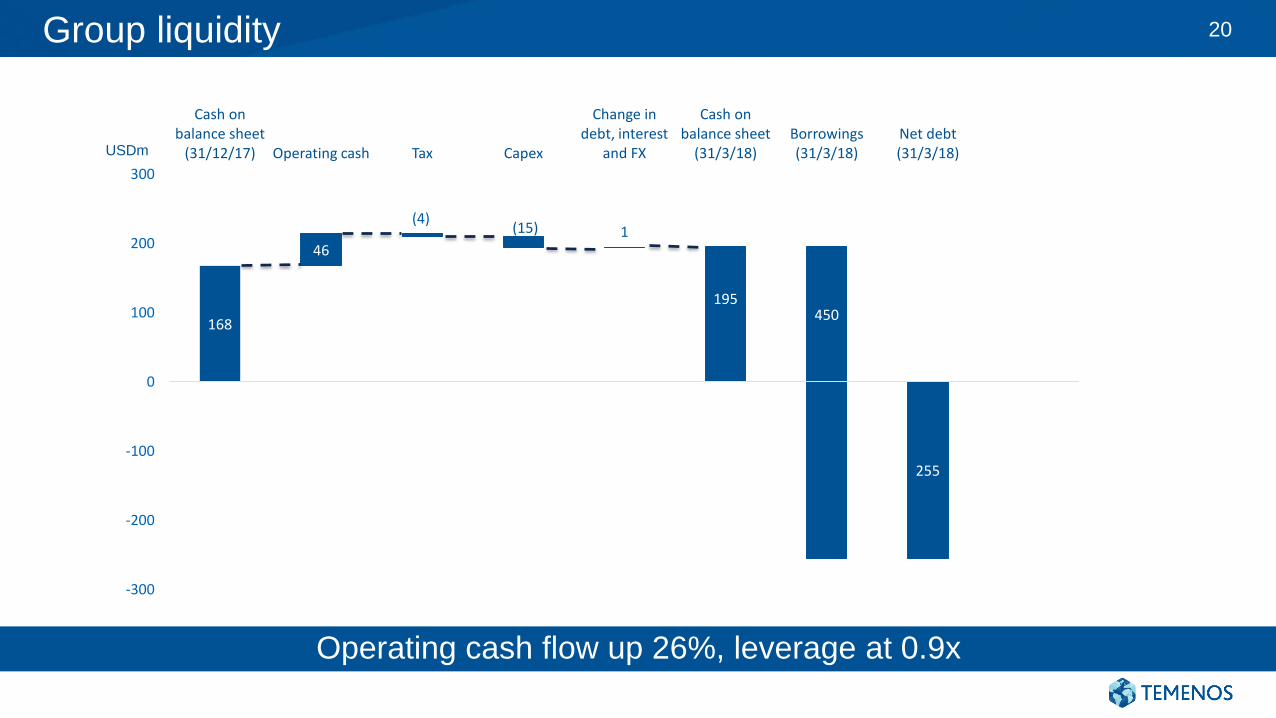
Group liquidity
168
255
46
(4)(15) 1
195450
-300
-200
-100
0
100
200
300
Cash on balance sheet
(31/12/17) Operating cash Tax Capex
Change in debt, interest
and FX
Cash on balance sheet
(31/3/18)Borrowings (31/3/18)
Net debt (31/3/18)
169
USDm
Operating cash flow up 26%, leverage at 0.9x
20

2018 non-IFRS guidance range (IAS 18, c.c.)
FY 2018 guidance
Total software licensing (%) 13.5% – 18.5%
Implied USDm 367 – 383
Total revenue (%) 10% – 13%
Implied USDm 825 – 847
EBIT (USDm) 255 – 260
Implied margin c.31%
Cash conversion 100%+ conversion of EBITDA into operating cash flow
Tax rate Expected FY 2018 tax rate of 15% to 16%
• Currency assumptions on slide 26
• See slide 42 for definition of non-IFRS
Revenue visibility continues to increase
21

Summary
David Arnott, CEO

Theme for 2018 is ‘Digital to the core’
Dedicated analyst and investor
stream
See product launches and our
software in action
Insights from Temenos executives
and industry thought leaders
Interaction and learning from
Temenos customers and partners
Breakout sessions with senior
management
TCF 2018 – Dublin, 22 to 24 May 23

Very strong start to 2018 across all KPIs
Growth across all geographies and client tiers
Combined pressures from digital, regulation and open banking driving bank
IT spend
IT renovation remains strategic, not discretionary
Third party validation of leadership position, pulling ahead of the competition
Revenue visibility continues to increase driven by strong pipeline growth and
committed spend
Conclusion
Very strong start to 2018
24

Appendices

FX assumptions underlying 2018 guidance
In preparing the 2018 guidance, the Company has assumed the following FX
rates:
USD to Euro exchange rate of 0.824
USD to GBP exchange rate of 0.711; and
USD to CHF exchange rate of 0.958
26
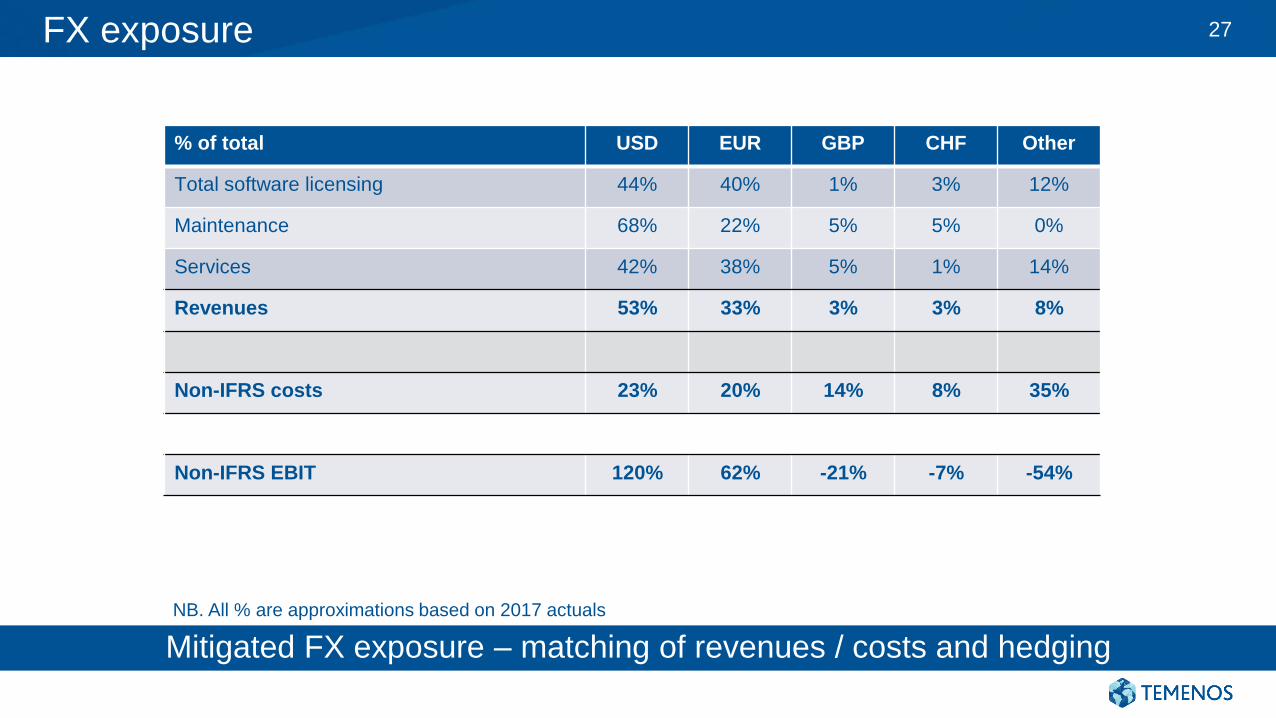
FX exposure
% of total USD EUR GBP CHF Other
Total software licensing 44% 40% 1% 3% 12%
Maintenance 68% 22% 5% 5% 0%
Services 42% 38% 5% 1% 14%
Revenues 53% 33% 3% 3% 8%
Non-IFRS costs 23% 20% 14% 8% 35%
Non-IFRS EBIT 120% 62% -21% -7% -54%
NB. All % are approximations based on 2017 actuals
Mitigated FX exposure – matching of revenues / costs and hedging
27

Total software licensing revenue breakdown by geography
18%
47%
22%
13%
APAC
Europe
Americas
MEA
18%
52%
21%
9%APAC
Europe
Americas
MEA
19%
38%
28%
15%
APAC
Europe
Americas
MEA
19%
51%
19%
11%APAC
Europe
Americas
MEA
LTM Q1 2017
Q1 2017 Q1 2018
LTM Q1 2018
28

Total software licensing revenue breakdown by customer tier
38%62%
1 and 2
3, 4 and 5
57%43%
1 and 2
3, 4 and 5
48%52%
1 and 2
3, 4 and 5
52%48%
1 and 2
3, 4 and 5
LTM Q1 2017
Q1 2017 Q1 2018
LTM Q1 2018
29

Software licensing revenue breakdown by competitive deals / add-ons to installed base
54%46%
Competitivedeals
Add-ons toinstalled base
45%55%
Competitivedeals
Add-ons toinstalled base
35%65%
Competitivedeals
Add-ons toinstalled base
37%63%
Competitivedeals
Add-ons toinstalled base
LTM Q1 2017
Q1 2017 Q1 2018
LTM Q1 2018
30

DSOs have declined significantly
183
151
127
117
100
120
140
160
180
200
Q1 2015 Q1 2016 Q1 2017 Q1 2018
31

Balance sheet – debt and leverage
0
50
100
150
200
250
300
350
400
450
500
Q1 2015 Q2 2015 Q3 2015 Q4 2015 Q1 2016 Q2 2016 Q3 2016 Q4 2016 Q1 2017 Q2 2017 Q3 2017 Q4 2017 Q1 2018
USDm
2.3x2.4x
2.1x
1.3x 1.3x 1.3x 1.2x
0.8x 0.7x
1.2x1.1x 0.9x1.0x
Net debt and leverage ratios*
* proforma non-IFRS EBITDA
32
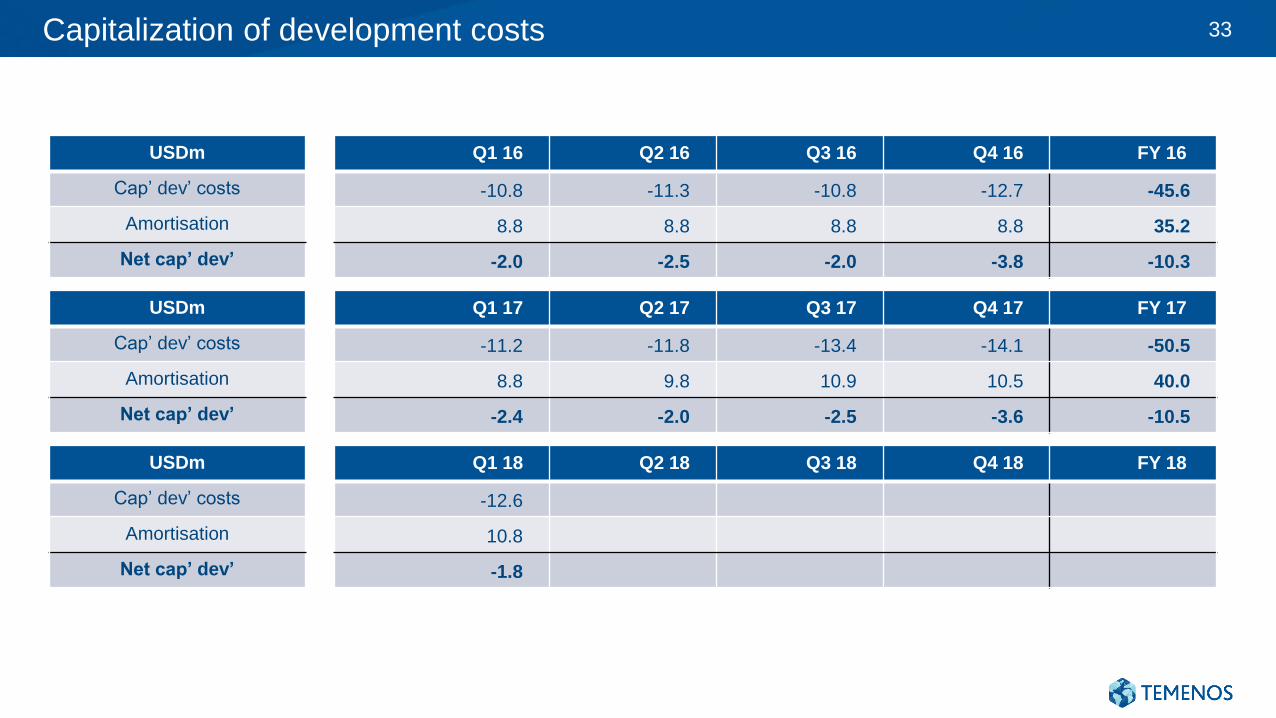
Capitalization of development costs
USDm Q1 16 Q2 16 Q3 16 Q4 16 FY 16
Cap’ dev’ costs -10.8 -11.3 -10.8 -12.7 -45.6
Amortisation 8.8 8.8 8.8 8.8 35.2
Net cap’ dev’ -2.0 -2.5 -2.0 -3.8 -10.3
USDm Q1 17 Q2 17 Q3 17 Q4 17 FY 17
Cap’ dev’ costs -11.2 -11.8 -13.4 -14.1 -50.5
Amortisation 8.8 9.8 10.9 10.5 40.0
Net cap’ dev’ -2.4 -2.0 -2.5 -3.6 -10.5
USDm Q1 18 Q2 18 Q3 18 Q4 18 FY 18
Cap’ dev’ costs -12.6
Amortisation 10.8
Net cap’ dev’ -1.8
33
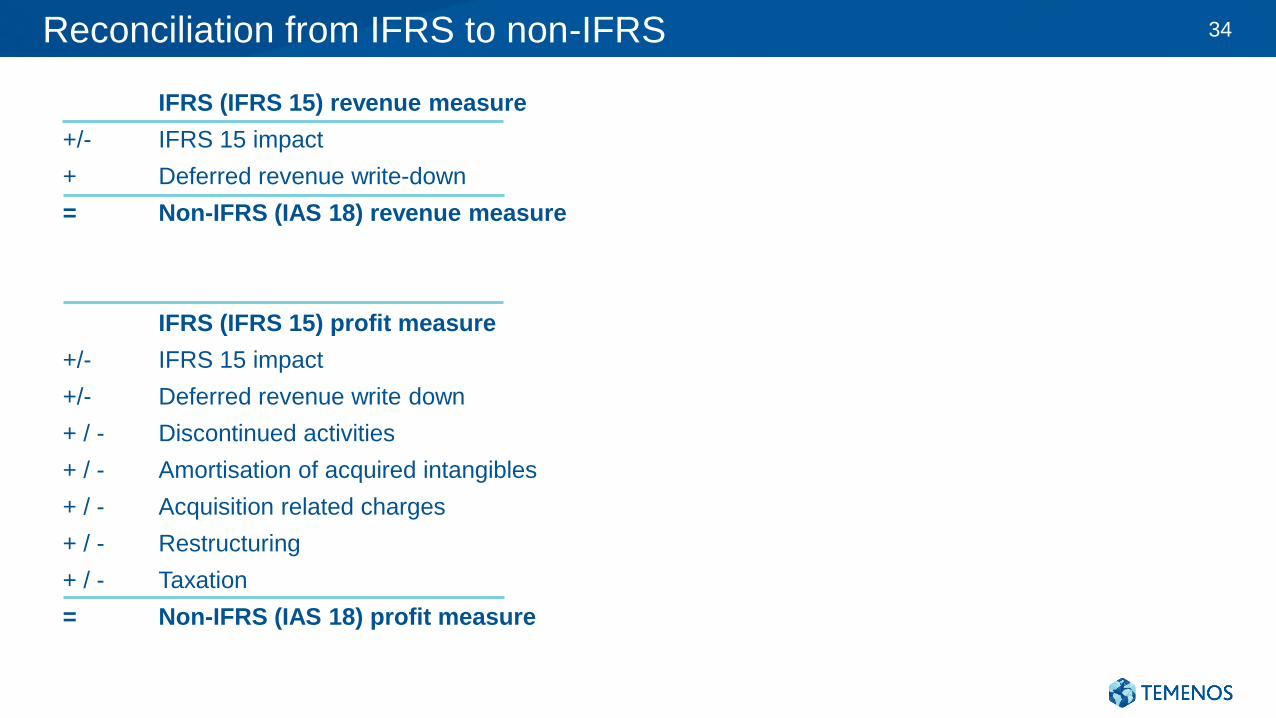
Reconciliation from IFRS to non-IFRS
IFRS (IFRS 15) revenue measure
+/- IFRS 15 impact
+ Deferred revenue write-down
= Non-IFRS (IAS 18) revenue measure
IFRS (IFRS 15) profit measure
+/- IFRS 15 impact
+/- Deferred revenue write down
+ / - Discontinued activities
+ / - Amortisation of acquired intangibles
+ / - Acquisition related charges
+ / - Restructuring
+ / - Taxation
= Non-IFRS (IAS 18) profit measure
34

Accounting elements not included in non-IFRS (IAS 18) guidance
Below are the accounting elements not included in the 2018 non-IFRS (IAS 18) guidance:
FY 2018 estimated deferred revenue write down of USD 1m
FY 2018 estimated amortisation of acquired intangibles of USD 38m
FY 2018 estimated restructuring costs of USD 5m
FY 2018 estimated acquisition costs of USD 27m
Restructuring costs include realising R&D, operational and infrastructure efficiencies and does not include estimated
restructuring costs related to the potential acquisition of Fidessa.
Acquisition costs include the estimated costs associated with the successful acquisition of Fidessa.
These estimates do not include impact of any further acquisitions or restructuring programmes commenced after 18
April 2018. The above figures are estimates only and may deviate from expected amounts.
35
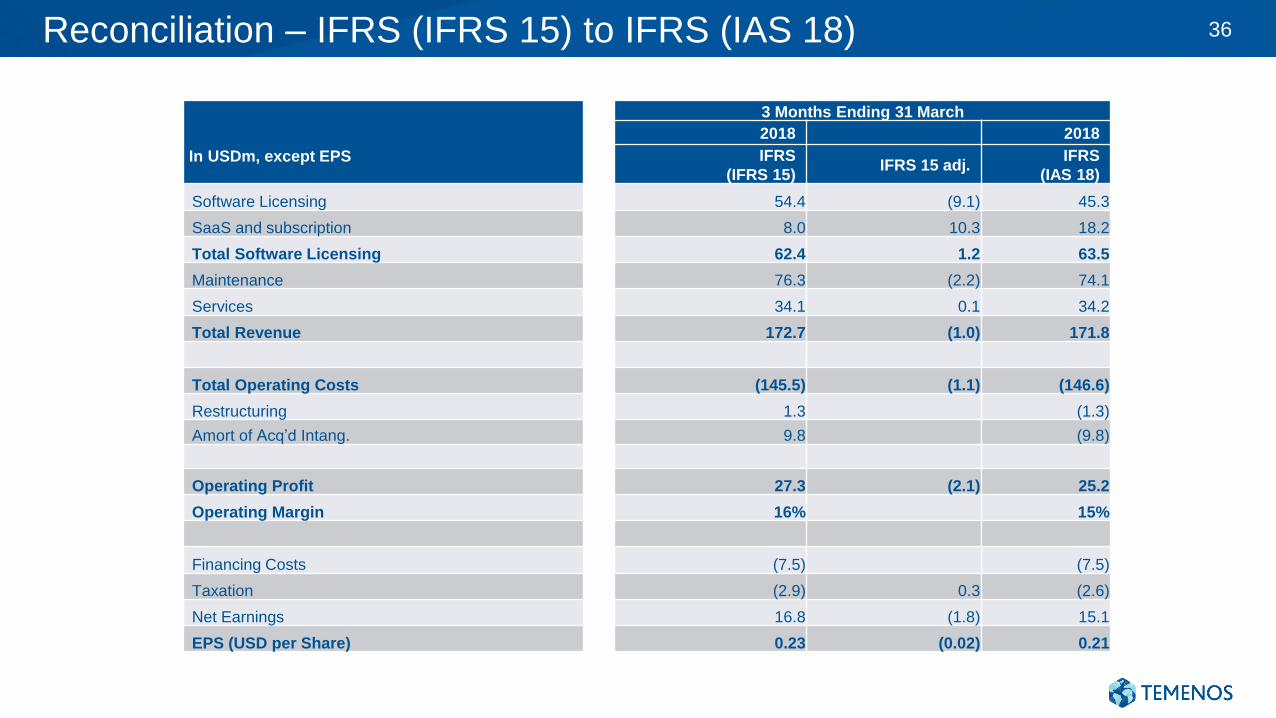
Reconciliation – IFRS (IFRS 15) to IFRS (IAS 18)
In USDm, except EPS
3 Months Ending 31 March
2018 2018
IFRS
(IFRS 15)IFRS 15 adj.
IFRS
(IAS 18)
Software Licensing 54.4 (9.1) 45.3
SaaS and subscription 8.0 10.3 18.2
Total Software Licensing 62.4 1.2 63.5
Maintenance 76.3 (2.2) 74.1
Services 34.1 0.1 34.2
Total Revenue 172.7 (1.0) 171.8
Total Operating Costs (145.5) (1.1) (146.6)
Restructuring 1.3 (1.3)
Amort of Acq’d Intang. 9.8 (9.8)
Operating Profit 27.3 (2.1) 25.2
Operating Margin 16% 15%
Financing Costs (7.5) (7.5)
Taxation (2.9) 0.3 (2.6)
Net Earnings 16.8 (1.8) 15.1
EPS (USD per Share) 0.23 (0.02) 0.21
36

Reconciliation – IFRS (IAS 18) to non-IFRS (IAS 18)
In USDm, except EPS
3 Months Ending 31 March Change
2018 2018 2017 2017
IFRS
(IAS 18)
Non-IFRS
adj.
Non-IFRS
(IAS 18)
IFRS
(IAS 18)
Non-IFRS
adj.
Non-IFRS
(IAS 18)IFRS Non-IFRS
Software Licensing 45.3 45.3 32.0 32.0 41% 41%
SaaS and subscription 18.2 0.1 18.3 13.0 0.3 13.3 40% 38%
Total Software Licensing 63.5 0.1 63.6 45.1 0.3 45.4 41% 40%
Maintenance 74.1 74.1 64.9 64.9 14% 14%
Services 34.2 34.2 32.5 32.5 5% 5%
Total Revenue 171.8 0.1 171.9 142.5 0.3 142.7 21% 20%
Total Operating Costs (146.6) 11.1 (135.5) (123.8) 8.4 (115.4) 18% 17%
Restructuring (1.3) 1.3 - (1.0) 1.0 0.0 36%
Amort of Acq’d Intang. (9.8) 9.8 - (7.4) 7.4 0.0 32%
Operating Profit 25.2 11.2 36.4 18.7 8.6 27.3 35% 33%
Operating Margin 15% 21% 13% 19% 1.5% pts 2.0% pts
Financing Costs (7.5) 4.6 (2.9) (4.7) (4.7) 61% (37%)
Taxation (2.6) (2.1) (4.8) (1.9) 1.1 (3.0) 35% 59%
Net Earnings 15.1 13.7 28.7 12.1 7.6 19.7 25% 46%
EPS (USD per Share) 0.21 0.19 0.40 0.17 0.10 0.27 24% 48%
37

Reconciliation – IFRS (IFRS 15) to non-IFRS (IFRS 15)
In USDm, except EPS
3 Months Ending 31 March
2018 2018
IFRS
(IFRS 15)IFRS 15 adj.
Non-IFRS
(IFRS 15)*
Software Licensing 54.4 54.4
SaaS and subscription 8.0 0.1 8.1
Total Software Licensing 62.4 0.1 62.5
Maintenance 76.3 76.3
Services 34.1 34.0
Total Revenue 172.7 0.1 172.8
Total Operating Costs (145.5) 11.1 (134.4)
Restructuring (1.3) 1.3
Amort of Acq’d Intang. (9.8) 9.8
Operating Profit 27.3 11.2 38.4
Operating Margin 16% 22%
Financing Costs (7.5) 4.6 (2.9)
Taxation (2.9) (2.1) (5.1)
Net Earnings 16.8 13.7 30.5
EPS (USD per Share) 0.23 0.19 0.42
* 2018 non-IFRS (IFRS15) will constitute the basis of Non-IFRS comparatives for non-IFRS numbers from 2019 onwards
38

Reconciliation – Balance sheet IAS 18 to IFRS 15 reported
In USDm, except EPS
31 March 2018
IFRS 15 reported IFRS 15 adj. IAS 18
Cash and cash equivalents 195.3 - 195.3
Trade receivables 246.6 5.8 252.5
Other receivables 49.1 (5.3) 43.8
Property, plant and equipment 16.7 - 16.7
Intangible assets 802.7 - 802.7
Deferred tax assets 24.9 - 24.9
Totals assets 1,335.3 0.6 1,335.9
Trade and other payables 164.5 - 164.5
Contract Liability / (Deferred revenue) 244.3 (1.0) 243.3
Income tax liabilities 42.1 (0.5) 41.7
Borrowings 450.2 - 450.2
Deferred tax liabilities 15.3 - 15.3
Retirement benefit obligations 8.3 - 8.3
Total liabilities 924.7 (1.4) 923.3
Equity (227.1) - (227.1)
Retained Earnings 637.8 2.0 639.8
Total Equity 410.6 2.0 412.6
Total liabilities and equity 1335.3 0.6 1335.9
39
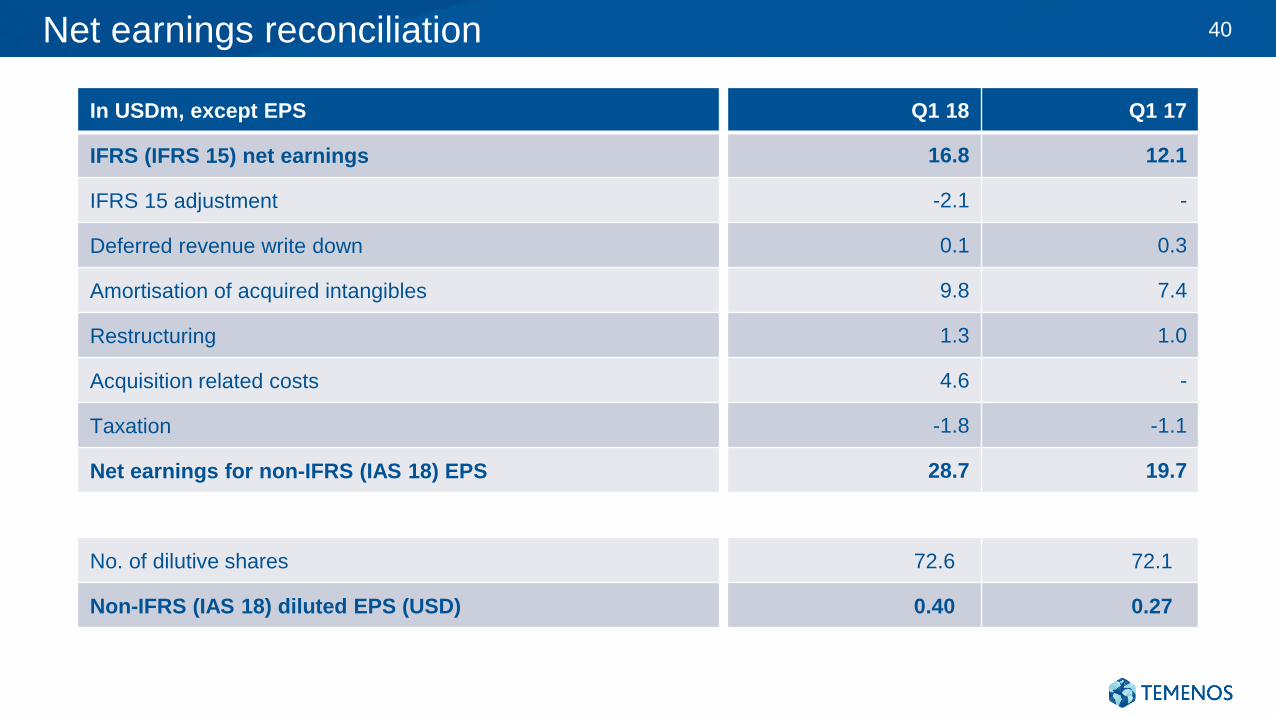
Net earnings reconciliation
In USDm, except EPS Q1 18 Q1 17
IFRS (IFRS 15) net earnings 16.8 12.1
IFRS 15 adjustment -2.1 -
Deferred revenue write down 0.1 0.3
Amortisation of acquired intangibles 9.8 7.4
Restructuring 1.3 1.0
Acquisition related costs 4.6 -
Taxation -1.8 -1.1
Net earnings for non-IFRS (IAS 18) EPS 28.7 19.7
No. of dilutive shares 72.6 72.1
Non-IFRS (IAS 18) diluted EPS (USD) 0.40 0.27
40

Reconciliation from IFRS (IFRS 15) to non-IFRS (IAS 18) for EBIT and EBITDA
USDm Q1 2018 EBIT Q1 2018 EBITDA
IFRS (IFRS 15) 27.3 50.5
IFRS 15 adjustment -2.1 -2.1
Deferred revenue write-down 0.1 0.1
Amortisation of acquired intangibles 9.8 -
Restructuring 1.3 1.3
Acquisition-related charges - -
Non-IFRS (IAS 18) 36.4 49.9
41

Definitions
Other
Constant currencies
Prior year results adjusted for currency movement
Like-for-like (LFL)
Adjusted prior year for acquisitions and movements
in currencies
SaaS and subscription
Revenues generated from Software-as-a-Service
and subscription licenses
Non-IFRS adjustments
Impact of IFRS 15
Adjustments made resulting from elimination of impact of IFRS 15 accounting
Deferred revenue write-down
Adjustments made resulting from acquisitions
Discontinued activities
Discontinued operations at Temenos that do not qualify as such under IFRS
Acquisition related charges
Relates mainly to advisory fees, integration costs and earn outs
Amortisation of acquired intangibles
Amortisation charges as a result of acquired intangible assets
Restructuring
Costs incurred in connection with a restructuring plan implemented and controlled
by management
Severance charges, for example, would only qualify under this expense category
if incurred as part of a company-wide restructuring plan
Taxation
Adjustments made to reflect the associated tax charge relating to the above items
42

Thank You
www.temenos.com