Embed Size (px)
Citation preview

DOWNTOWN BIKE PARKING ANALYSIS
HISTORICAL USE
AREAS OF IMPROVEMENT

PROJECT OBJECTIVES
GO boulder has been collecting downtown
bicycle parking data since 2007
The Objective:
To understand historical supply and demand trends
and to identify where additional bike parking is
needed.
The Goal:
To improve end of trip facilities in order to create a
more bicycle friendly downtown.

ADDITIONAL BENEFITS
These additions could have a variety of benefits:
Economic:
“When trip frequency is accounted for, the average monthly
expenditures by customer modes of travel reveal that bicyclists,
transit users, and pedestrians are competitive consumers and for
all businesses except supermarkets, spend more, on average than
those who drive.”
Reduced maintenance costs:
Hard to quantify, but less roadway usage means less road
maintenance costs for taxpayers.
Source: By, Professor Kelly J. Clifton, Christopher Muhs, and Sara Morrissey. "CONSUMER BEHAVIOR AND TRAVEL MODE CHOICES DRAFT Final Report." (n.d.): n. pag. Http://kellyjclifton.com/. Oregon Transportation Research And Education Consortium (OTREC), Nov. 2012. Web. May 2015.

PROJECT PHASES
We envision this project playing out in three
stages:
Phase I: Analysis of historical data (current phase)
Phase II: Analysis of Immediate priority areas
existing conditions and treatment recommendations
Phase III: Implementation of recommendations for
Immediate priority areas

DATA COLLECTION METHOD
The survey was conducted by volunteers at four
different times on four different days each year
Wednesday 6-7pm
Thursday 10-11am
Friday 7-8pm
Saturday 11-noon
41 blocks of downtown divided into eight
districts
In each district, volunteers counted parked
bicycles on each block face
North, East, South, West, and Interior

BIKE COUNT DISTRICTS

BIKE COUNT CLASSIFICATION
Three types of classification for parked bicycles
OR (On-Rack)– Bicycles that are locked to rack.
OO (On-Other)– Bicycles that are locked to objects
other than official bicycle racks
FS (Free Standing)– Bikes not attached to anything
On-Rack On-Other Free Standing

HISTORICAL DATA
Note: 2014 was statistical outlier because only 3 count dates could be
complete due to poor weather

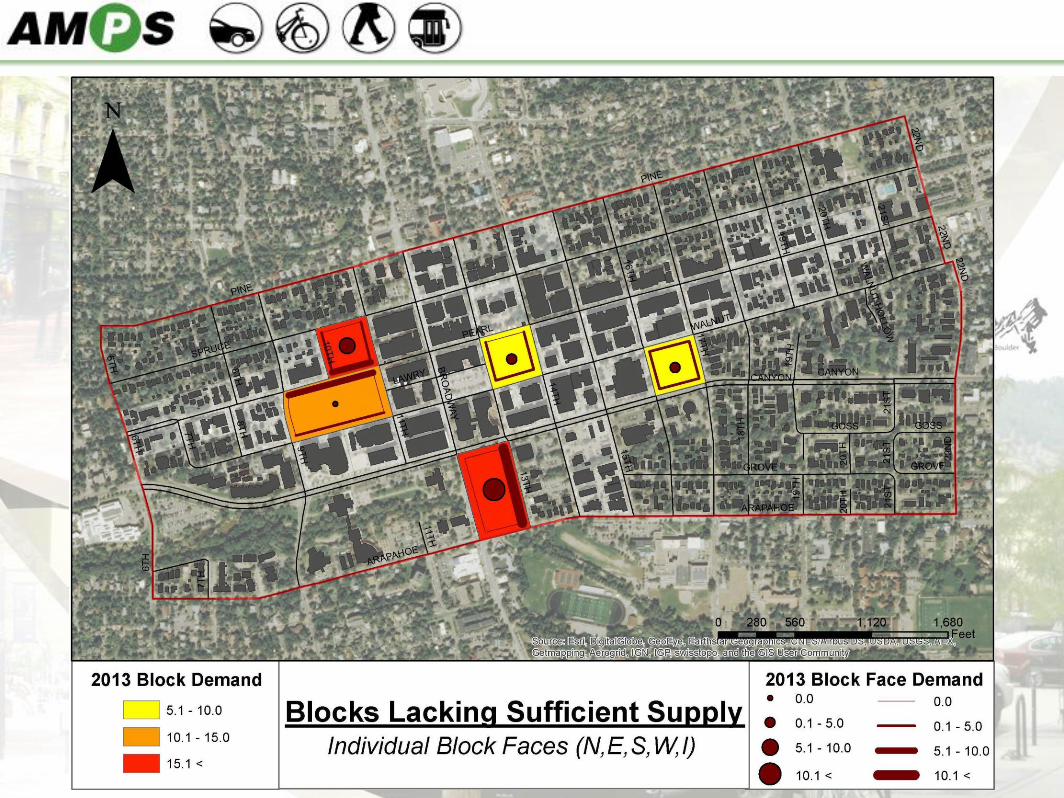
ADDRESSING INCREASED DEMAND BY BLOCK
With increased demand comes the need for
increased supply
An analysis of 41 Downtown blocks was
performed to see which blocks were meeting/
not-meeting the increased demand
Unmet Demand was found by averaging the total
reported amount of bikes found OO, and FS over
each years four count days for each block face.

UNMET DEMAND 2007-13: BLOCKS OF EMPHASIS


RESULTS OF BLOCK BY BLOCK ANALYSIS
There are two possibilities for why these
blocks have historically underperformed:
Lack of Bike Parking Supply
Total demand of block (OR+OO+FS) exceeds the number
of total available bicycle parking spaces
Less than Ideal placement of Existing Bicycle
Parking Placement
Total bicycle parking supply exceeds total demand of
block (OR+OO+FS), but there is still a substantial amount
of unmet demand (OO+FS)


BLOCKS LACKING SUFFICIENT SUPPLY

BLOCKS WITH LESS THAN IDEAL PLACEMENT


APPLYING THE DATA
We divided up all of the blocks into three priority
levels:
Immediate Priority: Areas lacking sufficient supply
Near Term Priority: Areas with inadequate
placement (>8 unmet demand)
Long Term Priority: All other areas with inadequate
placement (<8 unmet demand)

NEXT STEPS
For this project there are three phases:
Phase I: Analysis of historical data (current phase)
Phase II: Analysis of Immediate priority areas
existing conditions and treatment recommendations
Phase III: Implementation of recommendations for
Immediate priority areas
Phase II and III will then be repeated for the
Near Term and Long Term priority areas

Any Questions….