Embed Size (px)
Citation preview
DPRK 2004 Nutrition Assessment
Report of Survey Results
Prepared by
Central Bureau of Statistics
Institute of Child Nutrition
Democratic People’s Republic of Korea
February 2005
Table of Contents
Foreword
The government of DPRK, in collaboration with UNICEF and WFP, conducted the DPRK 2004 Nutrition Assessment in October 2004. This assessment was carried out by the Central Bureau of Statistics and Institute of Children Nutrition, with financial and technical support from UNICEF and WFP.
We extend our sincere gratitude to UNCEF, WFP, the National Co-ordination Committee of DPRK, the consultants, Dr. Michael John Dibley, University of Newcastle, Australia, and Mr. Tran Than Do, National Institute of Nutrition, Vietnam, who provided the invaluable assistance and support, and the survey team members.
Democratic People’s Republic of Korea
Central Bureau of Statistics
November 2004
DPRK 2004 National Nutrition Assessment
Table of Contents Page 3
Contents
Forward............................................................................................................................................. 2
Summary of Survey Findings.......................................................................................................... 8
SURVEY METHODOLOGY........................................................................................................ 8
SURVEY POPULATION AND DATA QUALITY ..................................................................... 8
CHILD NUTRITIONAL STATUS ............................................................................................... 9
MATERNAL NUTRITIONAL AND HAEMOGLOBIN STATUS ........................................... 10
FOOD AVAILABILITY.............................................................................................................. 11
MATERNAL AND CHILD CARE ............................................................................................. 11
WATER AND SANITATION..................................................................................................... 12
1 Introduction ............................................................................................................................ 13
2 Aims......................................................................................................................................... 14
3 Survey Methodology .............................................................................................................. 15
3.1 Design .............................................................................................................................. 15
3.2 Sampling design…………………………………………………………………………15
3.3 Survey measurements ....................................................................................................... 16
3.3.1 Questionnaires.......................................................................................................... 16
3.3.2 Anthropometry ......................................................................................................... 16
3.3.3 Haemoglobin ............................................................................................................ 17
3.3.4 Measurement of salt iodination ................................................................................ 17
3.4 Survey factors and outcome indicators ............................................................................ 17
3.4.1 Anthropometric indicators in children ..................................................................... 17
3.4.2 Anthropometric indicators in women....................................................................... 18
3.4.3 Measurement of infant feeding practices ................................................................. 19
3.5 Survey organisation.......................................................................................................... 19
3.6 Training ............................................................................................................................ 20
3.7 Data processing ................................................................................................................ 20
3.8 Data analysis .................................................................................................................... 20
4 Results ..................................................................................................................................... 23
4.1 Survey population ............................................................................................................ 23
DPRK 2004 National Nutrition Assessment
Page 4 Table of Contents
4.2 Assessment of data quality ............................................................................................... 26
4.2.1 Quality of age data.................................................................................................... 26
4.2.2 Quality of anthropometric measurements................................................................. 26
4.3 Child nutritional status...................................................................................................... 29
4.3.1 Weight-for-age ......................................................................................................... 29
4.3.2 Height-for-age .......................................................................................................... 32
4.3.3 Weight-for-height ..................................................................................................... 35
4.3.4 Factors associated with child malnutrition ............................................................... 38
4.3.5 Trends in child malnutrition ..................................................................................... 42
4.4 Maternal nutritional status ................................................................................................ 48
4.4.1 Maternal malnutrition ............................................................................................... 48
4.4.2 Maternal haemoglobin status.................................................................................... 54
4.5 Food availability ............................................................................................................... 56
4.6 Maternal and child care .................................................................................................... 59
4.6.1 Child feeding patterns............................................................................................... 59
4.6.2 Use of micronutrients ............................................................................................... 61
4.6.3 Immunisations of child ............................................................................................. 64
4.6.4 Childhood illnesses................................................................................................... 65
4.6.5 Pregnancy care.......................................................................................................... 68
4.7 Water and sanitation ......................................................................................................... 69
5 Conclusions and Recommendations...................................................................................... 72
6 References ............................................................................................................................... 73
Appendix A – List of Selected Clusters ........................................................................................ 74
Appendix B – Survey teams........................................................................................................... 78
Appendix C – Detailed Results ...................................................................................................... 80
Appendix D- Questionnaires ......................................................................................................... 91
DPRK 2004 National Nutrition Assessment
Table of Contents Page 5
Tables
Table 1 Design of multistage cluster sampling ................................................................................ 15
Table 2 Classification of prevalence levels for child anthropometric indicators ............................. 18
Table 3 Sampling weights ................................................................................................................ 21
Table 4 Number of clusters, women and children surveyed in each province ................................. 23
Table 5 Number of household members and children < 6 years...................................................... 24
Table 6 Age and sex distribution of children with anthropometric measurements .......................... 24
Table 7 Age distribution of women and percentage with nutrition measurements .......................... 25
Table 8 Education levels of surveyed mothers................................................................................. 25
Table 9 Assessment of quality of anthropometric measurements by team ...................................... 27
Table 10 Comparison of data quality between Nutrition Assessments, 2002 and 2004 .................. 28
Table 11 Prevalence of malnutrition in children aged less than 72 months by gender .................... 29
Table 12 Trends in the prevalence of child malnutrition - DPRK 2002 to 2004 ............................. 43
Table 13 Prevalence of maternal malnutrition by background characteristics................................. 50
Table 14 Body weight of mothers by background characteristics ................................................... 51
Table 15 Prevalence of maternal anaemia by background characteristics ....................................... 55
Table 16 Frequency of food groups consumed by households ........................................................ 56
Table 17 Use of wild foods………. ................................................................................................. 57
Table 18 Sources of main staple food .............................................................................................. 57
Table 19 Sources of beans and bean products.................................................................................. 58
Table 20 Sources of fruits and vegetables........................................................................................ 58
Table 21 Distribution of breastfeeding by age ................................................................................. 59
Table 22 Breastfeeding by province................................................................................................. 60
Table 23 Coverage of vitamin A supplementation of child ............................................................. 61
Table 24 Sources of Vitamin A supplements................................................................................... 62
Table 25 Maternal postpartum vitamin A supplementation ............................................................. 62
DPRK 2004 National Nutrition Assessment
Page 6 Table of Contents
Table 26 Maternal night blindness ................................................................................................... 63
Table 27 Household usage of iodised salt ........................................................................................ 64
Table 28 Coverage of childhood immunisations .............................................................................. 64
Table 29 Prevalence of childhood diarrhoea .................................................................................... 65
Table 30 Fluids and liquids during diarrhoea ................................................................................... 66
Table 31 Prevalence of acute respiratory illness .............................................................................. 67
Table 32 Coverage of antenatal care in last pregnancy .................................................................... 68
Table 33 Delivery assistance by background characteristics ........................................................... 69
Table 34 Household water sources by province ............................................................................... 70
Table 35 Household toilets by province .......................................................................................... 70
Table 36 Disposal of child's faecal matter........................................................................................ 71
Table 37 Prevalence of underweight and severe underweight by gender and province................... 80
Table 38 Mean weight-for-age Z-score, by gender and province .................................................... 81
Table 39 Prevalence of stunting and severe stunting by gender and province ................................ 82
Table 40 Mean height-for-age Z-score, by gender and province ..................................................... 83
Table 41 Prevalence of wasting and severe wasting by gender and province .................................. 84
Table 42 Mean weight-for-height Z-score, by gender and province ................................................ 85
Table 43 Prevalence of underweight & severe underweight by gender & 6 month age groups....... 86
Table 44 Prevalence of stunting & severe stunting by gender & 6 month age groups..................... 87
Table 45 Prevalence of wasting & severe wasting, by gender & 6 month age groups..................... 88
Table 46 Factors associated with child malnutrition ........................................................................ 89
DPRK 2004 National Nutrition Assessment
Table of Contents Page 7
Figures Figure 1 Percentage of children by age in months ........................................................................... 26
Figure 2 Prevalence of underweight by age groups ......................................................................... 30
Figure 3 Comparison of the prevalence of underweight in girls and boys....................................... 30
Figure 4 Weight-for-age Z-score distributions for girls and boys.................................................... 31
Figure 5 Comparison of the prevalence of underweight in surveyed provinces .............................. 32
Figure 6 Prevalence of stunting (height-for-age <-2 Z-score) ......................................................... 33
Figure 7 Comparison of the prevalence of stunting in girls and boys.............................................. 34
Figure 8 Height-for-age Z-score distributions for girls and boys..................................................... 34
Figure 9 Comparison of the prevalence of stunting in surveyed provinces ..................................... 35
Figure 10 Prevalence of wasting by age groups............................................................................... 36
Figure 11 Comparison of the prevalence of wasting in girls and boys ............................................ 37
Figure 12 Weight-for-height Z-score distributions for girls and boys ............................................. 37
Figure 13 Comparison of the prevalence of wasting in surveyed provinces.................................... 38
Figure 14 Prevalence of stunting by frequency of household intake of rice .................................... 40
Figure 15 Prevalence of stunting by frequency of household intake of poultry or meat ................. 41
Figure 16 Prevalence of stunting by source of household staple foods ........................................... 42
Figure 17 Height-for-age Z-score distributions for 2002 and 2004 ................................................. 44
Figure 18 Trends in age specific stunting rates for 2002 and 2004.................................................. 45
Figure 19 Trends in child malnutrition by province between 2002 and 2004.................................. 46
Figure 20 Weight-for-age Z-score distributions for 2002 and 2004 ................................................ 47
Figure 21 Trends in age specific underweight rates for 2002 and 2004 .......................................... 48
Figure 22 Trends in the prevalence of maternal malnutrition by age, 2002 to 2004........................ 52
Figure 23 Trends in the prevalence of maternal malnutrition by province,2002 to 2004 ................ 52
Figure 24 Distribution of children by breastfeeding status, according to age.................................. 60
DPRK 2004 National Nutrition Assessment
Page 8 Summary of Survey Findings
Summary of Survey Findings
SURVEY METHODOLOGY
The DPRK 2004 National Nutrition Assessment is the fourth national nutrition assessment with the previous surveys taking place in 1998, 2000 and 2002. It aimed to assess the nutritional status of children from birth to six years of age and of mothers with children less than 2 years of age, and to identify possible causal factors of malnutrition.
It was a cross sectional survey of a representative sample of children and women living in seven provinces and one municipal city, and was conducted in October 2004. Multi stage cluster sampling was used with provinces as strata and dong or ri within the provinces as clusters. An approximation of random sampling, based on the random selection of two index children from a nursery within the dong or ri was used to select the households and children for the survey within each cluster. Twenty clusters were selected in each province and 30 households within each cluster giving a total sample of 4800 children.
Three main questionnaires were used in the survey; the household questionnaire; the maternal and newborn health questionnaire; and the child and maternal anthropometric measurement form. Food availability was assessed by asking about the frequency of consumption of fourteen different food groups by the households and mothers in the six months prior to the survey. Anthropometry measurements of weight and height were collected from all children using standard methods. Anthropometry measurements of mid upper arm circumference and body weight, and haemoglobin were collected from women with a child less than two years of age. Anthropometry standardisation exercises were conducted prior to the data collection. All measurements were directly monitored for quality by the survey teams, which included staff from the supporting international organisations.
Maternal malnutrition was defined as a MUAC of<22.5 centimetres. For all indicators of child and maternal malnutrition 95% confidence intervals were estimated using SPSS (V. 13); the statistical program.
SURVEY POPULATION AND DATA QUALITY
Survey population
Data was collected in the survey from a total of 4800 households from 160 dong or ri clusters of which 97 were from urban areas and 63 from rural areas (Table 4). There was 2109 children aged less than two years (44% of children <6 years) and all the mothers of these children participated in the anthropometric measurements. However participation in the haemoglobin testing was lower with only 1253 women (59%) agreeing to be tested. of participation varied by province.
Data quality
Assessment of child age data revealed it was of good quality and had no patterns that could bias the calculation of anthropometric indices. The evaluation of the child anthropometric data found the WHO recommended quality indicators (standard deviations of indices) were within the usual range for all three indicators. Also there was a similar quality of the anthropometric data collected by the
DPRK 2004 National Nutrition Assessment
Summary of Survey Findings Page 9
survey teams. The data quality indicators for the 2002 and 2004 assessment were similar indicating the survey results could be validly compared.
CHILD NUTRITIONAL STATUS
Child malnutrition
The prevalence of stunted children (height-for-age < -2 Z-score) aged 0-71 months in 2004 was 37.0%. The prevalence of severe stunting (<-3 Z-score) was 12.2%. There was a progressive increase in the prevalence of stunting from birth through to 48-59 months. but a slight decline with the oldest age group. The prevalence of stunting was higher in boys (38.6%) than in girls (35.2%). The prevalence of stunting varied significantly by province. Two provinces, South Hamgyong, and Ryanggang, had a very high level of stunting.
The prevalence of underweight children (weight-for-age < -2 Z-score) aged 0-71 months in 2004 was 23.4%. The prevalence of severe underweight (<-3 Z-score) was 8.1%. There was a progressive increase in the prevalence of underweight from birth until 24-35 months and then a slight decline. Prevalence of underweight was similar in girls and boys. The prevalence of underweight children varied significantly by province. The highest prevalence were in South Hamgyong, North Hamgyong and Ryanggang provinces.
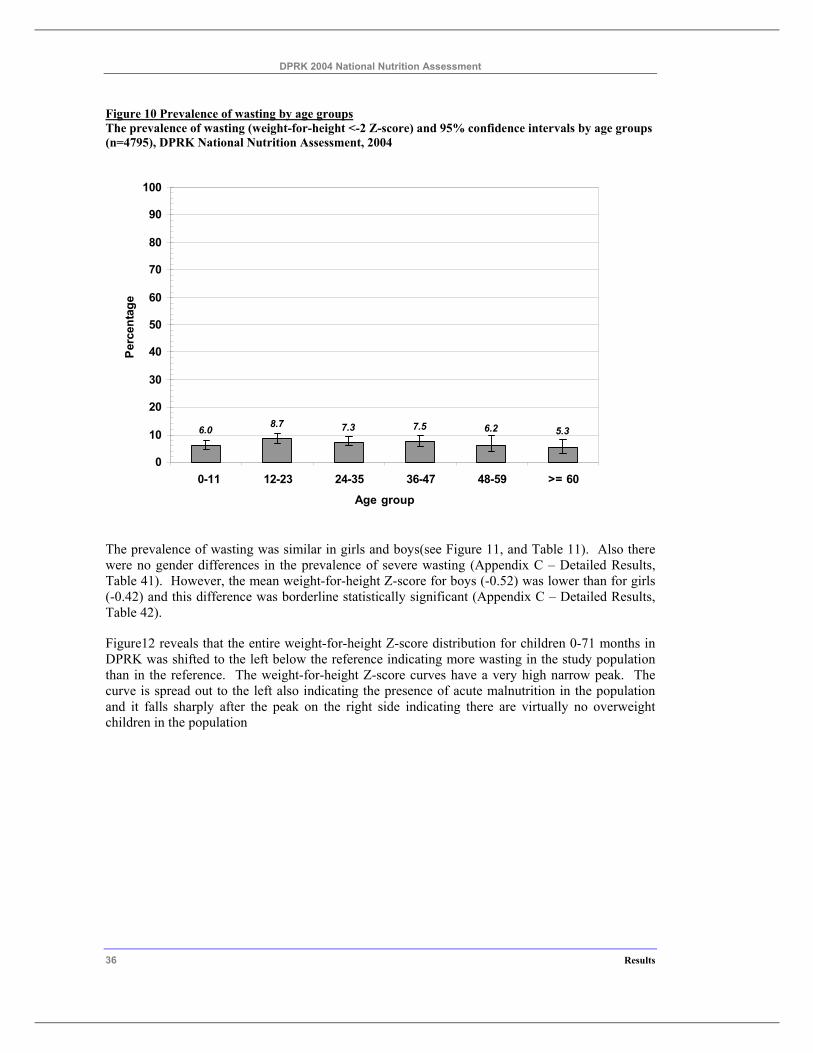
The prevalence of wasted children (weight-for-height <-2 Z-score) aged 0-71 months in 2004 was 7.0% which is a medium level based on WHO criteria. The prevalence of severely wasted (<-3 Z-score) children aged 0-71 months was 1.8%. There was a slight increase in the prevalence of wasting in children 12-23 months, and thereafter a slow decline with increasing age. Wasting levels were similar in girls and boys. The prevalence of wasted children varied significantly by province. Two provinces, South and North Hamgyong, had a high level of wasting (>10%). Other 4 provinces had a medium level(5-9%) based on WHO criteria.
Factors associated with child malnutrition
Maternal malnutrition was associated with an increased prevalence in stunting. Low birth size was associated with more stunting. The prevalence of stunting increased by 62% as reported birth size decreased from 19% in children who were very large at birth to 30.7% in children who were perceived to be very small at birth. Higher usual frequency of household consumption of rice and rice products, poultry or meat, red or yellow vegetables, and oils and fats were associated with reduced childhood malnutrition.
Trends in childhood malnutrition
The reliable indicator to assess trends in children malnutrition prevalence is low height-for-age or stunting. This indicator changes slowly and is not influenced by recent acute shortages of food or of illness in the children. Trends in child malnutrition were examined by comparing the unweighted prevalence of stunting in the two surveys.
The prevalence of stunting in children 0-71 months in DPRK has fallen by 2.9% from 38.8% in 2002 to 35.9% in 2004. This is an average decline of stunting prevalence of 1.45% per year. The decline was greater for girls (4%) than for boys (2.1%). There was a significant decline in the prevalence of severe stunting between the two surveys, from 14.4% in 2002 to 11.8% in 2004.
The age specific trends in stunting also revealed the following.
DPRK 2004 National Nutrition Assessment
Page 10 Summary of Survey Findings
Firstly, there was no change in the stunting rates between the surveys for children 0-11 months. Stunting in this age group is largely influenced by foetal growth and maternal malnutrition. The observed association between small birth size and stunting indicates that more efforts to improve maternal nutritional status will be required to rapidly reduce the prevalence of stunting in infants.
Secondly, the stunting rate in children 12 to 35 months has fallen sharply and was approximately 30% lower than 2002. If this progress in reducing stunting continues the overall prevalence of stunting will fall by a substantial amount in future surveys.
Thirdly, the stunting rate in the children 36 to 71 months did not change between the surveys. Children usually do not exhibit catch up growth beyond three years of age even if their diets improve. So it is critically important to provide interventions that have an impact on the growth of very young children.
The prevalence of stunting decreased in all provinces and on average the decline was from 2% to 3% in each province. These findings indicate improvements occurred uniformly across the country.
MATERNAL NUTRITIONAL AND HAEMOGLOBIN STATUS
Maternal malnutrition
Thirty two percent of the women with a child less than 24 months were malnourished as indicated by a mid upper arm circumference (MUAC) less than 22.5 centimetres. The prevalence of low MUAC demonstrated a U shaped relationship with age where by both younger and older women had higher levels. The prevalence of maternal malnutrition was similar in all provinces except for South Hwanghae, which was lower than the national average.
Similar patterns were observed for low maternal body weight. Low intakes of rice and rice products, poultry and meat, and green leafy vegetables had a weak relationship with higher prevalence of maternal body weight < 45 kg
Trends in maternal malnutrition were examined by comparing the prevalence of MUAC in the two surveys. There were some improvements in maternal nutritional status between the 2002 and 2004 assessments mainly for women 25 to 29 and 30 to 34 years and these improvements were observed in some provinces.
Maternal anaemia
There was an improved participation in the haemoglobin assessment with 59% of women with a child less than two years agreeing to the test. Overall, 34.7% of the women had anaemia (Hb < 12.0 g/DL), but only 0.5% had moderate to severe anaemia (Hb < 9.0 g/DL). Anaemia tended to be higher in the youngest and oldest age groups and was slightly lower in women who had completed tertiary education. There was a variation in the prevalence of anaemia by province. The highest prevalence of anaemia was found in South Phyongan (61.3%) followed by North Phyongan (47.8%).
The prevalence of anaemia in 2002 (33.6%) was very similar to the level found 2004.
DPRK 2004 National Nutrition Assessment
Summary of Survey Findings Page 11
FOOD AVAILABILITY
Household food availability was assessed in the survey by asking the women respondents about the usual frequency of consumption of fourteen different food groups during the six months prior to interview. Usual household consumption of rice was lowest in Ryanggang and North Hwanghae, but these provinces had high daily consumption of other cereals and potatoes. The usual consumption of poultry or meat and fish was about half that of beans and bean products across most provinces. The consumption of poultry or meat and fish was very low in Ryanggang. Green leafy vegetables and non-coloured vegetables were consumed with a similar high frequency across all provinces. There was more variation by province in the consumption of red/yellow vegetables with the highest levels in Ryanggang and North Hamgyong. Overall the average consumption of red/yellow vegetables was much lower than for the other vegetables. Oils and fats were consumed least frequently in the Ryanggang and more frequently in lowland southern provinces. The frequency of consumption of fortified foods was high in the northern provinces.
The most common source of staple foods was the PDC rations or Farmers rations, but a quarter of the households reported WFP foods as a source of their staple food. The most common sources of beans were farmer’s rations, self production, markets, kin support and WFP foods. The sources of fruits and vegetables were state shops, markets, self production and farmer’s rations. WFP foods were not a source of these foods.
MATERNAL AND CHILD CARE
Child feeding patterns
At <6 months, 6-9 months, 12-13 months and 22-23 months 98.5%, 86.1%, 71.2% and 38.9% of the children respectively were still breastfed. Based on 24 hour recall prior to interview, 65% of children less than six months of age were exclusively breastfed. About 22% of the children less than six months were receiving both breast feeds and other water based liquids. A smaller percentage was being given other milks. Amongst the breastfed children 31% were receiving at least some complimentary food at 6-9 months.
Use of micronutrients
The coverage of Vitamin A supplementation in the six months prior to the survey was uniformly very high for age eligible children across all provinces. The majority of children who received vitamin A obtained it from local nurseries.
Overall, 33.5% of women received vitamin A postpartum. The coverage of maternal postpartum vitamin A supplementation varied considerably by province with the highest levels in Pyongyang. Six percent of women reported night blindness during their last pregnancy.
Forty percent of households were using iodised salt. There was less consumption of iodised salt in the northern mountainous provinces.
Immunisations of children
There was a uniformly high coverage of all childhood immunisations.
Childhood illnesses
DPRK 2004 National Nutrition Assessment
Page 12 Summary of Survey Findings
About one in five children had diarrhoea in the two weeks prior to the survey. The prevalence of diarrhoea was lower in Pyongyang than other provinces. No relationship was seen between the type of toilet or water source and diarrhoea. This might be expected given the high level of appropriate methods of disposal of the children’s stools. Overall 83% of the mothers gave ORS or other acceptable fluids during the diarrhoea episode. Also 62% of the mothers appropriately continued to breastfed. However 30% of mothers did report reducing food intake during the diarrhoea episode and 20% reported giving fewer fluids.
Twelve percent of the children had ARI symptoms, 20% had a fever and 85% had both ARI and fever in the two weeks prior to the survey. Children 6 to 17 months were more likely to have ARI and ARI with fever. The vast majority of children with ARI were taken for treatment.
Pregnancy care
There was a very high level of antenatal care during pregnancy with approximately 60% of women attending ten or more antenatal care checks during their last pregnancy. The coverage of antenatal care was uniformly high across all provinces. Similarly, there was a uniformly high level of care during delivery from medically trained birth attendants.
WATER AND SANITATION
Overall 82% of the households in DPRK have water piped into the dwelling even in the remote northern provinces. Approximately 57% of households have flush toilet system and 43% have pit toilets. There was similar pattern found in all provinces. Overall 80% of mothers with a young child 0-3 years disposed of their children’s stools using a method that contained the stools.
DPRK 2004 National Nutrition Assessment
Introduction 13
1 Introduction
2004 Nutrition Assessment Health Survey in DPRK was carried out by the questionnaire and methodology on which were agreed with CBS, ICN, NCC, UNICEF, WFP and consultants according to the Protocol.
DPRK government carried out Nutrition Surveys in 1998, 2000(MICS) and 2002. The data collected from these surveys greatly assisted in improving the nutrition status of mothers and children, and also progressed survey methods and analysing capacity of the country. For the further improvement of nutrition, the government conducted nutrition assessment survey in October 2004, in collaboration with UNICEF and WFP.
DPRK 2004 National Nutrition Assessment
Page 14 Aims
2 Aims
The goal of the National Nutritional Assessment was to collect data for monitoring the National Programme of Action for the Well-being of Children (2001-2010) of DPRK and to identify strategies for better targeting of future programmes and expenditures of the Government, and international agencies such as UNICEF and WFP, directed at improving the nutrition of women and children. The assessment also sought to develop the capacity of the Central Bureau of Statistics (CBS) and the Institute of Child Nutrition (ICN) to carry out such nutrition assessments in the future.
The aim of the survey was to assess, in each of seven provinces and one municipal city, the nutritional status of children from birth to six years of age and of mothers with children less than 2 years of age, and to identify possible causal factors of malnutrition.
The survey specifically aimed to assess the following in each of the seven provinces and one municipal city, and at a national level:
• To assess the prevalence of underweight, stunting, and wasting in children less than 72 months of age
• To assess the prevalence of low mid upper arm circumference in women with children less than two years
• To assess the prevalence of anaemia in women with children less than two years
• To analyse factors associated with malnutrition in children and women
• To analyse patterns of infant feeding, including breastfeeding patterns.
• To assess the frequency of consumption of groups of foods at the household level and by the women with children less than two years
• To analyse the sources of main staple foods, beans and bean products, and fruits and vegetables for households.
• To assess the coverage of vitamin A supplementation for children less than two years in the six months prior to the survey
• To assess the coverage of vitamin A supplementation and the level of night blindness of women with children less than two years during their last pregnancy
• To assess the level of usage of iodised salt by households
• To assess the coverage of BCG, Polio, DTP and measles vaccinations in children less than two years of age
• To assess the access to water and sanitation facilities available to households with children less than six years of age
.
DPRK 2004 National Nutrition Assessment
Survey Methodology 15
3 Survey Methodology
3.1 Design
The DPRK 2004 Nutrition Assessment was a cross sectional survey of a representative sample of children less than six years and women with children less than two years living in seven provinces and one municipal city. The data collection was completed over a ten day period from 4 to 14 October 2004.
3.2 Sampling design
In the absence of a national household sampling frame, multi stage cluster sampling was used with provinces as strata and dong or ri within the provinces as clusters or primary sampling units (PSU). An approximation of random sampling, based on the random selection of two index children from a nursery within the dong or ri was used to select the households and children for the survey within each primary sampling unit. The multi-stage cluster sampling design is summarised in the Table 1.
Table 1 Design of multistage cluster sampling
List Used Sampling Method Provinces Stratification Dong and ri from stage 1 20 clusters by random sampling with dong and ri selected proportionate to
urban and rural population in province. Nurseries ini clusters from stage 2
Randomly select one nurseries
List of children in nursery Randomly select two index children Households in selected Dong or Ri
30 households starting with randomly selected index households and remainder selected by next-nearest-house method. Women present with child aged <6 years and resident in the household
The sample of this nutrition assessment represents the universe of seven provinces and one municipal city. The sample frame was all the dong or ri in both the accessible and non-accessible counties of these provinces and city. A random number generator was used to select twenty dong and or ri, proportionate to the size of the urban and rural population within the province, as the clusters for the survey. If a randomly selected dong or ri was located in a non-accessible county, then the next accessible dong or ri was chosen.
In each cluster, one nursery and two children from the list of those enrolled in the nursery were randomly selected, and their families became index households for the survey. A further 14 households with children under six surrounding the index households were selected using the “next-nearest-house“ method (MICS 2004). Thus, 30 households or secondary sampling units (SSU) were selected within each PSU. The youngest child and mother in the selected 30 households were asked to come to the central area for data collection and measurements.
The population of the dong and ri were assumed to be sufficiently similar within each province not to result in any major sampling bias, and no sampling weights for PSU were used when calculating province levels estimates. However, a fixed sample size was collected from each province even though the province population size varied. Thus sampling weights were used when calculating national level estimates of survey parameters, and these are discussed in more detail in section 0 3.8 Data analysis below.
DPRK 2004 National Nutrition Assessment
16 Survey Methodology
3.3 Survey measurements
3.3.1 Questionnaires
Three main questionnaires or forms were used in the survey; the household questionnaire; the maternal and newborn health questionnaire; and the child and maternal nutritional status form. The details of the information recorded on these forms are described below.
The household questionnaire consisted of the following modules:
• Household information module: This module recorded basic socio-demographic information and the results of the interview.
• Salt iodization module: This module recorded the results of the salt test for iodine content.
• Water and sanitation module: This module recorded information about the water supply and sanitation facilities in the household.
• Household food availability module: This module recorded information about the average consumption of groups of foods over the 6 months prior to the survey as an indicator household food availability.
The maternal and newborn health questionnaire consisted of the following modules:
• Maternal and newborn health module: This module recorded the history care in pregnancy and at delivery and the birth weight or perceived birth size of children aged less than 2 years.
• Vitamin A module: This module recorded if vitamin A supplements were received by children less than 2 years of age in the six months prior to interview.
• Infant feeding module: This module recorded current infant feeding practices for children less than two years of age.
• Care of illness module: This module recorded common childhood morbidity and the response of caregivers to these illnesses.
• Immunisation module: This module recorded the type and number of childhood immunisations.
• Maternal food frequency module: This module recorded the average frequency of consumption of food groups over the last 6 months of mothers with children less than 2 years.
The child and maternal nutritional status form consisted of the following modules:
• Child anthropometry module: This module was used to record the child anthropometry, the child’s sex and date of birth and the date of measurement.
• Maternal anthropometry and haemoglobin module: This module was used to record the maternal anthropometry and haemoglobin measurement.
3.3.2 Anthropometry
The anthropometry measurements were taken by trained staff of the Institute of Child Nutrition and recorded in child and maternal nutritional status form. All measurements were taken by two
DPRK 2004 National Nutrition Assessment
Survey Methodology 17
trained survey team staff. The measurements were taken in a warm environment with adequate light.
The weight of the mother and child were measured using an electronic scale (Uniscale) measuring up to a maximum of 120 kg with increments of 100 gram. An automatic tarring facility of the scale allowed the child to be held by the mother but with the child’s weight displayed. Weight measurements were taken with the mother or child in light clothing. Pre-weighed blankets were provided to keep the children warm when necessary during measurement. It was recorded if the child was measured with clothing or shoes.
Standing height was measured for children 2 years of age or older using a portable height measuring board, made of wood using a standard design with moveable head piece and tape to nearest millimetre. Supine length was measured for children less than 2 years of age using the same portable height measuring board described above. Two survey team members took the height or length measurements ensuring that the child’s legs were fully extended and that the child’s head touched the vertical headboard.
Mid upper arm circumference (MUAC) was measured for all women with a child less than 2 years of age using a non-stretch insertion tape to the nearest millimetre. The mid point between elbow and shoulder on the left arm was marked and used as the site for the measurement.
3.3.3 Haemoglobin
The mothers of all children less than two years of age were invited to have a haemoglobin examination, using a capillary blood sample tested with a Hemocue portable hemoglobinometer. A standard protocol was used to collect the blood sample and take the haemoglobin reading. Verbal consent of the women for the haemoglobin test was recorded. Women with haemoglobin <12.0 g/dL were referred to the local health authority.
3.3.4 Measurement of salt iodination
Salt iodization was measured using a colour-change kit which detected if there was no iodine (no colour), from 1 to 14 ppm of iodine (weak colour change) and 15 ppm or more (strong colour change). In the analysis only any colour change was used to indicate the salt had some iodine. The salt was brought to the survey site by the mother for testing by the staff of the Institute of Child Nutrition at the time of interview.
3.4 Survey factors and outcome indicators
3.4.1 Anthropometric indicators in children
All the anthropometric indicators of child nutritional status used in the survey were expressed as Z-scores, namely the deviation of the individual anthropometric measurement from the median value of the WHO growth reference for that child's height or age divided by the standard deviation for the reference population (WHO 1995).
Weight for-age is an indicator of body mass relative to chronological age. It is influenced by both the height of the child, and the weight of the child relative to height thus making its interpretation complex. Low weight-for-age indicates insufficient weight gain relative to age or weight loss (underweight). While high weight-for-age indicates an excess gain of weight relative to age
DPRK 2004 National Nutrition Assessment
18 Survey Methodology
(overweight). Two categories of low weight-for-age were used in the survey tables: moderate and severe underweight if Z-score <-2; and severe underweight if Z-score <-3.
Height-for-age reflects achieved linear growth and its deficits indicate long-term, cumulative inadequacies of health or nutrition (WHO 1995). Low height-for-age or stunting indicates a pathological process that has impaired linear growth. However some children with low height-for-age are genetically short. Where the prevalence of low height-for-age is very high then it is reasonable to assume that the majority of these children are stunted. Two categories of low height-for-age were used in the survey tables: moderate and severe stunting if Z-score <-2; and severe stunting if Z-score <-3.
Weight-for-height reflects body weight relative to height. Low weight-for-height or wasting indicates an insufficient weight gain relative to height or recent lose of weight. Wasting implies a recent severe process that has lead to weight loss such as acute illness or acute starvation. Some children with low weight-for-height are normally thin but if the prevalence of low weight-for-height is high it may be assumed that most of these children are wasted. High weight-for-height or overweight indicates an excess weight gain relative to height, or an insufficient gain in height relative to weight. Two categories of low weight-for-height were used in the survey tables: moderate and severe wasting if Z-score <-2; and severe wasting if Z-score <-3.
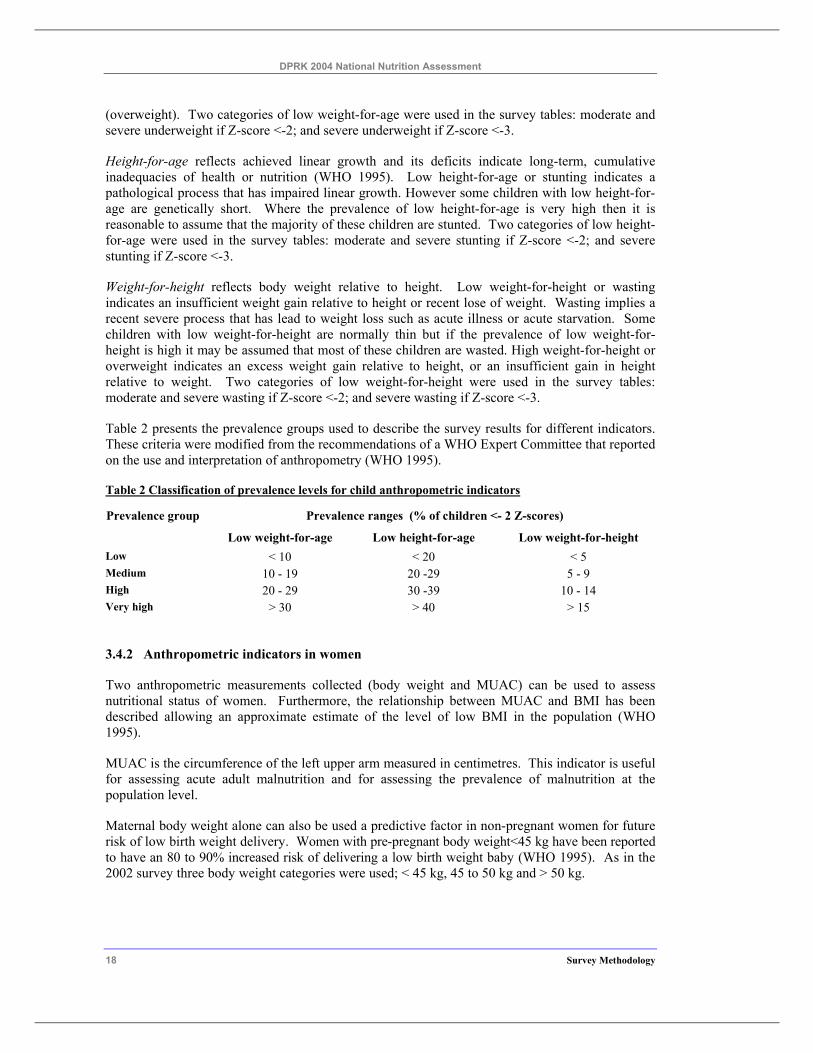
Table 2 presents the prevalence groups used to describe the survey results for different indicators. These criteria were modified from the recommendations of a WHO Expert Committee that reported on the use and interpretation of anthropometry (WHO 1995).
Table 2 Classification of prevalence levels for child anthropometric indicators
Prevalence group Prevalence ranges (% of children <- 2 Z-scores)
Low weight-for-age Low height-for-age Low weight-for-height Low < 10 < 20 < 5 Medium 10 - 19 20 -29 5 - 9 High 20 - 29 30 -39 10 - 14 Very high > 30 > 40 > 15
3.4.2 Anthropometric indicators in women
Two anthropometric measurements collected (body weight and MUAC) can be used to assess nutritional status of women. Furthermore, the relationship between MUAC and BMI has been described allowing an approximate estimate of the level of low BMI in the population (WHO 1995).
MUAC is the circumference of the left upper arm measured in centimetres. This indicator is useful for assessing acute adult malnutrition and for assessing the prevalence of malnutrition at the population level.
Maternal body weight alone can also be used a predictive factor in non-pregnant women for future risk of low birth weight delivery. Women with pre-pregnant body weight<45 kg have been reported to have an 80 to 90% increased risk of delivering a low birth weight baby (WHO 1995). As in the 2002 survey three body weight categories were used; < 45 kg, 45 to 50 kg and > 50 kg.
DPRK 2004 National Nutrition Assessment
Survey Methodology 19
3.4.3 Measurement of infant feeding practices
To measure infant feeding practices questions about the current feeding practices for children less than 24 months of age were asked of the mother in the survey. The current breastfeeding status of the infant was recorded as well as the consumption of a series of food items or groups such as water, fruit juice and rice soup in the 24 hours prior to interview. The use of bottle feeds was also specifically noted.
Definitions of breast feeding patterns: Standard indicators of breastfeeding patterns (WHO 1991) were used in the survey and were defined as follows.
Exclusive breastfeeding rate: The proportion of infants less than six months (180 days) of age who were only fed breast milk and no other fluids or solids.
Predominate breastfeeding rate: The proportion of infants less than six months (180 days) of age who were breastfeed but also received other fluids, excluding formula feeds, and no solids.
Timely complementary feeding rate: The proportion of infants six to nine months (180 - 299 days) of age who received solid foods and other fluids as well as breast milk in the 24 hours prior to interview.
Continued breastfeeding rate at 1 year: The proportion of children 12 to 15 months of age who were breastfed during the 24 hours prior to the interview.
Continued breastfeeding rate at 2 years: The proportion of children 20 to 23 months of age who were breast fed during the 24 hours prior to interview.
Bottle feeding rate: The proportion of infants less than 12 months of age who were bottle-fed during the 24 hours prior to interview.
3.5 Survey organisation
Three types of teams conducted the survey in each province: the logistics teams; the data collection teams; and the data entry and quality control teams. Each province was visited by two data collection teams from the central level, and each data collection team covered 10 clusters each and completed the data collection in 10 days, i.e. one cluster a day.
The provincial logistics teams were responsible for organising the basic support needed for the data collection teams during the time that they were in the province. This included contacting the local authorities in each cluster, briefing the community, and arranging accommodation as required. The provincial logistics team also identified the central location in each PSU where all the interviews and examinations were carried out.
The two data collection teams that came from the central level to each province/city comprised a Central bureau of Statistics staff member, an Institute of Child Nutrition staff member, an international UNICEF/WFP staff member, a national officer from UNICEF/WFP, and a UNICEF/WFP driver. The data collection teams identified the population sample and carried out the interviews and examinations1.
1 Ten survey teams had a permanent presence by international staff and six teams had random presence.
DPRK 2004 National Nutrition Assessment
20 Survey Methodology
The data entry and quality control teams came from provincial Statistics Office and included both a team leader for data quality checking and data entry clerks as necessary. Data entry was carried out the day after the questionnaires were collected in the field.
3.6 Training
Training of the survey team was conducted in two phases. In the first phase the project consultants conducted a training of trainers for six CBS staff and six ICN staff. This training took place over 2 days and covered the questionnaire, interviewing techniques, anthropometric measurements, how to standardise anthropometric measurements, haemoglobin examination, sample selection procedures in the field and approach to training survey team.
In the second phase the trainers conducted a three day training of the survey team. This training covered interviewing, anthropometry, haemoglobin examination, salt examination, data entry, field editing and form management. The survey was introduced on the first morning to all trainees. Then the trainees were divided into three groups; interviewers, anthropometrists and data entry staff. Each of these groups was provided with intensive training in the data collection for which they were responsible. Pre-tests of the questionnaires were also part of the training. The full team met again at the end to finalise logistics and work plans and to receive equipment. The training employed an active learning approach and stressed achieving the skills needed to successfully conduct the data collection.
3.7 Data processing
All forms were organised and packaged according to cluster and had a cluster control form was attached when questionnaires were dispatched to the data entry team or to the survey office in Pyongyang. This organisation of the forms was maintained for data entry and cleaning and for archiving of the forms. To facilitate field editing, checklists were prepared to guide the interviewers and field team leaders as to how to edit the forms. These daily checks aimed to detect missing values, range errors, invalid values, errors with skips and internal inconsistencies.
Epi Info version 6.04 was used for data entry and editing. Data entry screens were prepared with error checks for valid data ranges and skip patterns. Batch data error check programs were run once the data entry had been completed, and again once the data from the provinces was combined. Data entry was completed by two staff of the provincial CBS office and usually completed the day after the data was collected.
Also, at data entry, a special purpose program calculated anthropometric indices for children using the WHO international growth reference. After data cleaning and correcting the anthropometric measurements and the child’s age, these indices were recalculated. The data from the provinces was merged by staff of CBS in Pyongyang and further data cleaning completed based on an examination of distributions and checks for logical errors or improbable dates or values. The survey data was stored in a single file because only one record for each women and child was collected in sampled households.
3.8 Data analysis The data were analysed using SPSS version 13. For the estimates of child and maternal malnutrition 95% confidence intervals were calculated after adjustment for the sampling design using the standard methods used in SPPS. These confidence intervals were used to assess if differences between estimates were of statistically significant. If the confidence intervals between
DPRK 2004 National Nutrition Assessment
Survey Methodology 21
two estimates being compared did not overlap them the difference were assumed to be statistically significant.
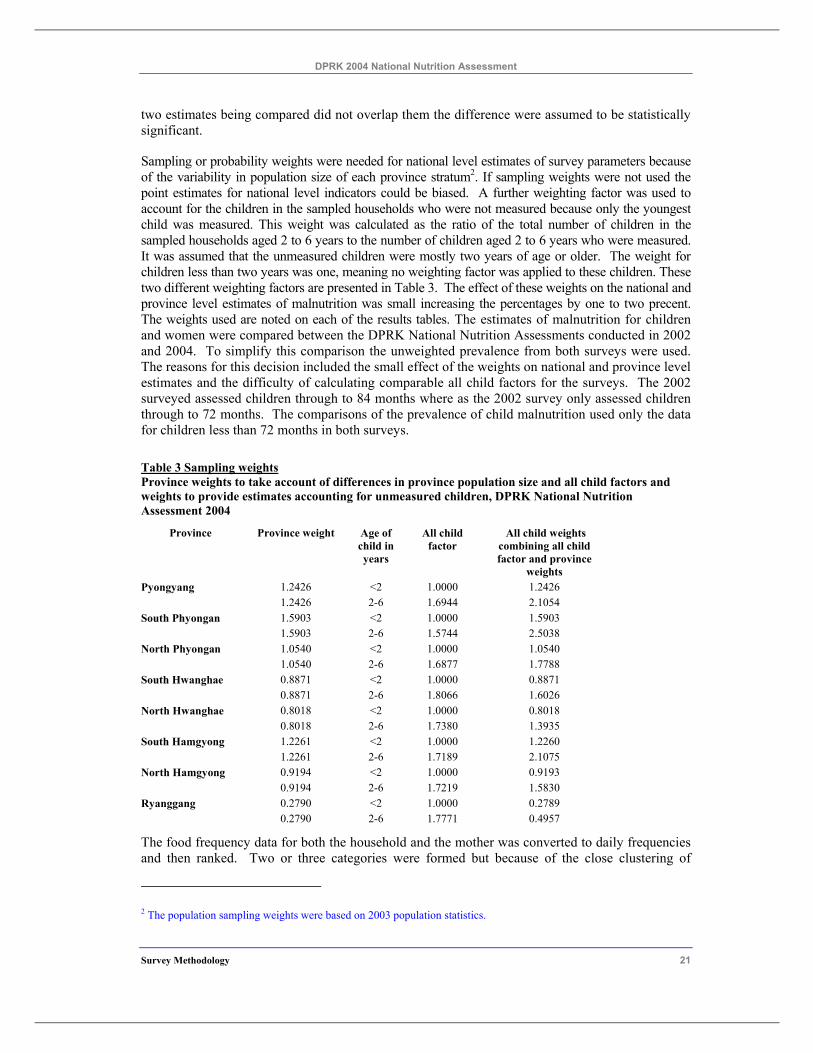
Sampling or probability weights were needed for national level estimates of survey parameters because of the variability in population size of each province stratum2. If sampling weights were not used the point estimates for national level indicators could be biased. A further weighting factor was used to account for the children in the sampled households who were not measured because only the youngest child was measured. This weight was calculated as the ratio of the total number of children in the sampled households aged 2 to 6 years to the number of children aged 2 to 6 years who were measured. It was assumed that the unmeasured children were mostly two years of age or older. The weight for children less than two years was one, meaning no weighting factor was applied to these children. These two different weighting factors are presented in Table 3. The effect of these weights on the national and province level estimates of malnutrition was small increasing the percentages by one to two precent. The weights used are noted on each of the results tables. The estimates of malnutrition for children and women were compared between the DPRK National Nutrition Assessments conducted in 2002 and 2004. To simplify this comparison the unweighted prevalence from both surveys were used. The reasons for this decision included the small effect of the weights on national and province level estimates and the difficulty of calculating comparable all child factors for the surveys. The 2002 surveyed assessed children through to 84 months where as the 2002 survey only assessed children through to 72 months. The comparisons of the prevalence of child malnutrition used only the data for children less than 72 months in both surveys.
Table 3 Sampling weights Province weights to take account of differences in province population size and all child factors and weights to provide estimates accounting for unmeasured children, DPRK National Nutrition Assessment 2004
Province Province weight Age of child in years
All child factor
All child weights combining all child factor and province
weights Pyongyang 1.2426 <2 1.0000 1.2426 1.2426 2-6 1.6944 2.1054 South Phyongan 1.5903 <2 1.0000 1.5903 1.5903 2-6 1.5744 2.5038 North Phyongan 1.0540 <2 1.0000 1.0540 1.0540 2-6 1.6877 1.7788 South Hwanghae 0.8871 <2 1.0000 0.8871 0.8871 2-6 1.8066 1.6026 North Hwanghae 0.8018 <2 1.0000 0.8018 0.8018 2-6 1.7380 1.3935 South Hamgyong 1.2261 <2 1.0000 1.2260 1.2261 2-6 1.7189 2.1075 North Hamgyong 0.9194 <2 1.0000 0.9193 0.9194 2-6 1.7219 1.5830 Ryanggang 0.2790 <2 1.0000 0.2789
0.2790 2-6 1.7771 0.4957
The food frequency data for both the household and the mother was converted to daily frequencies and then ranked. Two or three categories were formed but because of the close clustering of
2 The population sampling weights were based on 2003 population statistics.
DPRK 2004 National Nutrition Assessment
22 Survey Methodology
responses it was not always possible to form equal divisions of the data. When food frequency data was used in analyses of risk factors associated with child malnutrition the average intake described by each category was calculated and include as a footnote to the tables.
The graphs presented in the report were prepared in Excel based on SPSS output.
DPRK 2004 National Nutrition Assessment
Results 23
4 Results
4.1 Survey population
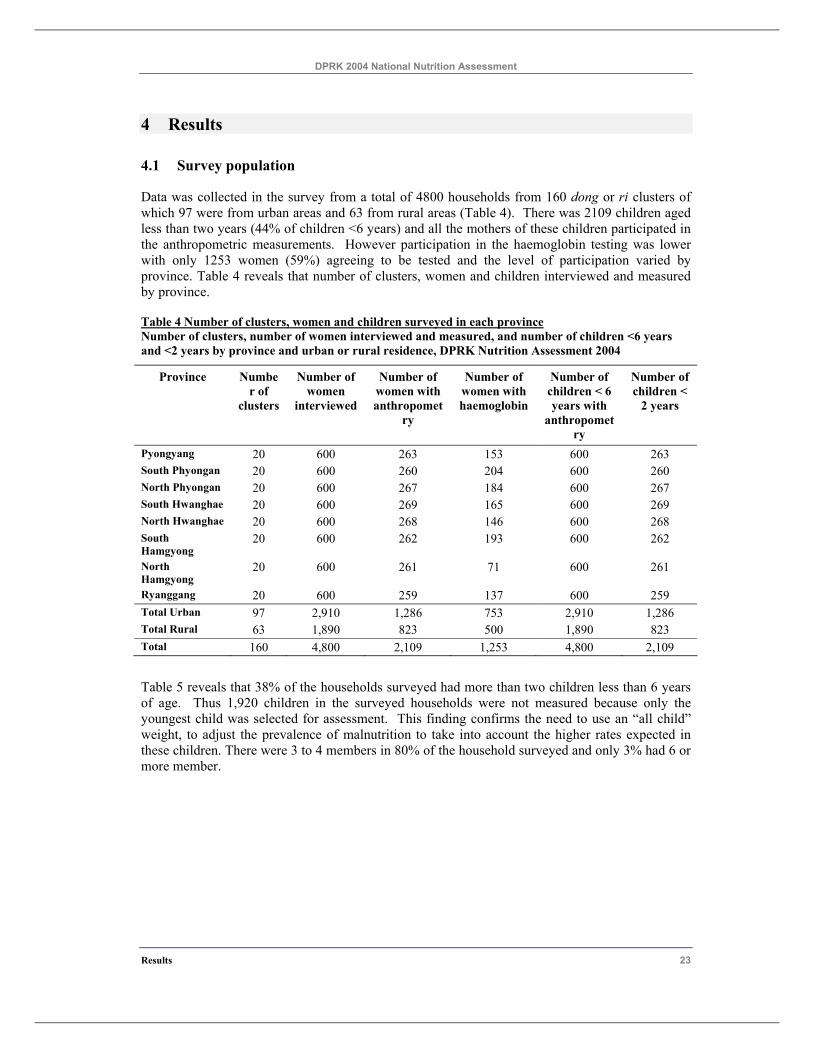
Data was collected in the survey from a total of 4800 households from 160 dong or ri clusters of which 97 were from urban areas and 63 from rural areas (Table 4). There was 2109 children aged less than two years (44% of children <6 years) and all the mothers of these children participated in the anthropometric measurements. However participation in the haemoglobin testing was lower with only 1253 women (59%) agreeing to be tested and the level of participation varied by province. Table 4 reveals that number of clusters, women and children interviewed and measured by province.
Table 4 Number of clusters, women and children surveyed in each province Number of clusters, number of women interviewed and measured, and number of children <6 years and <2 years by province and urban or rural residence, DPRK Nutrition Assessment 2004
Province Number of
clusters
Number of women
interviewed
Number of women with anthropomet
ry
Number of women with haemoglobin
Number of children < 6 years with
anthropometry
Number of children <
2 years
Pyongyang 20 600 263 153 600 263 South Phyongan 20 600 260 204 600 260 North Phyongan 20 600 267 184 600 267 South Hwanghae 20 600 269 165 600 269 North Hwanghae 20 600 268 146 600 268 South Hamgyong
20 600 262 193 600 262
North Hamgyong
20 600 261 71 600 261
Ryanggang 20 600 259 137 600 259 Total Urban 97 2,910 1,286 753 2,910 1,286 Total Rural 63 1,890 823 500 1,890 823 Total 160 4,800 2,109 1,253 4,800 2,109
Table 5 reveals that 38% of the households surveyed had more than two children less than 6 years of age. Thus 1,920 children in the surveyed households were not measured because only the youngest child was selected for assessment. This finding confirms the need to use an “all child” weight, to adjust the prevalence of malnutrition to take into account the higher rates expected in these children. There were 3 to 4 members in 80% of the household surveyed and only 3% had 6 or more member.
DPRK 2004 National Nutrition Assessment
24 Results
Table 5 Number of household members and children < 6 years Percentage distribution of number of household members and number of children < 6 years of age in surveyed households, DPRK Nutrition Assessment 2004
N Percentage Number of household members
3 1446 30.1 4 2394 49.9 5 799 16.6 6 143 3.0 7 17 0.4 8 1 0.0 Number of children < 6 years 1 2969 61.9 2 1742 36.3 3 89 1.9
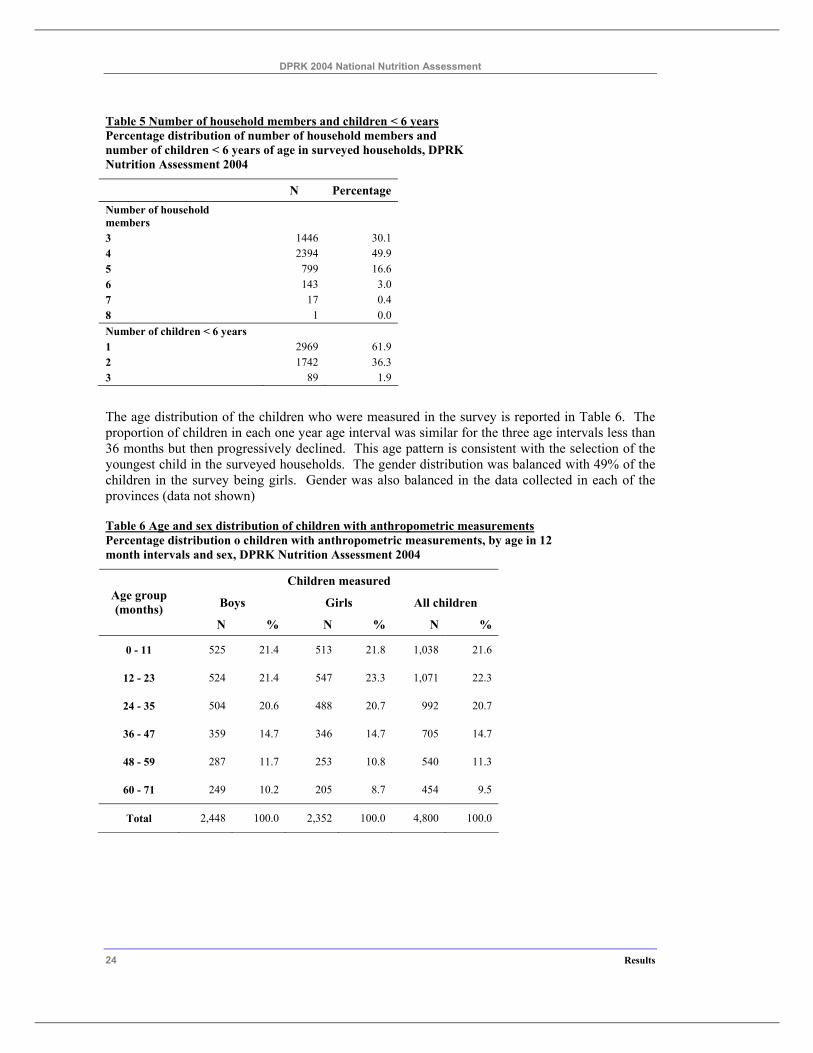
The age distribution of the children who were measured in the survey is reported in Table 6. The proportion of children in each one year age interval was similar for the three age intervals less than 36 months but then progressively declined. This age pattern is consistent with the selection of the youngest child in the surveyed households. The gender distribution was balanced with 49% of the children in the survey being girls. Gender was also balanced in the data collected in each of the provinces (data not shown)
Table 6 Age and sex distribution of children with anthropometric measurements Percentage distribution o children with anthropometric measurements, by age in 12 month intervals and sex, DPRK Nutrition Assessment 2004
Children measured
Boys Girls All children Age group (months)
N % N % N %
0 - 11 525 21.4 513 21.8 1,038 21.6
12 - 23 524 21.4 547 23.3 1,071 22.3
24 - 35 504 20.6 488 20.7 992 20.7
36 - 47 359 14.7 346 14.7 705 14.7
48 - 59 287 11.7 253 10.8 540 11.3
60 - 71 249 10.2 205 8.7 454 9.5
Total 2,448 100.0 2,352 100.0 4,800 100.0
DPRK 2004 National Nutrition Assessment
Results 25
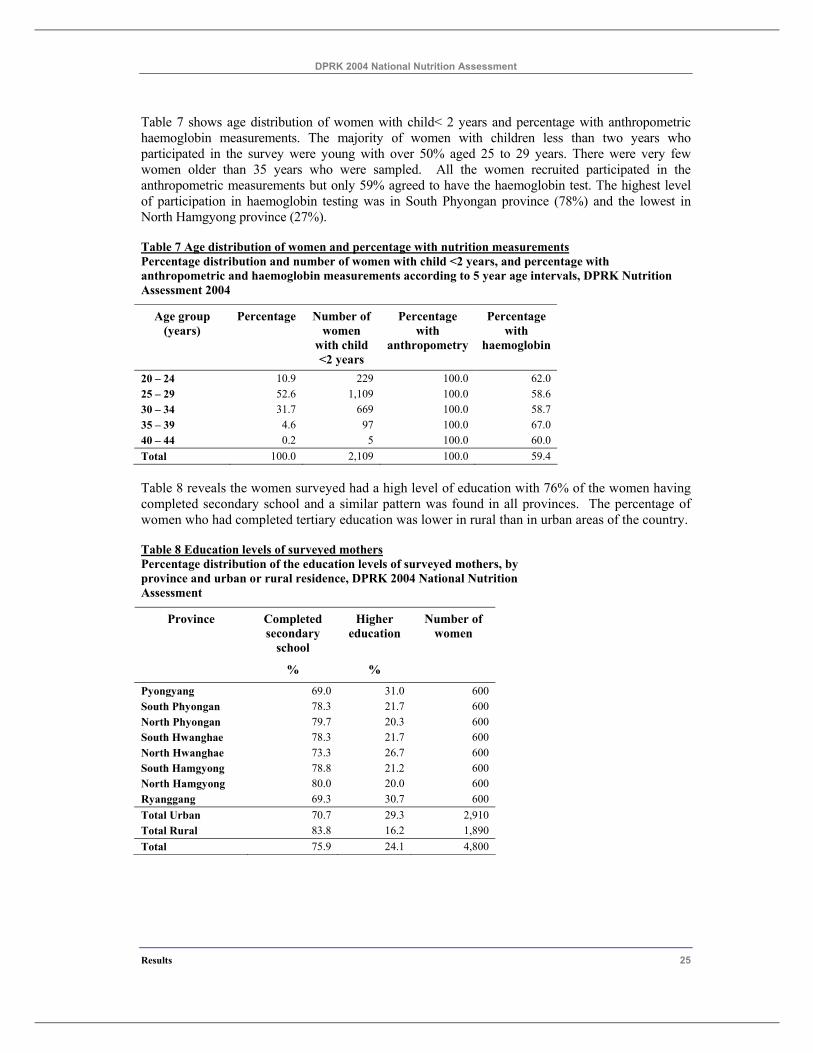
Table 7 shows age distribution of women with child< 2 years and percentage with anthropometric haemoglobin measurements. The majority of women with children less than two years who participated in the survey were young with over 50% aged 25 to 29 years. There were very few women older than 35 years who were sampled. All the women recruited participated in the anthropometric measurements but only 59% agreed to have the haemoglobin test. The highest level of participation in haemoglobin testing was in South Phyongan province (78%) and the lowest in North Hamgyong province (27%).
Table 7 Age distribution of women and percentage with nutrition measurements Percentage distribution and number of women with child <2 years, and percentage with anthropometric and haemoglobin measurements according to 5 year age intervals, DPRK Nutrition Assessment 2004
Age group (years)
Percentage Number of women
with child <2 years
Percentage with
anthropometry
Percentage with
haemoglobin
20 – 24 10.9 229 100.0 62.0 25 – 29 52.6 1,109 100.0 58.6 30 – 34 31.7 669 100.0 58.7 35 – 39 4.6 97 100.0 67.0 40 – 44 0.2 5 100.0 60.0 Total 100.0 2,109 100.0 59.4
Table 8 reveals the women surveyed had a high level of education with 76% of the women having completed secondary school and a similar pattern was found in all provinces. The percentage of women who had completed tertiary education was lower in rural than in urban areas of the country.
Table 8 Education levels of surveyed mothers Percentage distribution of the education levels of surveyed mothers, by province and urban or rural residence, DPRK 2004 National Nutrition Assessment
Completed secondary
school
Higher education
Number of women
Province
% %
Pyongyang 69.0 31.0 600 South Phyongan 78.3 21.7 600 North Phyongan 79.7 20.3 600 South Hwanghae 78.3 21.7 600 North Hwanghae 73.3 26.7 600 South Hamgyong 78.8 21.2 600 North Hamgyong 80.0 20.0 600 Ryanggang 69.3 30.7 600 Total Urban 70.7 29.3 2,910 Total Rural 83.8 16.2 1,890 Total 75.9 24.1 4,800
DPRK 2004 National Nutrition Assessment
26 Results
4.2 Assessment of data quality
4.2.1 Quality of age data
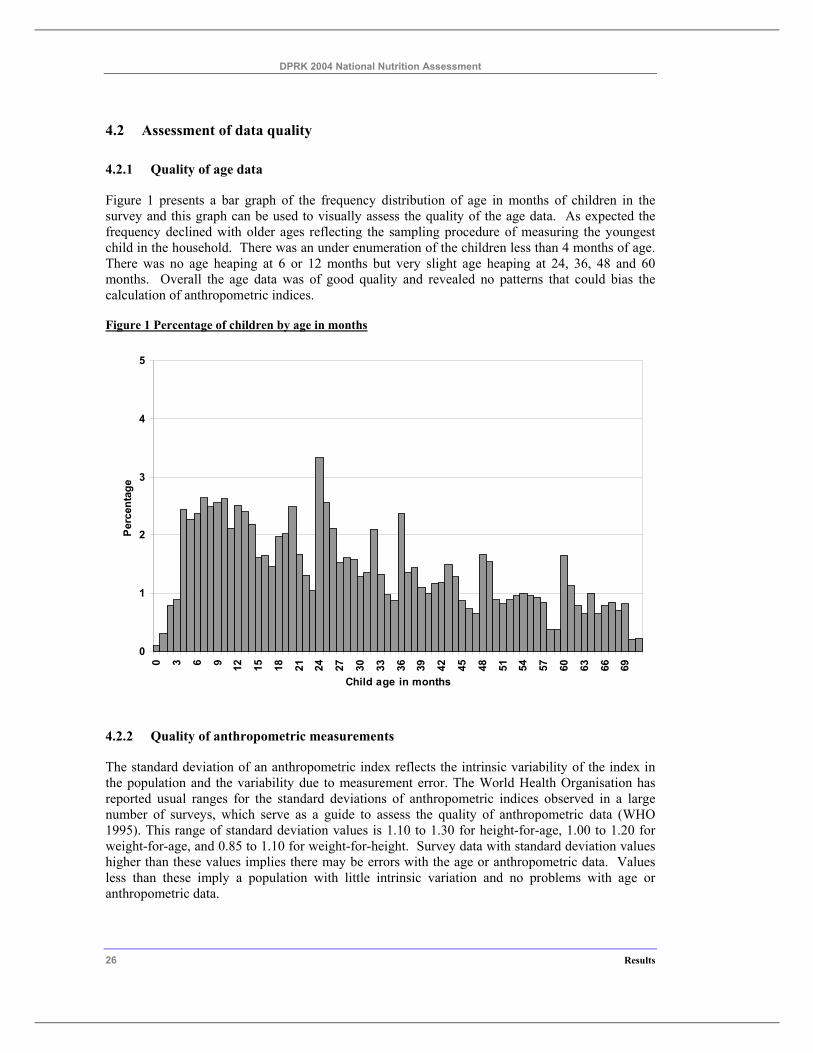
Figure 1 presents a bar graph of the frequency distribution of age in months of children in the survey and this graph can be used to visually assess the quality of the age data. As expected the frequency declined with older ages reflecting the sampling procedure of measuring the youngest child in the household. There was an under enumeration of the children less than 4 months of age. There was no age heaping at 6 or 12 months but very slight age heaping at 24, 36, 48 and 60 months. Overall the age data was of good quality and revealed no patterns that could bias the calculation of anthropometric indices.
Figure 1 Percentage of children by age in months
0
1
2
3
4
5
0 3 6 9 12 15 18 21 24 27 30 33 36 39 42 45 48 51 54 57 60 63 66 69
Child age in months
Per
cent
age
4.2.2 Quality of anthropometric measurements
The standard deviation of an anthropometric index reflects the intrinsic variability of the index in the population and the variability due to measurement error. The World Health Organisation has reported usual ranges for the standard deviations of anthropometric indices observed in a large number of surveys, which serve as a guide to assess the quality of anthropometric data (WHO 1995). This range of standard deviation values is 1.10 to 1.30 for height-for-age, 1.00 to 1.20 for weight-for-age, and 0.85 to 1.10 for weight-for-height. Survey data with standard deviation values higher than these values implies there may be errors with the age or anthropometric data. Values less than these imply a population with little intrinsic variation and no problems with age or anthropometric data.
DPRK 2004 National Nutrition Assessment
Results 27
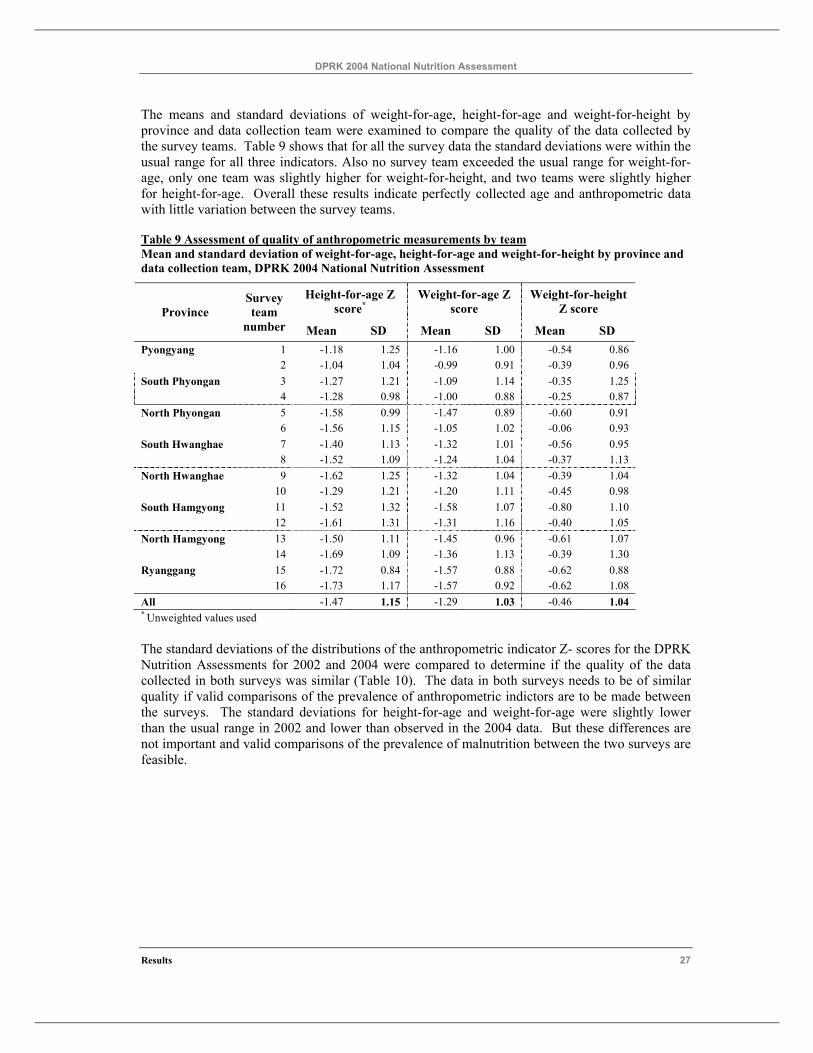
The means and standard deviations of weight-for-age, height-for-age and weight-for-height by province and data collection team were examined to compare the quality of the data collected by the survey teams. Table 9 shows that for all the survey data the standard deviations were within the usual range for all three indicators. Also no survey team exceeded the usual range for weight-for-age, only one team was slightly higher for weight-for-height, and two teams were slightly higher for height-for-age. Overall these results indicate perfectly collected age and anthropometric data with little variation between the survey teams.
Table 9 Assessment of quality of anthropometric measurements by team Mean and standard deviation of weight-for-age, height-for-age and weight-for-height by province and data collection team, DPRK 2004 National Nutrition Assessment
Height-for-age Z score*
Weight-for-age Z score
Weight-for-height Z score Province
Survey team
number Mean SD Mean SD Mean SD Pyongyang 1 -1.18 1.25 -1.16 1.00 -0.54 0.86 2 -1.04 1.04 -0.99 0.91 -0.39 0.96 South Phyongan 3 -1.27 1.21 -1.09 1.14 -0.35 1.25 4 -1.28 0.98 -1.00 0.88 -0.25 0.87 North Phyongan 5 -1.58 0.99 -1.47 0.89 -0.60 0.91 6 -1.56 1.15 -1.05 1.02 -0.06 0.93 South Hwanghae 7 -1.40 1.13 -1.32 1.01 -0.56 0.95 8 -1.52 1.09 -1.24 1.04 -0.37 1.13 North Hwanghae 9 -1.62 1.25 -1.32 1.04 -0.39 1.04 10 -1.29 1.21 -1.20 1.11 -0.45 0.98 South Hamgyong 11 -1.52 1.32 -1.58 1.07 -0.80 1.10 12 -1.61 1.31 -1.31 1.16 -0.40 1.05 North Hamgyong 13 -1.50 1.11 -1.45 0.96 -0.61 1.07 14 -1.69 1.09 -1.36 1.13 -0.39 1.30 Ryanggang 15 -1.72 0.84 -1.57 0.88 -0.62 0.88 16 -1.73 1.17 -1.57 0.92 -0.62 1.08 All -1.47 1.15 -1.29 1.03 -0.46 1.04 * Unweighted values used
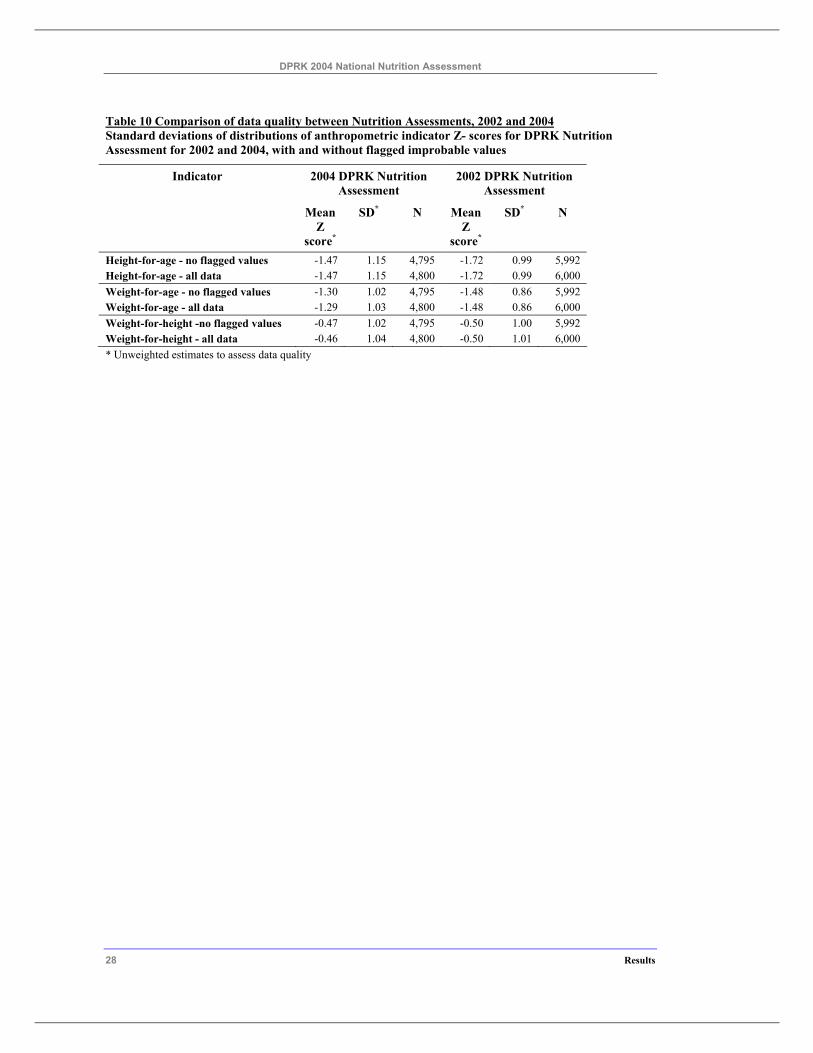
The standard deviations of the distributions of the anthropometric indicator Z- scores for the DPRK Nutrition Assessments for 2002 and 2004 were compared to determine if the quality of the data collected in both surveys was similar (Table 10). The data in both surveys needs to be of similar quality if valid comparisons of the prevalence of anthropometric indictors are to be made between the surveys. The standard deviations for height-for-age and weight-for-age were slightly lower than the usual range in 2002 and lower than observed in the 2004 data. But these differences are not important and valid comparisons of the prevalence of malnutrition between the two surveys are feasible.
DPRK 2004 National Nutrition Assessment
28 Results
Table 10 Comparison of data quality between Nutrition Assessments, 2002 and 2004 Standard deviations of distributions of anthropometric indicator Z- scores for DPRK Nutrition Assessment for 2002 and 2004, with and without flagged improbable values
Indicator 2004 DPRK Nutrition Assessment
2002 DPRK Nutrition Assessment
Mean Z
score*
SD* N Mean Z
score*
SD* N
Height-for-age - no flagged values -1.47 1.15 4,795 -1.72 0.99 5,992 Height-for-age - all data -1.47 1.15 4,800 -1.72 0.99 6,000 Weight-for-age - no flagged values -1.30 1.02 4,795 -1.48 0.86 5,992 Weight-for-age - all data -1.29 1.03 4,800 -1.48 0.86 6,000 Weight-for-height -no flagged values -0.47 1.02 4,795 -0.50 1.00 5,992 Weight-for-height - all data -0.46 1.04 4,800 -0.50 1.01 6,000 * Unweighted estimates to assess data quality
DPRK 2004 National Nutrition Assessment
Results 29
4.3 Child nutritional status
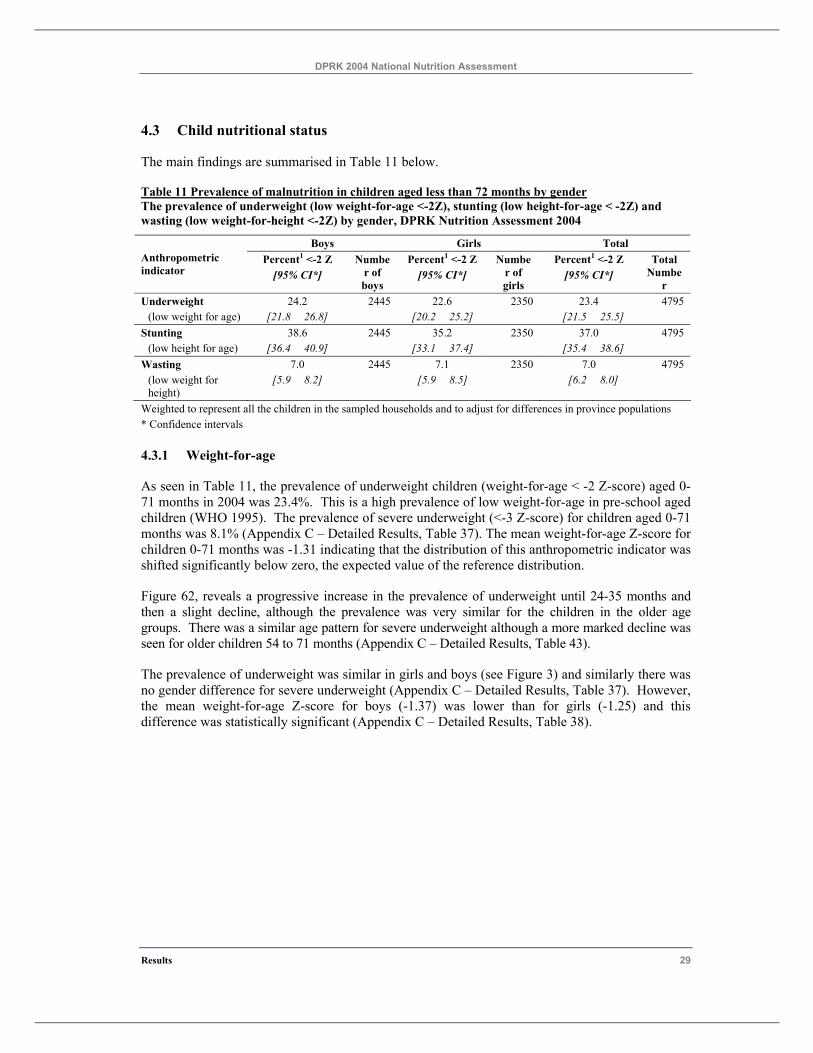
The main findings are summarised in Table 11 below.
Table 11 Prevalence of malnutrition in children aged less than 72 months by gender The prevalence of underweight (low weight-for-age <-2Z), stunting (low height-for-age < -2Z) and wasting (low weight-for-height <-2Z) by gender, DPRK Nutrition Assessment 2004
Boys Girls Total Percent1 <-2 Z Percent1 <-2 Z Percent1 <-2 Z Anthropometric
indicator [95% CI*] Numbe
r of boys
[95% CI*] Numbe
r of girls
[95% CI*] Total
Number
Underweight 24.2 2445 22.6 2350 23.4 4795 (low weight for age) [21.8 26.8] [20.2 25.2] [21.5 25.5]
Stunting 38.6 2445 35.2 2350 37.0 4795 (low height for age) [36.4 40.9] [33.1 37.4] [35.4 38.6]
Wasting 7.0 2445 7.1 2350 7.0 4795 (low weight for height)
[5.9 8.2] [5.9 8.5] [6.2 8.0]
Weighted to represent all the children in the sampled households and to adjust for differences in province populations * Confidence intervals
4.3.1 Weight-for-age
As seen in Table 11, the prevalence of underweight children (weight-for-age < -2 Z-score) aged 0-71 months in 2004 was 23.4%. This is a high prevalence of low weight-for-age in pre-school aged children (WHO 1995). The prevalence of severe underweight (<-3 Z-score) for children aged 0-71 months was 8.1% (Appendix C – Detailed Results, Table 37). The mean weight-for-age Z-score for children 0-71 months was -1.31 indicating that the distribution of this anthropometric indicator was shifted significantly below zero, the expected value of the reference distribution.
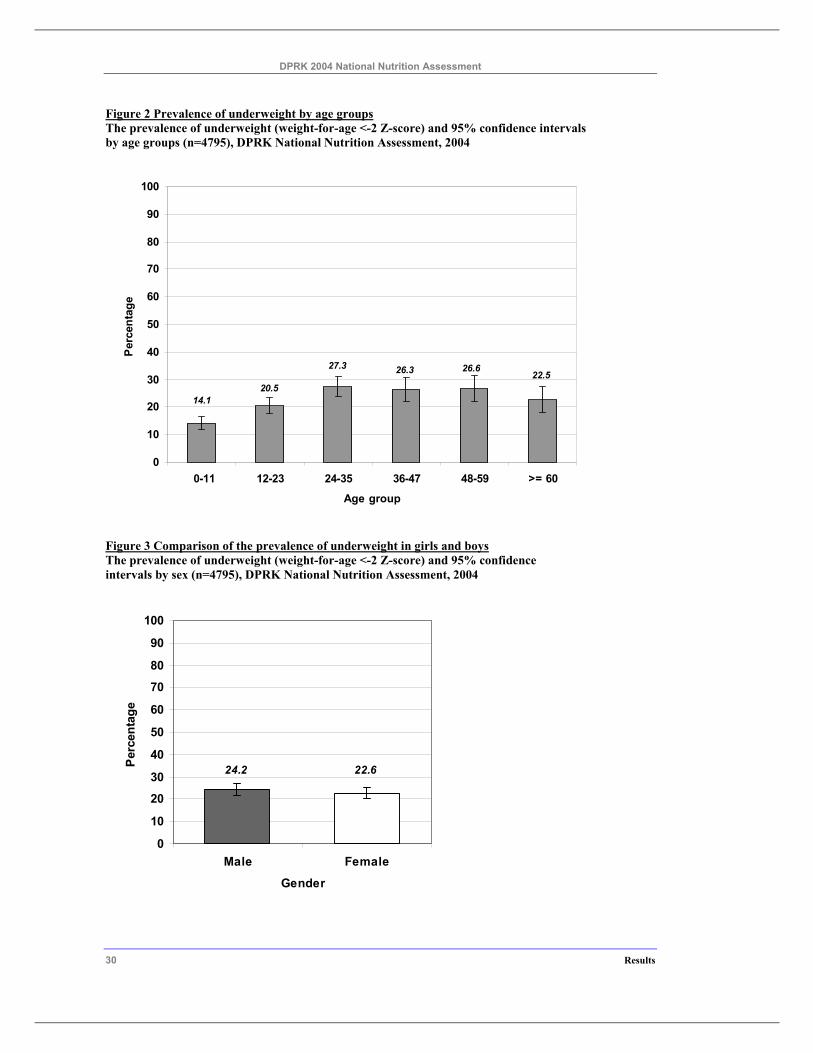
Figure 62, reveals a progressive increase in the prevalence of underweight until 24-35 months and then a slight decline, although the prevalence was very similar for the children in the older age groups. There was a similar age pattern for severe underweight although a more marked decline was seen for older children 54 to 71 months (Appendix C – Detailed Results, Table 43).
The prevalence of underweight was similar in girls and boys (see Figure 3) and similarly there was no gender difference for severe underweight (Appendix C – Detailed Results, Table 37). However, the mean weight-for-age Z-score for boys (-1.37) was lower than for girls (-1.25) and this difference was statistically significant (Appendix C – Detailed Results, Table 38).
DPRK 2004 National Nutrition Assessment
30 Results
Figure 2 Prevalence of underweight by age groups The prevalence of underweight (weight-for-age <-2 Z-score) and 95% confidence intervals by age groups (n=4795), DPRK National Nutrition Assessment, 2004
14.1
22.526.626.327.3
20.5
0
10
20
30
40
50
60
70
80
90
100
0-11 12-23 24-35 36-47 48-59 >= 60
Age group
Per
cent
age
Figure 3 Comparison of the prevalence of underweight in girls and boys The prevalence of underweight (weight-for-age <-2 Z-score) and 95% confidence intervals by sex (n=4795), DPRK National Nutrition Assessment, 2004
22.624.2
0
10
20
30
40
50
60
70
80
90
100
Male Female
Gender
Per
cent
age
DPRK 2004 National Nutrition Assessment
Results 31
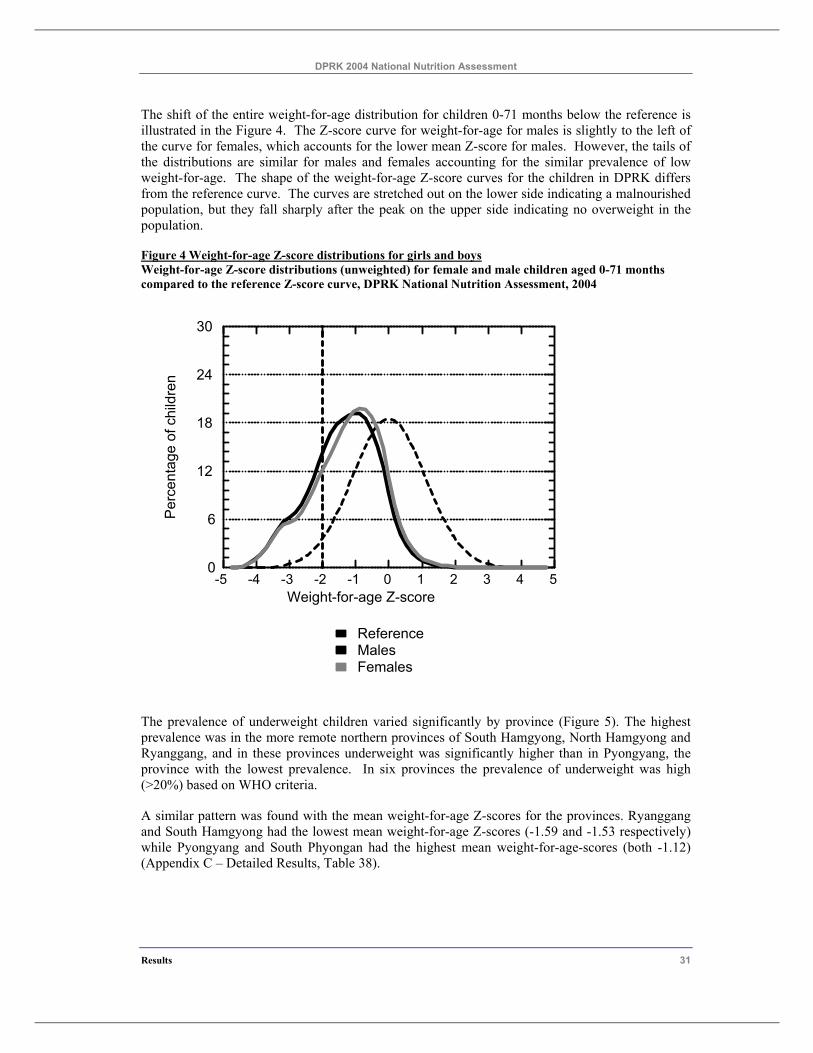
The shift of the entire weight-for-age distribution for children 0-71 months below the reference is illustrated in the Figure 4. The Z-score curve for weight-for-age for males is slightly to the left of the curve for females, which accounts for the lower mean Z-score for males. However, the tails of the distributions are similar for males and females accounting for the similar prevalence of low weight-for-age. The shape of the weight-for-age Z-score curves for the children in DPRK differs from the reference curve. The curves are stretched out on the lower side indicating a malnourished population, but they fall sharply after the peak on the upper side indicating no overweight in the population.
Figure 4 Weight-for-age Z-score distributions for girls and boys Weight-for-age Z-score distributions (unweighted) for female and male children aged 0-71 months compared to the reference Z-score curve, DPRK National Nutrition Assessment, 2004
-5 -4 -3 -2 -1 0 1 2 3 4 5Weight-for-age Z-score
0
6
12
18
24
30
Per
cent
a ge
of c
hild
ren
FemalesMalesReference
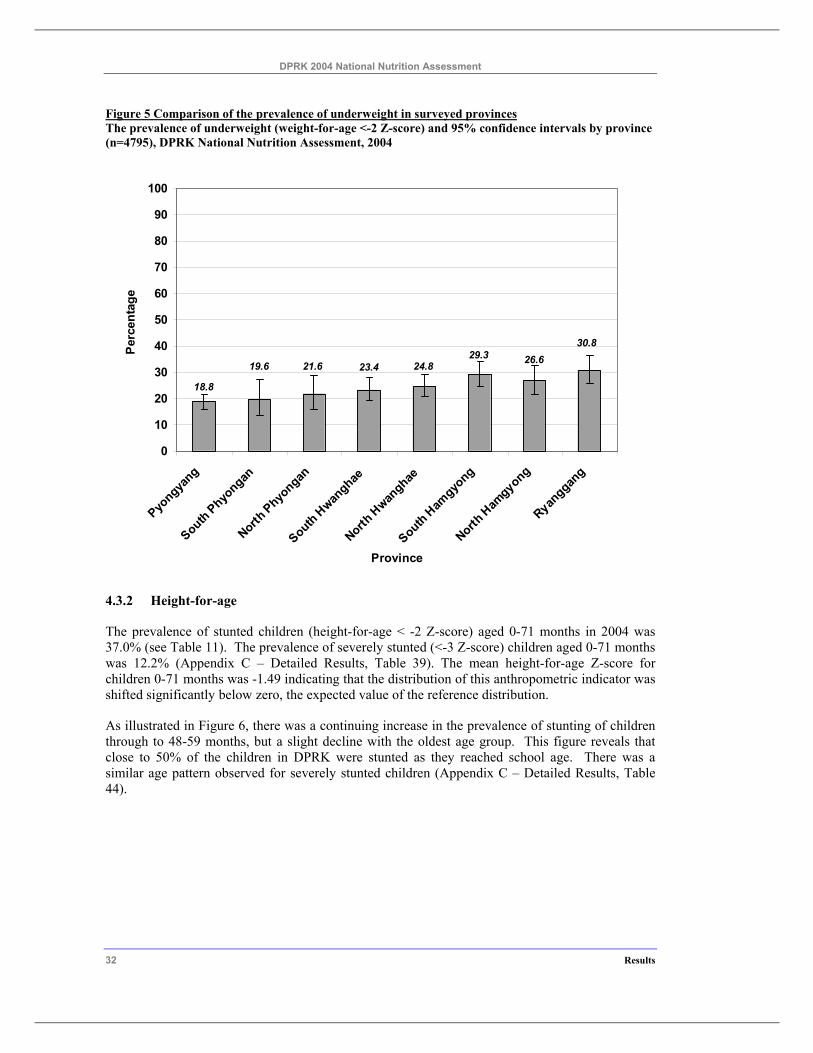
The prevalence of underweight children varied significantly by province (Figure 5). The highest prevalence was in the more remote northern provinces of South Hamgyong, North Hamgyong and Ryanggang, and in these provinces underweight was significantly higher than in Pyongyang, the province with the lowest prevalence. In six provinces the prevalence of underweight was high (>20%) based on WHO criteria.
A similar pattern was found with the mean weight-for-age Z-scores for the provinces. Ryanggang and South Hamgyong had the lowest mean weight-for-age Z-scores (-1.59 and -1.53 respectively) while Pyongyang and South Phyongan had the highest mean weight-for-age-scores (both -1.12) (Appendix C – Detailed Results, Table 38).
DPRK 2004 National Nutrition Assessment
32 Results
Figure 5 Comparison of the prevalence of underweight in surveyed provinces The prevalence of underweight (weight-for-age <-2 Z-score) and 95% confidence intervals by province (n=4795), DPRK National Nutrition Assessment, 2004
30.826.629.3
24.823.421.619.6
18.8
0
10
20
30
40
50
60
70
80
90
100
Pyongya
ng
South Phyongan
North Phyo
ngan
South Hwan
ghae
North H
wanghae
South Ham
gyong
North H
amgyong
Ryanggan
g
Province
Per
cent
age
4.3.2 Height-for-age
The prevalence of stunted children (height-for-age < -2 Z-score) aged 0-71 months in 2004 was 37.0% (see Table 11). The prevalence of severely stunted (<-3 Z-score) children aged 0-71 months was 12.2% (Appendix C – Detailed Results, Table 39). The mean height-for-age Z-score for children 0-71 months was -1.49 indicating that the distribution of this anthropometric indicator was shifted significantly below zero, the expected value of the reference distribution.
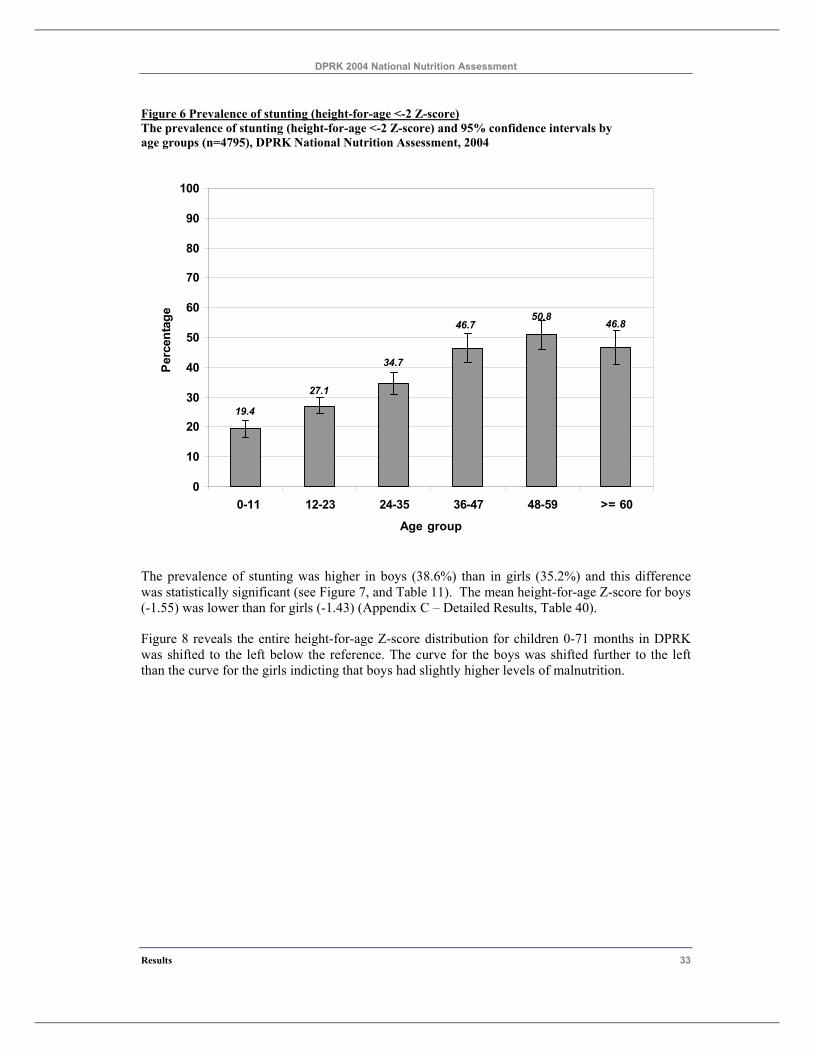
As illustrated in Figure 6, there was a continuing increase in the prevalence of stunting of children through to 48-59 months, but a slight decline with the oldest age group. This figure reveals that close to 50% of the children in DPRK were stunted as they reached school age. There was a similar age pattern observed for severely stunted children (Appendix C – Detailed Results, Table 44).
DPRK 2004 National Nutrition Assessment
Results 33
Figure 6 Prevalence of stunting (height-for-age <-2 Z-score) The prevalence of stunting (height-for-age <-2 Z-score) and 95% confidence intervals by age groups (n=4795), DPRK National Nutrition Assessment, 2004
46.850.8
46.7
34.7
27.1
19.4
0
10
20
30
40
50
60
70
80
90
100
0-11 12-23 24-35 36-47 48-59 >= 60
Age group
Perc
enta
ge
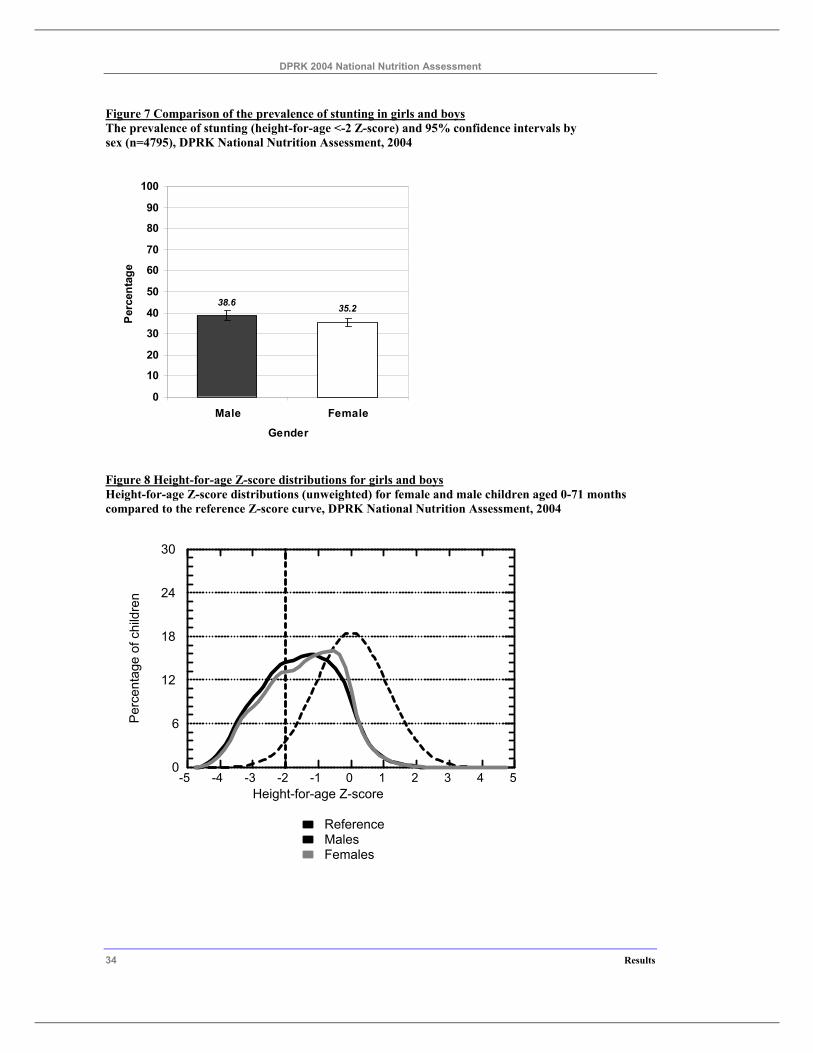
The prevalence of stunting was higher in boys (38.6%) than in girls (35.2%) and this difference was statistically significant (see Figure 7, and Table 11). The mean height-for-age Z-score for boys (-1.55) was lower than for girls (-1.43) (Appendix C – Detailed Results, Table 40).
Figure 8 reveals the entire height-for-age Z-score distribution for children 0-71 months in DPRK was shifted to the left below the reference. The curve for the boys was shifted further to the left than the curve for the girls indicting that boys had slightly higher levels of malnutrition.
DPRK 2004 National Nutrition Assessment
34 Results
Figure 7 Comparison of the prevalence of stunting in girls and boys The prevalence of stunting (height-for-age <-2 Z-score) and 95% confidence intervals by sex (n=4795), DPRK National Nutrition Assessment, 2004
38.6 35.2
0
10
20
30
40
50
60
70
80
90
100
Male Female
Gender
Per
cent
age
Figure 8 Height-for-age Z-score distributions for girls and boys Height-for-age Z-score distributions (unweighted) for female and male children aged 0-71 months compared to the reference Z-score curve, DPRK National Nutrition Assessment, 2004
-5 -4 -3 -2 -1 0 1 2 3 4 5Height-for-age Z-score
0
6
12
18
24
30
Per
cent
age
of c
hild
r en
FemalesMalesReference
DPRK 2004 National Nutrition Assessment
Results 35
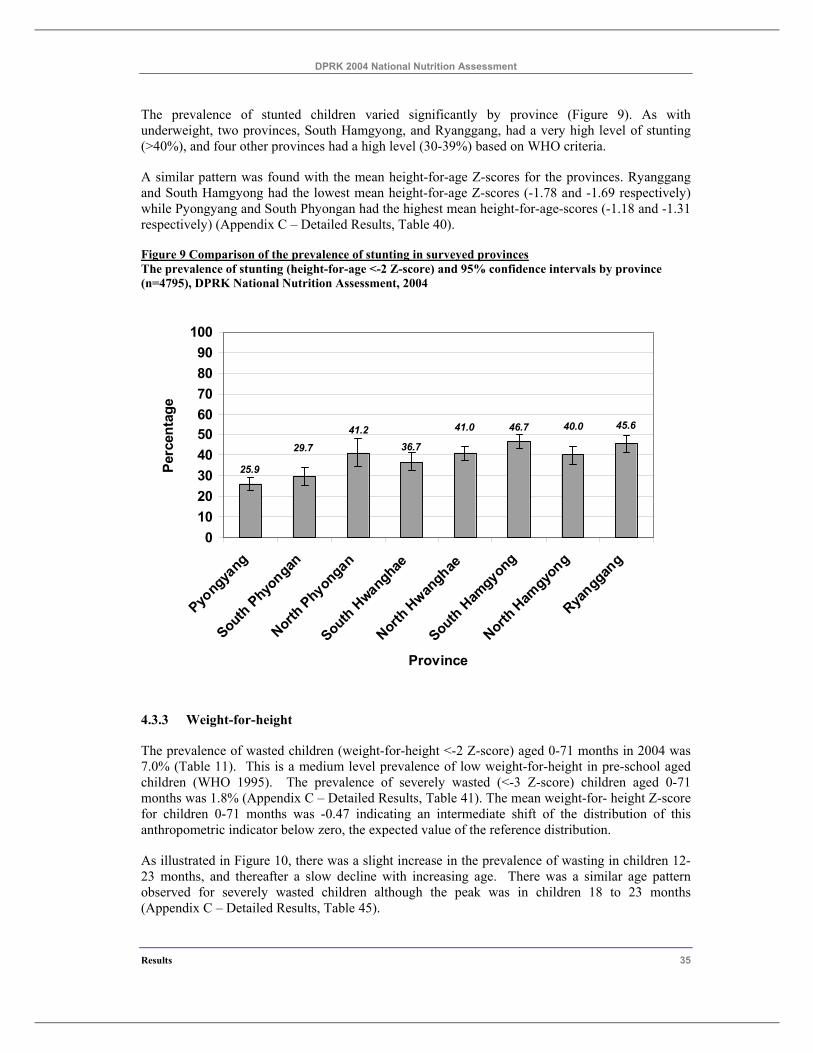
The prevalence of stunted children varied significantly by province (Figure 9). As with underweight, two provinces, South Hamgyong, and Ryanggang, had a very high level of stunting (>40%), and four other provinces had a high level (30-39%) based on WHO criteria.
A similar pattern was found with the mean height-for-age Z-scores for the provinces. Ryanggang and South Hamgyong had the lowest mean height-for-age Z-scores (-1.78 and -1.69 respectively) while Pyongyang and South Phyongan had the highest mean height-for-age-scores (-1.18 and -1.31 respectively) (Appendix C – Detailed Results, Table 40).
Figure 9 Comparison of the prevalence of stunting in surveyed provinces The prevalence of stunting (height-for-age <-2 Z-score) and 95% confidence intervals by province (n=4795), DPRK National Nutrition Assessment, 2004
25.9
29.7
45.640.046.741.0
36.741.2
0102030405060708090
100
Pyongya
ng
South Phyo
ngan
North Phyongan
South H
wanghae
North H
wanghae
South H
amgyong
North H
amgyo
ng
Ryanggan
g
Province
Perc
enta
ge
4.3.3 Weight-for-height
The prevalence of wasted children (weight-for-height <-2 Z-score) aged 0-71 months in 2004 was 7.0% (Table 11). This is a medium level prevalence of low weight-for-height in pre-school aged children (WHO 1995). The prevalence of severely wasted (<-3 Z-score) children aged 0-71 months was 1.8% (Appendix C – Detailed Results, Table 41). The mean weight-for- height Z-score for children 0-71 months was -0.47 indicating an intermediate shift of the distribution of this anthropometric indicator below zero, the expected value of the reference distribution.
As illustrated in Figure 10, there was a slight increase in the prevalence of wasting in children 12-23 months, and thereafter a slow decline with increasing age. There was a similar age pattern observed for severely wasted children although the peak was in children 18 to 23 months (Appendix C – Detailed Results, Table 45).
DPRK 2004 National Nutrition Assessment
36 Results
Figure 10 Prevalence of wasting by age groups The prevalence of wasting (weight-for-height <-2 Z-score) and 95% confidence intervals by age groups (n=4795), DPRK National Nutrition Assessment, 2004
5.36.27.57.38.76.0
0
10
20
30
40
50
60
70
80
90
100
0-11 12-23 24-35 36-47 48-59 >= 60
Age group
Per
cent
age
The prevalence of wasting was similar in girls and boys(see Figure 11, and Table 11). Also there were no gender differences in the prevalence of severe wasting (Appendix C – Detailed Results, Table 41). However, the mean weight-for-height Z-score for boys (-0.52) was lower than for girls (-0.42) and this difference was borderline statistically significant (Appendix C – Detailed Results, Table 42).
Figure12 reveals that the entire weight-for-height Z-score distribution for children 0-71 months in DPRK was shifted to the left below the reference indicating more wasting in the study population than in the reference. The weight-for-height Z-score curves have a very high narrow peak. The curve is spread out to the left also indicating the presence of acute malnutrition in the population and it falls sharply after the peak on the right side indicating there are virtually no overweight children in the population
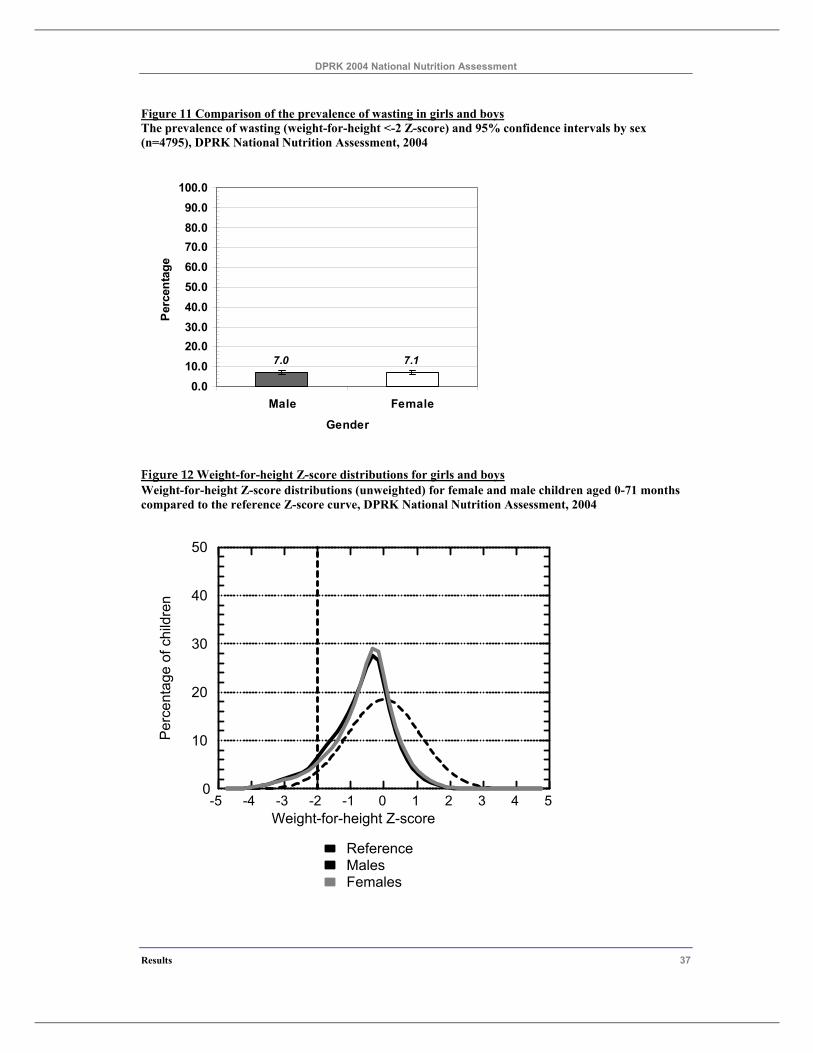
DPRK 2004 National Nutrition Assessment
Results 37
Figure 11 Comparison of the prevalence of wasting in girls and boys The prevalence of wasting (weight-for-height <-2 Z-score) and 95% confidence intervals by sex (n=4795), DPRK National Nutrition Assessment, 2004
7.0 7.1
0.010.020.030.040.050.060.070.080.090.0
100.0
Male Female
Gender
Per
cent
age
Figure 12 Weight-for-height Z-score distributions for girls and boys Weight-for-height Z-score distributions (unweighted) for female and male children aged 0-71 months compared to the reference Z-score curve, DPRK National Nutrition Assessment, 2004
-5 -4 -3 -2 -1 0 1 2 3 4 5Weight-for-height Z-score
0
10
20
30
40
50
Perc
enta
ge o
f chi
ldre
n
FemalesMalesReference
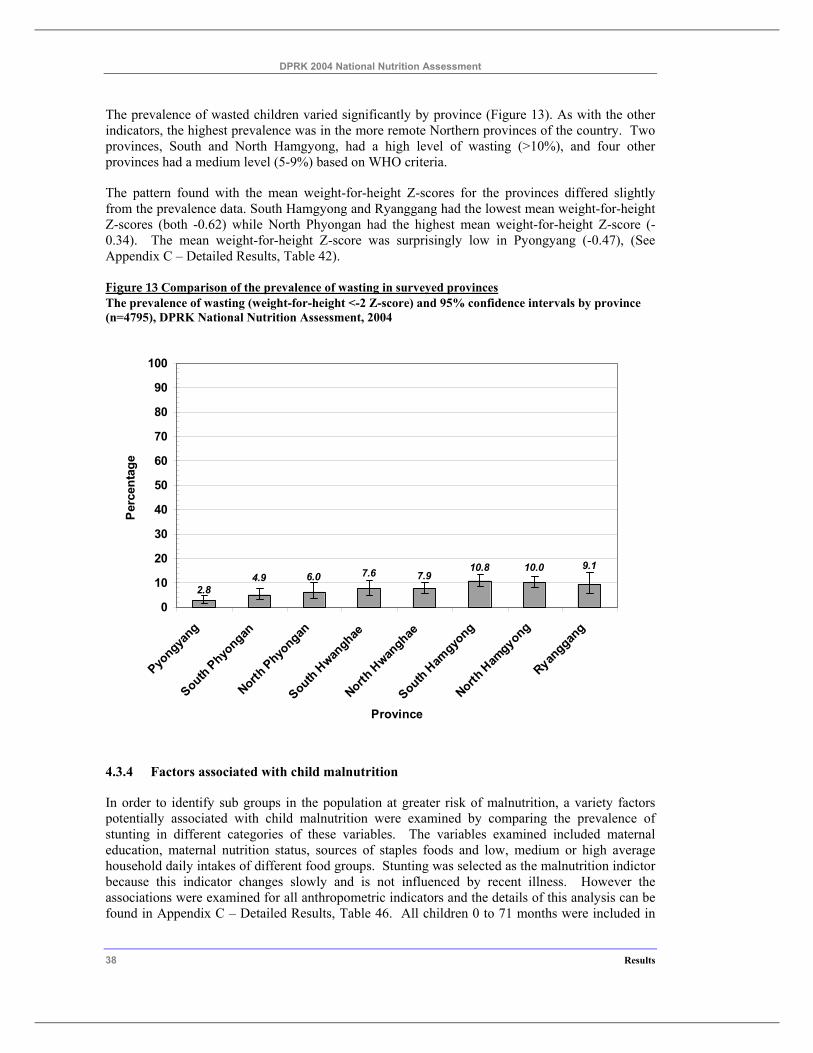
DPRK 2004 National Nutrition Assessment
38 Results
The prevalence of wasted children varied significantly by province (Figure 13). As with the other indicators, the highest prevalence was in the more remote Northern provinces of the country. Two provinces, South and North Hamgyong, had a high level of wasting (>10%), and four other provinces had a medium level (5-9%) based on WHO criteria.
The pattern found with the mean weight-for-height Z-scores for the provinces differed slightly from the prevalence data. South Hamgyong and Ryanggang had the lowest mean weight-for-height Z-scores (both -0.62) while North Phyongan had the highest mean weight-for-height Z-score (-0.34). The mean weight-for-height Z-score was surprisingly low in Pyongyang (-0.47), (See Appendix C – Detailed Results, Table 42).
Figure 13 Comparison of the prevalence of wasting in surveyed provinces The prevalence of wasting (weight-for-height <-2 Z-score) and 95% confidence intervals by province (n=4795), DPRK National Nutrition Assessment, 2004
2.8
9.110.010.87.97.66.04.9
0
10
20
30
40
50
60
70
80
90
100
Pyongya
ng
South Phyongan
North Phyo
ngan
South Hwan
ghae
North H
wanghae
South Ham
gyong
North H
amgyong
Ryanggan
g
Province
Per
cent
age
4.3.4 Factors associated with child malnutrition
In order to identify sub groups in the population at greater risk of malnutrition, a variety factors potentially associated with child malnutrition were examined by comparing the prevalence of stunting in different categories of these variables. The variables examined included maternal education, maternal nutrition status, sources of staples foods and low, medium or high average household daily intakes of different food groups. Stunting was selected as the malnutrition indictor because this indicator changes slowly and is not influenced by recent illness. However the associations were examined for all anthropometric indicators and the details of this analysis can be found in Appendix C – Detailed Results, Table 46. All children 0 to 71 months were included in
DPRK 2004 National Nutrition Assessment
Results 39
these analyses, except where the factors examined were only measured for children less than 24 months.
Maternal malnutrition was associated with an increased prevalence of child low height-for-age. The prevalence of stunting was 22% higher in the children of malnourished mothers, although this difference was not statistically significant; there was a statistically significant association between mean height-for-age and maternal malnutrition (see Appendix C – Detailed Results, Table 46). In addition, low weight-for-age was associated with maternal malnutrition and the prevalence of underweight was 43% higher in malnourished mothers (see Appendix C – Detailed Results, Table 46).
In the DPRK 2004 National Nutrition Assessment mothers were asked to report on the perceived size of their child at birth. This data was collected for all children less than 24 months and has been used to provide insight into the possible role of low birth weight in childhood malnutrition. The prevalence of stunting increased by 62% as reported perceived birth size decreased from 19.0% in children who were very large at birth to 30.7% in children who were perceived to be very small at birth. This finding suggests an important role of low birth weight in early childhood malnutrition.
In the DPRK 2004 National Nutrition Assessment the mothers were asked to report the usual frequency of household consumption of 14 different food groups over the six months prior to the survey. These frequencies of consumption for each food group were expressed as average daily household frequencies of consumption, ranked in order and divided into three equal groups from the lowest to the highest frequencies. The results for all food groups and anthropometric indicators are presented in Appendix C – Detailed Results, Table 46. Below is a selection of these analyses for those food groups that were significantly associated with childhood stunting.
The usual frequency of household consumption of rice and rice products was associated with childhood malnutrition. Figure 14 reveals the prevalence of stunting in children from those households with the lowest intake was higher than children from households with the highest intake. This difference was statistically significant (i.e. it did not occur by chance). The usual frequency of household consumption of rice was also statistically significantly associated with mean height for age (see Appendix C – Detailed Results, Table 46).
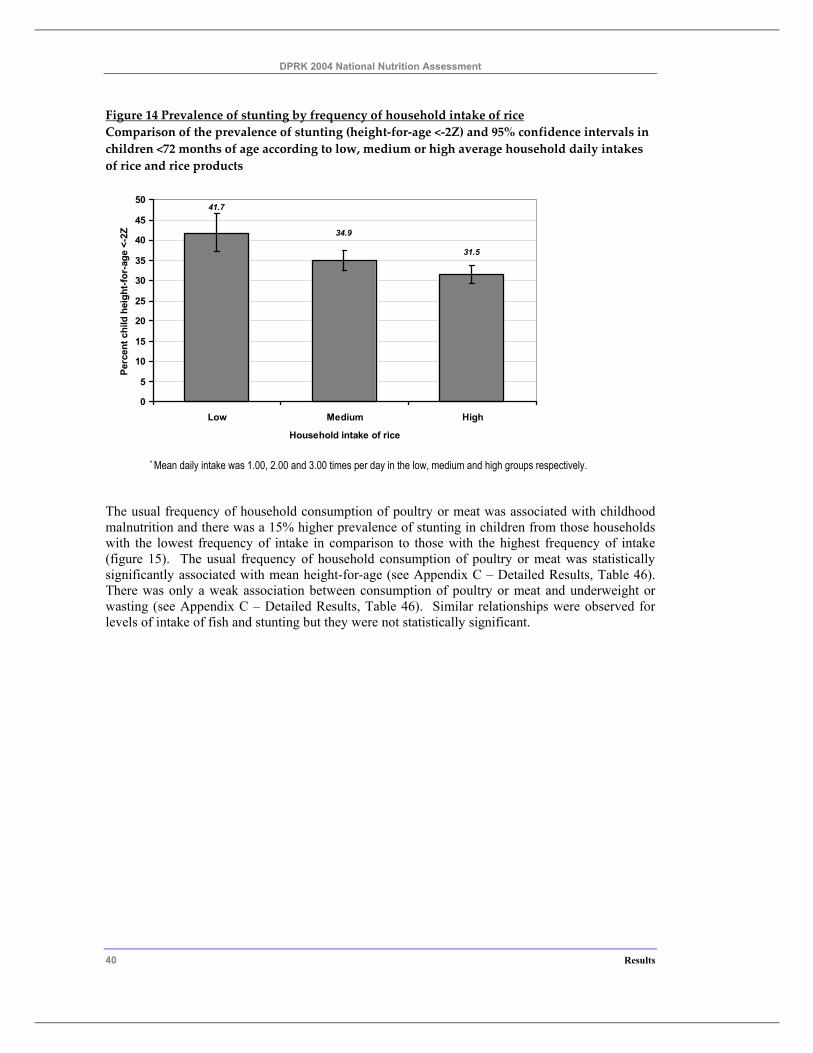
DPRK 2004 National Nutrition Assessment
40 Results
Figure 14 Prevalence of stunting by frequency of household intake of rice Comparison of the prevalence of stunting (height-for-age <-2Z) and 95% confidence intervals in children <72 months of age according to low, medium or high average household daily intakes of rice and rice products
41.7
34.9
31.5
0
5
10
15
20
25
30
35
40
45
50
Low Medium High
Household intake of rice
Perc
ent c
hild
hei
ght-f
or-a
ge <
-2Z
* Mean daily intake was 1.00, 2.00 and 3.00 times per day in the low, medium and high groups respectively.
The usual frequency of household consumption of poultry or meat was associated with childhood malnutrition and there was a 15% higher prevalence of stunting in children from those households with the lowest frequency of intake in comparison to those with the highest frequency of intake (figure 15). The usual frequency of household consumption of poultry or meat was statistically significantly associated with mean height-for-age (see Appendix C – Detailed Results, Table 46). There was only a weak association between consumption of poultry or meat and underweight or wasting (see Appendix C – Detailed Results, Table 46). Similar relationships were observed for levels of intake of fish and stunting but they were not statistically significant.
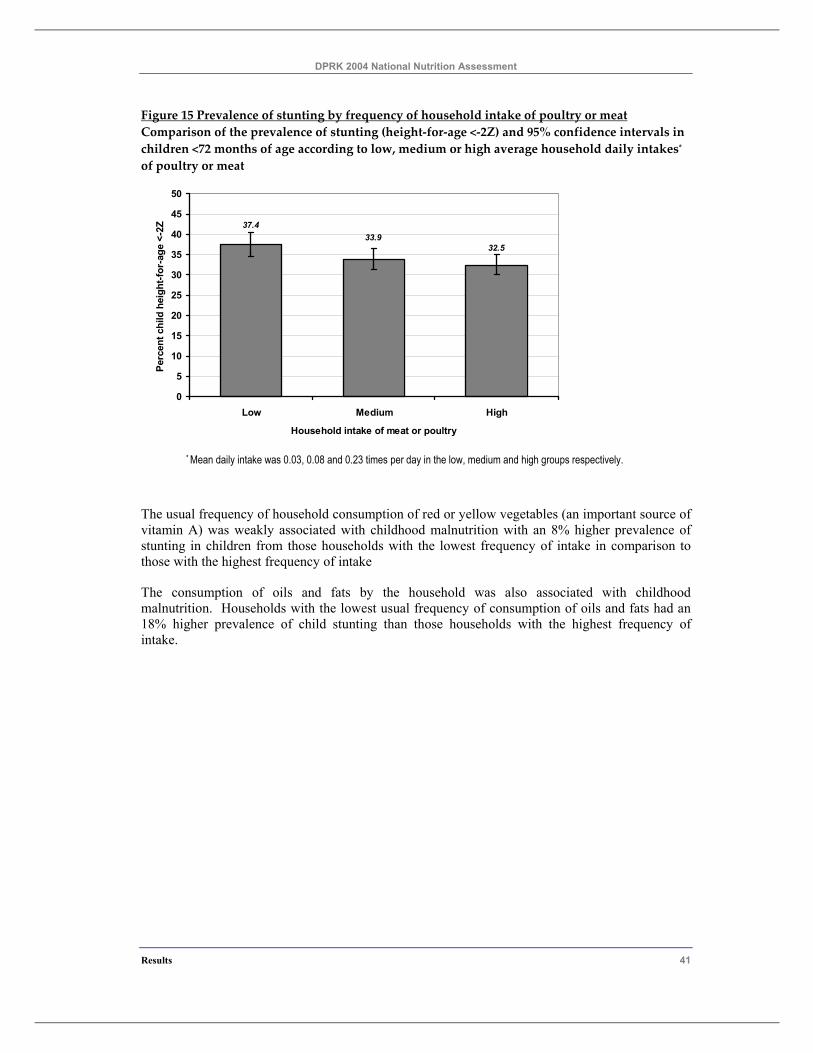
DPRK 2004 National Nutrition Assessment
Results 41
Figure 15 Prevalence of stunting by frequency of household intake of poultry or meat Comparison of the prevalence of stunting (height-for-age <-2Z) and 95% confidence intervals in children <72 months of age according to low, medium or high average household daily intakes* of poultry or meat
32.533.9
37.4
0
5
10
15
20
25
30
35
40
45
50
Low Medium High
Household intake of meat or poultry
Perc
ent c
hild
hei
ght-f
or-a
ge <
-2Z
* Mean daily intake was 0.03, 0.08 and 0.23 times per day in the low, medium and high groups respectively.
The usual frequency of household consumption of red or yellow vegetables (an important source of vitamin A) was weakly associated with childhood malnutrition with an 8% higher prevalence of stunting in children from those households with the lowest frequency of intake in comparison to those with the highest frequency of intake
The consumption of oils and fats by the household was also associated with childhood malnutrition. Households with the lowest usual frequency of consumption of oils and fats had an 18% higher prevalence of child stunting than those households with the highest frequency of intake.
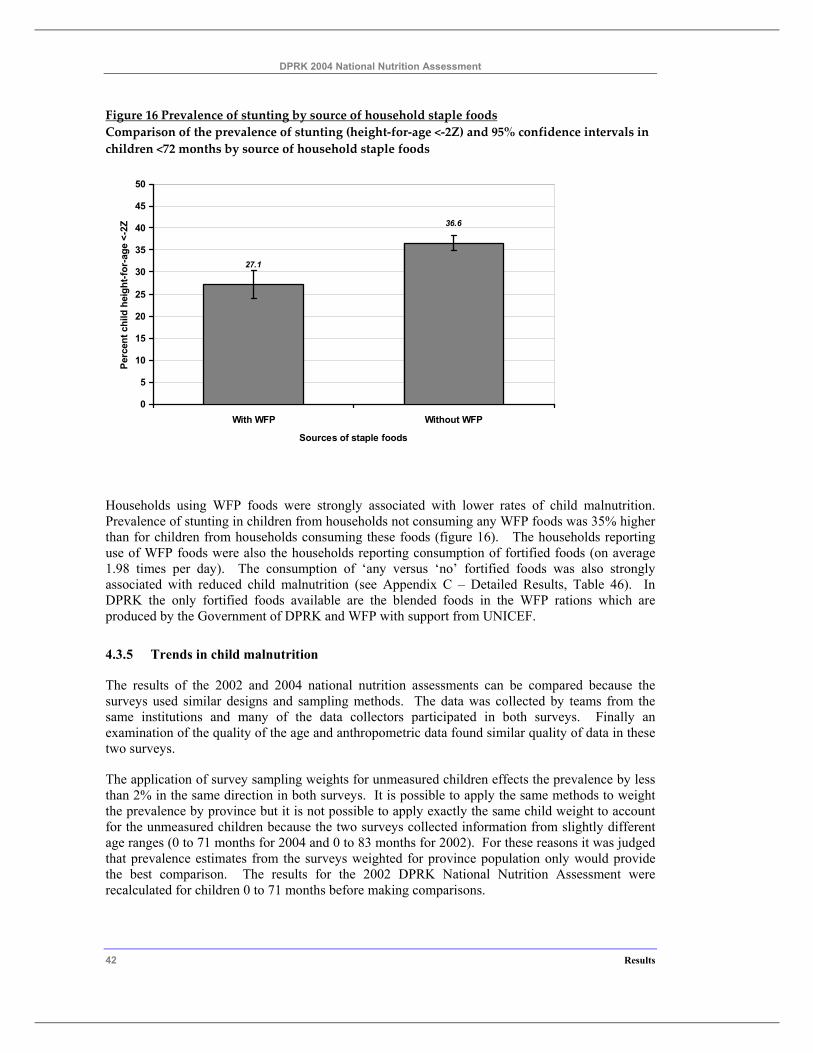
DPRK 2004 National Nutrition Assessment
42 Results
Figure 16 Prevalence of stunting by source of household staple foods Comparison of the prevalence of stunting (height-for-age <-2Z) and 95% confidence intervals in children <72 months by source of household staple foods
36.6
27.1
0
5
10
15
20
25
30
35
40
45
50
With WFP Without WFP
Sources of staple foods
Perc
ent c
hild
hei
ght-f
or-a
ge <
-2Z
Households using WFP foods were strongly associated with lower rates of child malnutrition. Prevalence of stunting in children from households not consuming any WFP foods was 35% higher than for children from households consuming these foods (figure 16). The households reporting use of WFP foods were also the households reporting consumption of fortified foods (on average 1.98 times per day). The consumption of ‘any versus ‘no’ fortified foods was also strongly associated with reduced child malnutrition (see Appendix C – Detailed Results, Table 46). In DPRK the only fortified foods available are the blended foods in the WFP rations which are produced by the Government of DPRK and WFP with support from UNICEF.
4.3.5 Trends in child malnutrition
The results of the 2002 and 2004 national nutrition assessments can be compared because the surveys used similar designs and sampling methods. The data was collected by teams from the same institutions and many of the data collectors participated in both surveys. Finally an examination of the quality of the age and anthropometric data found similar quality of data in these two surveys.
The application of survey sampling weights for unmeasured children effects the prevalence by less than 2% in the same direction in both surveys. It is possible to apply the same methods to weight the prevalence by province but it is not possible to apply exactly the same child weight to account for the unmeasured children because the two surveys collected information from slightly different age ranges (0 to 71 months for 2004 and 0 to 83 months for 2002). For these reasons it was judged that prevalence estimates from the surveys weighted for province population only would provide the best comparison. The results for the 2002 DPRK National Nutrition Assessment were recalculated for children 0 to 71 months before making comparisons.
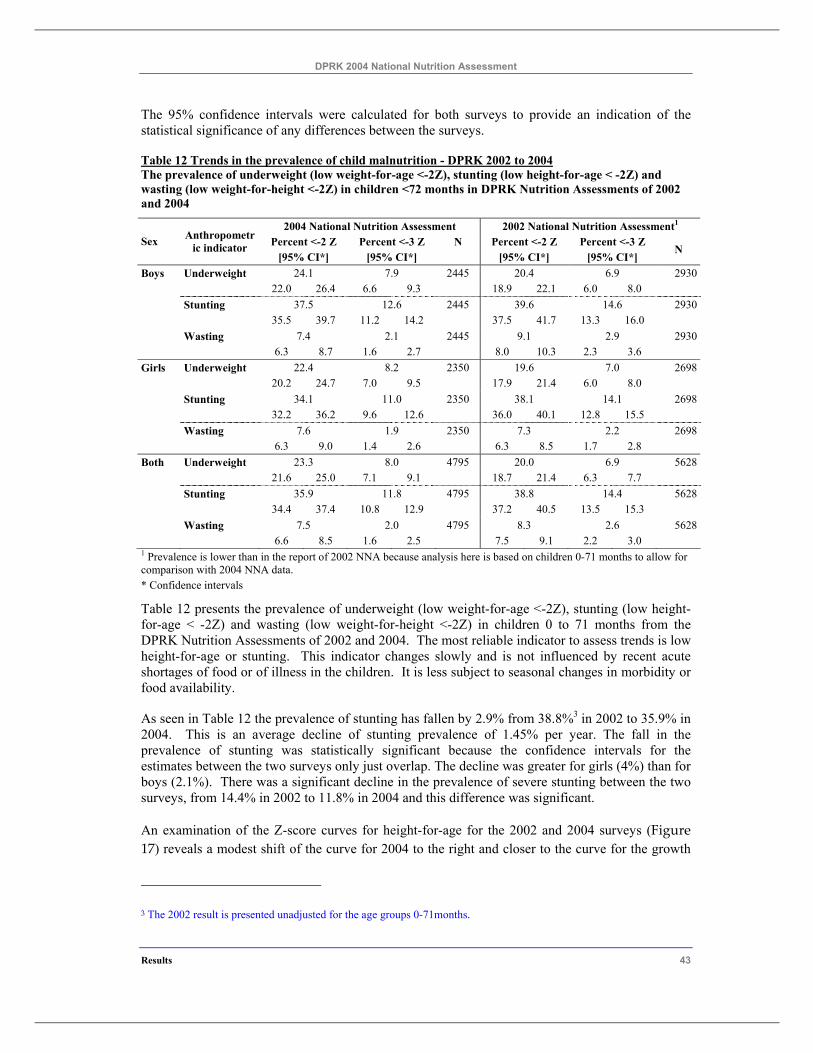
DPRK 2004 National Nutrition Assessment
Results 43
The 95% confidence intervals were calculated for both surveys to provide an indication of the statistical significance of any differences between the surveys.
Table 12 Trends in the prevalence of child malnutrition - DPRK 2002 to 2004 The prevalence of underweight (low weight-for-age <-2Z), stunting (low height-for-age < -2Z) and wasting (low weight-for-height <-2Z) in children <72 months in DPRK Nutrition Assessments of 2002 and 2004
2004 National Nutrition Assessment 2002 National Nutrition Assessment1 Percent <-2 Z Percent <-3 Z N Percent <-2 Z Percent <-3 Z Sex Anthropometr
ic indicator [95% CI*] [95% CI*] [95% CI*] [95% CI*]
N
Boys Underweight 24.1 7.9 2445 20.4 6.9 2930 22.0 26.4 6.6 9.3 18.9 22.1 6.0 8.0 Stunting 37.5 12.6 2445 39.6 14.6 2930 35.5 39.7 11.2 14.2 37.5 41.7 13.3 16.0 Wasting 7.4 2.1 2445 9.1 2.9 2930 6.3 8.7 1.6 2.7 8.0 10.3 2.3 3.6 Girls Underweight 22.4 8.2 2350 19.6 7.0 2698 20.2 24.7 7.0 9.5 17.9 21.4 6.0 8.0 Stunting 34.1 11.0 2350 38.1 14.1 2698 32.2 36.2 9.6 12.6 36.0 40.1 12.8 15.5 Wasting 7.6 1.9 2350 7.3 2.2 2698 6.3 9.0 1.4 2.6 6.3 8.5 1.7 2.8 Both Underweight 23.3 8.0 4795 20.0 6.9 5628 21.6 25.0 7.1 9.1 18.7 21.4 6.3 7.7 Stunting 35.9 11.8 4795 38.8 14.4 5628 34.4 37.4 10.8 12.9 37.2 40.5 13.5 15.3 Wasting 7.5 2.0 4795 8.3 2.6 5628 6.6 8.5 1.6 2.5 7.5 9.1 2.2 3.0 1 Prevalence is lower than in the report of 2002 NNA because analysis here is based on children 0-71 months to allow for comparison with 2004 NNA data. * Confidence intervals
Table 12 presents the prevalence of underweight (low weight-for-age <-2Z), stunting (low height-for-age < -2Z) and wasting (low weight-for-height <-2Z) in children 0 to 71 months from the DPRK Nutrition Assessments of 2002 and 2004. The most reliable indicator to assess trends is low height-for-age or stunting. This indicator changes slowly and is not influenced by recent acute shortages of food or of illness in the children. It is less subject to seasonal changes in morbidity or food availability.
As seen in Table 12 the prevalence of stunting has fallen by 2.9% from 38.8%3 in 2002 to 35.9% in 2004. This is an average decline of stunting prevalence of 1.45% per year. The fall in the prevalence of stunting was statistically significant because the confidence intervals for the estimates between the two surveys only just overlap. The decline was greater for girls (4%) than for boys (2.1%). There was a significant decline in the prevalence of severe stunting between the two surveys, from 14.4% in 2002 to 11.8% in 2004 and this difference was significant.
An examination of the Z-score curves for height-for-age for the 2002 and 2004 surveys (Figure 17) reveals a modest shift of the curve for 2004 to the right and closer to the curve for the growth
3 The 2002 result is presented unadjusted for the age groups 0-71months.
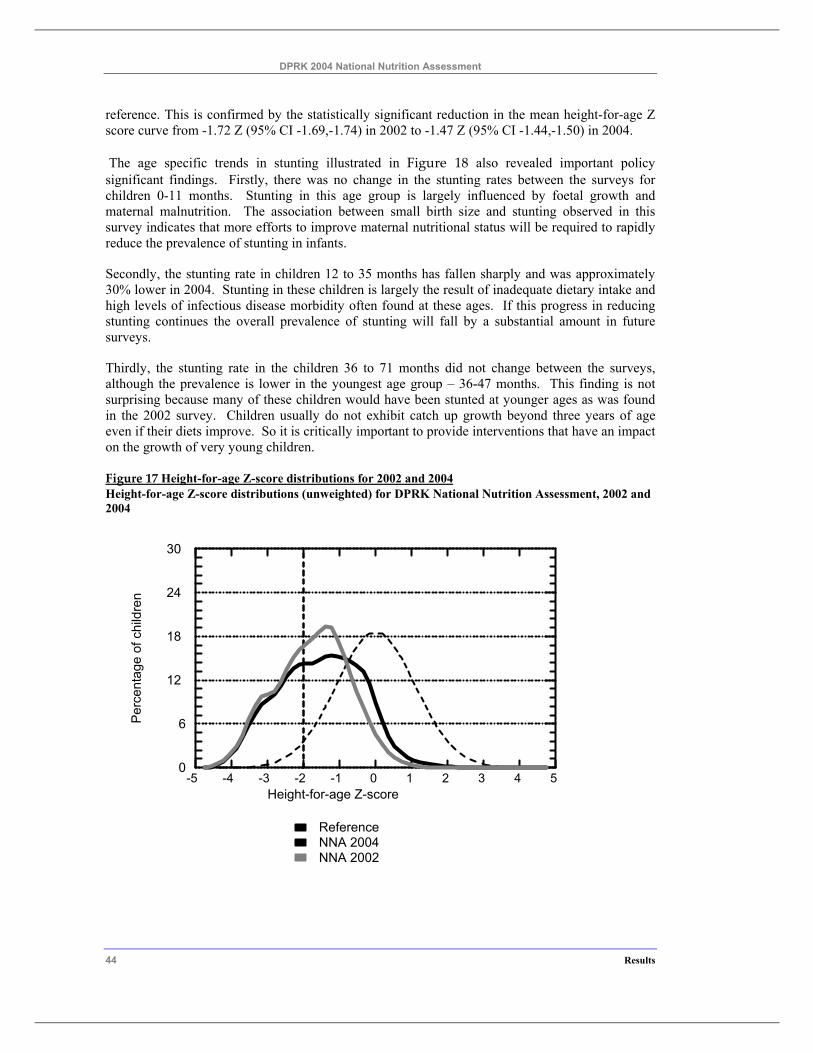
DPRK 2004 National Nutrition Assessment
44 Results
reference. This is confirmed by the statistically significant reduction in the mean height-for-age Z score curve from -1.72 Z (95% CI -1.69,-1.74) in 2002 to -1.47 Z (95% CI -1.44,-1.50) in 2004.
The age specific trends in stunting illustrated in Figure 18 also revealed important policy significant findings. Firstly, there was no change in the stunting rates between the surveys for children 0-11 months. Stunting in this age group is largely influenced by foetal growth and maternal malnutrition. The association between small birth size and stunting observed in this survey indicates that more efforts to improve maternal nutritional status will be required to rapidly reduce the prevalence of stunting in infants.
Secondly, the stunting rate in children 12 to 35 months has fallen sharply and was approximately 30% lower in 2004. Stunting in these children is largely the result of inadequate dietary intake and high levels of infectious disease morbidity often found at these ages. If this progress in reducing stunting continues the overall prevalence of stunting will fall by a substantial amount in future surveys.
Thirdly, the stunting rate in the children 36 to 71 months did not change between the surveys, although the prevalence is lower in the youngest age group – 36-47 months. This finding is not surprising because many of these children would have been stunted at younger ages as was found in the 2002 survey. Children usually do not exhibit catch up growth beyond three years of age even if their diets improve. So it is critically important to provide interventions that have an impact on the growth of very young children.
Figure 17 Height-for-age Z-score distributions for 2002 and 2004 Height-for-age Z-score distributions (unweighted) for DPRK National Nutrition Assessment, 2002 and 2004
-5 -4 -3 -2 -1 0 1 2 3 4 5Height-for-age Z-score
0
6
12
18
24
30
Per
cent
age
o f c
hild
ren
NNA 2002NNA 2004Reference
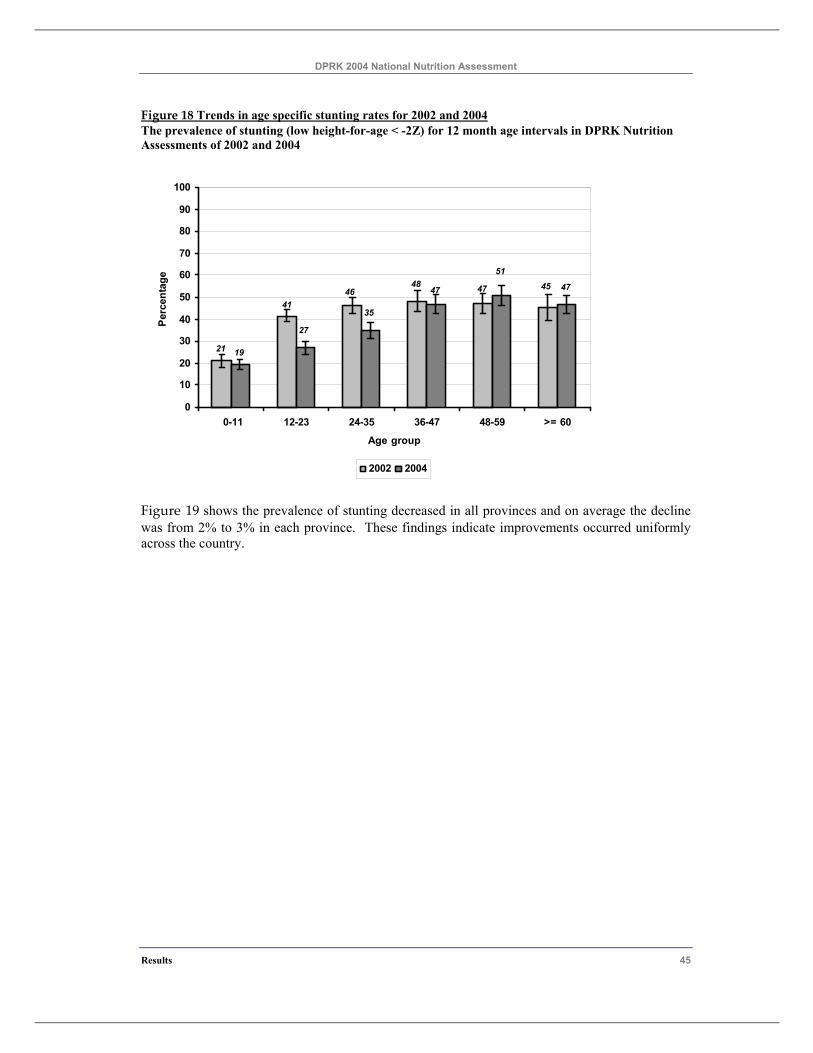
DPRK 2004 National Nutrition Assessment
Results 45
Figure 18 Trends in age specific stunting rates for 2002 and 2004 The prevalence of stunting (low height-for-age < -2Z) for 12 month age intervals in DPRK Nutrition Assessments of 2002 and 2004
45474846
41
21
47
51
47
35
27
19
0
10
20
30
40
50
60
70
80
90
100
0-11 12-23 24-35 36-47 48-59 >= 60
Age group
Perc
enta
ge
2002 2004
Figure 19 shows the prevalence of stunting decreased in all provinces and on average the decline was from 2% to 3% in each province. These findings indicate improvements occurred uniformly across the country.
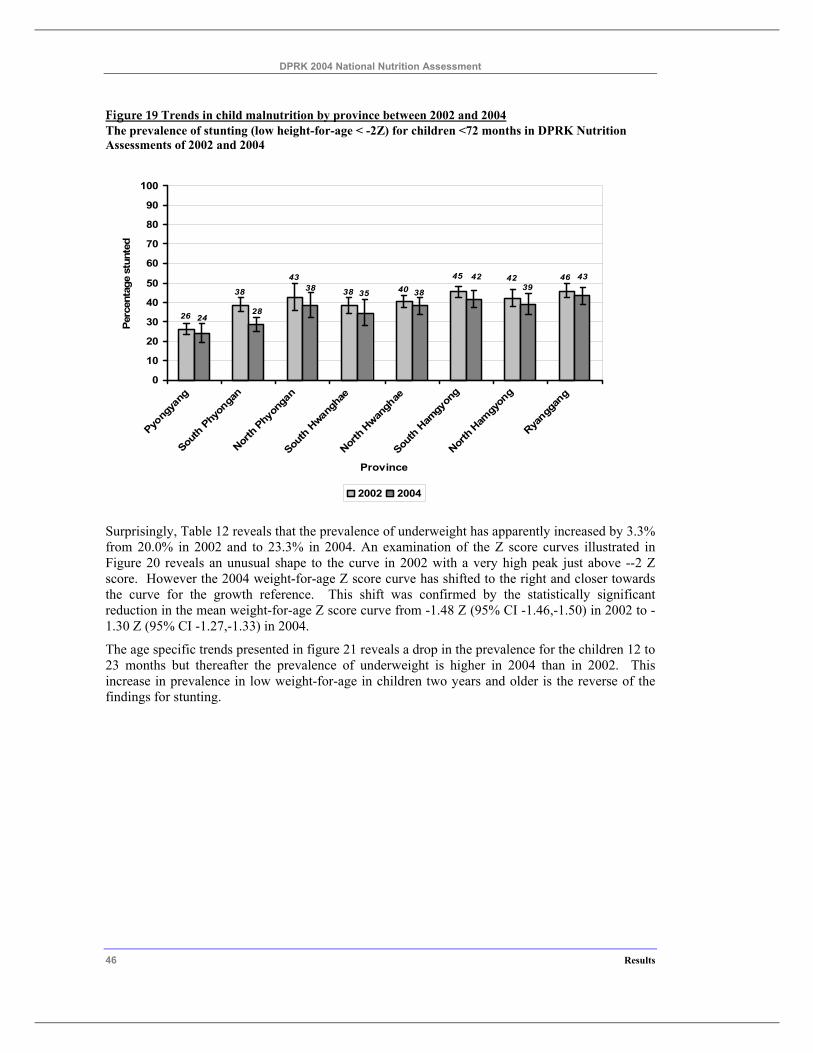
DPRK 2004 National Nutrition Assessment
46 Results
Figure 19 Trends in child malnutrition by province between 2002 and 2004 The prevalence of stunting (low height-for-age < -2Z) for children <72 months in DPRK Nutrition Assessments of 2002 and 2004
26
38
43
38 4045 42 46 43
3942
383538
2824
0
10
20
30
40
50
60
70
80
90
100
Pyong
yang
South
Phy
onga
n
North
Phy
onga
n
South
Hwan
ghae
North
Hwan
ghae
South
Ham
gyon
g
North
Ham
gyon
g
Ryangg
ang
Province
Perc
enta
ge s
tunt
ed
2002 2004
Surprisingly, Table 12 reveals that the prevalence of underweight has apparently increased by 3.3% from 20.0% in 2002 and to 23.3% in 2004. An examination of the Z score curves illustrated in Figure 20 reveals an unusual shape to the curve in 2002 with a very high peak just above --2 Z score. However the 2004 weight-for-age Z score curve has shifted to the right and closer towards the curve for the growth reference. This shift was confirmed by the statistically significant reduction in the mean weight-for-age Z score curve from -1.48 Z (95% CI -1.46,-1.50) in 2002 to -1.30 Z (95% CI -1.27,-1.33) in 2004.
The age specific trends presented in figure 21 reveals a drop in the prevalence for the children 12 to 23 months but thereafter the prevalence of underweight is higher in 2004 than in 2002. This increase in prevalence in low weight-for-age in children two years and older is the reverse of the findings for stunting.
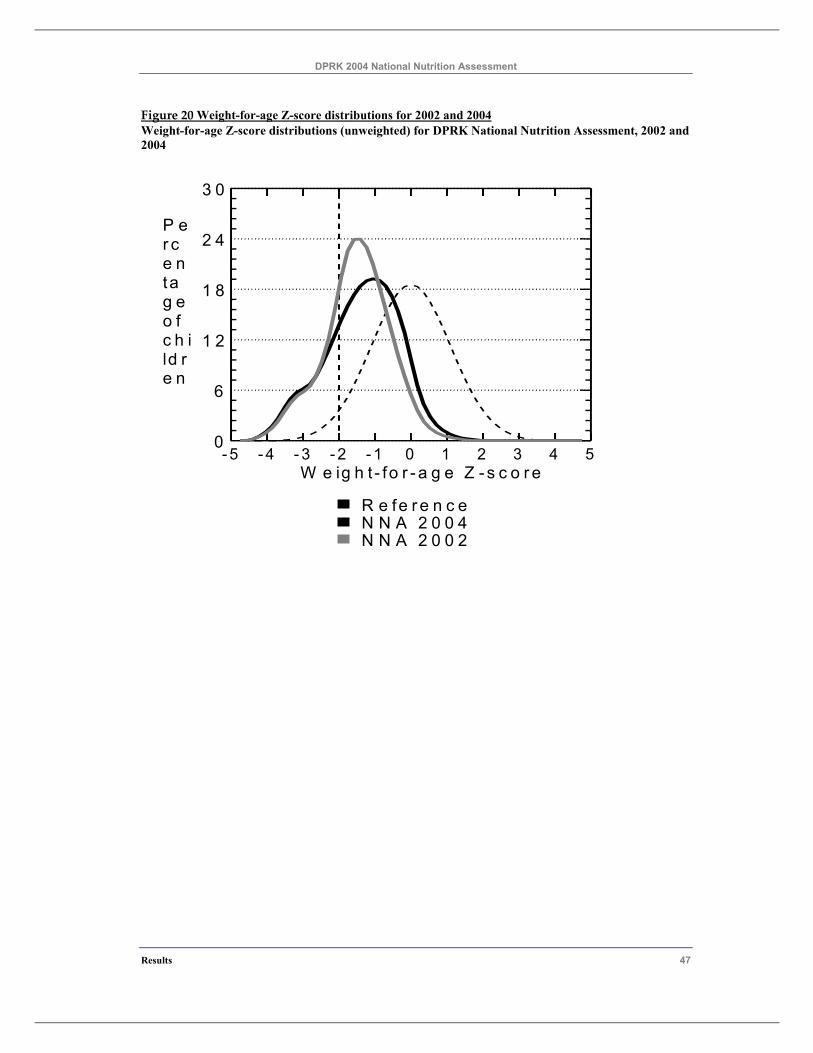
DPRK 2004 National Nutrition Assessment
Results 47
Figure 20 Weight-for-age Z-score distributions for 2002 and 2004 Weight-for-age Z-score distributions (unweighted) for DPRK National Nutrition Assessment, 2002 and 2004
- 5 - 4 - 3 - 2 - 1 0 1 2 3 4 5W e ig h t - fo r - a g e Z - s c o r e
0
6
1 2
1 8
2 4
3 0
P er ce ntag eo fc h ild re n
N N A 2 0 0 2N N A 2 0 0 4R e fe r e n c e
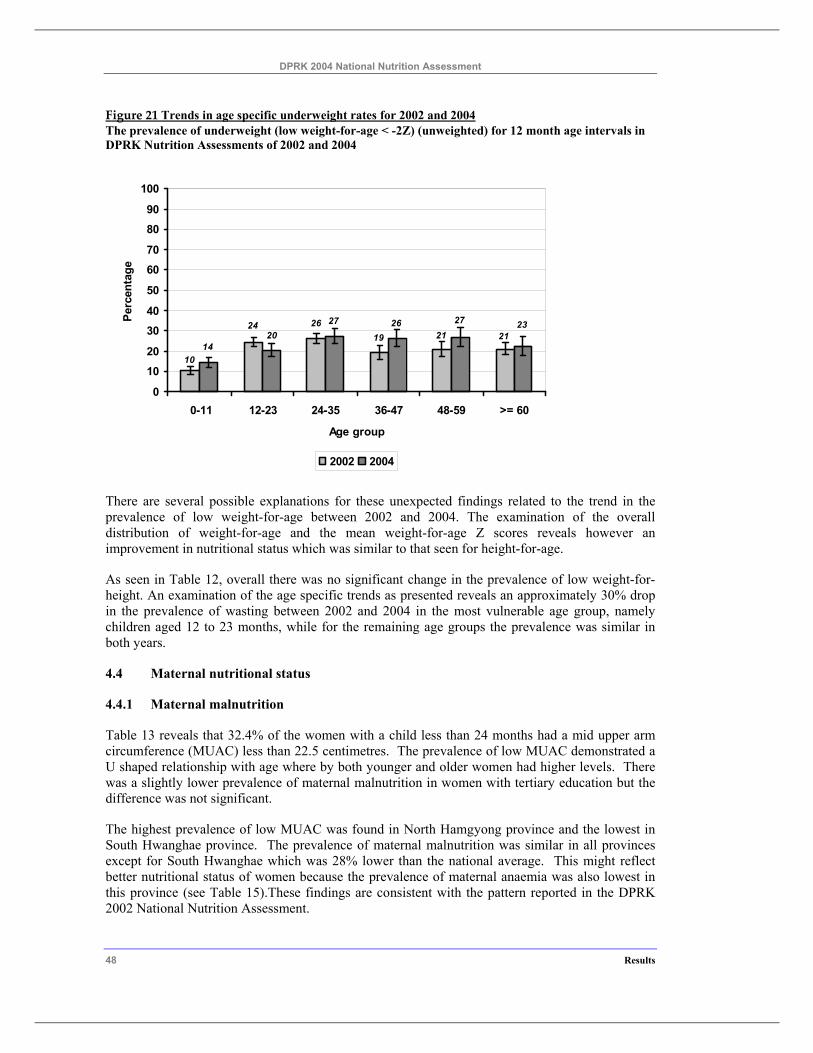
DPRK 2004 National Nutrition Assessment
48 Results
Figure 21 Trends in age specific underweight rates for 2002 and 2004 The prevalence of underweight (low weight-for-age < -2Z) (unweighted) for 12 month age intervals in DPRK Nutrition Assessments of 2002 and 2004
10
2121192624 23272627
2014
0
10
20
3040
50
60
70
80
90
100
0-11 12-23 24-35 36-47 48-59 >= 60
Age group
Perc
enta
ge
2002 2004
There are several possible explanations for these unexpected findings related to the trend in the prevalence of low weight-for-age between 2002 and 2004. The examination of the overall distribution of weight-for-age and the mean weight-for-age Z scores reveals however an improvement in nutritional status which was similar to that seen for height-for-age.
As seen in Table 12, overall there was no significant change in the prevalence of low weight-for-height. An examination of the age specific trends as presented reveals an approximately 30% drop in the prevalence of wasting between 2002 and 2004 in the most vulnerable age group, namely children aged 12 to 23 months, while for the remaining age groups the prevalence was similar in both years.
4.4 Maternal nutritional status
4.4.1 Maternal malnutrition
Table 13 reveals that 32.4% of the women with a child less than 24 months had a mid upper arm circumference (MUAC) less than 22.5 centimetres. The prevalence of low MUAC demonstrated a U shaped relationship with age where by both younger and older women had higher levels. There was a slightly lower prevalence of maternal malnutrition in women with tertiary education but the difference was not significant.
The highest prevalence of low MUAC was found in North Hamgyong province and the lowest in South Hwanghae province. The prevalence of maternal malnutrition was similar in all provinces except for South Hwanghae which was 28% lower than the national average. This might reflect better nutritional status of women because the prevalence of maternal anaemia was also lowest in this province (see Table 15).These findings are consistent with the pattern reported in the DPRK 2002 National Nutrition Assessment.
DPRK 2004 National Nutrition Assessment
Results 49
Similar patterns were observed in the distribution of women by body weight categories - Table 14. There was also a U shaped relationship of the percentage of women with body weight <50kg with age where by both younger and older women had higher levels. Maternal education was not associated with low body weight. The percentage of women with low body weight (<50 kg) was slightly higher in northern provinces and was highest in North Hamgyong, and lowest in North Hwanghae.
Table 14 also shows the percentage of women in different body weight groups by the level of their intake of a selection of food groups. Low intakes of rice and rice products, poultry and meat, and green leafy vegetables had a weak relationship with higher prevalence of maternal body weight < 45 kg.
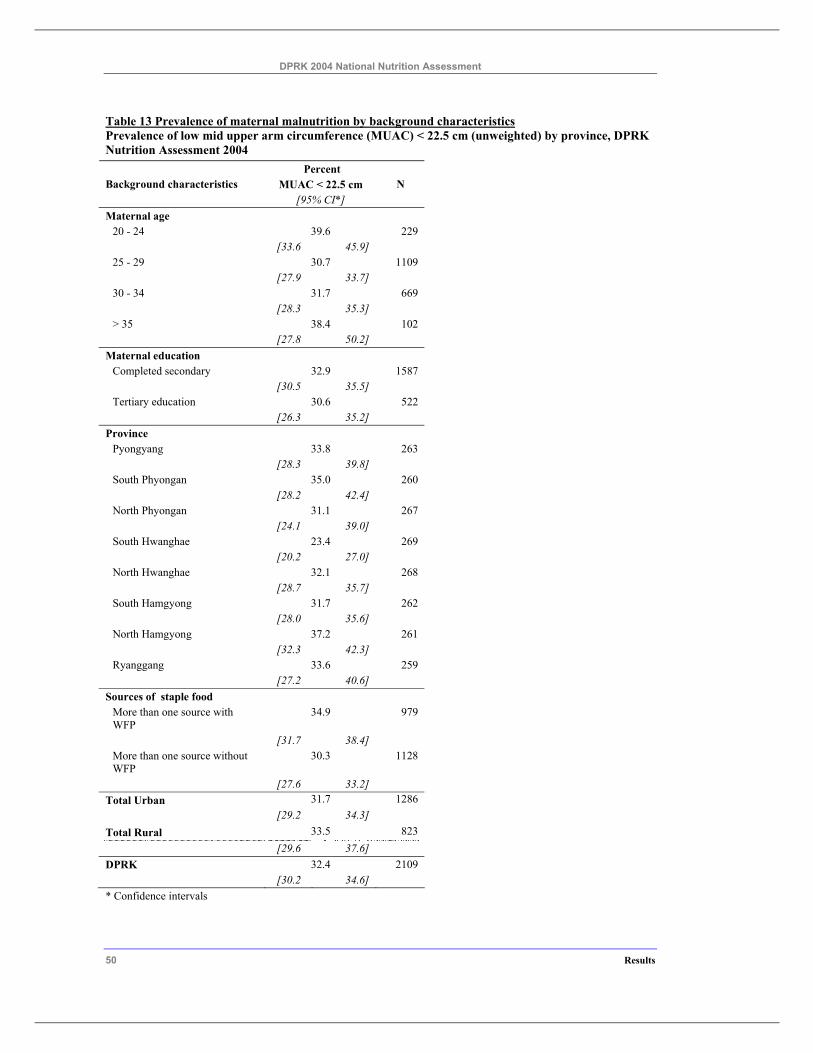
DPRK 2004 National Nutrition Assessment
50 Results
Table 13 Prevalence of maternal malnutrition by background characteristics Prevalence of low mid upper arm circumference (MUAC) < 22.5 cm (unweighted) by province, DPRK Nutrition Assessment 2004
Percent MUAC < 22.5 cm Background characteristics
[95% CI*] N
Maternal age 20 - 24 39.6 229 [33.6 45.9] 25 - 29 30.7 1109 [27.9 33.7] 30 - 34 31.7 669 [28.3 35.3] > 35 38.4 102 [27.8 50.2]
Maternal education Completed secondary 32.9 1587 [30.5 35.5] Tertiary education 30.6 522 [26.3 35.2]
Province Pyongyang 33.8 263 [28.3 39.8] South Phyongan 35.0 260 [28.2 42.4] North Phyongan 31.1 267 [24.1 39.0] South Hwanghae 23.4 269 [20.2 27.0] North Hwanghae 32.1 268 [28.7 35.7] South Hamgyong 31.7 262 [28.0 35.6] North Hamgyong 37.2 261 [32.3 42.3] Ryanggang 33.6 259
[27.2 40.6] Sources of staple food
More than one source with WFP
34.9 979
[31.7 38.4] More than one source without WFP
30.3 1128
[27.6 33.2] Total Urban 31.7 1286 [29.2 34.3] Total Rural 33.5 823 [29.6 37.6] DPRK 32.4 2109 [30.2 34.6] * Confidence intervals
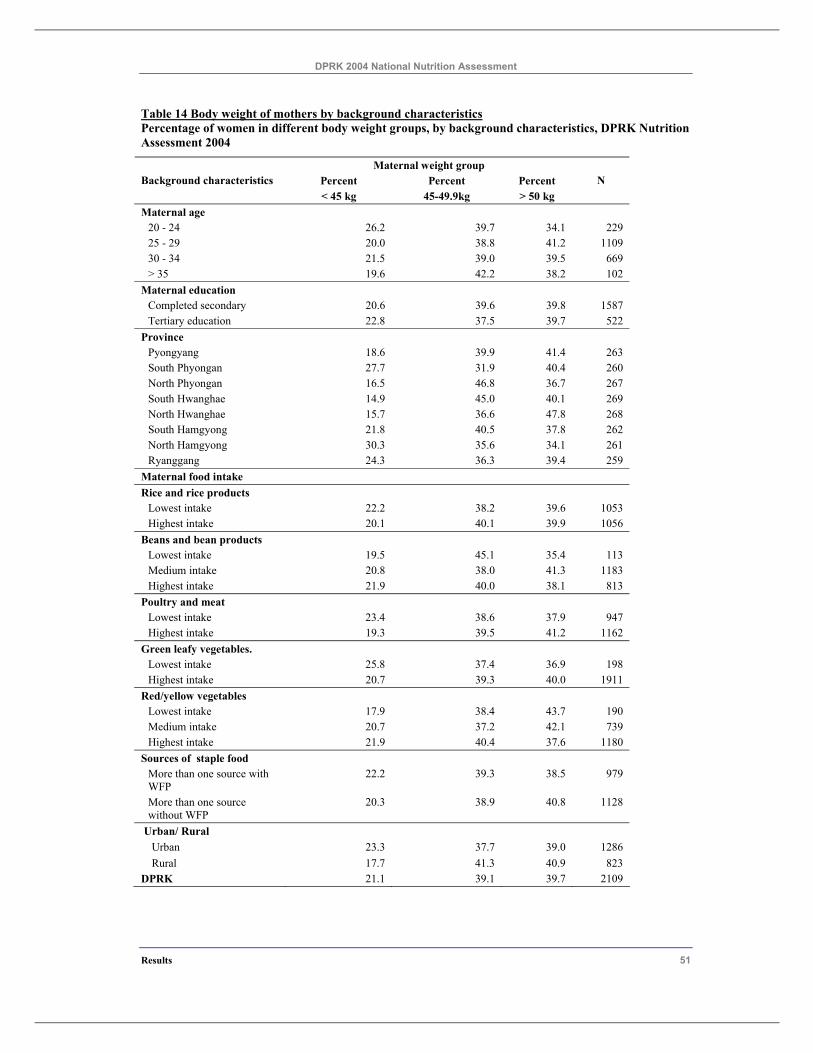
DPRK 2004 National Nutrition Assessment
Results 51
Table 14 Body weight of mothers by background characteristics Percentage of women in different body weight groups, by background characteristics, DPRK Nutrition Assessment 2004
Maternal weight group Background characteristics Percent
< 45 kg Percent
45-49.9kg Percent > 50 kg
N
Maternal age 20 - 24 26.2 39.7 34.1 229 25 - 29 20.0 38.8 41.2 1109 30 - 34 21.5 39.0 39.5 669 > 35 19.6 42.2 38.2 102
Maternal education Completed secondary 20.6 39.6 39.8 1587 Tertiary education 22.8 37.5 39.7 522
Province Pyongyang 18.6 39.9 41.4 263 South Phyongan 27.7 31.9 40.4 260 North Phyongan 16.5 46.8 36.7 267 South Hwanghae 14.9 45.0 40.1 269 North Hwanghae 15.7 36.6 47.8 268 South Hamgyong 21.8 40.5 37.8 262 North Hamgyong 30.3 35.6 34.1 261 Ryanggang 24.3 36.3 39.4 259
Maternal food intake Rice and rice products
Lowest intake 22.2 38.2 39.6 1053 Highest intake 20.1 40.1 39.9 1056
Beans and bean products Lowest intake 19.5 45.1 35.4 113 Medium intake 20.8 38.0 41.3 1183 Highest intake 21.9 40.0 38.1 813
Poultry and meat Lowest intake 23.4 38.6 37.9 947 Highest intake 19.3 39.5 41.2 1162
Green leafy vegetables. Lowest intake 25.8 37.4 36.9 198 Highest intake 20.7 39.3 40.0 1911
Red/yellow vegetables Lowest intake 17.9 38.4 43.7 190 Medium intake 20.7 37.2 42.1 739 Highest intake 21.9 40.4 37.6 1180
Sources of staple food More than one source with WFP
22.2 39.3 38.5 979
More than one source without WFP
20.3 38.9 40.8 1128
Urban/ Rural Urban 23.3 37.7 39.0 1286 Rural 17.7 41.3 40.9 823
DPRK 21.1 39.1 39.7 2109
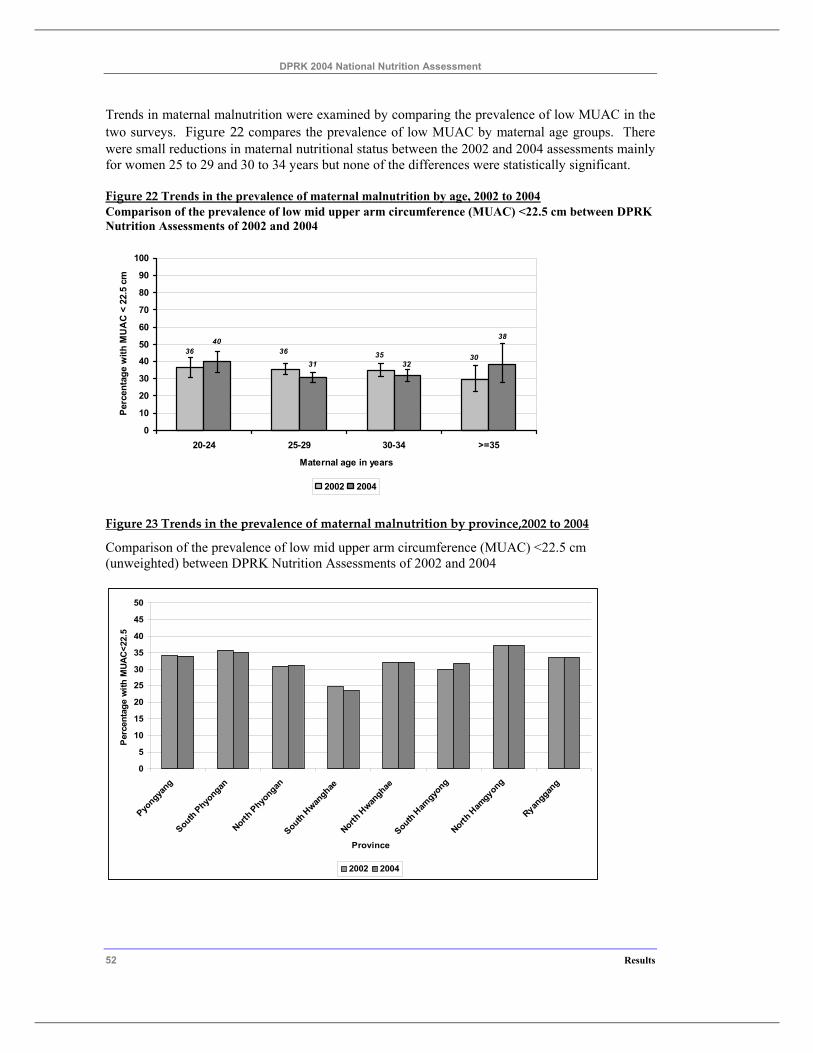
DPRK 2004 National Nutrition Assessment
52 Results
Trends in maternal malnutrition were examined by comparing the prevalence of low MUAC in the two surveys. Figure 22 compares the prevalence of low MUAC by maternal age groups. There were small reductions in maternal nutritional status between the 2002 and 2004 assessments mainly for women 25 to 29 and 30 to 34 years but none of the differences were statistically significant.
Figure 22 Trends in the prevalence of maternal malnutrition by age, 2002 to 2004 Comparison of the prevalence of low mid upper arm circumference (MUAC) <22.5 cm between DPRK Nutrition Assessments of 2002 and 2004
30353636
38
3231
40
0
10
20
30
40
50
60
70
80
90
100
20-24 25-29 30-34 >=35
Maternal age in years
Perc
enta
ge w
ith M
UA
C <
22.
5 cm
2002 2004
Figure 23 Trends in the prevalence of maternal malnutrition by province,2002 to 2004
Comparison of the prevalence of low mid upper arm circumference (MUAC) <22.5 cm (unweighted) between DPRK Nutrition Assessments of 2002 and 2004
0
5
10
15
20
25
30
35
40
45
50
Pyongya
ngSouth Phyo
nganNorth
Phyongan
South Hwan
ghaeNorth
Hwan
ghaeSouth H
amgyo
ngNorth
Ham
gyong
Ryanggan
g
Province
Per
cent
age
with
MUA
C<2
2.5
2002 2004
DPRK 2004 National Nutrition Assessment
Results 53
DPRK 2004 National Nutrition Assessment
54 Results
4.4.2 Maternal hemoglobin status
Anaemia has a number of adverse health effects in adults. The fatigue resulting from anaemia impairs work performance and endurance even for tasks that require only moderate levels of activity. Thus anaemia can result in reduced household productivity especially where many household tasks which require high levels of effort are mainly the responsibility of women. Maternal anaemia in pregnancy increases the risk of preterm and low birth weight and subsequent risk of anaemia in the infant.
Table 15 presents the anaemia levels of women with children less than two years who agreed to the haemoglobin measurement. Overall, 34.7% of the women had anaemia (Hb < 12.0 g/dl), but only 0.5% had moderate to severe anaemia (Hb < 9.0 g/dl). Not shown in the table was the very low prevalence (0.1%) of women with severe anaemia (Hb < 7.0 g/dl). Anaemia tended to be higher in the youngest and oldest age groups and was slightly lower in women who had completed tertiary education.
There was a marked variation in the prevalence of anaemia by province. The highest prevalence of anaemia was found in South Phyongan (61.3%) followed by North Phyongan (47.8%). The lowest prevalence was found in South Hwanghae, Pyongyang and South Hamgyong.
Maternal food intake was also associated with anaemia. Low intakes of rice and rice products, beans and bean products, poultry and meat and red / yellow vegetables were associated with higher prevalence of anaemia. Women from households that reported WFP foods as one of their sources of staple foods had higher prevalence of anaemia. The foods supplied through this program do not include high levels of iron fortified foods and would not be expected to prevent anaemia in women. This finding however indicates that the WFP programs were targeting women who have poorer nutritional status.
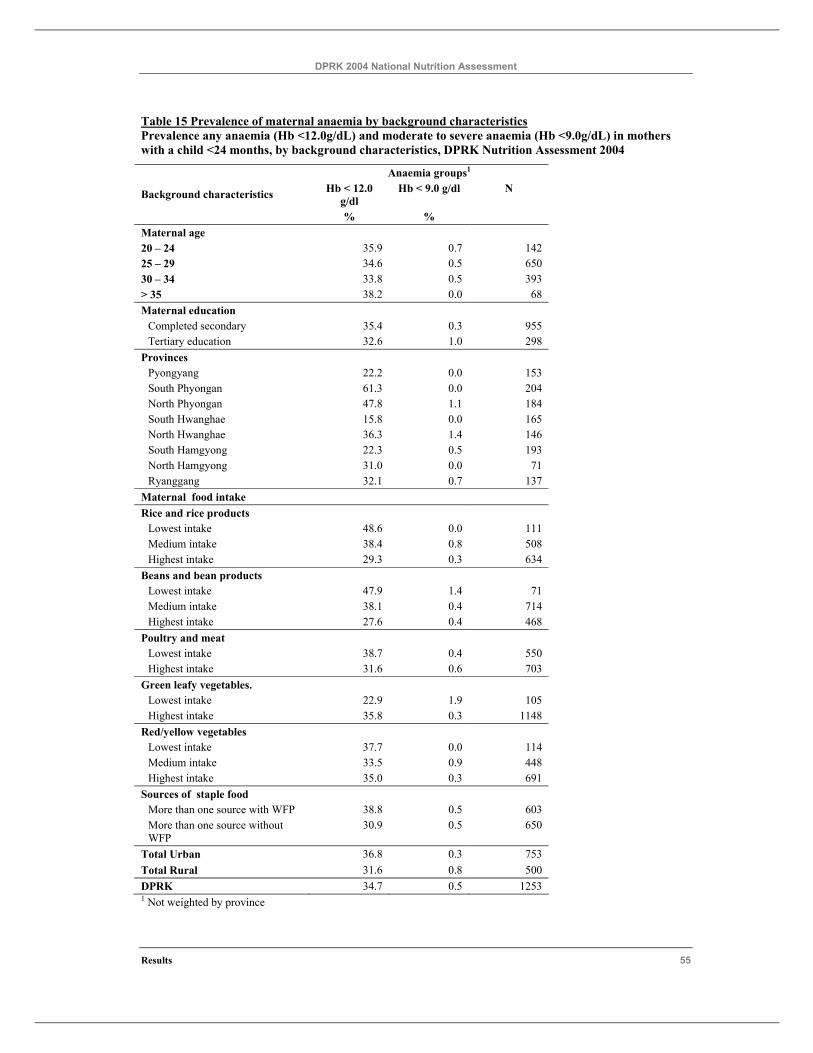
DPRK 2004 National Nutrition Assessment
Results 55
Table 15 Prevalence of maternal anaemia by background characteristics Prevalence any anaemia (Hb <12.0g/dL) and moderate to severe anaemia (Hb <9.0g/dL) in mothers with a child <24 months, by background characteristics, DPRK Nutrition Assessment 2004
Anaemia groups1 Hb < 12.0
g/dl Hb < 9.0 g/dl N Background characteristics
% % Maternal age 20 – 24 35.9 0.7 142 25 – 29 34.6 0.5 650 30 – 34 33.8 0.5 393 > 35 38.2 0.0 68 Maternal education
Completed secondary 35.4 0.3 955 Tertiary education 32.6 1.0 298
Provinces Pyongyang 22.2 0.0 153 South Phyongan 61.3 0.0 204 North Phyongan 47.8 1.1 184 South Hwanghae 15.8 0.0 165 North Hwanghae 36.3 1.4 146 South Hamgyong 22.3 0.5 193 North Hamgyong 31.0 0.0 71 Ryanggang 32.1 0.7 137
Maternal food intake Rice and rice products
Lowest intake 48.6 0.0 111 Medium intake 38.4 0.8 508 Highest intake 29.3 0.3 634
Beans and bean products Lowest intake 47.9 1.4 71 Medium intake 38.1 0.4 714 Highest intake 27.6 0.4 468
Poultry and meat Lowest intake 38.7 0.4 550 Highest intake 31.6 0.6 703
Green leafy vegetables. Lowest intake 22.9 1.9 105 Highest intake 35.8 0.3 1148
Red/yellow vegetables Lowest intake 37.7 0.0 114 Medium intake 33.5 0.9 448 Highest intake 35.0 0.3 691
Sources of staple food More than one source with WFP 38.8 0.5 603 More than one source without WFP
30.9 0.5 650
Total Urban 36.8 0.3 753 Total Rural 31.6 0.8 500 DPRK 34.7 0.5 1253 1 Not weighted by province
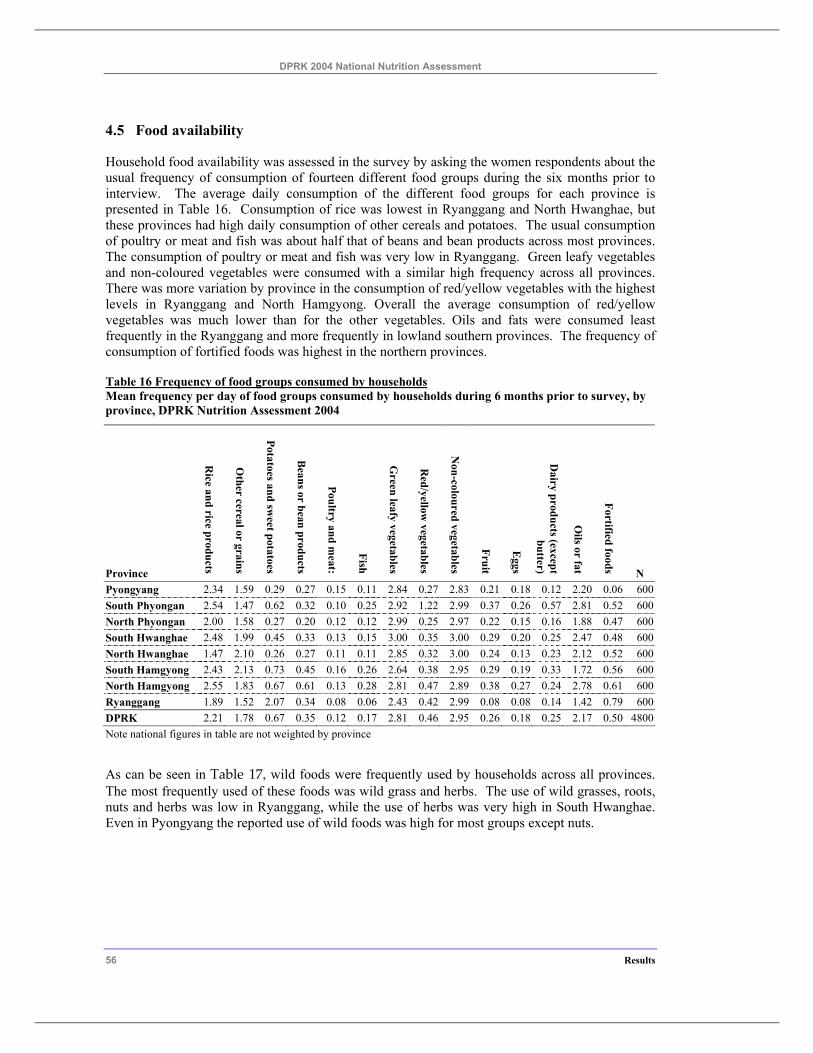
DPRK 2004 National Nutrition Assessment
56 Results
4.5 Food availability
Household food availability was assessed in the survey by asking the women respondents about the usual frequency of consumption of fourteen different food groups during the six months prior to interview. The average daily consumption of the different food groups for each province is presented in Table 16. Consumption of rice was lowest in Ryanggang and North Hwanghae, but these provinces had high daily consumption of other cereals and potatoes. The usual consumption of poultry or meat and fish was about half that of beans and bean products across most provinces. The consumption of poultry or meat and fish was very low in Ryanggang. Green leafy vegetables and non-coloured vegetables were consumed with a similar high frequency across all provinces. There was more variation by province in the consumption of red/yellow vegetables with the highest levels in Ryanggang and North Hamgyong. Overall the average consumption of red/yellow vegetables was much lower than for the other vegetables. Oils and fats were consumed least frequently in the Ryanggang and more frequently in lowland southern provinces. The frequency of consumption of fortified foods was highest in the northern provinces.
Table 16 Frequency of food groups consumed by households Mean frequency per day of food groups consumed by households during 6 months prior to survey, by province, DPRK Nutrition Assessment 2004
Province
Rice and rice products
Other cereal or grains
Potatoes and sweet potatoes
Beans or bean products
Poultry and meat:
Fish
Green leafy vegetables
Red/yellow
vegetables
Non-coloured vegetables
Fruit
Eggs
Dairy products (except
butter)
Oils or fat
Fortified foods N Pyongyang 2.34 1.59 0.29 0.27 0.15 0.11 2.84 0.27 2.83 0.21 0.18 0.12 2.20 0.06 600 South Phyongan 2.54 1.47 0.62 0.32 0.10 0.25 2.92 1.22 2.99 0.37 0.26 0.57 2.81 0.52 600 North Phyongan 2.00 1.58 0.27 0.20 0.12 0.12 2.99 0.25 2.97 0.22 0.15 0.16 1.88 0.47 600 South Hwanghae 2.48 1.99 0.45 0.33 0.13 0.15 3.00 0.35 3.00 0.29 0.20 0.25 2.47 0.48 600 North Hwanghae 1.47 2.10 0.26 0.27 0.11 0.11 2.85 0.32 3.00 0.24 0.13 0.23 2.12 0.52 600 South Hamgyong 2.43 2.13 0.73 0.45 0.16 0.26 2.64 0.38 2.95 0.29 0.19 0.33 1.72 0.56 600 North Hamgyong 2.55 1.83 0.67 0.61 0.13 0.28 2.81 0.47 2.89 0.38 0.27 0.24 2.78 0.61 600 Ryanggang 1.89 1.52 2.07 0.34 0.08 0.06 2.43 0.42 2.99 0.08 0.08 0.14 1.42 0.79 600 DPRK 2.21 1.78 0.67 0.35 0.12 0.17 2.81 0.46 2.95 0.26 0.18 0.25 2.17 0.50 4800 Note national figures in table are not weighted by province
As can be seen in Table 17, wild foods were frequently used by households across all provinces. The most frequently used of these foods was wild grass and herbs. The use of wild grasses, roots, nuts and herbs was low in Ryanggang, while the use of herbs was very high in South Hwanghae. Even in Pyongyang the reported use of wild foods was high for most groups except nuts.
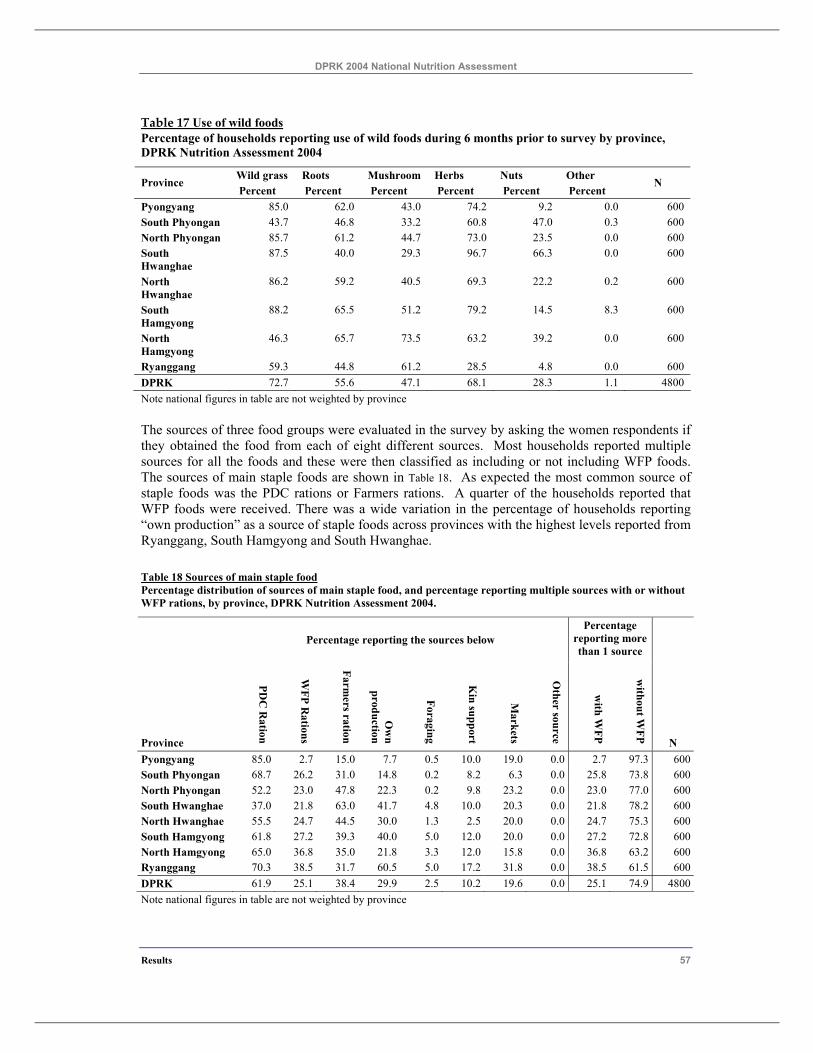
DPRK 2004 National Nutrition Assessment
Results 57
Table 17 Use of wild foods Percentage of households reporting use of wild foods during 6 months prior to survey by province, DPRK Nutrition Assessment 2004
Wild grass Roots Mushroom Herbs Nuts Other Province Percent Percent Percent Percent Percent Percent
N
Pyongyang 85.0 62.0 43.0 74.2 9.2 0.0 600 South Phyongan 43.7 46.8 33.2 60.8 47.0 0.3 600 North Phyongan 85.7 61.2 44.7 73.0 23.5 0.0 600 South Hwanghae
87.5 40.0 29.3 96.7 66.3 0.0 600
North Hwanghae
86.2 59.2 40.5 69.3 22.2 0.2 600
South Hamgyong
88.2 65.5 51.2 79.2 14.5 8.3 600
North Hamgyong
46.3 65.7 73.5 63.2 39.2 0.0 600
Ryanggang 59.3 44.8 61.2 28.5 4.8 0.0 600 DPRK 72.7 55.6 47.1 68.1 28.3 1.1 4800 Note national figures in table are not weighted by province
The sources of three food groups were evaluated in the survey by asking the women respondents if they obtained the food from each of eight different sources. Most households reported multiple sources for all the foods and these were then classified as including or not including WFP foods. The sources of main staple foods are shown in Table 18. As expected the most common source of staple foods was the PDC rations or Farmers rations. A quarter of the households reported that WFP foods were received. There was a wide variation in the percentage of households reporting “own production” as a source of staple foods across provinces with the highest levels reported from Ryanggang, South Hamgyong and South Hwanghae.
Table 18 Sources of main staple food Percentage distribution of sources of main staple food, and percentage reporting multiple sources with or without WFP rations, by province, DPRK Nutrition Assessment 2004.
Percentage reporting the sources below Percentage
reporting more than 1 source
Province
PDC
Ration
WFP R
ations
Farmers ration
Ow
n production
Foraging
Kin support
Markets
Other source
with W
FP
without W
FP N Pyongyang 85.0 2.7 15.0 7.7 0.5 10.0 19.0 0.0 2.7 97.3 600South Phyongan 68.7 26.2 31.0 14.8 0.2 8.2 6.3 0.0 25.8 73.8 600North Phyongan 52.2 23.0 47.8 22.3 0.2 9.8 23.2 0.0 23.0 77.0 600South Hwanghae 37.0 21.8 63.0 41.7 4.8 10.0 20.3 0.0 21.8 78.2 600North Hwanghae 55.5 24.7 44.5 30.0 1.3 2.5 20.0 0.0 24.7 75.3 600South Hamgyong 61.8 27.2 39.3 40.0 5.0 12.0 20.0 0.0 27.2 72.8 600North Hamgyong 65.0 36.8 35.0 21.8 3.3 12.0 15.8 0.0 36.8 63.2 600Ryanggang 70.3 38.5 31.7 60.5 5.0 17.2 31.8 0.0 38.5 61.5 600DPRK 61.9 25.1 38.4 29.9 2.5 10.2 19.6 0.0 25.1 74.9 4800Note national figures in table are not weighted by province
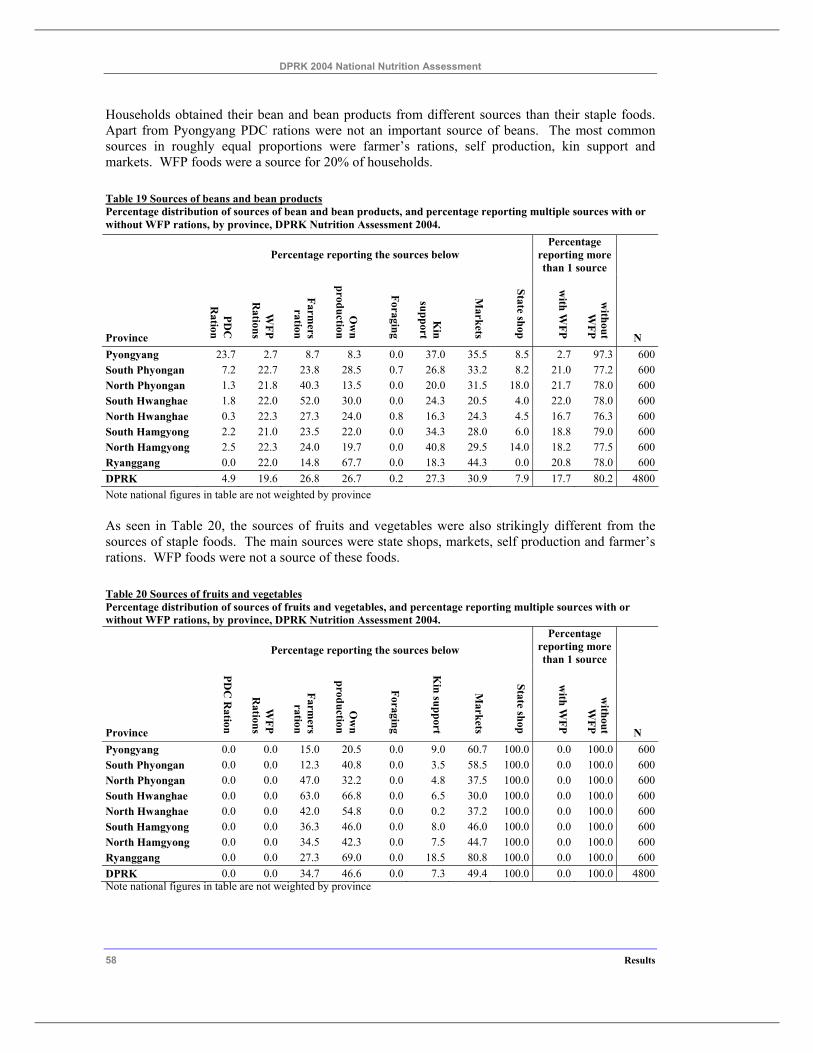
DPRK 2004 National Nutrition Assessment
58 Results
Households obtained their bean and bean products from different sources than their staple foods. Apart from Pyongyang PDC rations were not an important source of beans. The most common sources in roughly equal proportions were farmer’s rations, self production, kin support and markets. WFP foods were a source for 20% of households.
Table 19 Sources of beans and bean products Percentage distribution of sources of bean and bean products, and percentage reporting multiple sources with or without WFP rations, by province, DPRK Nutrition Assessment 2004.
Percentage reporting the sources below Percentage
reporting more than 1 source
Province
PDC
R
ation
WFP
Rations
Farmers
ration
Ow
n production
Foraging
Kin
support
Markets
State shop
with W
FP
without W
FP N Pyongyang 23.7 2.7 8.7 8.3 0.0 37.0 35.5 8.5 2.7 97.3 600South Phyongan 7.2 22.7 23.8 28.5 0.7 26.8 33.2 8.2 21.0 77.2 600North Phyongan 1.3 21.8 40.3 13.5 0.0 20.0 31.5 18.0 21.7 78.0 600South Hwanghae 1.8 22.0 52.0 30.0 0.0 24.3 20.5 4.0 22.0 78.0 600North Hwanghae 0.3 22.3 27.3 24.0 0.8 16.3 24.3 4.5 16.7 76.3 600South Hamgyong 2.2 21.0 23.5 22.0 0.0 34.3 28.0 6.0 18.8 79.0 600North Hamgyong 2.5 22.3 24.0 19.7 0.0 40.8 29.5 14.0 18.2 77.5 600Ryanggang 0.0 22.0 14.8 67.7 0.0 18.3 44.3 0.0 20.8 78.0 600DPRK 4.9 19.6 26.8 26.7 0.2 27.3 30.9 7.9 17.7 80.2 4800Note national figures in table are not weighted by province
As seen in Table 20, the sources of fruits and vegetables were also strikingly different from the sources of staple foods. The main sources were state shops, markets, self production and farmer’s rations. WFP foods were not a source of these foods.
Table 20 Sources of fruits and vegetables Percentage distribution of sources of fruits and vegetables, and percentage reporting multiple sources with or without WFP rations, by province, DPRK Nutrition Assessment 2004.
Percentage reporting the sources below Percentage
reporting more than 1 source
Province
PDC
Ration
WFP
Rations
Farmers
ration
Ow
n production
Foraging
Kin support
Markets
State shop
with W
FP
without W
FP N Pyongyang 0.0 0.0 15.0 20.5 0.0 9.0 60.7 100.0 0.0 100.0 600South Phyongan 0.0 0.0 12.3 40.8 0.0 3.5 58.5 100.0 0.0 100.0 600North Phyongan 0.0 0.0 47.0 32.2 0.0 4.8 37.5 100.0 0.0 100.0 600South Hwanghae 0.0 0.0 63.0 66.8 0.0 6.5 30.0 100.0 0.0 100.0 600North Hwanghae 0.0 0.0 42.0 54.8 0.0 0.2 37.2 100.0 0.0 100.0 600South Hamgyong 0.0 0.0 36.3 46.0 0.0 8.0 46.0 100.0 0.0 100.0 600North Hamgyong 0.0 0.0 34.5 42.3 0.0 7.5 44.7 100.0 0.0 100.0 600Ryanggang 0.0 0.0 27.3 69.0 0.0 18.5 80.8 100.0 0.0 100.0 600DPRK 0.0 0.0 34.7 46.6 0.0 7.3 49.4 100.0 0.0 100.0 4800Note national figures in table are not weighted by province
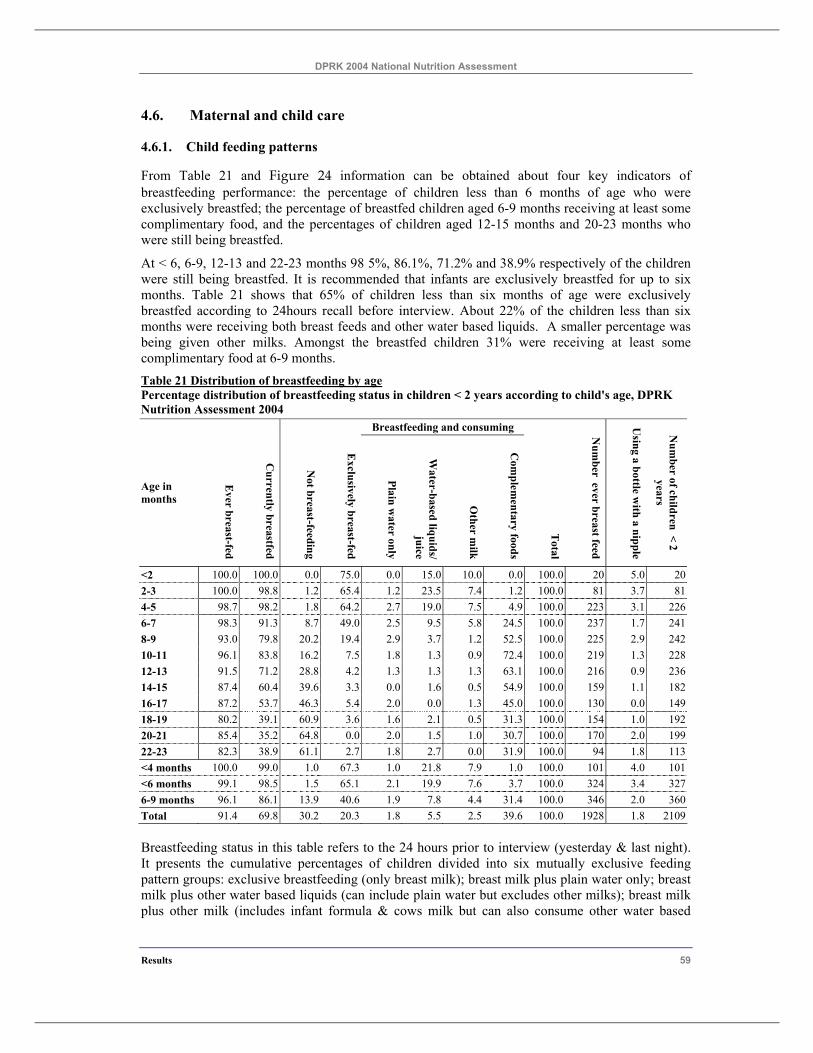
DPRK 2004 National Nutrition Assessment
Results 59
4.6. Maternal and child care
4.6.1. Child feeding patterns
From Table 21 and Figure 24 information can be obtained about four key indicators of breastfeeding performance: the percentage of children less than 6 months of age who were exclusively breastfed; the percentage of breastfed children aged 6-9 months receiving at least some complimentary food, and the percentages of children aged 12-15 months and 20-23 months who were still being breastfed.
At < 6, 6-9, 12-13 and 22-23 months 98 5%, 86.1%, 71.2% and 38.9% respectively of the children were still being breastfed. It is recommended that infants are exclusively breastfed for up to six months. Table 21 shows that 65% of children less than six months of age were exclusively breastfed according to 24hours recall before interview. About 22% of the children less than six months were receiving both breast feeds and other water based liquids. A smaller percentage was being given other milks. Amongst the breastfed children 31% were receiving at least some complimentary food at 6-9 months. Table 21 Distribution of breastfeeding by age Percentage distribution of breastfeeding status in children < 2 years according to child's age, DPRK Nutrition Assessment 2004
Breastfeeding and consuming
Age in months
Ever breast-fed
Currently breastfed
Not breast-feeding
Exclusively breast-fed
Plain water only
Water-based liquids/
juice
Other m
ilk
Com
plementary foods
Total
Num
ber ever breast feed
Using a bottle w
ith a nipple
Num
ber of children < 2 years
<2 100.0 100.0 0.0 75.0 0.0 15.0 10.0 0.0 100.0 20 5.0 202-3 100.0 98.8 1.2 65.4 1.2 23.5 7.4 1.2 100.0 81 3.7 814-5 98.7 98.2 1.8 64.2 2.7 19.0 7.5 4.9 100.0 223 3.1 2266-7 98.3 91.3 8.7 49.0 2.5 9.5 5.8 24.5 100.0 237 1.7 2418-9 93.0 79.8 20.2 19.4 2.9 3.7 1.2 52.5 100.0 225 2.9 24210-11 96.1 83.8 16.2 7.5 1.8 1.3 0.9 72.4 100.0 219 1.3 22812-13 91.5 71.2 28.8 4.2 1.3 1.3 1.3 63.1 100.0 216 0.9 23614-15 87.4 60.4 39.6 3.3 0.0 1.6 0.5 54.9 100.0 159 1.1 18216-17 87.2 53.7 46.3 5.4 2.0 0.0 1.3 45.0 100.0 130 0.0 14918-19 80.2 39.1 60.9 3.6 1.6 2.1 0.5 31.3 100.0 154 1.0 19220-21 85.4 35.2 64.8 0.0 2.0 1.5 1.0 30.7 100.0 170 2.0 19922-23 82.3 38.9 61.1 2.7 1.8 2.7 0.0 31.9 100.0 94 1.8 113<4 months 100.0 99.0 1.0 67.3 1.0 21.8 7.9 1.0 100.0 101 4.0 101<6 months 99.1 98.5 1.5 65.1 2.1 19.9 7.6 3.7 100.0 324 3.4 3276-9 months 96.1 86.1 13.9 40.6 1.9 7.8 4.4 31.4 100.0 346 2.0 360Total 91.4 69.8 30.2 20.3 1.8 5.5 2.5 39.6 100.0 1928 1.8 2109
Breastfeeding status in this table refers to the 24 hours prior to interview (yesterday & last night). It presents the cumulative percentages of children divided into six mutually exclusive feeding pattern groups: exclusive breastfeeding (only breast milk); breast milk plus plain water only; breast milk plus other water based liquids (can include plain water but excludes other milks); breast milk plus other milk (includes infant formula & cows milk but can also consume other water based
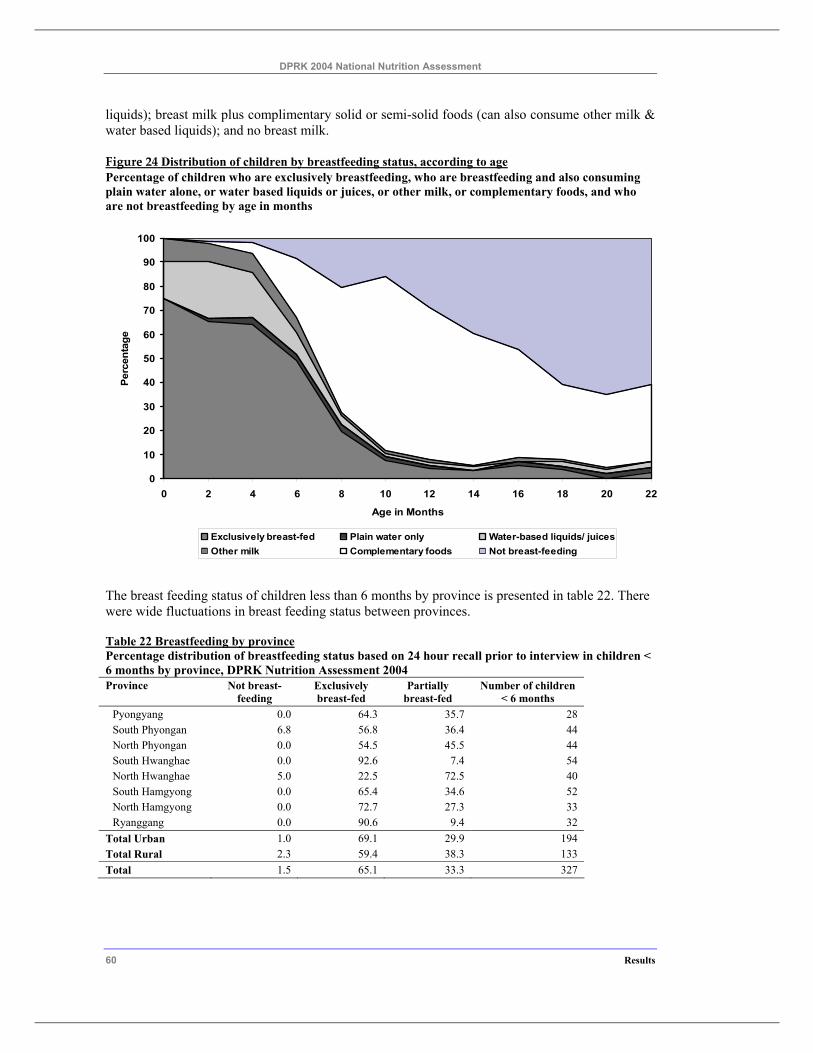
DPRK 2004 National Nutrition Assessment
60 Results
liquids); breast milk plus complimentary solid or semi-solid foods (can also consume other milk & water based liquids); and no breast milk.
Figure 24 Distribution of children by breastfeeding status, according to age Percentage of children who are exclusively breastfeeding, who are breastfeeding and also consuming plain water alone, or water based liquids or juices, or other milk, or complementary foods, and who are not breastfeeding by age in months
0
10
20
30
40
50
60
70
80
90
100
0 2 4 6 8 10 12 14 16 18 20 22
Age in Months
Perc
enta
ge
Exclusively breast-fed Plain water only Water-based liquids/ juicesOther milk Complementary foods Not breast-feeding
The breast feeding status of children less than 6 months by province is presented in table 22. There were wide fluctuations in breast feeding status between provinces.
Table 22 Breastfeeding by province Percentage distribution of breastfeeding status based on 24 hour recall prior to interview in children < 6 months by province, DPRK Nutrition Assessment 2004 Province Not breast-
feeding Exclusively breast-fed
Partially breast-fed
Number of children < 6 months
Pyongyang 0.0 64.3 35.7 28 South Phyongan 6.8 56.8 36.4 44 North Phyongan 0.0 54.5 45.5 44 South Hwanghae 0.0 92.6 7.4 54 North Hwanghae 5.0 22.5 72.5 40 South Hamgyong 0.0 65.4 34.6 52 North Hamgyong 0.0 72.7 27.3 33 Ryanggang 0.0 90.6 9.4 32
Total Urban 1.0 69.1 29.9 194 Total Rural 2.3 59.4 38.3 133 Total 1.5 65.1 33.3 327
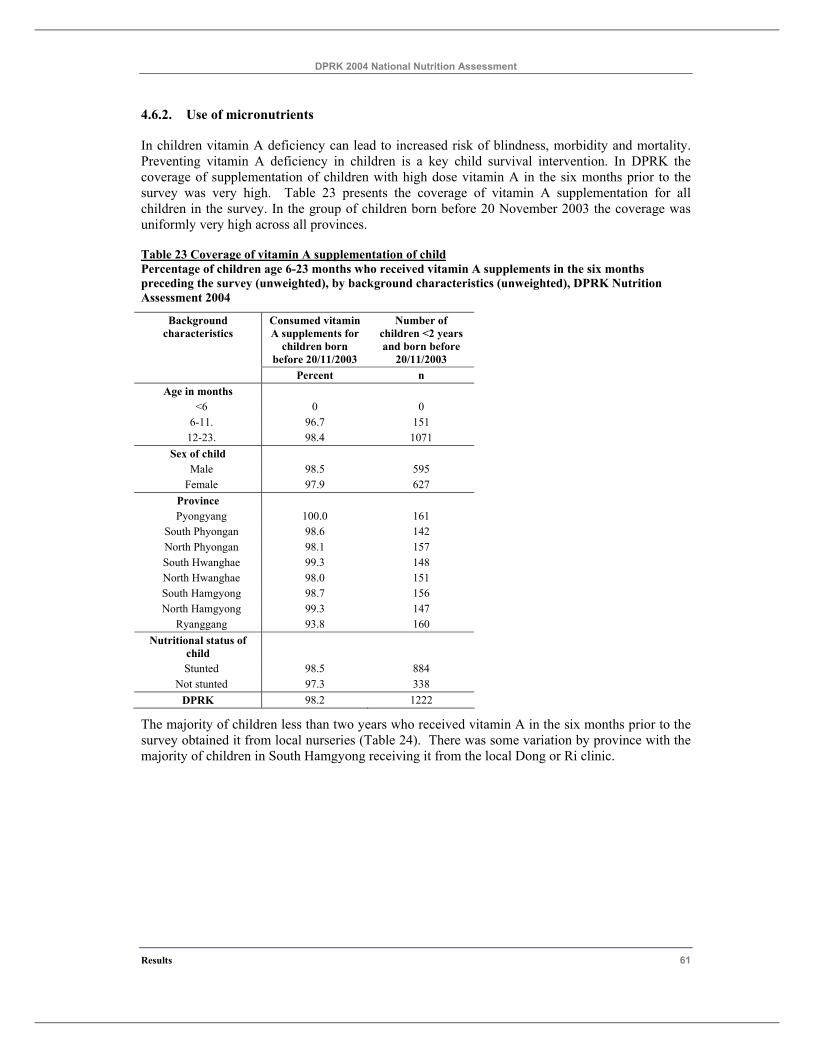
DPRK 2004 National Nutrition Assessment
Results 61
4.6.2. Use of micronutrients
In children vitamin A deficiency can lead to increased risk of blindness, morbidity and mortality. Preventing vitamin A deficiency in children is a key child survival intervention. In DPRK the coverage of supplementation of children with high dose vitamin A in the six months prior to the survey was very high. Table 23 presents the coverage of vitamin A supplementation for all children in the survey. In the group of children born before 20 November 2003 the coverage was uniformly very high across all provinces.
Table 23 Coverage of vitamin A supplementation of child Percentage of children age 6-23 months who received vitamin A supplements in the six months preceding the survey (unweighted), by background characteristics (unweighted), DPRK Nutrition Assessment 2004
Background characteristics
Consumed vitamin A supplements for
children born before 20/11/2003
Number of children <2 years and born before
20/11/2003 Percent n
Age in months <6 0 0
6-11. 96.7 151 12-23. 98.4 1071
Sex of child Male 98.5 595
Female 97.9 627 Province Pyongyang 100.0 161
South Phyongan 98.6 142 North Phyongan 98.1 157 South Hwanghae 99.3 148 North Hwanghae 98.0 151 South Hamgyong 98.7 156 North Hamgyong 99.3 147
Ryanggang 93.8 160 Nutritional status of
child
Stunted 98.5 884 Not stunted 97.3 338
DPRK 98.2 1222
The majority of children less than two years who received vitamin A in the six months prior to the survey obtained it from local nurseries (Table 24). There was some variation by province with the majority of children in South Hamgyong receiving it from the local Dong or Ri clinic.
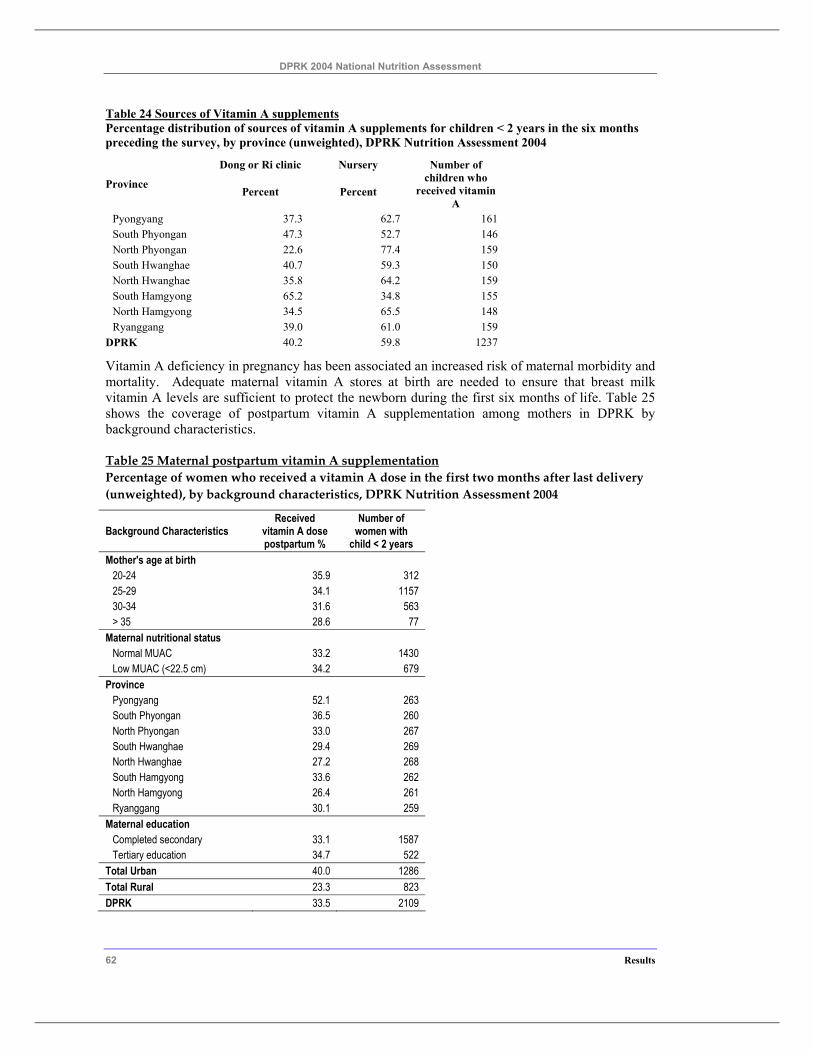
DPRK 2004 National Nutrition Assessment
62 Results
Table 24 Sources of Vitamin A supplements Percentage distribution of sources of vitamin A supplements for children < 2 years in the six months preceding the survey, by province (unweighted), DPRK Nutrition Assessment 2004
Dong or Ri clinic Nursery
Province Percent Percent
Number of children who
received vitamin A
Pyongyang 37.3 62.7 161 South Phyongan 47.3 52.7 146 North Phyongan 22.6 77.4 159 South Hwanghae 40.7 59.3 150 North Hwanghae 35.8 64.2 159 South Hamgyong 65.2 34.8 155 North Hamgyong 34.5 65.5 148 Ryanggang 39.0 61.0 159
DPRK 40.2 59.8 1237
Vitamin A deficiency in pregnancy has been associated an increased risk of maternal morbidity and mortality. Adequate maternal vitamin A stores at birth are needed to ensure that breast milk vitamin A levels are sufficient to protect the newborn during the first six months of life. Table 25 shows the coverage of postpartum vitamin A supplementation among mothers in DPRK by background characteristics.
Table 25 Maternal postpartum vitamin A supplementation Percentage of women who received a vitamin A dose in the first two months after last delivery (unweighted), by background characteristics, DPRK Nutrition Assessment 2004
Background Characteristics Received
vitamin A dose postpartum %
Number of women with
child < 2 years Mother's age at birth
20-24 35.9 312 25-29 34.1 1157 30-34 31.6 563 > 35 28.6 77
Maternal nutritional status Normal MUAC 33.2 1430 Low MUAC (<22.5 cm) 34.2 679
Province Pyongyang 52.1 263 South Phyongan 36.5 260 North Phyongan 33.0 267 South Hwanghae 29.4 269 North Hwanghae 27.2 268 South Hamgyong 33.6 262 North Hamgyong 26.4 261 Ryanggang 30.1 259
Maternal education Completed secondary 33.1 1587 Tertiary education 34.7 522
Total Urban 40.0 1286 Total Rural 23.3 823 DPRK 33.5 2109
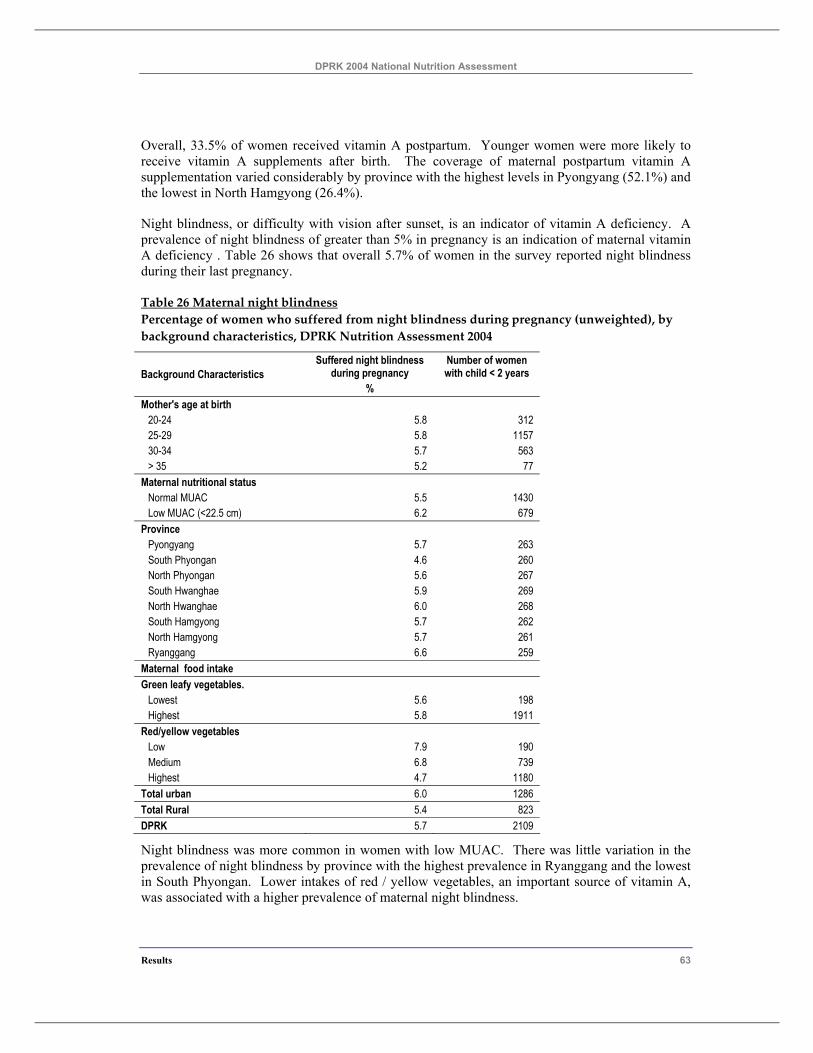
DPRK 2004 National Nutrition Assessment
Results 63
Overall, 33.5% of women received vitamin A postpartum. Younger women were more likely to receive vitamin A supplements after birth. The coverage of maternal postpartum vitamin A supplementation varied considerably by province with the highest levels in Pyongyang (52.1%) and the lowest in North Hamgyong (26.4%).
Night blindness, or difficulty with vision after sunset, is an indicator of vitamin A deficiency. A prevalence of night blindness of greater than 5% in pregnancy is an indication of maternal vitamin A deficiency . Table 26 shows that overall 5.7% of women in the survey reported night blindness during their last pregnancy.
Table 26 Maternal night blindness Percentage of women who suffered from night blindness during pregnancy (unweighted), by background characteristics, DPRK Nutrition Assessment 2004
Background Characteristics Suffered night blindness
during pregnancy %
Number of women with child < 2 years
Mother's age at birth 20-24 5.8 312 25-29 5.8 1157 30-34 5.7 563 > 35 5.2 77
Maternal nutritional status Normal MUAC 5.5 1430 Low MUAC (<22.5 cm) 6.2 679
Province Pyongyang 5.7 263 South Phyongan 4.6 260 North Phyongan 5.6 267 South Hwanghae 5.9 269 North Hwanghae 6.0 268 South Hamgyong 5.7 262 North Hamgyong 5.7 261 Ryanggang 6.6 259
Maternal food intake Green leafy vegetables.
Lowest 5.6 198 Highest 5.8 1911
Red/yellow vegetables Low 7.9 190 Medium 6.8 739 Highest 4.7 1180
Total urban 6.0 1286 Total Rural 5.4 823 DPRK 5.7 2109
Night blindness was more common in women with low MUAC. There was little variation in the prevalence of night blindness by province with the highest prevalence in Ryanggang and the lowest in South Phyongan. Lower intakes of red / yellow vegetables, an important source of vitamin A, was associated with a higher prevalence of maternal night blindness.
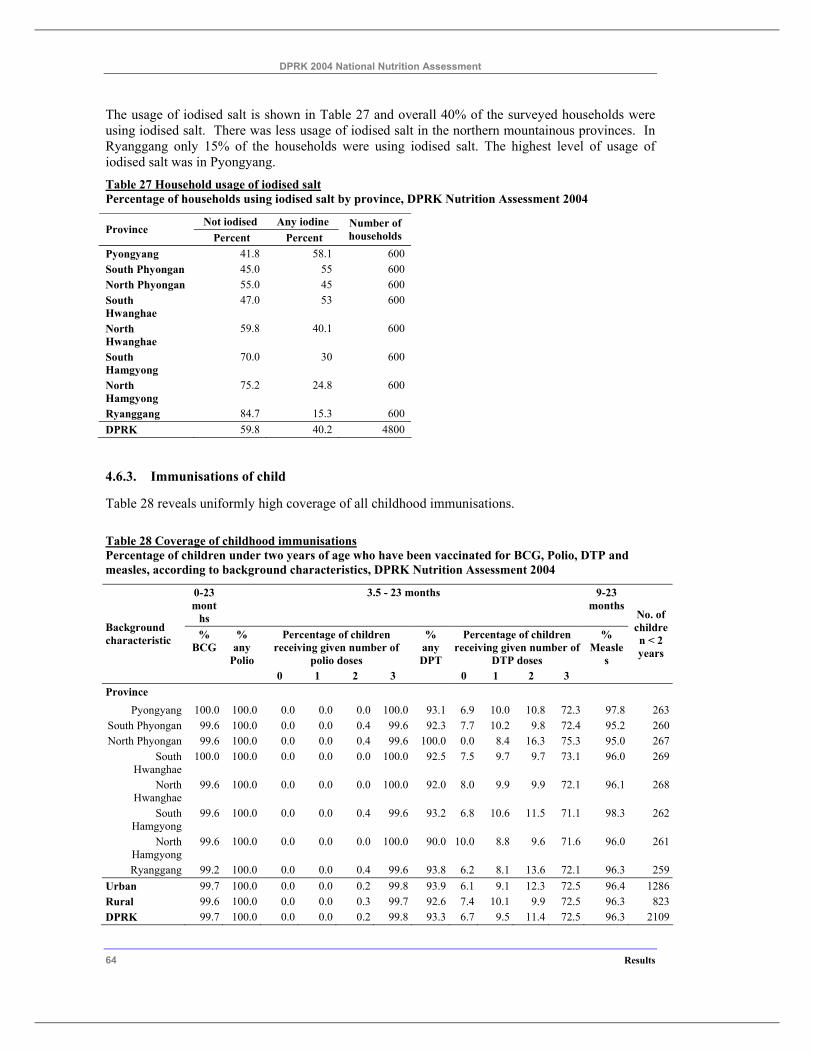
DPRK 2004 National Nutrition Assessment
64 Results
The usage of iodised salt is shown in Table 27 and overall 40% of the surveyed households were using iodised salt. There was less usage of iodised salt in the northern mountainous provinces. In Ryanggang only 15% of the households were using iodised salt. The highest level of usage of iodised salt was in Pyongyang. Table 27 Household usage of iodised salt Percentage of households using iodised salt by province, DPRK Nutrition Assessment 2004
Not iodised Any iodine Province
Percent Percent Number of households
Pyongyang 41.8 58.1 600 South Phyongan 45.0 55 600 North Phyongan 55.0 45 600 South Hwanghae
47.0 53 600
North Hwanghae
59.8 40.1 600
South Hamgyong
70.0 30 600
North Hamgyong
75.2 24.8 600
Ryanggang 84.7 15.3 600 DPRK 59.8 40.2 4800
4.6.3. Immunisations of child
Table 28 reveals uniformly high coverage of all childhood immunisations.
Table 28 Coverage of childhood immunisations Percentage of children under two years of age who have been vaccinated for BCG, Polio, DTP and measles, according to background characteristics, DPRK Nutrition Assessment 2004
0-23 mont
hs
3.5 - 23 months 9-23 months
% BCG
% any
Polio
Percentage of children receiving given number of
polio doses
% any DPT
Percentage of children receiving given number of
DTP doses
% Measle
s
Background characteristic
0 1 2 3 0 1 2 3
No. of children < 2 years
Province Pyongyang 100.0 100.0 0.0 0.0 0.0 100.0 93.1 6.9 10.0 10.8 72.3 97.8 263
South Phyongan 99.6 100.0 0.0 0.0 0.4 99.6 92.3 7.7 10.2 9.8 72.4 95.2 260North Phyongan 99.6 100.0 0.0 0.0 0.4 99.6 100.0 0.0 8.4 16.3 75.3 95.0 267
South Hwanghae
100.0 100.0 0.0 0.0 0.0 100.0 92.5 7.5 9.7 9.7 73.1 96.0 269
North Hwanghae
99.6 100.0 0.0 0.0 0.0 100.0 92.0 8.0 9.9 9.9 72.1 96.1 268
South Hamgyong
99.6 100.0 0.0 0.0 0.4 99.6 93.2 6.8 10.6 11.5 71.1 98.3 262
North Hamgyong
99.6 100.0 0.0 0.0 0.0 100.0 90.0 10.0 8.8 9.6 71.6 96.0 261
Ryanggang 99.2 100.0 0.0 0.0 0.4 99.6 93.8 6.2 8.1 13.6 72.1 96.3 259Urban 99.7 100.0 0.0 0.0 0.2 99.8 93.9 6.1 9.1 12.3 72.5 96.4 1286Rural 99.6 100.0 0.0 0.0 0.3 99.7 92.6 7.4 10.1 9.9 72.5 96.3 823DPRK 99.7 100.0 0.0 0.0 0.2 99.8 93.3 6.7 9.5 11.4 72.5 96.3 2109
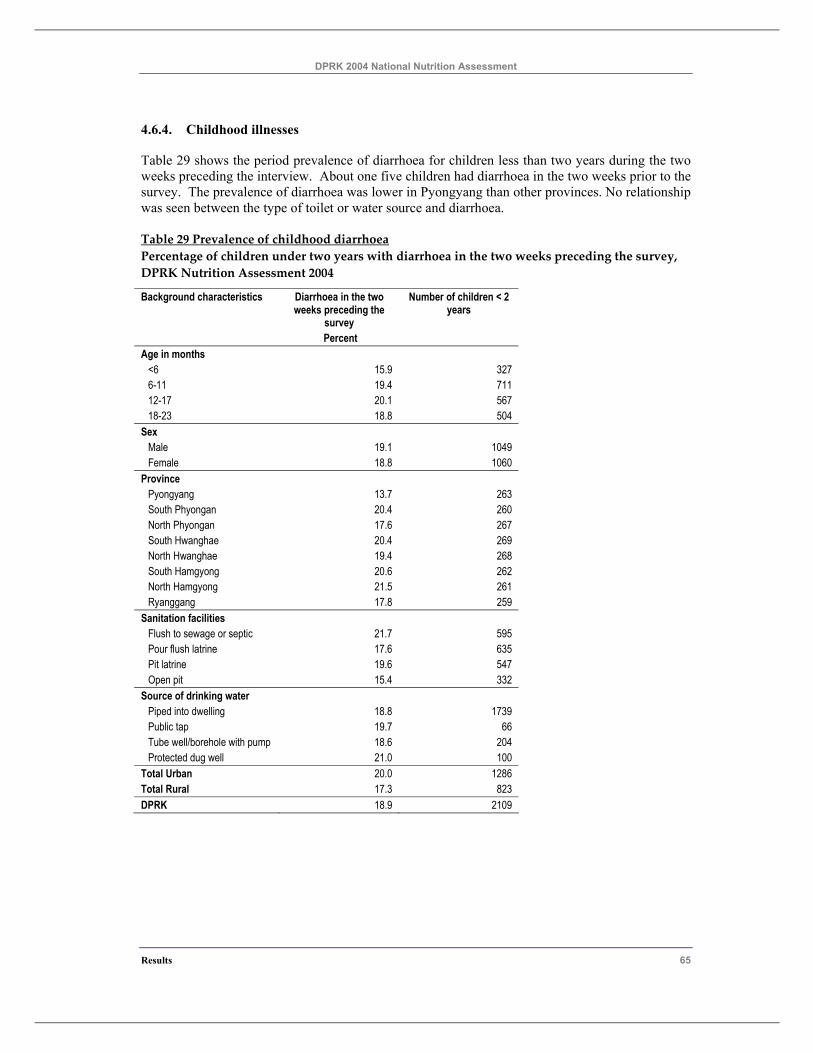
DPRK 2004 National Nutrition Assessment
Results 65
4.6.4. Childhood illnesses
Table 29 shows the period prevalence of diarrhoea for children less than two years during the two weeks preceding the interview. About one five children had diarrhoea in the two weeks prior to the survey. The prevalence of diarrhoea was lower in Pyongyang than other provinces. No relationship was seen between the type of toilet or water source and diarrhoea.
Table 29 Prevalence of childhood diarrhoea Percentage of children under two years with diarrhoea in the two weeks preceding the survey, DPRK Nutrition Assessment 2004
Background characteristics Diarrhoea in the two weeks preceding the
survey
Number of children < 2 years
Percent Age in months
<6 15.9 327 6-11 19.4 711 12-17 20.1 567 18-23 18.8 504
Sex Male 19.1 1049 Female 18.8 1060
Province Pyongyang 13.7 263 South Phyongan 20.4 260 North Phyongan 17.6 267 South Hwanghae 20.4 269 North Hwanghae 19.4 268 South Hamgyong 20.6 262 North Hamgyong 21.5 261 Ryanggang 17.8 259
Sanitation facilities Flush to sewage or septic 21.7 595 Pour flush latrine 17.6 635 Pit latrine 19.6 547 Open pit 15.4 332
Source of drinking water Piped into dwelling 18.8 1739 Public tap 19.7 66 Tube well/borehole with pump 18.6 204 Protected dug well 21.0 100
Total Urban 20.0 1286 Total Rural 17.3 823 DPRK 18.9 2109
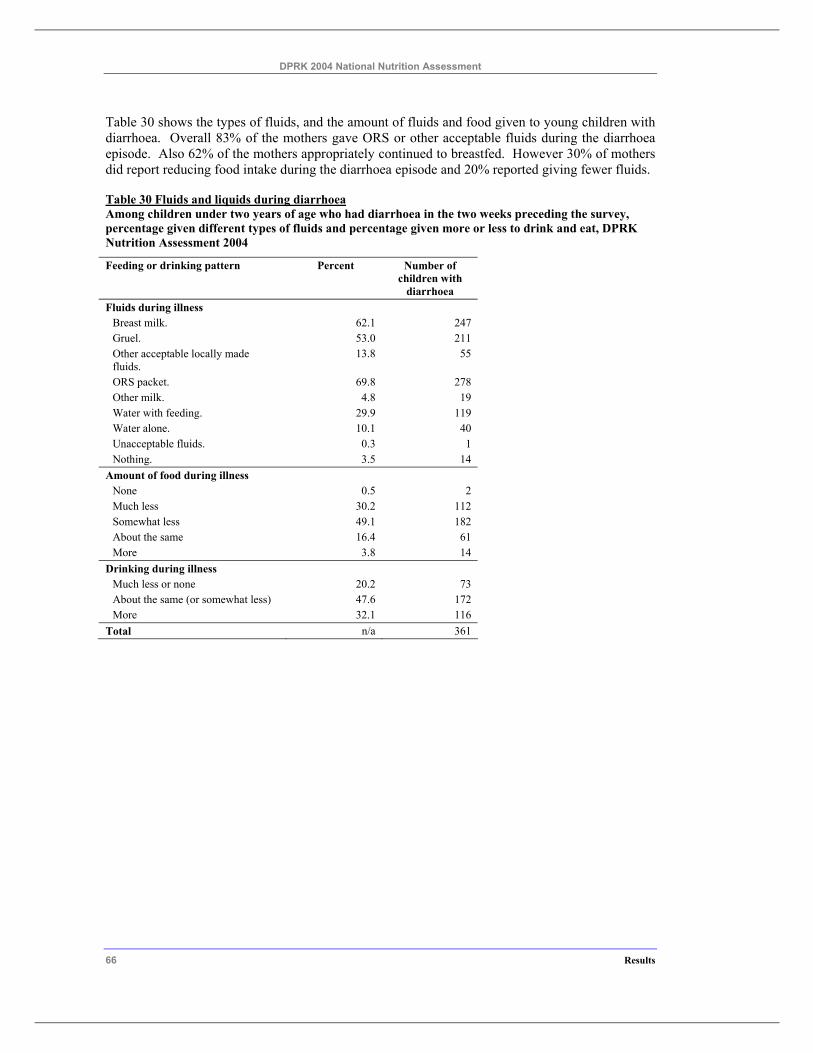
DPRK 2004 National Nutrition Assessment
66 Results
Table 30 shows the types of fluids, and the amount of fluids and food given to young children with diarrhoea. Overall 83% of the mothers gave ORS or other acceptable fluids during the diarrhoea episode. Also 62% of the mothers appropriately continued to breastfed. However 30% of mothers did report reducing food intake during the diarrhoea episode and 20% reported giving fewer fluids.
Table 30 Fluids and liquids during diarrhoea Among children under two years of age who had diarrhoea in the two weeks preceding the survey, percentage given different types of fluids and percentage given more or less to drink and eat, DPRK Nutrition Assessment 2004
Feeding or drinking pattern Percent Number of children with
diarrhoea Fluids during illness
Breast milk. 62.1 247 Gruel. 53.0 211 Other acceptable locally made fluids.
13.8 55
ORS packet. 69.8 278 Other milk. 4.8 19 Water with feeding. 29.9 119 Water alone. 10.1 40 Unacceptable fluids. 0.3 1 Nothing. 3.5 14
Amount of food during illness None 0.5 2 Much less 30.2 112 Somewhat less 49.1 182 About the same 16.4 61 More 3.8 14
Drinking during illness Much less or none 20.2 73 About the same (or somewhat less) 47.6 172 More 32.1 116
Total n/a 361
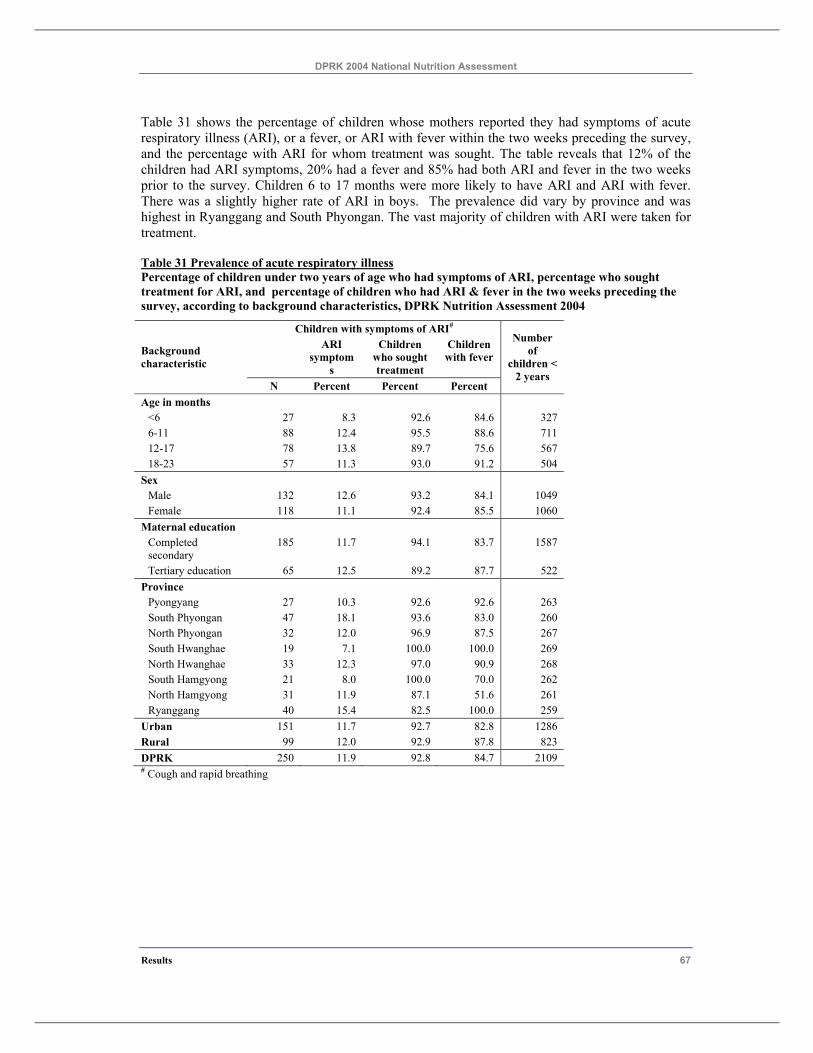
DPRK 2004 National Nutrition Assessment
Results 67
Table 31 shows the percentage of children whose mothers reported they had symptoms of acute respiratory illness (ARI), or a fever, or ARI with fever within the two weeks preceding the survey, and the percentage with ARI for whom treatment was sought. The table reveals that 12% of the children had ARI symptoms, 20% had a fever and 85% had both ARI and fever in the two weeks prior to the survey. Children 6 to 17 months were more likely to have ARI and ARI with fever. There was a slightly higher rate of ARI in boys. The prevalence did vary by province and was highest in Ryanggang and South Phyongan. The vast majority of children with ARI were taken for treatment.
Table 31 Prevalence of acute respiratory illness Percentage of children under two years of age who had symptoms of ARI, percentage who sought treatment for ARI, and percentage of children who had ARI & fever in the two weeks preceding the survey, according to background characteristics, DPRK Nutrition Assessment 2004
Children with symptoms of ARI# ARI
symptoms
Children who sought treatment
Children with fever Background
characteristic
N Percent Percent Percent
Number of
children < 2 years
Age in months <6 27 8.3 92.6 84.6 327 6-11 88 12.4 95.5 88.6 711 12-17 78 13.8 89.7 75.6 567 18-23 57 11.3 93.0 91.2 504
Sex Male 132 12.6 93.2 84.1 1049 Female 118 11.1 92.4 85.5 1060
Maternal education Completed secondary
185 11.7 94.1 83.7 1587
Tertiary education 65 12.5 89.2 87.7 522 Province
Pyongyang 27 10.3 92.6 92.6 263 South Phyongan 47 18.1 93.6 83.0 260 North Phyongan 32 12.0 96.9 87.5 267 South Hwanghae 19 7.1 100.0 100.0 269 North Hwanghae 33 12.3 97.0 90.9 268 South Hamgyong 21 8.0 100.0 70.0 262 North Hamgyong 31 11.9 87.1 51.6 261 Ryanggang 40 15.4 82.5 100.0 259
Urban 151 11.7 92.7 82.8 1286 Rural 99 12.0 92.9 87.8 823 DPRK 250 11.9 92.8 84.7 2109 # Cough and rapid breathing
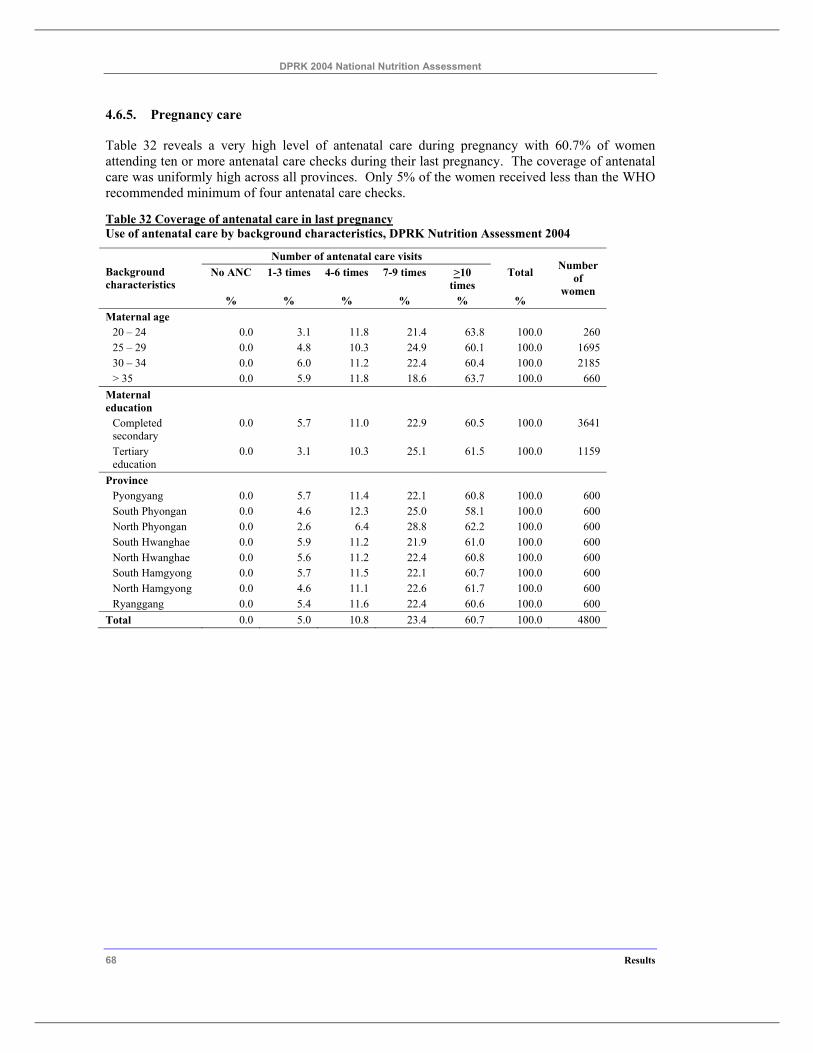
DPRK 2004 National Nutrition Assessment
68 Results
4.6.5. Pregnancy care
Table 32 reveals a very high level of antenatal care during pregnancy with 60.7% of women attending ten or more antenatal care checks during their last pregnancy. The coverage of antenatal care was uniformly high across all provinces. Only 5% of the women received less than the WHO recommended minimum of four antenatal care checks.
Table 32 Coverage of antenatal care in last pregnancy Use of antenatal care by background characteristics, DPRK Nutrition Assessment 2004
Number of antenatal care visits No ANC 1-3 times 4-6 times 7-9 times >10
times Total Background
characteristics % % % % % %
Number of
women
Maternal age 20 – 24 0.0 3.1 11.8 21.4 63.8 100.0 260 25 – 29 0.0 4.8 10.3 24.9 60.1 100.0 1695 30 – 34 0.0 6.0 11.2 22.4 60.4 100.0 2185 > 35 0.0 5.9 11.8 18.6 63.7 100.0 660
Maternal education
Completed secondary
0.0 5.7 11.0 22.9 60.5 100.0 3641
Tertiary education
0.0 3.1 10.3 25.1 61.5 100.0 1159
Province Pyongyang 0.0 5.7 11.4 22.1 60.8 100.0 600 South Phyongan 0.0 4.6 12.3 25.0 58.1 100.0 600 North Phyongan 0.0 2.6 6.4 28.8 62.2 100.0 600 South Hwanghae 0.0 5.9 11.2 21.9 61.0 100.0 600 North Hwanghae 0.0 5.6 11.2 22.4 60.8 100.0 600 South Hamgyong 0.0 5.7 11.5 22.1 60.7 100.0 600 North Hamgyong 0.0 4.6 11.1 22.6 61.7 100.0 600 Ryanggang 0.0 5.4 11.6 22.4 60.6 100.0 600
Total 0.0 5.0 10.8 23.4 60.7 100.0 4800
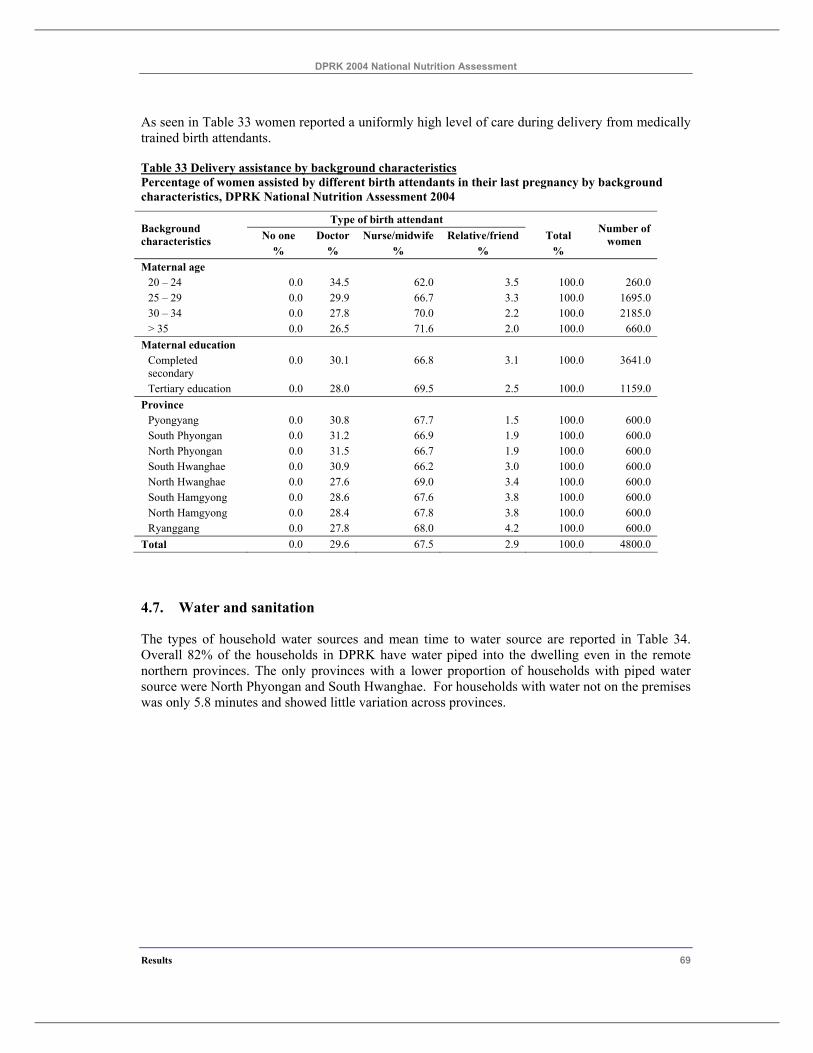
DPRK 2004 National Nutrition Assessment
Results 69
As seen in Table 33 women reported a uniformly high level of care during delivery from medically trained birth attendants.
Table 33 Delivery assistance by background characteristics Percentage of women assisted by different birth attendants in their last pregnancy by background characteristics, DPRK National Nutrition Assessment 2004
Type of birth attendant No one Doctor Nurse/midwife Relative/friend Total Background
characteristics % % % % %
Number of women
Maternal age 20 – 24 0.0 34.5 62.0 3.5 100.0 260.0 25 – 29 0.0 29.9 66.7 3.3 100.0 1695.0 30 – 34 0.0 27.8 70.0 2.2 100.0 2185.0 > 35 0.0 26.5 71.6 2.0 100.0 660.0
Maternal education Completed secondary
0.0 30.1 66.8 3.1 100.0 3641.0
Tertiary education 0.0 28.0 69.5 2.5 100.0 1159.0 Province
Pyongyang 0.0 30.8 67.7 1.5 100.0 600.0 South Phyongan 0.0 31.2 66.9 1.9 100.0 600.0 North Phyongan 0.0 31.5 66.7 1.9 100.0 600.0 South Hwanghae 0.0 30.9 66.2 3.0 100.0 600.0 North Hwanghae 0.0 27.6 69.0 3.4 100.0 600.0 South Hamgyong 0.0 28.6 67.6 3.8 100.0 600.0 North Hamgyong 0.0 28.4 67.8 3.8 100.0 600.0 Ryanggang 0.0 27.8 68.0 4.2 100.0 600.0
Total 0.0 29.6 67.5 2.9 100.0 4800.0
4.7. Water and sanitation
The types of household water sources and mean time to water source are reported in Table 34. Overall 82% of the households in DPRK have water piped into the dwelling even in the remote northern provinces. The only provinces with a lower proportion of households with piped water source were North Phyongan and South Hwanghae. For households with water not on the premises was only 5.8 minutes and showed little variation across provinces.
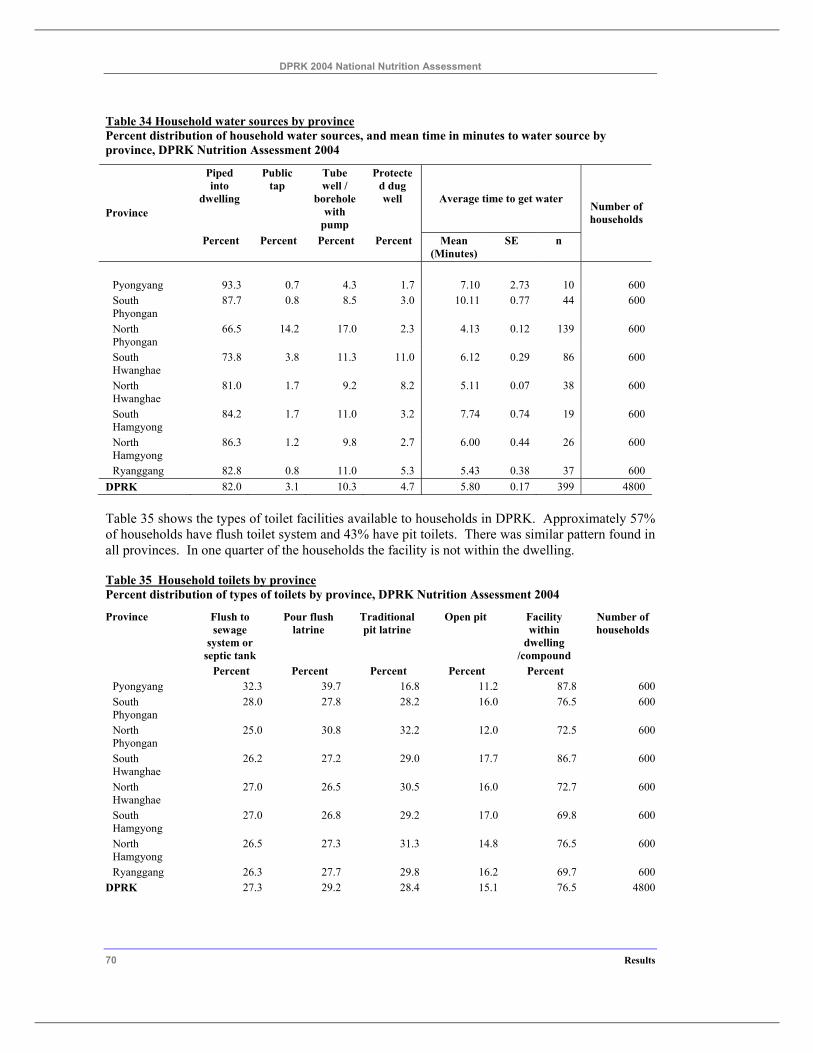
DPRK 2004 National Nutrition Assessment
70 Results
Table 34 Household water sources by province Percent distribution of household water sources, and mean time in minutes to water source by province, DPRK Nutrition Assessment 2004
Piped into
dwelling
Public tap
Tube well /
borehole with
pump
Protected dug well Average time to get water
Province
Percent Percent Percent Percent Mean (Minutes)
SE n
Number of households
Pyongyang 93.3 0.7 4.3 1.7 7.10 2.73 10 600 South Phyongan
87.7 0.8 8.5 3.0 10.11 0.77 44 600
North Phyongan
66.5 14.2 17.0 2.3 4.13 0.12 139 600
South Hwanghae
73.8 3.8 11.3 11.0 6.12 0.29 86 600
North Hwanghae
81.0 1.7 9.2 8.2 5.11 0.07 38 600
South Hamgyong
84.2 1.7 11.0 3.2 7.74 0.74 19 600
North Hamgyong
86.3 1.2 9.8 2.7 6.00 0.44 26 600
Ryanggang 82.8 0.8 11.0 5.3 5.43 0.38 37 600 DPRK 82.0 3.1 10.3 4.7 5.80 0.17 399 4800
Table 35 shows the types of toilet facilities available to households in DPRK. Approximately 57% of households have flush toilet system and 43% have pit toilets. There was similar pattern found in all provinces. In one quarter of the households the facility is not within the dwelling.
Table 35 Household toilets by province Percent distribution of types of toilets by province, DPRK Nutrition Assessment 2004
Province Flush to sewage
system or septic tank
Pour flush latrine
Traditional pit latrine
Open pit Facility within
dwelling /compound
Number of households
Percent Percent Percent Percent Percent Pyongyang 32.3 39.7 16.8 11.2 87.8 600 South Phyongan
28.0 27.8 28.2 16.0 76.5 600
North Phyongan
25.0 30.8 32.2 12.0 72.5 600
South Hwanghae
26.2 27.2 29.0 17.7 86.7 600
North Hwanghae
27.0 26.5 30.5 16.0 72.7 600
South Hamgyong
27.0 26.8 29.2 17.0 69.8 600
North Hamgyong
26.5 27.3 31.3 14.8 76.5 600
Ryanggang 26.3 27.7 29.8 16.2 69.7 600 DPRK 27.3 29.2 28.4 15.1 76.5 4800
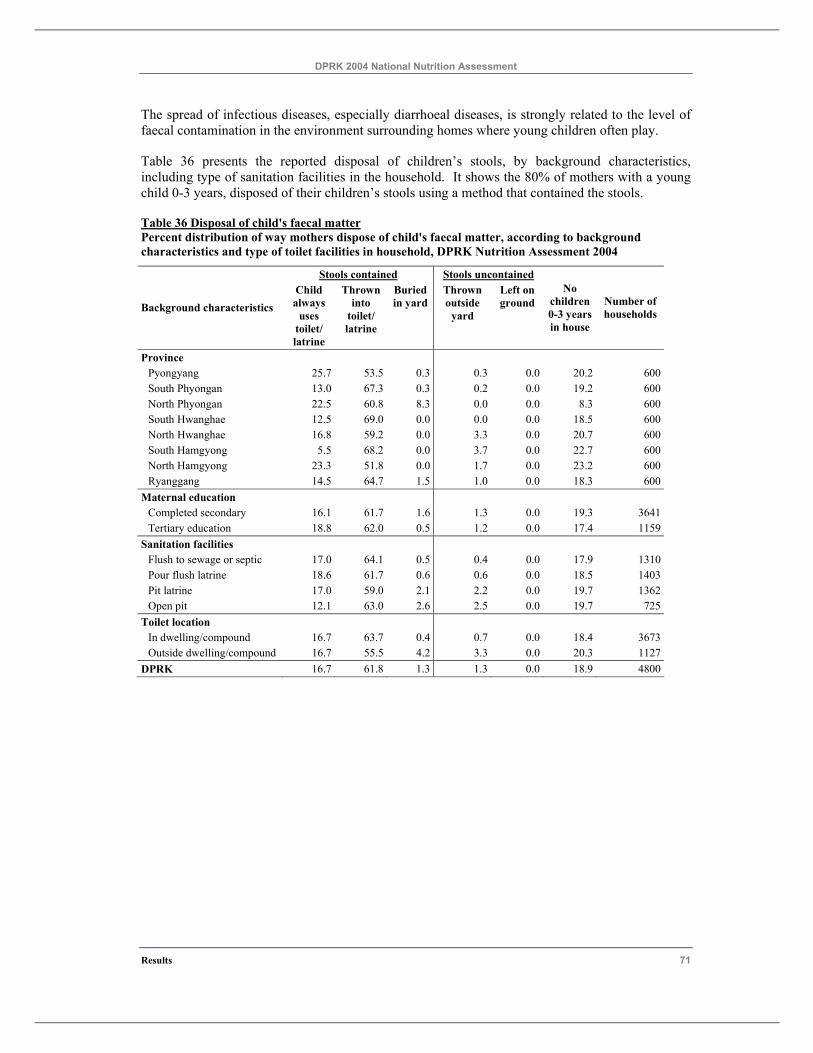
DPRK 2004 National Nutrition Assessment
Results 71
The spread of infectious diseases, especially diarrhoeal diseases, is strongly related to the level of faecal contamination in the environment surrounding homes where young children often play.
Table 36 presents the reported disposal of children’s stools, by background characteristics, including type of sanitation facilities in the household. It shows the 80% of mothers with a young child 0-3 years, disposed of their children’s stools using a method that contained the stools.
Table 36 Disposal of child's faecal matter Percent distribution of way mothers dispose of child's faecal matter, according to background characteristics and type of toilet facilities in household, DPRK Nutrition Assessment 2004
Stools contained Stools uncontained
Background characteristics Child always
uses toilet/ latrine
Thrown into
toilet/ latrine
Buried in yard
Thrown outside
yard
Left on ground
No children 0-3 years in house
Number of households
Province Pyongyang 25.7 53.5 0.3 0.3 0.0 20.2 600South Phyongan 13.0 67.3 0.3 0.2 0.0 19.2 600North Phyongan 22.5 60.8 8.3 0.0 0.0 8.3 600South Hwanghae 12.5 69.0 0.0 0.0 0.0 18.5 600North Hwanghae 16.8 59.2 0.0 3.3 0.0 20.7 600South Hamgyong 5.5 68.2 0.0 3.7 0.0 22.7 600North Hamgyong 23.3 51.8 0.0 1.7 0.0 23.2 600Ryanggang 14.5 64.7 1.5 1.0 0.0 18.3 600
Maternal education Completed secondary 16.1 61.7 1.6 1.3 0.0 19.3 3641Tertiary education 18.8 62.0 0.5 1.2 0.0 17.4 1159
Sanitation facilities Flush to sewage or septic 17.0 64.1 0.5 0.4 0.0 17.9 1310Pour flush latrine 18.6 61.7 0.6 0.6 0.0 18.5 1403Pit latrine 17.0 59.0 2.1 2.2 0.0 19.7 1362Open pit 12.1 63.0 2.6 2.5 0.0 19.7 725
Toilet location In dwelling/compound 16.7 63.7 0.4 0.7 0.0 18.4 3673Outside dwelling/compound 16.7 55.5 4.2 3.3 0.0 20.3 1127
DPRK 16.7 61.8 1.3 1.3 0.0 18.9 4800
DPRK 2004 National Nutrition Assessment
72 Results
5 Conclusions and Recommendations DPRK has achieved some improvement maternal and child nutrition during the last two years, in collaboration with the international organisations.
This can be seen from the decline in the childhood malnutrition since 2002. Stunting in children 0-71 months in DPRK has fallen by 2.9% from 2002 to 2004. This is an average decline of stunting prevalence of 1.45% per year. The improvements have been greatest in children 12 to 35 months where there was a 30% relative decline in the rate of stunting between 2002 and 2004. However in 2004 there still remained malnutrition of children 0-71 months with 37% stunted, 23% underweight and 7% wasted.
Childhood malnutrition was found to be associated with maternal malnutrition and with birth size. These findings, together with the lack of progress infant malnutrition, suggest the need for more programs to prevent maternal malnutrition in pregnancy. The well developed maternal pregnancy care system in DPRK provides an ideal opportunity for delivering these interventions.
Higher levels of household consumption of rice and rice products, poultry or meat, red or yellow vegetables, and oils and fats were associated with reduced childhood malnutrition. These findings highlight the importance of continued food assistance to ensure ongoing improvements in child nutritional status.
There were small improvements in maternal nutritional status between the 2002 and 2004 assessments mainly for women 25 to 34 years, but nearly one in three women with young children were malnourished and had anaemia. Further focuses are needed to accelerate the improvement in nutritional status of women of reproductive age and interventions such as micronutrient supplements and communications about healthy diet are especially needed for pregnant and lactating women, which have already started.
Future surveys need to use methodologies that will allow the results to be compared with past surveys, but also gather more information for developing national nutrition policies. Specific recommendations for the design of future studies include: sampling using the standard methods recommended by UNICEF for MICS surveys, measuring all preschool aged children in the house, conducting interviews and taking measurements at home at least for children less than six months of age. Also more attention must be paid to the preparations for future nutrition assessments such as the survey design methodology and appropriate training.
And for more policy relevant information further analyses of the 2004 nutrition assessment data would be required including extensive examination of the food consumption data and the factors associated with child and maternal malnutrition and anaemia.
DPRK 2004 National Nutrition Assessment
Conclusions and Recommendations 73
6 References
WHO (World Health Organisation). Indicators for assessing breast-feeding practices. 1991. Geneva, Switzerland, WHO.
WHO (World Health Organisation). Physical Status: The use and interpretation of anthropometry. Geneva: World Health Organisation, 1995.
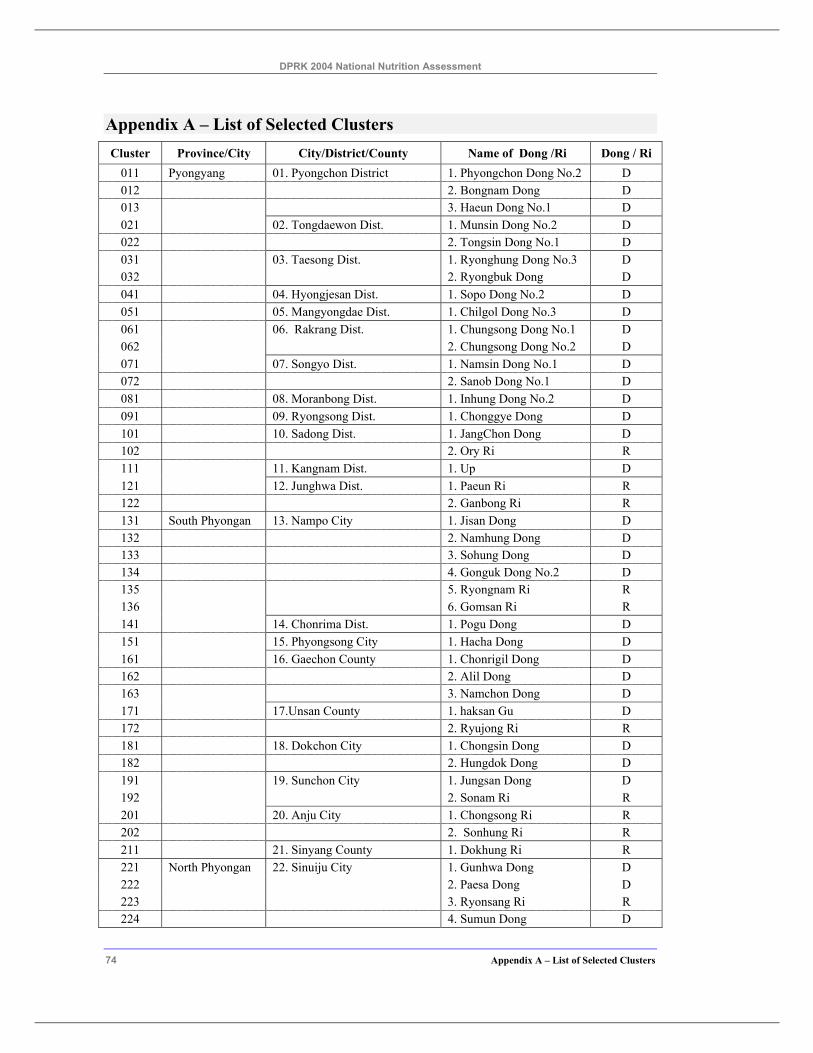
DPRK 2004 National Nutrition Assessment
74 Appendix A – List of Selected Clusters
Appendix A – List of Selected Clusters Cluster Province/City City/District/County Name of Dong /Ri Dong / Ri
011 Pyongyang 01. Pyongchon District 1. Phyongchon Dong No.2 D 012 2. Bongnam Dong D 013 3. Haeun Dong No.1 D 021 02. Tongdaewon Dist. 1. Munsin Dong No.2 D 022 2. Tongsin Dong No.1 D 031 03. Taesong Dist. 1. Ryonghung Dong No.3 D 032 2. Ryongbuk Dong D 041 04. Hyongjesan Dist. 1. Sopo Dong No.2 D 051 05. Mangyongdae Dist. 1. Chilgol Dong No.3 D 061 06. Rakrang Dist. 1. Chungsong Dong No.1 D 062 2. Chungsong Dong No.2 D 071 07. Songyo Dist. 1. Namsin Dong No.1 D 072 2. Sanob Dong No.1 D 081 08. Moranbong Dist. 1. Inhung Dong No.2 D 091 09. Ryongsong Dist. 1. Chonggye Dong D 101 10. Sadong Dist. 1. JangChon Dong D 102 2. Ory Ri R 111 11. Kangnam Dist. 1. Up D 121 12. Junghwa Dist. 1. Paeun Ri R 122 2. Ganbong Ri R 131 South Phyongan 13. Nampo City 1. Jisan Dong D 132 2. Namhung Dong D 133 3. Sohung Dong D 134 4. Gonguk Dong No.2 D 135 5. Ryongnam Ri R 136 6. Gomsan Ri R 141 14. Chonrima Dist. 1. Pogu Dong D 151 15. Phyongsong City 1. Hacha Dong D 161 16. Gaechon County 1. Chonrigil Dong D 162 2. Alil Dong D 163 3. Namchon Dong D 171 17.Unsan County 1. haksan Gu D 172 2. Ryujong Ri R 181 18. Dokchon City 1. Chongsin Dong D 182 2. Hungdok Dong D 191 19. Sunchon City 1. Jungsan Dong D 192 2. Sonam Ri R 201 20. Anju City 1. Chongsong Ri R 202 2. Sonhung Ri R 211 21. Sinyang County 1. Dokhung Ri R 221 North Phyongan 22. Sinuiju City 1. Gunhwa Dong D 222 2. Paesa Dong D 223 3. Ryonsang Ri R 224 4. Sumun Dong D
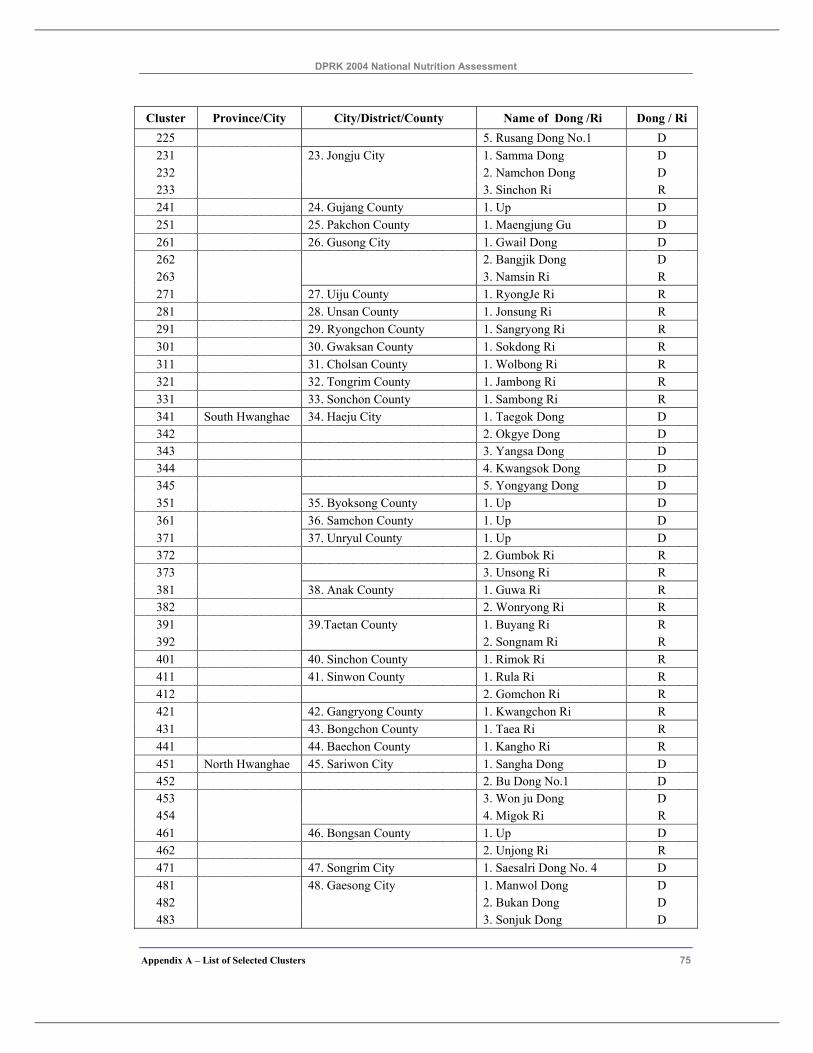
DPRK 2004 National Nutrition Assessment
Appendix A – List of Selected Clusters 75
Cluster Province/City City/District/County Name of Dong /Ri Dong / Ri 225 5. Rusang Dong No.1 D 231 23. Jongju City 1. Samma Dong D 232 2. Namchon Dong D 233 3. Sinchon Ri R 241 24. Gujang County 1. Up D 251 25. Pakchon County 1. Maengjung Gu D 261 26. Gusong City 1. Gwail Dong D 262 2. Bangjik Dong D 263 3. Namsin Ri R 271 27. Uiju County 1. RyongJe Ri R 281 28. Unsan County 1. Jonsung Ri R 291 29. Ryongchon County 1. Sangryong Ri R 301 30. Gwaksan County 1. Sokdong Ri R 311 31. Cholsan County 1. Wolbong Ri R 321 32. Tongrim County 1. Jambong Ri R 331 33. Sonchon County 1. Sambong Ri R 341 South Hwanghae 34. Haeju City 1. Taegok Dong D 342 2. Okgye Dong D 343 3. Yangsa Dong D 344 4. Kwangsok Dong D 345 5. Yongyang Dong D 351 35. Byoksong County 1. Up D 361 36. Samchon County 1. Up D 371 37. Unryul County 1. Up D 372 2. Gumbok Ri R 373 3. Unsong Ri R 381 38. Anak County 1. Guwa Ri R 382 2. Wonryong Ri R 391 39.Taetan County 1. Buyang Ri R 392 2. Songnam Ri R 401 40. Sinchon County 1. Rimok Ri R 411 41. Sinwon County 1. Rula Ri R 412 2. Gomchon Ri R 421 42. Gangryong County 1. Kwangchon Ri R 431 43. Bongchon County 1. Taea Ri R 441 44. Baechon County 1. Kangho Ri R 451 North Hwanghae 45. Sariwon City 1. Sangha Dong D 452 2. Bu Dong No.1 D 453 3. Won ju Dong D 454 4. Migok Ri R 461 46. Bongsan County 1. Up D 462 2. Unjong Ri R 471 47. Songrim City 1. Saesalri Dong No. 4 D 481 48. Gaesong City 1. Manwol Dong D 482 2. Bukan Dong D 483 3. Sonjuk Dong D
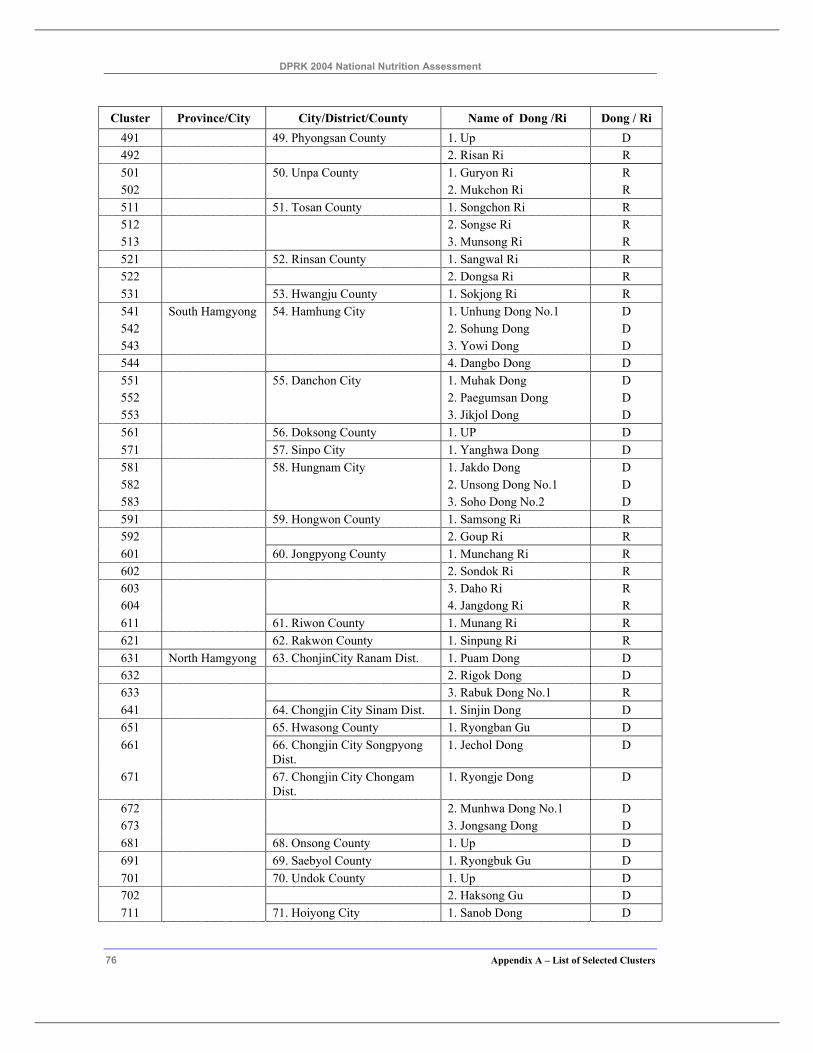
DPRK 2004 National Nutrition Assessment
76 Appendix A – List of Selected Clusters
Cluster Province/City City/District/County Name of Dong /Ri Dong / Ri 491 49. Phyongsan County 1. Up D 492 2. Risan Ri R 501 50. Unpa County 1. Guryon Ri R 502 2. Mukchon Ri R 511 51. Tosan County 1. Songchon Ri R 512 2. Songse Ri R 513 3. Munsong Ri R 521 52. Rinsan County 1. Sangwal Ri R 522 2. Dongsa Ri R 531 53. Hwangju County 1. Sokjong Ri R 541 South Hamgyong 54. Hamhung City 1. Unhung Dong No.1 D 542 2. Sohung Dong D 543 3. Yowi Dong D 544 4. Dangbo Dong D 551 55. Danchon City 1. Muhak Dong D 552 2. Paegumsan Dong D 553 3. Jikjol Dong D 561 56. Doksong County 1. UP D 571 57. Sinpo City 1. Yanghwa Dong D 581 58. Hungnam City 1. Jakdo Dong D 582 2. Unsong Dong No.1 D 583 3. Soho Dong No.2 D 591 59. Hongwon County 1. Samsong Ri R 592 2. Goup Ri R 601 60. Jongpyong County 1. Munchang Ri R 602 2. Sondok Ri R 603 3. Daho Ri R 604 4. Jangdong Ri R 611 61. Riwon County 1. Munang Ri R 621 62. Rakwon County 1. Sinpung Ri R 631 North Hamgyong 63. ChonjinCity Ranam Dist. 1. Puam Dong D 632 2. Rigok Dong D 633 3. Rabuk Dong No.1 R 641 64. Chongjin City Sinam Dist. 1. Sinjin Dong D 651 65. Hwasong County 1. Ryongban Gu D 661 66. Chongjin City Songpyong
Dist. 1. Jechol Dong D
671 67. Chongjin City Chongam Dist.
1. Ryongje Dong D
672 2. Munhwa Dong No.1 D 673 3. Jongsang Dong D 681 68. Onsong County 1. Up D 691 69. Saebyol County 1. Ryongbuk Gu D 701 70. Undok County 1. Up D 702 2. Haksong Gu D 711 71. Hoiyong City 1. Sanob Dong D
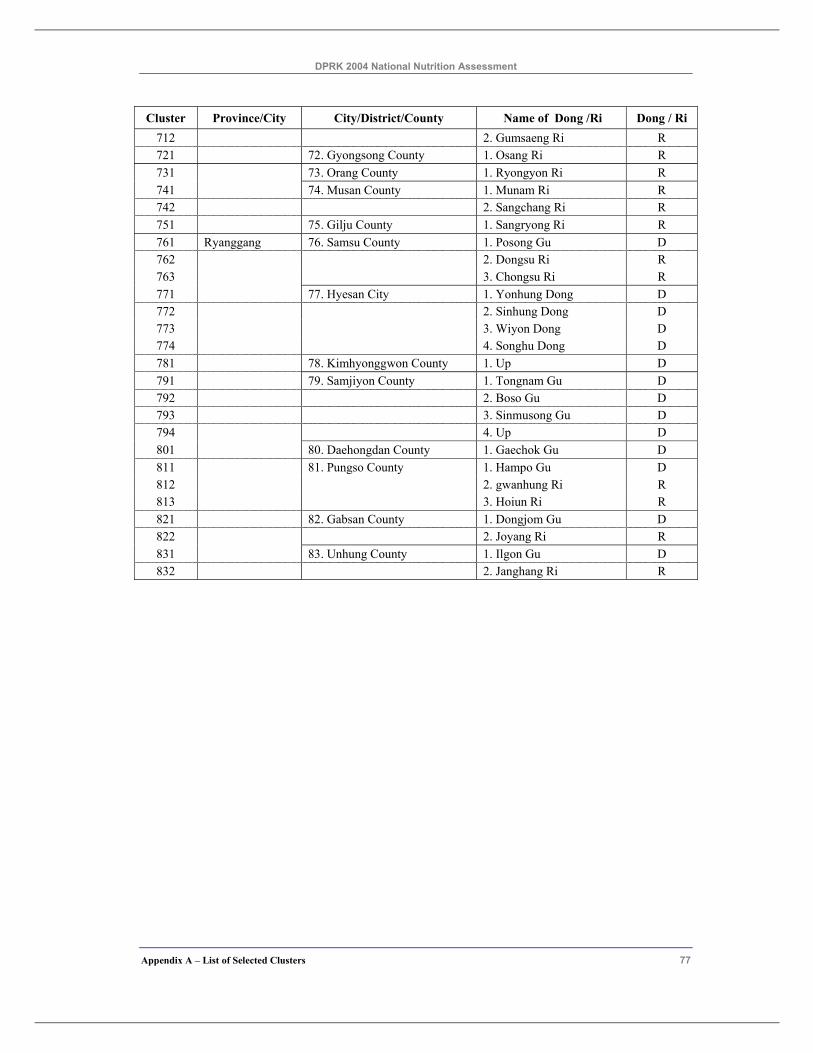
DPRK 2004 National Nutrition Assessment
Appendix A – List of Selected Clusters 77
Cluster Province/City City/District/County Name of Dong /Ri Dong / Ri 712 2. Gumsaeng Ri R 721 72. Gyongsong County 1. Osang Ri R 731 73. Orang County 1. Ryongyon Ri R 741 74. Musan County 1. Munam Ri R 742 2. Sangchang Ri R 751 75. Gilju County 1. Sangryong Ri R 761 Ryanggang 76. Samsu County 1. Posong Gu D 762 2. Dongsu Ri R 763 3. Chongsu Ri R 771 77. Hyesan City 1. Yonhung Dong D 772 2. Sinhung Dong D 773 3. Wiyon Dong D 774 4. Songhu Dong D 781 78. Kimhyonggwon County 1. Up D 791 79. Samjiyon County 1. Tongnam Gu D 792 2. Boso Gu D 793 3. Sinmusong Gu D 794 4. Up D 801 80. Daehongdan County 1. Gaechok Gu D 811 81. Pungso County 1. Hampo Gu D 812 2. gwanhung Ri R 813 3. Hoiun Ri R 821 82. Gabsan County 1. Dongjom Gu D 822 2. Joyang Ri R 831 83. Unhung County 1. Ilgon Gu D 832 2. Janghang Ri R
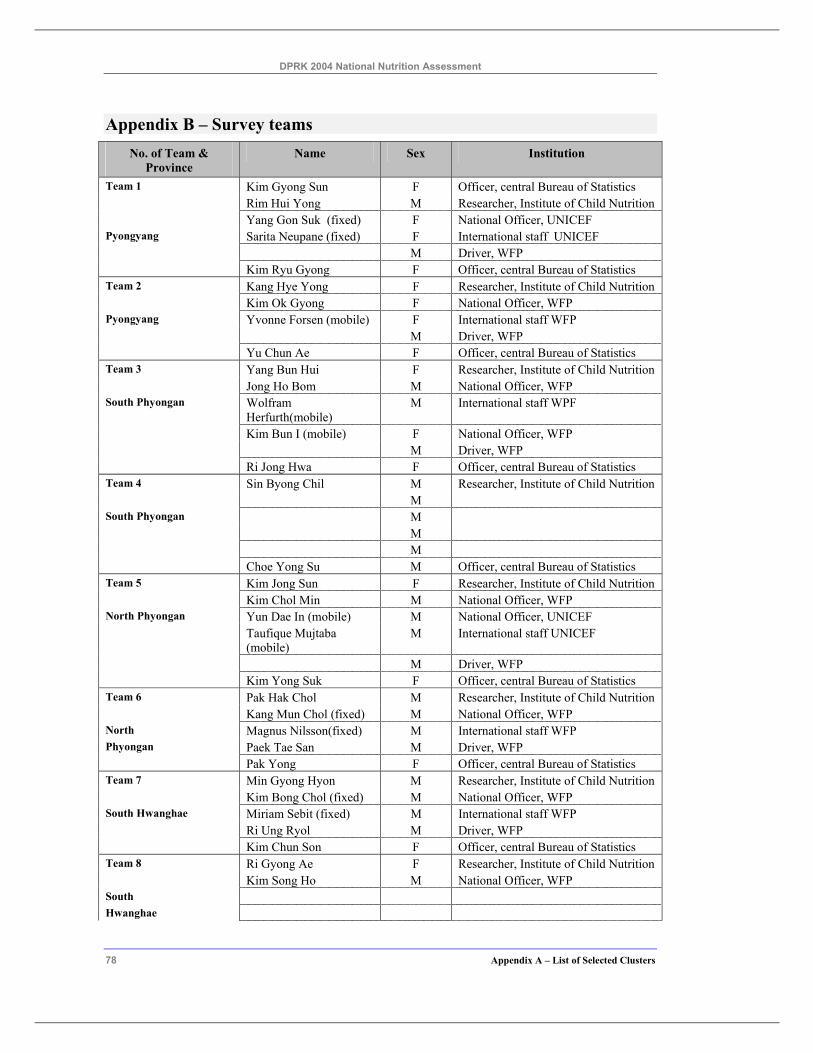
DPRK 2004 National Nutrition Assessment
78 Appendix A – List of Selected Clusters
Appendix B – Survey teams No. of Team &
Province Name Sex Institution
Team 1 Kim Gyong Sun F Officer, central Bureau of Statistics Rim Hui Yong M Researcher, Institute of Child Nutrition Yang Gon Suk (fixed) F National Officer, UNICEF Pyongyang Sarita Neupane (fixed) F International staff UNICEF M Driver, WFP Kim Ryu Gyong F Officer, central Bureau of Statistics Team 2 Kang Hye Yong F Researcher, Institute of Child Nutrition Kim Ok Gyong F National Officer, WFP Pyongyang Yvonne Forsen (mobile) F International staff WFP M Driver, WFP Yu Chun Ae F Officer, central Bureau of Statistics Team 3 Yang Bun Hui F Researcher, Institute of Child Nutrition Jong Ho Bom M National Officer, WFP South Phyongan Wolfram
Herfurth(mobile) M International staff WPF
Kim Bun I (mobile) F National Officer, WFP M Driver, WFP Ri Jong Hwa F Officer, central Bureau of Statistics Team 4 Sin Byong Chil M Researcher, Institute of Child Nutrition M South Phyongan M M M Choe Yong Su M Officer, central Bureau of Statistics Team 5 Kim Jong Sun F Researcher, Institute of Child Nutrition Kim Chol Min M National Officer, WFP North Phyongan Yun Dae In (mobile) M National Officer, UNICEF Taufique Mujtaba
(mobile) M International staff UNICEF
M Driver, WFP Kim Yong Suk F Officer, central Bureau of Statistics Team 6 Pak Hak Chol M Researcher, Institute of Child Nutrition Kang Mun Chol (fixed) M National Officer, WFP North Magnus Nilsson(fixed) M International staff WFP Phyongan Paek Tae San M Driver, WFP Pak Yong F Officer, central Bureau of Statistics Team 7 Min Gyong Hyon M Researcher, Institute of Child Nutrition Kim Bong Chol (fixed) M National Officer, WFP South Hwanghae Miriam Sebit (fixed) M International staff WFP Ri Ung Ryol M Driver, WFP Kim Chun Son F Officer, central Bureau of Statistics Team 8 Ri Gyong Ae F Researcher, Institute of Child Nutrition Kim Song Ho M National Officer, WFP South Hwanghae
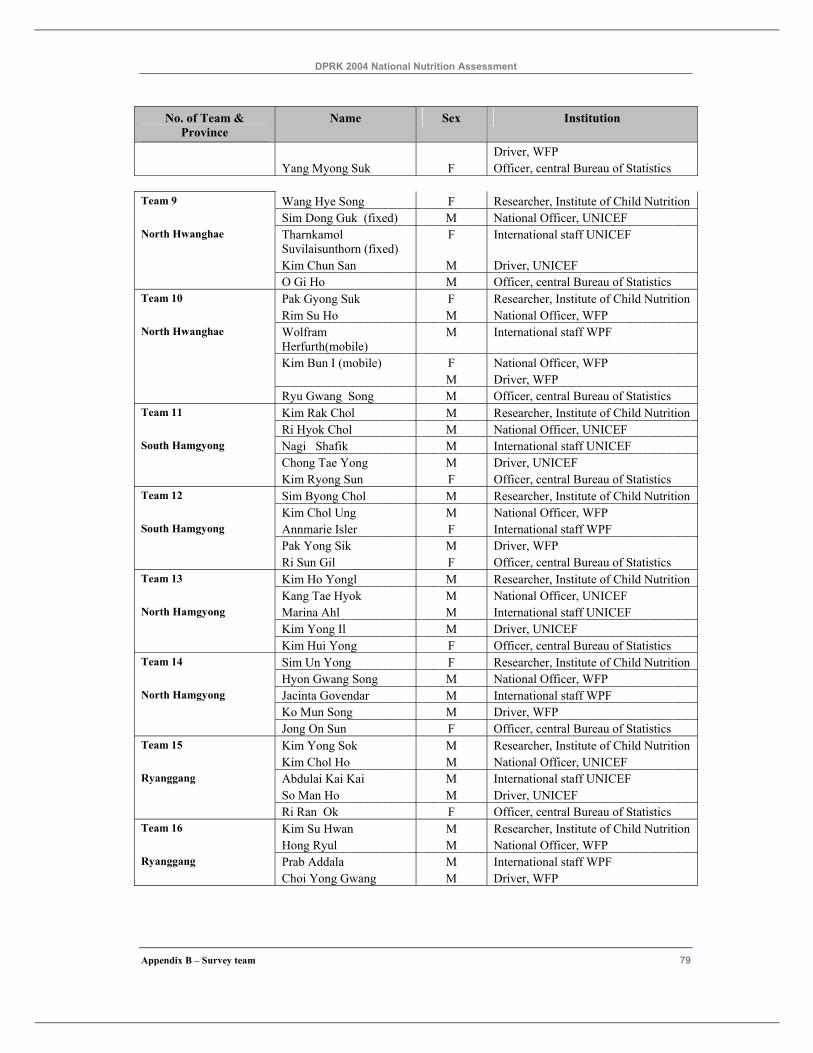
DPRK 2004 National Nutrition Assessment
Appendix B – Survey team 79
No. of Team & Province
Name Sex Institution
Driver, WFP Yang Myong Suk F Officer, central Bureau of Statistics Team 9 Wang Hye Song F Researcher, Institute of Child Nutrition Sim Dong Guk (fixed) M National Officer, UNICEF North Hwanghae Tharnkamol
Suvilaisunthorn (fixed) F International staff UNICEF
Kim Chun San M Driver, UNICEF O Gi Ho M Officer, central Bureau of Statistics Team 10 Pak Gyong Suk F Researcher, Institute of Child Nutrition Rim Su Ho M National Officer, WFP North Hwanghae Wolfram
Herfurth(mobile) M International staff WPF
Kim Bun I (mobile) F National Officer, WFP M Driver, WFP Ryu Gwang Song M Officer, central Bureau of Statistics Team 11 Kim Rak Chol M Researcher, Institute of Child Nutrition Ri Hyok Chol M National Officer, UNICEF South Hamgyong Nagi Shafik M International staff UNICEF Chong Tae Yong M Driver, UNICEF Kim Ryong Sun F Officer, central Bureau of Statistics Team 12 Sim Byong Chol M Researcher, Institute of Child Nutrition Kim Chol Ung M National Officer, WFP South Hamgyong Annmarie Isler F International staff WPF Pak Yong Sik M Driver, WFP Ri Sun Gil F Officer, central Bureau of Statistics Team 13 Kim Ho Yongl M Researcher, Institute of Child Nutrition Kang Tae Hyok M National Officer, UNICEF North Hamgyong Marina Ahl M International staff UNICEF Kim Yong Il M Driver, UNICEF Kim Hui Yong F Officer, central Bureau of Statistics Team 14 Sim Un Yong F Researcher, Institute of Child Nutrition Hyon Gwang Song M National Officer, WFP North Hamgyong Jacinta Govendar M International staff WPF Ko Mun Song M Driver, WFP Jong On Sun F Officer, central Bureau of Statistics Team 15 Kim Yong Sok M Researcher, Institute of Child Nutrition Kim Chol Ho M National Officer, UNICEF Ryanggang Abdulai Kai Kai M International staff UNICEF So Man Ho M Driver, UNICEF Ri Ran Ok F Officer, central Bureau of Statistics Team 16 Kim Su Hwan M Researcher, Institute of Child Nutrition Hong Ryul M National Officer, WFP Ryanggang Prab Addala M International staff WPF Choi Yong Gwang M Driver, WFP
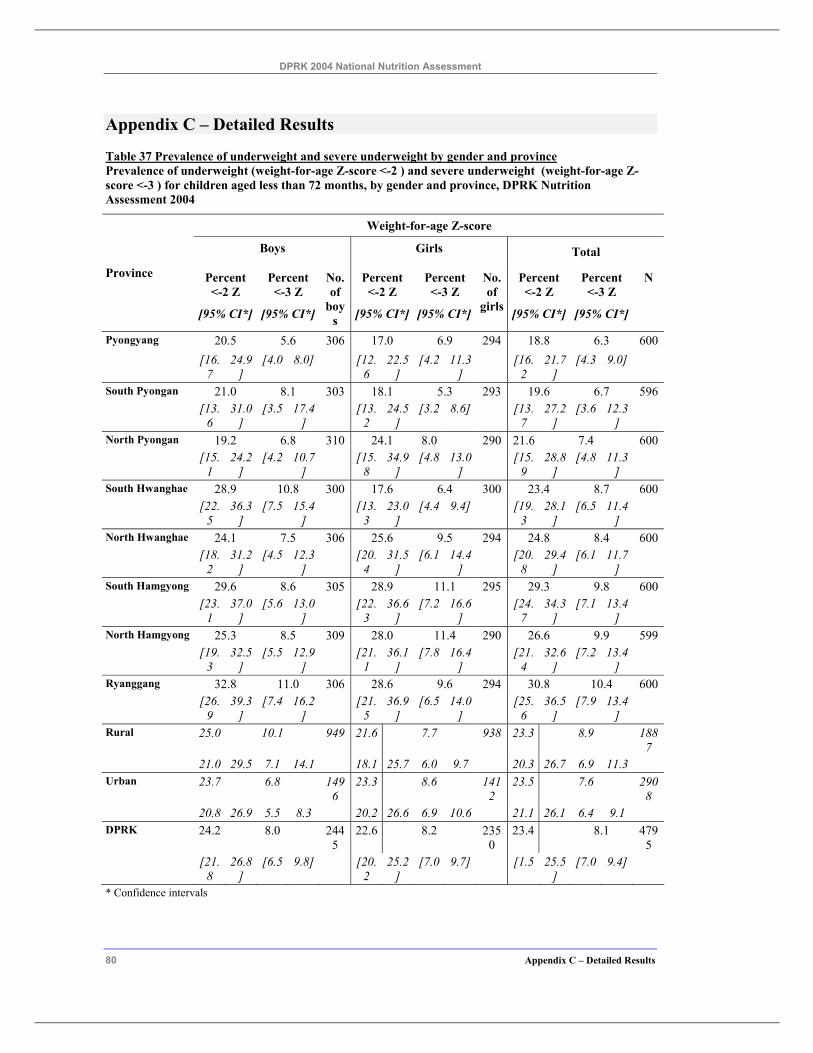
DPRK 2004 National Nutrition Assessment
80 Appendix C – Detailed Results
Appendix C – Detailed Results
Table 37 Prevalence of underweight and severe underweight by gender and province Prevalence of underweight (weight-for-age Z-score <-2 ) and severe underweight (weight-for-age Z-score <-3 ) for children aged less than 72 months, by gender and province, DPRK Nutrition Assessment 2004
Weight-for-age Z-score
Boys Girls Total
Percent <-2 Z
Percent <-3 Z
Percent <-2 Z
Percent <-3 Z
Percent <-2 Z
Percent <-3 Z
Province
[95% CI*] [95% CI*]
No. of
boys [95% CI*] [95% CI*]
No. of
girls [95% CI*] [95% CI*]
N
Pyongyang 20.5 5.6 306 17.0 6.9 294 18.8 6.3 600 [16.
7 24.9
] [4.0 8.0] [12.
6 22.5
] [4.2 11.3
] [16.
2 21.7
] [4.3 9.0]
South Pyongan 21.0 8.1 303 18.1 5.3 293 19.6 6.7 596 [13.
6 31.0
] [3.5 17.4
] [13.
2 24.5
] [3.2 8.6] [13.
7 27.2
] [3.6 12.3
]
North Pyongan 19.2 6.8 310 24.1 8.0 290 21.6 7.4 600 [15.
1 24.2
] [4.2 10.7
] [15.
8 34.9
] [4.8 13.0
] [15.
9 28.8
] [4.8 11.3
]
South Hwanghae 28.9 10.8 300 17.6 6.4 300 23.4 8.7 600 [22.
5 36.3
] [7.5 15.4
] [13.
3 23.0
] [4.4 9.4] [19.
3 28.1
] [6.5 11.4
]
North Hwanghae 24.1 7.5 306 25.6 9.5 294 24.8 8.4 600 [18.
2 31.2
] [4.5 12.3
] [20.
4 31.5
] [6.1 14.4
] [20.
8 29.4
] [6.1 11.7
]
South Hamgyong 29.6 8.6 305 28.9 11.1 295 29.3 9.8 600 [23.
1 37.0
] [5.6 13.0
] [22.
3 36.6
] [7.2 16.6
] [24.
7 34.3
] [7.1 13.4
]
North Hamgyong 25.3 8.5 309 28.0 11.4 290 26.6 9.9 599 [19.
3 32.5
] [5.5 12.9
] [21.
1 36.1
] [7.8 16.4
] [21.
4 32.6
] [7.2 13.4
]
Ryanggang 32.8 11.0 306 28.6 9.6 294 30.8 10.4 600 [26.
9 39.3
] [7.4 16.2
] [21.
5 36.9
] [6.5 14.0
] [25.
6 36.5
] [7.9 13.4
]
Rural 25.0 10.1 949 21.6 7.7 938 23.3 8.9 1887
21.0 29.5 7.1 14.1 18.1 25.7 6.0 9.7 20.3 26.7 6.9 11.3 Urban 23.7 6.8 149
6 23.3 8.6 141
2 23.5 7.6 290
8 20.8 26.9 5.5 8.3 20.2 26.6 6.9 10.6 21.1 26.1 6.4 9.1 DPRK 24.2 8.0 244
5 22.6 8.2 235
0 23.4 8.1 479
5 [21.
8 26.8
] [6.5 9.8] [20.
2 25.2
] [7.0 9.7] [1.5 25.5
] [7.0 9.4]
* Confidence intervals
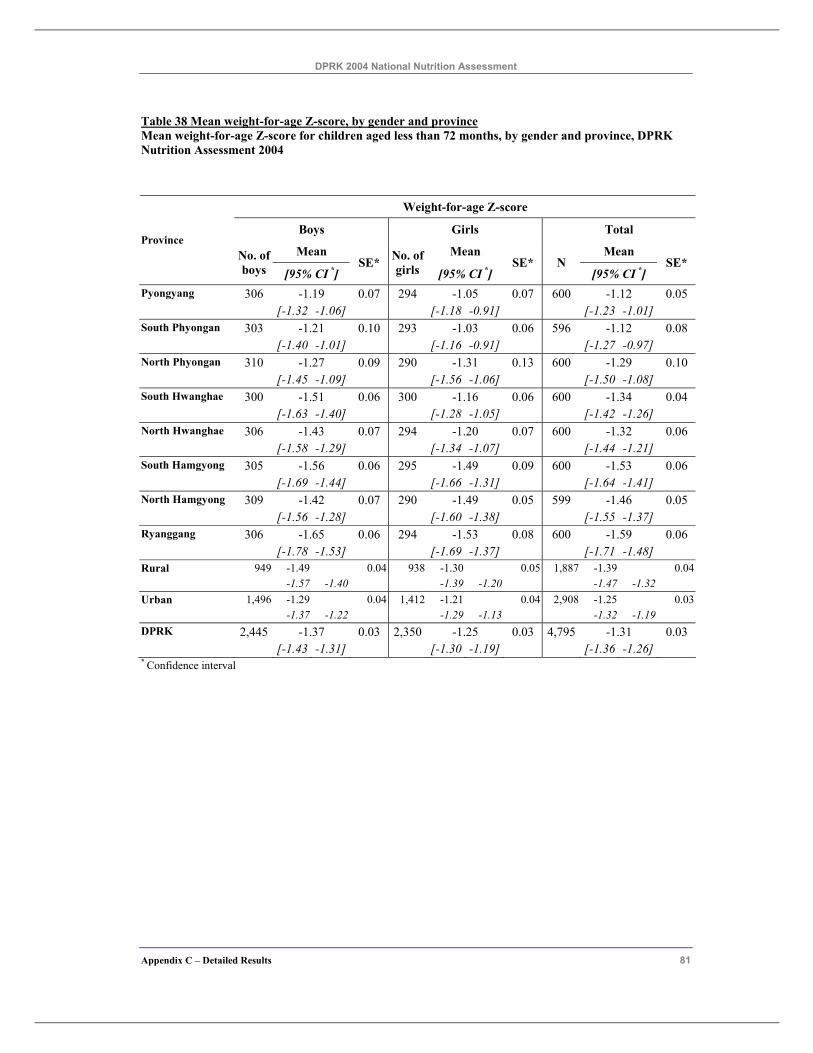
DPRK 2004 National Nutrition Assessment
Appendix C – Detailed Results 81
Table 38 Mean weight-for-age Z-score, by gender and province Mean weight-for-age Z-score for children aged less than 72 months, by gender and province, DPRK Nutrition Assessment 2004
Weight-for-age Z-score
Boys Girls Total
Mean Mean Mean Province
No. of boys [95% CI *]
SE* No. of girls [95% CI *]
SE* N [95% CI *]
SE*
Pyongyang 306 -1.19 0.07 294 -1.05 0.07 600 -1.12 0.05 [-1.32 -1.06] [-1.18 -0.91] [-1.23 -1.01] South Phyongan 303 -1.21 0.10 293 -1.03 0.06 596 -1.12 0.08 [-1.40 -1.01] [-1.16 -0.91] [-1.27 -0.97] North Phyongan 310 -1.27 0.09 290 -1.31 0.13 600 -1.29 0.10 [-1.45 -1.09] [-1.56 -1.06] [-1.50 -1.08] South Hwanghae 300 -1.51 0.06 300 -1.16 0.06 600 -1.34 0.04 [-1.63 -1.40] [-1.28 -1.05] [-1.42 -1.26] North Hwanghae 306 -1.43 0.07 294 -1.20 0.07 600 -1.32 0.06 [-1.58 -1.29] [-1.34 -1.07] [-1.44 -1.21] South Hamgyong 305 -1.56 0.06 295 -1.49 0.09 600 -1.53 0.06 [-1.69 -1.44] [-1.66 -1.31] [-1.64 -1.41] North Hamgyong 309 -1.42 0.07 290 -1.49 0.05 599 -1.46 0.05 [-1.56 -1.28] [-1.60 -1.38] [-1.55 -1.37] Ryanggang 306 -1.65 0.06 294 -1.53 0.08 600 -1.59 0.06 [-1.78 -1.53] [-1.69 -1.37] [-1.71 -1.48] Rural 949 -1.49 0.04 938 -1.30 0.05 1,887 -1.39 0.04 -1.57 -1.40 -1.39 -1.20 -1.47 -1.32 Urban 1,496 -1.29 0.04 1,412 -1.21 0.04 2,908 -1.25 0.03 -1.37 -1.22 -1.29 -1.13 -1.32 -1.19 DPRK 2,445 -1.37 0.03 2,350 -1.25 0.03 4,795 -1.31 0.03 [-1.43 -1.31] [-1.30 -1.19] [-1.36 -1.26] * Confidence interval
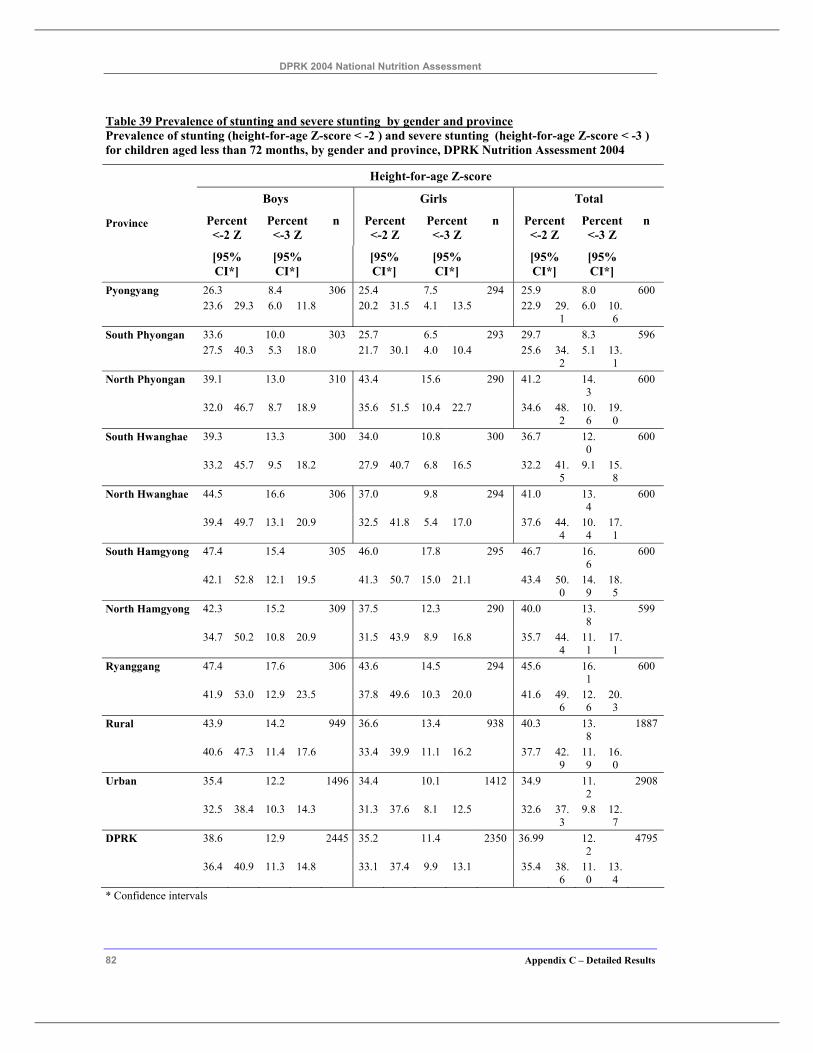
DPRK 2004 National Nutrition Assessment
82 Appendix C – Detailed Results
Table 39 Prevalence of stunting and severe stunting by gender and province Prevalence of stunting (height-for-age Z-score < -2 ) and severe stunting (height-for-age Z-score < -3 ) for children aged less than 72 months, by gender and province, DPRK Nutrition Assessment 2004
Height-for-age Z-score
Boys Girls Total
Percent <-2 Z
Percent <-3 Z
n Percent <-2 Z
Percent <-3 Z
n Percent <-2 Z
Percent <-3 Z
n Province
[95% CI*]
[95% CI*]
[95% CI*]
[95% CI*]
[95% CI*]
[95% CI*]
Pyongyang 26.3 8.4 306 25.4 7.5 294 25.9 8.0 600 23.6 29.3 6.0 11.8 20.2 31.5 4.1 13.5 22.9 29.
1 6.0 10.
6
South Phyongan 33.6 10.0 303 25.7 6.5 293 29.7 8.3 596 27.5 40.3 5.3 18.0 21.7 30.1 4.0 10.4 25.6 34.
2 5.1 13.
1
North Phyongan 39.1 13.0 310 43.4 15.6 290 41.2 14.3
600
32.0 46.7 8.7 18.9 35.6 51.5 10.4 22.7 34.6 48.2
10.6
19.0
South Hwanghae 39.3 13.3 300 34.0 10.8 300 36.7 12.0
600
33.2 45.7 9.5 18.2 27.9 40.7 6.8 16.5 32.2 41.5
9.1 15.8
North Hwanghae 44.5 16.6 306 37.0 9.8 294 41.0 13.4
600
39.4 49.7 13.1 20.9 32.5 41.8 5.4 17.0 37.6 44.4
10.4
17.1
South Hamgyong 47.4 15.4 305 46.0 17.8 295 46.7 16.6
600
42.1 52.8 12.1 19.5 41.3 50.7 15.0 21.1 43.4 50.0
14.9
18.5
North Hamgyong 42.3 15.2 309 37.5 12.3 290 40.0 13.8
599
34.7 50.2 10.8 20.9 31.5 43.9 8.9 16.8 35.7 44.4
11.1
17.1
Ryanggang 47.4 17.6 306 43.6 14.5 294 45.6 16.1
600
41.9 53.0 12.9 23.5 37.8 49.6 10.3 20.0 41.6 49.6
12.6
20.3
Rural 43.9 14.2 949 36.6 13.4 938 40.3 13.8
1887
40.6 47.3 11.4 17.6 33.4 39.9 11.1 16.2 37.7 42.9
11.9
16.0
Urban 35.4 12.2 1496 34.4 10.1 1412 34.9 11.2
2908
32.5 38.4 10.3 14.3 31.3 37.6 8.1 12.5 32.6 37.3
9.8 12.7
DPRK 38.6 12.9 2445 35.2 11.4 2350 36.99 12.2
4795
36.4 40.9 11.3 14.8 33.1 37.4 9.9 13.1 35.4 38.6
11.0
13.4
* Confidence intervals
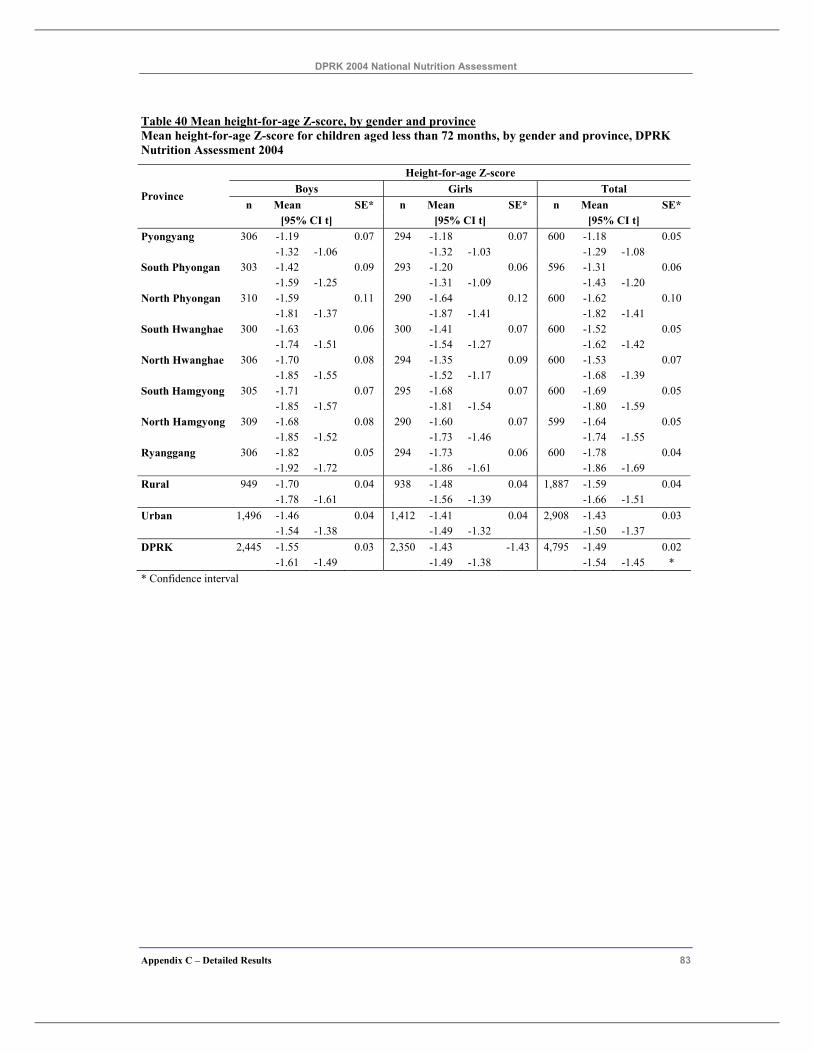
DPRK 2004 National Nutrition Assessment
Appendix C – Detailed Results 83
Table 40 Mean height-for-age Z-score, by gender and province Mean height-for-age Z-score for children aged less than 72 months, by gender and province, DPRK Nutrition Assessment 2004
Height-for-age Z-score Boys Girls Total
n Mean SE* n Mean SE* n Mean SE* Province
[95% CI t] [95% CI t] [95% CI t] Pyongyang 306 -1.19 0.07 294 -1.18 0.07 600 -1.18 0.05 -1.32 -1.06 -1.32 -1.03 -1.29 -1.08 South Phyongan 303 -1.42 0.09 293 -1.20 0.06 596 -1.31 0.06 -1.59 -1.25 -1.31 -1.09 -1.43 -1.20 North Phyongan 310 -1.59 0.11 290 -1.64 0.12 600 -1.62 0.10 -1.81 -1.37 -1.87 -1.41 -1.82 -1.41 South Hwanghae 300 -1.63 0.06 300 -1.41 0.07 600 -1.52 0.05 -1.74 -1.51 -1.54 -1.27 -1.62 -1.42 North Hwanghae 306 -1.70 0.08 294 -1.35 0.09 600 -1.53 0.07 -1.85 -1.55 -1.52 -1.17 -1.68 -1.39 South Hamgyong 305 -1.71 0.07 295 -1.68 0.07 600 -1.69 0.05 -1.85 -1.57 -1.81 -1.54 -1.80 -1.59 North Hamgyong 309 -1.68 0.08 290 -1.60 0.07 599 -1.64 0.05 -1.85 -1.52 -1.73 -1.46 -1.74 -1.55 Ryanggang 306 -1.82 0.05 294 -1.73 0.06 600 -1.78 0.04 -1.92 -1.72 -1.86 -1.61 -1.86 -1.69 Rural 949 -1.70 0.04 938 -1.48 0.04 1,887 -1.59 0.04 -1.78 -1.61 -1.56 -1.39 -1.66 -1.51 Urban 1,496 -1.46 0.04 1,412 -1.41 0.04 2,908 -1.43 0.03 -1.54 -1.38 -1.49 -1.32 -1.50 -1.37 DPRK 2,445 -1.55 0.03 2,350 -1.43 -1.43 4,795 -1.49 0.02 -1.61 -1.49 -1.49 -1.38 -1.54 -1.45 * * Confidence interval
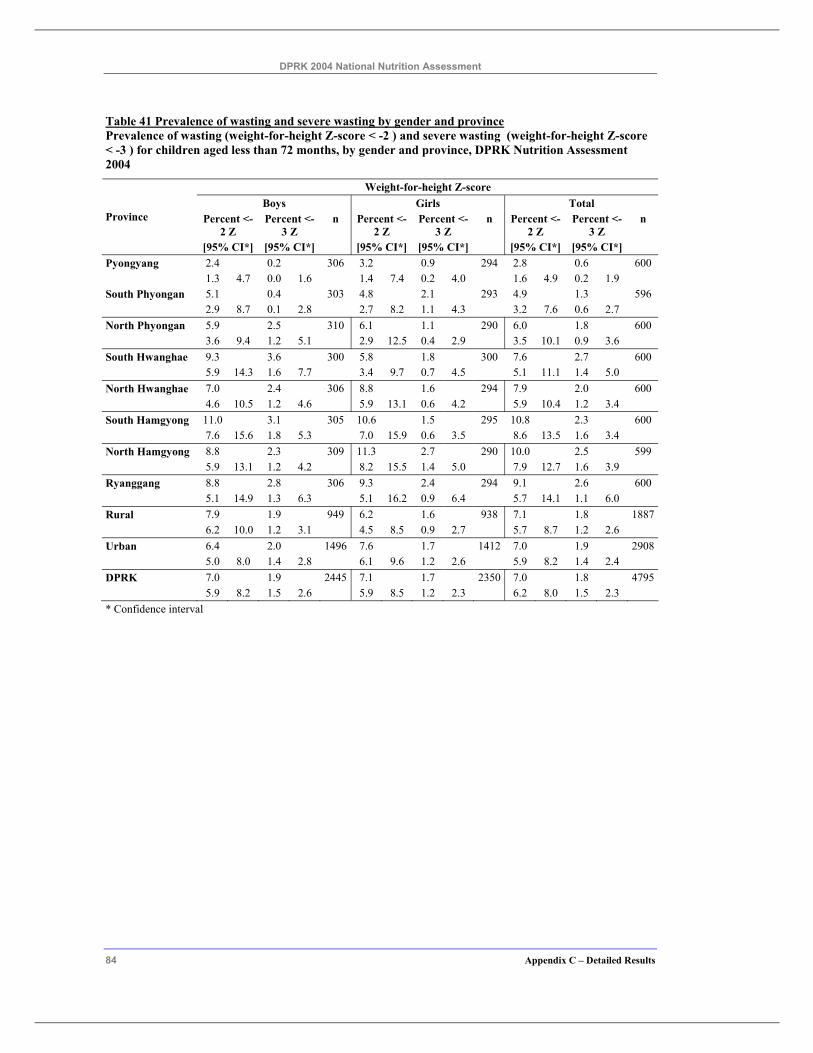
DPRK 2004 National Nutrition Assessment
84 Appendix C – Detailed Results
Table 41 Prevalence of wasting and severe wasting by gender and province Prevalence of wasting (weight-for-height Z-score < -2 ) and severe wasting (weight-for-height Z-score < -3 ) for children aged less than 72 months, by gender and province, DPRK Nutrition Assessment 2004
Weight-for-height Z-score Boys Girls Total
Percent <-2 Z
Percent <-3 Z
n Percent <-2 Z
Percent <-3 Z
n Percent <-2 Z
Percent <-3 Z
n Province
[95% CI*] [95% CI*] [95% CI*] [95% CI*] [95% CI*] [95% CI*] Pyongyang 2.4 0.2 306 3.2 0.9 294 2.8 0.6 600 1.3 4.7 0.0 1.6 1.4 7.4 0.2 4.0 1.6 4.9 0.2 1.9 South Phyongan 5.1 0.4 303 4.8 2.1 293 4.9 1.3 596 2.9 8.7 0.1 2.8 2.7 8.2 1.1 4.3 3.2 7.6 0.6 2.7 North Phyongan 5.9 2.5 310 6.1 1.1 290 6.0 1.8 600 3.6 9.4 1.2 5.1 2.9 12.5 0.4 2.9 3.5 10.1 0.9 3.6 South Hwanghae 9.3 3.6 300 5.8 1.8 300 7.6 2.7 600 5.9 14.3 1.6 7.7 3.4 9.7 0.7 4.5 5.1 11.1 1.4 5.0 North Hwanghae 7.0 2.4 306 8.8 1.6 294 7.9 2.0 600 4.6 10.5 1.2 4.6 5.9 13.1 0.6 4.2 5.9 10.4 1.2 3.4 South Hamgyong 11.0 3.1 305 10.6 1.5 295 10.8 2.3 600 7.6 15.6 1.8 5.3 7.0 15.9 0.6 3.5 8.6 13.5 1.6 3.4 North Hamgyong 8.8 2.3 309 11.3 2.7 290 10.0 2.5 599 5.9 13.1 1.2 4.2 8.2 15.5 1.4 5.0 7.9 12.7 1.6 3.9 Ryanggang 8.8 2.8 306 9.3 2.4 294 9.1 2.6 600 5.1 14.9 1.3 6.3 5.1 16.2 0.9 6.4 5.7 14.1 1.1 6.0 Rural 7.9 1.9 949 6.2 1.6 938 7.1 1.8 1887 6.2 10.0 1.2 3.1 4.5 8.5 0.9 2.7 5.7 8.7 1.2 2.6 Urban 6.4 2.0 1496 7.6 1.7 1412 7.0 1.9 2908 5.0 8.0 1.4 2.8 6.1 9.6 1.2 2.6 5.9 8.2 1.4 2.4 DPRK 7.0 1.9 2445 7.1 1.7 2350 7.0 1.8 4795 5.9 8.2 1.5 2.6 5.9 8.5 1.2 2.3 6.2 8.0 1.5 2.3 * Confidence interval
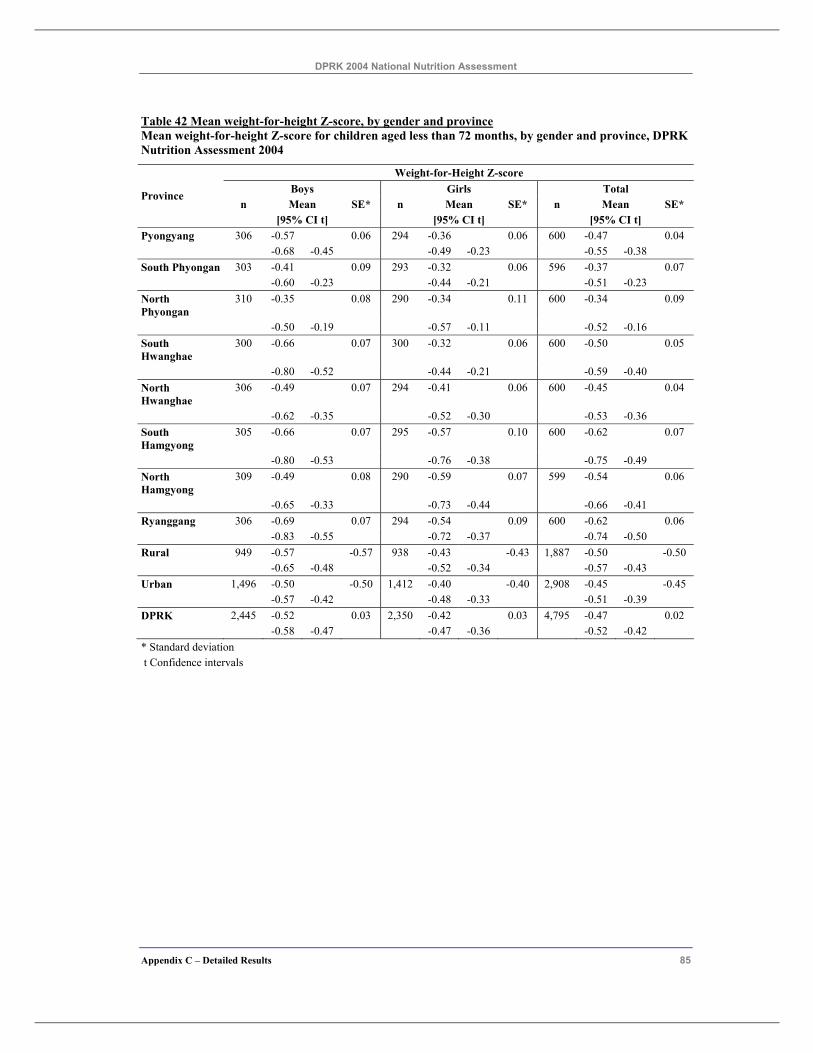
DPRK 2004 National Nutrition Assessment
Appendix C – Detailed Results 85
Table 42 Mean weight-for-height Z-score, by gender and province Mean weight-for-height Z-score for children aged less than 72 months, by gender and province, DPRK Nutrition Assessment 2004
Weight-for-Height Z-score Boys Girls Total
n Mean SE* n Mean SE* n Mean SE* Province
[95% CI t] [95% CI t] [95% CI t] Pyongyang 306 -0.57 0.06 294 -0.36 0.06 600 -0.47 0.04 -0.68 -0.45 -0.49 -0.23 -0.55 -0.38 South Phyongan 303 -0.41 0.09 293 -0.32 0.06 596 -0.37 0.07 -0.60 -0.23 -0.44 -0.21 -0.51 -0.23 North Phyongan
310 -0.35 0.08 290 -0.34 0.11 600 -0.34 0.09
-0.50 -0.19 -0.57 -0.11 -0.52 -0.16 South Hwanghae
300 -0.66 0.07 300 -0.32 0.06 600 -0.50 0.05
-0.80 -0.52 -0.44 -0.21 -0.59 -0.40 North Hwanghae
306 -0.49 0.07 294 -0.41 0.06 600 -0.45 0.04
-0.62 -0.35 -0.52 -0.30 -0.53 -0.36 South Hamgyong
305 -0.66 0.07 295 -0.57 0.10 600 -0.62 0.07
-0.80 -0.53 -0.76 -0.38 -0.75 -0.49 North Hamgyong
309 -0.49 0.08 290 -0.59 0.07 599 -0.54 0.06
-0.65 -0.33 -0.73 -0.44 -0.66 -0.41 Ryanggang 306 -0.69 0.07 294 -0.54 0.09 600 -0.62 0.06 -0.83 -0.55 -0.72 -0.37 -0.74 -0.50 Rural 949 -0.57 -0.57 938 -0.43 -0.43 1,887 -0.50 -0.50 -0.65 -0.48 -0.52 -0.34 -0.57 -0.43 Urban 1,496 -0.50 -0.50 1,412 -0.40 -0.40 2,908 -0.45 -0.45 -0.57 -0.42 -0.48 -0.33 -0.51 -0.39 DPRK 2,445 -0.52 0.03 2,350 -0.42 0.03 4,795 -0.47 0.02 -0.58 -0.47 -0.47 -0.36 -0.52 -0.42 * Standard deviation t Confidence intervals
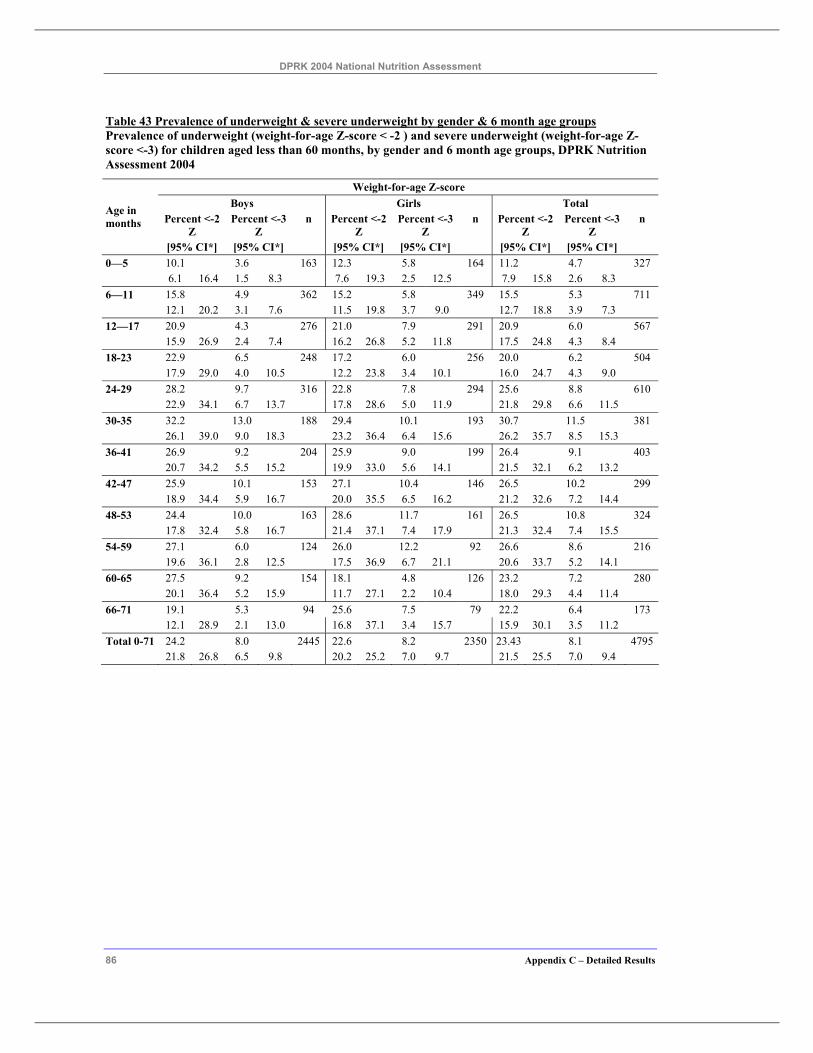
DPRK 2004 National Nutrition Assessment
86 Appendix C – Detailed Results
Table 43 Prevalence of underweight & severe underweight by gender & 6 month age groups Prevalence of underweight (weight-for-age Z-score < -2 ) and severe underweight (weight-for-age Z-score <-3) for children aged less than 60 months, by gender and 6 month age groups, DPRK Nutrition Assessment 2004
Weight-for-age Z-score Boys Girls Total
Percent <-2 Z
Percent <-3 Z
n Percent <-2 Z
Percent <-3 Z
n Percent <-2 Z
Percent <-3 Z
n Age in months
[95% CI*] [95% CI*] [95% CI*] [95% CI*] [95% CI*] [95% CI*] 0—5 10.1 3.6 163 12.3 5.8 164 11.2 4.7 327 6.1 16.4 1.5 8.3 7.6 19.3 2.5 12.5 7.9 15.8 2.6 8.3 6—11 15.8 4.9 362 15.2 5.8 349 15.5 5.3 711 12.1 20.2 3.1 7.6 11.5 19.8 3.7 9.0 12.7 18.8 3.9 7.3 12—17 20.9 4.3 276 21.0 7.9 291 20.9 6.0 567 15.9 26.9 2.4 7.4 16.2 26.8 5.2 11.8 17.5 24.8 4.3 8.4 18-23 22.9 6.5 248 17.2 6.0 256 20.0 6.2 504 17.9 29.0 4.0 10.5 12.2 23.8 3.4 10.1 16.0 24.7 4.3 9.0 24-29 28.2 9.7 316 22.8 7.8 294 25.6 8.8 610 22.9 34.1 6.7 13.7 17.8 28.6 5.0 11.9 21.8 29.8 6.6 11.5 30-35 32.2 13.0 188 29.4 10.1 193 30.7 11.5 381 26.1 39.0 9.0 18.3 23.2 36.4 6.4 15.6 26.2 35.7 8.5 15.3 36-41 26.9 9.2 204 25.9 9.0 199 26.4 9.1 403 20.7 34.2 5.5 15.2 19.9 33.0 5.6 14.1 21.5 32.1 6.2 13.2 42-47 25.9 10.1 153 27.1 10.4 146 26.5 10.2 299 18.9 34.4 5.9 16.7 20.0 35.5 6.5 16.2 21.2 32.6 7.2 14.4 48-53 24.4 10.0 163 28.6 11.7 161 26.5 10.8 324 17.8 32.4 5.8 16.7 21.4 37.1 7.4 17.9 21.3 32.4 7.4 15.5 54-59 27.1 6.0 124 26.0 12.2 92 26.6 8.6 216 19.6 36.1 2.8 12.5 17.5 36.9 6.7 21.1 20.6 33.7 5.2 14.1 60-65 27.5 9.2 154 18.1 4.8 126 23.2 7.2 280 20.1 36.4 5.2 15.9 11.7 27.1 2.2 10.4 18.0 29.3 4.4 11.4 66-71 19.1 5.3 94 25.6 7.5 79 22.2 6.4 173 12.1 28.9 2.1 13.0 16.8 37.1 3.4 15.7 15.9 30.1 3.5 11.2 Total 0-71 24.2 8.0 2445 22.6 8.2 2350 23.43 8.1 4795 21.8 26.8 6.5 9.8 20.2 25.2 7.0 9.7 21.5 25.5 7.0 9.4
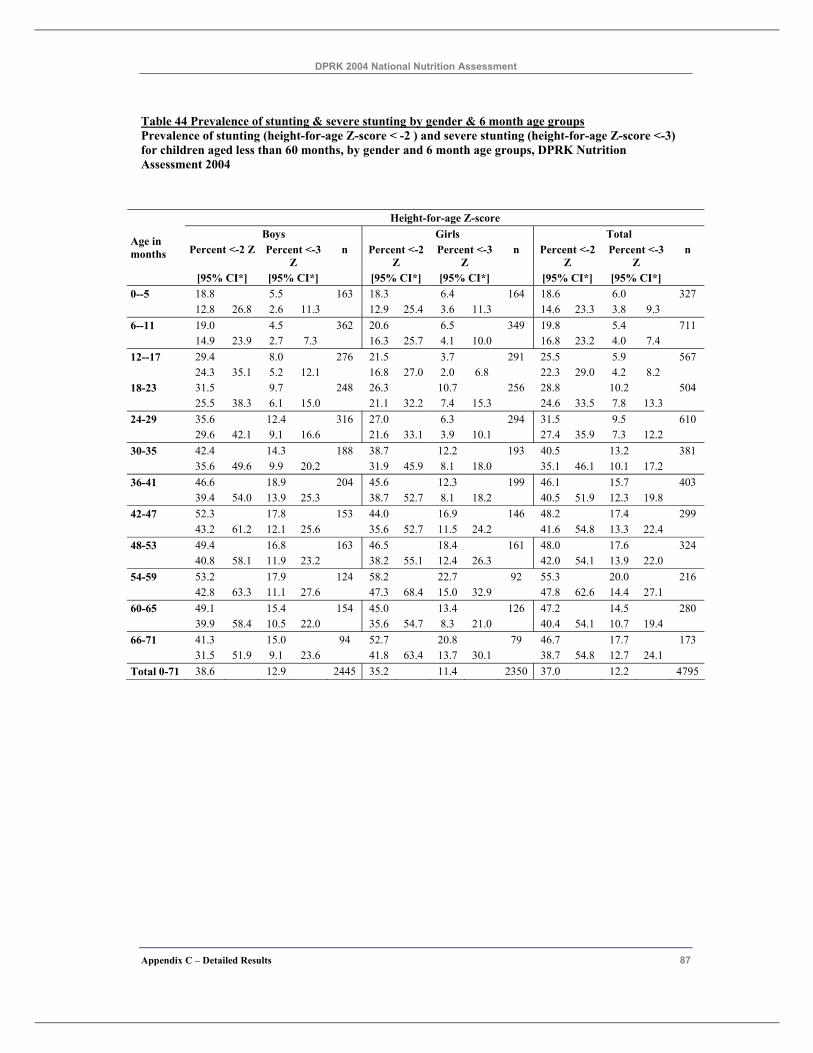
DPRK 2004 National Nutrition Assessment
Appendix C – Detailed Results 87
Table 44 Prevalence of stunting & severe stunting by gender & 6 month age groups Prevalence of stunting (height-for-age Z-score < -2 ) and severe stunting (height-for-age Z-score <-3) for children aged less than 60 months, by gender and 6 month age groups, DPRK Nutrition Assessment 2004
Height-for-age Z-score Boys Girls Total
Percent <-2 Z Percent <-3 Z
n Percent <-2 Z
Percent <-3 Z
n Percent <-2 Z
Percent <-3 Z
n Age in months
[95% CI*] [95% CI*] [95% CI*] [95% CI*] [95% CI*] [95% CI*] 0--5 18.8 5.5 163 18.3 6.4 164 18.6 6.0 327 12.8 26.8 2.6 11.3 12.9 25.4 3.6 11.3 14.6 23.3 3.8 9.3 6--11 19.0 4.5 362 20.6 6.5 349 19.8 5.4 711 14.9 23.9 2.7 7.3 16.3 25.7 4.1 10.0 16.8 23.2 4.0 7.4 12--17 29.4 8.0 276 21.5 3.7 291 25.5 5.9 567 24.3 35.1 5.2 12.1 16.8 27.0 2.0 6.8 22.3 29.0 4.2 8.2 18-23 31.5 9.7 248 26.3 10.7 256 28.8 10.2 504 25.5 38.3 6.1 15.0 21.1 32.2 7.4 15.3 24.6 33.5 7.8 13.3 24-29 35.6 12.4 316 27.0 6.3 294 31.5 9.5 610 29.6 42.1 9.1 16.6 21.6 33.1 3.9 10.1 27.4 35.9 7.3 12.2 30-35 42.4 14.3 188 38.7 12.2 193 40.5 13.2 381 35.6 49.6 9.9 20.2 31.9 45.9 8.1 18.0 35.1 46.1 10.1 17.2 36-41 46.6 18.9 204 45.6 12.3 199 46.1 15.7 403 39.4 54.0 13.9 25.3 38.7 52.7 8.1 18.2 40.5 51.9 12.3 19.8 42-47 52.3 17.8 153 44.0 16.9 146 48.2 17.4 299 43.2 61.2 12.1 25.6 35.6 52.7 11.5 24.2 41.6 54.8 13.3 22.4 48-53 49.4 16.8 163 46.5 18.4 161 48.0 17.6 324 40.8 58.1 11.9 23.2 38.2 55.1 12.4 26.3 42.0 54.1 13.9 22.0 54-59 53.2 17.9 124 58.2 22.7 92 55.3 20.0 216 42.8 63.3 11.1 27.6 47.3 68.4 15.0 32.9 47.8 62.6 14.4 27.1 60-65 49.1 15.4 154 45.0 13.4 126 47.2 14.5 280 39.9 58.4 10.5 22.0 35.6 54.7 8.3 21.0 40.4 54.1 10.7 19.4 66-71 41.3 15.0 94 52.7 20.8 79 46.7 17.7 173 31.5 51.9 9.1 23.6 41.8 63.4 13.7 30.1 38.7 54.8 12.7 24.1 Total 0-71 38.6 12.9 2445 35.2 11.4 2350 37.0 12.2 4795
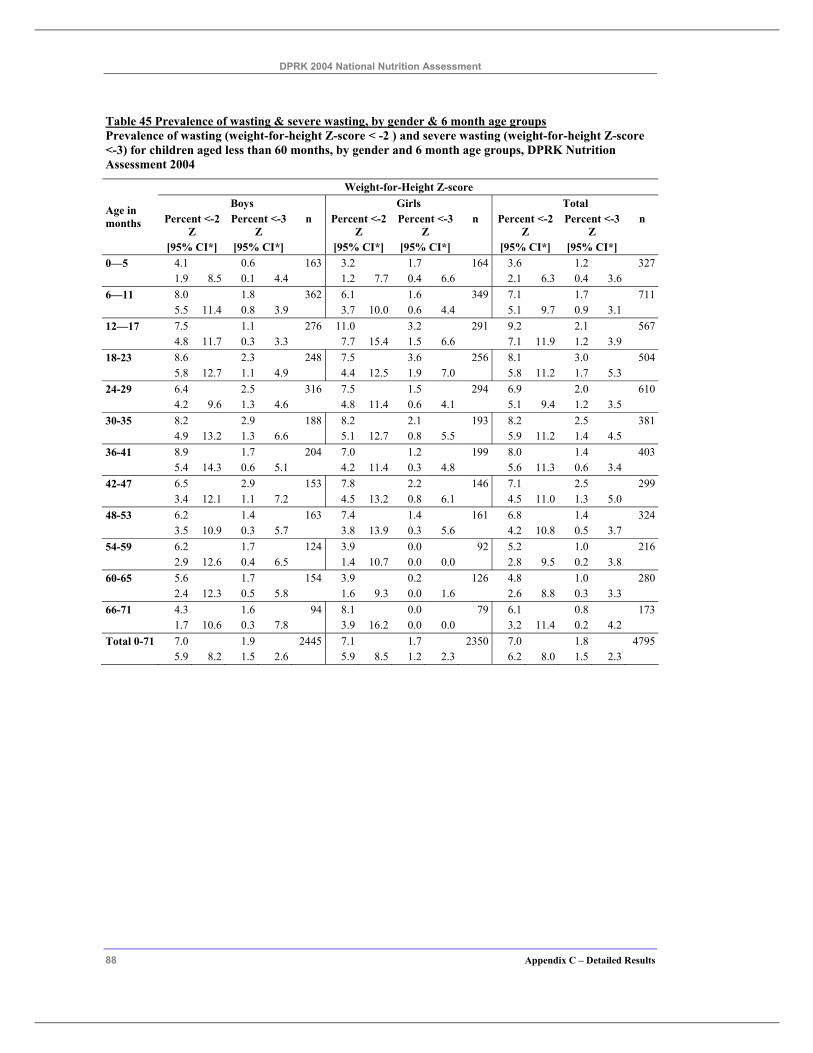
DPRK 2004 National Nutrition Assessment
88 Appendix C – Detailed Results
Table 45 Prevalence of wasting & severe wasting, by gender & 6 month age groups Prevalence of wasting (weight-for-height Z-score < -2 ) and severe wasting (weight-for-height Z-score <-3) for children aged less than 60 months, by gender and 6 month age groups, DPRK Nutrition Assessment 2004
Weight-for-Height Z-score Boys Girls Total
Percent <-2 Z
Percent <-3 Z
n Percent <-2 Z
Percent <-3 Z
n Percent <-2 Z
Percent <-3 Z
n Age in months
[95% CI*] [95% CI*] [95% CI*] [95% CI*] [95% CI*] [95% CI*] 0—5 4.1 0.6 163 3.2 1.7 164 3.6 1.2 327 1.9 8.5 0.1 4.4 1.2 7.7 0.4 6.6 2.1 6.3 0.4 3.6 6—11 8.0 1.8 362 6.1 1.6 349 7.1 1.7 711 5.5 11.4 0.8 3.9 3.7 10.0 0.6 4.4 5.1 9.7 0.9 3.1 12—17 7.5 1.1 276 11.0 3.2 291 9.2 2.1 567 4.8 11.7 0.3 3.3 7.7 15.4 1.5 6.6 7.1 11.9 1.2 3.9 18-23 8.6 2.3 248 7.5 3.6 256 8.1 3.0 504 5.8 12.7 1.1 4.9 4.4 12.5 1.9 7.0 5.8 11.2 1.7 5.3 24-29 6.4 2.5 316 7.5 1.5 294 6.9 2.0 610 4.2 9.6 1.3 4.6 4.8 11.4 0.6 4.1 5.1 9.4 1.2 3.5 30-35 8.2 2.9 188 8.2 2.1 193 8.2 2.5 381 4.9 13.2 1.3 6.6 5.1 12.7 0.8 5.5 5.9 11.2 1.4 4.5 36-41 8.9 1.7 204 7.0 1.2 199 8.0 1.4 403 5.4 14.3 0.6 5.1 4.2 11.4 0.3 4.8 5.6 11.3 0.6 3.4 42-47 6.5 2.9 153 7.8 2.2 146 7.1 2.5 299 3.4 12.1 1.1 7.2 4.5 13.2 0.8 6.1 4.5 11.0 1.3 5.0 48-53 6.2 1.4 163 7.4 1.4 161 6.8 1.4 324 3.5 10.9 0.3 5.7 3.8 13.9 0.3 5.6 4.2 10.8 0.5 3.7 54-59 6.2 1.7 124 3.9 0.0 92 5.2 1.0 216 2.9 12.6 0.4 6.5 1.4 10.7 0.0 0.0 2.8 9.5 0.2 3.8 60-65 5.6 1.7 154 3.9 0.2 126 4.8 1.0 280 2.4 12.3 0.5 5.8 1.6 9.3 0.0 1.6 2.6 8.8 0.3 3.3 66-71 4.3 1.6 94 8.1 0.0 79 6.1 0.8 173 1.7 10.6 0.3 7.8 3.9 16.2 0.0 0.0 3.2 11.4 0.2 4.2 Total 0-71 7.0 1.9 2445 7.1 1.7 2350 7.0 1.8 4795
5.9 8.2 1.5 2.6 5.9 8.5 1.2 2.3 6.2 8.0 1.5 2.3
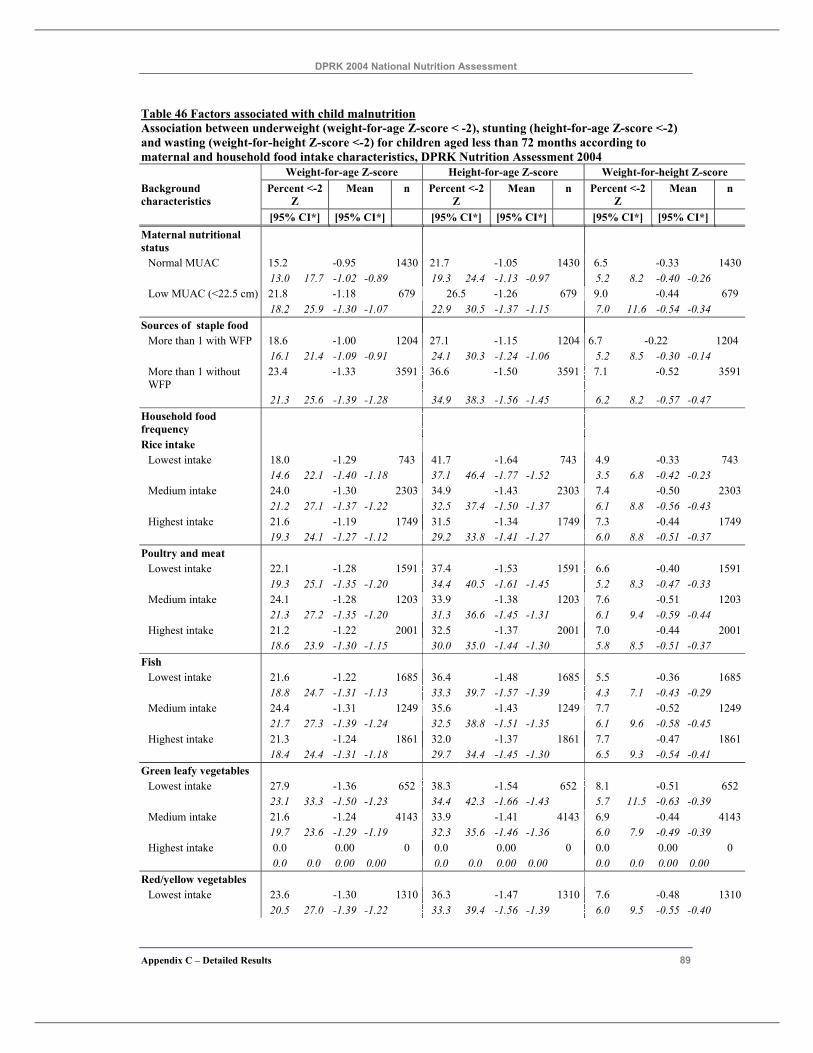
DPRK 2004 National Nutrition Assessment
Appendix C – Detailed Results 89
Table 46 Factors associated with child malnutrition Association between underweight (weight-for-age Z-score < -2), stunting (height-for-age Z-score <-2) and wasting (weight-for-height Z-score <-2) for children aged less than 72 months according to maternal and household food intake characteristics, DPRK Nutrition Assessment 2004 Weight-for-age Z-score Height-for-age Z-score Weight-for-height Z-score Background characteristics
Percent <-2 Z
Mean n Percent <-2 Z
Mean n Percent <-2 Z
Mean n
[95% CI*] [95% CI*] [95% CI*] [95% CI*] [95% CI*] [95% CI*] Maternal nutritional status
Normal MUAC 15.2 -0.95 1430 21.7 -1.05 1430 6.5 -0.33 1430 13.0 17.7 -1.02 -0.89 19.3 24.4 -1.13 -0.97 5.2 8.2 -0.40 -0.26 Low MUAC (<22.5 cm) 21.8 -1.18 679 26.5 -1.26 679 9.0 -0.44 679
18.2 25.9 -1.30 -1.07 22.9 30.5 -1.37 -1.15 7.0 11.6 -0.54 -0.34 Sources of staple food
More than 1 with WFP 18.6 -1.00 1204 27.1 -1.15 1204 6.7 -0.22 1204 16.1 21.4 -1.09 -0.91 24.1 30.3 -1.24 -1.06 5.2 8.5 -0.30 -0.14 More than 1 without WFP
23.4 -1.33 3591 36.6 -1.50 3591 7.1 -0.52 3591
21.3 25.6 -1.39 -1.28 34.9 38.3 -1.56 -1.45 6.2 8.2 -0.57 -0.47 Household food frequency
Rice intake Lowest intake 18.0 -1.29 743 41.7 -1.64 743 4.9 -0.33 743 14.6 22.1 -1.40 -1.18 37.1 46.4 -1.77 -1.52 3.5 6.8 -0.42 -0.23 Medium intake 24.0 -1.30 2303 34.9 -1.43 2303 7.4 -0.50 2303 21.2 27.1 -1.37 -1.22 32.5 37.4 -1.50 -1.37 6.1 8.8 -0.56 -0.43 Highest intake 21.6 -1.19 1749 31.5 -1.34 1749 7.3 -0.44 1749
19.3 24.1 -1.27 -1.12 29.2 33.8 -1.41 -1.27 6.0 8.8 -0.51 -0.37 Poultry and meat
Lowest intake 22.1 -1.28 1591 37.4 -1.53 1591 6.6 -0.40 1591 19.3 25.1 -1.35 -1.20 34.4 40.5 -1.61 -1.45 5.2 8.3 -0.47 -0.33 Medium intake 24.1 -1.28 1203 33.9 -1.38 1203 7.6 -0.51 1203 21.3 27.2 -1.35 -1.20 31.3 36.6 -1.45 -1.31 6.1 9.4 -0.59 -0.44 Highest intake 21.2 -1.22 2001 32.5 -1.37 2001 7.0 -0.44 2001
18.6 23.9 -1.30 -1.15 30.0 35.0 -1.44 -1.30 5.8 8.5 -0.51 -0.37 Fish
Lowest intake 21.6 -1.22 1685 36.4 -1.48 1685 5.5 -0.36 1685 18.8 24.7 -1.31 -1.13 33.3 39.7 -1.57 -1.39 4.3 7.1 -0.43 -0.29 Medium intake 24.4 -1.31 1249 35.6 -1.43 1249 7.7 -0.52 1249 21.7 27.3 -1.39 -1.24 32.5 38.8 -1.51 -1.35 6.1 9.6 -0.58 -0.45 Highest intake 21.3 -1.24 1861 32.0 -1.37 1861 7.7 -0.47 1861
18.4 24.4 -1.31 -1.18 29.7 34.4 -1.45 -1.30 6.5 9.3 -0.54 -0.41 Green leafy vegetables
Lowest intake 27.9 -1.36 652 38.3 -1.54 652 8.1 -0.51 652 23.1 33.3 -1.50 -1.23 34.4 42.3 -1.66 -1.43 5.7 11.5 -0.63 -0.39 Medium intake 21.6 -1.24 4143 33.9 -1.41 4143 6.9 -0.44 4143 19.7 23.6 -1.29 -1.19 32.3 35.6 -1.46 -1.36 6.0 7.9 -0.49 -0.39 Highest intake 0.0 0.00 0 0.0 0.00 0 0.0 0.00 0
0.0 0.0 0.00 0.00 0.0 0.0 0.00 0.00 0.0 0.0 0.00 0.00 Red/yellow vegetables
Lowest intake 23.6 -1.30 1310 36.3 -1.47 1310 7.6 -0.48 1310 20.5 27.0 -1.39 -1.22 33.3 39.4 -1.56 -1.39 6.0 9.5 -0.55 -0.40
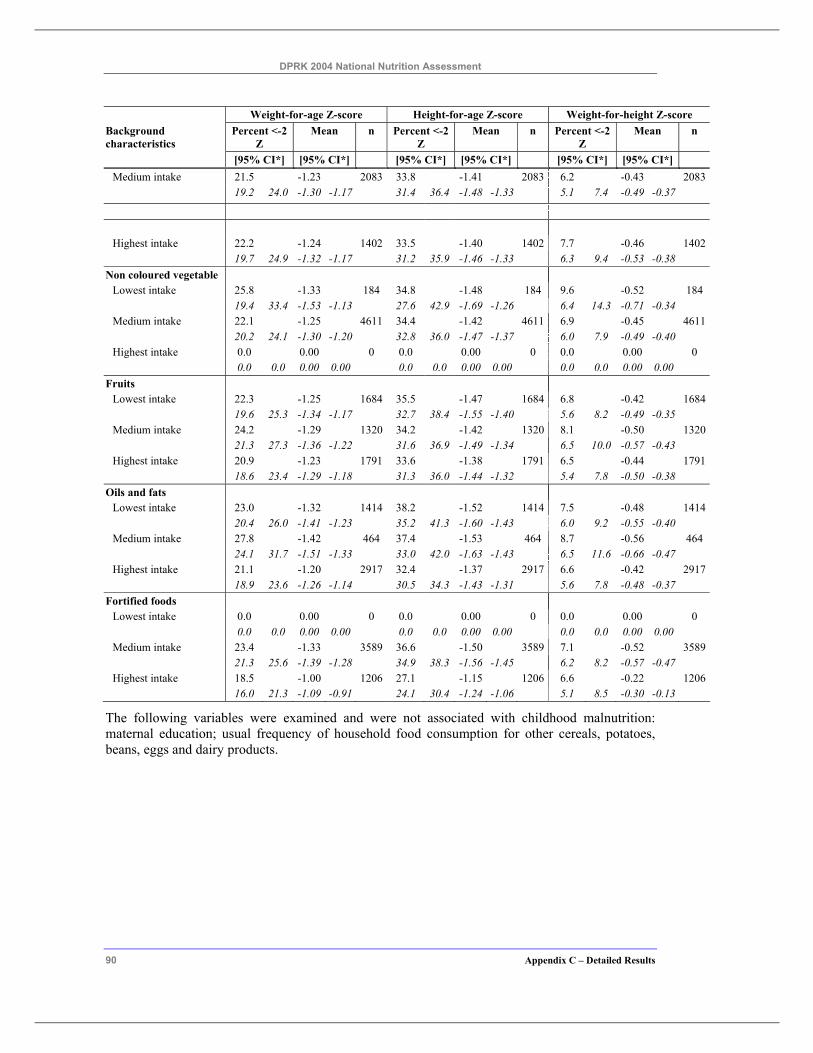
DPRK 2004 National Nutrition Assessment
90 Appendix C – Detailed Results
Weight-for-age Z-score Height-for-age Z-score Weight-for-height Z-score Background characteristics
Percent <-2 Z
Mean n Percent <-2 Z
Mean n Percent <-2 Z
Mean n
[95% CI*] [95% CI*] [95% CI*] [95% CI*] [95% CI*] [95% CI*] Medium intake 21.5 -1.23 2083 33.8 -1.41 2083 6.2 -0.43 2083 19.2 24.0 -1.30 -1.17 31.4 36.4 -1.48 -1.33 5.1 7.4 -0.49 -0.37
Highest intake 22.2 -1.24 1402 33.5 -1.40 1402 7.7 -0.46 1402
19.7 24.9 -1.32 -1.17 31.2 35.9 -1.46 -1.33 6.3 9.4 -0.53 -0.38 Non coloured vegetable
Lowest intake 25.8 -1.33 184 34.8 -1.48 184 9.6 -0.52 184 19.4 33.4 -1.53 -1.13 27.6 42.9 -1.69 -1.26 6.4 14.3 -0.71 -0.34 Medium intake 22.1 -1.25 4611 34.4 -1.42 4611 6.9 -0.45 4611 20.2 24.1 -1.30 -1.20 32.8 36.0 -1.47 -1.37 6.0 7.9 -0.49 -0.40 Highest intake 0.0 0.00 0 0.0 0.00 0 0.0 0.00 0
0.0 0.0 0.00 0.00 0.0 0.0 0.00 0.00 0.0 0.0 0.00 0.00 Fruits
Lowest intake 22.3 -1.25 1684 35.5 -1.47 1684 6.8 -0.42 1684 19.6 25.3 -1.34 -1.17 32.7 38.4 -1.55 -1.40 5.6 8.2 -0.49 -0.35 Medium intake 24.2 -1.29 1320 34.2 -1.42 1320 8.1 -0.50 1320 21.3 27.3 -1.36 -1.22 31.6 36.9 -1.49 -1.34 6.5 10.0 -0.57 -0.43 Highest intake 20.9 -1.23 1791 33.6 -1.38 1791 6.5 -0.44 1791
18.6 23.4 -1.29 -1.18 31.3 36.0 -1.44 -1.32 5.4 7.8 -0.50 -0.38 Oils and fats
Lowest intake 23.0 -1.32 1414 38.2 -1.52 1414 7.5 -0.48 1414 20.4 26.0 -1.41 -1.23 35.2 41.3 -1.60 -1.43 6.0 9.2 -0.55 -0.40 Medium intake 27.8 -1.42 464 37.4 -1.53 464 8.7 -0.56 464 24.1 31.7 -1.51 -1.33 33.0 42.0 -1.63 -1.43 6.5 11.6 -0.66 -0.47 Highest intake 21.1 -1.20 2917 32.4 -1.37 2917 6.6 -0.42 2917
18.9 23.6 -1.26 -1.14 30.5 34.3 -1.43 -1.31 5.6 7.8 -0.48 -0.37 Fortified foods
Lowest intake 0.0 0.00 0 0.0 0.00 0 0.0 0.00 0 0.0 0.0 0.00 0.00 0.0 0.0 0.00 0.00 0.0 0.0 0.00 0.00 Medium intake 23.4 -1.33 3589 36.6 -1.50 3589 7.1 -0.52 3589 21.3 25.6 -1.39 -1.28 34.9 38.3 -1.56 -1.45 6.2 8.2 -0.57 -0.47 Highest intake 18.5 -1.00 1206 27.1 -1.15 1206 6.6 -0.22 1206
16.0 21.3 -1.09 -0.91 24.1 30.4 -1.24 -1.06 5.1 8.5 -0.30 -0.13
The following variables were examined and were not associated with childhood malnutrition: maternal education; usual frequency of household food consumption for other cereals, potatoes, beans, eggs and dairy products.
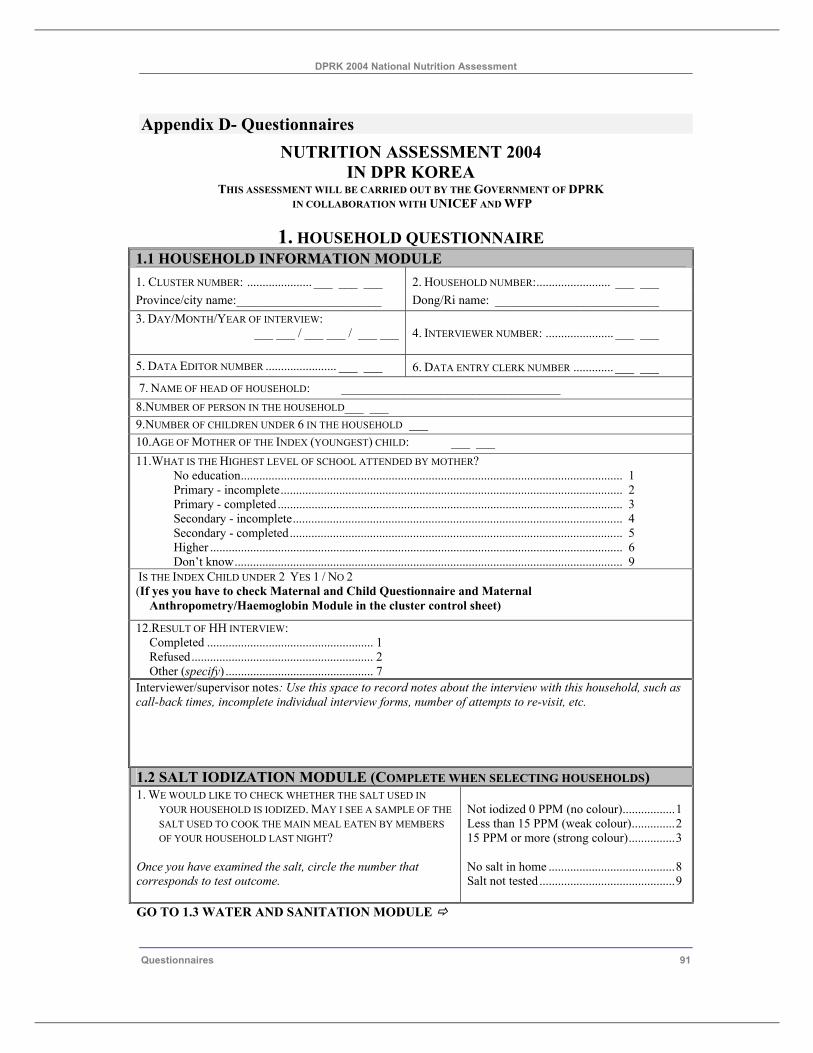
DPRK 2004 National Nutrition Assessment
Questionnaires 91
Appendix D- Questionnaires NUTRITION ASSESSMENT 2004
IN DPR KOREA THIS ASSESSMENT WILL BE CARRIED OUT BY THE GOVERNMENT OF DPRK
IN COLLABORATION WITH UNICEF AND WFP
1. HOUSEHOLD QUESTIONNAIRE 1.1 HOUSEHOLD INFORMATION MODULE 1. CLUSTER NUMBER: ..................... ___ ___ ___ 2. HOUSEHOLD NUMBER:........................ ___ ___ Province/city name:_______________________ Dong/Ri name: __________________________ 3. DAY/MONTH/YEAR OF INTERVIEW:
___ ___ / ___ ___ / ___ ___
4. INTERVIEWER NUMBER: ...................... ___ ___
5. DATA EDITOR NUMBER ....................... ___ ___ 6. DATA ENTRY CLERK NUMBER ............. ___ ___
7. NAME OF HEAD OF HOUSEHOLD: ___________________________________ 8.NUMBER OF PERSON IN THE HOUSEHOLD___ ___ 9.NUMBER OF CHILDREN UNDER 6 IN THE HOUSEHOLD ___ 10.AGE OF MOTHER OF THE INDEX (YOUNGEST) CHILD: ___ ___ 11.WHAT IS THE HIGHEST LEVEL OF SCHOOL ATTENDED BY MOTHER?
No education............................................................................................................................ 1 Primary - incomplete............................................................................................................... 2 Primary - completed................................................................................................................ 3 Secondary - incomplete........................................................................................................... 4 Secondary - completed............................................................................................................ 5 Higher ...................................................................................................................................... 6 Don’t know.............................................................................................................................. 9
IS THE INDEX CHILD UNDER 2 YES 1 / NO 2 (If yes you have to check Maternal and Child Questionnaire and Maternal
Anthropometry/Haemoglobin Module in the cluster control sheet)
12.RESULT OF HH INTERVIEW: Completed ...................................................... 1
Refused........................................................... 2 Other (specify) ................................................ 7
Interviewer/supervisor notes: Use this space to record notes about the interview with this household, such as call-back times, incomplete individual interview forms, number of attempts to re-visit, etc. 1.2 SALT IODIZATION MODULE (COMPLETE WHEN SELECTING HOUSEHOLDS) 1. WE WOULD LIKE TO CHECK WHETHER THE SALT USED IN
YOUR HOUSEHOLD IS IODIZED. MAY I SEE A SAMPLE OF THE SALT USED TO COOK THE MAIN MEAL EATEN BY MEMBERS OF YOUR HOUSEHOLD LAST NIGHT?
Once you have examined the salt, circle the number that corresponds to test outcome.
Not iodized 0 PPM (no colour).................1 Less than 15 PPM (weak colour)..............2 15 PPM or more (strong colour)...............3 No salt in home .........................................8 Salt not tested ............................................9
GO TO 1.3 WATER AND SANITATION MODULE
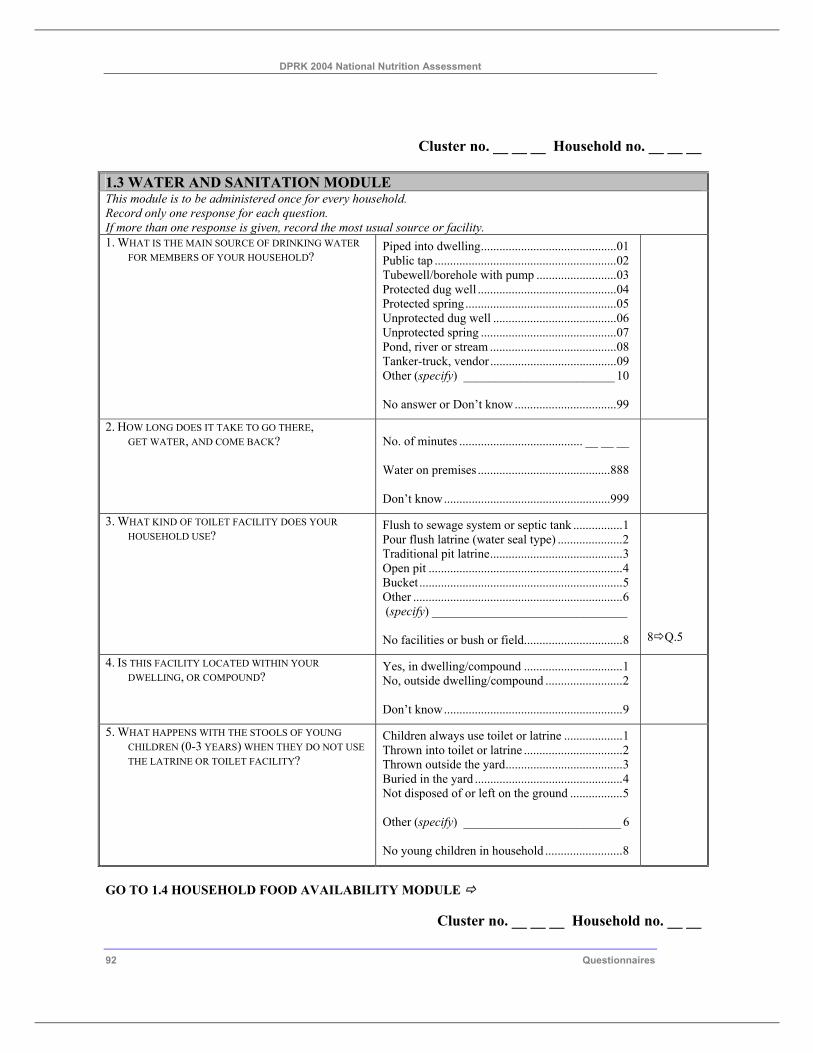
DPRK 2004 National Nutrition Assessment
92 Questionnaires
Cluster no. __ __ __ Household no. __ __ __ 1.3 WATER AND SANITATION MODULE This module is to be administered once for every household. Record only one response for each question. If more than one response is given, record the most usual source or facility. 1. WHAT IS THE MAIN SOURCE OF DRINKING WATER
FOR MEMBERS OF YOUR HOUSEHOLD? Piped into dwelling............................................01 Public tap ...........................................................02 Tubewell/borehole with pump ..........................03 Protected dug well .............................................04 Protected spring.................................................05 Unprotected dug well ........................................06 Unprotected spring ............................................07 Pond, river or stream .........................................08 Tanker-truck, vendor .........................................09 Other (specify) ________________________ 10 No answer or Don’t know.................................99
2. HOW LONG DOES IT TAKE TO GO THERE, GET WATER, AND COME BACK?
No. of minutes ........................................ __ __ __ Water on premises ...........................................888 Don’t know......................................................999
3. WHAT KIND OF TOILET FACILITY DOES YOUR HOUSEHOLD USE?
Flush to sewage system or septic tank ................1 Pour flush latrine (water seal type) .....................2 Traditional pit latrine...........................................3 Open pit ...............................................................4 Bucket ..................................................................5 Other ....................................................................6 (specify) _______________________________ No facilities or bush or field................................8
8 Q.5
4. IS THIS FACILITY LOCATED WITHIN YOUR DWELLING, OR COMPOUND?
Yes, in dwelling/compound ................................1 No, outside dwelling/compound .........................2 Don’t know..........................................................9
5. WHAT HAPPENS WITH THE STOOLS OF YOUNG CHILDREN (0-3 YEARS) WHEN THEY DO NOT USE THE LATRINE OR TOILET FACILITY?
Children always use toilet or latrine ...................1 Thrown into toilet or latrine ................................2 Thrown outside the yard......................................3 Buried in the yard ................................................4 Not disposed of or left on the ground .................5 Other (specify) _________________________ 6 No young children in household .........................8
GO TO 1.4 HOUSEHOLD FOOD AVAILABILITY MODULE
Cluster no. __ __ __ Household no. __ __
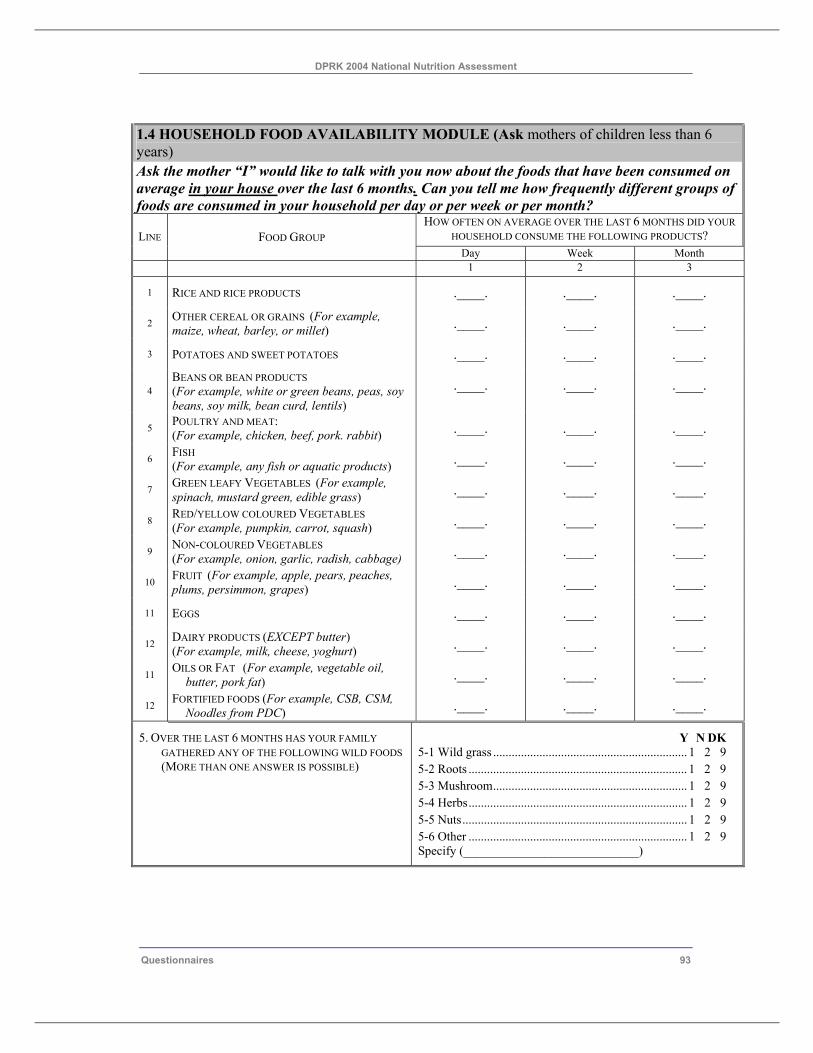
DPRK 2004 National Nutrition Assessment
Questionnaires 93
1.4 HOUSEHOLD FOOD AVAILABILITY MODULE (Ask mothers of children less than 6 years) Ask the mother “I” would like to talk with you now about the foods that have been consumed on average in your house over the last 6 months. Can you tell me how frequently different groups of foods are consumed in your household per day or per week or per month?
HOW OFTEN ON AVERAGE OVER THE LAST 6 MONTHS DID YOUR HOUSEHOLD CONSUME THE FOLLOWING PRODUCTS? LINE FOOD GROUP
Day Week Month 1 2 3
1 RICE AND RICE PRODUCTS .____. .____. .____.
2 OTHER CEREAL OR GRAINS (For example, maize, wheat, barley, or millet) .____. .____. .____.
3 POTATOES AND SWEET POTATOES .____. .____. .____.
4 BEANS OR BEAN PRODUCTS (For example, white or green beans, peas, soy beans, soy milk, bean curd, lentils)
.____. .____. .____.
5 POULTRY AND MEAT: (For example, chicken, beef, pork. rabbit) .____. .____. .____.
6 FISH (For example, any fish or aquatic products) .____. .____. .____.
7 GREEN LEAFY VEGETABLES (For example, spinach, mustard green, edible grass) .____. .____. .____.
8 RED/YELLOW COLOURED VEGETABLES (For example, pumpkin, carrot, squash) .____. .____. .____.
9 NON-COLOURED VEGETABLES (For example, onion, garlic, radish, cabbage) .____. .____. .____.
10 FRUIT (For example, apple, pears, peaches, plums, persimmon, grapes) .____. .____. .____.
11 EGGS .____. .____. .____.
12 DAIRY PRODUCTS (EXCEPT butter) (For example, milk, cheese, yoghurt) .____. .____. .____.
11 OILS OR FAT (For example, vegetable oil, butter, pork fat) .____. .____. .____.
12 FORTIFIED FOODS (For example, CSB, CSM, Noodles from PDC) .____. .____. .____.
5. OVER THE LAST 6 MONTHS HAS YOUR FAMILY GATHERED ANY OF THE FOLLOWING WILD FOODS (MORE THAN ONE ANSWER IS POSSIBLE)
Y N DK 5-1 Wild grass ............................................................... 1 2 9 5-2 Roots ....................................................................... 1 2 9 5-3 Mushroom............................................................... 1 2 9 5-4 Herbs....................................................................... 1 2 9 5-5 Nuts......................................................................... 1 2 9 5-6 Other ....................................................................... 1 2 9 Specify (____________________________)
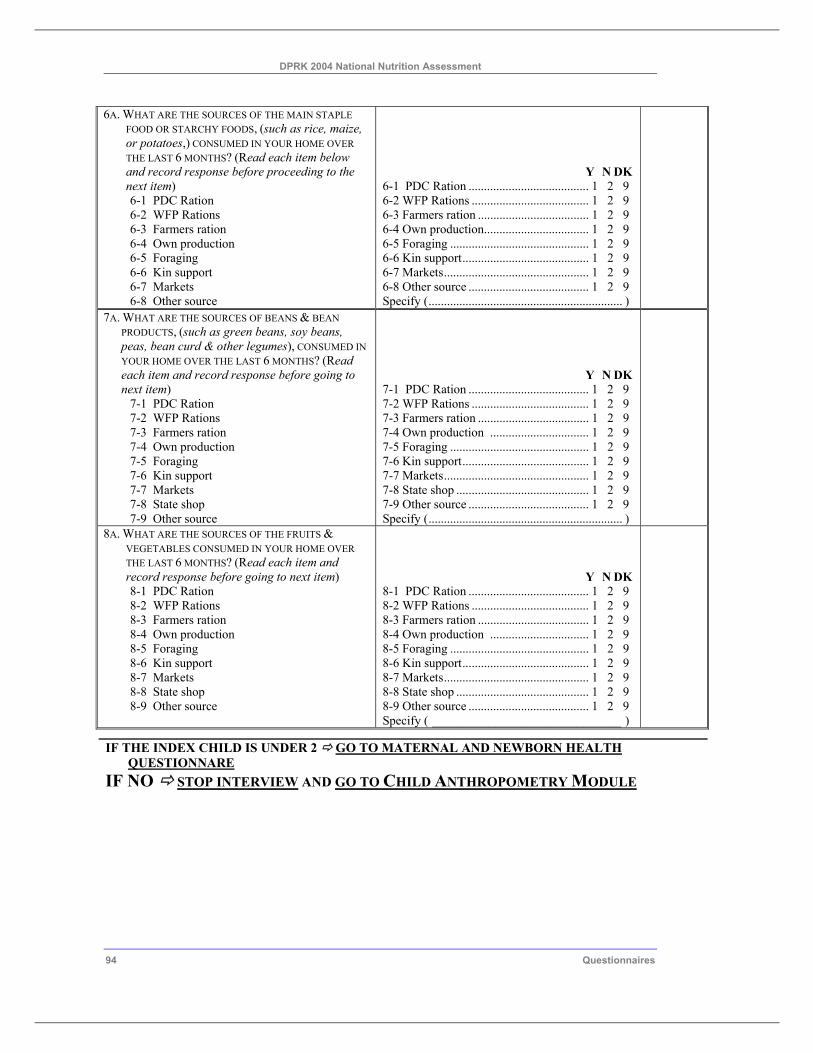
DPRK 2004 National Nutrition Assessment
94 Questionnaires
6A. WHAT ARE THE SOURCES OF THE MAIN STAPLE FOOD OR STARCHY FOODS, (such as rice, maize, or potatoes,) CONSUMED IN YOUR HOME OVER THE LAST 6 MONTHS? (Read each item below and record response before proceeding to the next item) 6-1 PDC Ration 6-2 WFP Rations 6-3 Farmers ration 6-4 Own production 6-5 Foraging 6-6 Kin support 6-7 Markets 6-8 Other source
Y N DK 6-1 PDC Ration ....................................... 1 2 9 6-2 WFP Rations ...................................... 1 2 9 6-3 Farmers ration .................................... 1 2 9 6-4 Own production.................................. 1 2 9 6-5 Foraging ............................................. 1 2 9 6-6 Kin support......................................... 1 2 9 6-7 Markets............................................... 1 2 9 6-8 Other source ....................................... 1 2 9 Specify (............................................................... )
7A. WHAT ARE THE SOURCES OF BEANS & BEAN PRODUCTS, (such as green beans, soy beans, peas, bean curd & other legumes), CONSUMED IN YOUR HOME OVER THE LAST 6 MONTHS? (Read each item and record response before going to next item)
7-1 PDC Ration 7-2 WFP Rations 7-3 Farmers ration 7-4 Own production 7-5 Foraging 7-6 Kin support 7-7 Markets 7-8 State shop 7-9 Other source
Y N DK 7-1 PDC Ration ....................................... 1 2 9 7-2 WFP Rations ...................................... 1 2 9 7-3 Farmers ration .................................... 1 2 9 7-4 Own production ................................ 1 2 9 7-5 Foraging ............................................. 1 2 9 7-6 Kin support......................................... 1 2 9 7-7 Markets............................................... 1 2 9 7-8 State shop ........................................... 1 2 9 7-9 Other source ....................................... 1 2 9 Specify (............................................................... )
8A. WHAT ARE THE SOURCES OF THE FRUITS & VEGETABLES CONSUMED IN YOUR HOME OVER THE LAST 6 MONTHS? (Read each item and record response before going to next item) 8-1 PDC Ration 8-2 WFP Rations 8-3 Farmers ration 8-4 Own production 8-5 Foraging 8-6 Kin support 8-7 Markets 8-8 State shop 8-9 Other source
Y N DK 8-1 PDC Ration ....................................... 1 2 9 8-2 WFP Rations ...................................... 1 2 9 8-3 Farmers ration .................................... 1 2 9 8-4 Own production ................................ 1 2 9 8-5 Foraging ............................................. 1 2 9 8-6 Kin support......................................... 1 2 9 8-7 Markets............................................... 1 2 9 8-8 State shop ........................................... 1 2 9 8-9 Other source ....................................... 1 2 9 Specify ( ______________________________ )
IF THE INDEX CHILD IS UNDER 2 GO TO MATERNAL AND NEWBORN HEALTH QUESTIONNARE
IF NO STOP INTERVIEW AND GO TO CHILD ANTHROPOMETRY MODULE
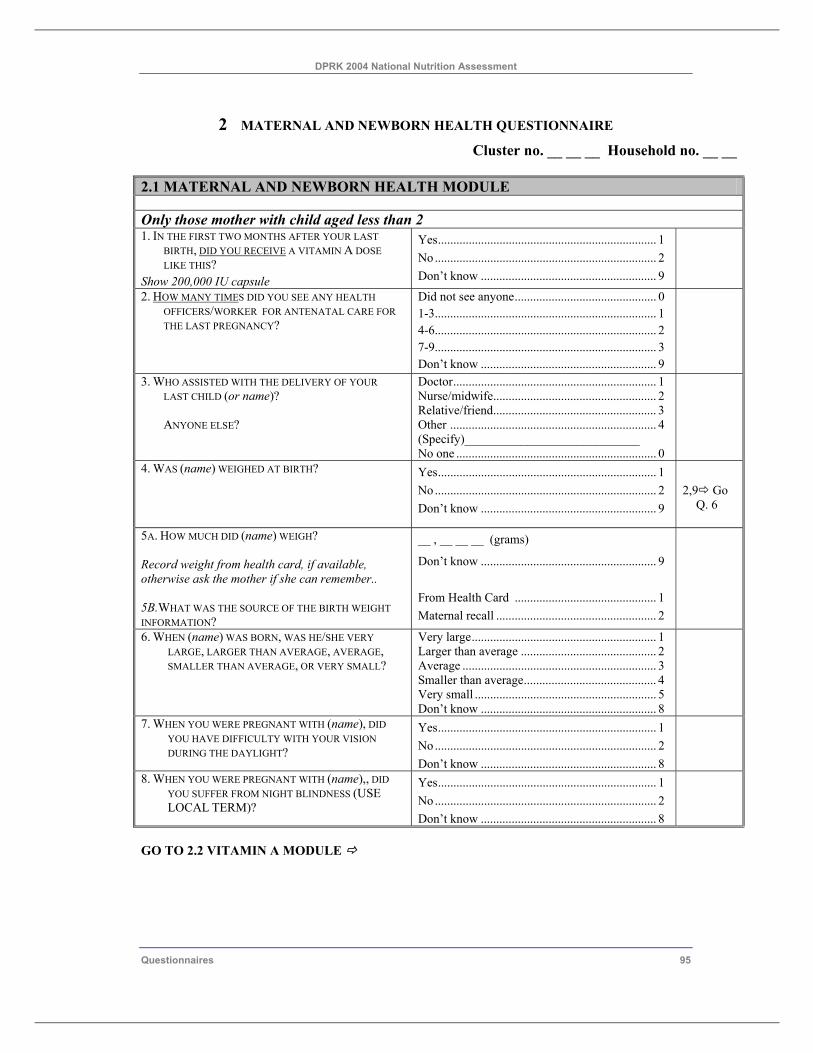
DPRK 2004 National Nutrition Assessment
Questionnaires 95
2 MATERNAL AND NEWBORN HEALTH QUESTIONNAIRE Cluster no. __ __ __ Household no. __ __
2.1 MATERNAL AND NEWBORN HEALTH MODULE Only those mother with child aged less than 2 1. IN THE FIRST TWO MONTHS AFTER YOUR LAST
BIRTH, DID YOU RECEIVE A VITAMIN A DOSE LIKE THIS?
Show 200,000 IU capsule
Yes....................................................................... 1 No ........................................................................ 2 Don’t know ......................................................... 9
2. HOW MANY TIMES DID YOU SEE ANY HEALTH OFFICERS/WORKER FOR ANTENATAL CARE FOR THE LAST PREGNANCY?
Did not see anyone.............................................. 0 1-3........................................................................ 1 4-6........................................................................ 2 7-9........................................................................ 3 Don’t know ......................................................... 9
3. WHO ASSISTED WITH THE DELIVERY OF YOUR LAST CHILD (or name)? ANYONE ELSE?
Doctor.................................................................. 1 Nurse/midwife..................................................... 2 Relative/friend..................................................... 3 Other ................................................................... 4 (Specify)____________________________ No one ................................................................. 0
4. WAS (name) WEIGHED AT BIRTH? Yes....................................................................... 1 No ........................................................................ 2 Don’t know ......................................................... 9
2,9 Go
Q. 6
5A. HOW MUCH DID (name) WEIGH? Record weight from health card, if available, otherwise ask the mother if she can remember.. 5B.WHAT WAS THE SOURCE OF THE BIRTH WEIGHT INFORMATION?
__ , __ __ __ (grams)
Don’t know ......................................................... 9 From Health Card .............................................. 1 Maternal recall .................................................... 2
6. WHEN (name) WAS BORN, WAS HE/SHE VERY LARGE, LARGER THAN AVERAGE, AVERAGE, SMALLER THAN AVERAGE, OR VERY SMALL?
Very large............................................................ 1 Larger than average ............................................ 2 Average ............................................................... 3 Smaller than average........................................... 4 Very small ........................................................... 5 Don’t know ......................................................... 8
7. WHEN YOU WERE PREGNANT WITH (name), DID YOU HAVE DIFFICULTY WITH YOUR VISION DURING THE DAYLIGHT?
Yes....................................................................... 1 No ........................................................................ 2 Don’t know ......................................................... 8
8. WHEN YOU WERE PREGNANT WITH (name),, DID YOU SUFFER FROM NIGHT BLINDNESS (USE LOCAL TERM)?
Yes....................................................................... 1 No ........................................................................ 2 Don’t know ......................................................... 8
GO TO 2.2 VITAMIN A MODULE
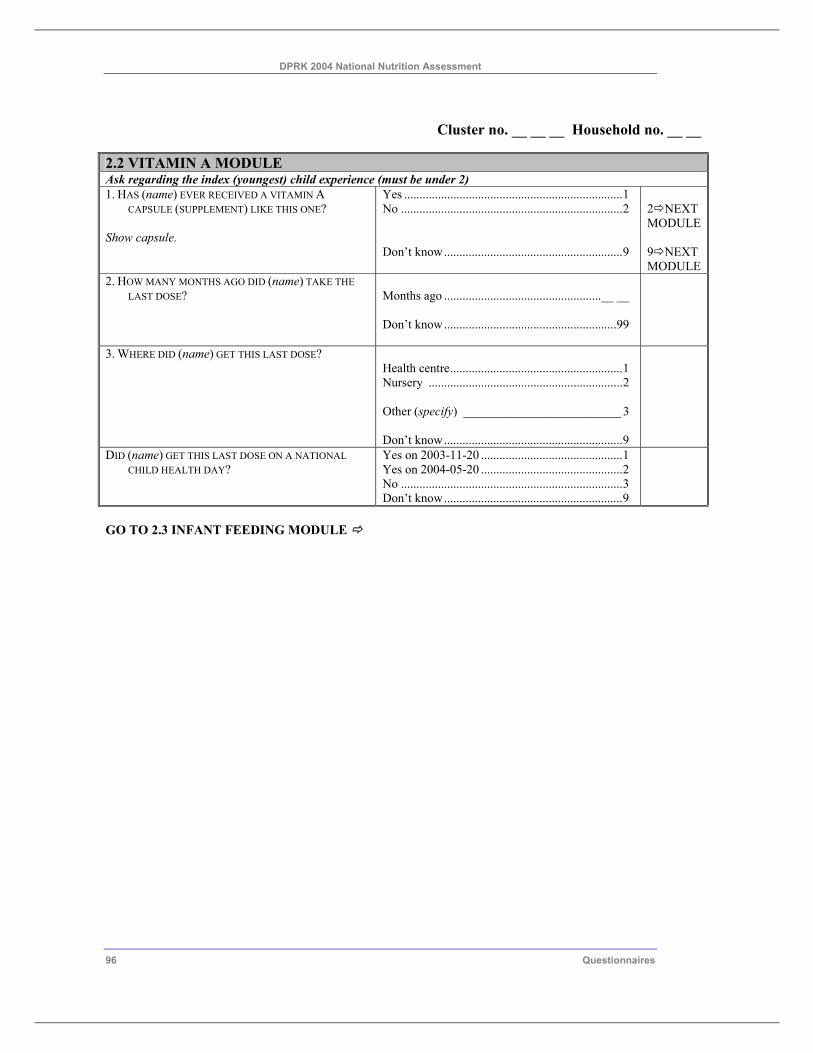
DPRK 2004 National Nutrition Assessment
96 Questionnaires
Cluster no. __ __ __ Household no. __ __
2.2 VITAMIN A MODULE Ask regarding the index (youngest) child experience (must be under 2) 1. HAS (name) EVER RECEIVED A VITAMIN A
CAPSULE (SUPPLEMENT) LIKE THIS ONE? Show capsule.
Yes .......................................................................1 No ........................................................................2 Don’t know..........................................................9
2 NEXT MODULE 9 NEXT MODULE
2. HOW MANY MONTHS AGO DID (name) TAKE THE LAST DOSE?
Months ago ...................................................__ __ Don’t know........................................................99
3. WHERE DID (name) GET THIS LAST DOSE?
Health centre........................................................1 Nursery ...............................................................2 Other (specify) _________________________ 3 Don’t know..........................................................9
DID (name) GET THIS LAST DOSE ON A NATIONAL CHILD HEALTH DAY?
Yes on 2003-11-20 ..............................................1 Yes on 2004-05-20 ..............................................2 No ........................................................................3 Don’t know..........................................................9
GO TO 2.3 INFANT FEEDING MODULE
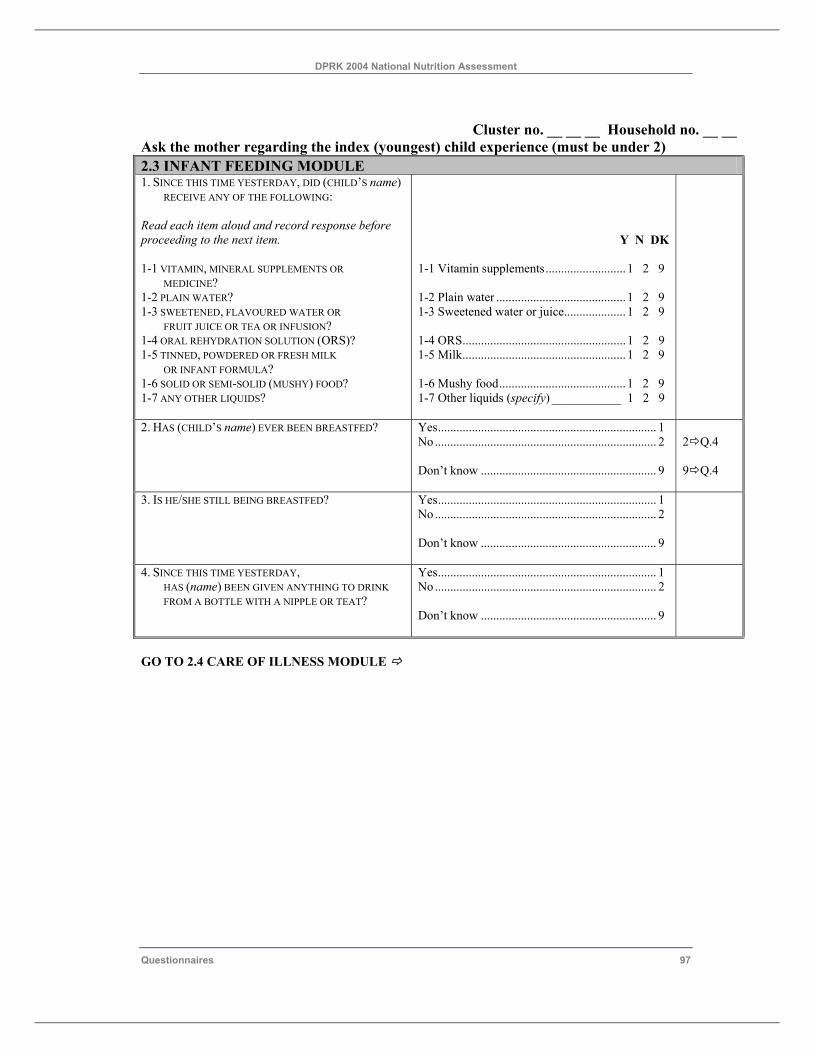
DPRK 2004 National Nutrition Assessment
Questionnaires 97
Cluster no. __ __ __ Household no. __ __
Ask the mother regarding the index (youngest) child experience (must be under 2) 2.3 INFANT FEEDING MODULE 1. SINCE THIS TIME YESTERDAY, DID (CHILD’S name)
RECEIVE ANY OF THE FOLLOWING: Read each item aloud and record response before proceeding to the next item. 1-1 VITAMIN, MINERAL SUPPLEMENTS OR
MEDICINE? 1-2 PLAIN WATER? 1-3 SWEETENED, FLAVOURED WATER OR
FRUIT JUICE OR TEA OR INFUSION? 1-4 ORAL REHYDRATION SOLUTION (ORS)? 1-5 TINNED, POWDERED OR FRESH MILK
OR INFANT FORMULA? 1-6 SOLID OR SEMI-SOLID (MUSHY) FOOD? 1-7 ANY OTHER LIQUIDS?
Y N DK 1-1 Vitamin supplements.......................... 1 2 9 1-2 Plain water .......................................... 1 2 9 1-3 Sweetened water or juice.................... 1 2 9 1-4 ORS..................................................... 1 2 9 1-5 Milk..................................................... 1 2 9 1-6 Mushy food......................................... 1 2 9 1-7 Other liquids (specify) ___________ 1 2 9
2. HAS (CHILD’S name) EVER BEEN BREASTFED?
Yes....................................................................... 1 No ........................................................................ 2 Don’t know ......................................................... 9
2 Q.4 9 Q.4
3. IS HE/SHE STILL BEING BREASTFED? Yes....................................................................... 1 No ........................................................................ 2 Don’t know ......................................................... 9
4. SINCE THIS TIME YESTERDAY, HAS (name) BEEN GIVEN ANYTHING TO DRINK FROM A BOTTLE WITH A NIPPLE OR TEAT?
Yes....................................................................... 1 No ........................................................................ 2 Don’t know ......................................................... 9
GO TO 2.4 CARE OF ILLNESS MODULE
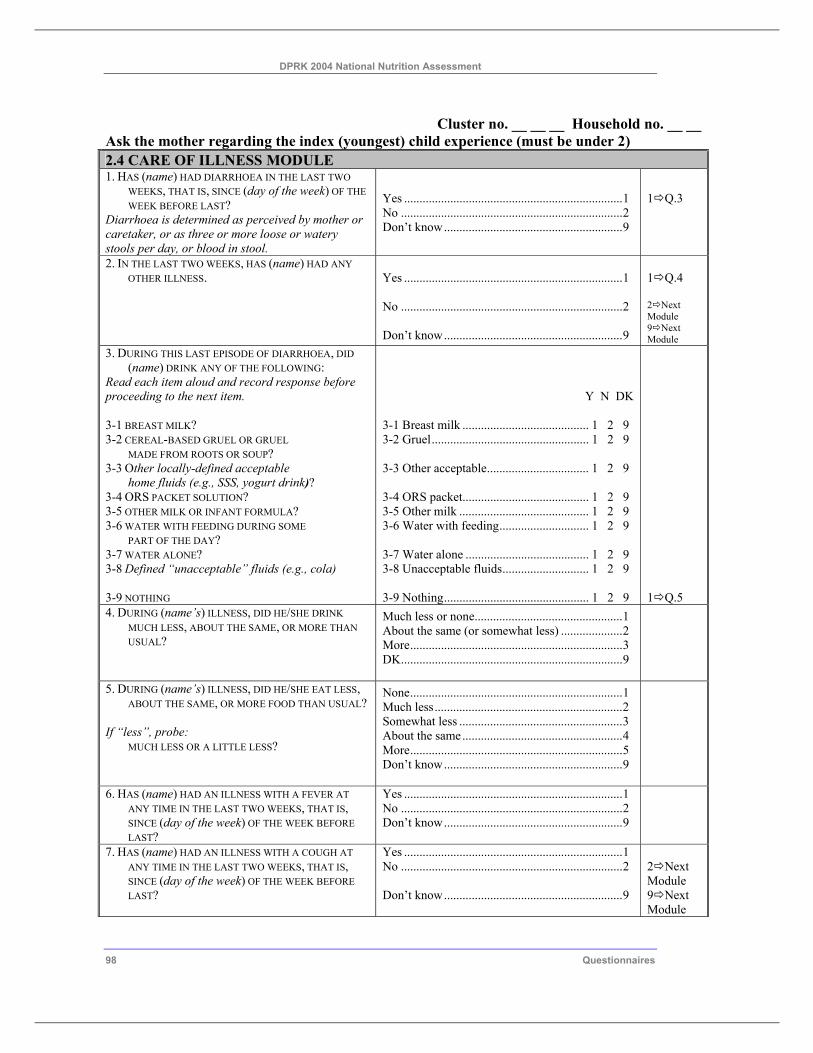
DPRK 2004 National Nutrition Assessment
98 Questionnaires
Cluster no. __ __ __ Household no. __ __ Ask the mother regarding the index (youngest) child experience (must be under 2) 2.4 CARE OF ILLNESS MODULE 1. HAS (name) HAD DIARRHOEA IN THE LAST TWO
WEEKS, THAT IS, SINCE (day of the week) OF THE WEEK BEFORE LAST?
Diarrhoea is determined as perceived by mother or caretaker, or as three or more loose or watery stools per day, or blood in stool.
Yes .......................................................................1 No ........................................................................2 Don’t know..........................................................9
1 Q.3
2. IN THE LAST TWO WEEKS, HAS (name) HAD ANY OTHER ILLNESS.
Yes .......................................................................1 No ........................................................................2 Don’t know..........................................................9
1 Q.4 2 Next Module 9 Next Module
3. DURING THIS LAST EPISODE OF DIARRHOEA, DID (name) DRINK ANY OF THE FOLLOWING:
Read each item aloud and record response before proceeding to the next item. 3-1 BREAST MILK? 3-2 CEREAL-BASED GRUEL OR GRUEL
MADE FROM ROOTS OR SOUP? 3-3 Other locally-defined acceptable
home fluids (e.g., SSS, yogurt drink)? 3-4 ORS PACKET SOLUTION? 3-5 OTHER MILK OR INFANT FORMULA? 3-6 WATER WITH FEEDING DURING SOME
PART OF THE DAY? 3-7 WATER ALONE? 3-8 Defined “unacceptable” fluids (e.g., cola) 3-9 NOTHING
Y N DK 3-1 Breast milk ......................................... 1 2 9 3-2 Gruel................................................... 1 2 9 3-3 Other acceptable................................. 1 2 9 3-4 ORS packet......................................... 1 2 9 3-5 Other milk .......................................... 1 2 9 3-6 Water with feeding............................. 1 2 9 3-7 Water alone ........................................ 1 2 9 3-8 Unacceptable fluids............................ 1 2 9 3-9 Nothing............................................... 1 2 9
1 Q.5
4. DURING (name’s) ILLNESS, DID HE/SHE DRINK MUCH LESS, ABOUT THE SAME, OR MORE THAN USUAL?
Much less or none................................................1 About the same (or somewhat less) ....................2 More.....................................................................3 DK........................................................................9
5. DURING (name’s) ILLNESS, DID HE/SHE EAT LESS, ABOUT THE SAME, OR MORE FOOD THAN USUAL?
If “less”, probe:
MUCH LESS OR A LITTLE LESS?
None.....................................................................1 Much less.............................................................2 Somewhat less .....................................................3 About the same....................................................4 More.....................................................................5 Don’t know..........................................................9
6. HAS (name) HAD AN ILLNESS WITH A FEVER AT ANY TIME IN THE LAST TWO WEEKS, THAT IS, SINCE (day of the week) OF THE WEEK BEFORE LAST?
Yes .......................................................................1 No ........................................................................2 Don’t know..........................................................9
7. HAS (name) HAD AN ILLNESS WITH A COUGH AT ANY TIME IN THE LAST TWO WEEKS, THAT IS, SINCE (day of the week) OF THE WEEK BEFORE LAST?
Yes .......................................................................1 No ........................................................................2 Don’t know..........................................................9
2 Next Module 9 Next Module
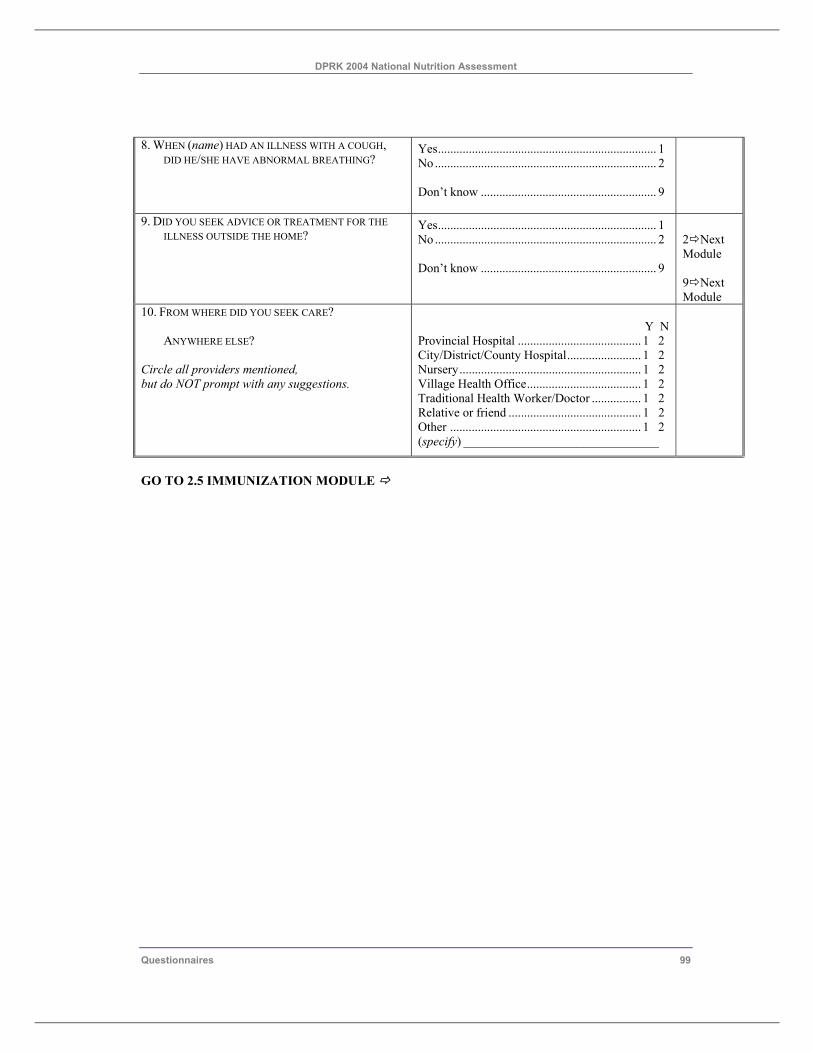
DPRK 2004 National Nutrition Assessment
Questionnaires 99
8. WHEN (name) HAD AN ILLNESS WITH A COUGH, DID HE/SHE HAVE ABNORMAL BREATHING?
Yes....................................................................... 1 No ........................................................................ 2 Don’t know ......................................................... 9
9. DID YOU SEEK ADVICE OR TREATMENT FOR THE ILLNESS OUTSIDE THE HOME?
Yes....................................................................... 1 No ........................................................................ 2 Don’t know ......................................................... 9
2 Next Module 9 Next Module
10. FROM WHERE DID YOU SEEK CARE? ANYWHERE ELSE?
Circle all providers mentioned, but do NOT prompt with any suggestions.
Y N
Provincial Hospital ........................................ 1 2 City/District/County Hospital........................ 1 2 Nursery........................................................... 1 2 Village Health Office..................................... 1 2 Traditional Health Worker/Doctor ................ 1 2 Relative or friend ........................................... 1 2 Other .............................................................. 1 2 (specify) _______________________________
GO TO 2.5 IMMUNIZATION MODULE
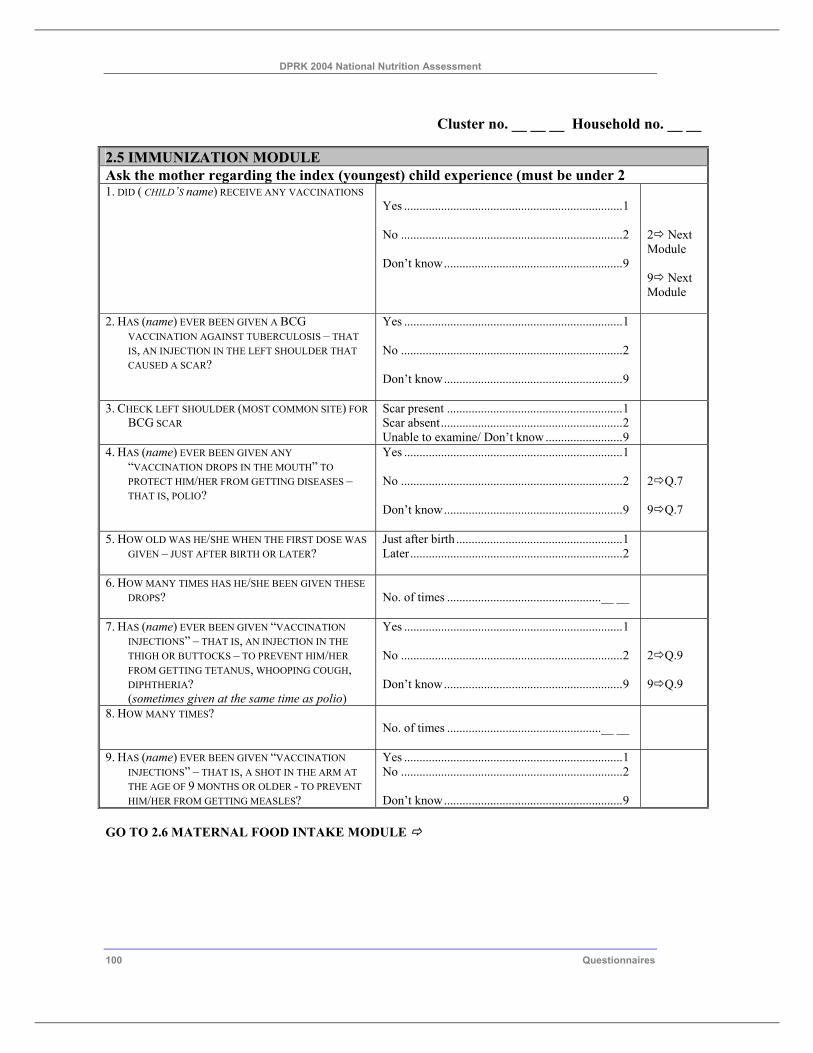
DPRK 2004 National Nutrition Assessment
100 Questionnaires
Cluster no. __ __ __ Household no. __ __ 2.5 IMMUNIZATION MODULE Ask the mother regarding the index (youngest) child experience (must be under 2 1. DID ( CHILD’S name) RECEIVE ANY VACCINATIONS
Yes .......................................................................1 No ........................................................................2 Don’t know..........................................................9
2 Next Module 9 Next Module
2. HAS (name) EVER BEEN GIVEN A BCG VACCINATION AGAINST TUBERCULOSIS – THAT IS, AN INJECTION IN THE LEFT SHOULDER THAT CAUSED A SCAR?
Yes .......................................................................1 No ........................................................................2 Don’t know..........................................................9
3. CHECK LEFT SHOULDER (MOST COMMON SITE) FOR BCG SCAR
Scar present .........................................................1 Scar absent...........................................................2 Unable to examine/ Don’t know .........................9
4. HAS (name) EVER BEEN GIVEN ANY “VACCINATION DROPS IN THE MOUTH” TO PROTECT HIM/HER FROM GETTING DISEASES – THAT IS, POLIO?
Yes .......................................................................1 No ........................................................................2 Don’t know..........................................................9
2 Q.7 9 Q.7
5. HOW OLD WAS HE/SHE WHEN THE FIRST DOSE WAS GIVEN – JUST AFTER BIRTH OR LATER?
Just after birth ......................................................1 Later.....................................................................2
6. HOW MANY TIMES HAS HE/SHE BEEN GIVEN THESE DROPS?
No. of times ..................................................__ __
7. HAS (name) EVER BEEN GIVEN “VACCINATION INJECTIONS” – THAT IS, AN INJECTION IN THE THIGH OR BUTTOCKS – TO PREVENT HIM/HER FROM GETTING TETANUS, WHOOPING COUGH, DIPHTHERIA? (sometimes given at the same time as polio)
Yes .......................................................................1 No ........................................................................2 Don’t know..........................................................9
2 Q.9 9 Q.9
8. HOW MANY TIMES? No. of times ..................................................__ __
9. HAS (name) EVER BEEN GIVEN “VACCINATION INJECTIONS” – THAT IS, A SHOT IN THE ARM AT THE AGE OF 9 MONTHS OR OLDER - TO PREVENT HIM/HER FROM GETTING MEASLES?
Yes .......................................................................1 No ........................................................................2 Don’t know..........................................................9
GO TO 2.6 MATERNAL FOOD INTAKE MODULE
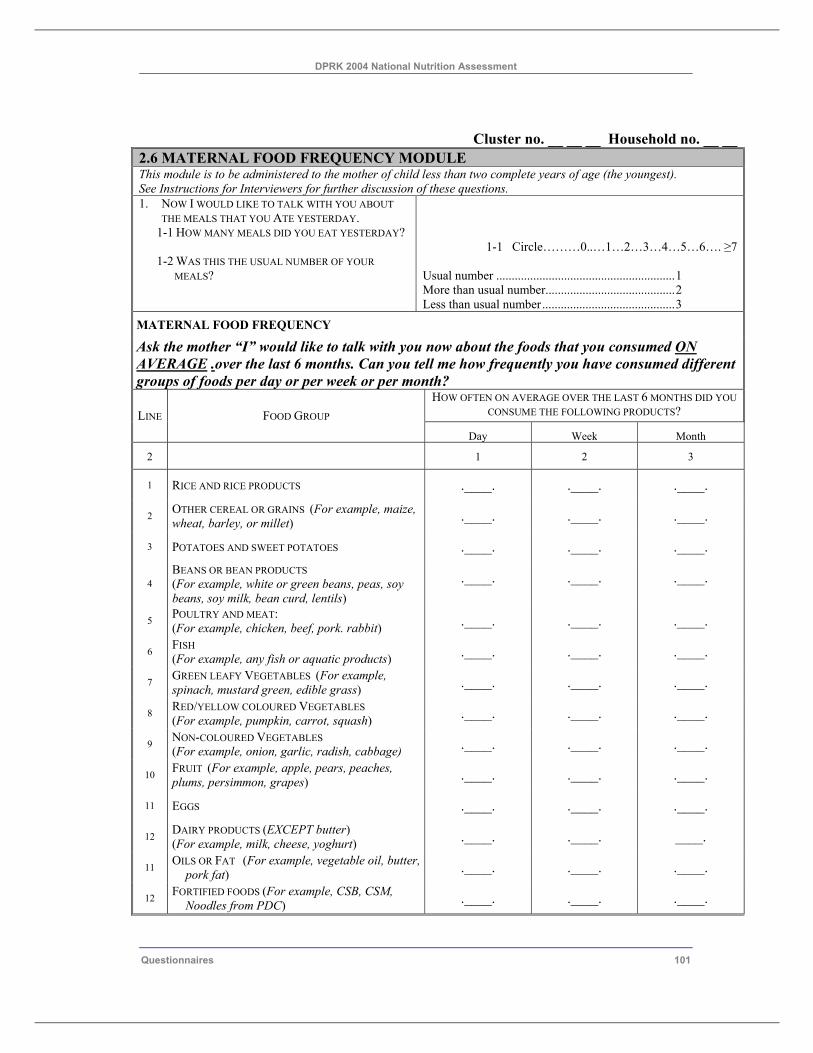
DPRK 2004 National Nutrition Assessment
Questionnaires 101
Cluster no. __ __ __ Household no. __ __ 2.6 MATERNAL FOOD FREQUENCY MODULE This module is to be administered to the mother of child less than two complete years of age (the youngest). See Instructions for Interviewers for further discussion of these questions. 1. NOW I WOULD LIKE TO TALK WITH YOU ABOUT
THE MEALS THAT YOU ATE YESTERDAY. 1-1 HOW MANY MEALS DID YOU EAT YESTERDAY? 1-2 WAS THIS THE USUAL NUMBER OF YOUR
MEALS?
1-1 Circle………0..…1…2…3…4…5…6…. ≥7
Usual number ..........................................................1 More than usual number..........................................2 Less than usual number...........................................3
MATERNAL FOOD FREQUENCY Ask the mother “I” would like to talk with you now about the foods that you consumed ON AVERAGE .over the last 6 months. Can you tell me how frequently you have consumed different groups of foods per day or per week or per month?
HOW OFTEN ON AVERAGE OVER THE LAST 6 MONTHS DID YOU CONSUME THE FOLLOWING PRODUCTS? LINE FOOD GROUP
Day Week Month
2 1 2 3
1 RICE AND RICE PRODUCTS .____. .____. .____.
2 OTHER CEREAL OR GRAINS (For example, maize, wheat, barley, or millet) .____. .____. .____.
3 POTATOES AND SWEET POTATOES .____. .____. .____.
4 BEANS OR BEAN PRODUCTS (For example, white or green beans, peas, soy beans, soy milk, bean curd, lentils)
.____. .____. .____.
5 POULTRY AND MEAT: (For example, chicken, beef, pork. rabbit) .____. .____. .____.
6 FISH (For example, any fish or aquatic products) .____. .____. .____.
7 GREEN LEAFY VEGETABLES (For example, spinach, mustard green, edible grass) .____. .____. .____.
8 RED/YELLOW COLOURED VEGETABLES (For example, pumpkin, carrot, squash) .____. .____. .____.
9 NON-COLOURED VEGETABLES (For example, onion, garlic, radish, cabbage) .____. .____. .____.
10 FRUIT (For example, apple, pears, peaches, plums, persimmon, grapes) .____. .____. .____.
11 EGGS .____. .____. .____.
12 DAIRY PRODUCTS (EXCEPT butter) (For example, milk, cheese, yoghurt) .____. .____. ____.
11 OILS OR FAT (For example, vegetable oil, butter, pork fat) .____. .____. .____.
12 FORTIFIED FOODS (For example, CSB, CSM, Noodles from PDC) .____. .____. .____.
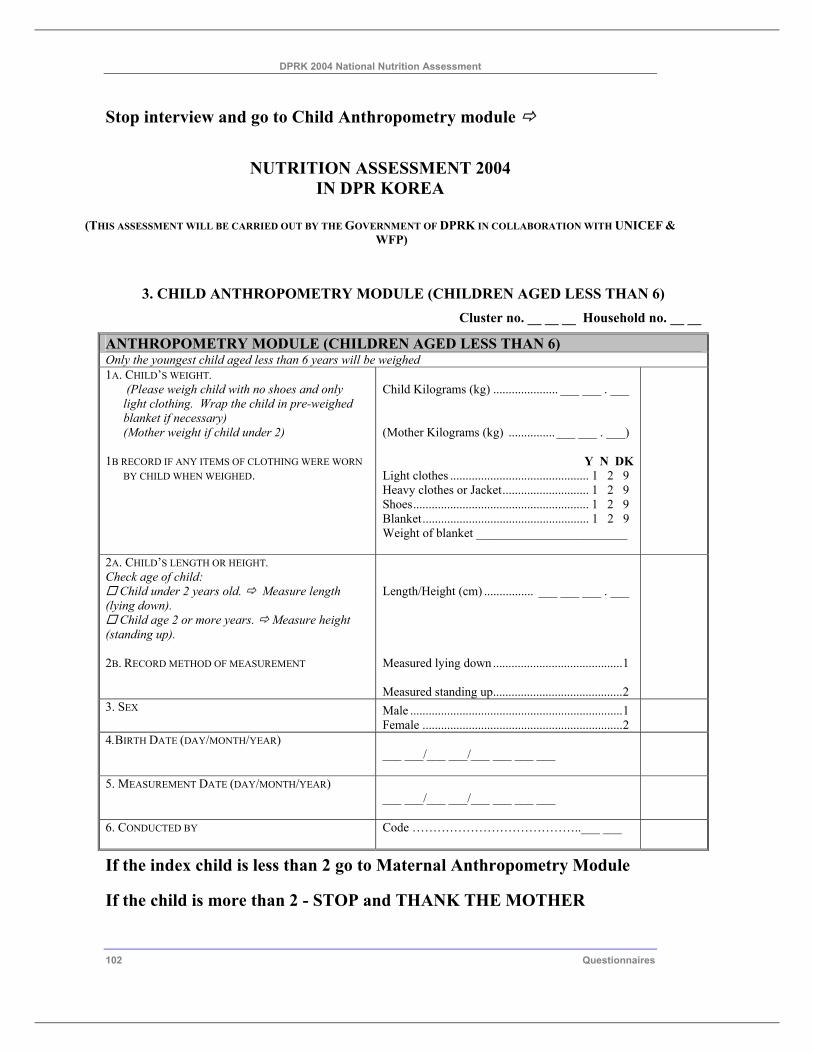
DPRK 2004 National Nutrition Assessment
102 Questionnaires
Stop interview and go to Child Anthropometry module
NUTRITION ASSESSMENT 2004 IN DPR KOREA
(THIS ASSESSMENT WILL BE CARRIED OUT BY THE GOVERNMENT OF DPRK IN COLLABORATION WITH UNICEF &
WFP)
3. CHILD ANTHROPOMETRY MODULE (CHILDREN AGED LESS THAN 6) Cluster no. __ __ __ Household no. __ __
ANTHROPOMETRY MODULE (CHILDREN AGED LESS THAN 6) Only the youngest child aged less than 6 years will be weighed 1A. CHILD’S WEIGHT.
(Please weigh child with no shoes and only light clothing. Wrap the child in pre-weighed blanket if necessary) (Mother weight if child under 2)
1B RECORD IF ANY ITEMS OF CLOTHING WERE WORN
BY CHILD WHEN WEIGHED.
Child Kilograms (kg) ..................... ___ ___ . ___ (Mother Kilograms (kg) ...............___ ___ . ___)
Y N DK Light clothes ............................................. 1 2 9 Heavy clothes or Jacket............................ 1 2 9 Shoes......................................................... 1 2 9 Blanket...................................................... 1 2 9 Weight of blanket ________________________
2A. CHILD’S LENGTH OR HEIGHT. Check age of child:
Child under 2 years old. Measure length (lying down).
Child age 2 or more years. Measure height (standing up). 2B. RECORD METHOD OF MEASUREMENT
Length/Height (cm) ................ ___ ___ ___ . ___ Measured lying down ..........................................1 Measured standing up..........................................2
3. SEX
Male .....................................................................1 Female .................................................................2
4.BIRTH DATE (DAY/MONTH/YEAR) ___ ___/___ ___/___ ___ ___ ___
5. MEASUREMENT DATE (DAY/MONTH/YEAR) ___ ___/___ ___/___ ___ ___ ___
6. CONDUCTED BY Code …………………………………..___ ___
If the index child is less than 2 go to Maternal Anthropometry Module
If the child is more than 2 - STOP and THANK THE MOTHER
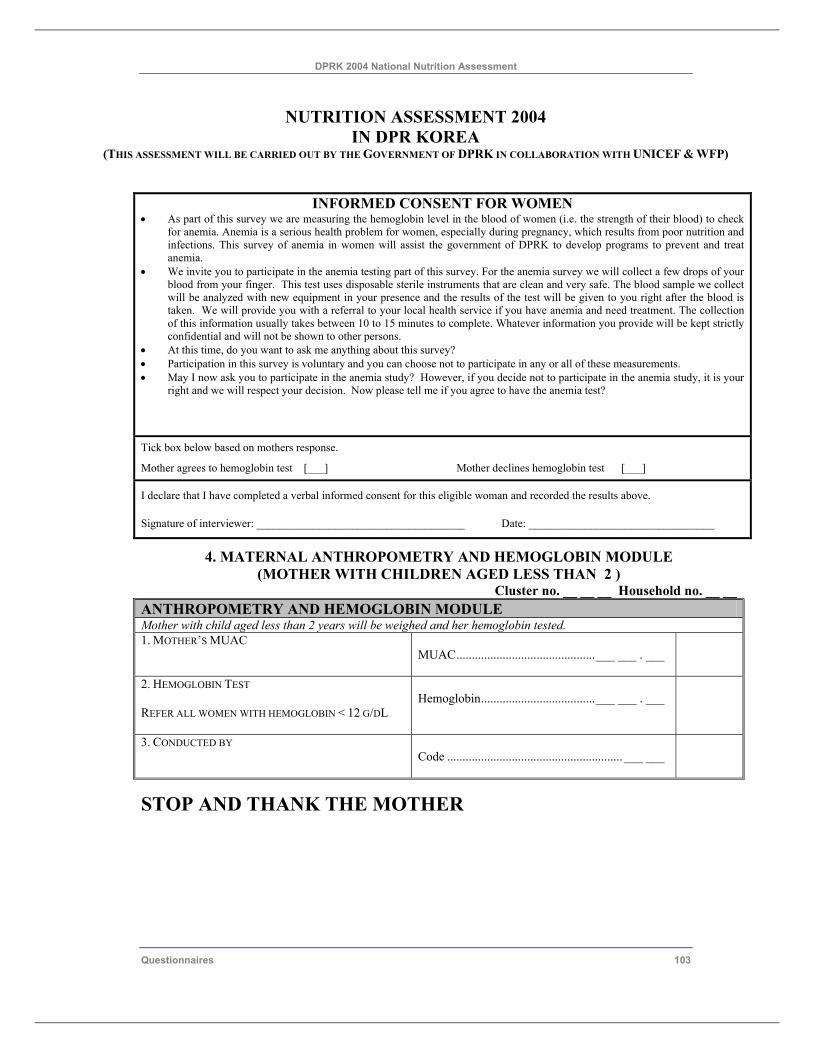
DPRK 2004 National Nutrition Assessment
Questionnaires 103
NUTRITION ASSESSMENT 2004 IN DPR KOREA
(THIS ASSESSMENT WILL BE CARRIED OUT BY THE GOVERNMENT OF DPRK IN COLLABORATION WITH UNICEF & WFP)
INFORMED CONSENT FOR WOMEN
• As part of this survey we are measuring the hemoglobin level in the blood of women (i.e. the strength of their blood) to check for anemia. Anemia is a serious health problem for women, especially during pregnancy, which results from poor nutrition and infections. This survey of anemia in women will assist the government of DPRK to develop programs to prevent and treat anemia.
• We invite you to participate in the anemia testing part of this survey. For the anemia survey we will collect a few drops of your blood from your finger. This test uses disposable sterile instruments that are clean and very safe. The blood sample we collect will be analyzed with new equipment in your presence and the results of the test will be given to you right after the blood is taken. We will provide you with a referral to your local health service if you have anemia and need treatment. The collection of this information usually takes between 10 to 15 minutes to complete. Whatever information you provide will be kept strictly confidential and will not be shown to other persons.
• At this time, do you want to ask me anything about this survey? • Participation in this survey is voluntary and you can choose not to participate in any or all of these measurements. • May I now ask you to participate in the anemia study? However, if you decide not to participate in the anemia study, it is your
right and we will respect your decision. Now please tell me if you agree to have the anemia test?
Tick box below based on mothers response.
Mother agrees to hemoglobin test [___] Mother declines hemoglobin test [___]
I declare that I have completed a verbal informed consent for this eligible woman and recorded the results above.
Signature of interviewer: _____________________________________ Date: _________________________________
4. MATERNAL ANTHROPOMETRY AND HEMOGLOBIN MODULE (MOTHER WITH CHILDREN AGED LESS THAN 2 )
Cluster no. __ __ __ Household no. __ __ANTHROPOMETRY AND HEMOGLOBIN MODULE Mother with child aged less than 2 years will be weighed and her hemoglobin tested. 1. MOTHER’S MUAC
MUAC.............................................___ ___ . ___
2. HEMOGLOBIN TEST REFER ALL WOMEN WITH HEMOGLOBIN < 12 G/DL
Hemoglobin.....................................___ ___ . ___
3. CONDUCTED BY
Code .........................................................___ ___
STOP AND THANK THE MOTHER
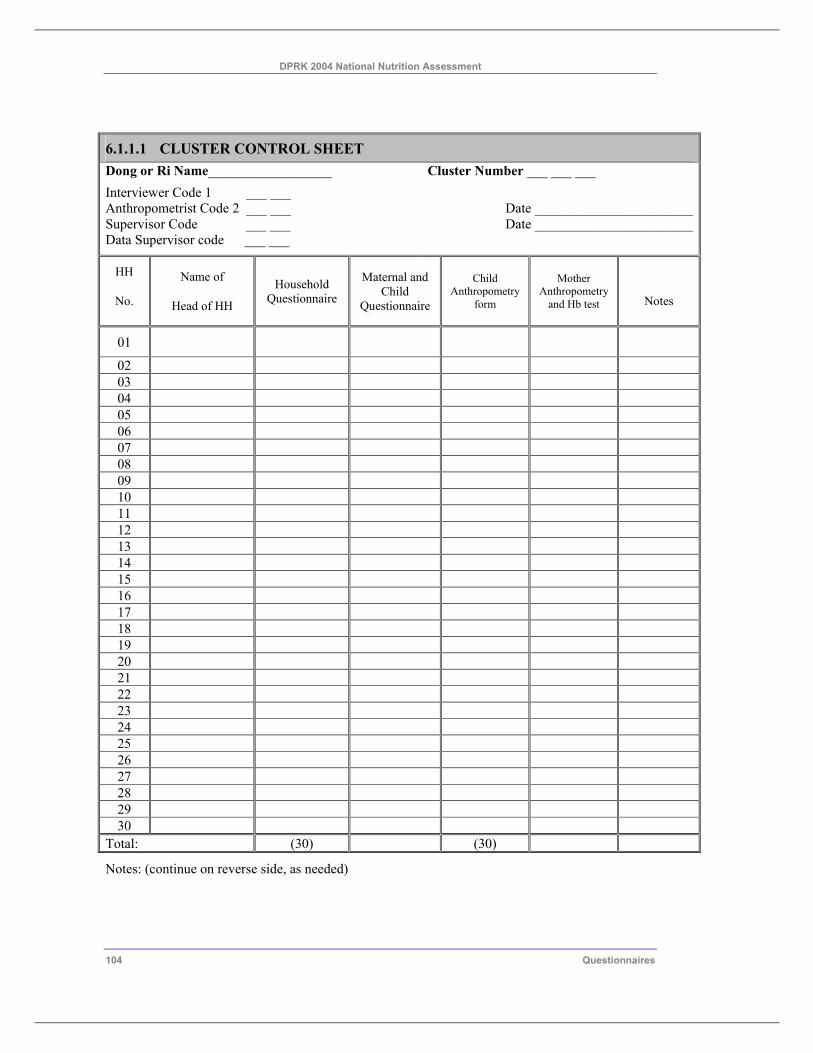
DPRK 2004 National Nutrition Assessment
104 Questionnaires
6.1.1.1 CLUSTER CONTROL SHEET Dong or Ri Name__________________ Cluster Number ___ ___ ___ Interviewer Code 1 ___ ___ Anthropometrist Code 2 ___ ___ Supervisor Code ___ ___ Data Supervisor code ___ ___
Date _______________________Date _______________________
HH
No.
Name of
Head of HH
Household Questionnaire
Maternal and Child
Questionnaire
Child Anthropometry
form
Mother Anthropometry
and Hb test
Notes
01
02 03 04 05 06 07 08 09 10 11 12 13 14 15 16 17 18 19 20 21 22 23 24 25 26 27 28 29 30
Total: (30) (30)
Notes: (continue on reverse side, as needed)