Embed Size (px)
DESCRIPTION
THE RIPPLE EFFECT OF PRINCIPAL BEHAVIOR: Improving Teacher Instructional Practices through Principal-Teacher Interactions. Dr. Brennon Sapp EdD. Origin of the Study. - PowerPoint PPT Presentation
Citation preview
THE RIPPLE EFFECT OF PRINCIPAL BEHAVIOR:Improving Teacher Instructional Practices through
Principal-Teacher Interactions
Dr. Brennon Sapp EdD

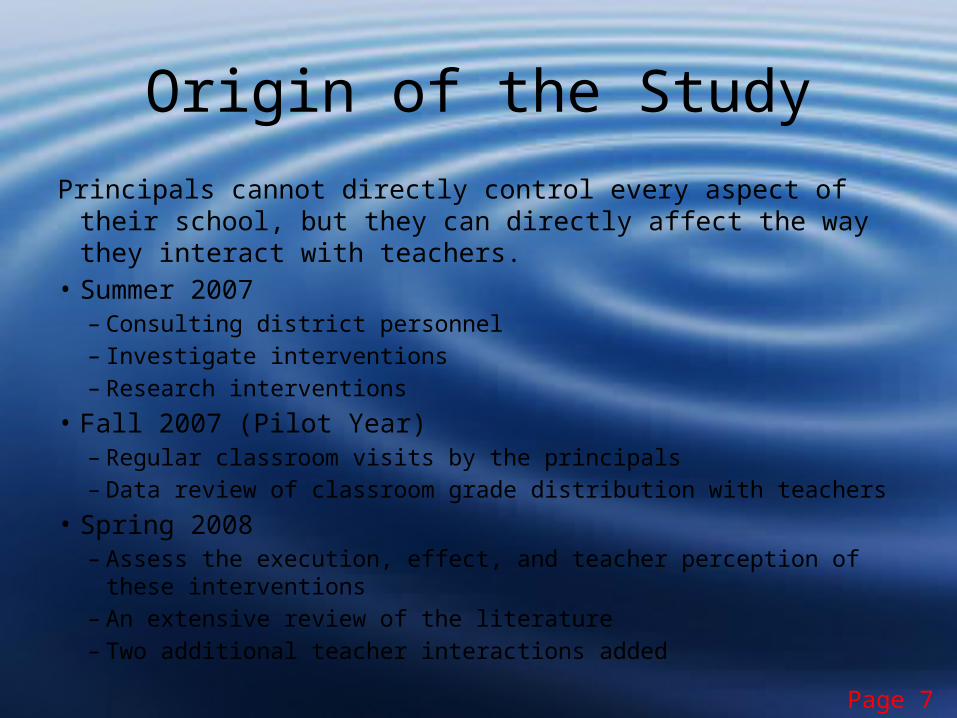
Origin of the StudyPrincipals cannot directly control every aspect of their school, but they
can directly affect the way they interact with teachers. • Summer 2007
– Consulting district personnel– Investigate interventions– Research interventions
• Fall 2007 (Pilot Year)– Regular classroom visits by the principals– Data review of classroom grade distribution with teachers
• Spring 2008 – Assess the execution, effect, and teacher perception of these
interventions– An extensive review of the literature– Two additional teacher interactions added
Page 7
So. . .
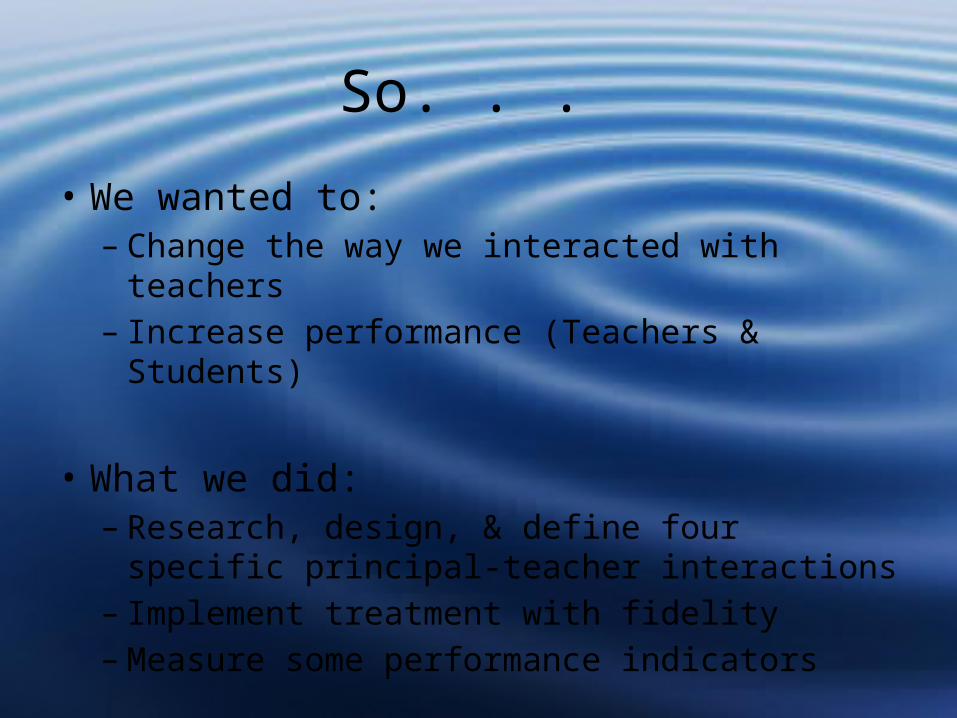
• We wanted to:– Change the way we interacted with teachers– Increase performance (Teachers & Students)
• What we did:– Research, design, & define four specific principal-
teacher interactions– Implement treatment with fidelity– Measure some performance indicators
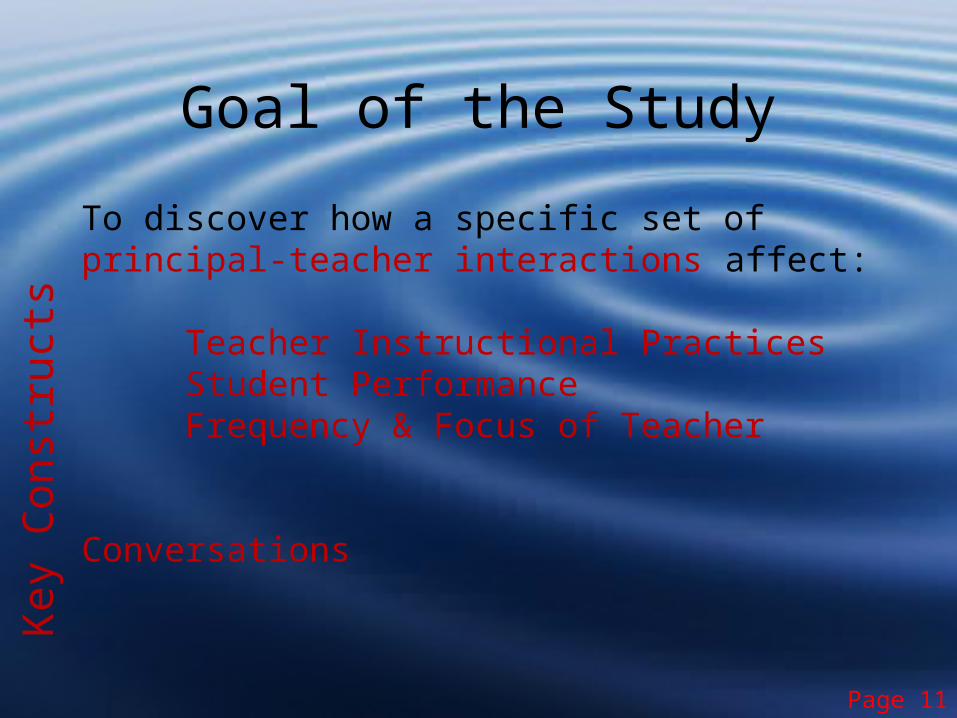
To discover how a specific set of principal-teacher interactions affect:
Teacher Instructional Practices Student Performance Frequency & Focus of Teacher Conversations
Page 11
Goal of the StudyKe
y Co
nstr
ucts
Research Questions
Page 11
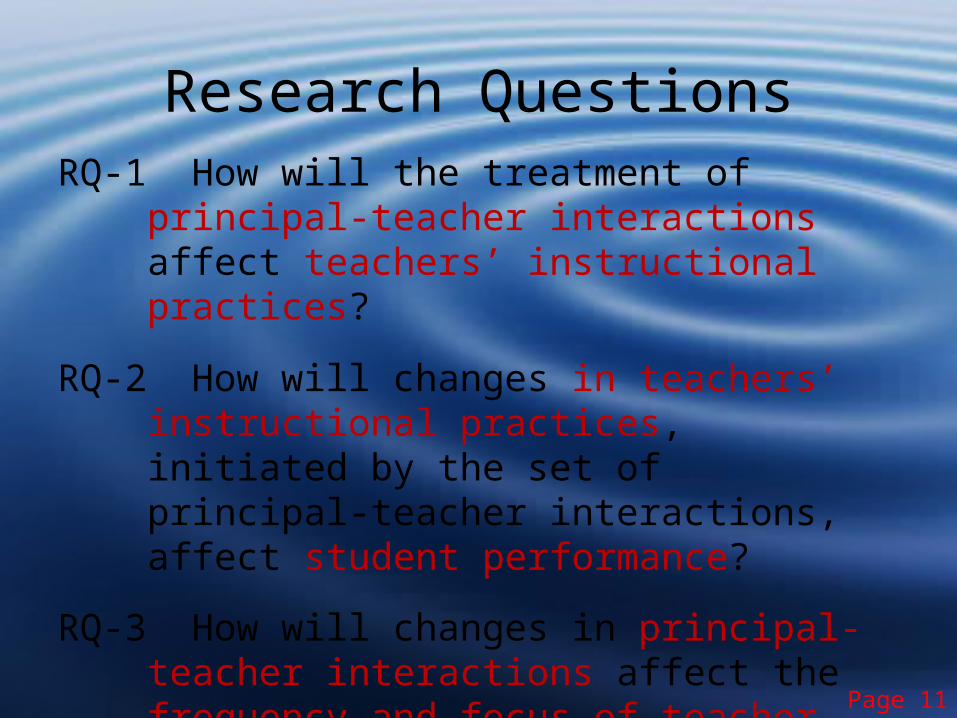
RQ-1 How will the treatment of principal-teacher interactions affect teachers’ instructional practices?
RQ-2 How will changes in teachers’ instructional practices, initiated by the set of principal-teacher interactions, affect student performance?
RQ-3 How will changes in principal-teacher interactions affect the frequency and focus of teacher conversations with principals, students, and other teachers?
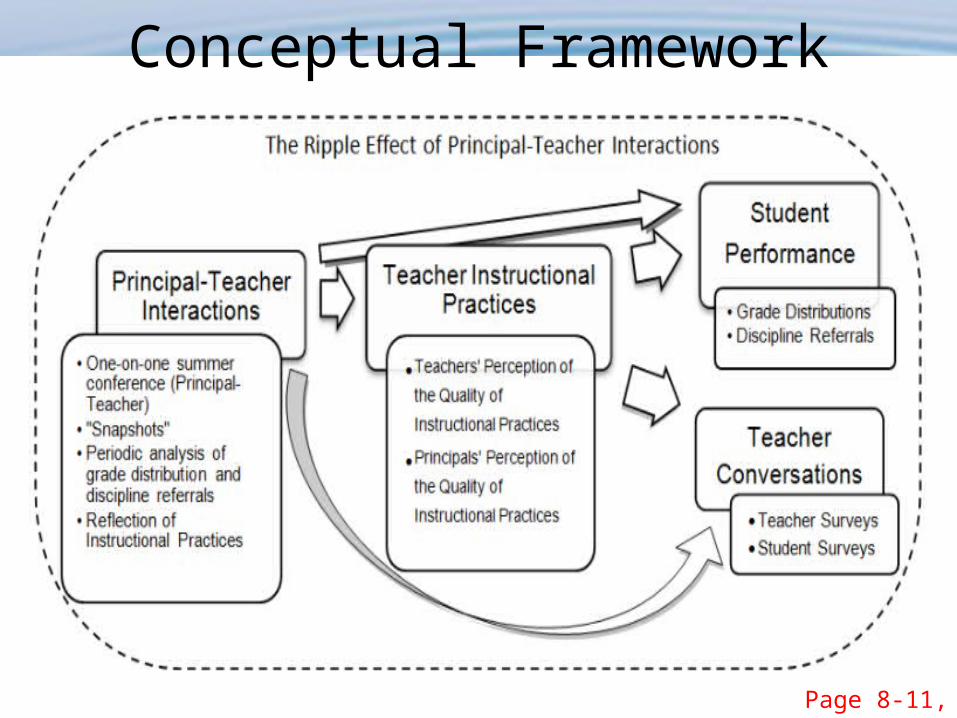
Conceptual Framework
Page 8-11, Figure 1
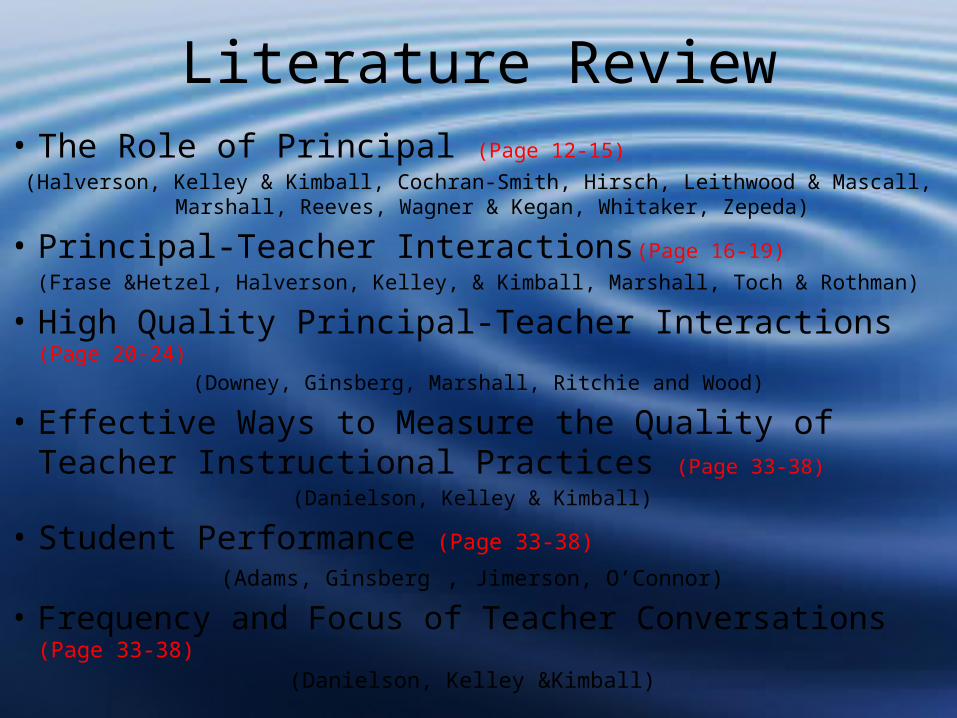
Literature Review• The Role of Principal (Page 12-15)
(Halverson, Kelley & Kimball, Cochran-Smith, Hirsch, Leithwood & Mascall, Marshall, Reeves, Wagner & Kegan, Whitaker, Zepeda)
• Principal-Teacher Interactions(Page 16-19)(Frase &Hetzel, Halverson, Kelley, & Kimball, Marshall, Toch & Rothman)
• High Quality Principal-Teacher Interactions (Page 20-24)(Downey, Ginsberg, Marshall, Ritchie and Wood)
• Effective Ways to Measure the Quality of Teacher Instructional Practices (Page 33-38)
(Danielson, Kelley & Kimball)
• Student Performance (Page 33-38)
(Adams, Ginsberg , Jimerson, O’Connor)
• Frequency and Focus of Teacher Conversations (Page 33-38)(Danielson, Kelley &Kimball)
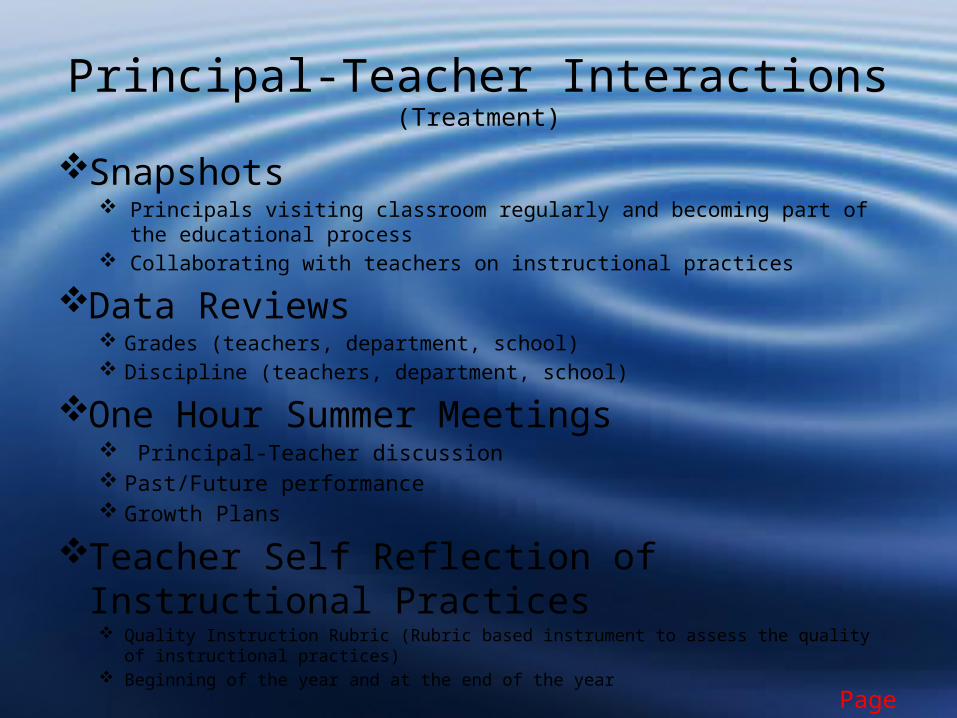
Principal-Teacher Interactions(Treatment)
Snapshots Principals visiting classroom regularly and becoming part of the educational
process Collaborating with teachers on instructional practices
Data Reviews Grades (teachers, department, school) Discipline (teachers, department, school)
One Hour Summer Meetings Principal-Teacher discussion Past/Future performance Growth Plans
Teacher Self Reflection of Instructional Practices Quality Instruction Rubric (Rubric based instrument to assess the quality of instructional practices) Beginning of the year and at the end of the year
Page 66-70
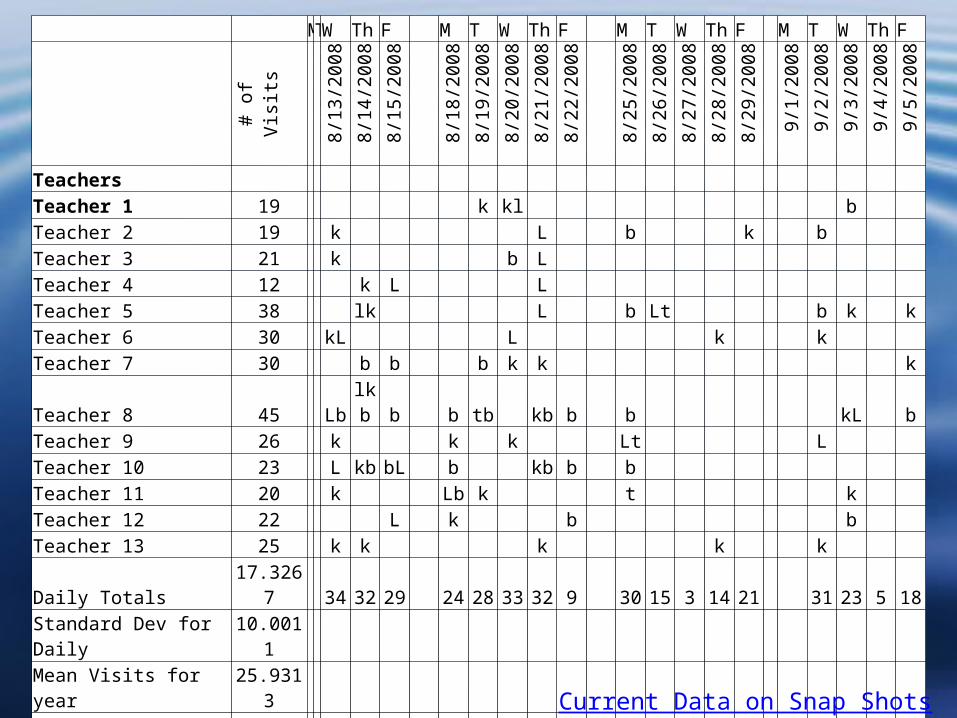
MTW Th F M T W Th F M T W Th F M T W Th F
# of
Visits
8/13/2007
8/14/2007
8/13/2008
8/14/200
8
8/15/200
8
8/18/200
8
8/19/200
8
8/20/200
8
8/21/200
8
8/22/200
8
8/25/200
8
8/26/200
8
8/27/200
8
8/28/200
8
8/29/200
8
9/1/2008
9/2/2008
9/3/2008
9/4/2008
9/5/2008
Teachers Teacher 1 19 k kl b Teacher 2 19 k L b k b Teacher 3 21 k b L Teacher 4 12 k L L Teacher 5 38 lk L b Lt b k kTeacher 6 30 kL L k k Teacher 7 30 b b b k k kTeacher 8 45 Lb lkb b b tb kb b b kL bTeacher 9 26 k k k Lt L Teacher 10 23 L kb bL b kb b b Teacher 11 20 k Lb k t k Teacher 12 22 L k b b Teacher 13 25 k k k k k Daily Totals 17.3267 34 32 29 24 28 33 32 9 30 15 3 14 21 31 23 5 18Standard Dev for Daily 10.0011 Mean Visits for year 25.9313 Standard Dev for year 9.79159 Kim 480 Larry 510 Tom 109 Brennon 554 Total visits 1653
Current Data on Snap Shots
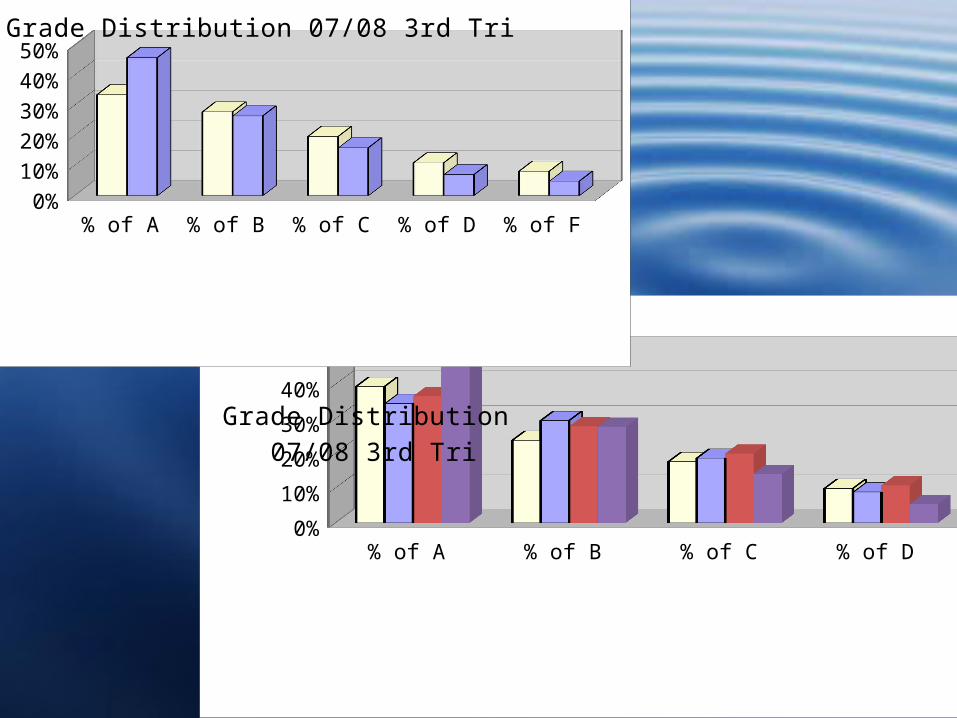
% of A % of B % of C % of D % of F0%
10%
20%
30%
40%
50%
Grade Distribution 07/08 3rd Tri
% of A % of B % of C % of D % of F0%
10%20%30%40%50%
Grade Distribution 07/08 3rd Tri
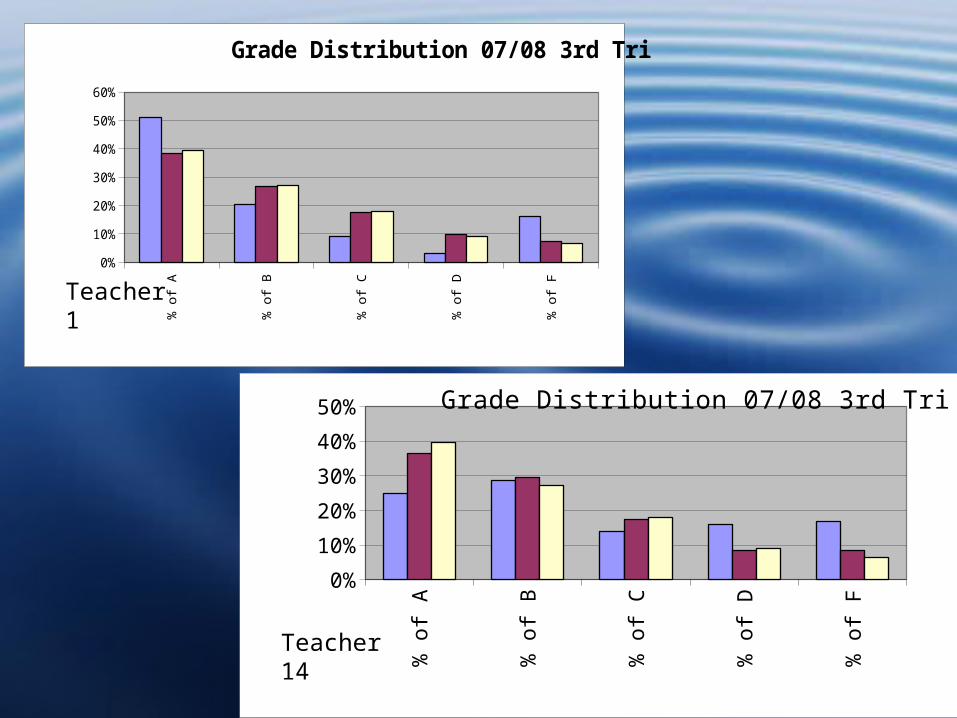
% o
f A
% o
f B
% o
f C
% o
f D
% o
f F
0%
10%
20%
30%
40%
50%
60%
Grade Distribution 07/08 3rd Tri
% o
f A
% o
f B
% o
f C
% o
f D
% o
f F
0%
10%
20%
30%
40%
50% Grade Distribution 07/08 3rd Tri
Teacher 1
Teacher 14
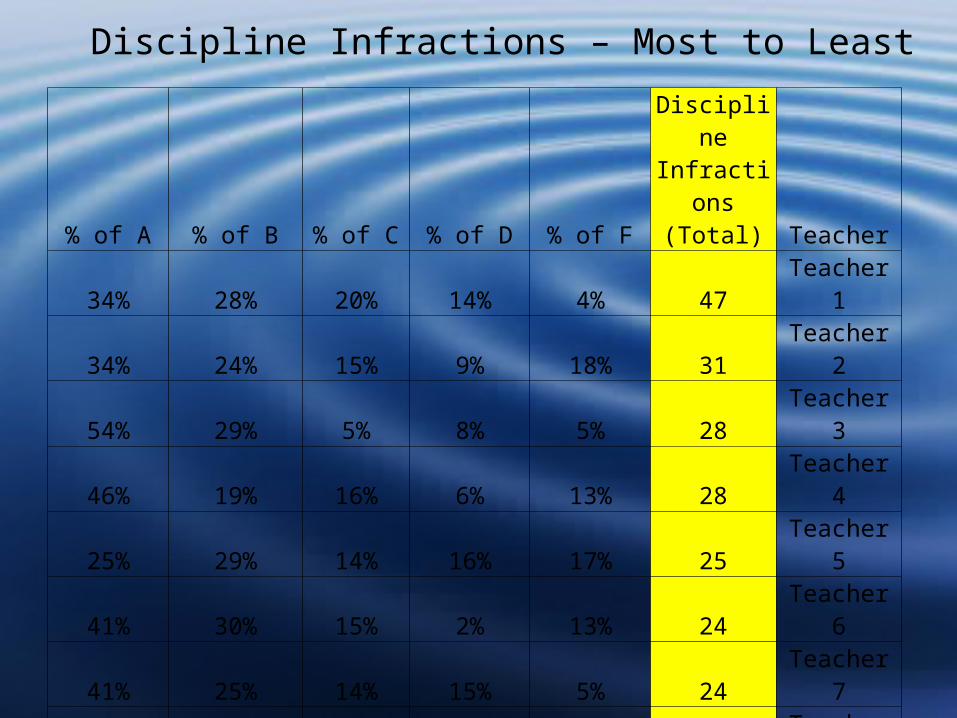
Discipline Infractions – Most to Least
% of A % of B % of C % of D % of F
Discipline Infractions
(Total) Teacher34% 28% 20% 14% 4% 47 Teacher 134% 24% 15% 9% 18% 31 Teacher 254% 29% 5% 8% 5% 28 Teacher 346% 19% 16% 6% 13% 28 Teacher 425% 29% 14% 16% 17% 25 Teacher 541% 30% 15% 2% 13% 24 Teacher 641% 25% 14% 15% 5% 24 Teacher 727% 28% 20% 13% 12% 24 Teacher 852% 20% 13% 9% 7% 22 Teacher 9
33% 34% 19% 9% 5% 22 Teacher 1032% 29% 15% 15% 10% 20 Teacher 11
30% 30% 23% 8% 9% 19 Teacher 1237% 34% 10% 11% 10% 17 Teacher 13
37% 27% 25% 6% 6% 16 Teacher 1423% 40% 17% 12% 9% 16 Teacher 15
14% 23% 20% 34% 9% 15 Teacher 16
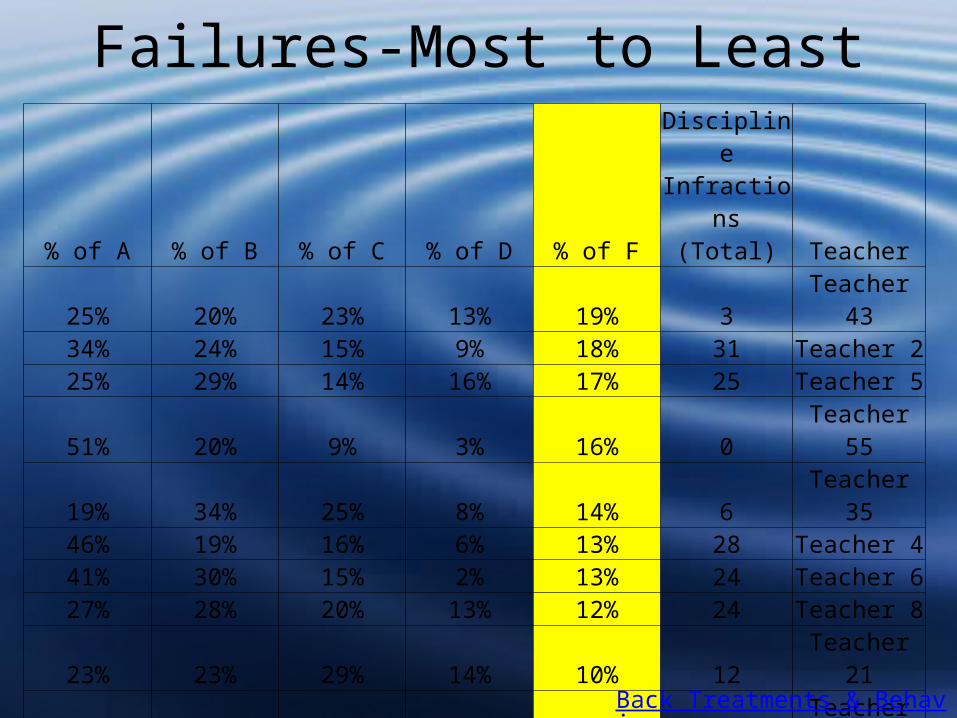
Failures-Most to Least
% of A % of B % of C % of D % of F
Discipline Infractions
(Total) Teacher25% 20% 23% 13% 19% 3 Teacher 4334% 24% 15% 9% 18% 31 Teacher 225% 29% 14% 16% 17% 25 Teacher 551% 20% 9% 3% 16% 0 Teacher 5519% 34% 25% 8% 14% 6 Teacher 3546% 19% 16% 6% 13% 28 Teacher 441% 30% 15% 2% 13% 24 Teacher 627% 28% 20% 13% 12% 24 Teacher 823% 23% 29% 14% 10% 12 Teacher 2123% 26% 24% 16% 10% 7 Teacher 3237% 34% 10% 11% 10% 17 Teacher 1332% 29% 15% 15% 10% 20 Teacher 1123% 40% 17% 12% 9% 16 Teacher 1530% 30% 23% 8% 9% 19 Teacher 1221% 29% 21% 19% 9% 11 Teacher 2214% 23% 20% 34% 9% 15 Teacher 1641% 29% 18% 4% 8% 8 Teacher 31
Back Treatments & Behaviors
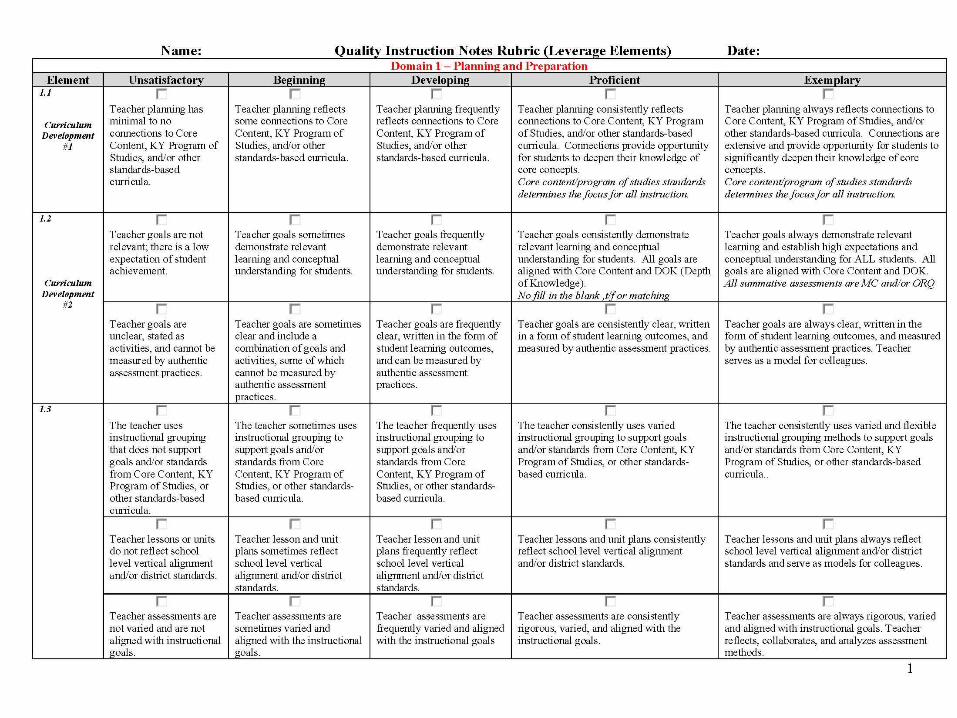
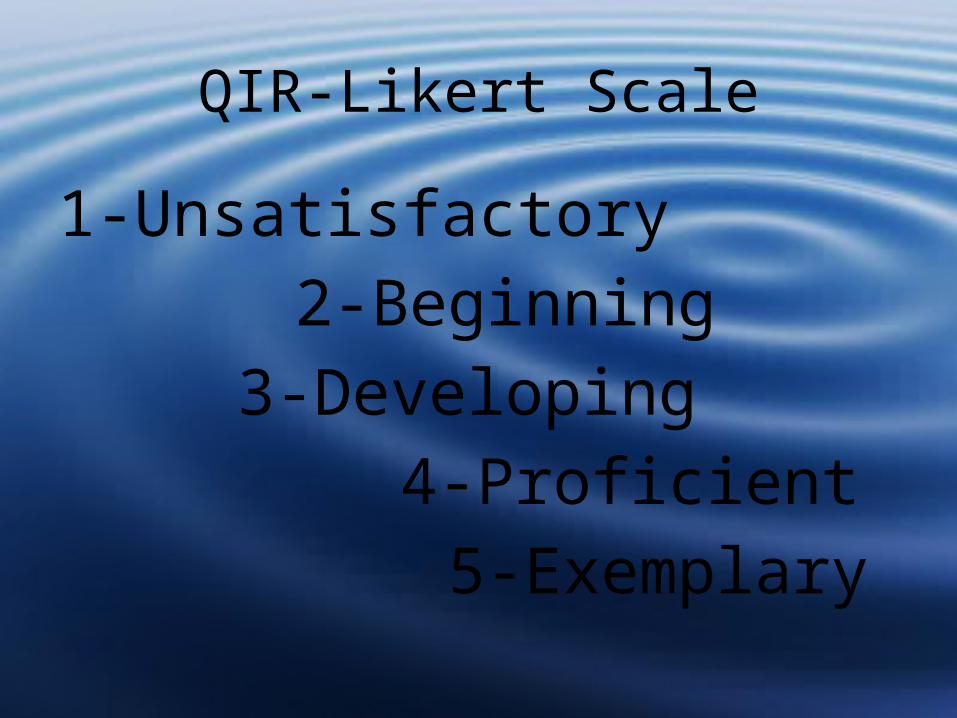
QIR-Likert Scale
1-Unsatisfactory 2-Beginning3-Developing 4-Proficient 5-Exemplary
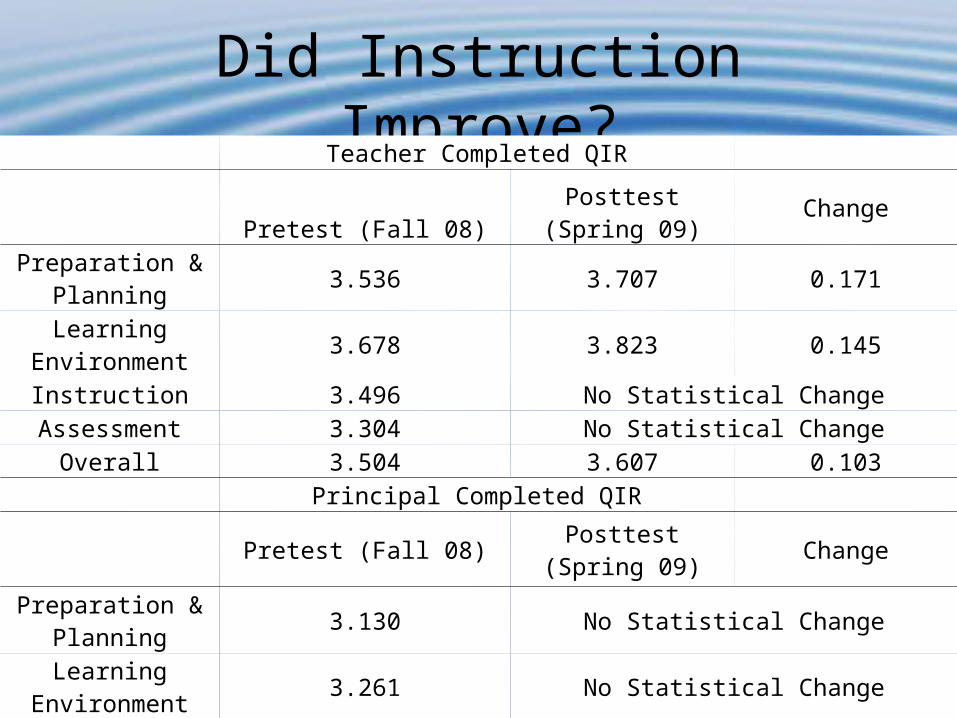
Did Instruction Improve?Teacher Completed QIR
Pretest (Fall 08) Posttest (Spring 09)Change
Preparation & Planning 3.536 3.707 0.171
Learning Environment 3.678 3.823 0.145
Instruction 3.496 No Statistical ChangeAssessment 3.304 No Statistical Change
Overall 3.504 3.607 0.103Principal Completed QIR
Pretest (Fall 08) Posttest (Spring 09) Change
Preparation & Planning 3.130 No Statistical Change
Learning Environment 3.261 No Statistical Change
Instruction 2.835 3.089 0.253Assessment 2.685 2.978 0.293
Overall 2.978 3.139 0.161
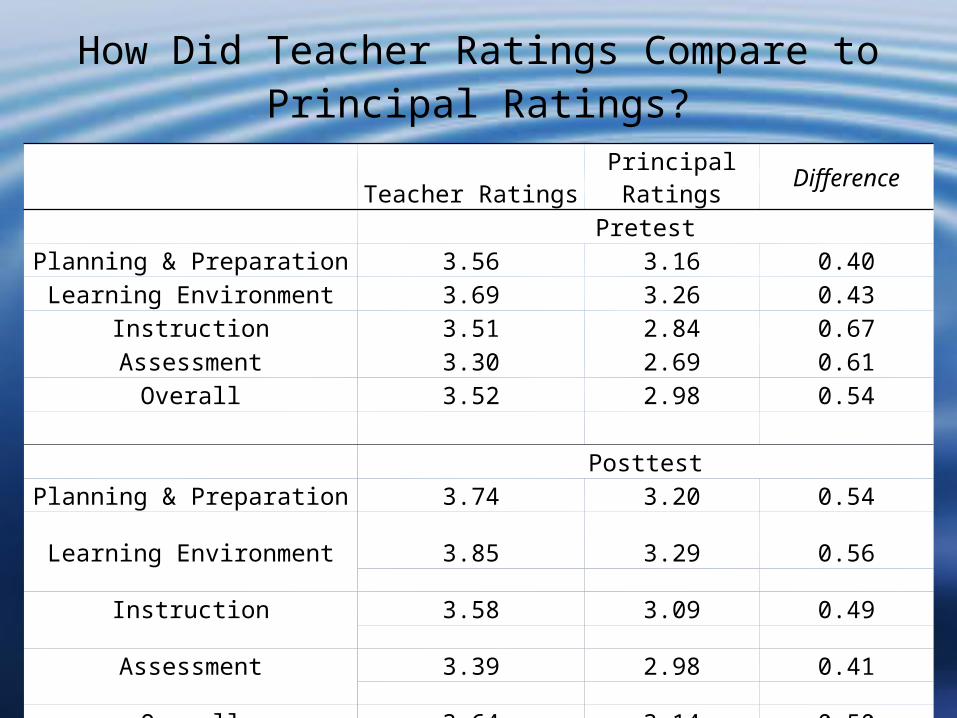
How Did Teacher Ratings Compare to Principal Ratings?
Teacher Ratings Principal Ratings DifferencePretest
Planning & Preparation 3.56 3.16 0.40Learning Environment 3.69 3.26 0.43
Instruction 3.51 2.84 0.67Assessment 3.30 2.69 0.61
Overall 3.52 2.98 0.54
PosttestPlanning & Preparation 3.74 3.20 0.54
Learning Environment 3.85 3.29 0.56
Instruction 3.58 3.09 0.49
Assessment 3.39 2.98 0.41
Overall 3.64 3.14 0.50

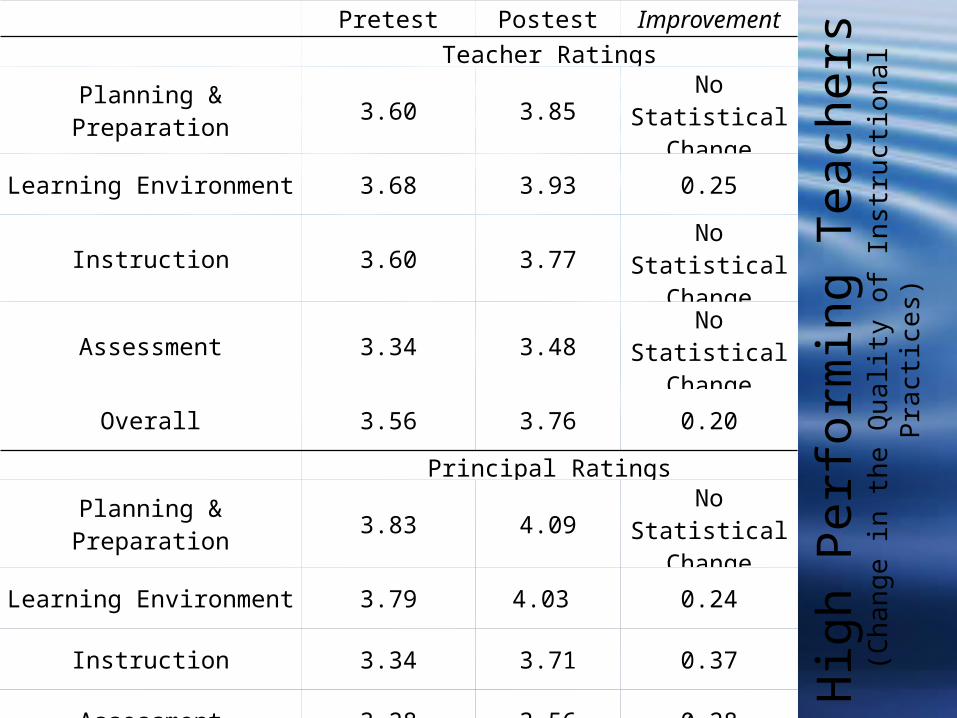
Grouping Teachers into Performance Levels
Hig
h Pe
rfor
min
g Te
ache
rs(C
hang
e in
the
Qua
lity
of In
stru
ctio
nal P
ract
ices
)
Pretest Postest Improvement Teacher Ratings
Planning & Preparation 3.60 3.85 No Statistical Change
Learning Environment 3.68 3.93 0.25
Instruction 3.60 3.77 No Statistical Change
Assessment 3.34 3.48 No Statistical Change
Overall 3.56 3.76 0.20
Principal Ratings
Planning & Preparation 3.83 4.09 No Statistical Change
Learning Environment 3.79 4.03 0.24
Instruction 3.34 3.71 0.37
Assessment 3.28 3.56 0.28
Overall 3.56 3.85 0.29
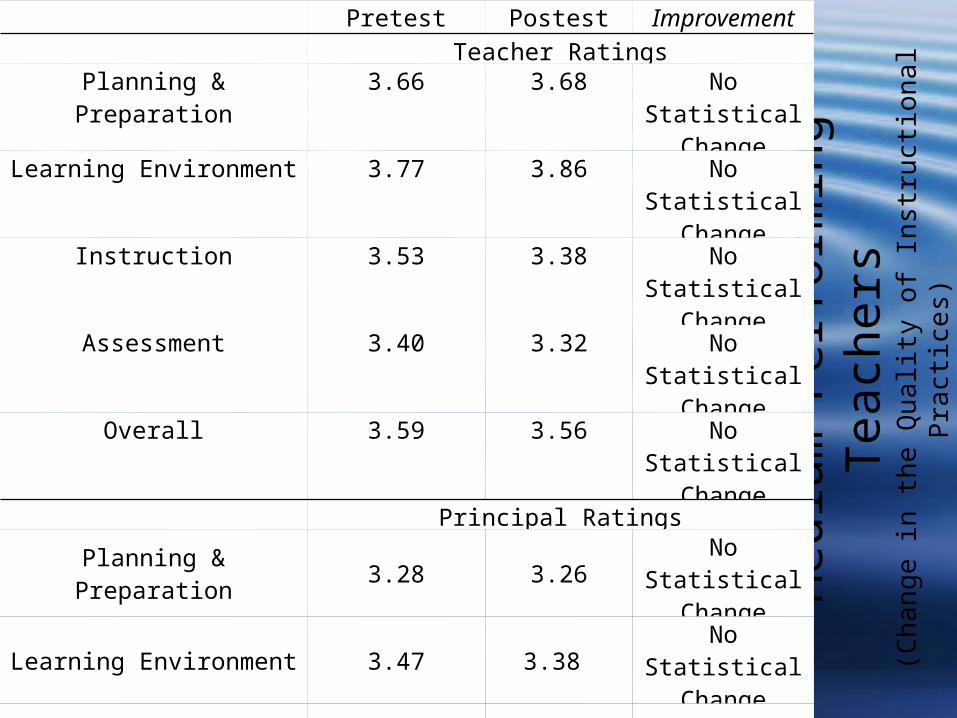
Med
ium
Per
form
ing
Teac
hers
(Cha
nge
in th
e Q
ualit
y of
Inst
ruct
iona
l Pra
ctic
es)
Pretest Postest Improvement Teacher Ratings
Planning & Preparation 3.66 3.68 No Statistical Change
Learning Environment 3.77 3.86 No Statistical Change
Instruction 3.53 3.38 No Statistical Change
Assessment 3.40 3.32 No Statistical Change
Overall 3.59 3.56 No Statistical Change
Principal Ratings
Planning & Preparation 3.28 3.26 No Statistical Change
Learning Environment 3.47 3.38 No Statistical Change
Instruction 2.99 3.17 0.18
Assessment 2.85 3.01 No Statistical Change
Overall 3.15 3.21 No Statistical Change
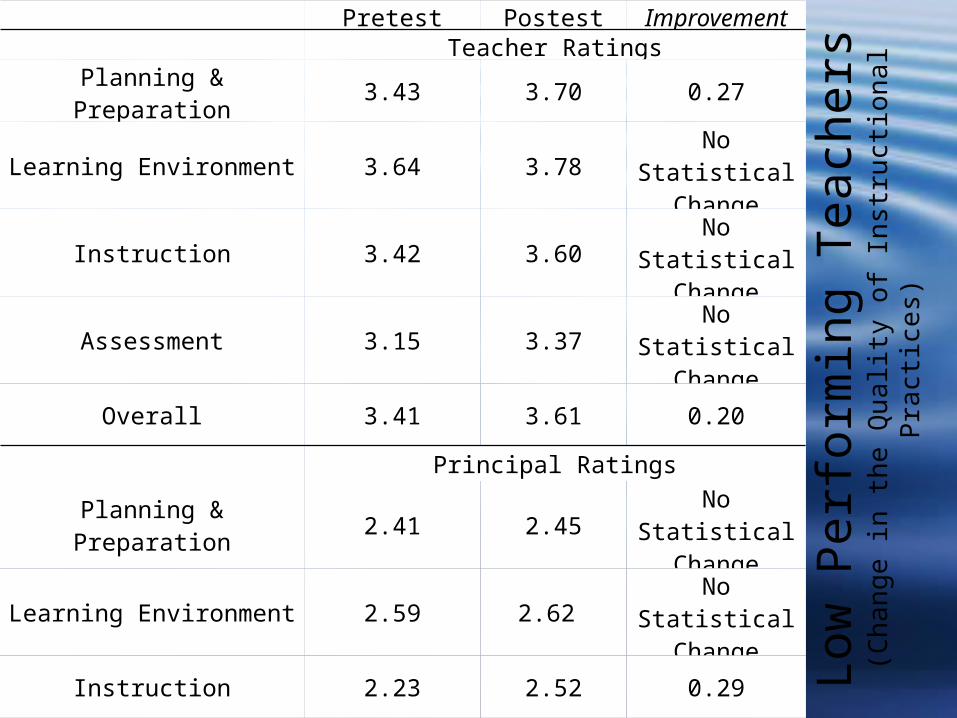
Low
Per
form
ing
Teac
hers
(Cha
nge
in th
e Q
ualit
y of
Inst
ruct
iona
l Pra
ctic
es)
Pretest Postest Improvement Teacher Ratings
Planning & Preparation 3.43 3.70 0.27
Learning Environment 3.64 3.78 No Statistical Change
Instruction 3.42 3.60 No Statistical Change
Assessment 3.15 3.37 No Statistical Change
Overall 3.41 3.61 0.20
Principal Ratings
Planning & Preparation 2.41 2.45 No Statistical Change
Learning Environment 2.59 2.62 No Statistical Change
Instruction 2.23 2.52 0.29
Assessment 2.02 2.41 0.39
Overall 2.31 2.50 0.19
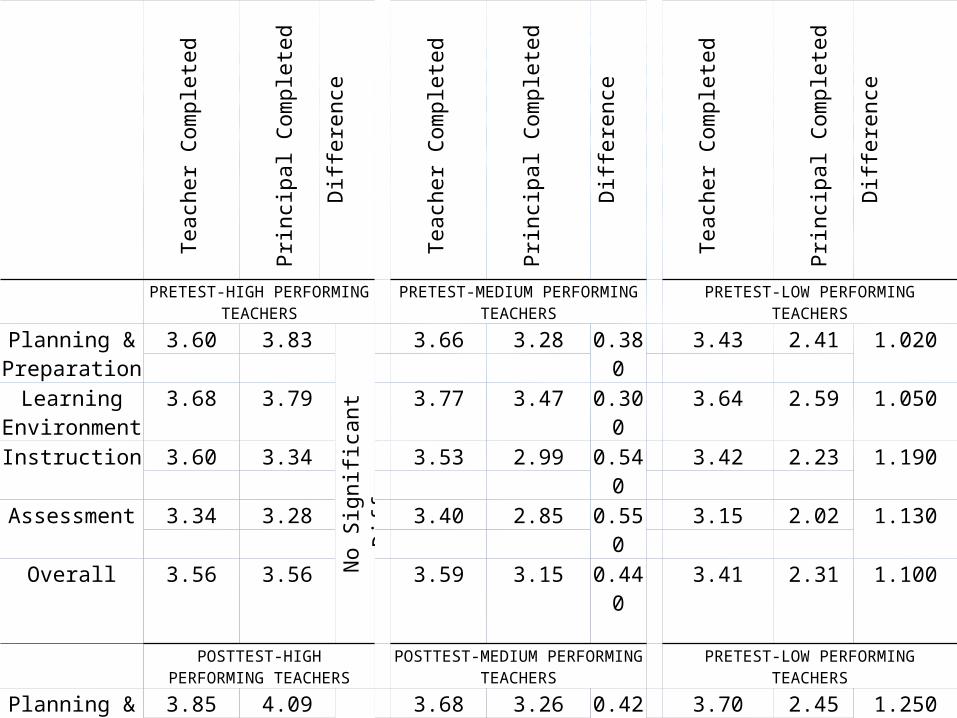
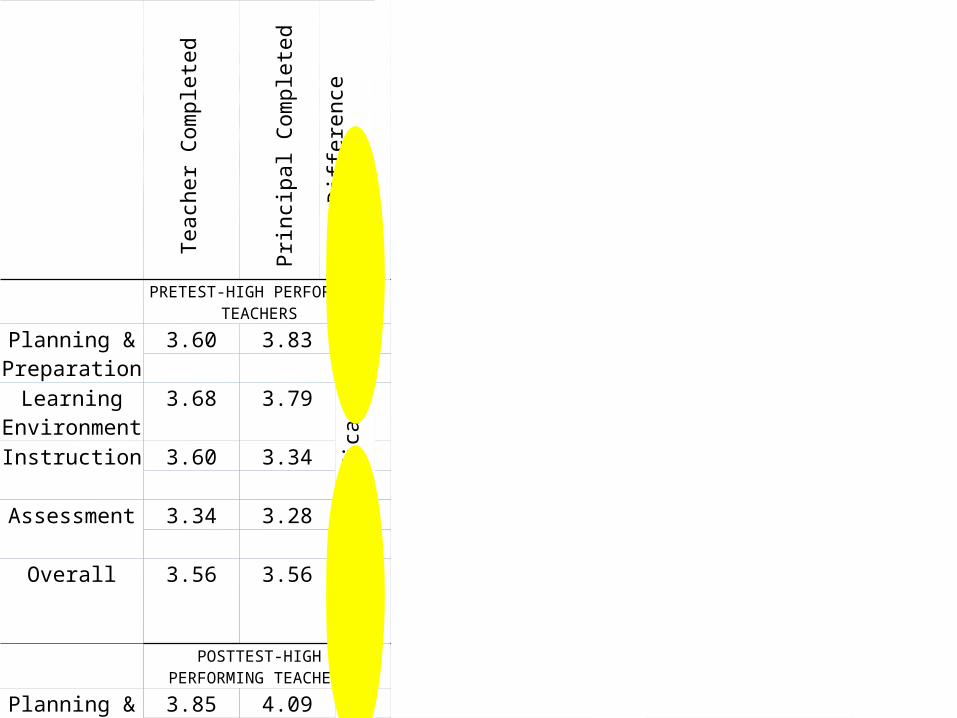
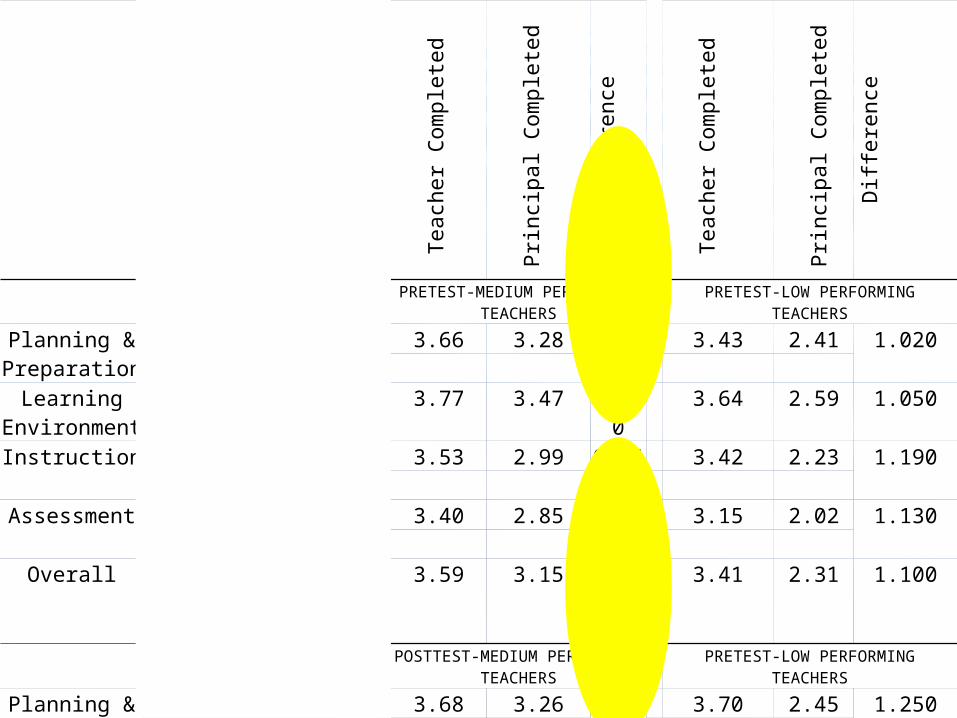
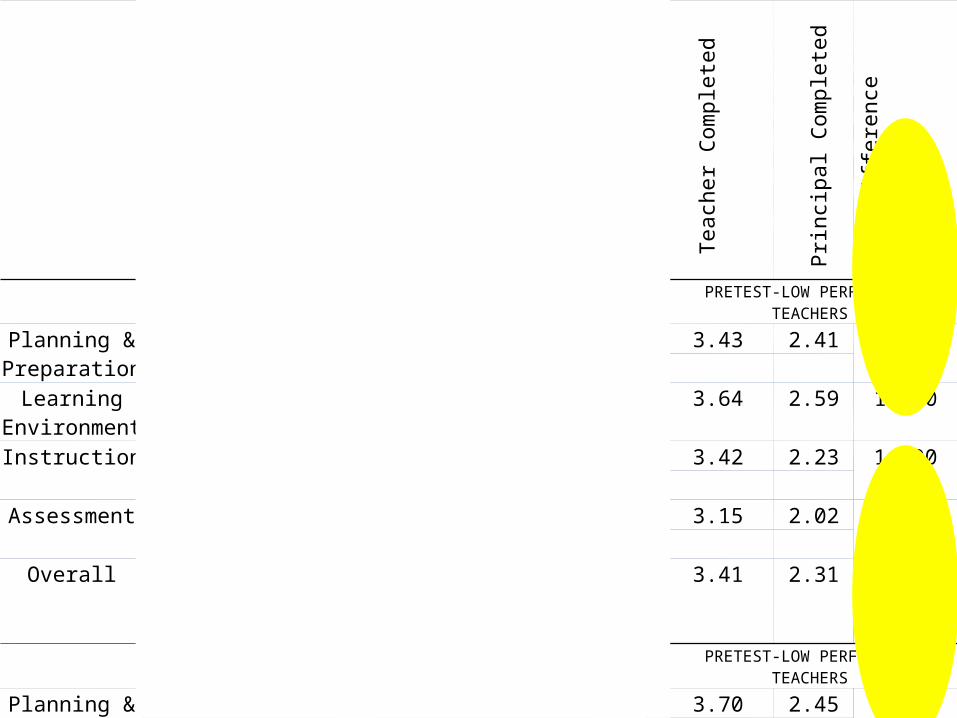
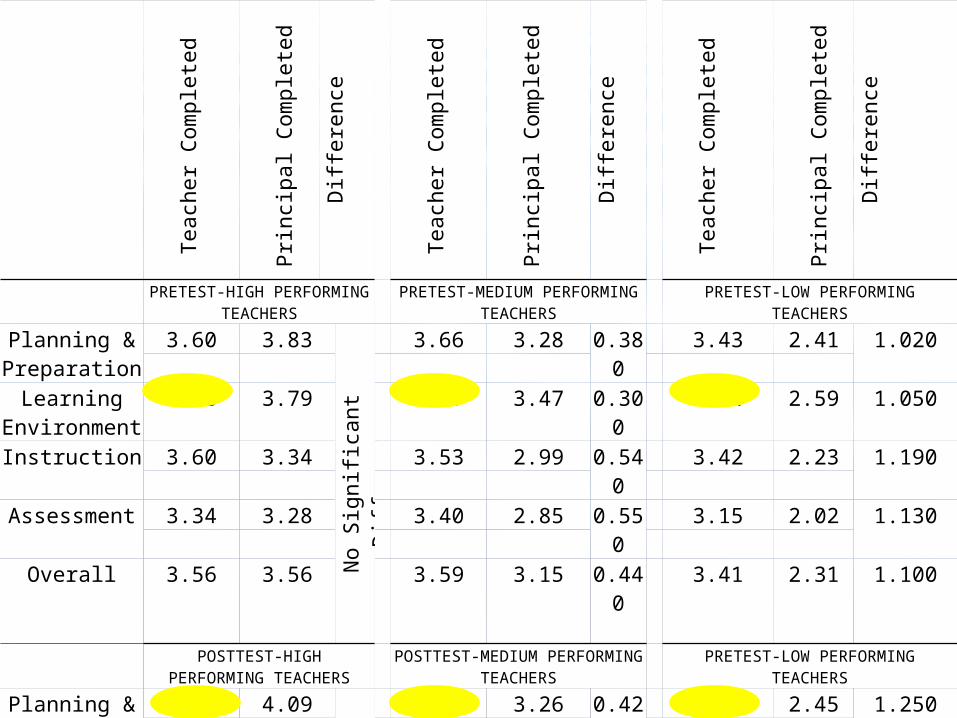
How did Teacher Ratings Compare with Principal Ratings?
Teacher
Completed
Principal Complet
ed
Difference
Teacher
Completed
Principal
Completed
Difference
Teacher
Completed
Principal Complet
ed
Difference
PRETEST-HIGH PERFORMING TEACHERS
PRETEST-MEDIUM PERFORMING TEACHERS
PRETEST-LOW PERFORMING TEACHERS
Planning & Preparation
3.60 3.83
No Significant Difference
3.66 3.28 0.380 3.43 2.41 1.020
Learning Environment
3.68 3.79 3.77 3.47 0.300 3.64 2.59 1.050
Instruction 3.60 3.34 3.53 2.99 0.540 3.42 2.23 1.190
Assessment 3.34 3.28 3.40 2.85 0.550 3.15 2.02 1.130
Overall 3.56 3.56 3.59 3.15 0.440 3.41 2.31 1.100
POSTTEST-HIGH PERFORMING TEACHERS
POSTTEST-MEDIUM PERFORMING TEACHERS
PRETEST-LOW PERFORMING TEACHERS
Planning & Preparation
3.85 4.09 No Significant Difference
3.68 3.26 0.420 3.70 2.45 1.250
Learning Environment
3.93 4.03 3.86 3.38 0.480 3.78 2.62 1.160
Instruction 3.77 3.71 3.38 3.17 0.210 3.60 2.52 1.080
Assessment 3.48 3.56 3.32 3.01 0.310 3.37 2.41 0.960
Overall 3.76 3.85 3.56 3.21 0.350 3.61 2.50 1.110
Teacher
Completed
Principal Complet
ed
Difference
Teacher
Completed
Principal
Completed
Difference
Teacher
Completed
Principal Complet
ed
Difference
PRETEST-HIGH PERFORMING TEACHERS
PRETEST-MEDIUM PERFORMING TEACHERS
PRETEST-LOW PERFORMING TEACHERS
Planning & Preparation
3.60 3.83
No Significant Difference
3.66 3.28 0.380 3.43 2.41 1.020
Learning Environment
3.68 3.79 3.77 3.47 0.300 3.64 2.59 1.050
Instruction 3.60 3.34 3.53 2.99 0.540 3.42 2.23 1.190
Assessment 3.34 3.28 3.40 2.85 0.550 3.15 2.02 1.130
Overall 3.56 3.56 3.59 3.15 0.440 3.41 2.31 1.100
POSTTEST-HIGH PERFORMING TEACHERS
POSTTEST-MEDIUM PERFORMING TEACHERS
PRETEST-LOW PERFORMING TEACHERS
Planning & Preparation
3.85 4.09 No Significant Difference
3.68 3.26 0.420 3.70 2.45 1.250
Learning Environment
3.93 4.03 3.86 3.38 0.480 3.78 2.62 1.160
Instruction 3.77 3.71 3.38 3.17 0.210 3.60 2.52 1.080
Assessment 3.48 3.56 3.32 3.01 0.310 3.37 2.41 0.960
Overall 3.76 3.85 3.56 3.21 0.350 3.61 2.50 1.110
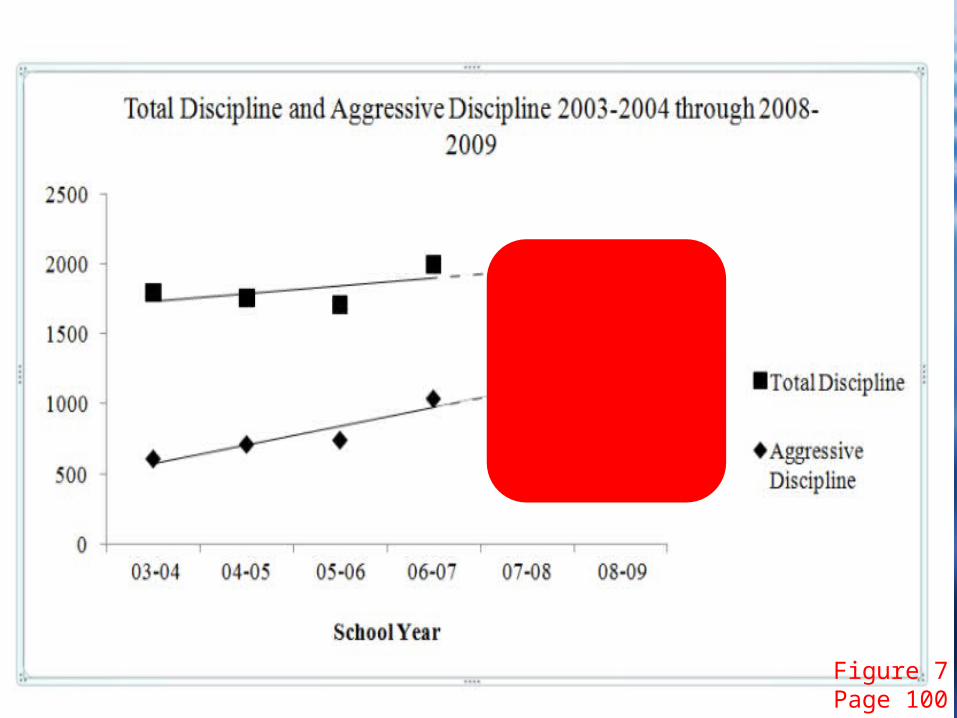
Did Grades and Discipline Improve?
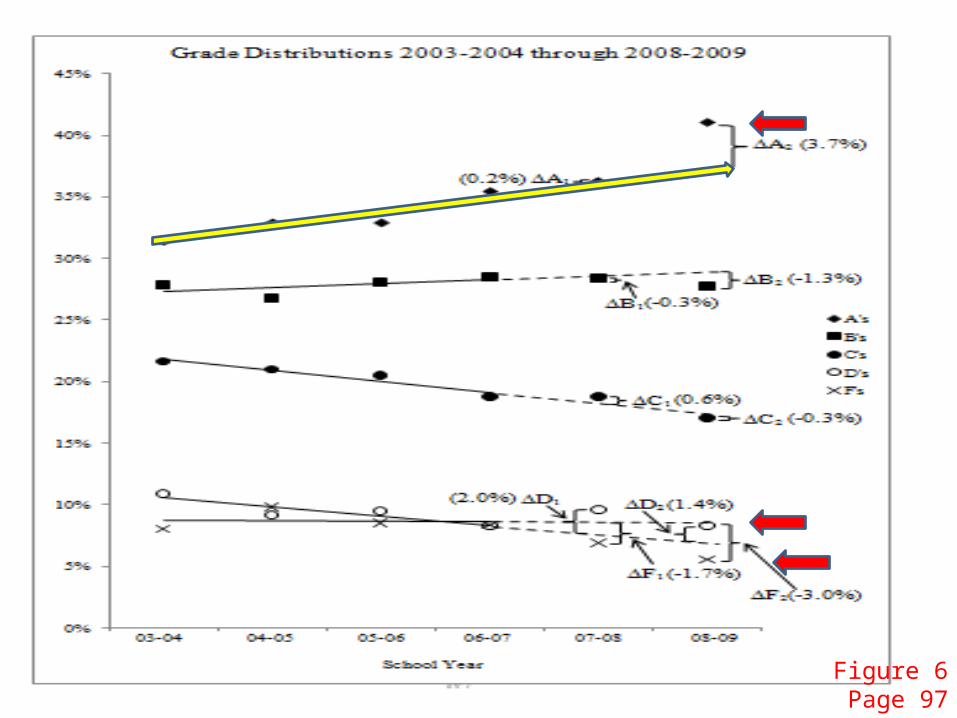
Figure 6Page 97
d
Figure 7Page 100
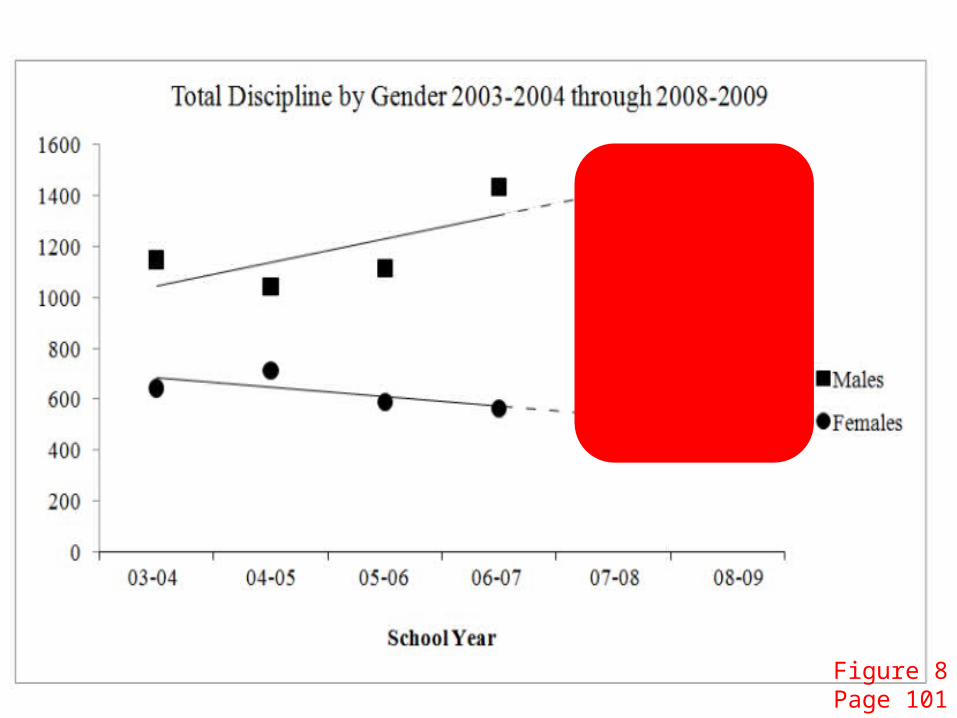
Figure 8Page 101
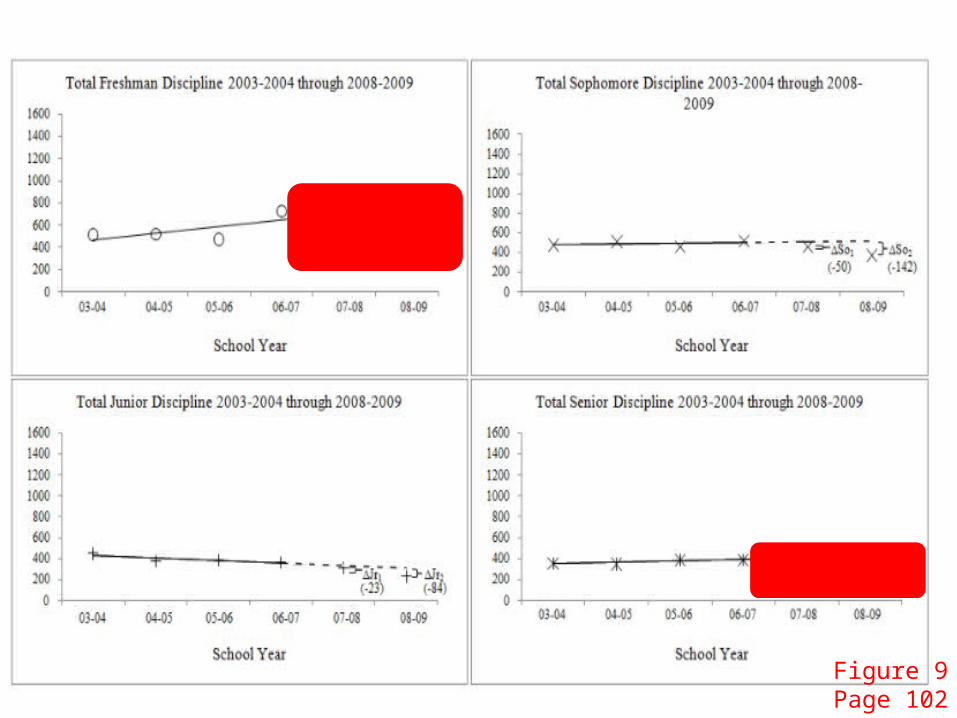
Figure 9Page 102
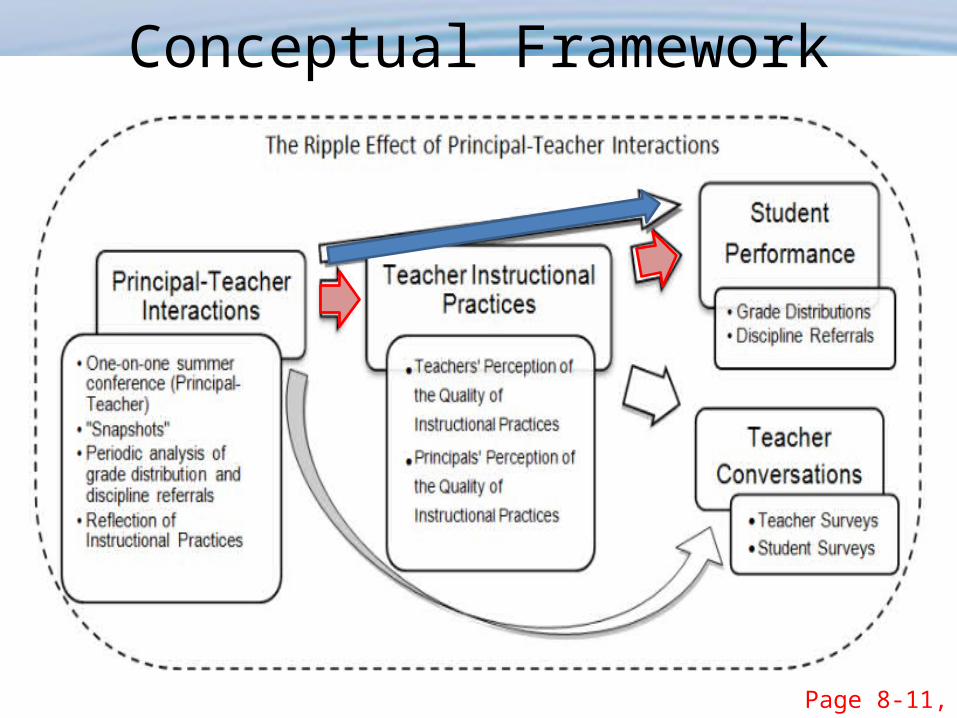
Conceptual Framework
Page 8-11, Figure 1

Did Teacher Conversations Change?
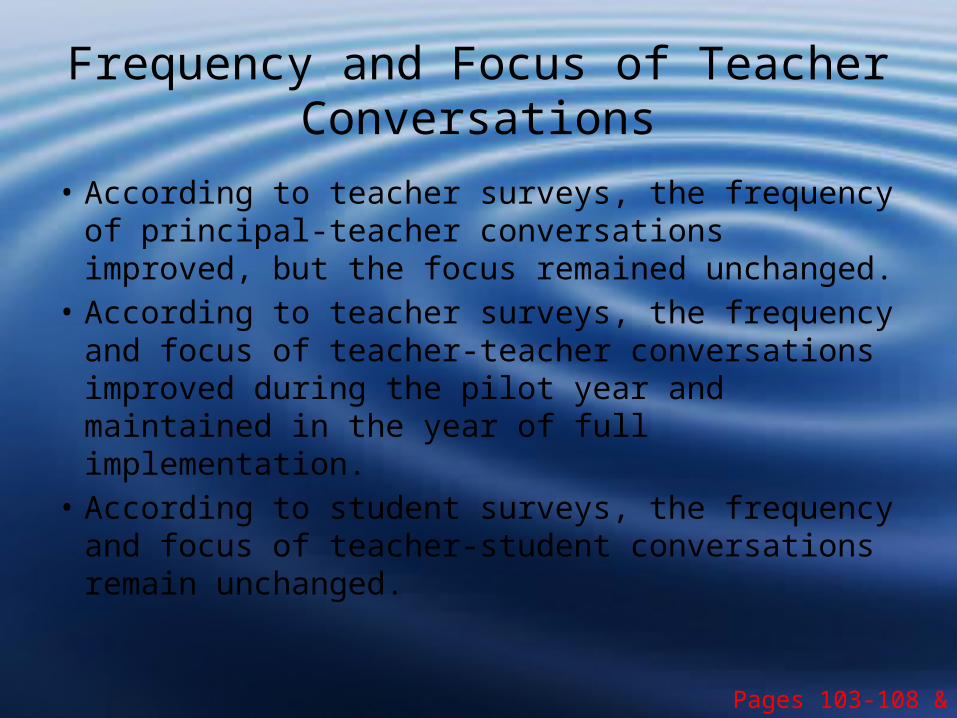
Frequency and Focus of Teacher Conversations
• According to teacher surveys, the frequency of principal-teacher conversations improved, but the focus remained unchanged.
• According to teacher surveys, the frequency and focus of teacher-teacher conversations improved during the pilot year and maintained in the year of full implementation.
• According to student surveys, the frequency and focus of teacher-student conversations remain unchanged.
Pages 103-108 & 122
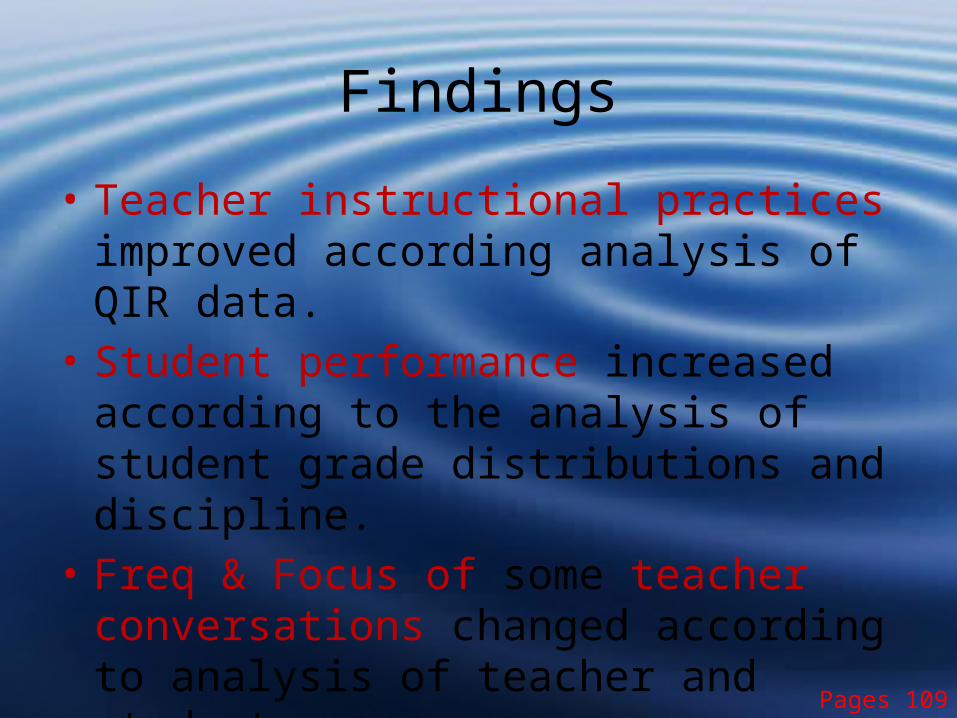
Findings
• Teacher instructional practices improved according analysis of QIR data.
• Student performance increased according to the analysis of student grade distributions and discipline.
• Freq & Focus of some teacher conversations changed according to analysis of teacher and student surveys.
Pages 109
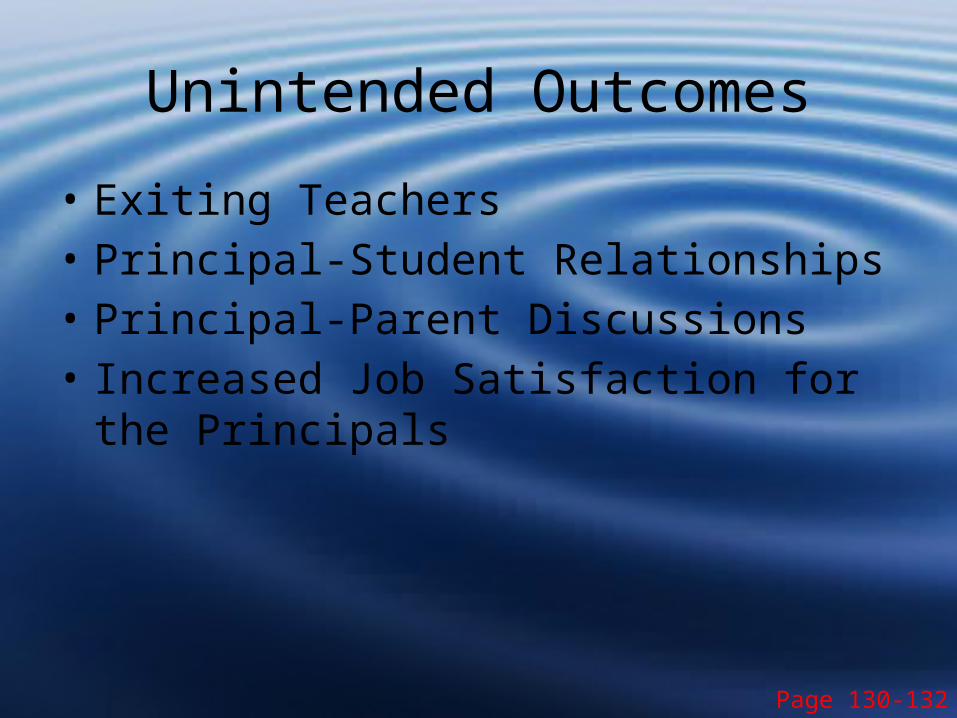
Unintended Outcomes
• Exiting Teachers• Principal-Student Relationships• Principal-Parent Discussions• Increased Job Satisfaction for the Principals
Page 130-132