Embed Size (px)
Citation preview

1
Financial Analysis of Information and Technology Industry of India (A Case Study
of Wipro Ltd and Infosys Ltd)
Dr. Pramod Bhargavaa
a Dr., Department of Commerce, DAV College, Chandigarh, India, [email protected]
Keywords
Information and Technology (IT), Return on Capital (ROC), New York Stock Exchange (NYSE), Earning Before Interest and Taxes (EBIT), Return on Equity (ROE), Net Profit Ratio (NPR) Jel Classification
F65, D80.
Abstract
Financial analysis now a day is an important instrument for the critical review of the performance of a business. It helps the concern to analyse the financial data and provide information which is required to take decisions regarding investments and also help to understand financial position better. The financial analysis portrays the financial health of a company and helps the companies to improve their financial resources and manage generated funds efficiently. Information and technology industry has grown up extraordinarily in India during previous years. Its contribution in economy has also increased with a huge margin. Investment in IT industry is considered as a profitable and less risky investment destination in the Indian context. The paper is an attempt to facilitate the investor and the management to asses the financial position of a firm from the proprietor’s point of view. In order to identify the financial management efficiencies this paper will analyse management of proprietor’s funds in IT Companies of India, Specifically for Wipro Ltd. & Infosys Ltd. The paper will also suggest the initiatives to be taken by both the companies for improving their financial management techniques and achieving the optimum capital structures.

Journal of Accounting, Finance and Auditing Studies 3/3 (2017) 1-13
2
Introduction of Financial Analysis
Financial analysis is a process of considering the financial strength and weakness of a
firm by forming strategic relationship between the items of the balance sheet, profit and
loss account and other financial statements.
According to Metcalf and Titard, "It is a process of evaluating the relationship between
component parts of a financial statement to obtain a better understanding of a firm's
position and performance".
In the words of Myers, "Financial statement analysis is mainly a study of relationship
among various financial factors in a business as disclosed by a single set-of statement,
and a study of trend of these factors as shown in a series of statements.
The financial analysis facilitates in identifying the trends, it also measures the liquidity,
solvency and profitability of the firm in such a manner that can give a comparative view
of the different aspect of the performance of an organization. For the purpose of analysis,
balance sheet, income statement and cash flow statement are considered as the main
financial statements for a company. The balance sheet is a snapshot in terms of the
company's assets, liabilities and shareholders' equity. Balance sheet is used to analyze
trends in assets and liabilities. The income statement begins with sales and ends with net
income. It provides an operating report of a business from the activity and profitability
aspects. The cash flow statement provides an overview of the company's cash flows from
operating activities, investing activities and financing activities.
Proprietors’ funds are the indispensible part of a capital structure of a company.
Proprietors are basically owners of a company having investment in either equity shares
or preference shares. A rational investor analyse thoroughly the financial position of any
concern before investing in it. A company can also get the better performance if it uses
the proprietor’s funds in an efficient way.
Research Methodology
Source of Data: For the purpose of study the data is collected preferably from the
secondary sources. Financial statements of the companies as well as annual reports are
taken into consideration. In addition to this a number of financial journals and magazines
are also used for the study.
Duration of the study: For the purpose of in-depth study financial data for a period of five
years commencing from the year 2011-12 to the year 2015-16 is taken into
consideration.

Journal of Accounting, Finance and Auditing Studies 3/3 (2017) 1-13
3
Area of the study: For the present study, two companies, Wipro Limited and Infosys
Limited are selected. The companies are leading companies in the information and
technology industry of India.
1. WIPRO Ltd It is one of the most successful technological companies in India and
around the world. Wipro an Indian based company was founded as a peanut oil
company with name of Western Indian Vegetable Products in 1945 by M.H. Premji
and later was renamed "Wipro Ltd." by his son Azim H. Premji.
2. Infosys Ltd. Established in 1981, Infosys Ltd. is a NYSE listed global consulting
and IT services company with more than 199,000 employees. From a capital of
US$ 250, it has grown to become a US$ 10.1 billion (LTM Q3 FY17 revenues)
company with a market capitalization of approximately US$ 34.1 billion.
Review of Literature
1. Bhunia, A., MukhutI, S., (2011) identified that understanding financial statements is a
key to fundamental stock analysis and overall investment research. Financial statements
provide an account of a company’s past performance, a picture of its current financial
strength and a glimpse into the future potential of a firm. The goal is to enhance an ability
to make a sound judgment about a company’s financial strength and future prospects by
using financial statements in your personal investment research.
2.Thomson, R., (2008) said that financial analysis is the process of identifying the
strengths and weakness of the firm with the help of accounting information provided in
the Profit and Loss Account and Balance Sheet.
3. Anthony, R., (2007) identified that Accounting as a means of collecting, summarizing,
analysing and reporting in monetary terms, information about the business. This simple
definition highlights the importance of accounting and financial information in the
business enterprise. There is a reference to the following accounting principles and scope
of the field of accounting and finance.
4. Gordon, M., Shilinglaw, G., (2006) the author explains the importance of business and
financial reporting. He highlighted that the economy depends on the business
organizations for goods and services. The financial activities of business enterprises of
production and sale are of utmost importance.
5. Wilson, P. R., Carpenter, J. H., (2005) said that the financial statement assumes an
important place in modern management. Executives, officers, and directors of

Journal of Accounting, Finance and Auditing Studies 3/3 (2017) 1-13
4
corporation should be able to make an authentic examination of the financial statement
of their business if they exist to plan fruitfully and wisely.
6. Reilly., Brown, (2004) identified that the major source of information regarding a stock
is the corporation's financial statement. Financial statement are intended to provide
information on the resources available to management, how these resources were
financed, and what the firm accomplished with them. Corporate shareholders annual
reports include three required financial statement: the balance sheet, the income
statement, and the statement of cash flow.
7.George, T., Schleifeer,L.F.,(2003) identified that financial analysis of companies is
usually undertaken so that investors, creditors, and other stakeholders can make
decisions regarding their companies. The focus of this paper is on the financial analysis
of companies who trade freely and therefore make the data and information public
needed by stakeholders.
8. Altman, E. (1968). In this study author talks about relationship among various financial
factors in a business as disclosed by a single set of statements and a study of trend of
those factors as shown in a series of statements.”
Objective of Study: A number of IT companies are analysed in a number of ways by
researchers. But the significance of financial analysis from the proprietor’s view in IT
companies is yet to be analysed. Following are the main objectives of the present study.
1. To analyze the proprietors funds of companies i.e. Infosys ltd. and Wipro ltd.
2. To analyze the profitability position of selected IT companies under the study.
3. To analyze the return on shareholder’s funds and to know the utilisation power
of equity funds in both the companies.
4. To suggest the financial management efficiency to the companies under the
study.
HYPOTHESIS:
Hypothesis testing is a technique through which some claims can be proved or disproved.
It is a logical test of findings and conclusions.
For the present study the following hypothesis are formulated
Null Hypothesis (Ho): There is no significant difference between the financial positions
of the companies under study.
Journal of Accounting, Finance and Auditing Studies 3/3 (2017) 1-13
5
Alternative Hypothesis (H1): There is a significant difference between the financial
positions of the companies under study.
Tools for the study
Ratio Analysis:
Ratio analysis is used to evaluate various aspects of a company’s operating and financial
performance such as its efficiency, liquidity, profitability and solvency. Ratios are also
compared across the different companies in the same sector to see how they stack up,
and to get an idea of comparative valuations. The following ratios are calculated in order
to analyse the financial position of the companies under study.
1 Return on Capital Employed
2 Return on Shareholders' Funds or Equity
3 Net Profit Ratios
4 Proprietary Ratio
5 Debt Equity Ratio
Return on Capital Employed: Return on Capital employed (ROC) is profitability
ratio which reflects a relationship between the profit earned and the capital employed in
a firm. It measures the level of efficiency in generating profits from the employed capital.
The profit here is an operating profit often called as earning before interest and taxes
(EBIT) where as the capital employed is a surplus amount of total assets over current
liabilities.
Table No.1
Return on Capital Employed
Source: Moneycontrol.com
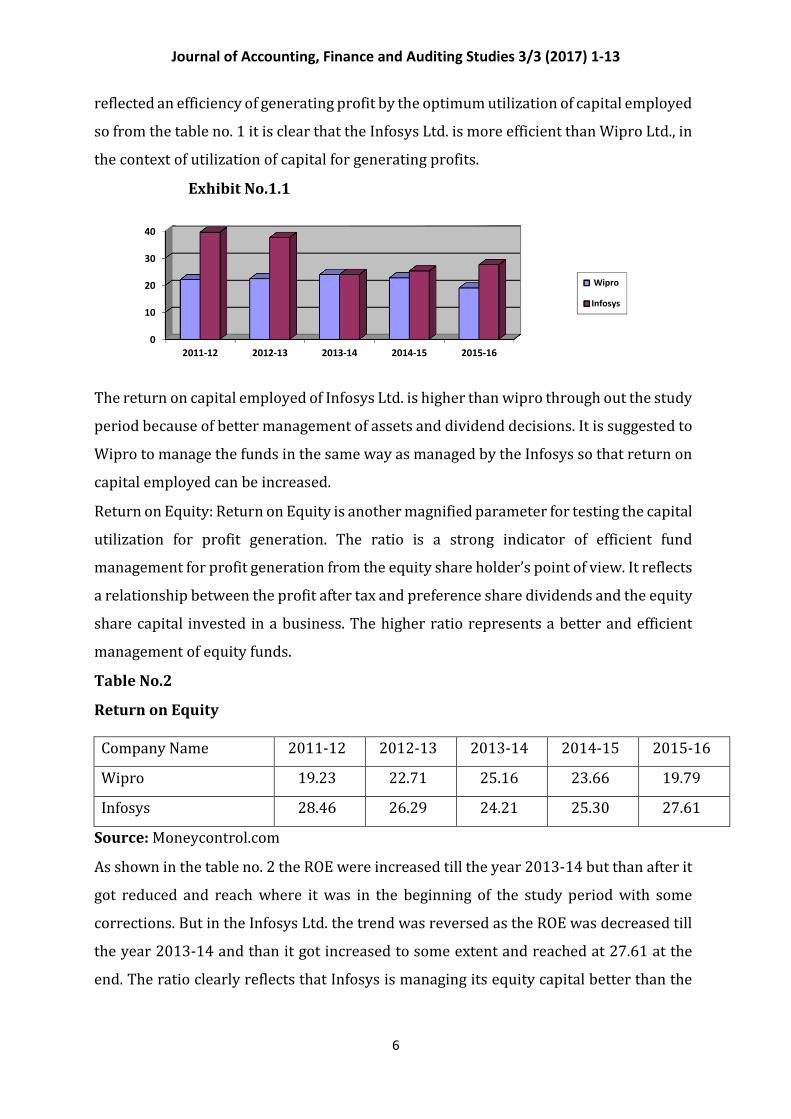
It is depicted from the table no. 1 that the ROC in Wipro Ltd was 22.04 in the year 2011-
12, it reached at 23.96 in the year 2013-14 although it got reduced and reached 19.02 at
the end of study period. Where as in Infosys Ltd. the same were highest in the beginning
at 28.46 and there from it got declined continuously till the year 2013-14 but afterwards
it was increased and reached 27.58 in the year 2015-16. As stated earlier the ROC
Company 2011-12 2012-13 2013-14 2014-15 2015-16
Wipro 22.04 22.44 23.96 22.73 19.02
Infosys 28.46 25.15 24.01 25.29 27.58
Journal of Accounting, Finance and Auditing Studies 3/3 (2017) 1-13
6
reflected an efficiency of generating profit by the optimum utilization of capital employed
so from the table no. 1 it is clear that the Infosys Ltd. is more efficient than Wipro Ltd., in
the context of utilization of capital for generating profits.
Exhibit No.1.1
The return on capital employed of Infosys Ltd. is higher than wipro through out the study
period because of better management of assets and dividend decisions. It is suggested to
Wipro to manage the funds in the same way as managed by the Infosys so that return on
capital employed can be increased.
Return on Equity: Return on Equity is another magnified parameter for testing the capital
utilization for profit generation. The ratio is a strong indicator of efficient fund
management for profit generation from the equity share holder’s point of view. It reflects
a relationship between the profit after tax and preference share dividends and the equity
share capital invested in a business. The higher ratio represents a better and efficient
management of equity funds.
Table No.2
Return on Equity
Source: Moneycontrol.com
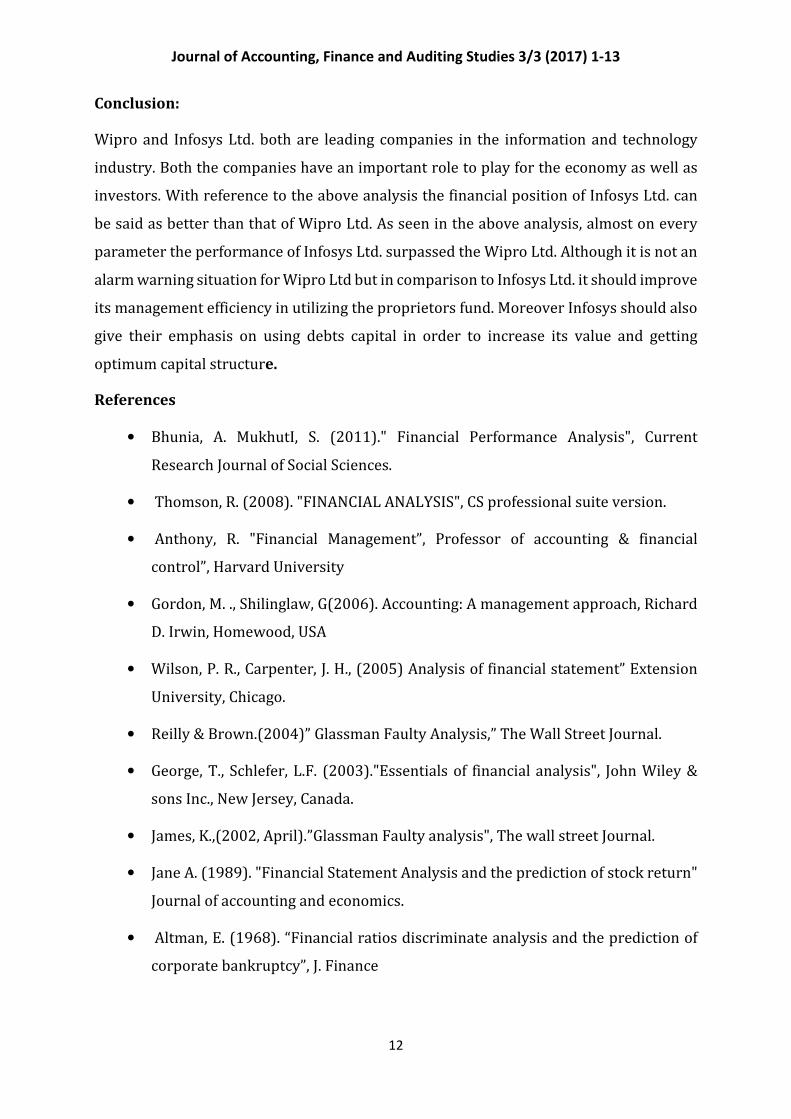
As shown in the table no. 2 the ROE were increased till the year 2013-14 but than after it
got reduced and reach where it was in the beginning of the study period with some
corrections. But in the Infosys Ltd. the trend was reversed as the ROE was decreased till
the year 2013-14 and than it got increased to some extent and reached at 27.61 at the
end. The ratio clearly reflects that Infosys is managing its equity capital better than the
0
10
20
30
40
2011-12 2012-13 2013-14 2014-15 2015-16
Wipro
Infosys
Company Name 2011-12 2012-13 2013-14 2014-15 2015-16
Wipro 19.23 22.71 25.16 23.66 19.79
Infosys 28.46 26.29 24.21 25.30 27.61

Journal of Accounting, Finance and Auditing Studies 3/3 (2017) 1-13
7
Wipro Ltd not only this but it also got alert of their performance and initiated some rehab
actions within time which was not reflected in Wipro Ltd.
Exhibit No.2.1
Net Profit Ratio: The net profit percentage is the ratio of after-tax profits to net sales.
It reveals the remaining profit after all costs of production, administration, and financing
have been deducted from sales, and income taxes recognized. As such, it is one of the best
measures of the overall results of a firm, especially when combined with an evaluation of
how well it is using its working capital. The measure is commonly reported on a trend
line, to judge performance over time. It is also used to compare the results of a business
with its competitors.
Table No.3
Net Profit Ratio
Source: Moneycontrol.com
The net profit ratio in Wipro Ltd was 14.23 % in the year 2011-12 and there from the
same got reached at 19.88 % in the year 2014-15 but in the year 2015-16 it was
decreased to 18.12%. where as in case of Infosys Ltd. the NPR was 25.60% in the year
2011-12 and from there it reached at 29.24% in the year 2015-16 , with a continues
increasing trend.
0
5
10
15
20
25
30
2011-12 2012-13 2013-14 2014-15 2015-16
Wipro
Infosys
Company Name 2011-12 2012-13 2013-14 2014-15 2015-16
Wipro 14.23 17.95 19.06 19.88 18.12
Infosys 25.60 24.28 22.99 25.71 29.24

Journal of Accounting, Finance and Auditing Studies 3/3 (2017) 1-13
8
Exhibit No.3.1
Exhibit no. 3.1 is clearly showing that NPR is always placed better in Infosys Ltd. than
Wipro Ltd. Infosys had always succeeded in maintaining a handsome margin of net profit
over the Wipro Ltd.
Proprietary Ratio: Proprietary ratio refers to a ratio which helps the creditors of the
company in seeing that their capital or loans which the creditors have given to the
company are safe. Proprietary ratio can be calculated as follows – Proprietors
funds/Total Assets
In the above formula proprietary funds includes equity and preference share capital of
the company and reserves and surplus of the company, while total assets of company
includes both fixed assets and current assets of the company but it excludes fictitious
assets which company may have.
Table No.4
Proprietary Ratio
Source: Moneycontrol.com
As far as proprietary ratio is concerned it seems that both the firms are relying upon their
own funds rather than debt capital although Infosys has a higher proprietary ratio than
Wipro Ltd through the study period. It is depicted from the table no. 4 that Wipro Ltd is
diluting its capital structure with a very slow rate which means that the company is
representing more of debt capital in its capital structure where as Infosys Ltd. is
strengthening its capital structure by its own funds the Prop Ratio in Wipro Ltd got
0
5
10
15
20
25
30
2011-12 2012-13 2013-14 2014-15 2015-16
Wipro
Infosys
Company Name 2011-12 2012-13 2013-14 2014-15 2015-16
Wipro 0.69 0.65 0.65 0.64 0.59
Infosys 0.78 0.77 0.80 0.84 0.83

Journal of Accounting, Finance and Auditing Studies 3/3 (2017) 1-13
9
decreased every year and reached 0.59 from 0.69 during the study period where as in
Infosys Ltd. the same was increased from 0.78 to 0.83 at the end of study period.
Exhibit No.4.1
Debts Equity Ratio: The debt to equity ratio is a financial, liquidity ratio that compares
a company's long term debts to total equity. The debt to equity ratio shows the
percentage of company financing that comes from creditors and investors. A higher debt
to equity ratio indicates that more creditor financing (bank loans) is used than investor
financing (shareholders).
Table No.5
Debts Equity Ratio
Source: Moneycontrol.com
Exhibit No.5.1
As per the table no. 5 in comparison to Wipro Ltd, Infosys has no debts capital in its
capital structure. As a result the debts equity ratio in Infosys Ltd. were 0.00 through out
the study period although in the beginning years it was of negligible value as Infosys Ltd.
0
0,2
0,4
0,6
0,8
1
2011-12 2012-13 2013-14 2014-15 2015-16
Wipro
Infosys
0
0,05
0,1
0,15
0,2
0,25
2011-12 2012-13 2013-14 2014-15 2015-16
Wipro
Infosys
Company Name 2011-12 2012-13 2013-14 2014-15 2015-16
Wipro 0.22 0.17 0.15 0.17 0.16
Infosys 0.00 0.00 0.00 0.00 0.00

Journal of Accounting, Finance and Auditing Studies 3/3 (2017) 1-13
10
have some long term debts. But Wipro Ltd is using its debts capital in its capital structure.
Although it is also trying to reduce the part of capital financed through long term debts
which is also reflected in its ratio, the debts equity ratio which was 0.22 in the year 2011-
12 reached 0.18 in the year 2015-16.
Hypothesis Testing: For the analysis of financial position of companies under study, an
inter comparison of firms from five dimensions is made by applying the student’s t test
at 5% level of significance. The following table depicts observations and conclusions of
the application of test. As shown in the table no 6 the null hypothesis is rejected in all
cases. The acceptance of Ho denotes that there is no significant difference between the
financial positions of companies under study but the rejection of null hypothesis
indicates that there is a significant difference between the same.

Journal of Accounting, Finance and Auditing Studies 3/3 (2017) 1-13
11
Table No. 6
Hypothesis Testing
ROCE ROE NPR PROP Ratio D/E Ratio
Ho µWipro=µInfosys µWipro=µInfosys µWipro=µInfosys µWipro=µInfosys µWipro=µInfosys
Hi µWipro ≠ µInfosys µWipro ≠ µInfosys µWipro ≠ µInfosys µWipro ≠ µInfosys µWipro ≠ µInfosys
Degree of
freedom
8 8 8 8 8
Significance
level
5% 5% 5% 5% 5%
Test
Two tailed Two tailed Two tailed Two tailed Two tailed
Critical value
of t
2.306 2.306 2.306 2.306 2.306
Calculated
value of t
3,485 3.104 3.726 7.610 14.40
Ho is Rejected Rejected Rejected Rejected Rejected
Conclusion There is a significant
difference between the
mean ROCE of Wipro
Ltd. and Infosys
There is a significant
difference between
the mean ROE of
Wipro Ltd. and Infosys
There is a significant
difference between the
mean NPR of Wipro
Ltd. and Infosys
There is a significant
difference between the
mean PROP Ratio of
Wipro Ltd. and Infosys
There is a significant
difference between the
mean D/E Ratio of
Wipro Ltd. and Infosys
Journal of Accounting, Finance and Auditing Studies 3/3 (2017) 1-13
12
Conclusion:
Wipro and Infosys Ltd. both are leading companies in the information and technology
industry. Both the companies have an important role to play for the economy as well as
investors. With reference to the above analysis the financial position of Infosys Ltd. can
be said as better than that of Wipro Ltd. As seen in the above analysis, almost on every
parameter the performance of Infosys Ltd. surpassed the Wipro Ltd. Although it is not an
alarm warning situation for Wipro Ltd but in comparison to Infosys Ltd. it should improve
its management efficiency in utilizing the proprietors fund. Moreover Infosys should also
give their emphasis on using debts capital in order to increase its value and getting
optimum capital structure.
References
• Bhunia, A. MukhutI, S. (2011)." Financial Performance Analysis", Current
Research Journal of Social Sciences.
• Thomson, R. (2008). "FINANCIAL ANALYSIS", CS professional suite version.
• Anthony, R. "Financial Management”, Professor of accounting & financial
control”, Harvard University
• Gordon, M. ., Shilinglaw, G(2006). Accounting: A management approach, Richard
D. Irwin, Homewood, USA
• Wilson, P. R., Carpenter, J. H., (2005) Analysis of financial statement” Extension
University, Chicago.
• Reilly & Brown.(2004)” Glassman Faulty Analysis,” The Wall Street Journal.
• George, T., Schlefer, L.F. (2003)."Essentials of financial analysis", John Wiley &
sons Inc., New Jersey, Canada.
• James, K.,(2002, April).”Glassman Faulty analysis", The wall street Journal.
• Jane A. (1989). "Financial Statement Analysis and the prediction of stock return"
Journal of accounting and economics.
• Altman, E. (1968). “Financial ratios discriminate analysis and the prediction of
corporate bankruptcy”, J. Finance

Journal of Accounting, Finance and Auditing Studies 3/3 (2017) 1-13
13
Webliography:
www.Moneycontrol.com
www.wipro.com
www.Infosys.com
www.BusinessStandard,com
www.wikipedia.com