Embed Size (px)
Citation preview

360/737-2726 503/256-2726 WWW.COLUMBIARIVERCROSSING.ORG 700 WASHINGTON STREET, SUITE 300, VANCOUVER, WA 98660
DRAFT Meeting Agenda
MEETING TITLE: Task Force Meeting
DATE: November 29, 4:00 - 8:00 pm
LOCATION: WSDOT, SW Region Office 11018 NE 51st Circle
Note: Please turn off all cell phones, handheld devices, and pagers during the meeting as they can disrupt the audio and recording equipment. Thank you.
TIME AGENDA ITEM ACTION
4:00 – 4:15 Welcome & Announcements Project Update
4:15 – 4:20 October 25 Meeting Summary Approval
4:20 – 4:35 Public Comment Receive public comment
4:35 – 7:05 Overview of Analysis Results 1. Major Trends 2. Transit Recommendations 3. River Crossing Recommendations
Presentation and Discussion
7:05 – 7:25 DEIS Alternatives Presentation and Discussion
7:25 – 7:40 Upcoming Public Outreach Events and Opportunities.
Presentation
7:40 – 7:55 Overview of Budget and Schedule Presentation
7:55 – 8:00 Wrap Up and Next Steps
Next Meeting:
December 13, 4-6:30 p.m. Portland State University Smith Memorial Student Union, 1825 SW Broadway, Room 328
BUS DIRECTIONS from PORTLAND: From Downtown Portland (SW Salmon and 6th Avenue) take C-Tran Bus #105 (I-5 Express) or TriMet Bus #6 (MLK Jr. Blvd) to Downtown Vancouver (7th Street Transit Center). Then follow directions below from Vancouver. BUS DIRECTIONS from VANCOUVER: From Downtown Vancouver (7th Street Transit Center) take C-TRAN Bus #4 (Fourth Plain) eastbound to the Vancouver Mall Transit Center. Other buses to Vancouver Mall are #32, 72, 76, and 78. From the VM Transit Center, transfer to Bus #80 (Van Mall/Fisher's) eastbound to 49th and 112th Avenue. WSDOT SW Regional Headquarters is 2 blocks north of this bus stop.

COLUMBIA RIVER CROSSING TASK FORCE | October 25, 2006
PAGE 1 OF 12
Meeting: Columbia River Crossing Task Force
Date: October 25, 2006, 4 p.m. – 6:30 p.m.
Location: Oregon Assn. of Minority Entrepreneurs 4134 N. Vancouver Ave., Portland
Members Present: Last Name First Name Organization Alternate Attending Adams Sam City of Portland Tom Miller Armbruster Grant Portland Business Alliance Burkholder Rex Metro Richard Brandman Byrd Bob Identity Clark County Ginger Metcalf Caine Lora Friends of Clark County Cruz Walsh Serena Multnomah County Dengerink Hal Wash. State University - Vancouver Frei Dave Amada Neighborhood Association Fuglister Jill Coalition for a Livable Future Grossnickle Jerry Columbia River Towboat Association Halverson Brad Overlook Neighborhood Association Hansen Fred TriMet Alan Lehto Hewitt Henry Stoel Rives, LLP Isbell Monica Starboard Alliance Company, LLC Lookingbill Dean Regional Transportation Council Lynch Ed Vancouver National Historic Reserve Trust Malin Dick Central Park Neighborhood Assn.
Morris Betty Sue C-TRAN Osborn Dennis City of Battle Ground Paulson Larry Port of Vancouver Katy Brooks Pollard Royce City of Vancouver Russel Bob Oregon Trucking Association Schlueter Jonathan Westside Economic Alliance Stuart Steve Clark County Sundvall-Williams
Jeri Environmental Justice Action Group
Tischer Dave Columbia Pacific Building Trades Council
Valenta Walter Bridgeton Neighborhood Association Walstra Scot Greater Vancouver Chamber of Commerce Wyatt Bill Port of Portland Susie Lahsene Members Absent: Becker Charles City of Gresham Brown Rich Bank of America Branch Wayne Eki Elliott Oregon/Idaho AAA Phillips Bart Columbia River Economic Development
Council
Pursley Larry Washington Trucking Association Ray Janet Washington AAA Schmidt Karen Washington Freight Mobility Strategic Investment Board Zelenka Tom Schnitzer Group
Meeting Summary
Project Staff Present: Ron Anderson Mike Baker Danielle Cogan Doug Ficco Frank Green Heather Gundersen Craig Hainey Barbara Hart Bob Hart Jeff Heilman Zachary Horowitz Leslie Howell Ryan LeProwse Jay Lyman Tom Markgraf John Osborn Peter Ovington David Parisi Ed Pickering Anne Pressentin Lynn Rust Lynette Shaw Gregg Snyder Audri Streif Rex Wong

COLUMBIA RIVER CROSSING TASK FORCE | October 25, 2006
PAGE 2 OF 12
1. Announcements
• Welcome New Members.
• Dennis Osborn is the newly appointed interim City Manager for the city of Battle Ground.
• Dave Tischer, from Laborers Local 320 is the new Columbia Pacific Building and Construction Trades Council representative
• Focus groups were recently held (two in Vancouver, two in Portland) to get a sampling of public perceptions of this project. A report is being prepared and will be distributed when ready.
•
2. Acknowledgement and discussion of letters to Co-Chairs from Task Force
(Appendix 1 and 2) Rex Burkholder briefly explained purpose of letter to the Co-Chairs -- The Metro Council received a presentation from CRC staff, and discussed what would be some guidance for me in terms of representing the Council. So they looked at where we came from and gave some general principles for moving forward. We decided to stay away from looking at alternatives and instead determine some principles that I would be directed to use here and that we’d be using when the time came for adopting the project that comes out of this group into the Regional Transportation Plan (RTP). Hopefully, these are all well laid out in the letter and I am glad to talk to people later. Letter from Task Force members Caine, Fuglister, Frei , Sundvall and others -- Chair – I think this letter thoughtfully creates a basis for us to consider the decisions we have to make. What’s most important depends on your perspective. There is interest in further drilling into performance measures and how we measure against the goals we have established. We’ve proposed a separate workshop sometime in November to allow people to get a better understanding of what these look like. There might be an opportunity to shape those in the course of our evaluation process as we get into more specifics with assessing the performance of the various alternatives. -- Jill Fuglister –. We’re concerned about the big picture getting lost and never really being discussed. We
started building from where the bi-state partnership left off and moved quickly to this focused set of transportation ideas and kind of lost the question that is articulated first in this letter - “What are we trying to create as a region?” I just want to make sure that there is space for that discussion at some point.
-- Chair - What we will be talking about is how these alternatives stack up against the criteria we established
early on that deal with the interrelationship between growth and land use and communities. What we are being given is a selection of alternatives so that we might understand how things fit together. I think that when we get to the point of saying “which one works best” it will be against a list of factors that will help us address the impacts that are mentioned in your letter. There are a lot of approval levels this project has to go through - if the Task Force generally doesn’t like what is going to happen, nothing is going to happen.
NOTE: Task Force and public questions and comments are in italics, (Staff responses are in parentheses)

COLUMBIA RIVER CROSSING TASK FORCE | October 25, 2006
PAGE 3 OF 12
-- Jerry Grossnickle - Looking at the Metro letter, it suggests that we can prioritize the outcomes of what we are looking for – collectively agree on what is most important.
-- Chair – I think it is too early. I think if you try to do that in the abstract we’ll spend three years trying to get ourselves around questions that are more able to be answered when they are applied to real or potentially real situations.
Jay Lyman- (When we’re working with a group like this, there are different ways you can tackle criteria and how they are used. The most effective we’ve found is to get agreement on criteria. We report the results of how the alternatives affect those criteria both positively and negatively, and each of us based on our own value systems and interests – use these results to focus on the things that are most important to us.. This has worked well in processes like this. The other option is that we could take time as a group to collectively prioritize – it is a different process, not necessarily a worse process but it is different than what we have done up until now.)
-- Jill Fuglister – One concern I have is about the performance measures discussion being pushed into another forum is that how we measure it is extremely important in getting the information of how those criteria actually perform. So my understanding is that this is going to be a separate session’s discussion? I would like to see us agree and approve a set of performance measures.
Jay Lyman - (The process we are proposing is to have a work session for interested folks to find out what their interests are and for them to hear the rationale of why the staff has structured the performance measures the way they have. We will do what we can to react to changes, but there is a limit to what we will be able to do in the short term. We’re fairly confident that the process in the next few months is not going to drive down to the level of detail of the suggestions so far for performance measures. Where it will become important is at a more detailed level further into the process. If we have the conversation in November, we will be able to look at what information is being requested and ask “is it available?” “will it be available in the next round of analysis?” and “how can we incorporate it?” Then we can report that back to the larger group that here are the things we heard, and here is how we are going to incorporate them. In some cases we may not be able to incorporate it and we will report that back.)
-- Chair –If the group at the workshop comes away and thinks that things are wrong and need to be
discussed or changed, we’ll discuss that. -- Monica Isbell – Why not do an email poll of those on the task force to rank the criteria? Have them rank
each in three buckets of “high, medium, and low priority.” -- Chair- We will take that up and look at it. --Hal Dengerink – There are two issues here. There is the question of ranking the priorities and the one of
accepting the measures developed. There won’t be a set of measures that everybody feels is an exact measure of the criteria. We are going to come up with approximations of those that are there in part because of the kind of data that’s available and measures that can be made prior to building something. It is going to be a combination of the value of the criteria to us and the degree to which measures approximate them. In the mean time, not only do we have the workshops scheduled, you can also go to visit the staff office. There are a series of ways rank these – it needs to be done once we know how closely we can approximate these values with the performance measures that we come up with
--Betty Sue Morris - When is the workshop?
Jay Lyman – (We haven’t set the date yet, but we have promised to schedule one We’ll be doing that.)

COLUMBIA RIVER CROSSING TASK FORCE | October 25, 2006
PAGE 4 OF 12
--Betty Sue Morris – Are the attendees at the workshop different than those at the Task Force or is this just a
special meeting for the Task Force? And if so, could we do it at a Task Force meeting? --Chair - It could be either, but I don’t think that we want to put it on top of what we’re doing. We need a
separate meeting for it. You could call it a workshop or a special Task Force meeting and it’d be pretty much the same.
3. Meeting Summary Approval
• Action: Approved - Draft summary of September 27, 2006 meeting summary 4. Public Comment • Lee Johnson – I’m owner and president of Jet Delivery, past president of the Portland Air Cargo
Association, current member of EPAC, CRC freight working group, and the Portland Freight Committee. The I-5 freeway is the major route north and south from Mexico into Canada and provides freight service to our customers in San Francisco, Portland, and Seattle. We run that route everyday. About 50% of our business is international, even though we do a lot of local business also. Freight is important not just for Portland, but for the cities along the freeway. We must build freeways to support that important need because it affects other states not just Oregon. We are very experienced with I-5 and the congestion that it has. Anything that slows trucks is adding cost, manpower, wastes fuel resources, and hurts our environment. The memo forwarded by the Columbia River freight working group suggests improvements that we think can help solve the problems that we have by the volume of traffic using this freeway.
• Sharon Nasset (Appendix 3) – I brought a letter today. Arch Miller recently said to me you know RTC
and JPACT can’t do anything about the missing data and discrepancies you are talking about and he recommended that our group go directly to the governors of both states. If you haven’t had the chance to look at the book I put together for Sam, if you go to screening A and you look at several things like how does a 10 lane bridge only have 30,000 cars when it’s 2,000 cars an hour and all other kinds of discrepancies, missing documents. But the one thing that I think is going to be the largest issue with the governors is in Oregon, we have Oregon Context Solutions. When something is accepted to be studied for an environmental study, it has to be given equal, equal in every manner from the beginning in all of its engineering and all of its work. When you look at your books and the things that were kicked out before, it says right in it that they used materials from other studies, studies that said they didn’t have enough information and recommended that there be further study and that they did no engineering at all. This is in direct violation of Oregon Context Solutions and does not go in with environmental study issues. So I hope you’re going to look at the many pieces of missing data and that it was inappropriate for the 20 people that voted that night to have taken all those options out. If you weren’t here, it was at the end of a meeting. Jill asked “Gee whiz, you added on to this meeting and you’re going to have a vote? Can we not vote now?” Sam Adams said, I’m not going to be able to be here, could you not vote. Jeri said, “We’re being steamrolled.” Steve said, “It feels like we are frogs in water being heated up.” And then you took a vote, and you never did a roll count, and you don’t know the names of the people, the 20 people out of 40 or 39, that voted them out .I can understand why you are getting all these letters, and it is probably really hard because it is from staff that is giving the bad direction, not necessarily anyone but the Task Force. So I hope we get the chance to move onto something more positive. Like talking about what a new bridge would do for our economy, how we have 1,000 acres out in North Portland that would just love to have manufacturing jobs, and that the more you do to build up our industrial areas, the more jobs we have there, the less urban sprawl we’ll have. Unless we do something about the roads in and out of those industrial areas so they don’t have to move, we’re going to have serious problems.

COLUMBIA RIVER CROSSING TASK FORCE | October 25, 2006
PAGE 5 OF 12
• Corky Collier – I am the executive director of the Columbia Corridor Association and part of the freight working group. I recommend that you consider the memo you will be receiving and that you take the recent congestion study and the Portland freight plan and weave it into the decisions as you move forward. I think that you can use these studies to look at this from an economic perspective. Marine Drive is essential to Portland’s industrial corridor/sanctuary. The Columbia Corridor is home to 2,000 businesses that employ 60,000 individuals, and Marine Drive is at the heart of it. The interchange is perhaps the most important interchange in the entire state -- it is amazing how much goes through there and how badly it works right now. The designs in front of you improve this. Look strongly at the free flow design for Marine Drive because that will really help to move rigs through the area much faster and reduce the number of accidents. Just look at the number of fender benders that would be eliminated each year. The cost of one fender bender averages about $150,000 lost in productivity. By using a better design and to improve the interchange and reducing fender benders by just 10/yr, and extrapolate let’s say a hundred year lifespan of the bridge, just in fender benders alone we save $150 million. That’s just one of a half dozen reasons to have good design in this area.
• Jim Howell – I represent the Assn. of Oregon Rail and Transit Advocates (AORTA). I wanted to
express my disappointment in some of the work done so far. Tonight you are going to be looking at the arterial bridges. Alternative bridge package #3 that was put in as a supplemental option was designed to fail. It is a straw man to be shot down. Unfortunately, they tended not to use some important elements of my arterial bridge proposal that I presented over a year ago which would make it work. I’d be glad to talk about those but I know you don’t want to hear about them right now. I just wanted to express my disappointment.
• Jim Karlock – I am confused about a thing I found on Sam Adams’ website. It talks about a letter
from David Evans and Associates dated Aug 25 ’06, and it says “traffic volume counts were collected from all on and off ramps from the Marquam Bridge in Oregon to the Pioneer St. Interchange in Washington.” A friend of mine has been trying to get that data. Can anyone from David Evans tell me if that data has been made available yet? Because that seems like it would be something that is very valuable for this Task Force to know about what is going on at every single interchange. And apparently that data was collected quite some time ago in October of ’05. Can we see the data? This first came to my attention about 2 weeks ago and it seems to me that it takes about a day to get the data out in an email. And this Task Force might be interested too. Jay Lyman - (We’ve received a couple of requests in the last week or so. Anyone who has asked for the data in writing should be getting it soon. It’s in the works.)
Jim Karlock - And the second interesting item is an hour by hour report on the level of traffic
congestion throughout the day. It shows level of service at F in the morning and F in the afternoon, but the interesting thing is that the first entry in the morning is level of service F so the question is at what time does the level of service F start? Because this shows the 6-7 o’clock hour, the first hour on the chart at F. So does it turn F at 5 or 4? I think that is also a valuable piece of information. This chart shows 7 hours a day at level F, maybe it is actually 8 or 9 or 10. We don’t know without the data. So could we get that data also?
Jay Lyman- (I believe the data you’ll be receiving will be 24 hr counts. You’ll be able to take a look at the numbers and if you have traffic folks, they can certainly do that analysis.)
--Jonathan Schlueter- What I’ve learned recently about vehicular data is that there are 127,000 vehicles daily across the I-5 Columbia River Crossing as of March 06. That represents a 660 vehicle/day increase from just last year. --Walter Valenta - Information Jim got was off of Hayden Island moratorium study. Not directly a CRC study but it is important.

COLUMBIA RIVER CROSSING TASK FORCE | October 25, 2006
PAGE 6 OF 12
--Chair - Aren’t we expecting more data?
Jay Lyman - (We started with information we had which was from 2002. As the speaker noted, we had an extensive traffic data collection program in fall of 2005 over a large area. We have started to work with that, and will begin presenting the info as we go forward. We’re on cusp of being able to do that, hopefully next month)
• Jim Karlock – It’s been a year and a month since that report was dated. Seems like we could have all
the studies in a couple of months – ten months ago. --Chair – I think the point is that that was done for a different purpose. We’ll see that data and even more current in the course of this study and in the near future.
• Sharon Nasset – In the report that Sam put out, it stated that the finding data was collected in October
2005 as part of the Columbia River Crossing project. This study was done a year ago for the CRC project.
Jay – (That information was collected last year and has been used to be developing the models we are using to forecast the traffic.)
5. Freight Working Group Report Jay Lyman - (The key decisions that are coming up are about transit modes and which river crossing options to carry forward for more detailed study. Though it’s not directly relevant now, this is work the freight working group has completed. Their recommendations will be part of our refinement process. We wanted to get it on the table now.) Presentation by David Parisi
• Recommendation to drop F1 (managed truck only)
• Recommends continued consideration of F2 (freight bypass)
• Recommends continued consideration of F5 (direct access ramps)
• Recommends adding a new component, F6 (enhanced highway design for freight mobility)
Discussion -- Serena Cruz – On F2, is there data outside this process that suggests it’s actually effective? There are a lot of HOV freight or bypasses on the way to Seattle that don’t seem to help.
David Parisi - (There are some limited studies, and we are working to educate the group. We are seeing that some of them could be effective.)
--Serena Cruz- Are there more HOVs than freight at peak capacity?
David Parisi – (During the mid-afternoon there are a lot of trucks). --Serena Cruz - In regards to F6, mainline capacity – does that mean more lanes?
David Parisi - (It generally means more lanes as well as reducing congestion.)

COLUMBIA RIVER CROSSING TASK FORCE | October 25, 2006
PAGE 7 OF 12
--Serena Cruz - Does that mean three thru lanes are not being considered? David Parisi – (The freight working group have said the existing conditions are not tolerable. We’re looking for increased capacity. No number of lanes has been determined yet.)
--Serena Cruz - There seems to be a heavy emphasis on the lanes instead of the off and on ramp clean ups. --Chair - What is the facility near Barbur and Capitol on North I-5?
David Parisi– (It’s a good example of the freight bypass. It Improves safety and capacity.) --Richard Brandman (sitting in for Rex Burkholder) –In F6 it says “an increase in the number of through lanes to at least preserve the existing hours of uncongested highway conditions.” There are different ways to get to less congestion, adding lanes is not the only way. --Hal Dengerink - F6 is different than other components. Already have as one criteria to improve freight mobility. How does F6 differ and rise to the level of a component?
David Parisi - (It’s not a criteria, it’s a component the freight working group is recommending be considered. The others are spot specific, but this is something that should be considered in the design of all the alternatives. Good design for trucks is needed, and has to look at the corridor as a whole.)
--Hal Dengerink- If we pursue criteria number 5, will we not have accomplished this?
Jay Lyman - (The freight working group looked at what came back from the public. The one component not on there is the one that has most benefits – good design for trucks. It’s not radically different, but acknowledgement that the design work MUST keep in mind trucks)
--Chair - In years of overseeing projects that did these things, I’ve seen the freight community saying you haven’t done anything. What is being talked about in F6 is good design for all purposes – slight distinctions here and there. To have freight community acknowledge that highway improvements are good for them is an advancement.
David Parisi - (The freight group wanted to emphasize that it is short-sighted to design just to highway standards. Considering truck needs may mean that we want to go beyond standards.)
--Jeri Sundvall-Williams – I recognize the importance of freight. Many times though the issue is that commuters need to change their habits- you can’t just add lanes. I love freight but we as a people need to think about other ways we get across the river. We need to reduce commuters. --Chair - Are there things we need to decide now?
Jay Lyman – (No, this was informational tonight. We’ll come back and discuss how these play out in the months to come.)
--Bob Russel - I agree with Jeri. We need a combination of modes. What you see with F6 is paranoia on the part of trucks. F6 are just some reminders from freight that these things are very important. If we adopt F6, it’ll make the freight community feel better. -- Jill Fuglister - If we use F6, we should find a way to integrate the comments from Rex and Jeri about reducing demand. Add capacity OR reduce demand. Not assuming that by adding lanes, we might solve freight mobility issue.

COLUMBIA RIVER CROSSING TASK FORCE | October 25, 2006
PAGE 8 OF 12
--Chair – I think that they would agree completely with adding that.
Jay Lyman - (I think this is very interesting. From the perspective of the technical staff, the recommendations from the freight group are considerations that should be considered as part of any good design effort. I don’t think any of us looked at the mainline capacity recommendation as anything other than the same regional issue that will have to be addressed from a regional perspective. Keep in mind that we are going to matching to the existing freeway both north and south of the project area.)
--Richard Brandman– You are mixing and matching in bullets [on F6 slide]. The first bullet is about adding capacity, and the others are about design. They are separate issues. --Mayor Pollard – I support this - the interstate was designed to move freight and commerce. Issue of getting people out of cars is what we need to deal with when we are offering alternatives. 7. Traffic Performance of Arterial Bridge Options Presentation by David Parisi
• Review of five arterial alternatives with maps
• Traffic forecasts for I-5 and arterial trips
Discussion -- Betty Sue Morris – In alternatives with arterials, is the intent to dislodge the direct access SR 14 to what is now I- 5? Otherwise would downtown Vancouver traffic remain the same? Nobody gets off of it to get to neighborhood streets.
David Parisi - (Intent of all the alternatives is to retain all ramps, except in some alternatives where the Hayden Island interchange would be removed. It would not force SR 14 onto an arterial. )
-- Betty Sue Morris - How does that work if you are talking about leaving the green bridges as the arterial, and leaving the connection as it is?
Jay Lyman - (SR 14 would not be connected to old bridges. They would connect to the highway.) -- Chair - We know a high percentage traffic starts or ends in the area, but most does not do both. People from further out are still going to use the freeway --Lora Caine - When you were studying the new bridge, were you counting the new bridge as 10 lanes? Three through lanes, and two auxiliary?
David Parisi– (What we have done in any alternative that involves additional main line capacity is that we are trying to treat them all equally, in this phase of the work. So we are assuming 5 lanes plus an auxiliary lane in each direction that connects SR 14 with Hayden Island. It is my understanding that as we proceed we’ll be doing some refinement work and that might mean that at the end of the day it isn’t just a question of safety, but of operations and safety. This is going to come back to the Task Force for consideration on the lanes.)
-- Lora Caine – I’m curious about Jim Howell’s proposal. Why wasn’t it studied?

COLUMBIA RIVER CROSSING TASK FORCE | October 25, 2006
PAGE 9 OF 12
Jay Lyman - (One of the principle features of the proposal was to eliminate the on-ramps from SR 14 to I-5 South, and from Hayden Island to I-5 North. Both are problematic from a design and policy perspective. Connecting an interstate freeway and a state highway indirectly is very problematic. Another part of the proposal was to redirect the northbound traffic to I-5 from Hayden Island. Instead of getting on the freeway northbound at Hayden Island, motorists would have to go south through Marine Drive traffic. This would add half a mile and overload the already overloaded interchange.)
Jim Howell – I did not eliminate the SR 14 connection and downtown to I-5 S. I put it on an auxiliary
lane on the arterial bridge and it merged onto I-5 at Hayden Island so it did not have to go across the green bridges. I did eliminate the ramp from Hayden Island which would allow the full through flow across the green bridges. But I also added a lane to the harbor bridge which then makes the Marine Drive Interchange work better.
--Chair- We’ll ask staff to dust off Jim’s proposal and bring it back in the context of making decisions for arterial. --Brad Halverson – On alternatives 1 and 2 which are no build, what kind of numbers are you talking about?
David Parisi - (I’ll have to go to my technical source to see about that.) --Brad Halverson - If it’s six lanes north and south, call it that, don’t call it three auxiliary and three through. --Jill Fuglister - I will be glad to see how some of Jim’s ideas might be integrated. I also wanted to clarify what the mode split assumption is? What is the mode split currently? What are we aspiring to achieve?
David Parisi – (The alternatives assume full use of travel demand management as well as high capacity transit modes, so potential traffic volumes have already been reduced from what they might otherwise be.)
Jay Lyman - (Mode split is not an input assumption. It’s a forecast based on the transit, TDM and highway options included in each alternative. The forecast results will be presented soon.)
--Jill Fuglister – It would be nice if we had an aspiration for mode split. These various alternatives show dumping traffic into downtown Vancouver. Are you saying there are no design fixes for that?
David Parisi – (No, not at all. The analyses assume that the streets remain as they are, but if an alternative that included an arterial is chosen, Vancouver would have the option to respond. )
Jay Lyman - (What goes along with that is if you make it difficult to use the arterial, you end up with an expensive bridge with little traffic. Then the question is whether keeping the existing bridges would be cost effective.)
--Jill Fuglister - That assumes a design fix would minimize use. Finally, I am concerned that all the build options use 12 lanes. I don’t understand how Oregonians could support this with their decision they’ve made on the number of lanes for I-5. --Chair – I think we said three through lanes and no more. We will see what we need to do to support three through lanes. We don’t have enough information to know now.
Jay Lyman - (The goal for this phase is not deciding on the number of lanes but to determine the best way to cross the river. The number of lanes has not been decided upon, but needed them to be the same for the purposes of comparing across all the alternatives. Based on previous experience

COLUMBIA RIVER CROSSING TASK FORCE | October 25, 2006
PAGE 10 OF 12
and work to date, it is likely to be 5 or 6 lanes just make the interchanges work. But, we want to bring that topic back to the Task Force early next year., when we have more information.)
--Chair – We know that more than three lanes won’t have anywhere to go. --Steve Stuart – I appreciate all the information on this. I’ve asked if we will get the same level of detail on replacement options. Has that been scheduled?
Jay - (We were supposed to start at 5:10. The next level after looking at specific details of the arterial options is to look at all 12 alternatives. The goal was to spend the balance of this meeting looking how these different alternatives work with respect to the criteria this group has determined.)
--Steve Stuart – Do you have a four hour volume graphic for alternatives 6 and 7?
David Parisi – (No, but we could put it together). --Steve Stuart - Do we have a capacity analysis of Vancouver streets?
David Parisi - (No, we haven’t done that yet.) --Steve Stuart - How do we know what the congestion is then?
David Parisi - (All we have established is that there’d be an increase in traffic volumes.) --Steve Stuart - Seems like it is important for Vancouver to be doing cost analysis for what capacity is available. --Jeri Sundvall-Williams - Dave Frei and I are part of the Community and Environmental Justice Group and what we are hearing is that Hayden Island residents really need another way to get off the island other than the freeway. --Serena Cruz – I don’t want to belabor 12 lanes. Are you assuming one of those six lanes in each direction is for high capacity transit?
David Parisi– (No, all lanes are general traffic other than one that could be managed.) --Serena Cruz – I agree we didn’t have science, but these same engineers that were on the past project said that three through lanes and two auxiliary lanes would handle the traffic. The assumption we’re working with is five through lanes and some other kind of lane. Is that setting things up in terms of comparison when we are looking at the way the bridge traffic will perform?
Jay Lyman - (One of the changes is that we are looking at 10 years further out now and there have been new population forecasts. We did start from the I-5 Partnership conclusions – however the changes in assumptions mean that it is an open question on how do you safely get cars on and off the freeway in the very short distance of the river crossing. It is a good question – we are trying to work it from an analytical perspective and looking at operational and safety conditions. We will start the conversation in March to talk about what we’re learning as we continue our analyses.)
David Parisi – (What we have now for the sake of modeling and comparison are 6 lanes across, with 1 managed on the inside and 1 auxiliary to be picked up and dropped between Hayden Island and SR 14.)
--Serena Cruz - In terms of auxiliary lanes, what are you testing?

COLUMBIA RIVER CROSSING TASK FORCE | October 25, 2006
PAGE 11 OF 12
David Parisi - (Three through lanes to be carried throughout the corridor. Between each interchange, depending on whether you are approaching or leaving the bridge, either adding or subtracting auxiliary lanes.)
--Serena Cruz – So it’s three through lanes, two auxiliary lanes, and one HOV lane?
David Parisi – (Three lanes north and south of the Bridge Influence Area. Because of the volumes and the number of on and off ramps, the number of lanes in each direction goes up from 4 to 5 to 6 as you approach the bridge, and then back down again as you get farther away from the bridge.)
--Chair – It’s in terms of being able to get it all on and off in this area.
David Parisi – (It is different to look at this from an operational basis than a capacity basis. We’re just looking to see if we need to have auxiliary lanes to help get on and off in all these interchanges in such a tight area. It is as much of an operational basis, maybe more so, than capacity when we are talking about these lanes.)
--Tom Miller (for Sam Adams) – I would emphasize the Importance on behalf of Portland to get to this as soon as possible. We are coming into the Hayden Island process soon, and it will in part be based on expectations of what this group will do. --Walter Valenta – I need to talk about the arterial. It represents a philosophy of a lower cost option that is intensely land use based. I propose that we get people together who are interested in this idea, and sit down with the engineers to see how we could get this concept to work. See if there isn’t a way to do mainly an arterial that handles the concerns that Mayor Royce has expressed. --Mayor Pollard – I find little in this proposal that is meritorious. I find it offensive that we would consider dumping this traffic into downtown.
Doug Ficco - (I wanted to address the issue of lanes – we’re getting lost in something that we won’t talk about for six months. There is so much analysis that has to be done to find out how many lanes we need. We have a lot of other stuff to get over before then. I feel like we are wasting our time on this issue when we need to get to other decisions right now, like what kind of transit mode are we considering. We really need to get there. There is an issue about putting more alternatives on the table. Most of the money in this project comes from WSDOT. We don’t have that kind of money, we can only analyze so many alternatives, and the longer we keep them on the table, the more costly it’s going to get. And somehow we have to get a reality of what keeping all this going is costing.)
--Chair – But inevitably a dalliance here and there has to occur. Very few suggestions have taken us off the course the staff has suggested. I don’t see anything offensive about the suggestions that we revisit variations of the alternatives we’ve discussed tonight. It’s inevitable that we’re going to have some issues thrown at us that we need to spend some time thinking about.
Doug Ficco - (I just want to be careful that if we are doing that, it does meet our problem definition. That is, if these alternatives don’t meet our problem definition, we shouldn’t be researching them.)
-- Chair – I don’t think that it will come out of the process if it doesn’t. -- Betty Sue Morris - Where are we on money for the CRC project as a whole?
Doug Ficco – (Right now we have enough to get us to July.)

COLUMBIA RIVER CROSSING TASK FORCE | October 25, 2006
PAGE 12 OF 12
-- Betty Sue Morris - So if the discussion on lanes is drawn out now – we are going to run out of money?
Doug Ficco - (At the next meeting, we’ll discuss our funding and budget, including costs so far.) --Chair - What does staff want to do now with the remaining 20 minutes?
Jay Lyman- (We would like to drop last agenda item– the introduction to the Cost Estimate Validation Process. That will allow us to focus on first half of Jeff’s presentation – which covers the river crossing)
8. Preliminary Alternative Package Evaluation Results
• Presentation by Jeff Heilman (first part only with focus on river crossing) Discussion -- Dave Frei - When you are talking about lifelines, I would think that multiple options versus a single one would balance that out. So I am just curious on that with the supplemental versus replacement bridges.
Jeff Heilman - (What we looked at primarily were the results from the seismic panel. We could conceivably improve the seismic capacity of the existing bridges, but not feasibly to the same standard as a new bridge)
--Steve Stuart – Do you have a quantitative scale to go along with the colors? Are these qualitative?
Jeff Heilman - (It is not specifically a rational scale where one is directly proportional to one another. It’s based on the comparative evaluation of criteria, are there some that stand out better than others. The colors represent better or worse than average)
Jay Lyman - (We tried to roll up a lot of information into this presentation. The details you’re asking about, Steve, are provided in the handouts for the meeting.)
Next Meeting Date / Location Wednesday, November 29, 2006, 4pm – 8pm Washington State Dept. of Transportation 11018 NE 51st Circle, Vancouver, Washington

Appendices to Task Force Meeting Summary
Handouts from Task Force Members Appendix 1: Metro Council letter Appendix 2: Letter from Task Force members Caine,
Frei, Fuglister, Sundvall et al.
Handouts from Public Commenters
Appendix 3: Sharon Nasset letter Appendix 4: Guy Kudlemyer letter Appendix 5: Patrick Singleton letter


What We’re Hearing The themes heard are a snapshot from this four week period and do not represent a scientific survey. They are meant to provide Task Force members with a flavor of the comments the project is receiving. A more comprehensive summary of public comments received will be provided in advance of the February Task Force meeting in preparation for making a final recommendation on the choice of DEIS alternatives. Public comments were received in these forms:
Emails: 20 Short comment forms: 13 Long comment forms: 2 Proposal: 1 Letters: 4 Meeting summaries: 11
River Crossing generated the most public comments with more than 40. Of those, 10 said to keep the existing bridges for future transportation purposes. Six comments supported the proposal to replace the existing bridges and six comments supported ideas for a 3rd river crossing. Many of the comments received were questions from people seeking more information. Transit generated nearly two dozen comments, nine specifically supporting light rail and two listing their opposition to light rail. Other comments related to commuter rail, support for improved public transit, and general questions. More than a dozen comments related to cost, financing and tolling. Most of the comments were in the form of questions. Two comments were in opposition to a toll.
Highway design and alignment generated a dozen comments. Most related to highway design ideas for Hayden Island and were generated from a “mini workshop” held there during this period. Hayden Island residents are generally not supportive of removing the I-5 interchange on the island. Several comments related to concerns with neighborhood impacts from air pollution and noise generated from highway construction or increased traffic. Several other questions related to coordination with other agencies/decision-making. Nearly two dozen comments were classified as “miscellaneous” because they were outside the scope of the project. Other comments that received less than a handful of comments related to the following: transportation issues outside of the project area, freight, and seismic safety. Where We’ve Been In the past four weeks, CRC staff has been to the following events. The number of people reached is in parentheses. Neighborhoods Washington:
• Bennington Neighborhood Assn. (15) • Harney Heights Neigh. Assn. (18) • Shumway Neigh. Assn. (15)
Oregon:
• East Columbia Neighborhood Assn. (25)
• Arbor Lodge Neigh. Assn. (15) • Piedmont Neigh. Assn. (10) • Hayden Island Mobile Home Owners
and Renters Association (41)
Communications Summary October 23 – November 19, 2006

Other
• Identity Clark County board (15) • Say Hey! NW Partners in Diversity
Event (15) • Oregon Highway Users Alliance (19) • Wyeast Middle School (250) • Youth Town Hall, Clark County (9) • SW Region WSDOT open house (41) • Columbia Corridor Association (18) • Kiwanis, Boulevard Chapter, Van. (22) • Task Force Meeting (22 guests) • Opus Northwest, Portland (11) • Portland Freight Committee (26) • Felida Neigh. Park Dedication (10)
The Totals 597 people reached in this 4 week period. 3,726 people reached since March 1, 2006. What else is happening? Clark County Youth Summit Clark County junior and senior high school students attended the annual Clark County Youth Summit. The Columbia River Crossing was the focus of a short seminar on transportation at this county-sponsored event. Students received an introduction to transportation projects and delved into some of the specific issues surrounding the CRC project. It was a great chance for students to learn about what is happening in their area and an opportunity for staff to find out more about the concerns and priorities of the region’s upcoming generation. Community and Environmental Justice Group The CEJG will meet on Thursday, November 30. Topics of discussion include the role of the group in the decision making process and the staff recommendations to the Task Force.
Media Coverage
• The Columbian – Oct. 24: The CRC project was cited as a reason for relocating railroad lines on the Washington side of the Columbia.
• The Oregonian – Oct. 26: In a report on the new executive director of C-TRAN, CRC and the decision of whether or not to extend light rail was mentioned.
• The Columbian – Oct. 26: Front page story on the project with specific reference to the Task Force and the decisions ahead.
• The Oregonian – Nov. 14: In a report on changes to C-Tran’s service, the incorporation of high capacity transit into the CRC project was mentioned. A presentation on BRT that C-Tran received also was referenced.
Outreach Materials
• Staff distributed English, Vietnamese, Russian and Spanish copies of Bridgenews, CRC’s most recent newsletter, at a variety of community hubs in and around the project area.
• One of the traveling informational displays was at the Salmon Creek Library this month. Other possible locations in North Portland and Hayden Island are being researched to house a display in the coming weeks.
• CRC’s first podcast, an audio file available for download from websites, has finished production and will be available on the website soon.
• The second edition of Bridgenews is in the works and is expected to be mailed in early January. This issue will focus on the staff recommendation for river crossing and transit decisions, the schedule for the January open houses, and the upcoming period of public input.

Meetings and Events January Open Houses Wednesday, Jan. 17, 2007 5:30 – 7:30 p.m. Battle Ground Police Dept Training Room 507 SW First St, Battle Ground
Saturday, January 20, 2007 9:30 a.m. - 1 p.m. Lincoln Elementary School 4200 Daniels St., Vancouver
Thursday, January 25, 2007 4:30 - 7:30 p.m. Oregon Association of Minority Entrepreneurs (OAME) 4134 N Vancouver Ave., Portland
Neighborhood and Community Meetings Presentations have been scheduled with the following groups in December and January and will focus on the February DEIS decision: Cascade Park Kiwanis, Portland downtown Kiwanis, Hayden Island Neighborhood Network, Vancouver Rotary, Shumway Neighborhood, Esther Short Neighborhood, Vancouver Lions Club. Other meetings will be scheduled for January. Briefings to Elected Officials/Governing Boards/Advisory Committees To date, presentations have been scheduled with the following groups between now and February: Regional Transportation Commission, Metro, Portland Planning Commission, C-TRAN Board, Cowlitz County, City Center Redevelopment Authority, and Neighborhood Traffic Safety Alliance.
Listening sessions Several “listening sessions” will be scheduled for Clark County and Portland to provide informal discussion opportunities for the public on the recommendation for the DEIS alternatives. The dates and locations will be announced soon. African American Community Unity Breakfast CRC is sponsoring a breakfast Jan. 18 at 7:30 a.m. and will be giving the keynote presentation. Communication Materials Publicity materials are being produced to inform the community about the public comment opportunities. They include: newsletter (scheduled for distribution in early January), podcast (scheduled for uploading in early December), website updates, post card to announce open houses (to be sent in late December/early January), flyers in Vancouver neighborhood newsletters, and the monthly project email. Submitting Public Comments CRC encourages written comments to be submitted to the project office in these ways: Email: [email protected] Mail: 700 Washington St., Suite 300,
Vancouver, WA 98660 Fax: 360.737.0294
Public Outreach Efforts planned for Decision on DEIS Alternatives

Staff Recommendation
November 21, 2006 1
for the Range of Alternatives to Advance for Further Analysis in the Columbia River Crossing Draft Environmental Impact Statement
EXECUTIVE SUMMARYThe Columbia River Crossing project staff in consultation with agency partners presents this recommendation for the river crossing and transit components to advance for further analysis in the Draft Environmental Impact Statement. This proposal is intended for the Columbia River Crossing Task Force, interested stakeholders and members of the public.
The Columbia River Crossing project staff in consultation with agency partners proposes forwarding one river crossing and two transit components for further study in the Draft Environmental Impact Statement (DEIS) process:
The primary goal of the Columbia River Crossing project is to find viable solutions to improve safety, reliability and mobility on Interstate 5 across the Columbia River and between State Route 500 in Vancouver and Columbia Boulevard in Portland.
The analysis of all river crossing and transit options show the Mid-level Replacement Bridge, Bus Rapid Transit with Express Bus and Light Rail Transit with Express Bus performed better on nearly all criteria adopted by the Task Force for decision-making.
These components also meet the project’s objectives as stated in the Purpose and Need Statement and Problem Definition.
For these reasons, we propose these river crossing and public transit options be advanced for further analysis during the Draft Environmental Impact Statement (DEIS) process.
We propose the following combinations of components as DEIS alternatives:
Beginning in early 2007, additional strategies to reduce congestion and enhance safety will be added to the draft DEIS alternatives as part of a comprehensive proposal for in-depth analysis in the following year. These strategies will focus on highway, freight, bicycle and pedestrian improvements, and methods to reduce single occupant car trips and improve the flow of traffic.
RECOMMENDATIONS Alternative 1 No Action. This alternative is required for any DEIS process as a baseline for comparison with other alternatives.
Alternative 2 Replacement Bridge and Bus Rapid Transit (BRT) with complementary Express Bus service.
Alternative 3Replacement Bridge and Light Rail Transit (LRT) with complementary Express Bus service.
River CrossingMid-level Replacement Bridge
TransitBus Rapid Transit (BRT) with complementary Express Bus
TransitLight Rail Transit (LRT) with complementary Express Bus

2 River Crossing Recommenations
RIVER CROSSING In addition to the No Action alternative, the CRC staff proposes to advance for further analysis one river crossing option: a mid-level Replacement Bridge. When tested against other river crossing components, a replacement bridge performs better on nearly all criteria adopted for decision-making.
A Replacement Bridge would accommodate all types of travel over the Columbia River, including vehicles, freight, public transit, bicycles and pedestrians. The bridge would be built high enough to avoid the need for a lift span. It also would be designed to avoid impacts to the airspace of Pearson Air Park.
As part of the continued analysis of benefits and impacts in the upcoming year, further study is warranted to determine whether a replacement bridge should be constructed east (upstream) or west (downstream) of the existing Interstate Bridges location.
With this recommendation, CRC staff proposes to dismiss from further consideration two different Supplemental Bridge options that would retain the Interstate Bridges. The first option, “supplemental downstream arterial bridge,” calls for keeping interstate traffic on the existing Interstate Bridges and constructing a new bridge for local traffic. The second, “supplemental downstream I-5 bridge,” calls for a new bridge for I-5 traffic and would retain the existing bridges for local traffic, bicycles and pedestrians, and public transit.
The CRC staff recommends that the Replacement Bridge option advance for further analysis for the following reasons:
IMpROVES FlOw OF I-5 TRAFFIC
Compared to keeping interstate traffic on the existing Interstate Bridges, a new I-5 bridge would better meet the forecasted travel demands through 2030. Traffic analyses completed in summer 2006 indicate this to be the case even with the construction of a new four lane arterial bridge that also would carry light rail. While some regional and local trips would be carried by a new arterial under the “supplemental downstream arterial bridge” option, forecasts indicate that much of the arterial’s capacity would remain unused and it would do little to address the over-capacity conditions on I-5.
Because traffic congestion on the existing bridges is expected to worsen even with construction of a new arterial bridge, retaining the status quo for interstate travel would not meet the project’s goals, as stated in the Problem Definition and Purpose and Need Statement.
IMpROVES SAFETY
Crash rates are higher on and near the Interstate Bridges than other comparable urban freeways in Washington and Oregon due to bridge design, bridge lifts, number of vehicles traveling and vehicle speed. Narrow one-foot shoulders do not allow disabled vehicles to pull off the highway safely and the “hump” in the middle of the bridges does not provide sufficient line of sight for vehicles traveling more than about 35 mph.

Columbia River Crossing �
Retaining the status quo for safety would not meet the project’s goals, as stated in the Problem Definition and Purpose and Need Statement. As a result, the “supplemental downstream arterial bridge” option, which calls for continued use of the existing bridges for I-5 traffic, is not recommended to advance.
ElIMINATES NEED FOR SEISMIC UpGRADES
A Replacement Bridge would be built to current seismic standards to withstand a significant earthquake and continue to serve the transportation needs of the region during recovery.
The existing Interstate Bridges do not meet earthquake standards and would likely need to be upgraded if the structures were used for any transportation purpose, including interstate travel, arterial travel, public transit and paths for bicyclists and pedestrians. In August 2006, a panel of seismic experts determined the structure would potentially collapse during a significant earthquake because the soils holding many of the bridge’s wooden piers would liquefy. The panel also reported that the structure could be retrofitted to partially meet current earthquake standards (i.e., it could be designed to avoid collapse). However, even with a seismic upgrade to prevent collapse the structure could be rendered unusable after a significant earthquake. A seismic upgrade would
require reinforcing each of the piers with a concrete encasement and nearly completely rebuilding the lift structure. Pier encasements would increase the diameter of each pier by 10 to 40 feet, which would reduce the space between piers for marine traffic.
lOwER COSTS
The existing bridges are expensive to maintain and operate in comparison to a Replacement Bridge because of their age, need for bridge lifts, and characteristics of the structures. In addition to current annual operation, maintenance, and capital costs of about $3 million per year, seismically upgrading the bridges could cost between $125 and $265 million.
The existing bridges could accommodate both high capacity transit options under consideration: either light rail or bus rapid transit. However, light rail would require costly upgrades to the bridges for placement of tracks and power.

� Background Information
REDUCES lAND NEEDS
Adverse land use and right-of-way impacts are generally greater for options that reuse the existing bridges because of the need for parallel connections at each end of the structures. This is especially true on Hayden Island where some of the Supplemental Bridge options require an interchange design with a much larger footprint, nearly doubling the permanent property required for the widened I-5 freeway corridor and its interchanges, as well as the right-of-way needed for the existing bridges being used as an arterial. As a result, business and private property displacements would increase with the Supplemental Bridge options.
FEwER IMpACTS TO lOCAl STREETS
The Supplemental Bridge options provide a local arterial connection between downtown Vancouver and Hayden Island. All of the options would cause an increase in congestion in downtown Vancouver and Hayden Island compared to the Replacement Bridge options due to traffic diversion to local streets that would result from congestion on I-5, especially for the Supplemental Arterial option. Other traffic impacts would result from routing Clark County trips to Hayden Island through downtown Vancouver.
In addition, congestion and queueing would result from bridge lifts. The U.S. Coast Guard has said lifts could occur at any time of the day if the existing bridges are not used for interstate traffic. Currently, bridge lifts are restricted from 6:30 to 9 a.m. during the morning peak period and 2:30 to 6 p.m. during the afternoon peak period. A change to frequent bridge lifts would result in
increased arterial congestion in downtown Vancouver and on Hayden Island and the vicinity of Marine Drive in Portland.
IMpROVES RIVER NAVIGATION
River navigation problems would worsen from current conditions under the Supplemental Bridge options because nearly three times more bridge piers would be placed in the water creating more navigational hazards. In addition, the piers associated with the existing bridges would be widened as part of the seismic upgrade, further restricting the river navigation channels.
The U.S. Coast Guard currently recognizes this stretch of the Columbia River as one of the more difficult areas to navigate because of currents and the challenges associated with weaving through the Interstate Bridges and the railroad bridge one mile downstream. River navigation would be improved under the Replacement Bridge options because the marine channel alignment would be improved with fewer piers and the need for bridge lifts would be removed.
GREATER RElIAbIlITY FOR TRANSIT SERVICE
The existing bridges would continue to be affected by bridge lifts. For that reason, a Replacement Bridge provides for more reliable transit service compared to the Supplemental Bridge options that place light rail or bus rapid transit on the existing bridges. Bridge lifts that could occur any time during the day would disrupt transit service throughout the entire transit system.

Columbia River Crossing �
pROJECT bACKGROUND AND TIMElINE
FAll 2005Defining the Problems and Potential Solutions
The Columbia River Crossing project staff reviewed data developed by the I-5 Transportation and Trade Partnership and worked with the public, tribal governments and partner agencies to define the primary problems in the project area, which included congestion, dangerous travel conditions and travel demand that exceeds capacity. The staff then used a public process to brainstorm potential solutions and ideas to address the problems. The staff worked with the project’s advisory Task Force to develop criteria based on regulatory requirements and community values and concerns to evaluate the potential solutions and ideas.
SpRING 2006 Narrowing the Ideas
Through discussions with the Task Force and community, the CRC project staff studied the options proposed for improving the river crossing and public transportation. A set of 23 initial river crossing ideas was eventually reduced to four and a set of 14 initial public transportation ideas was reduced to five over a series of months.
SpRING – SUMMER 2006 Testing the Preliminary Alternatives
A dozen preliminary alternative packages were generated by combining options under consideration for the purpose of testing and analysis. Each preliminary alternative was composed of components or parts that make up a comprehensive transportation system to address the safe and
efficient movement of people and goods between Oregon and Washington. River crossing, highway, transit, freight, bicycle and pedestrian improvements and strategies to reduce travel demand are the components that comprised the alternatives. River crossing and transit components serve as the fundamental elements for analysis of improvements to the I-5 corridor.
The 12 preliminary alternative packages were tested against the evaluation criteria to highlight the strengths and weaknesses of individual components and the best performing combinations. The analysis incorporated community, cost, land use, environmental, environmental justice, and seismic concerns.
Results from this work are now available.
FAll 2006 Identifying Best Performing Components for the Draft Environmental Impact Statement
Columbia River Crossing project staff in collaboration with partner agencies have proposed the best performing river crossing and transit components move forward for further evaluation in the Draft Environmental Impact Statement (DEIS). These best performing river crossing and transit components have been repackaged into three draft DEIS alternatives as part of the proposal. Beginning in early 2007, other components that will incorporate highway, freight, bicycle and pedestrian improvements, and strategies to reduce travel demand will be added to the draft DEIS alternatives for further in depth analysis. The next step is for the Task Force and the community to provide feedback on the recommendations.

This would affect transit reliability, travel times, and ridership beyond just the project area. Each bridge lift during peak periods would back up at least three to four trains or buses at each end of the bridges during peak periods, delaying riders and severely impacting operations north and south of the Columbia River. Today, following a bridge lift, it can take up to an hour to restore highway and transit operations to pre-lift conditions.
Bridge lifts would make high capacity transit service on the existing bridges inferior and more costly compared to operating transit on a new bridge. This raises transportation equity concerns for those options where auto users would be on a new, fixed span bridge and transit users would be on the older, lift span bridge that would be subject to peak period interruptions, decreased reliability, longer travel times and higher operation and maintenance costs. Thus, it would be imprudent to subject a high capacity transit system to frequent and disruptive bridge-lift impacts.
COMMITTED bRIDGE OwNERSHIp
With a Replacement Bridge for I-5 traffic, the Oregon and Washington transportation departments would continue to own, operate and maintain a new bridge similar to the current situation with the Interstate Bridges.
For the Supplemental Bridge options, the functions served by the existing bridges would change to either carrying local arterial traffic or transit. As transportation system uses convert from Interstate to local functions, they move outside of the purview of the DOTs; as such, neither DOT has an interest in owning and operating
facilities that function as city or county facilities. If no alternative owner can be found, the U.S. Coast Guard would require the bridges to be removed. To date, no other entity has expressed interest in owning and operating the existing Interstate Bridges.
FEwER IMpACTS TO NATURAl RESOURCES
Long term natural resource impacts are greater for Supplemental Bridge options versus Replacement Bridge options.
An analysis of the Supplemental Bridge options found they would:
Have more total impervious surface with 10 – 20 percent more deck area, which would increase the amount of pollutants entering the water;Place more piers in the water with about 14 compared to five, which would disrupt fish passage routes and provide greater habitat for predators; andBe less conducive to reducing pollutants in storm water runoff.
These differences all would result in greater adverse impacts to water quality, salmon and other aquatic resources.
In addition, the bridge lifts that would occur with the Supplemental Bridge options would cause more local traffic congestion and would back up light rail or bus rapid transit vehicles attempting to cross the existing bridges. These transportation impacts would result in higher air quality impacts near the river crossing and higher energy consumption, compared to locating all traffic and transit operations on a new fixed span bridge.
•
•
•
6 River Crossing Recommendations

Columbia River Crossing �
REqUIREMENTS RElATED TO lISTING ON THE NATIONAl REGISTER OF HISTORIC plACES
The existing I-5 northbound bridge is listed on the National Register of Historic Places and is therefore subject to special protection under Section 4(f ) of the U.S. Department of Transportation Act. This federal law prohibits the USDOT (which includes the Federal Highway Administration and Federal Transit Administration) from funding any project that would have an adverse impact on significant historic resources unless it can be demonstrated that there are no “prudent and feasible” alternatives that would avoid the impact.
The lead federal agencies (FHWA and FTA) have the authority to determine whether the avoidance
Columbia River Crossing �
A Short History of the Interstate bridgeThe Interstate Bridge is really two adjacent bridges, the first of which was built in 1917 and today carries northbound I-5 traffic. The first bridge was designed when horses shared traffic with automobiles. With a posted speed limit of 15 mph, most motor vehicles crossing the bridge were Model T Fords powered by a 20 HP engine and top speeds of 45 mph. The companion southbound bridge, opened in 1958, was built to match the 1917 bridge and has similar design features that limit operations and safety under current regional traffic use.
In 1960, 30,000 vehicles crossed the I-5 bridges each day. In 2006, in excess of 130,000 vehicles cross daily, resulting in demand that exceeds capacity during extended morning and evening peak periods. By 2030, it is forecast that about 180,000 vehicles will cross the I-5 bridges each day. Over time, each bridges original two lanes were narrowed and repainted to increase capacity by providing three lanes in each direction. This action left no room for shoulders to accommodate vehicle breakdown and recovery or emergency response. At the same time, modern cars, trucks, and buses now are bigger and faster and require roadway design features that are built to current standards to accomodate safer operations.
alternatives are “prudent and feasible.” The CRC team is confident that the accumulation of factors (identified above) will satisfy the Section 4(f ) requirements and have requested the federal lead agencies to provide their legal opinion on the prudence and feasibility of removing the existing bridges. The federal agency opinion will be requested in early 2007.
Formal Section 4(f ) analysis and documentation will be completed as part of the NEPA documentation, scheduled for completion in 2008. Required steps would include photographic records and other documentation of the historic elements and nature of the 1917 bridge.

� Transit Recommendations
TRANSIT In addition to the No Action alternative, the Columbia River Crossing project team proposes to advance two transit options for further analysis in the process to develop a Draft Environmental Impact Statement:
Bus Rapid Transit with complementary Express Bus service on I-� (BRT)Light Rail Transit with complementary Express Bus service on I-� (LRT)
Bus Rapid Transit is a high capacity transit option that incorporates many features commonly associated with light rail. The vehicles may operate either in a roadway separate from the other traffic or in general purpose lanes.
Express Bus service has been combined with both Bus Rapid Transit and Light Rail to better serve transit needs in and beyond the project area. Express Bus service would serve long distance commuter markets by providing direct access to and from Clark County to downtown Portland during morning and evening peak commute hours.
Light Rail is a high capacity transit option that operates in its own right of way, which helps to ensure a fast and reliable transit time. LRT vehicles are typically much larger than buses, thus providing an enhanced capacity for riders.
There were five transit options analyzed by the Columbia River Crossing project team in mid-2006.
Express Bus service in I-5 general purpose lanes
Express Bus service in I-5 managed lanes
Bus Rapid Transit Lite
Bus Rapid Transit (BRT)
Light Rail Transit (LRT)
•
•
•
•
•
•
•
This recommendation would effectively combine the two BRT options with the aim of taking the best aspects of each to create an optimal BRT proposal for the DEIS. In addition, the Express Bus options, with this proposal, would be dropped from further study as stand alone public transportation solution.
The best performing features of Express Bus service in I-5 general purpose lanes and Express Bus service in I-5 managed lanes would be combined with existing local bus service and paired with BRT and Light Rail.
The CRC project team proposes to advance the Bus Rapid Transit and Light Rail options for further refinement and evaluation during the Draft Environmental Impact Statement process for the following reasons:
bUS RApID TRANSIT (bRT) wITH COMplEMENTARY EXpRESS bUS SERVICE ON I-5
Reduces Congestion on I-5
Bus Rapid Transit would increase transit use while reducing the number of buses on the highway. Buses would connect directly to the existing TriMet Yellow Line MAX. This option takes advantage of the existing high capacity transit system instead of traveling on I-5 to and from downtown Portland during morning and evening peak commute hours. Bus Rapid Transit holds
Columbia River Crossing �
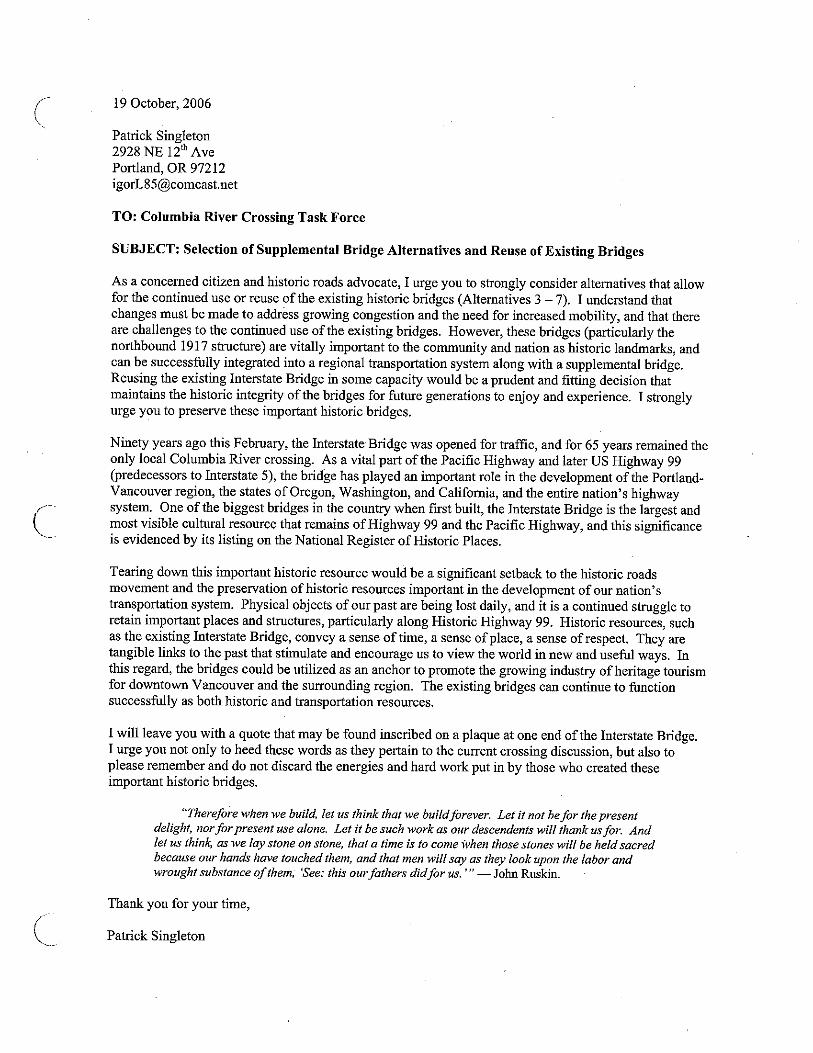
promise for significantly increasing transit use. However, because the BRT system evaluated used I-5 general purpose lanes south of Delta Park, it would experience additional delays from freeway incidents and congestion.
Meets Current and Forecasted Transit Demand for the Year 2030
Extensive data gathering, public review, and forecasting projections conducted by the CRC project staff indicate public transit must be reliable, fast, and frequent. The diversity of transit needs in the project area and the Vancouver-Portland metropolitan area cannot be served by one form of transit alone. To effectively serve current and forecasted travel demand in the year 2030, transit components must be combined.
The Bus Rapid Transit option would meet the test of fast and frequent service, but would experience additional travel delays south of Delta Park, thus degrading future reliability. Schedules would be coordinated with existing transit on both sides of the Columbia River; it would connect to an existing high capacity transit system; and in combination with Express Bus service would provide for long distance commuters to connect directly to downtown Portland. Because BRT would work in conjunction with existing transit, it also provides a high capacity transit alternative at a somewhat lower capital cost (when compared to light rail). As part of the continued analysis of benefits and impacts, the project team will refine the capital cost estimates and conduct continued analysis to determine the most optimal Bus Rapid Transit operating plan.
Addresses public Transit Issues Identified in project purpose and Need Statement
The five transit options considered in 2006 were evaluated to determine how well each addressed these
transit issues identified in the CRC project’s Purpose and Need Statement: markets, reliability, operations and connectivity.
BRT addresses the four transit issues because this option would be part of an integrated transit system connecting transit providers and transit users on both sides of the Columbia River. It would be capable of serving the inner urban core, and when coupled with express bus service would serve suburban long distance transit markets. The option would further enhance transit operations by working in conjunction with existing transit.
lessons learned
The analysis of BRT alternatives provided several lessons to help refine the BRT alternative recommended to be carried forward. Some of the key lessons learned include:
Operating BRT to downtown Portland on I-5 general purpose lanes incurs a large operating expense while subjecting BRT to additional delays due to incidents and congestion.In lieu of operating BRT to downtown Portland, the future service should connect directly to the Interstate MAX line, avoiding travel on I-5 south of Delta Park.To achieve the capacities needed to serve projected market share, BRT frequencies would need to be relatively higher than LRT. Further study will be needed to optimize the number and frequency of buses operating in downtown Vancouver and Hayden Island.
Further study will be needed to optimize alignment and station locations.
•
•
•
•

10 Transit Recommendations
lIGHT RAIl TRANSIT (lRT) wITH COMplEMENTARY EXpRESS bUS SERVICE ON I-5
Reduces Congestion on I-5
Light Rail would extend TriMet’s Yellow Line MAX service from the Expo Center to Hayden Island and across the Columbia River to downtown Vancouver. This option takes advantage of the existing TriMet Light Rail infrastructure already built and operating from Expo Center to downtown Portland, Portland International Airport (PDX), east Multnomah County and Washington County and under construction to Clackamas County.
Light Rail would provide transit that better connects residents within the project area to employment, cultural, educational, health and recreational centers in the region. Operating on a dedicated guide-way separate from vehicle traffic would ensure reliability and consistency of travel times, while also helping to reduce roadway conflicts and congestion on I-5 general purpose lanes.
Meets Current and Forecasted Transit Demand for the Year 2030
Of all the transit alternatives considered, Light Rail features the highest passenger capacity and would accommodate the projected transit demand of the year 2030. Fast, frequent and reliable service have been identified through surveys and analysis conducted by the CRC project team as the most important features of public transit. Light Rail has an established high degree of travel time reliability that will continue into the future. Complementary Express Bus service will enhance this attribute.
Extension of the existing Light Rail system has a relatively high capital cost, but the lowest incremental operating cost of any of the high capacity transit options analyzed. Because travel demand will increase, Light Rail’s low operating cost is also a factor that contributes to the recommendation to move this option forward for further analysis.
Addresses public Transit Issues Identified in project purpose and Need
Light Rail was evaluated during 2006 to determine how well the option addressed the transit issues identified in the CRC project’s Purpose and Need Statement: markets, reliability, operations and connectivity.
Light Rail is a specific recommendation outlined in the I-5 Transportation and Trade Partnership Strategic Plan. Combined with complementary Express Bus service, Light Rail addresses the issues identified in the Columbia River Crossing project’s Purpose and Need Statement. Transit markets would have the most access to the region’s future employment centers. Light Rail with complementary Express Bus service

Columbia River Crossing 11
on I-5 also would offer greater support to development and redevelopment in the City of Vancouver than other alternatives. The system would benefit from the demonstrated reliability of Light Rail. The option would further enhance transit reliability and operation efficiency because it works in conjunction with existing transit systems.
lessons learned
The analysis of LRT alternatives provided several lessons to help refine the LRT alternative recommended to be carried forward. Some of the key lessons learned include:
LRT has the highest degree of travel time reliability now and in the future. LRT also has the highest passenger capacity of any transit mode evaluated to date.
LRT operating costs are lower than BRT due to the existing and funded Interstate MAX line to the Expo Station. LRT operations need to be refined so that frequencies match the forecasted transit market demand.
LRT park-and-ride capacities need to be optimized to accommodate the forecasted demand from both the inner urban and suburban commuter markets.
Further study will be needed to optimize alignment and station locations.
•
•
•
•

12 Alternatives Recommended for DEIS
Alternatives Recommended for the DEIS Building on the proposals detailed above, the CRC project team further recommends three alternatives be evaluated during the DEIS process. When completed, the alternatives will include a comprehensive set of strategies to address all aspects of traffic congestion and highway safety identified into projects’ problem definition and purpose and need. At this time, the CRC team is forwarding only the river crossing and transit proposals as the defining elements for future decision-making. The following alternatives are proposed:
AlTERNATIVE 1: NO ACTION
Under the National Environmental Policy Act (NEPA), one of the alternatives considered must be a no-action alternative. Although this alternative does not meet the project Purpose and Need, it establishes a baseline for comparison with other alternatives. It will include only existing facilities and services, as well as projects that can be reasonably anticipated for funding and construction in the Metro and Southwest Washington regional transportation plans.
AlTERNATIVE 2: I-5 REplACEMENT bRIDGE wITH bUS RApID TRANSIT (bRT)
River Crossing Features
This alternative includes construction of a new I-5 replacement bridge. It would be built as a mid-level span to comply with vertical clearance requirements
wHAT IS A DRAFT ENVIRONMENTAl IMpACT STATEMENT (DEIS)?
The National Environmental Policy Act (NEPA) is a federal law that regulates the decision-making processes of federally funded projects. The purpose of NEPA is to help ensure that public projects address the needs of the community while avoiding or minimizing negative impacts on human and natural environments.
For any project that might have significant impact on its environment, NEPA requires the development of a Draft Environmental Impact Statement. The DEIS is a summary of the expected impacts each project design, or “alternative,” is likely to have on the surrounding area. Developing a DEIS requires an intense and thorough process of analysis for each proposed alternative.
After completion, the DEIS becomes the subject of one or several public hearings. Through integrating comments from these hearings into the DEIS along with other process elements, project sponsors then create a Final Environmental Impact Statement. As part of this process, they also identify a “locally preferred alternative” to signify the decision of a single project alternative to move forward into funding and construction.

Columbia River Crossing 1�
above the Columbia River and clearance requirements below Pearson Airpark airspace. The mid-level height allows the bridge to be a fixed-span structure with no bridge lifts. The new bridge could be built either upstream or downstream of the existing I-5 bridges, which would be removed once the new bridge could accommodate traffic. The new bridge would carry I-5 traffic in general purpose lanes and potentially in managed lanes, high capacity transit, express bus and bicycles and pedestrians.
Transit Features
This alternative focuses on BRT as the high capacity transit mode crossing the river. It is the consolidation of the best performing elements of BRT, BRT-Lite, and local bus infrastructure and service within the project area, combined with complementary express bus service on I-5. The BRT service would not run buses to downtown Portland, but would instead involve a transfer to the TriMet LRT Yellow Line MAX for continuation to downtown Portland.
AlTERNATIVE 3: I-5 REplACEMENT bRIDGE wITH lIGHT RAIl TRANSIT (lRT)
River Crossing Features
Same as Alternative 2.
Transit Features
Light rail would serve as the high capacity transit mode for Alternative 3 and involve a double-track extension from the Exposition Center LRT Station in Portland to a park and ride terminus near downtown Vancouver. Exact transit alignment(s), termini, and supportive park-and-ride facilities will be refined during the DEIS. Complementary express bus service on I-5 also would be part of this alternative.

Other Outstanding Issues to be Addressed
Several outstanding issues will require further refinement and testing leading up to and during the DEIS. The CRC project team will test many of these issues before launching the DEIS process in spring 200� to narrow the number of outstanding issues and better define the DEIS alternatives. Decisions on these issues will be informed by public feedback and input beginning in December 2006.
High Capacity Transit Alignment and Station Area Refinement
During the screening process to-date, light rail and bus rapid transit were evaluated in the same representative alignment. To complete the DEIS, other alignments for each mode will be evaluated. A short list of alignments, as well as station locations and park and ride facility capacities and locations will be refined for the DEIS analysis.
Roadways North and South Features
Any new Replacement Bridge would include improvements both north and south of the river. These could consist of potential I-5 interchange reconfigurations, arterial street improvements, and I-5 safety improvements within the project area. At some interchange locations, such as Hayden Island, more
than one feasible design option may be advanced for evaluation. During the DEIS process, the most appropriate interchange options for safe and efficient operations will be paired with river crossing and transit modes.
bicycle/pedestrian Features
Any new replacement bridge would accommodate a multi-use path(s) for bicyclists and pedestrians. Improved connections to Hayden Island, downtown Vancouver, and North Portland would be provided.
Freight Features
As recognized by the CRC Freight Working Group, freight vehicles would gain the greatest benefits from increased mobility on I-5 and arterial street improvements through capacity and safety improvements. Additionally, the Alternative 2 and Alternative 3 proposals, where appropriate and feasible, could integrate one or more of the following freight features that remain under consideration:
1� Alternatives Recommended for DEIS

Freight bypass lanes in congested locations where trucks have difficulty merging on and off I-5;Freight direct access ramps at key regional freight accesses to/from I-5;Enhanced design of highway ramps and interchanges for freight mobility
TDM/TSM Measures
Transportation demand management (TDM) promotes programs that are designed to maximize the people-moving capability of the transportation system by shifting travel to non-automobile modes, increasing the number of persons in vehicles, and influencing the time of, or need to, travel. Transportation system management (TSM) programs tend to be traffic operation-oriented activities implemented by public transportation agencies, and include such measures as improved traffic signal timing, enhanced traveler information, the addition of auxiliary lanes at congested intersections, signing and marking improvements, parking restrictions, one-way street systems, and ramp meter by-pass lanes.
Alone, TDM/TSM measures will not satisfy the range of transportation issues identified along I-5 within the project area. This conclusion was reached during the I-5 Transportation and Trade Partnership, and confirmed by more recent modeling and analysis.
Many TDM/TSM measures have the potential to help reduce travel demand and improve operational performance in the project area. Incorporation of a TDM/TSM program into the DEIS alternatives will serve as part of a larger multi-modal solution. The “build” alternatives carried forward into the DEIS process will incorporate the most appropriate and potentially effective TDM/TSM measures as part of a multi-modal solution.
•
•
•
Columbia River Crossing 1�
Managed lanes
A single managed lane in each direction along I-5 will be tested on the new I-5 replacement bridge and within the project area to support express bus service that complements the light rail and bus rapid transit options. The managed lane system to be tested assumes that I-5 would be re-striped wherever possible to add a managed lane between 139th Street in Clark County and approximately Alberta Street (for northbound I-5) or Victory Boulevard (for southbound I-5) in Portland. The managed lane system would include preferential managed lane merges north and south and would include selected ramp queue jumps for transit vehicles where ramp meters operate. The CRC project team will test managed lane performance to help refine the range of variables needing further evaluation in the DEIS.
Tolling
Early review of funding and financing options for this project suggest that tolling will be required to fund any new Columbia River Crossing. As such, additional work is needed to refine and test various tolling structures and assess how tolling influences at least the following three issues: 1. revenue generation, 2. congestion management, and 3. facility design.
Replacement bridge Structure Type, Alignment, and Appearance
The Replacement Bridge proposal could include an alignment upstream (east) of the existing bridges or downstream (west). The vertical alignment of both upstream and downstream options will be constrained by clearance requirements above the Columbia River and by clearance requirements below Pearson Airpark airspace. These constraints limit the range of potential bridge structure types that could be employed.

MORE INFORMATIONweb www.ColumbiaRiverCrossing.orgphone 866-396-2726 (toll-free)
SUbMIT A COMMENTComments and questions about the Columbia River Crossing project may be submitted at any time through the following channels:
E-Mail [email protected] 700 Washington St., Suite 300 Vancouver, WA 98660Fax 360-737-0294phone 866-396-2726 (toll-free)
Sponsored by the Oregon Department of Transportation and the Washington State Department of Transportation.
Americans with Disabilities Act (ADA) Information: Individuals requiring reasonable accommodations may request written material in alternative formats by calling the Columbia River Crossing Project Office (�60-���-2�26 or �0�-2�6-2�26). For individual needs in Oregon call the Oregon Department of Transportation (�0�-��6-��00). For individuals who are deaf or hard of hearing call the Washington State TTY (1-�00-���-6���) or the Oregon State TTY (1-�00-���-2�00).
Title VI: The project ensures full compliance with Title VI of the Civil Rights Act of 1�6� by prohibiting discrimination against any person on the basis of race, color, national origin or sex in the provision of benefits and services resulting from its federally assisted programs and activities. For questions regarding the Title VI Program, you may contact WSDOT’s Title VI Coordinator at �60-�0�-�0��.
The appearance, aesthetic qualities, and costs of potential bridge structure types will be evaluated during the DEIS process. The CRC project team is developing an Architectural Guidelines and Aesthetic Assessment Framework to engage the public and project stakeholders in a dialogue around these issues.
NEXT STEpS TO REACH A RECOMMENDATION OF THE DEIS RANGE OF AlTERNATIVES
With this document, the CRC project team has issued its proposed range of alternatives to advance into the DEIS. Over the next three months, the project team will conduct a series of meetings with project stakeholder groups and the public to obtain input on this recommendation.
The CRC Task Force will discuss the proposal at its December 13, 2006 meeting. Task Force comments and recommendations from that meeting will be included in the materials presented to the public for consideration. In January 2007, a series of public and agency outreach events will occur to gain feedback on the proposal. The Task Force is scheduled to consider public feedback during its February 2007 meeting and make a final recommendation on the DEIS range of alternatives.
16 Alternatives Recommended for DEIS

G:\CRC\CRC WORKPAPER FILES\9.0 IMPLEMENTATION (INTERDISCIPLINARY COORDINATION)\AA REPORT TOOLS\ROUND 2\11 21 06 DISTRIBUTED TO TASK FORCE\BRIDGE MEMO (2006-11-21).DOC 1 11/16/2006
360/737-2726 503/256-2726 WWW.COLUMBIARIVERCROSSING.ORG 700 WASHINGTON STREET, SUITE 300, VANCOUVER, WA 98660
DRAFT Memorandum
November 21, 2006
TO: Task Force
FROM: CRC Project Team
SUBJECT: UPDATE: Considerations for Replacing Versus Reusing the Existing Interstate 5 Bridges
1. Introduction
1.1 What is the purpose of this memo?
This memo describes key considerations associated with replacing versus reusing the existing I-5 Columbia River bridges. Over the next few of months, the decisions on which alternatives to carry forward into the Draft Environmental Impact Statement (DEIS) will include narrowing the river crossing options. A key choice is whether to remove or keep the existing bridges over the Columbia River. The “replacement” alternatives would remove the existing I-5 bridges and build new structures. The “reuse” alternatives would keep one or both of the existing bridges in addition to building a new supplemental crossing.
The primary purpose of this memo is to provide a summary of the key trade-offs associated with replacing versus reusing the existing bridges, to inform the upcoming recommendations from the Task Force and other advisory, decision-making and stakeholder groups.
1.2 What issues should the Task Force consider before deciding to reuse or replace the existing bridges?
The river crossing alternatives have been evaluated on how well they meet the adopted project Values and Criteria. The key issues to consider in the decision to remove or reuse the existing bridges are:
■ Traffic and transit operations and safety;
■ Navigation operations and safety;
■ Community and economic impacts;
■ Natural environment impacts;
■ Costs; and
■ Other considerations, including Ownership.
1.3 Are there other considerations that will affect the decision?
If the bridges were no longer used for transportation purposes, US Coast Guard policy related to their jurisdiction over navigable waterways would require that the bridges be removed. This eliminates pure “preservation” options that would keep the structures in place but not provide any transportation function on them. Therefore, this memo focuses only on reusing the existing bridges for one or more transportation functions.
In addition to considering how well the various alternatives meet the project’s Vision and Values, the USDOT will need to ensure that the alternatives carried into the DEIS will be consistent with specific requirements of federal environmental law. Because the northbound I-5 bridge is listed on the National Register of Historic Places (NRHP), it is afforded special protection under Section 4(f) of the Department

UPDATE: CONSIDERATIONS FOR REPLACING VERSUS REUSING THE EXISTING INTERSTATE 5 BRIDGES
2
of Transportation Act. This law prohibits the USDOT from funding any project that would have an adverse impact on significant historic resources (as well as public park lands), unless it can be demonstrated that there are no prudent and feasible alternatives that would avoid that impact. An alternative is feasible if it is technically possible to design and build. An alternative may be feasible but imprudent for several reasons, such as: it adds costs of an extraordinary magnitude; it does not meet the project purpose and need; or, it would have an accumulation of factors that collectively have adverse impacts of a unique or extraordinary nature. The formal Section 4(f) analysis and documentation cannot be completed prior to the Final EIS phase in 2008. However, the project team is pursuing input from the USDOT to determine which, if any, of the alternatives that avoid or minimize impact to the existing bridges (e.g. those that reuse the bridge) would be considered prudent and feasible. The USDOT is expected to provide that input by January or early February 2007.
The Task Force and other local advisory and decision-making bodies can make their recommendations prior to the USDOT input. If the USDOT determines that any of the avoidance alternatives are prudent and feasible, then these will be included in the final range of alternatives carried into the DEIS.
2. Key Findings and Next Steps
On nearly all the Values, alternatives that replace the existing bridges perform better than alternatives that supplement and reuse the existing bridges. Replacement options perform better for transit, traffic, navigation, community resources, natural resources, transportation equity and seismic safety. The only key advantage of the reuse options is that they would have less impact on the historic bridge. The following are the current key findings related to the reuse options:
■ Keeping Interstate traffic on the existing bridges (package 3) would not meet the project’s purpose and need related to traffic safety.
■ Arterial traffic could function with adequate safety on the existing bridge (packages 4, 5, 6 and 7). However, that traffic would be affected by frequent (including peak period) bridge lifts that would result in through-traffic intrusion, queuing, and other impacts on Hayden Island and in downtown Vancouver. The options that put arterial traffic on the existing bridge and include an I-5 interchange on Hayden Island (packages 6 and 7) would have substantially greater property acquisitions and business displacements, compared to replacement bridge options. All of these reuse options may also require a major seismic upgrade to the existing bridge. Cost estimates are needed to understand the cost implications of arterial reuse for the existing bridges.
■ Light Rail Transit (LRT) on the existing bridge would likely include major seismic retrofits and design upgrades to the existing bridge. The existing bridge, due to unrestricted bridge lifts interrupting service and reliability, would have substantial operational disadvantages for LRT, doubling travel times between downtown Vancouver and Rose Quarter and causing ripple effects through other parts of the region’s LRT system. There are also important equity considerations that arise if the region places transit service on the lift span bridge that is subject to random service interruptions, delays and added operational costs, while autos and freight are placed on the new fixed span crossing that is immune from bridge lift interruptions. This option also reduces transit cost-effectiveness and therefore jeopardizes the region’s ability to secure federal funding for the transit portion of the project. Cost estimates are needed to fully understand the cost implications of LRT on the existing bridges.
■ Bus Rapid Transit (BRT) on the existing bridge would likely include major seismic retrofits. The existing bridge, due to unrestricted bridge lifts interrupting service and reliability, would have substantial operational disadvantages for BRT, although the impacts would not be as regionally disruptive as with LRT. A bridge lift would increase travel times between downtown Vancouver and Rose Quarter. There are also important equity considerations that arise if the region puts transit service on the lift span bridge that is subject to random service interruptions, delays and added operational costs, while autos and freight are placed on the new fixed span crossing that is immune from bridge lift interruptions. This option also jeopardizes the region’s ability to secure federal funding for the transit portion of the project. Cost estimates are needed to fully understand the cost implications of BRT on the existing bridges.

UPDATE: CONSIDERATIONS FOR REPLACING VERSUS REUSING THE EXISTING INTERSTATE 5 BRIDGES
3
■ Using an existing bridge for bicycles and pedestrians only would require some seismic upgrades. The lower elevation of the existing bridge makes it easier to access than a new bridge, although that advantage is contradicted by the interruptions due to bridge lifts. The lifecycle cost of this option would likely be substantially higher than the cost of accommodating bikes and pedestrians on a new highway and transit bridge (replacement alternatives). Cost estimates are needed to fully understand the cost implications of providing a bike\ped facility on the existing bridge.
Other factors differentiating all of the reuse options from the replacement options are:
■ The river navigation problems associated with the existing bridges would be largely fixed if they were replaced by a new bridge. These problems would be exacerbated by supplementing and reusing the existing bridges. While this is clearly a disadvantage for reuse options, the US Coast Guard has not yet provided a definitive, official opinion or determination on the severity or permittability of a bridge that would degrade navigation. However, Coast Guard officials have informally stated their preference for a replacement bridge. In addition to the bridge lift impacts on navigation, the reuse options would result in nearly 3 times as many piers in the water, compared to the replacement options. The Coast Guard’s concern over the reuse options will be an important consideration for the river crossing decision.
■ Adverse land use and right-of-way (ROW) impacts are greater for alternatives that reuse and supplement the existing bridges versus alternatives that use a replacement bridge. This is especially true on Hayden Island where the Supplemental Bridge options require an interchange design with a much larger footprint.
■ Natural resource impacts are greater for supplemental versus replacement alternatives, especially from a long-term perspective.
■ Ownership is a significant consideration for any reuse option other than interstate traffic use. This may be a fatal flaw if WSDOT and ODOT are not willing and not required to maintain ownership and no alternative owner can be found. Answering these questions requires additional research.
3. Operations and Safety of Reuse Options
3.1 How well would interstate traffic operate on the existing bridges?
The existing bridges do not meet current interstate highway standards. Sub-standard design features reduce traffic speeds and capacity and increase accident rates for interstate traffic using the bridges. Furthermore, bridge lifts occur during off-peak periods, causing accidents and increasing the chance of congestion throughout the day. Given their through-truss design, it is prohibitively expensive to widen the existing structures to meet current interstate highway design standards. Therefore, alternatives that keep interstate traffic on the existing bridges would not meet the project’s purpose and need.
The existing bridges have steep vertical grades approaching the crest of the structures (the “hump”). Because the crest limits sight distance, the bridge does not meet stopping sight distance standards for speeds greater than about 35 mph. This contributes to increased accident rates on the bridges. Cars approaching the hump cannot see traffic on the downward slope, causing rear-end collisions if traffic has stopped on the other side of the hump.
The shoulders on the bridges are approximately 1 foot wide, well below the standard 10 – 12 feet. This is inadequate as a storage location for disabled vehicles and forces drivers on the outside lanes to be undesirably close to the physical barriers that border the bridges. The lack of safe areas for incident response, disabled vehicle pullout, and driver recovery impairs the ability to manage highway operations and recover from events that interrupt traffic flow. As a result, accidents occur more frequently and even minor accidents can cause severe delay crossing the bridges.
Upgrading the existing bridges to reduce vertical grades and provide sufficient shoulder widths is prohibitively expensive. Reducing the vertical grades would require significant modifications to piers and reconstruction of selected truss spans. Though technically feasible, this would be prohibitively expensive

UPDATE: CONSIDERATIONS FOR REPLACING VERSUS REUSING THE EXISTING INTERSTATE 5 BRIDGES
4
and would impact river navigation by lowering vertical clearance under the high span channel. The existing bridges are not wide enough to retain three lanes of interstate traffic and provide at least a 10-foot-wide shoulder. Removing one lane of traffic in each direction would provide enough room for one standard width shoulder but would further limit the capacity of the bridges, which are undersized to meet demand even with three lanes in each direction. It would not be technically feasible to widen the existing bridges to provide enough width for a standard shoulder without virtually rebuilding the structures. The existing truss members would have to be removed and replaced with new, wider through truss members, which would be prohibitively expensive, close the bridges during construction, and change the visual character of the existing structures.
Currently, the Coast Guard permits the DOTs to prohibit bridge lifts during peak periods, restricting lifts to off-peak periods. Bridge lifts create congestion because they require traffic to wait for as much as 20 minutes. This is often long enough to create long lines of traffic waiting to cross the bridge, which can take up to 1 hour or more to clear. Bridge lifts also can cause collisions as drivers do not expect to stop as they approach the bridge. Bridge lifts would likely continue to be limited to off-peak traffic periods if the existing bridges remain in use for interstate traffic. However, lift restrictions might be removed if the Coast Guard were to determine that a supplemental bridge created safety concerns for river navigation.
The substandard features on the existing bridges increase accident rates and cause even minor accidents to create congestion. Furthermore, bridge lifts would continue to create operational problems for interstate traffic during off-peak periods. Since the existing substandard design features cannot practicably be corrected, continuing to route interstate traffic on these bridges would not meet the project’s purpose and need.
3.2 How well would arterial traffic operate on the existing bridges?
Reusing the existing bridges for arterial traffic would encounter some of the same problems as reusing them for interstate traffic and introduce some additional difficulties. Providing a crossing devoted to arterial traffic would not reduce or eliminate any of the necessary functions of a new crossing (i.e. it would not make the new bridge need fewer lanes). Retaining the existing bridges for automotive use would result in complex intersection arrangements due to the proximity of a new interstate crossing. Substantial increases in cut-through traffic in downtown Vancouver and Hayden Island would disrupt livability and hinder growth in these areas. Furthermore, while traffic impacts to local streets would be substantial, overall usage of an arterial crossing would be very low, making such a bridge difficult to justify.
Because arterial traffic would have lower speeds and volumes than interstate traffic, it would not be as adversely affected by sub-standard design features, such as the steep grades approaching the “hump” of the bridges. The currently narrow shoulders that do not allow vehicle storage and can cause even minor accidents to create congestion could be widened by converting the six lanes to just four lanes (two lanes per bridge) into an 8-foot-wide outside and 4-foot-wide inside shoulder. An arterial could potentially be posted for travel speeds of 35 mph, which would meet the existing limitations on stopping sight distance.
One significant concern for reusing the existing bridges for arterial traffic is the effect of bridge lifts. Currently, the Coast Guard restricts lifts to off-peak periods. If the bridges are used for non-interstate purposes, discussions with Coast Guard officials have indicated that the lift restrictions would likely be removed. This would permit lifts on-demand throughout the day. Lifts during peak periods would disrupt arterial traffic and increase congestion, travel time, and accidents during these times.
An arterial crossing’s connections in downtown Vancouver, on Hayden Island, and near Marine Drive could also create operational and safety concerns because the supplemental highway bridge and its ramp connections would be immediately adjacent. The interface between the arterial’s intersections and the new highway ramps cause complex intersection arrangements and potentially prohibit some turning movements from the arterial or require circuitous routing.
Perhaps most importantly, an arterial crossing would increase cut-through traffic in downtown Vancouver and on Hayden Island. Initial traffic forecasts indicate that there would be few close-in or short trips that would use an arterial crossing (only 3.5% of the vehicle-trips currently using the existing bridges travel five miles or less). Some motorists taking longer trips would divert to an arterial crossing, especially

UPDATE: CONSIDERATIONS FOR REPLACING VERSUS REUSING THE EXISTING INTERSTATE 5 BRIDGES
5
during congested periods on I-5, and increase traffic intrusion in downtown Vancouver (e.g., along Columbia, Washington, Main, and Broadway Streets), and on Hayden Island streets (e.g., along Center Avenue, Jantzen Drive, and Hayden Island Drive). This would impact intersection service levels, interactions with other modes (e.g., pedestrians and bicyclists), and may introduce safety concerns on local streets.
Diversion of interstate traffic to local streets because of an arterial bridge is especially concerning for downtown Vancouver. Downtown Vancouver is undergoing rapid revitalization, continuing to attract new residential and business development. As the downtown grows, so will traffic destinations and origins. This traffic growth is indicative of a thriving downtown and is desirable. However, traffic diversions from the Interstate crossing would increase traffic traveling through, not to, the downtown area. This would increase traffic congestion on these streets without increasing the commerce and enjoyment of downtown Vancouver.
Preliminary traffic modeling results indicate different supplemental bridge options produce substantially different arterial traffic impacts on downtown Vancouver. Constructing a new supplemental arterial bridge (keeping interstate traffic on the existing bridges) would increase traffic in downtown Vancouver by about 60% to 70% more than if a replacement bridge were built. If the existing bridges were used as an arterial crossing and an interchange on Hayden Island were not constructed (instead relying on a new downstream bridge over the Oregon Slough), arterial traffic in downtown would increase about 50% more than with a replacement bridge. If the existing bridges were used as an arterial bridge and an interchange on Hayden Island were constructed for the supplemental interstate crossing, arterial traffic in downtown would increase by about 15% to 20%. Under the latter scenario (new supplemental interstate crossing with a Hayden Island interchange), traffic impacts in the downtown are much less because total usage of the arterial crossing would be very low – only about 400 to 500 total vehicles per hour during the PM peak period.
Operating arterial traffic over the existing bridges proves very problematic. While some of the safety concerns that exist for interstate traffic could be alleviated, new problems arise. Retaining the bridges as a second vehicular crossing requires complex interchange configurations that consume highly desirable land on Hayden Island and in downtown Vancouver. Furthermore, these areas would both be burdened by cut-through traffic diverting from the new interstate crossing to the arterial bridge, clogging local streets. Added to these problems is the fact that a separate arterial crossing does nothing to address the project’s Purpose and Need.
3.3 How well would transit operate on the existing bridges?
Reusing the existing bridges for LRT or BRT would require substantial upgrades and would still limit transit operations when compared to using LRT or BRT on a new bridge.
Operating LRT on the existing bridges would require adding an electric power system, rail tracks, and potentially complete deck reconstruction and substantial structural improvements to ensure sufficient load capacity. More importantly, major seismic upgrades (see Section 3.5) would be required to the bridge’s substructure and superstructure and the lift towers and bearings would need to be replaced.
Furthermore, since a new supplemental bridge would be located west of the existing bridges, LRT would need to cross under I-5 at both ends of the bridge in order to access Hayden Island and downtown Vancouver. Such crossings would consume more property and require tight radius curves which would slow LRT operations.
One advantage of operating LRT on the existing structures would be the lower elevation of those bridges on Hayden Island and at the south end of downtown Vancouver. Being closer to ground level allows easier access to the LRT stations by pedestrians, buses, and autos. However, this advantage would be contradicted by the slower LRT speeds and longer LRT route that would result from the two additional I-5 crossings and tight radius curves mentioned above.
Bridge lifts would cause severe limitations on LRT or BRT operations by delaying trains or buses for extended periods of time and decreasing transit travel times, reliability, and ridership. These delays,

UPDATE: CONSIDERATIONS FOR REPLACING VERSUS REUSING THE EXISTING INTERSTATE 5 BRIDGES
6
particularly during peak period when such delays are most harmful, disrupt schedules and limit the travel time benefits that a major transit project is expected to deliver. For LRT, this would also impair signal prioritization — requiring train operators to manually override automated operation — and impede operators’ ability to coordinate signalization at the Steel Bridge in Portland. If the Coast Guard were to allow bridge lifts throughout the day (which is likely), transit operations would be severely impeded because lifts during peak periods may result in up to four trains waiting at both ends of the bridges. This would substantially reduce capacity during times of peak demand. Delays of this magnitude would also impact all other trains operating through the Rose Quarter and across the Steel Bridge and disrupt schedules along the entire Portland Mall because service in these areas is provided by weaving two or more train lines together. Preliminary data suggest bridge lifts would add at least 17 minutes of delay, effectively doubling travel time between downtown Vancouver and Rose Quarter Transit Center. This does not include the effect of train queues that would accumulate during peak periods and the resultant system-wide disruption that would increase delay for many more trains than those directly stopped by a bridge lift.
Reusing the existing bridges for BRT would require the same seismic upgrades (major retrofit of substructure and superstructure and replacement of lift towers and bearings) as for other reuse options. However, unlike LRT, it would not require reconstructing the deck or adding rail and an electric traction power system. The only deck improvements required would be roadway restriping and resurfacing.
There are no meaningful operational advantages to running BRT on the existing bridges versus a new bridge, but there are clear disadvantages. While the operational limitations would not be as severe to BRT as to LRT, they would still be substantial. Bridge lifts would not be as disruptive to system-wide performance compared to LRT, but they would result in holding up to three buses at each end of the bridge during the peak periods, thus increasing travel times and decreasing reliability and passenger-carrying capacity.
The existing bridges can be retrofitted to meet design standards for LRT and BRT use. However, these retrofits would be substantial for LRT and would still result in much lower operational efficiency and reliability compared with transit operation on a new structure. Seismic safety would require major seismic upgrades to nearly all bridge elements, whether used for LRT or BRT. If the Coast Guard were to allow bridge lifts during peak periods, which appears likely, the negative impact on either LRT or BRT reliability, travel time, and ridership would likely fall short of meeting the project’s purpose and need.
Transportation equity is another important issue when considering operating transit on the existing bridges. Transit, especially LRT, would benefit from the advantages of a new fixed span bridge as much as vehicular and freight traffic. Burdening transit riders with delays and reliability problems associated with the lift span makes a clear and undesirable statement about the project’s, and the region’s, priorities. Ultimately, if the project were to pursue relegating transit to the existing bridges, it is likely that there would be substantial community discontent that autos and freight were given priority over transit.
The increased cost and reduced performance of BRT or LRT on the existing bridges raises significant concern about the ability of the transit project to secure federal funds. This project must compete nationwide for a limited funding pool, and any options that add costs and decrease transit rider benefits decrease the competitiveness of the project.
3.4 How would the existing bridges work for pedestrians and bicyclists?
Existing bicycle and pedestrian facilities across the existing bridges are 4 feet narrower than the 10-foot minimum standard and are located extremely close to traffic lanes, impacting safety for pedestrians and bicyclists. Furthermore, connectivity between the bridges and adjacent areas is poor; bicycle and pedestrian connections between Marine Drive, Hayden Island, and Vancouver require out-of-direction travel.
Options for reusing the existing bridges for bicycles and pedestrians range from retaining the current conditions to devoting one of the existing bridges entirely for these users. The former option would not address the project’s purpose and need, while the latter could improve capacity and safety for bicycles

UPDATE: CONSIDERATIONS FOR REPLACING VERSUS REUSING THE EXISTING INTERSTATE 5 BRIDGES
7
and pedestrians comparable to a facility on a new bridge. Minimal upgrades would be required to convert one of the existing bridges for bicycle/pedestrian use.
However, seismic safety may still require substantial seismic upgrades as discussed in Section 2.5, thus adding substantial cost to this bike/ped option, compared to accommodating pedestrians and bicycles on a new multi-use bridge. In addition, the lift span would be allowed to open at any time and would require 24-hour staffing. This could make the bridge a very expensive bicycle/pedestrian facility and it is doubtful that there is a public entity that would be willing and able to assume ownership. Although lifts would likely occur even during peak periods, they would not be expected to substantially impact bicycle or pedestrian safety, though they would introduce delays and uncertainty.
The existing bridges can be retrofitted to meet design standards for bicycle/pedestrian use. Reusing one of the bridges exclusively for bicycles and pedestrians would perform nearly as well as a facility on a new structure as long as the connections at each end were improved. However, the cost of seismic upgrades and the cost of long-term lift span operations make it unlikely that any public entity would be willing and able to own and operate one of the existing bridges exclusively for bicycles and pedestrians.
3.5 Can the existing bridges be seismically upgraded to current standards?
The project convened an “Expert Seismic Panel” of structural engineering and geotechnical engineering experts for a two-day workshop on August 28 and 29, 2006 to discuss the seismic vulnerabilities and retrofit strategies of the existing bridges. Based on the age and design of the bridges, the soils in which the bridge piers are located, and the seismic vulnerability of this region, the Seismic Panel considered the existing bridges to be highly vulnerable to significant damage and/or collapse from a seismic event. Key findings from this panel included:
■ Soil will liquefy to a significant depth, requiring a full foundation seismic retrofit to avoid foundation failure;
■ The rebar in the pier columns lacks adequate confinement and could be severely damaged;
■ The bridge bearings would be significantly overstressed in a major seismic event and would fail;
■ The movement of the unrestrained bridge counterweights during a seismic event could severely damage the bridges; and
■ The tower and truss span members and connections are vulnerable to overstress and damage during a seismic event.
The bridges currently do not meet basic “no collapse” criteria for safety in the occurrence of a major seismic event. The panel determined that it is technically feasible to retrofit the existing bridges to a level of service that would meet “no collapse” criteria, though the expense could be equal to a substantial portion of the cost of a new structure. The panel discussed the structural elements that were considered to be most vulnerable to severe damage or failure in a seismic event and retrofit strategies that addressed these vulnerable elements. The panel recommended that any alternative that reuses the existing bridges should, at a minimum, have a seismic retrofit strategy that protects against collapse (rather than maintain an operational level of service) in a 500-year event. Such a decision would likely rest with the entity owning the bridge.
Seismic retrofits would change the visual character of the existing bridges due to added and strengthened structural members and rebuilt towers. Changes to the structural members would likely not be apparent to traffic traveling over the bridges, but would be visible to viewers on Hayden Island and in downtown Vancouver. Rebuilding the lift towers would substantially change the visual character of the bridges for travelers on the bridges and viewers on Hayden Island and in downtown Vancouver.
Seismic retrofits would include encasing the existing foundations, adding 20 to 80 feet to the width of each of the foundations. This would extend the current foundation limits and reduce the horizontal clearance between piers, worsening the already restricted navigation route (see section 4.1) that many vessels must traverse between the existing bridges and the downstream railroad bridge. Increasing the

UPDATE: CONSIDERATIONS FOR REPLACING VERSUS REUSING THE EXISTING INTERSTATE 5 BRIDGES
8
width of the existing bridge foundations and adding a supplemental new bridge would combine to further tighten the horizontal navigation clearances.
The existing bridges are clearly vulnerable to seismic events and major seismic retrofits are necessary to safely reuse the bridges. These retrofits are expensive, potentially change the visual character of the bridges, and reduce the safety of marine traffic traveling between the piers.
4. Navigation Considerations
4.1 How would river navigation be affected by reusing versus replacing the existing bridges?
Vessels traveling under the existing I-5 bridges and through the swingspan of the Burlington Northern Santa Fe (BNSF) railroad bridge often choose a less direct route between the bridge piers to avoid delay. The most direct navigation channel through this river section is through the lift spans of the I-5 bridges and the BNSF bridge swing span. This route is relatively straight and is preferred during times of high velocity river flow. However, it is subject to lift span restriction periods that can delay vessels. As vertical clearance allows, vessel operators can avoid delays during lift span restriction periods by traveling through the I-5 bridges’ wide or high spans. Since the wide and high spans are south of the BNSF bridge swing span, this path dictates a more complex maneuver than the route through the I-5 lift spans. Vessels using the wide or high spans must navigate an “S” curve path between the I-5 bridges and the BNSF bridge.
Alternatives that reuse and supplement the existing bridges complicate river navigation by placing additional piers between the existing bridges and the BNSF bridge. There are two options that have been analyzed for pier locations — one with 600-foot spacing and another with 800-foot spacing. Both spacing options impact river navigation for the high span channel and the 800-foot span length impacts the lift span channel. Additional piers from supplemental bridges make navigation routes through the high span more difficult. Recreational vessels that typically use the high span may be forced to use the lift span if a supplemental bridge is constructed. In general, additional piers will decrease vessel safety, particularly along routes using the wide and high spans. This may cause more vessels to use the lift span, increasing the impact that the lift has on traffic using the existing bridges.
Replacing the existing bridges would remove the piers currently in the river and provide a fixed span that would accommodate nearly all vessels that currently navigate through this portion of the river. This would eliminate the current conflict between navigation operations under the existing bridges and traffic operations over them. A new bridge could also be built to current seismic standards without seismic retrofits that would narrow navigation channels (see section 3.3). Furthermore, the crest of a replacement bridge, and thus the channel with the highest clearance, could be better aligned with the swing span of the BNSF railroad bridge and simplify the route for vessel operators. A replacement bridge would allow river traffic and bridge traffic to traverse without conflict.
The existing bridges create a navigational hazard and restricted bridge lifts impact navigation operations. Seismically upgrading the existing bridge foundations and adding a new supplemental bridge would increase the navigational hazards and the conflict between river vessels and bridge users. This hazard could be eliminated and the operational restrictions avoided by removing the existing bridges and replacing them with a new bridge. Supplemental options that reuse the existing bridges for non-interstate uses might slightly improve navigation conditions by allowing more frequent bridge lifts.
4.2 How will restrictions on bridge lifts affect river navigation?
Currently, the Coast Guard allows ODOT and WSDOT to restrict bridge lifts during peak traffic periods. However, the Coast Guard would likely require bridge lifts to be allowed throughout the day if the existing bridges are reused for non-interstate uses (i.e., arterial traffic, transit, or bike/ped) or if a supplemental bridge were to exacerbate existing impacts on marine safety and operational efficiency. Current restrictions on bridge lifts cause some marine traffic to take the safety risk of making the “S” curve to avoid the delay of waiting to use the lift span, while other vessels that do not want to risk this maneuver must wait to use the lift span during off-peak periods. Thus, alternatives that reuse the existing bridges
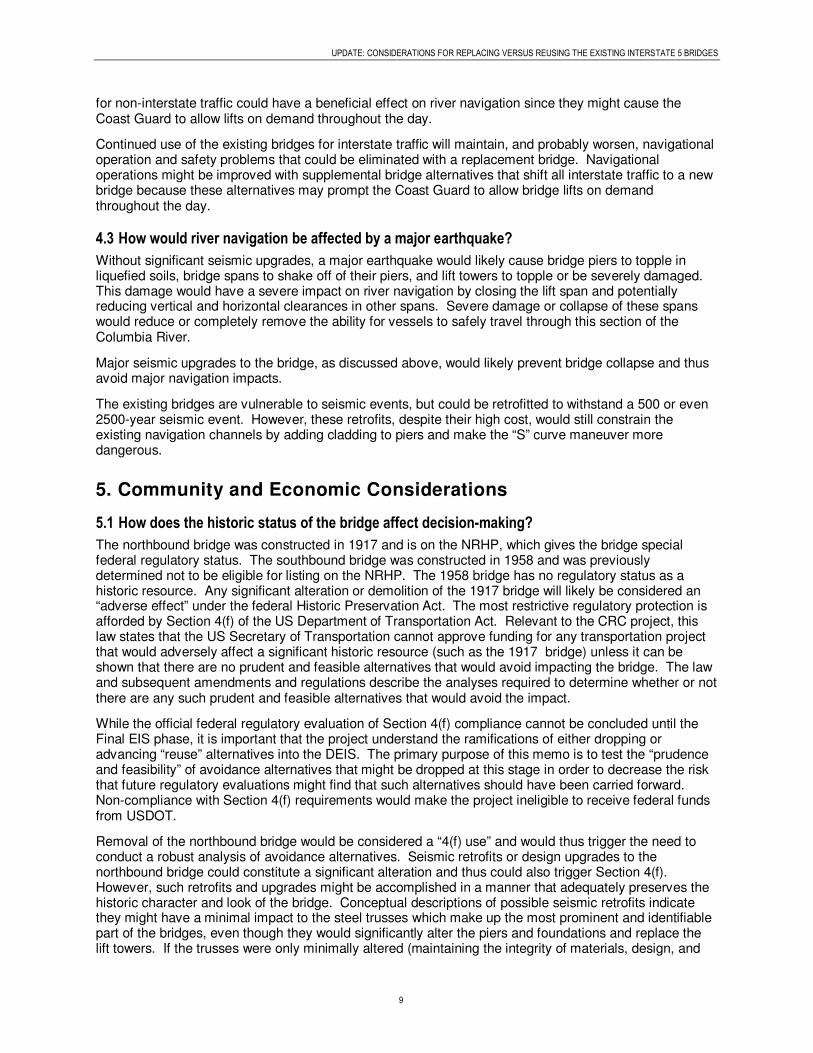
UPDATE: CONSIDERATIONS FOR REPLACING VERSUS REUSING THE EXISTING INTERSTATE 5 BRIDGES
9
for non-interstate traffic could have a beneficial effect on river navigation since they might cause the Coast Guard to allow lifts on demand throughout the day.
Continued use of the existing bridges for interstate traffic will maintain, and probably worsen, navigational operation and safety problems that could be eliminated with a replacement bridge. Navigational operations might be improved with supplemental bridge alternatives that shift all interstate traffic to a new bridge because these alternatives may prompt the Coast Guard to allow bridge lifts on demand throughout the day.
4.3 How would river navigation be affected by a major earthquake?
Without significant seismic upgrades, a major earthquake would likely cause bridge piers to topple in liquefied soils, bridge spans to shake off of their piers, and lift towers to topple or be severely damaged. This damage would have a severe impact on river navigation by closing the lift span and potentially reducing vertical and horizontal clearances in other spans. Severe damage or collapse of these spans would reduce or completely remove the ability for vessels to safely travel through this section of the Columbia River.
Major seismic upgrades to the bridge, as discussed above, would likely prevent bridge collapse and thus avoid major navigation impacts.
The existing bridges are vulnerable to seismic events, but could be retrofitted to withstand a 500 or even 2500-year seismic event. However, these retrofits, despite their high cost, would still constrain the existing navigation channels by adding cladding to piers and make the “S” curve maneuver more dangerous.
5. Community and Economic Considerations
5.1 How does the historic status of the bridge affect decision-making?
The northbound bridge was constructed in 1917 and is on the NRHP, which gives the bridge special federal regulatory status. The southbound bridge was constructed in 1958 and was previously determined not to be eligible for listing on the NRHP. The 1958 bridge has no regulatory status as a historic resource. Any significant alteration or demolition of the 1917 bridge will likely be considered an “adverse effect” under the federal Historic Preservation Act. The most restrictive regulatory protection is afforded by Section 4(f) of the US Department of Transportation Act. Relevant to the CRC project, this law states that the US Secretary of Transportation cannot approve funding for any transportation project that would adversely affect a significant historic resource (such as the 1917 bridge) unless it can be shown that there are no prudent and feasible alternatives that would avoid impacting the bridge. The law and subsequent amendments and regulations describe the analyses required to determine whether or not there are any such prudent and feasible alternatives that would avoid the impact.
While the official federal regulatory evaluation of Section 4(f) compliance cannot be concluded until the Final EIS phase, it is important that the project understand the ramifications of either dropping or advancing “reuse” alternatives into the DEIS. The primary purpose of this memo is to test the “prudence and feasibility” of avoidance alternatives that might be dropped at this stage in order to decrease the risk that future regulatory evaluations might find that such alternatives should have been carried forward. Non-compliance with Section 4(f) requirements would make the project ineligible to receive federal funds from USDOT.
Removal of the northbound bridge would be considered a “4(f) use” and would thus trigger the need to conduct a robust analysis of avoidance alternatives. Seismic retrofits or design upgrades to the northbound bridge could constitute a significant alteration and thus could also trigger Section 4(f). However, such retrofits and upgrades might be accomplished in a manner that adequately preserves the historic character and look of the bridge. Conceptual descriptions of possible seismic retrofits indicate they might have a minimal impact to the steel trusses which make up the most prominent and identifiable part of the bridges, even though they would significantly alter the piers and foundations and replace the lift towers. If the trusses were only minimally altered (maintaining the integrity of materials, design, and

UPDATE: CONSIDERATIONS FOR REPLACING VERSUS REUSING THE EXISTING INTERSTATE 5 BRIDGES
10
scale of the bridge superstructure) the bridge would likely maintain its eligibility for and listing on the NRHP.
The historic status of the northbound bridge places substantial protection on it. USDOT can only fund a replacement bridge if none of the alternatives that reuse the northbound bridge are prudent and feasible. The formal analysis that determines whether USDOT can fund a replacement bridge cannot be approved until 2008 or 2009. Therefore, the project sponsors are conducting a preliminary “prudent and feasible” test at this time in order to reduce the risk that alternatives eliminated prior to the DEIS will comply with Section 4(f) evaluation to be completed at the FEIS phase.
5.2 What is the importance of the bridges as a local cultural resource?
Both of the existing bridges have played a transportation role in the region and have become cultural and community resources. The northbound I-5 bridge is the second largest (in size) historic resource in Vancouver and the largest on Hayden Island. As a result of their historic nature, size, use, and location as a gateway between Washington and Oregon, the I-5 bridges have become a part of Vancouver and Hayden Island’s sense of place. Any new supplemental and replacement alternatives would also function as a gateway and contribute to a sense of place.
The existing bridges also have negative impacts on some aspects of the community and other historic resources. The bridge lift towers negatively impact views from the Vancouver National Historic Reserve and the Fort Vancouver National Historic Site. The upland ends of the bridges are a physical barrier that divides the eastern neighborhood areas of Hayden Island from the western commercial areas, and traffic from I-5 generates substantial noise and affects noise-sensitive uses along the central corridor. Replacement alternatives would remove both the positive and negative visual effects of the existing bridges, and add the visual element of a new bridge and approaches. Supplemental alternatives would combine the visual and physical impacts of the old bridge with those of the new one. The new bridge (with both supplemental and replacement alternatives) would be considerably lower than the existing bridge lift towers but higher than the existing truss structures. They would also be higher across Hayden Island and in southern Vancouver compared to the existing bridges and approaches.
The CRC project’s outreach and communication efforts have described replacement and reuse options to the public and received oral and written comments related to the existing bridges. A few recent comments have mentioned the historic nature of the bridge as a reason to retain them. Some residents on Hayden Island and in downtown Vancouver also value the bridges as a visual resource and as a potential transportation alternative to I-5. Other comments indicated a preference for the operational advantages and reduced land requirements of a replacement crossing. However, no formal survey has been used to scientifically assess the public’s preferences on this question.
5.3 Would replacing the existing bridges be consistent with locally adopted plans?
The existing and proposed new bridges are included in local plans mostly in terms of the functions they currently or potentially could provide. The plans discuss congestion management, freight mobility, mass transit, pedestrian connectivity, etc. For each of these sets of plan policies, the supplemental and replacement options have little difference. For example, both replacement and supplemental bridge packages are able to provide similar levels of vehicular capacity, can provide a high capacity transit link, and will include pedestrian/bicycle improvements. However, those options that keep the existing bridges as an arterial bridge, and thus direct more through-traffic onto local Vancouver streets, would be less consistent with local plans, as discussed in Section 4.4.
In nearly every local land use plan there is a set of policies that call for the preservation of historically significant places and structures. These policies tie historic preservation goals to broader goals for the community, including cultural tourism and protecting a sense of place. Such policies exist in the plans of the Cities of Vancouver and Portland, Multnomah and Clark Counties, and in many sub-area plans. The historic built environments of the Kenton neighborhood, downtown Vancouver, and in the Vancouver National Historic Reserve are all near the existing bridges, include the bridges, or include a view of the bridges. These areas tie their economic success and community livability to the general protection of historic resources. Alternatives that reuse the existing bridges are generally more consistent with the

UPDATE: CONSIDERATIONS FOR REPLACING VERSUS REUSING THE EXISTING INTERSTATE 5 BRIDGES
11
policy direction of preserving historic resources, although there is no specific mention of the I-5 bridges in these documents. Furthermore, the existing bridges are considered to be intrusive on the views from the Vancouver National Historic Reserve and the Fort Vancouver National Historic Site. A new bridge would further intrude on those views, although not likely as much as the combined effects of keeping the existing bridges and adding new ones.
5.4 Will impacts to land use and neighborhoods differ if the bridges are reused or replaced?
There are two primary differences in how supplemental and replacement alternatives are likely to impact land use and neighborhoods: 1) greater ROW requirements from reuse alternatives will consume more community resources and create a more substantial barrier through Hayden Island and downtown Vancouver and 2) reusing the existing bridges for arterial traffic could cause traffic problems on Hayden Island and in downtown Vancouver.
Comparing ROW requirements between reuse and replacement alternatives is difficult to describe succinctly because there are numerous alternative packages for replacement and supplemental bridge options, each of which has different impacts on different areas. Furthermore, ROW acquisitions have not been fully developed for each alternative. However, initial assessments of ROW requirements indicate that reuse alternatives consume more land than replacement alternatives. Not only does reusing the bridges require more ROW, these alternatives will oblige the project to maintain ownership of all the existing land that is currently occupied by elements of the existing bridges and roadways. In contrast, replacement alternatives entail a new bridge that is either east or west of existing structures and could allow some of the area used by the existing bridges and interstate roadway to be sold to new owners and converted to other uses. Therefore, it is reasonable to assume that reuse alternatives generally consume considerably more land compared to replacement options. This will cause reuse alternatives to have greater impacts to existing land use and neighborhood resources such as commercial amenities at Jantzen beach or riverfront property that is valuable to Vancouver’s revitalizing downtown that faces the Columbia River.
Alternatives that reuse the existing bridges as an arterial crossing could substantially increase through-traffic in downtown Vancouver and Hayden Island. Especially during congested periods on I-5, traffic would likely divert from the new bridge to the arterial crossing and increase traffic intrusion along local streets. This could deteriorate the social cohesion that downtown Vancouver is developing and disrupt neighborhoods on Hayden Island.
Reuse alternatives require more ROW than replacement options, potentially causing greater disruption and creating a larger barrier to social cohesion on Hayden Island and downtown Vancouver. Alternatives that reuse the existing bridges for arterial traffic exacerbate this by adding through-traffic in these areas at all times and especially during periods when I-5 is congested.
5.5 How would development and economic opportunities be affected?
A qualitative comparison of development/redevelopment impacts of supplementing versus replacing the existing bridges indicates that the extra land requirements of building a supplemental crossing would consume additional valuable land in downtown Vancouver and add constraints to redevelopment opportunities along the Vancouver waterfront and Hayden Island waterfront. Overall, supplemental alternatives appear to reduce, or at least increase to a lesser degree, redevelopment potential in the project area compared to replacement alternatives.
6. Natural Environment Considerations
Supplemental bridge alternatives would create more substantial short-term and permanent impacts to the natural environment than a replacement bridge option. Seismic retrofits to the existing bridges, coupled with construction of a new supplemental bridge, would cause more temporary disruption to stream flow and aquatic species than the deconstruction and construction associated with a replacement bridge. A replacement bridge would also have less long-term effects because it allows more thorough and efficient treatment of stormwater, and would create substantially less in-water structure.

UPDATE: CONSIDERATIONS FOR REPLACING VERSUS REUSING THE EXISTING INTERSTATE 5 BRIDGES
12
The temporary impacts from a supplemental bridge option would be greater than from a replacement bridge. Constructing seismic retrofits on the piers and towers of the existing bridges would entail extensive in-water work and require cofferdams around each pier to allow new piles to be driven around them. This work would disrupt stream flows and potentially impact water quality through increased sediment and turbidity from debris and dust falling into the river. The deconstruction of the existing bridges associated with replacement bridge options poses a similar potential to impact water quality and aquatic species’ habitat, but to a much lesser extent due to lesser duration and physical intrusion.
Replacement alternatives would have less long-term impacts on fish habitat and passage because they would have less structure over the water and substantially less structure in the water compared to alternatives that reuse the existing bridges. A supplemental bridge, paired with the existing bridges, would cover more of the river. Adding a new bridge while retaining the current bridges also entails more in-water structure than replacing the existing bridges. Furthermore, seismic retrofits to the current bridges require encasing the piers, widening each 20 to 80 feet. Compared to a replacement bridge, supplemental bridge alternatives entail far more permanent structure in the river, threatening ESA protected fish by disrupting stream flows and providing predator habitat.
Long-term stormwater impacts on water quality are likely to be worse for alternatives that reuse the existing bridges than alternatives that replace them, though both would improve upon current conditions. Currently, stormwater from the existing bridges flows untreated into the Columbia River. Reusing the existing bridges could include retrofitting parts of them with stormwater retention and conveyance facilities. However, stormwater and pollutants on the lift spans of the existing bridges would likely flow untreated into the river because the movement of these spans makes retrofits much more difficult. Furthermore, the increased deck area of supplemental bridge options increases stormwater volumes, requiring greater retention and treatment facilities. Given the constrained urban environment of the project area, this added facility requirement is likely an important distinction between supplemental and replacement bridge alternatives. Replacement bridge alternatives more easily allow the complete retention, conveyance, and treatment of stormwater and thus improve water quality conditions vital to the health of aquatic species in the river better than allowed by supplemental bridge alternatives.
7. Cost Considerations
Cost estimates of alternatives are not yet available. Once estimated, the project team will compare the total estimated cost of constructing and operating a supplemental alternative versus a replacement alternative. Key cost considerations include:
■ Cost to demolish and remove the existing bridges
■ Cost to seismically retrofit the existing bridges
■ Cost to upgrade design features of the existing bridges for different reuses
■ ROW costs for supplemental and replacement alternatives
■ Capital cost to construct a supplemental versus replacement bridge
■ Operation and maintenance costs of a replacement bridge versus a supplemental bridge (which includes O&M of the existing bridges).
Once each of these costs is estimated, the project team will compare lifecycle costs of the supplemental versus replacement bridges.
8. Other Considerations
ODOT and WSDOT have indicated they would choose to not retain ownership of the existing bridges if they are not used for interstate traffic. Currently, no other entity has expressed interest in assuming ownership of the existing bridges. However, there has been no formal solicitation from ODOT or WSDOT, and such a determination would likely require extensive negotiations. Any prospective owner

UPDATE: CONSIDERATIONS FOR REPLACING VERSUS REUSING THE EXISTING INTERSTATE 5 BRIDGES
13
would need to be willing to assume the operation and maintenance costs, and perhaps substantial capital expenses for seismic safety upgrades and design retrofit for the new transportation mode (e.g., arterial traffic, transit or bicycle/pedestrian). Such costs would be part of ownership transfer negotiations. None of these issues have been explored extensively by the project team, but may be assessed during later phases of the project if alternatives that reuse the existing bridges advance for further consideration

C:\DOCUMENTS AND SETTINGS\STREIFA\LOCAL SETTINGS\TEMPORARY INTERNET FILES\OLK74\TASK FORCE COVER MEMO (2).DOC 1 11/21/2006
360/737-2726 503/256-2726 WWW.COLUMBIARIVERCROSSING.ORG 700 WASHINGTON STREET, SUITE 300, VANCOUVER, WA 98660
Memorandum
November 21, 2006
TO: Task Force
FROM: Doug Ficco, CRC Project Director
John Osborn, CRC Project Director
SUBJECT: Preliminary Alternative Package Results – Nov 2006 Task Force Meeting
The project team continues to evaluate the 12 Alternative Packages relative to the screening criteria adopted by Task Force in the project’s Evaluation Framework. Performance for many of these criteria were assessed and reported during the October 25 Task Force meeting. This month, the project team will report on most of the remaining criteria, though some will not be evaluated until later phases of the project when more detailed design information is available. Table 1 (attached) shows when each criterion has been or will be evaluated. Results from this month’s evaluations have been summarized similar to the previous month’s data. Results are presented at three levels: Component Findings – These provide the most concise roll-up of findings for the two major decisions to be made in this phase. There is a summary for River Crossing options and one for Transit options. Each summary provides an overview of how the options perform on the screening criteria that have been measured to-date. Value Performance – These provide more detailed findings organized according to each of the project’s adopted Values. There is a separate sheet for each Value. Criterion Performance – These provide the most detailed results. There is a separate sheet for each of the criteria that were used to evaluate how well the project components and alternatives meet the adopted values. The findings are largely focused on River Crossing options and Transit modes. The intent is to use these findings to narrow River Crossing and Transit options for packaging of alternatives to be evaluated in the Draft Environmental Impact Statements (DEIS). A brief summary of the findings for River Crossings and Transit in this latest round of evaluation is as follows: Replacement bridges (upstream or downstream) generally provide better performance than Supplemental Interstate or New Arterial bridge options. Traffic throughput, congestion, and travel time is comparable or better for Replacement bridges. A Replacement bridge provides substantially better transit performance because transit vehicles are not subjected to delays and reliability problems associated with bridge lifts. Freight trucks receive the same benefits as autos and transit from a Replacement bridge. While capital costs for River Crossings have not been calculated yet, maintenance and operation of a Replacement bridge is a small fraction of Supplemental bridge options ($35,000/year versus $3 million/year). Transit findings have shown Express Bus service, paired with either Bus Rapid Transit (BRT) or Light Rail Transit (LRT), provides the best overall performance. Pairing these modes allows transit to reach the most households and employers while providing competitive travel times and good reliability, particularly when paired with a Replacement bridge. Placing transit on the existing bridges, as a Supplemental Interstate option would, would not provide an equitable distribution of benefits; automotive users would benefit from improved travel time and reliability afforded by a new fixed-span crossing while transit

PRELIMINARY ALTERNATIVE PACKAGE RESULTS – NOV 2006 TASK FORCE MEETING
2
patrons would experience delay and poor reliability across the existing bridges. When a distinction can be made, LRT generally performs better than BRT. LRT has greater capacity and lower annual operating costs than BRT ($0.35 per transit seat $1.92/seat respectively). However, LRT has the highest capital costs. For a more detailed summary of River Crossing and Transit findings, please consult the Component Findings described above.

Table 1. Criteria evaluationDistributed for October Task
Force Mtg
Distributed for November Task
Force MtgTo be evaluated
later1 Community Livability and Human Resources
1.1 Avoid, then minimize adverse impacts to, and where practicable reduce, noise levels1.2 Avoid, then minimize adverse impacts to, and where practicable enhance, neighborhood cohesion 1.3 Avoid, then minimize adverse impacts to, and where practicable enhance, air quality1.4 Avoid or minimize residential displacements 1.5 Avoid or minimize business displacements 1.6 Avoid or minimize adverse impacts, and where practicable, preserve historic, prehistoric, and cultural
resources 1.7 Avoid, then minimize adverse impacts to, and where practicable enhance, public park and recreation
resources 1.8 Support development/redevelopment opportunities consistent with local comprehensive plans, including
jurisdiction-approved neighborhood plans1.9 Incorporate aesthetic values of the community in the project design
2 Mobility, Reliability, Accessibility, Congestion Reduction, and Efficiency2.1 Reduce travel times and delay in the I-5 corridor and within the bridge influence area for passenger
vehicles2.2 Reduce travel times and delay in the I-5 corridor and within the bridge influence area for transit modes
2.3 Reduce the number of hours of daily highway congestion in the I-5 corridor and within the bridge influence area
2.4 Enhance or maintain accessibility of jobs, housing, health care and education to travel markets served by the I-5 Columbia River crossing
2.5 Improve person throughput of I-5 Columbia River crossing2.6 Improve vehicle throughput of I-5 Columbia River crossing
3 Modal Choice3.1 Provide for multi-modal transportation choices in the I-5 corridor and within the bridge influence area3.2 Improve transit service to target markets in the I-5 corridor and within the bridge influence area3.3 Improve bike/pedestrian connectivity in the I-5 corridor and within the bridge influence area3.4 Increase vehicle occupancy in the I-5 corridor and within the bridge influence area
4 Safety4.1 Enhance vehicle/freight safety4.2 Enhance bike/pedestrian facilities and safety4.3 Enhance or maintain marine safety4.4 Enhance or maintain aviation safety4.5 Provide sustained life-line connectivity4.6 Enhance I-5 incident/emergency response access within the bridge influence area
5 Regional Economy; Freight Mobility5.1 Reduce travel times and reduce delay for vehicle-moved freight on I-5 within the bridge influence area
5.2 Reduce travel times and reduce delay for vehicle-moved freight in the I-5 corridor5.3 Enhance or maintain efficiency of marine navigation5.4 Improve freight truck throughput of the bridge influence area5.5 Avoid or minimize adverse impacts to the parallel freight rail corridor5.6 Enhance or maintain access to port, freight, and industrial facilities
6 Stewardship of Natural Resources6.1 Avoid, then minimize adverse impacts to, and where practicable enhance, threatened or endangered fish
or wildlife habitat6.2 Avoid, then minimize adverse impacts to, and where practicable enhance, other fish or wildlife habitat
6.3 Avoid, then minimize adverse impacts to, and where practicable enhance, rare, threatened, or endangered plant species
6.4 Avoid, then minimize adverse impacts to, and where practicable enhance, wetlands6.5 Avoid, then minimize adverse impacts to, and where practicable enhance, water quality6.6 Minimize total energy consumption of construction and transportation system operations6.7 Avoid, then minimize adverse impacts to, and where practicable enhance, waterways
7 Distribution of Benefits and Impacts7.1 Avoid or minimize disproportionate adverse impacts on, and where practicable, improve conditions for low
income and minority populations7.2 Provide for equitable distribution of benefits to low income and minority populations
8 Cost Effectiveness and Financial Resources8.1 Minimize the cost of construction.8.2 Ensure transportation system construction cost effectiveness.8.3 Ensure transportation system maintenance and operation cost effectiveness.8.4 Ensure a reliable funding plan for the project
9 Growth Management/Land Use9.1 Support adopted regional growth management and comprehensive plans10 Constructability
10.1 Maintain transportation operations during construction10.2 Minimize adverse construction impacts10.3 Provide flexibility to accommodate future transportation system improvements10.4 Use construction practices and materials that minimize environmental impact
Component Findings

Page 1
Component Findings
River Crossing Findings
Key Findings Value 1 – Community Livability and Human Resources
The alternatives with no new river crossings (No-Build and TDM/TSM) would have the fewest direct adverse impacts to community resources. However, they would not address local or regional plans nor meet the project’s Purpose and Need.
Of the Build Alternative Packages:
Property acquisitions in the river crossing area (from SR 14 to Marine Drive) are a function of several factors, only one of which is the river crossing option itself. Interchange designs at SR 14, Hayden Island, and Marine Drive interchanges are a major factor. River crossings would displace approximately 5 to 15 floating homes. This range varies largely on whether it includes LRT or BRT (that makes the bridge wider) and on the interchange configurations at Marine Drive and on Hayden Island. Supplemental and replacement bridges in all Build alternatives affect up to 30 commercial parcels; most of these would be partial, not full property acquisitions.
A new supplemental arterial bridge (Alternative Package 3) would have the fewest impacts to historic, archaeological, and recreational properties. Replacement bridges (Alternative Packages 8 - 12) would have the greatest historic impacts due to removing the historic, northbound I-5 bridge. However, supplemental bridges (Alternative Packages 3 - 7) would also have impacts to the historic character of the bridge because they would likely require substantial seismic upgrades. Other than the historic bridge, the impacts to historic resources would be similar for all the replacement and supplemental bridge options.
No neighborhood will be bisected by construction of a new replacement or supplemental bridge and no neighborhood will lose more than 10 percent of its total area for construction of the bridges. Upstream replacement bridges require complete acquisition of Safeway, the only grocery store on Hayden Island and a significant resource for the neighborhood. A downstream replacement bridge and supplemental interstate bridge could avoid the Safeway acquisition with some interchange options and would acquire it with other interchange options. The supplemental arterial bridge (Alternative Package 3) would avoid direct impact to Safeway. Safeway could likely be relocated on Hayden Island.
Replacement bridges and the supplemental arterial bridge all put LRT or BRT on the new bridge. This would provide more reliable service and faster travel times, thus better supporting local plans than placing LRT or BRT on the existing lift span bridge (Alternative Packages 4 and 5) or options with BRT-Lite or Express Bus only (Alternative Packages 6, 7, 11, and 12).
Value 2 – Mobility, Reliability, Accessibility
The Supplemental Interstate and Replacement Bridge alternatives result in the shortest overall travel times. These alternative packages reduce northbound I-5 travel times compared to the TDM/TSM and New Arterial alternatives by 50% or more. However, build alternatives do not improve southbound AM peak period travel times because they would carry more vehicles and would not improve capacity limitations south of the project area. A New Arterial bridge provides similar travel times as No-build and TDM/TSM.
Replacement bridges reduce transit vehicle hours of delay (VHD). Supplemental bridge alternatives place transit vehicles on the existing bridges, subjecting them to bridge lift interruptions. Bridge lifts add substantial delay – at least 17 minutes – to vehicles directly affected and cause system-wide disruption for LRT.
The Supplemental Interstate and Replacement Bridge alternatives provide the highest traffic volume throughput. The No-Build, TDM/TSM and New Arterial alternatives provide similar peak period throughput across the I-5 Bridge. The TDM/TSM and New Arterial alternatives do not accommodate I-5 Bridge travel demands, resulting in substantial congestion and increased travel times. The Supplemental Interstate alternatives accommodate about 15% to 20% higher southbound AM peak period traffic volumes and about 35% to 45% higher northbound PM peak

Page 2
period traffic volumes than the TDM/TSM and New Arterial alternatives. The Replacement Bridge alternatives perform best, accommodating about 20% to 25% higher southbound AM peak period traffic volumes and about 50% to 55% higher northbound PM peak period traffic volumes than the TDM/TSM and New Arterial alternatives.
Value 3 – Modal Choice
The Replacement Bridge options and the New Arterial Bridge option perform best for Modal Choice because they would operate transit on a new fixed-span bridge, allowing transit to avoid delays and service interruptions from bridge lifts. Supplemental Interstate bridge options place transit on the existing bridges, subjecting it to bridge lifts that cause at least 17 minutes of delay to vehicles immediately affected and substantially more delay to other vehicles due to system-wide disruption (particularly for LRT). These delays not only impair travel time, but also introduce reliability problems that would make transit a less viable choice.
The Replacement and Supplemental Interstate bridge options provide the best bike and pedestrian connectivity, improving the viability of choosing these modes.
Value 4 – Safety
A replacement bridge (Alternative Packages 8 – 12) provides the greatest safety improvements because it would: provide separate facilities for bicycle and pedestrian travel; increase vehicle capacity over I-5 and provide full shoulders for incident response; eliminate bridge lifts which would alleviate both highway and marine conflicts and congestion; and, particularly for downstream replacement bridges (Alternative Packages 8, 9, and 11), reduce encroachment into the desirable clearance zone for Pearson Airpark. In addition, the replacement bridges would be constructed to current seismic standards. Overall, a replacement bridge would best enhance safety.
Using a new supplemental bridge for interstate traffic (Alternative Packages 4 – 7) would provide similar highway safety benefits as a replacement bridge except that the obstruction into Pearson Airpark’s airspace would remain because the existing bridges would be reused. Also, unless the existing bridges are seismically retrofitted, they may not withstand an earthquake event.
Using a supplemental bridge for arterial traffic, and continuing to operate I-5 on the existing bridges (Alternative Package 3) would likely have a negative impact on highway safety as congestion would increase, which would also likely increase the “no bridge lift” periods and impact marine safety.
Value 5 – Regional Economy, Freight Mobility
The Replacement Bridge options provide the greatest overall benefit to the Regional Economy and Freight Mobility value. The Supplemental Interstate bridge options also perform well on most criteria, but provide much less benefit to marine navigation efficiency.
Supplemental Interstate and Replacement bridges provide the best travel times for trucks in the BIA and I-5 corridor and reduce periods of congestion over the No-Build, TDM/TSM, and New Arterial alternatives. Supplemental Interstate and Replacement bridges also provide the greatest truck throughput and provide more improvements to interchanges used to access ports, freight, and industrial facilities.
Replacement bridges (Alternative Packages 8 – 12) provide the greatest benefit to marine navigation because they eliminate the “no bridge lift” period, remove the S-curve maneuver for vessels, and increase the horizontal clearance between piers. Supplemental bridge options would likely require seismic upgrades to the existing bridge piers that would narrow the horizontal clearance between piers. The supplemental options would further increase physical obstructions in the river by adding additional piers (approximately 14 piers, versus approximately 5 with the replacement bridge options). These factors increase the size and number of piers in the navigation channel and thus adversely impact navigation operations and safety.
Value 6 – Stewardship of Natural Resources Alternative Packages 1 and 2 (No-Build and TSM/TDM) have the least direct impact on natural resources, but they would not meet the project’s Purpose and Need. They would also likely continue to discharge untreated stormwater runoff from the existing bridge into the Columbia River.

Page 3
Replacement bridges (Alternative Packages 8 - 12) would perform better than supplemental bridges (Alternative Packages 3 - 7) due to smaller total footprint, greater ability to treat stormwater runoff, and fewer permanent in-water structures than supplemental bridges.
Value 7 – Distribution of Benefits and Impacts
Replacement bridge options provide the greatest equity between transit and auto users by operating both transit and auto modes on equivalent structures over the river. Supplemental bridge options that locate autos on the new, fixed span bridge, and locate high capacity transit on the existing, lift span bridge (which is subject to bridge lifts that reduce transit reliability, increase transit travel times and increase transit operation costs) could have transportation equity concerns.
The Replacement bridge options (8-12) and the Supplemental Bridge options that provide an interchange on Hayden Island (Alternative Packages 6 and 7) offer the greatest access improvements for all populations and do not appear to have notable disproportionate adverse effects.
Value 8 – Cost Effectiveness and Financial Resources
Capital cost estimates are being developed for the river crossing options.
Supplemental bridge options have much higher annual maintenance and operation costs (approximately $3 million/year) than replacement bridge options (approximately $35,000/year). This is due to higher operation costs (largely because of staffing the lift structure) and major maintenance/preservation work (such as repaving and repainting) that will be required for the existing bridges. The new, fixed span bridge would not require 24-hour staffing, and would not require any additional major preservation or maintenance improvements during the planning period (2035).
Value 9 – Growth Management/Land Use
A new bridge for LRT service (Alternative Packages 3, 8, and 9) best adheres to regional plans and policies because it provides more reliable and faster service than running LRT on the existing bridge, or providing BRT, BRT-Lite or Express Bus only. This favors replacement bridge options.
Supplemental bridges and No-Build alternatives better support the Clark County planning policy that includes historic preservation because replacement bridges remove the existing northbound bridge that is on the National Register of Historic Places.
Value 10 – Constructability
Construction impacts would be less for the New Arterial bridge compared to the other Supplemental and Replacement bridge options because it has the smallest footprint and would not require construction phasing to transfer I-5 traffic to a new bridge and interchanges. Designs are currently conceptual and therefore provide little basis or detail for distinguishing other aspects of constructability at this phase.

Page 4
Transit Findings Key Findings Value 1 – Community Livability and Human Resources No-Build and TSM/TDM only options (Alternative Packages 1 and 2), followed by Express Bus only (Alternative Packages 7 and 11) would have the lowest direct impact on community resources but would not meet key policies in local plans.
Of the Build Alternative Packages, Express Bus only (in Alternative Packages 7 and 12) would have the lowest direct impact because they would be contained largely within the I-5 right-of-way. However, better transit and pedestrian access to Hayden Island and downtown Vancouver afforded by LRT and BRT (in Alternative Packages 3 - 5 and 8 - 10) would provide greater potential for commercial and residential vitality and community enhancement. None of the transit options would bisect neighborhoods or affect more than 10 percent of any neighborhood.
LRT and BRT (Alternative Packages 3 - 5 and 8 - 10) necessitate widening river crossings across the Oregon Slough, displacing up to approximately 5 additional floating homes. LRT and BRT also affect up to about 30 commercial properties; most of these would be partial property acquisitions (not displacing the existing uses). BRT-Lite (Alternative Packages 6 and 11) and Express Bus only (Alternative Packages 7 and 12) impact few or no residential or commercial properties.
Alternative Packages with LRT or BRT meet local plans better than those with BRT-Lite or Express Bus only. Alternative Packages 8 and 9 appear to best meet local plans and uphold principles of multi-modalism because they provide LRT on a new fixed-span crossing that affords more reliable transit service compared to all other alternatives.
Value 2 – Mobility, Reliability, Accessibility
Overall, LRT performs best for value 2.
LRT would have the fewest transit vehicle hours of delay (VHD) during peak periods because of the exclusive guideway that continues south of the BIA. BRT-Lite would be subject to twice as much VHD as LRT. Express Bus in general purpose lanes has up to six times more transit VHD than LRT. Express bus in managed lanes performs better than in general purpose lanes, but still has twice as much VHD as LRT.
Transit mode split during the PM peak period would be 30% to 40% higher for LRT and BRT options compared to the No-Build or TDM/TSM alternatives (the mode split would be 16%, 13% and 11%, respectively). Additionally, LRT can carry at least 1.5 times more people than BRT, express bus, or BRT-Lite alone. Alternatives with both Express Bus and LRT have the highest transit carrying capacity because of the combined service. The no-build has the lowest transit mode split share, and also has a 5% to 10% higher share of single occupancy vehicles compared to the build alternatives.
Value 3 – Modal Choice
Pairing LRT and Express Bus provides the best performance overall for modal choice since this combination provides the highest access to transit markets, an exclusive guideway for transit throughout the BIA and south of the BIA, and the non-stop service of Express Bus. BRT with Express Bus provides similarly strong performance except that BRT would be delayed by I-5 traffic congestion south of the BIA. BRT-lite has relatively good transit access but would have the longest travel times because it diverts through downtown and has no exclusive guideway on I-5.
Value 4 – Safety Transit modes that would operate on a guideway separate from vehicle traffic would help reduce conflicts and congestion on I-5. Therefore, providing LRT or BRT (Alternative Packages 3 - 5 or 8 - 9) would best enhance safety. However, introducing LRT or BRT at-grade crossings with arterial traffic in Vancouver would create potential new safety hazards.

Page 5
Value 5 – Regional Economy, Freight Mobility Transit mode options have little effect on the freight-related measures evaluated to date.
Value 6 – Stewardship of Natural Resources LRT and BRT (Alternative Packages 3 - 5 and 8 - 10) have larger footprints which cause greater direct adverse impacts than transit options with smaller footprints such as BRT-Lite (Alternative Packages 6 and 11), Express Bus only (Alternative Packages 2, 7, and 12), and No-Build (Alternative Package 1).
LRT and BRT, as currently designed, would impact a buffer adjacent to Burnt Bridge Creek, City of Portland E-Zones, and habitat areas. However, these impacts are based on a sample alignment and could likely be reduced through design refinement. An additional consideration is that LRT and BRT are likely to increase transit mode share and better support regional growth management policies, which would lower secondary impacts to natural resources.
Value 7 – Distribution of Benefits and Impacts
LRT and BRT have higher potential to affect residential properties than BRT-Lite or Express Bus because they necessitate wider structures across the Oregon Slough, which may displace up to approximately 5 floating homes. However, residential acquisitions and displacements do not cluster in areas with notable low-income and/or minority populations.
Transit options that provide either LRT or BRT, combined with Express Bus, offer the greatest improvements in transit service to all populations. There is no notable difference in the distribution of benefits.
Value 8, Cost Efficiency and Financial Resources
Per-Mile Transit Capital CostsLRT BRT BRT-Lite Express Bus
Low $60 million $25 million $20 million $10 millionHigh $120 million $110 million $40 million $30 million The table above shows the possible range of cost per-mile of the various transit modes. LRT would run for approximately 4.5 miles, whereas the bus lines would run for 5 miles. Alternative Packages 3 and 8 combine Express Bus service with LRT. With these Alternative Packages, in addition to the capital cost requirements for LRT, express bus service would require costs for the bus vehicles and a bus maintenance facility. This would be less than simply adding the Express Bus capital costs listed in Table 1 to the LRT costs.
Annual Transit Operating Costs
Raw CostsLRT + Express Bus $10,600,000 $0.35LRT $8,700,000 $0.33BRT $13,300,000 $1.92BRT-Lite $17,000,000 $1.37Express Bus $7,000,000 $0.67
Cost per transit seat
Annual operating cost per annual transit seat (a proxy for operations cost-effectiveness) varies substantially across the modes. Express bus alternatives have moderate operating costs per seat due to their AM and PM peak period operation and lower bus capacity. BRT and BRT-Lite have higher operating costs per seat, reflecting a full, all day operation between downtown Portland and Kiggins Bowl. The LRT alternatives have lower operating costs per seat due to the large train capacity and the already operating Yellow Line in Portland.
Value 9 – Growth Management/Land Use Alternative Packages with LRT (3, 4, 8, and 9) best support regional plans and policies. BRT (Alternative Packages 5 and 10) does not satisfy regional plans calling for LRT but would support multi-modalism and compact growth.

Page 6
BRT-Lite (Alternative Packages 6 and 11) is less supportive. Express Bus only options (Alternative Packages 2, 7, and 12) are the least supportive of regional plans and growth management goals.
Value 10 – Constructability LRT and BRT (Alternative Packages 3 - 5 and 8 - 10) would have the greatest amount of construction impacts because they would have the largest footprints.


1
Nov. 29, 2006 To: The Columbia River Crossing Task Force From: Jim Howell, Director Re: CRC Environmental Impact Study An alternative that retains the existing bridges, in addition to the mandatory No Build Alternative, must be studied in the Environmental Impact phase of this project. AORTA has shown how such an alternative can address all of the significant problems associated with the current infrastructure. Our first proposal made almost three years ago in February 2004 is still viable with some modifications. Our simple and practical proposal has been summarily rejected by this project team without even the courtesy of taking the time to understand it, as was evidenced by the inaccurate statements made by the consultant at the last Task Force meeting. Briefly, our proposal would: 1. Build a Multi-modal Bridge with a lift span, immediately downstream from the
existing bridges, that would carry an extended on-ramp from SR-14 and downtown Vancouver separated from two local traffic lanes, bikes and pedestrians by two light rail tracks.
2. Remove five existing dysfunctional ramps in the bridge area and replace them with two long ones on Hayden Island.
3. Build a Portland Harbor Bridge for light rail, local traffic, bikes and pedestrians.
4. Provide a local road connection from the Portland Harbor Bridge to Expo Road, under Marine Drive and through the Expo Center parking lot next to the MAX Station.
5. Provide a new unrestricted truck-only northbound I-5 access lane from Marine Drive and MLK Blvd.


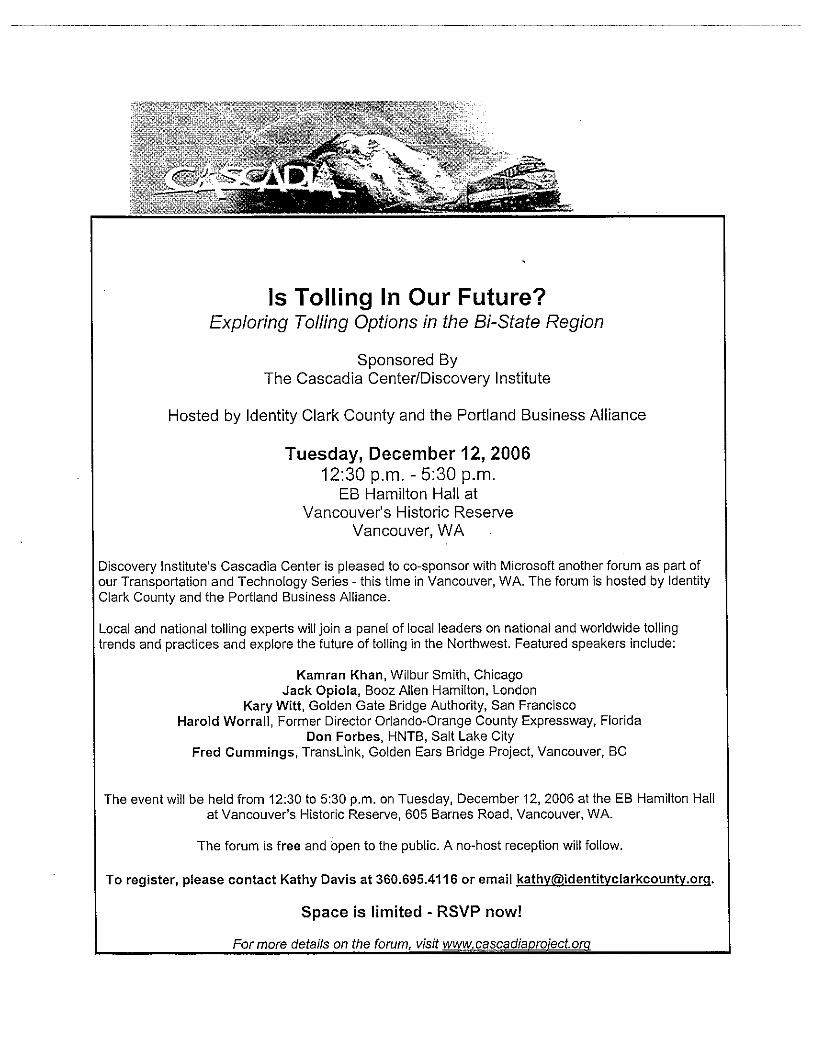
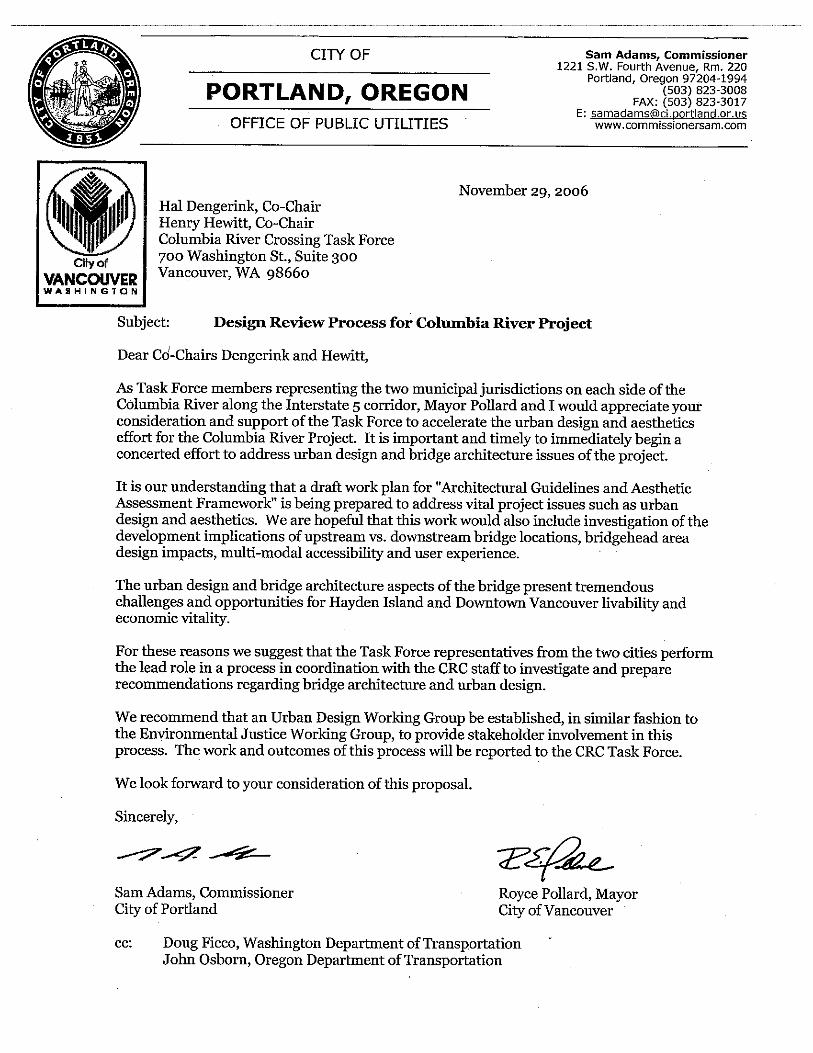

Criterion Performance

Page 1
Criterion Performance
Criterion 1.2 – Avoid, then minimize adverse impacts to, and where practicable enhance, neighborhood cohesion (Part of Value 1 – COMMUNITY LIVABILITY AND HUMAN RESOURCES)
Performance Measure(s) • Number of neighborhoods bisected by new construction • Number of significantly impacted neighborhoods (>10% of total area required for new construction) • Number of neighborhoods divided from their identified resources by new construction
Best Performing Package(s) and/or Component(s) The alternatives with the least physical improvements score the highest on these measures because they would have the least adverse impact to existing neighborhoods. As such, No-Build alternatives (Alternative Packages 1 and 2) rate the highest. However, these packages can do little to enhance access or livability, and do not support the community’s future vision as expressed in local plans. Of the Build alternatives, only Alternative Package 3 completely avoids displacing the only grocery store on Hayden Island. Alternatives with LRT or BRT require more commercial acquisitions than alternatives using BRT-Lite or Express Bus only. Residential acquisitions or relocations range from 5 to 15 floating homes, and vary largely based on interchange configurations at Marine Drive, on Hayden Island, and at SR 500.
Key Findings River Crossing
No neighborhoods will be bisected by new construction and no neighborhoods will lose more than 10% of their total area for construction. Therefore, the only remaining metric is whether a neighborhood is divided from its resources. Upstream replacement bridges require complete acquisition of Safeway, the only grocery store on Hayden Island and a significant resource for the neighborhood. A downstream replacement bridge and supplemental interstate bridge may require partial or full acquisition of Safeway as well due to interchange improvements. Only a supplemental arterial bridge (Alternative Package 3) would completely avoid direct impact to Safeway. Safeway could likely be relocated on Hayden Island.
Transit None of the transit options would bisect neighborhoods or affect more than 10% of any neighborhood. Alternative Packages 3 - 5 and 8 - 10 add high capacity transit to downtown Vancouver and Hayden Island, improving residents’ access to resources in these areas.
Roadways North and Roadways South
The interchanges at Marine Drive and on Hayden Island can affect the number of floating homes displaced by the alternatives. A more complex interchange at Marine Drive widens the bridge over the Oregon Slough, impacting additional floating homes. Removing an I-5 interchange on Hayden Island necessitates an arterial crossing over the Oregon Slough which would displace additional floating homes. None of the Roadways North options would bisect neighborhoods or affect more than 10% of any neighborhood. Some interchange designs at SR 500 cause additional residential acquisitions.
Other (Bike/Ped, Freight, TSM/TDM, Tolling)
All build alternatives provide improved bicycle and pedestrian access and connectivity within the BIA.

Page 2
Criterion Performance Criterion 1.4 – Avoid or minimize residential displacements (Part of Value 1 – COMMUNITY LIVABILITY AND HUMAN RESOURCES)
Performance Measure(s) • How many residential units fall within the design area footprint?
Best Performing Package(s) and/or Component(s)
Note: Identifying necessary property acquisitions and displacements requires substantial design refinement and property analysis that are not included in the alternatives screening phase. For screening purposes, property acquisition estimates are generalized in accordance with the conceptual nature of the current level of design. Alternative Packages 1 and 2 would avoid residential property acquisitions. Based on conceptual designs of Build alternatives, all Build alternatives have fewer than 30 residential acquisitions. Differences occur primarily due to HCT and interchange designs. LRT and BRT require wider bridge crossings over the Oregon Slough and displace more floating homes. A more complex interchange at Marine Drive widens the bridge over the Oregon Slough, impacting additional floating homes. Removing an I-5 interchange on Hayden Island necessitates an arterial crossing over the Oregon Slough, which would displace additional floating homes.
Key Findings River Crossing
Property acquisitions in the river crossing area (from SR 14 to Marine Drive) are a function of several factors, only one of which is the river crossing option itself. Interchange designs on Hayden Island and at Marine Drive are a major factor. River crossings displace between 5 and 15 floating homes on Hayden Island depending upon interchange designs at Marine Drive and Hayden Island, and on whether the river crossing must accommodate LRT or BRT. Transit
LRT and BRT have higher potential to affect more floating homes than BRT-Lite or Express Bus because they require dedicated ROW. LRT and BRT necessitate widening river crossings across the Oregon Slough, which requires displacement of approximately 5 additional floating homes for most bridge options. Roadways North and Roadways South
The interchanges at Marine Drive and on Hayden Island can affect the number of floating homes displaced. A more complex interchange at Marine Drive widens the bridge over the Oregon Slough, impacting additional floating homes. Removing an I-5 interchange on Hayden Island necessitates an arterial crossing over the Oregon Slough, which would displace additional floating homes. Roadways North options would have all likely residential acquisitions. Interchange configurations at SR 500 are the primary contributor to the range of residential acquisitions.
Other (Bike/Ped, Freight, TSM/TDM, Tolling)
Not Applicable.

Page 3
Criterion Performance Criterion 1.5 – Avoid or minimize business displacements (Part of Value 1 – COMMUNITY LIVABILITY AND HUMAN RESOURCES)
Performance Measure(s) • How many commercial or industrial properties fall within the design area footprint?
Best Performing Package(s) and/or Component(s)
Note: Identifying necessary property acquisitions and displacements requires substantial design refinement and property analysis that are not included in the alternatives screening phase. For screening purposes, property acquisition estimates are generalized in accordance with the conceptual nature of the current level of design.
The approximate number of commercial properties that would be affected (from sliver impacts to full acquisitions) ranges from about 30 to 90 for the Build alternatives. BRT-Lite (Alternative Packages 6 and 11) or Express Bus only (Alternative Packages 7 and 12) require fewer commercial acquisitions than those with LRT or BRT (Alternative Packages 3 - 5 and 8 -10).
No-Build alternatives (Alternative Packages 1 and 2) would affect no commercial properties.
Key Findings River Crossing
The property acquisitions in the river crossing area (from SR 14 to Marine Drive) are a function of several factors, only one of which is the river crossing option itself. Interchange designs are a major factor, including SR 14, Hayden Island, and Marine Drive interchanges. All river crossing alternatives require partial or full acquisition of approximately 30 commercial parcels. Replacement alternatives (Alternative Packages 8-12), with only one bridge and a smaller interchange footprint, impact less commercial land than Supplemental alternatives.
Transit
LRT and BRT affect approximately 10 to 30 commercial properties. These would mostly be partial acquisitions and would primarily occur in the Hayden Island, Washington Street and McLoughlin Boulevard areas. BRT-Lite (Alternatives 6 and 11) and Express Bus only (Alternatives 7 and 12) impact few or no commercial properties. Roadways North and Roadways South
Interchange configurations at SR 500 are the primary contributor to the range of residential acquisitions. Potential commercial property acquisitions from Roadways South options are minimal (ranging from 0 to 14) largely depending upon the interchange configuration on Hayden Island. Commercial acquisitions from Roadways North are range from 5 to 15, largely depending upon the impact of different interchanges at SR 14 on downtown Vancouver.
Other (Bike/Ped, Freight, TSM/TDM, Tolling)
Not Applicable

Page 4
Criterion Performance Criterion 1.6 – Avoid or minimize adverse impacts to, or where practicable preserve, historic and prehistoric cultural resources (Part of Value 1 – COMMUNITY LIVABILITY AND HUMAN RESOURCES)
Performance Measure(s) • How many acres of land are located in high probability areas for archaeological resources? • How many of these properties are also within the potential noise impact footprint? • What is the total acreage of these properties? • How many historic, archaeological, and cultural properties fall within the design area footprint in the following
categories: National Register listed, Potentially Eligible, National Historic Site? Best Performing Package(s) and/or Component(s)
Alternative Package 3 would likely have the least adverse effects on historic and archaeological resources of the Build alternatives because it has the smallest overall footprint. Alternative Packages 8 through 12 would likely have the greatest adverse effects on historic resources because they would replace the historic northbound bridge with a new crossing rather than reuse the existing bridges. None of the river crossing options would directly affect a known archaeological site. However, the area where the river crossing options are located has the potential to contain archaeological resources. At this time, there is little evidence to distinguish one option from another. Alternative Packages 4 and 7 would likely have the greatest adverse effects on the Vancouver National Historic Site/National Historic Reserve (NHS/NHR). This is due to the easternmost SR 14 WB to I-5 NB ramp’s location east of the cloverleaf ramps. Generally, packages that disturb the least amount of undisturbed native soil within the high probability areas for prehistoric sites would have the lowest potential adverse effects on archaeological resources.
Key Findings River Crossing
Above Ground Built Historic Resources: Supplemental bridge options (Alternative Packages 3 - 7) would retain the historic bridges. However, preliminary results from a Seismic Panel convened in August 2006 indicate that major seismic upgrades would likely be required for the bridges to avoid collapse in a major earthquake. These retrofits would likely have an adverse effect on the historic character of the bridges. All of the Alternative Packages may affect the Columbia River levees; this may be reduced to “no adverse effect” and no “use” with appropriate design. Only a supplemental arterial bridge would avoid encroaching upon the historic Apple Tree Park. Downstream replacement bridges cut through or over the parcel more significantly than the others. Archaeological Resources: None of the river crossing options would directly affect a known archaeological site. However, the area that the river crossing options are located has the potential to contain archaeological resources. At this time, there is little evidence to distinguish one option from another.
Transit Above Ground Built Historic Resources:
The representative BRT and LRT alignment uses Washington and McLoughlin, traveling through Vancouver’s locally-designated downtown historic district. Conceptual designs do not appear to have a direct effect on any significant historic resources, but they would affect the visual character. Whether such an effect would be adverse or beneficial will depend on whether it is designed with regard to the character of the district. LRT alternatives may have a lower likelihood to pose an adverse effect than BRT. Both LRT and BRT options involving direct downtown access may result in beneficial effects from improved accessibility to the district, which would enhance the viability of the historic downtown area.
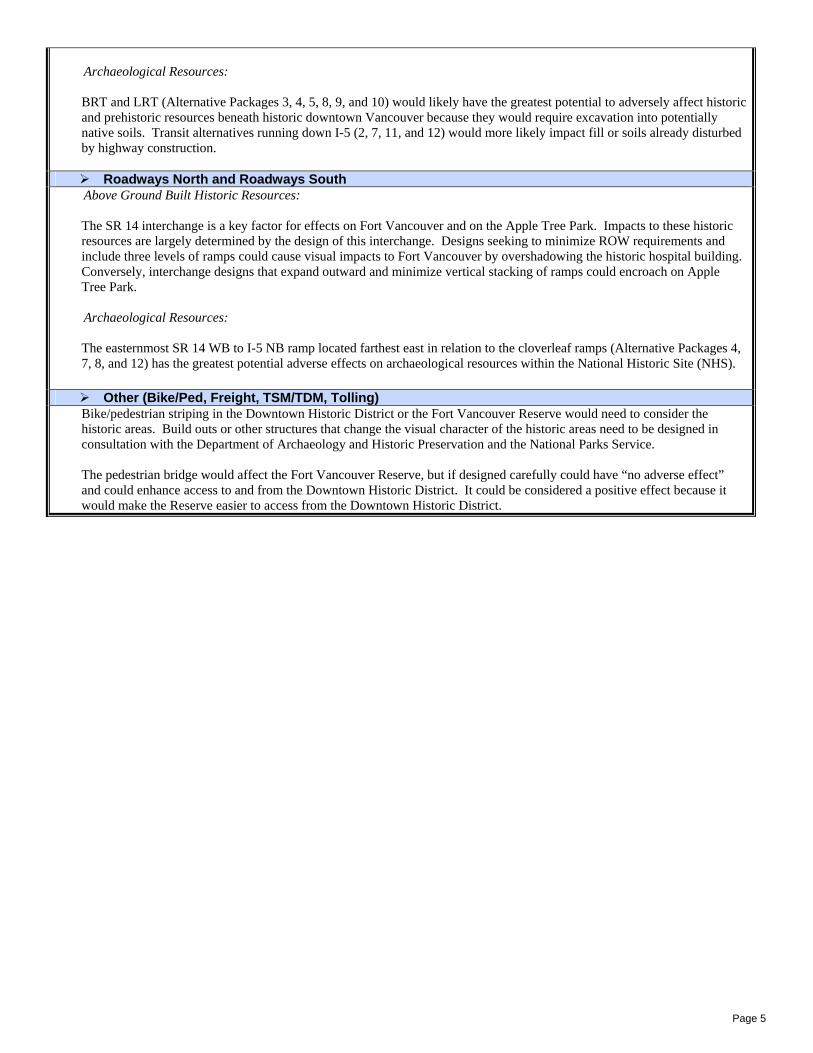
Page 5
Archaeological Resources: BRT and LRT (Alternative Packages 3, 4, 5, 8, 9, and 10) would likely have the greatest potential to adversely affect historic and prehistoric resources beneath historic downtown Vancouver because they would require excavation into potentially native soils. Transit alternatives running down I-5 (2, 7, 11, and 12) would more likely impact fill or soils already disturbed by highway construction.
Roadways North and Roadways South
Above Ground Built Historic Resources: The SR 14 interchange is a key factor for effects on Fort Vancouver and on the Apple Tree Park. Impacts to these historic resources are largely determined by the design of this interchange. Designs seeking to minimize ROW requirements and include three levels of ramps could cause visual impacts to Fort Vancouver by overshadowing the historic hospital building. Conversely, interchange designs that expand outward and minimize vertical stacking of ramps could encroach on Apple Tree Park.
Archaeological Resources: The easternmost SR 14 WB to I-5 NB ramp located farthest east in relation to the cloverleaf ramps (Alternative Packages 4, 7, 8, and 12) has the greatest potential adverse effects on archaeological resources within the National Historic Site (NHS).
Other (Bike/Ped, Freight, TSM/TDM, Tolling) Bike/pedestrian striping in the Downtown Historic District or the Fort Vancouver Reserve would need to consider the historic areas. Build outs or other structures that change the visual character of the historic areas need to be designed in consultation with the Department of Archaeology and Historic Preservation and the National Parks Service. The pedestrian bridge would affect the Fort Vancouver Reserve, but if designed carefully could have “no adverse effect” and could enhance access to and from the Downtown Historic District. It could be considered a positive effect because it would make the Reserve easier to access from the Downtown Historic District.

Page 6
Criterion Performance Criterion 1.7 Magnitude and significance of public park and recreation resources crossed by component’s conceptual footprint (Part of Value 1 – COMMUNITY LIVABILITY AND HUMAN RESOURCES)
Performance Measure(s) • Number and area of 4(f) public parks that fall within the design area footprint.
Best Performing Package(s) and/or Component(s) Of the Build alternatives, Alternative Package 3 would have the lowest direct or secondary impacts on recreational or park resources. Alternative Packages 4 and 8 would likely have the greatest impacts as they would affect both the NHS the greatest and Clark College Park. The greatest NHS open space impact is the result of SR 14 interchange options that require additional ROW to the east of the existing interchange; City College Park is impacted by Roadways North options and LRT; East Delta Park impact is associated with Marine Drive interchange choices and LRT; Leverich Park impacts are due to SR 500 and BRT/LRT improvements. Considerations: Any potential “use” of the NHS/NHR would likely affect the whole resource. This includes land within the Roadways North project segments. Sliver acquisition(s) may be allowable as a de minimis impact. This would need to be confirmed with officials that have jurisdiction over the affected resource.
Key Findings River Crossing
All new river crossings (Alternative Packages 3 - 12) may temporarily or permanently affect recreational trails underlying the existing and/or new bridges. “Use” would need to be determined based on the location of features such as intermediate bent columns and fill, as well as the extent of potential removal of the existing bridges and transfer of ownership. In this phase of conceptual design, there is no significant difference among the river crossing options.
Considerations: Visual impacts could also be associated with this project. They could affect the historic setting and the recreational value associated with the NHS/NHR cultural landscapes. While visual impacts don’t frequently trigger a “constructive use,” they should be considered, given the importance of the historic cultural landscape.
Transit LRT and BRT impact Clark College Park slightly as they realign from McLoughlin Boulevard to I-5. This alignment also would affect Leverich Park and Delta Park. The alignment is preliminary and it may be possible to refine the design to avoid any impact. Furthermore, this alignment provides improved access as it brings HCT to this park (and McLoughlin Park that is immediately to the south) with a major transit station by Clark College. All transit modes require a sliver of the easternmost portions of Kiggins Bowl because they necessitate a wider I-5 ROW than existing conditions. BRT-Lite requires the most substantial acquisition of Kiggins Bowl.
Roadways North and Roadways South
Roadways North: Improvements to the SR 14 interchange that extend east of the existing interchange can impact the Fort Vancouver Historic Reserve. Interchange designs for all Build alternatives except Alternative Package 3 require sliver acquisitions of properties within the NHS. These properties are now under US Army ownership, but will likely be transferred to other ownership, and remain within the NHS. They may become recreational properties in the future. Improvements to the interchange at SR 14 could also impact the historic apple tree. All Build alternatives except Package 3 would require acquisition of part of the parcel with the apple tree. These takes are not likely to directly impact the tree, but could cause substantial indirect effects (encroachment, noise, shading, etc.).
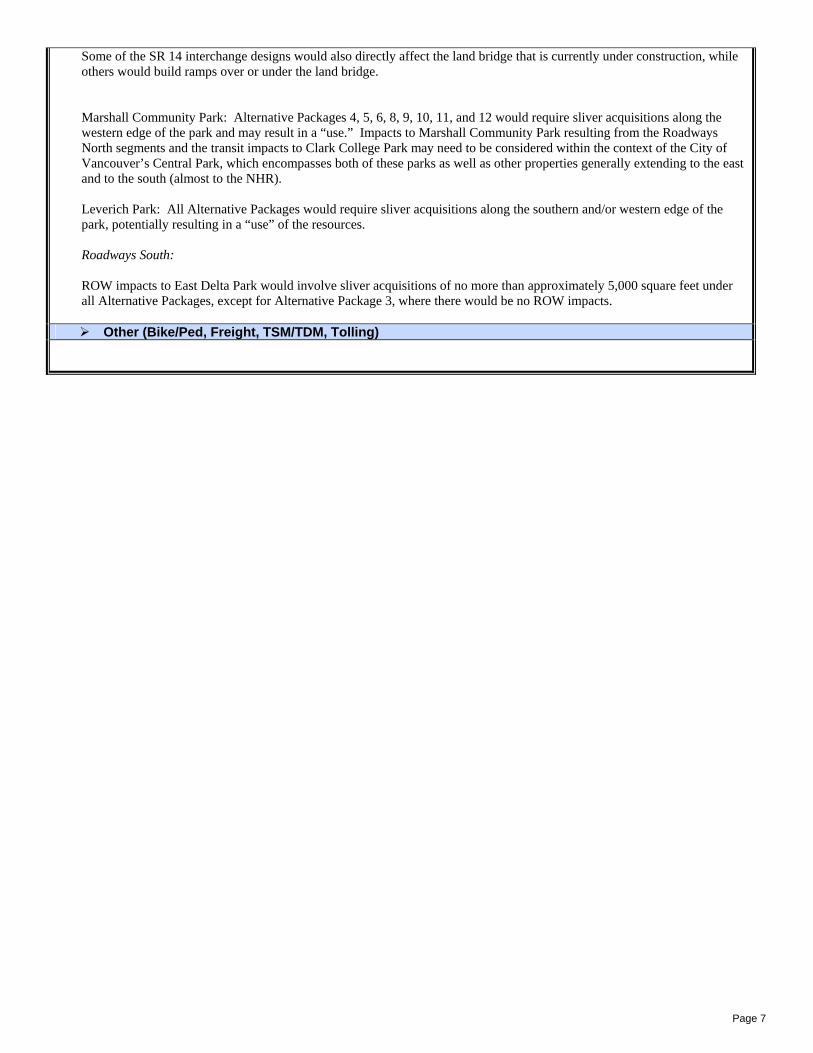
Page 7
Some of the SR 14 interchange designs would also directly affect the land bridge that is currently under construction, while others would build ramps over or under the land bridge.
Marshall Community Park: Alternative Packages 4, 5, 6, 8, 9, 10, 11, and 12 would require sliver acquisitions along the western edge of the park and may result in a “use.” Impacts to Marshall Community Park resulting from the Roadways North segments and the transit impacts to Clark College Park may need to be considered within the context of the City of Vancouver’s Central Park, which encompasses both of these parks as well as other properties generally extending to the east and to the south (almost to the NHR).
Leverich Park: All Alternative Packages would require sliver acquisitions along the southern and/or western edge of the park, potentially resulting in a “use” of the resources.
Roadways South: ROW impacts to East Delta Park would involve sliver acquisitions of no more than approximately 5,000 square feet under all Alternative Packages, except for Alternative Package 3, where there would be no ROW impacts.
Other (Bike/Ped, Freight, TSM/TDM, Tolling)

Page 8
Criterion Performance Criterion 1.8 – Support local comprehensive plans and jurisdiction-approved neighborhood plans including development and redevelopment opportunities, consistent with these plans. (Part of Value 1 – COMMUNITY LIVABILITY AND HUMAN RESOURCES)
Performance Measure(s) • Does the project support/uphold principles of multi-modalism? • Is it in project lists of comprehensive plans? • Are alternatives consistent with the project-specific policies in the Vancouver City Center Vision? • How much developable land will be lost?
Best Performing Package(s) and/or Component(s) While both BRT and LRT are included in local plans, LRT service (included in Alternative Packages 3, 4, 8, and 9) best supports most local plans.
It is difficult to rank the components in terms of land use and impacts to downtown Vancouver, but a dedicated arterial crossing, as provided by supplemental bridge alternatives, would cause significant traffic intrusion through downtown Vancouver.
Of the Build alternatives, Alternative Packages 8 and 9 appear to best meet local plans because they uphold principles of multi-modalism (they have LRT) and will not require as much developable land (because they include a replacement bridge). At this point in the analysis, the direct access to Vancouver and ability to support redevelopment opportunities, as called for in the Vancouver City Center Vision, are unknown.
Alternative Packages 1 and 2 are the worst performers, as they fail to follow the recommendations of the Bi-State Trade and Transportation Study and do not provide BRT or LRT service.
Key Findings
River Crossing An evaluation of compliance with multi-modal policies and planned project lists does not help to discern between river crossing options. Supplemental downstream and arterial bridges provide arterial and Interstate access. A supplemental arterial would cause significant traffic intrusion through downtown Vancouver.
River Crossing components have different land use and ROW impacts. Supplemental bridge options and a downstream replacement bridge would displace portions of the Inn at the Quay. Replacement bridges with LRT will also directly impact the FHWA and Army buildings, and possibly the West Coast Bank building. A supplemental arterial bridge would impact two commercial blocks in the southern portion of downtown Vancouver east of Columbia Street.
A replacement bridge provides much better service for LRT or BRT. LRT, and to a lesser extent BRT, support local plan policies encouraging multi-modalism. Replacement bridges also require less land on Hayden Island, particularly compared to Supplemental Interstate bridges that include an interchange on the island, better supporting local goals of redevelopment.
Transit Express buses in general purpose or managed lanes fail to provide HCT, as explicitly called for in local plans. LRT is most consistent with regional plan policies and was called for in recommendations by the Bi-State Trade and Transportation Study that is referenced in numerous plans. Alternative Packages 3, 8, and 9 provide the most reliable LRT service by placing transit on a new fixed span bridge that would eliminate delays in the transit system resulting from bridge lifts.
Roadways North and Roadways South
Design options for Roadways North and Roadways South do not have significant differences.
Other (Bike/Ped, Freight, TSM/TDM, Tolling)

Evaluation of Component Packages – FORM A Page 1
Criterion Performance Criterion 2.1 – Reduce travel times and delay in the I-5 corridor and within the Bridge Influence Area for passenger vehicles (Part of Value 2 – MOBILITY, RELIABILITY, ACCESSIBILITY, CONGESTION REDUCTION, AND EFFICIENCY)
Performance Measure(s) [list the metrics used to assess the degree to which the established criteria are satisfied.]
• Travel times between select points along I-5 in Oregon and Washington • Determined based on travel demand and traffic operations analysis
Best Performing Package(s) and/or Component(s) [Summarize your findings regarding the components and combination of components that perform best on this criterion.]
• The Supplemental Interstate and Replacement Bridge alternatives result in the shortest travel times
Key Findings River Crossing
• The TDM/TSM and New Arterial alternatives provide similar travel times along I-5 as the No-Build alternative
• The Supplemental Interstate and Replacement Bridge alternatives reduce northbound I-5 travel times compared to the TDM/TSM and New Arterial alternatives by about 50% or more (e.g., I-84 to 179th Street travel time decreases by 22 to 26 minutes)
• The Supplemental Interstate and Replacement Bridge alternatives result in similar to slightly higher southbound I-5 travel times during the AM peak period compared to the TDM/TSM and New Arterial alternatives due to constraints on I-5 south of the Bridge Influence Area
• Note: The Supplemental Interstate and Replacement Bridge alternatives accommodate 15% to 25% higher southbound AM peak period traffic volumes and about 35% to 55% higher northbound PM peak period traffic volumes than the TDM/TSM and New Arterial alternatives (see Criterion 2.6)
• Note: The Supplemental Interstate and Replacement Bridge alternatives reduce the duration of congestion by about 55% to 60% compared to the TDM/TSM and New Arterial alternatives (see Criterion 2.3)

Evaluation of Component Packages – FORM A Page 2
Northbound I-5 Travel Times (Year 2030*)
1214 14 13
9 9 9
50 4946
30 30 30
38
0
10
20
30
40
50
60
Existing(2005)
No-Build TDM/TSM New Arterial SupplementalInterstate w/
Hayden Island IC
SupplementalInterstate w/o
Hayden Island IC
ReplacementBridge
2-H
our P
M P
eak
Ave
rage
Tra
vel T
ime
(min
)
Columbia Boulevard to SR-500 I-84 to 179th Street
*Except for Existing Conditions (Year 2005)
Southbound I-5 Travel Times (Year 2030*)
1619 19 18
49
19+19+19+
44434446
31
48
0
10
20
30
40
50
60
Existing(2005)
No-Build TDM/TSM New Arterial SupplementalInterstate w/
Hayden Island IC
SupplementalInterstate w/o
Hayden Island IC
Replacement Bridge
2-H
our A
M P
eak
Ave
rage
Tra
vel T
ime
(min
)
SR-500 to Columbia Boulevard 179th Street to I-84
*Except for Existing Conditions (Year 2005)

Evaluation of Component Packages – FORM A Page 3
Transit
Roadways North and Roadways South
Other (Bike/Ped, Freight, TSM/TDM, Tolling)

Evaluation of Component Packages – FORM A Page 4
Criterion Performance Criterion 2.2 – Reduce travel times and delay in the I-5 corridor and within the Bridge Influence Area for transit modes (Part of Value 2 – MOBILITY, RELIABILITY, ACCESSIBILITY, CONGESTION REDUCTION, AND EFFICIENCY)
Performance Measure(s) • Peak period transit vehicle hours of delay (VHD) within the bridge influence area and the I-5 corridor (from Salmon
Creek to downtown Portland).
Best Performing Package(s) and/or Component(s) • Alternative Packages 4 and 9, with LRT as the high capacity transit mode, would have the fewest transit vehicle
hours of delay within the bridge influence area and the I-5 corridor. Alternative Package 9 is the best because it uses a replacement bridge and thus avoids delays from the bridge lifts.
Key Findings River Crossing
Placing LRT or BRT on the existing bridges (Alternative Packages 4, 5, and 6) introduces delay from the bridge lifts. Currently, a bridge lift causes at least 17 minutes of delay to transit vehicles trying to cross the river during the lift period. This delay would have substantial impacts to LRT because it would cause system-wide schedule disruptions. Therefore, replacement bridges provide less transit VHD than supplemental bridges.
Transit
Transit VHD
0
5
10
15
20
25
2030 No Build Buses in I -5 GP Lanes Buses in I-5 ManagedLanes
BRT Lite BRT LRT
AM/P
M P
eak
Peri
od H
ours
of D
elay
I-5 Corridor BIA
The above graphic illustrates VHD for the entire transit network (HCT, express buses, and local buses) within the bridge

Evaluation of Component Packages – FORM A Page 5
influence area and the I-5 corridor. For a discussion of transit travel times see criterion 3.2. With Alternative Package 1, 2030 No Build, in the PM peak direction there would be 26 transit vehicles per hour traveling over the Columbia River on I-5. The transit VHD for both the four hour AM and PM peak period would be 14.8 hours within the bridge influence area and 21.4 hours within the I-5 corridor. All build alternatives would substantially reduce transit VHD. Of the build alternatives, express buses (Alternative Packages 7 and 12) would have the most transit vehicles operating on I-5 (38 vehicles per hour in the PM peak period) and would have the highest transit VHD in the peak periods. Express buses operating in general purpose lanes on I-5 (Alternative Package 12) would have the greatest transit VHD with 2.8 hours in the bridge influence area and 13 hours in the I-5 corridor for the combined AM and PM peak periods. With Alternative Package 7, where express buses operate in managed lanes, the combined peak period transit VHD would be reduced to 1.2 hours within the bridge influence area and 9.3 hours for the I-5 corridor.
Of the HCT modes, BRT-Lite (Alternative Packages 6 and 11) would have the highest peak period VHD within the bridge influence area at 0.9 hours. This is likely because BRT-Lite operates in general purpose lanes with mixed traffic within portions of the bridge influence area. BRT (Alternative Packages 5 and 10) and LRT (Alternative Packages 4 and 9) would have a similar peak period VHD (0.5 hours and 0.4 hours respectively). BRT buses or the LRT trains would operate in a separate guideway in the bridge influence area.
Combining a HCT mode with express buses increases transit VHD because more vehicles would be operating on I-5 in either general purpose or managed lanes. Alternative Package 8, which has a combination of LRT and express buses has 23 buses per hour on I-5 and 12 LRT trains on a separate track for a total of 35 transit vehicles per hour. Alternative Package 8 would result in a slight increase in the peak period VHD in the I-5 corridor over alternatives that include an HCT mode only; 0.6 hours transit VHD within the bridge influence area and 6.3 hours within the I-5 corridor. Despite this slight increase, combining a HCT mode with express buses represents a reduction in I-5 corridor VHD over Alternatives 7 and 12 which focus on express bus service only.
Roadways North and Roadways South
Other (Bike/Ped, Freight, TSM/TDM, Tolling)

Evaluation of Component Packages – FORM A Page 6
Criterion Performance Criterion 2.3 – Reduce the number of hours of daily highway congestion in the I-5 corridor and within the Bridge Influence Area (Part of Value 2 – MOBILITY, RELIABILITY, ACCESSIBILITY, CONGESTION REDUCTION, AND EFFICIENCY)
Performance Measure(s) [list the metrics used to assess the degree to which the established criteria are satisfied.]
• Total number of hours when travel speeds in each direction on the I-5 Bridge average 30 mph or less • Determined based on travel demand and traffic operations analysis
Best Performing Package(s) and/or Component(s) [Summarize your findings regarding the components and combination of components that perform best on this criterion.]
• The Supplemental Interstate and Replacement Bridge alternatives provide the fewest hours of daily highway congestion on the I-5 Bridge
Key Findings
River Crossing • The TDM/TSM alternative results in a similar duration of congestion at the I-5 Bridge as the No Build alternative
• The New Arterial alternative reduces the duration of daily congestion by about 5% compared to the TSM/TDM alternative
• The Supplemental Interstate and Replacement Bridge alternatives reduce the duration of daily congestion by about 55% to 60% compared to the No Build, TDM/TSM, and the New Arterial alternatives
• Note: The Supplemental Interstate and Replacement Bridge alternatives accommodate 15% to 25% higher southbound AM peak period traffic volumes and about 35% to 55% higher northbound PM peak period traffic volumes than the TDM/TSM and New arterial alternatives (see Criterion 2.6)
Northbound I-5 Daily Highway Congestion at I-5 Bridge (Year 2030*)
1.25
7.75
7.25
1.5
1.5
0-2
0-2
0-2
7.50
4
5:00 AM 6:00 AM 7:00 AM 8:00 AM 9:00 AM 10:00 AM 11:00 AM 12:00 PM 1:00 PM 2:00 PM 3:00 PM 4:00 PM 5:00 PM 6:00 PM 7:00 PM 8:00 PM 9:00 PM
Existing
No-Build
TDM/TSM
New Arterial
Supplemental Interstate w/ Hayden Island IC
Supplemental Interstate w/o Hayden Island IC
Replacement Bridge
Congested Hours (Travel Speed < 30 mph)
*Except for Existing Conditions (Year 2005)

Evaluation of Component Packages – FORM A Page 7
Southbound I-5 Daily Highway Congestion at the I-5 Bridge (Year 2030*)
6.25
4.75
0.75
0.75
0.75
2
6
5.5
4.5
4.5
5:00 AM 6:00 AM 7:00 AM 8:00 AM 9:00 AM 10:00 AM 11:00 AM 12:00 PM 1:00 PM 2:00 PM 3:00 PM 4:00 PM 5:00 PM 6:00 PM 7:00 PM 8:00 PM 9:00 PM
Existing
No-Build
TDM/TSM
New Arterial
Supplemental Interstate w/ Hayden Island IC
Supplemental Interstate w/o Hayden Island IC
Replacement Bridge
Congested Hours (Travel Speed < 30 mph)
*Except for Existing Conditions (Year 2005)
Transit
Roadways North and Roadways South
Other (Bike/Ped, Freight, TSM/TDM, Tolling)

Evaluation of Component Packages – FORM A Page 8
Criterion Performance Criterion 2.5 – Improve person throughput of I-5 Columbia River crossing (Part of Value 2 – MOBILITY, RELIABILITY, ACCESSIBILITY, CONGESTION REDUCTION, AND EFFICIENCY)
Performance Measure(s) • Persons served in vehicles across the I-5 Bridge in the peak directions and during the morning and afternoon peak
periods • Peak period mode split between SOV, HOV and transit for I-5.
Best Performing Package(s) and/or Component(s) • The Supplemental Interstate and Replacement Bridge alternatives proved the highest person (in vehicles) throughput • Alternative Packages 8 with a combined transit service of LRT and express buses would have the greatest annual
transit capacity over the Columbia River on I-5 and would have the highest transit percentage of the PM peak period peak direction mode split at 16%.
• Alternative Packages 4 and 9, with LRT alone, would have the next highest annual transit capacity and the next highest transit PM peak period peak direction mode split at 15%.
Key Findings River Crossing
• The TDM/TSM and New Arterial alternatives provide similar peak period person (in vehicles) throughput across the
I-5 Bridge as the No Build alternative
• The Supplemental Interstate alternatives accommodate about 15% to 20% higher southbound AM peak period person throughput and about 35% to 45% higher northbound PM peak period person throughput than the TDM/TSM and New Arterial alternatives
• The Replacement Bridge alternatives accommodate about 20% to 25% higher southbound AM peak period person throughput and about 50% to 55% higher northbound PM peak period person throughput than the TDM/TSM and New Arterial alternatives
• Note: The TDM/TSM and New Arterial alternatives do not accommodate I-5 Bridge travel demands, resulting in substantial congestion and increased travel times (see Criteria 2.1 and 2.3)

Evaluation of Component Packages – FORM A Page 9
Person Throughput (in Vehicles) on I-5 Bridge (Year 2030*)
24,60025,90026,300
32,20029,800
31,200
22,90025,700
38,50036,600
25,300 25,000 25,300
33,700
0
5,000
10,000
15,000
20,000
25,000
30,000
35,000
40,000
45,000
Existing(2005)
No-Build TDM/TSM New Arterial SupplementalInterstate w/
Hayden Island IC
SupplementalInterstate w/o
Hayden Island IC
Replacement Bridge
Peak
4-H
our P
erso
n Th
roug
hput
Southbound AM Northbound PM
*Except for Existing Conditions (Year 2005)
Transit With the 2030 No Build, Alternative Package 1, the PM peak period and peak direction mode split is 11% for transit, 61% for SOV and 28% for HOV. Table 1 lists the forecasted 2030 mode split in the PM peak period, peak direction. Providing both LRT and express bus service would generate the highest transit percentage of the PM peak period, peak direction mode split. This combined transit service, (represented by Alternative 8), would have a mode split of 16% for transit, 55% for SOV and 29% for HOV. LRT alone (Alternative Packages 4 and 9) would have the next highest PM peak period mode split for transit at 15% (56% for SOV and 29% for HOV). BRT, with Alternative Packages 5 and 10, would have a transit mode split of 14% for the PM peak period peak direction. BRT-Lite and express bus service (Alternative Packages 6, 7, 11 and 12) would have the same PM peak period mode split over the Columbia River at 13% for transit, 58% for SOV and 29% for HOV. Table 1
Transit Mode: 2030 Forecasted Transit Mode Split
Express Bus 13%
BRT-Lite 13%
BRT 14%
LRT 15%
LRT & Express Bus 16% Roadways North and Roadways South
Other (Bike/Ped, Freight, TSM/TDM, Tolling)
Criterion Performance

Evaluation of Component Packages – FORM A Page 10
Criterion 2.6 – Improve vehicle throughput of I-5 Columbia River crossing (Part of Value 2 – MOBILITY, RELIABILITY, ACCESSIBILITY, CONGESTION REDUCTION, AND EFFICIENCY)
Performance Measure(s) [list the metrics used to assess the degree to which the established criteria are satisfied.]
• Traffic volumes served across the I-5 Bridge in the peak directions and during the morning and afternoon peak periods
• Determined based on travel demand and traffic operations analysis Best Performing Package(s) and/or Component(s) [Summarize your findings regarding the components and combination of components that perform best on this criterion.]
• The Supplemental Interstate and Replacement Bridge alternatives provide the highest traffic volume throughput
Key Findings River Crossing
• The TDM/TSM and New Arterial alternatives provide similar peak period throughput across the I-5 Bridge as the No
Build alternative
• The Supplemental Interstate alternatives accommodate about 15% to 20% higher southbound AM peak period traffic volumes and about 35% to 45% higher northbound PM peak period traffic volumes than the TDM/TSM and New Arterial alternatives
• The Replacement Bridge alternatives accommodate about 20% to 25% higher southbound AM peak period traffic volumes and about 50% to 55% higher northbound PM peak period traffic volumes than the TDM/TSM and New Arterial alternatives
• Note: The TDM/TSM and New Arterial alternatives do not accommodate I-5 Bridge travel demands, resulting in substantial congestion and increased travel times (see Criteria 2.1 and 2.3)
Vehicle Throughput on I-5 Bridge (Year 2030*)
21,60021,900 21,40019,100
26,00024,800
26,800
32,10030,500
20,500
28,100
21,10020,80021,100
0
5,000
10,000
15,000
20,000
25,000
30,000
35,000
Existing(2005)
No-Build TDM/TSM New Arterial SupplementalInterstate w/
Hayden Island IC
SupplementalInterstate w/o
Hayden Island IC
Replacement Bridge
Peak
4-H
our V
ehic
le T
hrou
ghpu
t
Southbound AM Northbound PM
*Except for Existing Conditions (Year 2005)
Transit

Evaluation of Component Packages – FORM A Page 11
Roadways North and Roadways South
Other (Bike/Ped, Freight, TSM/TDM, Tolling)

Evaluation of Component Packages – FORM A Page 12
Criterion Performance Criterion 3.1 – Provide for multi-modal transportation choices in the I-5 corridor and within the Bridge Influence Area (Part of Value 3 – MODAL CHOICE)
Performance Measure(s) [list the metrics used to assess the degree to which the established criteria are satisfied.]
• Percent of population and employment with access to transit within ¼ mile of bus lines (Local and Express Bus) and within ½ mile of High Capacity Transit (HCT) stations and park and rides.
Best Performing Package(s) and/or Component(s) [Summarize your findings regarding the components and combination of components that perform best on this criterion.]
• The best performing packages include both an HCT mode and Express Bus. • The No Build and the TSM/TDM Alternative Packages (1 and 2) would provide the least amount of access to transit
because there would be no new transit facilities within the BIA. Furthermore, by 2030 the proximity of population and employment to the bus network is diminished due to the unchanging nature of bus routes and forecasted changes in regional population growth.
Key Findings
River Crossing
While river crossings do not directly affect modal choice, they can influence the quality of transit service. Replacement bridge alternatives (Packages 8-12) place transit on a new fixed-span crossing. This allows transit to avoid bridge lifts, thus improving travel time and reliability. Thus replacement bridges indirectly enhance multi-modal transportation choices.
Transit For this measure, the two areas that are closely analyzed are Clark County and the Bridge Influence Area because this is where the bulk of new transit services would be implemented under the build alternatives; including expanded or new park-and-rides with Express Bus service and stations associated with the HCT components. For 2005 Existing Conditions, approximately 67% of the population, and 83% of employment is within ¼ mile of a bus route. For 2030 No Build, approximately 61% of the population and 77% of employment is within ¼ mile of a bus route (both data points given here are on a region-wide basis). The reduction between today and 2030 No Build is largely due to a static transit network and forecasted changes in regional population growth. Approximately 88% of the population in Clark County will be within ¼ mile of a local bus route in 2030. Improvements to the Express Bus service would mostly be seen in Clark County and the Bridge Influence Area; although it would provide improved service to the Portland CBD it would not be accessible to transit in Oregon. Park and ride lots, new or expanded, served by Express Buses would give transit riders more choices as to where to begin their transit trip. Proximity of housing and employment to park-and-ride lots is used to measure usage of Express Bus service (Alternative Packages 3, 7, 8 and 9). In 2030, approximately 17% of the population and 12% of employment in Clark County would be within ½ mile of newly planned or existing park-and-ride lots (a total of 10 park-and-ride lots with 4,500 spaces). Express Bus options would include a local bus network with approximately 88% of the population in Clark County within ¼ mile of a bus route. Population and employment within ½ mile of a HCT (LRT or BRT) station is used to assess to these transit modes. For either LRT or BRT the stations (a total of 6 new HCT stations including one on Hayden Island) are in the same location along the same alignment route to the terminal station at Kiggins Bowl. In 2030, approximately 8% of the population and 12% of employment in Clark County will be within ½ mile of a proposed HCT station. LRT and BRT options would include a local bus network with approximately 88% of the population in Clark County within ¼ mile of a bus route.
Roadways North and Roadways South
Other (Bike/Ped, Freight, TSM/TDM, Tolling)
Criterion Performance

Evaluation of Component Packages – FORM A Page 13
Criterion 3.2 – Improve transit service to target markets in the I-5 corridor and within the Bridge Influence Area (Part of Value 3 – MODAL CHOICE)
Performance Measure(s) • Transit travel-times from Clark County transit markets to Oregon transit markets (in vehicle travel times in the AM
and PM peak periods for two representative pairs).
Best Performing Package(s) and/or Component(s) • Due to an exclusive guideway, LRT alternatives have the most reliable overall travel time between downtown
Vancouver and downtown Portland. • BRT provides similar travel times to LRT through the BIA, but BRT vehicles operate in general traffic south of the
BIA. This increases southbound AM peak travel times but decreases northbound PM peak travel times because the BRT makes no stops south of the BIA and the I-5 traffic enhancements improve traffic speeds in the NB direction.
• Express Bus travel times are 10 to 90% longer than LRT in the AM peak (southbound) and the same as or up to 50% shorter than LRT in the PM peak (northbound). With the I-5 traffic improvements and no stops south of the BIA, northbound Express Buses would travel in improved traffic conditions.
• BRT-Lite alternatives have the longest travel times due to their use of downtown general purpose lanes and I-5 managed lanes in lieu of an exclusive guideway.
• Replacement bridge options and the new arterial bridge option provide the best transit travel times and reliability because they allow LRT and BRT to operate on a new, fixed span bridge, thus avoiding delays and increased travel times due to bridge lifts.
Key Findings River Crossing
Replacement bridges perform better than Supplemental bridges because the former places transit on a fixed-span crossing. One cause of transit vehicle delay on the river crossing itself is bridge-lifts; raising the lift-span on the I-5 Bridge takes only a matter of minutes, but the resultant transit vehicle delay can be significant. Furthermore, the US Coast Guard has indicated that the current restrictions on bridge lifts (lifts are not allowed during peak travel times) would likely be removed if I-5 traffic were no longer on these bridges. Thus, bridge lifts would likely occur much more frequently than today and would occur during peak travel periods. Bi-state transit service is also affected by traffic incidents/crashes, which randomly occur within the bridge influence area. Traffic crashes have the largest impact on travel-time variability, with about 28 minutes of delay observed in the corridor for a northbound crash on the I-5 Bridge. Each bridge lift resulted in about 17 minutes of delay. Incident delays for fixed-route local buses were even greater than express buses: 45 minutes for bridge lifts and 60 minutes for traffic crashes, primarily because ramp meters constrain arterial access to I-5 under severe traffic conditions. Empirical data shows that congestion, bridge lifts, and incident delay on a portion of a bus route, in this case along I-5, can seriously deteriorate reliability on the entire route.
Transit Transit vehicle travel time for northbound PM peak segments and southbound AM peak segments are included in the table below. These travel-time segments do not include any delays that would be associated with bridge lifts, incidents or crashes. The travel time for high-capacity transit operating on the existing lift-span bridge (packages 4, 5 and 6) would be longer than reported below when a bridge lift occurs, as discussed above for River Crossings. For buses that operate on I-5, the travel-times reported here are a high speed and a low speed estimate. Both Table 1 and Table 2 report the travel time estimates.
Table 1.0 Estimated Travel-Time in Minutes Between Kiggins Bowl and Pioneer Courthouse Square
AM Southbound PM Southbound Transit Mode:
Low Speed Estimate
High Speed Estimate
Low Speed Estimate
High Speed Estimate
Type of Right-of-Way
Express Bus 40 49 20 28 I-5 managed lanes without stops
BRT-Lite 48 54 38 43 General purpose and managed lanes with station stops
BRT 45 49 33 38 44% in exclusive right-of-way and 56% in I-5 general purpose lanes with station stops

Evaluation of Component Packages – FORM A Page 14
LRT 37 37 37 37 100% in exclusive right-of-way with station stops
Table 2.0 Estimated Travel-Time in Minutes Between Vancouver CBD and Rose Quarter TC
AM Southbound PM Southbound
Transit Mode:
Low Speed Estimate
High Speed Estimate
Low Speed Estimate
High Speed Estimate
Type of Right-of-Way
Express Bus 30 36 16 22 I-5 managed lanes without stops
BRT-Lite 34 39 21 27 General purpose and managed lanes with station stops
BRT 23 27 14 16 44% in exclusive right-of-way and 56% in I-5 general purpose lanes with station stops
LRT 19 19 19 19 100% in exclusive right-of-way with station stops
Other (Bike/Ped, Freight, TSM/TDM, Tolling)

Evaluation of Component Packages – FORM A Page 15
Criterion Performance Criterion 3.3 – Improve bike/pedestrian connectivity in the I-5 corridor and within the Bridge Influence Area (Part of Value 3 – MODAL CHOICE)
Performance Measure(s) [list the metrics used to assess the degree to which the established criteria are satisfied.]
• Improve bicycle and pedestrian safety along the I-5 corridor and in the Bridge Influence Area • Provide more direct access to residential, employment and recreational destinations along I-5
Best Performing Package(s) and/or Component(s) [Summarize your findings regarding the components and combination of components that perform best on this criterion.]
• The Supplemental Interstate and Replacement Bridge alternatives would provide the best comprehensive multi-use enhancements, with pathway and connection improvements provided north of, across, and south of the river
Key Findings
River Crossing
RESULTS: EXISTING CONDITIONS: - Existing bicycle and pedestrian facilities in the I-5 corridor and within the I-5 Bridge Influence Area are circuitous and
consist of nonstandard connections between key residential, employment and recreational locations. Existing pathways lack proper features, are in need of maintenance, and have poor or missing directional signage. The nonstandard existing conditions create a deleterious effect on non-motorized mode choice in the I-5 corridor and within the Bridge Influence Area.
NO-BUILD ALTERNATIVE: - The No Build alternative would make no improvements to the existing bicycle and pedestrian facilities, other than
continued routine maintenance and repair of current infrastructure TDM/TSM ALTERNATIVE: - Under the TDM/TSM alternative there would be minor improvements to connections at each end of the bridge but no
improvements to the path across the bridge. NEW ARTERIAL ALTERNATIVE: - The New Arterial alternative is proposed to contain standardized bicycle and pedestrian facilities including a two-way
multi-use separated pathway. This pathway would provide a straight, comfortable and safe connection between downtown Vancouver, Hayden Island and the Marine Drive area.
SUPPLEMENTAL INTERSTATE ALTERNATIVES: - These options, in addition to carrying arterial traffic and a high capacity transit mode, would include pathway-separated
bicycle and pedestrian facilities. These facilities would provide a direct connection between downtown Vancouver, Hayden Island and the Marine Drive area that would follow the current path of I-5, while improving the safety and comfort of bicyclists and pedestrians. Options that use the existing bridges would provide a low-level crossing, compared to crossing on a new mid-level bridge. However, the low-level crossing would be subject to interruptions due to bridge lifts.
REPLACEMENT BRIDGE ALTERNATIVES: - Any new freeway bridge considered under this option would be equipped with standard bicycle and pedestrian facilities
that provide a safe, direct connection between downtown Vancouver, Hayden Island and the Marine Drive area. These new facilities would be separated from the new mainline roadways, improving the safety and comfort of bicyclists and pedestrians.
Note: All results shown above are approximate and subject to change
CONCLUSIONS:

Evaluation of Component Packages – FORM A Page 16
- The TDM/TSM alternative would provide only minor improvements to connections at either end of the bridge. - A multi-use pathway would be provided as part of the New Arterial alternative connecting to existing pathways on both
sides of the bridge - A new multi-use pathway, with an improved network of paths and connections in the I-5 Bridge Influence Area, would
be provided under the Supplemental Interstate and Replacement Bridge alternative
Transit Transit modes do not directly affect bicycle and pedestrian connectivity. However, many bicyclists and pedestrians use transit as part of their commute (e.g. bike to an LRT station and take LRT to downtown Portland). For these commuters, extending LRT through the BIA or adding BRT would improve regional bicycle and pedestrian connections. Therefore, Alternative Packages with LRT or BRT (3, 4, 5, 8, 9, 10) improve bicycle/pedestrian connectivity more than those without high capacity transit.
Roadways North and Roadways South
Other (Bike/Ped, Freight, TSM/TDM, Tolling)

Evaluation of Component Packages – FORM A Page 17
Criterion Performance Criterion 3.4 – Increase vehicle occupancy in the I-5 corridor and within the Bridge Influence Area (Part of Value 3 – MODAL CHOICE)
Performance Measure(s) [list the metrics used to assess the degree to which the established criteria are satisfied.]
• Average vehicle occupancy at the I-5 Bridge for single-occupant and high-occupancy vehicles and trucks • Measured using the regional travel demand model in terms of people per vehicle
Best Performing Package(s) and/or Component(s) [Summarize your findings regarding the components and combination of components that perform best on this criterion.]
• Average combined automobile and truck vehicle occupancy would remain consistent among all alternatives
Key Findings River Crossing
RESULTS:
The preliminary traffic modeling results indicate that average vehicle occupancy across all travel lanes (general purpose plus high occupancy vehicle lanes, if applicable) would be similar (about 1.2 occupants per vehicle) during peak travel periods for all alternatives. However, it should be noted that alternatives with high occupancy vehicle lanes would likely result in increased overall vehicle occupancy.
CONCLUSIONS:
Average combined automobile and truck vehicle occupancy would remain consistent among all alternatives
Transit
Roadways North and Roadways South
Other (Bike/Ped, Freight, TSM/TDM, Tolling)

Page 9
Criterion Performance Criterion 4.1 – Enhance vehicle/freight safety (Part of Value 4 – Safety)
Performance Measure(s) • Highway improvements to I-5 that specifically improve vehicle/freight safety within the Bridge Influence Area.
Best Performing Package(s) and/or Component(s)
• As designed, Alternative Packages 4, 5, and 10 would provide the most improvements to vehicle/freight safety within the Bridge Influence Area by (1) providing full shoulders on I-5; (2) removing three short weaving sections (at Marine Drive, Hayden Island, and SR 14); (3) operating transit in a separated guideway; and (4) adding freight bypass lanes at difficult merge locations. It’s important to note that all of these safety factors could be included with any of the river crossing Build options, except the new arterial bridge. All of these safety factors, except item 3 – separated guideway – could be paired with any of the transit modes. Only LRT and BRT would incorporate the “separated guideway” safety factor.
Key Findings
River Crossing No investment in I-5 would occur with Alternative Package 1, 2030 No Build, and therefore it would not improve vehicle/freight safety over the Columbia River. Alternative Package 2 would include minor improvements to correct some geometric deficiencies at SR 14, which may improve vehicle and freight safety at this interchange but would leave most of the river crossing’s substandard design features in place.
A new supplemental bridge, with arterial traffic separated from I-5 traffic would allow the Hayden Island interchange on I-5 to be removed. This would improve vehicle and freight safety over the river by eliminating points of conflict and reducing the amount of vehicle weaving. Alternative Package 3 would replace the existing Hayden Island interchange on I-5 with a new supplemental arterial bridge connection. Alternative Packages 4 and 5 would provide a new supplemental bridge for I-5 that would also eliminate the interchange on Hayden Island. The arterial connection to Hayden Island would be via the existing Columbia River bridges plus a new local access bridge across the Oregon Slough,
With a replacement bridge, access to Hayden Island from an interchange off of I-5 would be maintained. To improve vehicle and freight safety at this location on I-5, an interchange option (as included in Alternative Packages 8, 10, and 11) provides braided ramps to remove a short weave section from the I-5 main line between Hayden Island and Marine Drive. This would improve safety compared to other interchange options, though to a somewhat lesser degree than removing the interchange. This design feature could be used with any of the replacement bridge options (upstream or downstream).
Vehicle and freight safety would be further improved with either a new supplemental or replacement bridge for I-5 (Alternative Packages 4 - 12) because a new bridge would include full highway shoulders and lanes in both the northbound and southbound direction.
Transit
Vehicle and freight safety would be improved with those modes of transit that would operate in a separated guideway, which would reduce the number of buses on I-5 and in general purpose lanes. Therefore, Alternative Packages 3, 4, 5, 8, 9, and 10 that include LRT or BRT as the transit mode would improve vehicle/freight safety within the Bridge Influence Area. Introducing a new mode, such as LRT or BRT, to city streets creates potential conflicts at at-grade crossings. However, lower speeds and signal controls for at-grade crossings reduce the risk.
Roadways North and Roadways South
North or south of the river crossing, within the Bridge Influence Area, improvements specifically for vehicle/freight safety would not be provided with Alternative Packages 1, 2, and 3. Operating I-5 on a new supplemental or replacement bridge (Alternative Packages 4 – 12) would improve vehicle and freight safety north and south of the river crossing because full shoulders would be provided along I-5 through the whole length of the Bridge Influence Area, from SR 500 in the north to Victory Boulevard in the south. Operating I-5 on a new supplemental or replacement bridge also allows a short weaving section at SR 14 to be removed. Between SR 14 and Mill Plain Boulevard, Alternative Packages 4 – 12 include either a braided ramp or a collector/distributor road, which would improve vehicle and freight safety on the I-5 mainline.

Page 10
South of the Columbia River, safety would be improved with the removal a short weaving section from Marine Drive to southbound I-5 by adding a braided ramp between the Marine Drive and the Interstate Avenue/Denver Avenue interchange. This improvement is included in Alternative Packages 4, 5, 8, 10, and 11; it could be included as an option with either a new supplemental or a replacement bridge for I-5.
Other (Bike/Ped, Freight, TSM/TDM, Tolling) Vehicle and freight safety would be improved with the addition of freight bypass lanes in locations where trucks currently have difficulty entering and exiting I-5. This improvement is included in Alternative Packages 4, 5, 9, and 10; it could be included as an option with either a new supplemental or a replacement bridge for I-5.
Outside of the Bridge Influence Area, re-striping I-5 (in both directions) to add a managed lane network between 139th Street and SR 500 is included in Alternative Packages 4 – 11. Re-striping to add a managed lane would reduce the width of the shoulders in this section of I-5, which may impact vehicle and freight safety.

Page 11
Criterion Performance Criterion 4.2 – Enhance bike/pedestrian facilities and safety (Part of Value 4 – Safety)
Performance Measure(s) • Qualitative assessment of improved bicycle and pedestrian pathways provided within an alternative package.
Best Performing Package(s) and/or Component(s)
• Alternative Packages 3 - 12 provide similar improvements to bicycle and pedestrian facilities that best enhance safety.
Key Findings
River Crossing A new replacement bridge or the supplemental arterial bridge would construct on the new bridge, a two-way bicycle path and a two-way pedestrian path and improved connections to North Portland, Hayden Island, and downtown Vancouver. By providing separated facilities meeting current standards Alternative Packages 3 and 8 - 12 best enhance bicycle and pedestrian safety. Alternatives 4-7 would include widened bike and ped paths on the existing bridges, which would also be a substantial improvement over the No-build or TDM/TSM alternatives.
Transit
N/A
Roadways North and Roadways South N/A
Other (Bike/Ped, Freight, TSM/TDM, Tolling) New bicycle and pedestrian facilities would not be constructed with Alternative Package 1, 2030 No Build, and therefore bicycle and pedestrian safety would not be enhanced.
A new replacement bridge or the supplemental arterial bridge would construct on the new bridge, a two-way bicycle path and a two-way pedestrian path and improved connections to North Portland, Hayden Island, and downtown Vancouver. By providing separated facilities meeting current standards Alternative Packages 3 and 8 - 12 best enhance bicycle and pedestrian safety. Alternatives 4-7 would include widened bike and ped paths on the existing bridges, which would also be a substantial improvement over the No-build or TDM/TSM alternatives.

Page 12
Criterion Performance Criterion 4.3 – Enhance or maintain marine safety (Part of Value 4 – Safety)
Performance Measure(s) • Quality of marine navigation channel geometrics to accommodate ship movements, considering necessary tug and barge
turning maneuvers and hazards of additional lift restrictions.
Best Performing Package(s) and/or Component(s) • A replacement bridge, with Alternative Packages 8 - 12, provides the most benefit to marine safety because the new
bridge piers could be located to ease maneuvers between the I-5 bridge and the downstream railroad bridge and there would be no bridge lifts.
Key Findings
River Crossing Alternative Packages 1 and 2 would maintain the existing Columbia River channel geometrics between the existing I-5 bridges and the downstream railroad bridge.
If I-5 traffic continued to operate on the existing bridges, as would occur with Alternative Packages 1, 2, and 3, the bridge lift restriction periods, and associated marine hazards, would remain and likely increase with future increases in congestion on I-5. As congestion on I-5 increases, more restrictions on bridge lifts would negatively impact marine navigation.
For marine navigation and safety, a new supplemental bridge would have to be constructed so that the new piers would be in line with the piers of the existing bridges. Even with the piers in line, a new downstream supplemental bridge would reduce the available distance for ships to maneuver between the supplemental bridge and the downstream railroad bridge. Therefore, Alternative Packages 3 - 7, because they increase the number of obstructions in the water, would negatively impact marine maneuvers and safety.
Operating I-5 on a new supplemental bridge and using the existing bridges for arterial traffic, as is proposed with Alternative Packages 4 - 7, could reduce the bridge lift restriction period. This aspect would benefit marine safety.
A replacement bridge would allow the new bridge piers to be located to ease ship maneuvers between the I-5 bridge and the downstream railroad bridge, would reduce the number of obstructions in the water, and would eliminate bridge lifts. Alternative Packages 8 - 12 would provide the greatest improvements to marine safety.
Transit
Roadways North and Roadways South
Other (Bike/Ped, Freight, TSM/TDM, Tolling)

Page 13
Criterion Performance Criterion 4.4 – Enhance or maintain aviation safety (Part of Value 4 – Safety)
Performance Measure(s) • Ability to accommodate Federal Aviation Administration (FAA) clearance zone for Pearson Airpark.
Best Performing Package(s) and/or Component(s)
• Alternative Packages 8, 9, and 11, which include a downstream replacement bridge that would increase the distance between the I-5 bridge and Pearson Airpark, would best accommodate the FAA clearance zone for Pearson Airpark and therefore best enhance aviation safety.
Key Findings
River Crossing The towers of the existing I-5 bridges encroach 55 feet into the approach slope to Pearson Airpark. This impact to the FAA clearance zone would continue with those alternatives that would keep the existing bridges (Alternative Packages 1 - 7).
A new supplemental bridge would be constructed at a lower elevation than the existing bridge towers; however, they would still have a slight impact on the desirable clearance zone for Pearson Airpark. In addition to the supplemental bridge, the existing bridges (which encroach into the airspace) would remain. Therefore, Alternative Packages 3 - 7 would result in two structures within the airspace that may impact aviation safety.
A replacement bridge would enhance aviation safety because, as with a new supplemental bridge, they would be constructed at a lower elevation than the existing bridge towers and the existing bridges would be removed. Alternative Packages 8, 9, and 11 would provide the greatest benefit to aviation safety because the replacement bridge would be downstream from the existing bridges, which would increase the distance between the I-5 bridge and Pearson Airpark. Under Alternative Packages 10 and 12 the replacement bridge would be upstream from the existing bridges, which would slightly reduce the distance between the I-5 bridges and Pearson Airpark. With Alternative Packages 10 and 12, aviation safety would be enhanced but, because of the reduced distance between the bridge and Pearson Airpark, to a slightly lesser degree than with a downstream replacement bridge.
Transit
Roadways North and Roadways South
Other (Bike/Ped, Freight, TSM/TDM, Tolling)
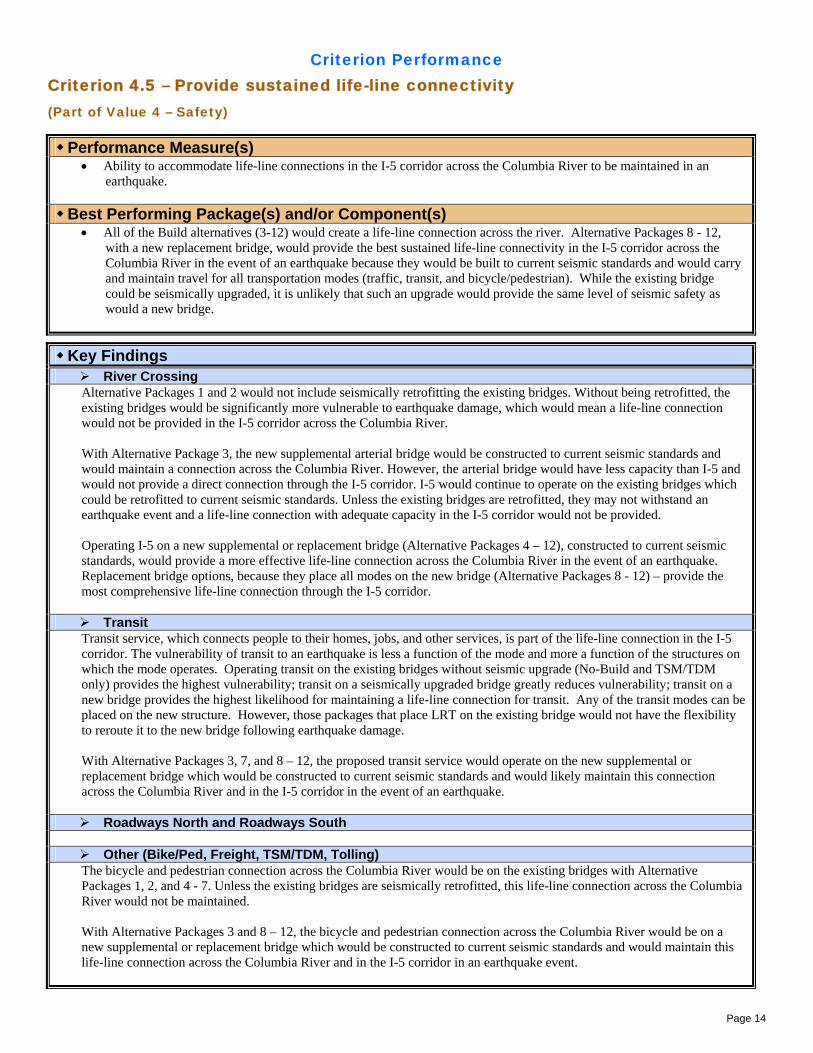
Page 14
Criterion Performance Criterion 4.5 – Provide sustained life-line connectivity (Part of Value 4 – Safety)
Performance Measure(s) • Ability to accommodate life-line connections in the I-5 corridor across the Columbia River to be maintained in an
earthquake.
Best Performing Package(s) and/or Component(s) • All of the Build alternatives (3-12) would create a life-line connection across the river. Alternative Packages 8 - 12,
with a new replacement bridge, would provide the best sustained life-line connectivity in the I-5 corridor across the Columbia River in the event of an earthquake because they would be built to current seismic standards and would carry and maintain travel for all transportation modes (traffic, transit, and bicycle/pedestrian). While the existing bridge could be seismically upgraded, it is unlikely that such an upgrade would provide the same level of seismic safety as would a new bridge.
Key Findings
River Crossing Alternative Packages 1 and 2 would not include seismically retrofitting the existing bridges. Without being retrofitted, the existing bridges would be significantly more vulnerable to earthquake damage, which would mean a life-line connection would not be provided in the I-5 corridor across the Columbia River.
With Alternative Package 3, the new supplemental arterial bridge would be constructed to current seismic standards and would maintain a connection across the Columbia River. However, the arterial bridge would have less capacity than I-5 and would not provide a direct connection through the I-5 corridor. I-5 would continue to operate on the existing bridges which could be retrofitted to current seismic standards. Unless the existing bridges are retrofitted, they may not withstand an earthquake event and a life-line connection with adequate capacity in the I-5 corridor would not be provided.
Operating I-5 on a new supplemental or replacement bridge (Alternative Packages 4 – 12), constructed to current seismic standards, would provide a more effective life-line connection across the Columbia River in the event of an earthquake. Replacement bridge options, because they place all modes on the new bridge (Alternative Packages 8 - 12) – provide the most comprehensive life-line connection through the I-5 corridor.
Transit
Transit service, which connects people to their homes, jobs, and other services, is part of the life-line connection in the I-5 corridor. The vulnerability of transit to an earthquake is less a function of the mode and more a function of the structures on which the mode operates. Operating transit on the existing bridges without seismic upgrade (No-Build and TSM/TDM only) provides the highest vulnerability; transit on a seismically upgraded bridge greatly reduces vulnerability; transit on a new bridge provides the highest likelihood for maintaining a life-line connection for transit. Any of the transit modes can be placed on the new structure. However, those packages that place LRT on the existing bridge would not have the flexibility to reroute it to the new bridge following earthquake damage. With Alternative Packages 3, 7, and 8 – 12, the proposed transit service would operate on the new supplemental or replacement bridge which would be constructed to current seismic standards and would likely maintain this connection across the Columbia River and in the I-5 corridor in the event of an earthquake.
Roadways North and Roadways South
Other (Bike/Ped, Freight, TSM/TDM, Tolling)
The bicycle and pedestrian connection across the Columbia River would be on the existing bridges with Alternative Packages 1, 2, and 4 - 7. Unless the existing bridges are seismically retrofitted, this life-line connection across the Columbia River would not be maintained.
With Alternative Packages 3 and 8 – 12, the bicycle and pedestrian connection across the Columbia River would be on a new supplemental or replacement bridge which would be constructed to current seismic standards and would maintain this life-line connection across the Columbia River and in the I-5 corridor in an earthquake event.

Page 15
Criterion Performance Criterion 4.6 – Enhance I-5 incident/emergency response access within the Bridge Influence Area (Part of Value 4 – Safety)
Performance Measure(s) • Ability to accommodate incident/emergency service access to incidents on I-5 in the Bridge Influence Area.
Best Performing Package(s) and/or Component(s) • Alternative Packages 5 and 10 would provide the greatest amount of access and capacity improvements to I-5 (such as a
new supplemental or replacement bridge for I-5, HCT in a separated guideway, and interchange improvements) that would best enhance emergency response access to incidents on I-5 in the Bridge Influence Area.
Key Findings
River Crossing If I-5 continued to operate on the existing bridges (Alternative Packages 1 - 3), emergency service access to incidents on I-5 would continue to be impacted by bridge lifts and by the substandard width of the bridges, which do not include shoulders.
With Alternative Package 2, the interchange improvements at SR 14 and Hayden Island, which would improve capacity and congestion, may slightly enhance emergency service access. However, the river crossing would still impact existing emergency response due to substandard shoulders.
A new supplemental or replacement bridge for I-5 would provide additional capacity over the Columbia River, include full shoulder widths, and not require bridge lifts. Therefore, Alternative Packages 4 - 12 would enhance emergency response and access on I-5 in the Bridge Influence Area.
A new supplemental or replacement bridge for I -5 (Alternative Packages 4 – 12) would also allow for improvements at SR 14 and Hayden Island that would better manage congestion on I-5 and enhance emergency service to incidents.
Transit N/A
Roadways North and Roadways South South of the river crossing, improvements to the Marine Drive interchange may improve emergency response on I-5. This improvement is proposed with Alternative Packages 4, 5, 8, 10, and 11; it could be included as an option with a new supplemental or replacement bridge for I-5.
North of the river crossing, ramps to and from the north at SR 500 would be provided with either a new supplemental or replacement bridge for I-5 (Alternative Packages 4 – 12). Adding these ramps at SR 500 would increase access points to I-5, which would improve emergency service and access to incidents on I-5 in the Bridge Influence Area.
Eliminating northbound ramps on I-5 at 39th Street (included as an option with Alternative Packages 4, 7, 8, and 12) would result in out-of-direction travel that may impact emergency service and access.
Other (Bike/Ped, Freight, TSM/TDM, Tolling) A managed lane network on I-5 through the Bridge Influence Area (included with Alternative Packages 4 – 11) would provide options to increase traffic efficiency, which may enhance emergency service access to incidents on I-5.

Evaluation of Component Packages – FORM A Page 18
Criterion Performance Criterion 5.1 – Reduce travel times and reduce delay for vehicle-moved freight on I-5 within the Bridge Influence Area (Part of Value 5 – Regional Economy; Freight Mobility)
Performance Measure(s) [list the metrics used to assess the degree to which the established criteria are satisfied.]
• Truck travel times on I-5 in the Bridge Influence Area (between SR-500 and Columbia Blvd.) • Determined based on travel demand and traffic operations analysis
Best Performing Package(s) and/or Component(s) [Summarize your findings regarding the components and combination of components that perform best on this criterion.]
• The Supplemental Interstate and Replacement Bridge alternatives result in the shortest truck travel times
Key Findings River Crossing
• The TDM/TSM and New Arterial alternatives provide similar truck travel times along I-5 as the No-Build alternative
• The Supplemental Interstate and Replacement Bridge alternatives reduce northbound I-5 truck travel times compared to the TDM/TSM and New Arterial alternatives by 50% to 60%
• The Supplemental Interstate and Replacement Bridge alternatives result in similar to slightly higher southbound I-5 travel times during the AM peak period compared to the TDM/TSM and New Arterial alternatives due to constraints on I-5 south of the Bridge Influence Area
• Note: The Supplemental Interstate and Replacement Bridge alternatives accommodate about 20% to 25% higher southbound AM peak period truck traffic volumes and about 30% to 50% higher northbound truck traffic volumes than the TDM/TSM and New Arterial alternatives (see Criterion 5.4)
• Note: The Supplemental Interstate and Replacement Bridge alternatives reduce the duration of congestion by about 55% to 60% compared to the TDM/TSM and New Arterial alternatives (see Criterion 2.3)

Evaluation of Component Packages – FORM A Page 19
Northbound I-5 Truck Travel Times (Year 2030*)
1418 18
16
10 10 10
45
61 60
55
34 34 34
0
10
20
30
40
50
60
70
Existing(2005)
No-Build TDM/TSM New Arterial SupplementalInterstate w/
Hayden Island IC
SupplementalInterstate w/o
Hayden Island IC
ReplacementBridge
2-H
our P
M P
eak
Ave
rage
Tra
vel T
ime
(min
)
Columbia Boulevard to SR-500 I-84 to 179th Street
*Except for Existing Conditions (Year 2005)
Southbound I-5 Truck Travel Times (Year 2030*)
29 29 29
37
64 64
58 58
29+29+29+27
57
61
0
10
20
30
40
50
60
70
Existing(2005)
No-Build TDM/TSM New Arterial SupplementalInterstate w/
Hayden Island IC
SupplementalInterstate w/o
Hayden Island IC
Replacement Bridge
2-H
our A
M P
eak
Ave
rage
Tra
vel T
ime
(min
)
SR-500 to Columbia Boulevard 179th Street to I-84
*Except for Existing Conditions (Year 2005)
Transit
Roadways North and Roadways South
Other (Bike/Ped, Freight, TSM/TDM, Tolling)
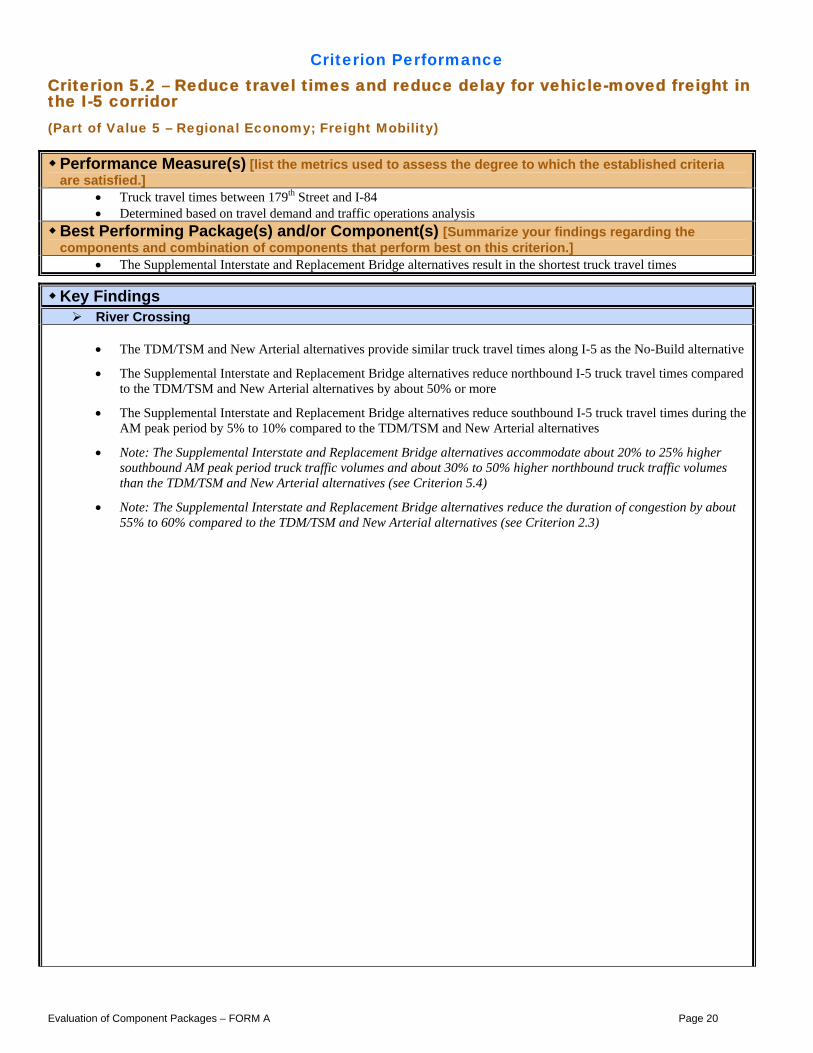
Evaluation of Component Packages – FORM A Page 20
Criterion Performance Criterion 5.2 – Reduce travel times and reduce delay for vehicle-moved freight in the I-5 corridor (Part of Value 5 – Regional Economy; Freight Mobility)
Performance Measure(s) [list the metrics used to assess the degree to which the established criteria are satisfied.]
• Truck travel times between 179th Street and I-84 • Determined based on travel demand and traffic operations analysis
Best Performing Package(s) and/or Component(s) [Summarize your findings regarding the components and combination of components that perform best on this criterion.]
• The Supplemental Interstate and Replacement Bridge alternatives result in the shortest truck travel times
Key Findings River Crossing
• The TDM/TSM and New Arterial alternatives provide similar truck travel times along I-5 as the No-Build alternative
• The Supplemental Interstate and Replacement Bridge alternatives reduce northbound I-5 truck travel times compared to the TDM/TSM and New Arterial alternatives by about 50% or more
• The Supplemental Interstate and Replacement Bridge alternatives reduce southbound I-5 truck travel times during the AM peak period by 5% to 10% compared to the TDM/TSM and New Arterial alternatives
• Note: The Supplemental Interstate and Replacement Bridge alternatives accommodate about 20% to 25% higher southbound AM peak period truck traffic volumes and about 30% to 50% higher northbound truck traffic volumes than the TDM/TSM and New Arterial alternatives (see Criterion 5.4)
• Note: The Supplemental Interstate and Replacement Bridge alternatives reduce the duration of congestion by about 55% to 60% compared to the TDM/TSM and New Arterial alternatives (see Criterion 2.3)

Evaluation of Component Packages – FORM A Page 21
Northbound I-5 Truck Travel Times (Year 2030*)
1418 18
16
10 10 10
45
61 60
55
34 34 34
0
10
20
30
40
50
60
70
Existing(2005)
No-Build TDM/TSM New Arterial SupplementalInterstate w/
Hayden Island IC
SupplementalInterstate w/o
Hayden Island IC
ReplacementBridge
2-H
our P
M P
eak
Ave
rage
Tra
vel T
ime
(min
)
Columbia Boulevard to SR-500 I-84 to 179th Street
*Except for Existing Conditions (Year 2005)
Southbound I-5 Truck Travel Times (Year 2030*)
29 29 29
37
64 64
58 58
29+29+29+27
57
61
0
10
20
30
40
50
60
70
Existing(2005)
No-Build TDM/TSM New Arterial SupplementalInterstate w/
Hayden Island IC
SupplementalInterstate w/o
Hayden Island IC
Replacement Bridge
2-H
our A
M P
eak
Ave
rage
Tra
vel T
ime
(min
)
SR-500 to Columbia Boulevard 179th Street to I-84
*Except for Existing Conditions (Year 2005)
Transit
Roadways North and Roadways South
Other (Bike/Ped, Freight, TSM/TDM, Tolling)

Page 16
Criterion Performance Criterion 5.3 – Enhance or maintain efficiency of marine navigation (Part of Value 5 – Regional Economy; Freight Mobility)
Performance Measure(s) • Potential for an alternative to avert extension of “no bridge lift” periods tied to I-5 congestion.
Best Performing Package(s) and/or Component(s)
• The greatest benefit to the efficiency of marine navigation would be with Alternative Packages 8 - 12, which include a replacement bridge, because (1) this would eliminate the existing liftspan bridge, thus eliminating the “no bridge lift” period and (2) it would have fewer piers (approximately 5 versus 14) in the water, resulting in fewer obstructions to the navigation channel.
Key Findings
River Crossing As congestion on I-5 increases, it is likely that bridge lift restrictions could be increased, thereby further impacting river navigation. Continuing to operate I-5 on the existing bridges (Alternative Packages 1 - 3) would decrease the efficiency of marine navigation because the “no bridge lift” period would be extended.
A new supplemental bridge for I-5 (Alternative Packages 4 - 7) would remove the limitations that I-5 traffic places on bridge lifts. The existing bridges would be used for arterial traffic and the “no bridge lift” period may decrease, which would enhance marine navigation. However, there would be approximately three times as many piers in the water.
Providing a replacement bridge for I-5 and removing the existing bridges (Alternative Packages 8 – 12) would eliminate the “no bridge lift” period, remove the existing bridge and its navigation obstructions, and provide the greatest benefit to marine navigation.
Transit
None of the transit modes would have a meaningful impact on marine navigation efficiency. However, marine navigation needs would likely impact reliability for some transit mode and river crossing combinations. With a supplemental bridge for I-5, the ”no bridge lift” period could be reduced since there would be no direct impact to I-5 traffic. Operating the transit service on the existing bridges (Alternative Packages 4 – 6), which may be subjected to additional bridge lifts, could impact transit schedules but would enhance marine navigation.
With a replacement bridge that would also carry transit service (Alternative Packages 8 – 12), the “no bridge lift” period would be eliminated and there would be no impacts to transit service.
Roadways North and Roadways South
Other (Bike/Ped, Freight, TSM/TDM, Tolling)
These elements would have no meaningful impact on river navigation efficiency.
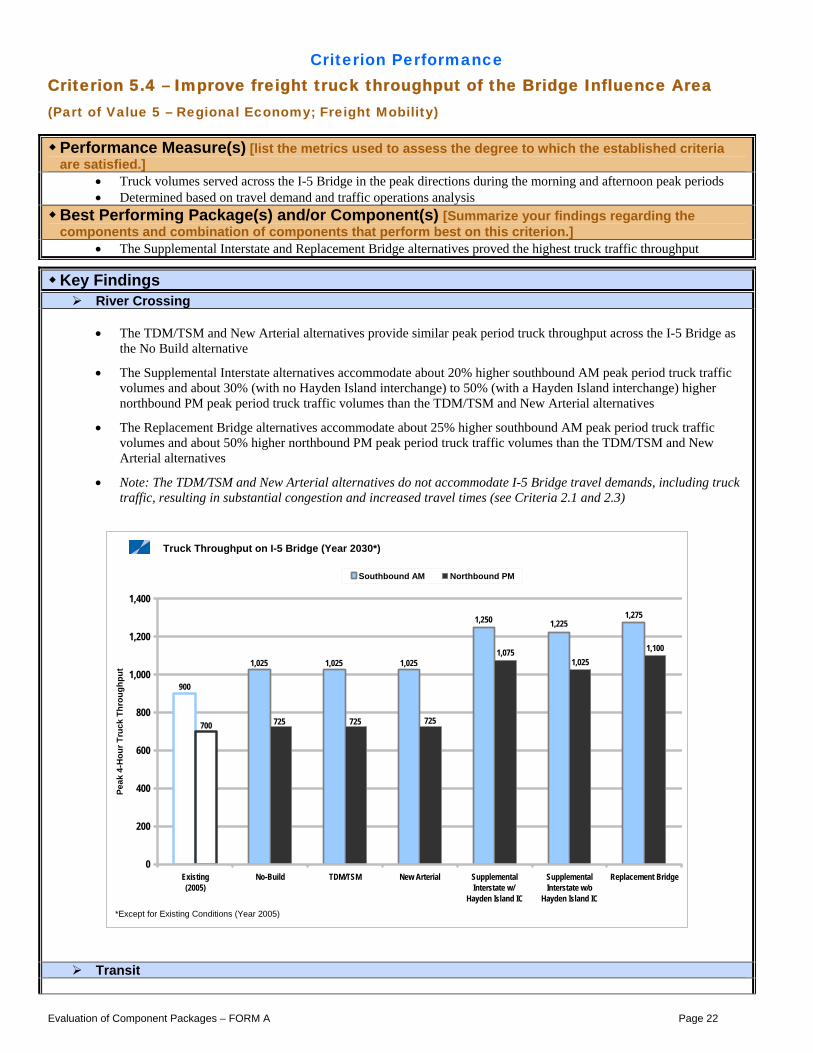
Evaluation of Component Packages – FORM A Page 22
Criterion Performance Criterion 5.4 – Improve freight truck throughput of the Bridge Influence Area (Part of Value 5 – Regional Economy; Freight Mobility)
Performance Measure(s) [list the metrics used to assess the degree to which the established criteria are satisfied.]
• Truck volumes served across the I-5 Bridge in the peak directions during the morning and afternoon peak periods • Determined based on travel demand and traffic operations analysis
Best Performing Package(s) and/or Component(s) [Summarize your findings regarding the components and combination of components that perform best on this criterion.]
• The Supplemental Interstate and Replacement Bridge alternatives proved the highest truck traffic throughput
Key Findings River Crossing
• The TDM/TSM and New Arterial alternatives provide similar peak period truck throughput across the I-5 Bridge as
the No Build alternative
• The Supplemental Interstate alternatives accommodate about 20% higher southbound AM peak period truck traffic volumes and about 30% (with no Hayden Island interchange) to 50% (with a Hayden Island interchange) higher northbound PM peak period truck traffic volumes than the TDM/TSM and New Arterial alternatives
• The Replacement Bridge alternatives accommodate about 25% higher southbound AM peak period truck traffic volumes and about 50% higher northbound PM peak period truck traffic volumes than the TDM/TSM and New Arterial alternatives
• Note: The TDM/TSM and New Arterial alternatives do not accommodate I-5 Bridge travel demands, including truck traffic, resulting in substantial congestion and increased travel times (see Criteria 2.1 and 2.3)
Truck Throughput on I-5 Bridge (Year 2030*)
1,025
900
1,250 1,2251,275
1,025 1,025 1,025
725725725700
1,075 1,100
0
200
400
600
800
1,000
1,200
1,400
Existing(2005)
No-Build TDM/TSM New Arterial SupplementalInterstate w/
Hayden Island IC
SupplementalInterstate w/o
Hayden Island IC
Replacement Bridge
Peak
4-H
our T
ruck
Thr
ough
put
Southbound AM Northbound PM
*Except for Existing Conditions (Year 2005)
Transit

Evaluation of Component Packages – FORM A Page 23
Roadways North and Roadways South
Other (Bike/Ped, Freight, TSM/TDM, Tolling)

Evaluation of Component Packages – FORM A Page 24
Criterion Performance Criterion 5.5 – Avoid or minimize adverse impacts to the parallel freight rail corridor (Part of Value 5 – Regional Economy; Freight Mobility)
Performance Measure(s) [list the metrics used to assess the degree to which the established criteria are satisfied.]
• Peak period traffic congestion experienced on east-west arterial roadways within the Bridge Influence Area with at-grade crossings of the north-south BNSF railline
• Determined based on travel demand analysis Best Performing Package(s) and/or Component(s) [Summarize your findings regarding the components and combination of components that perform best on this criterion.]
• An examination of the twelve alternatives reveals that they would each result in similar traffic levels at the at-grade crossings and therefore each alternative would result in similar impacts on freight rail operations.
Key Findings
River Crossing
• An examination of the twelve alternatives reveals that they each would result in similar traffic levels at the at-grade intersections and would therefore result in similar impacts on freight rail operations.
• Note that the closest, at-grade BNSF rail crossing in the Bridge Influence Area is located about 900 feet east of the W 39th Street/NW Fruit Valley Road intersection in Vancouver. This intersection is located about 1.3 miles west of I-5.
• An examination of the twelve alternatives reveals that they each would result in similar traffic levels at the at-grade crossings and would therefore result in similar impacts on freight rail operations.
Transit
Roadways North and Roadways South
Other (Bike/Ped, Freight, TSM/TDM, Tolling)

Evaluation of Component Packages – FORM A Page 25
Criterion Performance Criterion 5.6 – Enhance or maintain access to port, freight, and industrial facilities (Part of Value 5 – Regional Economy; Freight Mobility)
Performance Measure(s) [list the metrics used to assess the degree to which the established criteria are satisfied.]
• Improved accessibility between I-5 and typical freight centers •
Best Performing Package(s) and/or Component(s) [Summarize your findings regarding the components and combination of components that perform best on this criterion.]
• The Supplemental Interstate and Replacement Bridge alternatives would provide the greatest accessibility to port, freight, and industrial facilities
Key Findings
River Crossing EXISTING CONDITIONS, N0-BUILD ALTERNATIVE, TDM/TSM ALTERNATIVE, AND NEW ARTERIAL ALTERNATIVE: • These alternatives will provide no to minimal accessibility improvements to I-5 Bridge Influence Area interchanges SUPPLEMENTAL INTERSTATE ALTERNATIVE AND REPLACEMENT BRIDGE ALTERNATIVE: • These alternatives would provide accessibility improvements to most or all I-5 Bridge Influence Area interchanges,
thereby improving accessibility to nearby freight centers
Transit
Roadways North and Roadways South
Other (Bike/Ped, Freight, TSM/TDM, Tolling)

Page 17
Criterion Performance Criterion 6.1 – Avoid, then minimize adverse impacts to, and where practicable enhance, threatened or endangered fish or wildlife habitat (Part of Value 6 – Stewardship of Natural Resources)
Performance Measure(s) • What is the total area of critical and native habitat for threatened and endangered species within the design area
footprint? • What is the relative quality of the habitat?
Best Performing Package(s) and/or Component(s) Replacement bridge options perform better than supplemental bridge options. Express Bus and BRT-Lite options have less direct impact than LRT or BRT, although any transit options that increase transit mode share and better support growth management would likely reduce long-term, indirect impacts to threatened and endangered species. Alternative Package 12 has the smallest impact on threatened and endangered species; however, the differences are relatively minor.
Key Findings
River Crossing Supplemental downstream bridge: Supplemental bridges will add new piers into Columbia River and Oregon Slough (critical habitat for salmonid species), and disturb the (already disturbed) riparian area along the Columbia River and the Oregon Slough. Construction of the supplemental bridge may cause disturbance to peregrine falcons and will disturb salmonid species. Seismic retrofitting of the existing bridge will impact salmonid species, disturb peregrine falcons, and temporarily remove peregrine falcon habitat. Demolition of the existing Oregon Slough Bridge will also impact salmonid species. A supplemental interstate bridge (Alternative Packages 4 – 7) combined with the existing bridges would have approximately 10-20 percent more deck area over the Columbia River, compared to Replacement options. These areas are used as surrogates for the actual area/volume of piers in the water because that information is not yet available. It is assumed that the larger the bridge area, the larger the piers that would be needed. Bridges will also indirectly impact designated critical habitat by shading the river. Supplemental bridge options will also have more (about 14 piers) compared to replacement bridge options (about 5 piers)
Replacement downstream or upstream bridge: Replacement bridges will remove peregrine falcon habitat, add new piers to the Columbia River and Oregon Slough (critical habitat for salmonid species), and disturb the riparian area along the Columbia River. Construction of the replacement bridge and demolition of existing bridges will cause disturbance to salmonid species. The replacement bridge options (Alternative Packages 8 through 12) would have approximately 18 to 24 acres of area over water. These areas are used as surrogates for the actual area/volume of piers in the water because that information is not yet available. It is assumed that the larger the bridge area, the larger the piers that would be needed. Bridges will also indirectly impact designated critical habitat by shading the river. Supplemental arterial bridge: Seismic retrofitting of the existing bridge will impact salmonid species, disturb peregrine falcons, and potentially remove peregrine falcon habitat. The new arterial bridge will add new piers into the Columbia River (critical habitat for salmonid species) and disturb the riparian area along the Columbia River. Construction of the arterial bridge may cause disturbance to peregrine falcons and will disturb salmonid species. The arterial bridge will have an approximate area of 18 acres over the Columbia River and Oregon Slough. The supplemental arterial bridge will also have more piers (about 14) compared to replacement bridge options (about 5 piers) All river crossing options will impact peregrine falcons and salmonid species through habitat loss and disturbance. A replacement bridge performs better for threatened and endangered salmon in the long term. Building a supplemental or a replacement bridge will both require new piers in the Columbia River. Demolition of the existing bridges in the replacement option will cause additional disturbance to salmonid species, but once those piers are removed only the replacement bridge piers will remain. Building a supplemental bridge will require additional piers in the river, along with larger piers on the existing bridge due to seismic retrofitting. Short-term disturbance is likely greater for the supplemental options. In the long

Page 18
term, a replacement bridge will have fewer piers in the water, and therefore have a smaller impact. A supplemental arterial bridge (Alternative Package 3), combined with the existing bridges, would have the least total area over water. The new arterial bridge is a smaller supplemental bridge so will have fewer impacts than the supplemental interstate bridge.
Transit LRT and BRT options in Alternative Packages 8, 9, and 10 have a separate bridge for the transit component over the Oregon Slough. This could add more piers into the Oregon Slough (critical habitat for salmonid species) and cause disturbance to salmonids during construction. It could also clear span the Slough. LRT or BRT require a wider river crossing, increasing area over water. All LRT and BRT options impact the riparian habitat of Burnt Bridge Creek, which is native habitat for salmonid species. Express Bus and BRT-Lite components have little direct impacts on threatened and endangered species. On the down side, because they provide less support to growth management goals, compared to LRT or BRT, they could have greater indirect impacts on wildlife and fish.
Roadways North and Roadways South Roadways North have no direct impact on threatened or endangered species. The Marine Drive Flyover Access has an arterial crossing and an on-ramp from MLK crossing the Oregon Slough. This could add piers (if not clear spanned) into the Oregon Slough (critical habitat for salmonid species) and cause disturbance to salmonids during construction. This option impacts about 1.85 acres of salmonid critical habitat.
Other (Bike/Ped, Freight, TSM/TDM, Tolling)

Page 19
Criterion Performance Criterion 6.2– Avoid, then minimize adverse impacts to, and where practicable enhance, other fish or wildlife habitat (Part of Value 6 – Stewardship of Natural Resources)
Performance Measure(s) • What is the total area of fish and wildlife habitat within the design area footprint? • What is the range of different habitat types within the design area footprint? • What are the impacts to wildlife crossings/passage? • What is the type and quality of habitat within the design area footprint?
Best Performing Package(s) and/or Component(s)
Replacement bridge options perform better than supplemental bridge options. Express Bus and BRT-Lite options have less direct impact than LRT or BRT, although any transit options that increase transit mode share and better support growth management would likely reduce long-term, indirect impacts to fish and wildlife. Alternative Package 12 has the smallest direct impact on fish and wildlife habitat; however, the differences are relatively minor.
Key Findings
River Crossing Replacement, downstream or upstream, bridge The replacement bridge options will remove a section of the riparian area (already disturbed) along the Columbia River, but would also provide the opportunity to restore riparian vegetation where the existing bridges are located. New piers will be added within the Columbia River, but the existing piers will be removed. This construction has the potential to impact native fish species, such as lamprey and sturgeon. Demolition of the existing bridge will remove habitat for bridge-nesting species; this can be replaced with the new bridge.
Demolition of the existing Oregon Slough Bridge and construction of the new bridge will cause disturbance to native fish species and bridge-nesting species. Construction of the new bridge will also remove (already disturbed) riparian area along the slough, and will add piers in to the slough.
Supplemental, downstream, bridge A supplemental bridge will remove a section of the riparian area along the Columbia River and will add new piers in the Columbia River, which has the potential to impact native fish species, such as lamprey and sturgeon. Seismic retrofitting of the existing bridge may also disturb native fish species in the Columbia River, along with bridge-nesting species using the existing bridges. Supplemental bridge options will also have more (about 14 piers) compared to replacement bridge options (about 5 piers) Demolition of the existing Oregon Slough Bridge and construction of the new bridge will cause disturbance to native fish species and bridge-nesting species. Construction of the new bridge will also remove (already disturbed) riparian area along the slough, and add piers in to the slough. New arterial bridge Seismic retrofitting of the existing bridge will impact native fish species and bridge-nesting species using the bridge. The new arterial bridge will add new piers into the Columbia River and disturb a section of the riparian area along the Columbia River. Construction of the arterial bridge will cause disturbance to native fish species and bridge-nesting species. Demolition of the existing Oregon Slough Bridge and construction of the new bridge will cause disturbance to native fish species and bridge-nesting species. Construction of the new bridge will also remove (already disturbed) riparian area along the slough, and add piers in to the slough.
All river crossing options impact City of Portland Environmental Zones (conservation zones), Metro Goal 5 habitat zones, and Clark County Sensitive and Critical lands. Impacts occur in the Burnt Bridge Creek area and along the Columbia River. In Portland, this would also include the Oregon Slough, Delta Slough, and the forested areas at the southwestern edge of the Marine Drive interchange. Alternative Package 3 has the smallest impact on these zones. The only habitats identified during field surveys that are impacted by the river crossings are the open water of the Columbia River and Oregon Slough. Overall, Alternative Package 3 has the smallest impact on these habitats, followed by Alternative Packages 9 and 12.

Page 20
All river crossing options have the potential to impact native fish in the Columbia River and Oregon Slough, bridge-nesting species using the existing bridges, and riparian habitat along the Columbia River and Oregon Slough. All options are likely to have the same impact on wildlife passage.
Transit
The LRT and BRT options in Alternative Packages 8, 9, and 10 have a separate bridge for the transit component over the Oregon Slough. This could add additional piers into the Oregon Slough, alter the riparian area, and cause disturbance to native fish and bridge-nesting species during construction. This bridge may instead clear span the Slough and therefore add no additional piers.
All LRT and BRT options impact the riparian habitat of Burnt Bridge Creek, which is habitat for native fish, migratory birds, and other wildlife species, and is a WDFW Priority Habitat and Clark County Sensitive and Critical Lands. LRT and BRT options also impact City of Portland Environmental Zones, Metro Goal 5 zones, and habitats identified during field surveys. These habitats are generally low to medium quality.
With two exceptions, Express Bus and BRT-Lite options have no direct impacts on fish and wildlife habitat. Alternative Packages 7 and 11 transit components impact roughly 1 acre of Clark County Sensitive and Critical Lands. Transit components that increase transit mode share and better support growth management would likely help reduce long-term, indirect impacts to fish and wildlife habitat.
Roadways North and Roadways South
Roadways North alternatives have an impact on WDFW Priority Habitats in the Burnt Bridge Creek riparian area and Urban Open Space, and on Clark County Sensitive and Critical Lands. The SR 500 Flyover Access has a greater impact on these habitats than the SR 500 Tunnel Access, and also impacts more of the habitats identified during field surveys. These habitats are of low to medium quality.
The Hayden Island Access option has no impacts to the Oregon Slough and very small impacts to City of Portland Environmental Zones, Metro Goal 5 zones, and on habitats identified during field surveys.
The Hayden Island Arterial Access option has an arterial crossing and an on-ramp from Martin Luther King Boulevard crossing the Oregon Slough. This could add additional piers into the Oregon Slough, alter the riparian area, and cause disturbance to native fish and migratory birds during construction. The Hayden Island Arterial Access has the largest impact on City of Portland Environmental Zones, Metro Goal 5 zones, and on habitats identified during field surveys (Westside Riparian Wetland habitats). These habitats are of low to medium quality.
The Full Standard option has a split off-ramp south from Hayden Island and a Martin Luther King Boulevard crossing over the Oregon Slough. This could add additional piers into the Oregon Slough, alter the riparian area, and cause disturbance to salmonids during construction. The Hayden Island Full Standard component has the second highest impacts to City of Portland Environmental Zones, Metro Goal 5 zones, and habitats identified during field surveys (Westside Riparian Wetland habitats). These habitats are of low to medium quality.
Other (Bike/Ped, Freight, TSM/TDM, Tolling)
Page 21
Criterion Performance Criterion 6.3 - Avoid, then minimize adverse impacts to, and where practicable enhance, rare, threatened, or endangered plant species (Part of Value 6 – Stewardship of Natural Resources)
Performance Measure(s) • What is the total area of rare plant habitat within the design area footprint?
Best Performing Package(s) and/or Component(s)
• All packages and components perform the same. There is no rare plant habitat impacted by any packages and/or components.
Key Findings River Crossing
No impacts to rare plant habitat.
Transit No impacts to rare plant habitat.
Roadways North and Roadways South
No impacts to rare plant habitat.
Other (Bike/Ped, Freight, TSM/TDM, Tolling) No impacts to rare plant habitat.

Page 22
Criterion Performance Criterion 6.4 - Avoid, then minimize adverse impacts to, and where practicable enhance, wetlands (Part of Value 6 – Stewardship of Natural Resources)
Performance Measure(s) • What is the total area of wetlands within the design area footprint? • What are the types and quality of different wetlands within the design area footprint?
Best Performing Package(s) and/or Component(s) None of the Alternative Packages or components directly impact wetlands. The BRT and LRT components come within 3 feet of a wetland along Burnt Bridge Creek and the Hayden Island Arterial and Full Standard access options come within 40 feet of a wetland southwest of the Marine Drive interchange.
The differences among all alternatives are minor.
Key Findings
River Crossing There are no impacts to wetlands from river crossing options.
Transit
The Express Bus and BRT-Lite options are farthest from the Burnt Bridge Creek wetland, while BRT and LRT options come within about 3 feet of the Burnt Bridge Creek wetland. None of the transit options has any direct impacts to wetlands.
Any transit options that increase transit mode share and better support growth management would likely reduce long-term, indirect impacts to other wetlands.
Roadways North and Roadways South
Roadways North components have no impacts on wetlands.
The Hayden Island Access and Hayden Island Folded Diamond components are the farthest from the wetland near the Marine Drive interchange, while the Hayden Island Arterial access and the Full Standard components are the closest (within 40 feet).
Other (Bike/Ped, Freight, TSM/TDM, Tolling)
There are no impacts to wetlands under any of these components.

Page 23
Criterion Performance Criterion 6.5 - Avoid, then minimize adverse impacts to, and where practicable enhance, water quality (Part of Value 6 – Stewardship of Natural Resources)
Performance Measure(s) • How much area of additional impervious surface would be introduced by this alternative? • How much existing impervious surface would remain?
Best Performing Package(s) and/or Component(s)
• The supplemental arterial bridge (package 3) has the smallest design area footprints. The replacement bridge options have smaller total deck area (by about 10% to 20%) than the equivalent supplemental bridge options.
• It will generally be easier to treat stormwater runoff from a new bridge than from the existing bridges. However, existing upland space for providing extensive treatment facilities is limited.
• The Replacement bridges would have fewer permanent piers in the water and likely less in-water work during
construction.
Key Findings
River Crossing The new arterial bridge (Alternative Package 3) has the smallest footprint. The replacement bridge options have less total impervious surface area than the supplemental bridge options (by approximately 10-20%).
Replacement Alternative Packages 8 - 12 will generally perform better than supplemental alternative because they have less total impervious surface area and are more conducive to full stormwater collection, conveyance, and treatment. They would also have fewer permanent piers in the water and likely less in-water work during construction.
No-Build has the least impervious surface area but would not include any treatment of stormwater runoff.
Transit
The BRT and LRT options have the largest footprints, while Express Bus has no additional footprint (unless it includes a managed lane). All of the transit options would likely allow storm water treatment.
Roadways North and Roadways South
Other (Bike/Ped, Freight, TSM/TDM, Tolling)

Page 24
Criterion Performance Criterion 6.7 - Avoid, then minimize adverse impacts to, and where practicable enhance, waterways (Part of Value 6 – Stewardship of Natural Resources)
Performance Measure(s) • What are the removal/fill impacts to waterways?
Best Performing Package(s) and/or Component(s)
• Replacement bridges (downstream or upstream) have the fewest piers in the water, and would leave less in-water structure than alternative packages with a supplemental bridge; Express Bus and BRT-Lite options have no impacts to waterways.
• Of the Build options, Alternative Package 12 has the smallest impact on waterways.
Key Findings River Crossing
Replacement, downstream or upstream, bridge New piers will be added into the Columbia River and Oregon Slough but the existing piers would be removed. This option would include about 5 piers in the Columbia River compared to the Supplemental options with about 14 piers in the water. The replacement bridges would have about 10% to 20% less deck area over water, compared to the supplemental bridge options..
Supplemental downstream bridge New piers will be added into the Columbia River and Oregon Slough. Seismic retrofitting of the existing bridges will increase the footprint of the existing piers.
New arterial bridge New piers will be added into the Columbia River and Oregon Slough. This bridge, combined with the existing bridges, will have a total area over water of about 18 acres. Seismic retrofitting of the existing bridges will increase the footprint of the existing piers.
All river crossing options will require new piers to be put in the Columbia River and Oregon Slough. Replacement bridges are bigger than supplemental bridges and therefore would require bigger piers; however, supplemental bridge crossings will require seismic retrofitting of the existing bridges. With the information currently available, we expect all river component options to have similar areas of fill in the water, although supplemental options would have about three times as many piers as the replacement options.
Transit Express Bus and BRT Lite options have no impacts on waterways. LRT or BRT require a wider river crossing, increasing area over water. Furthermore, pairing BRT or LRT with a downstream replacement bridge uses a separate structure over the Oregon Slough in order to connect with the existing Expo MAX station.
Roadways North and Roadways South
Roadways North have no impacts to waterways.
The Hayden Island Arterial Access option has an arterial bridge over the Oregon Slough and an MLK on-ramp, both of which could require additional piers in the Oregon Slough.
The Hayden Island Folded Diamond Access option has a split off-ramp heading south and an MLK crossing, both of which could require additional piers in the Oregon Slough.
Other (Bike/Ped, Freight, TSM/TDM, Tolling)
There will be no impacts to waterways under these components.

Evaluation of Component Packages – FORM A Page 26
Criterion Performance Criterion 7.1 – Avoid or minimize disproportionate adverse impacts on, and where practicable, improve conditions for low income & minority populations (Part of Value 7 – Distribution of Benefits and Impacts)
Performance Measure(s) • 7.1.1 Do potential acquisitions and noise impacts cluster in areas considered high-minority or low income? (noise
impacts have not been modeled) • 7.1.2 Is traffic diverted to census tracts considered high-minority or low income? (not evaluated at this time)
Best Performing Package(s) and/or Component(s) • All of the river crossing options and all of the transit options perform similarly on this criteria. According to current
census data* residential acquisitions and displacements do not cluster in areas with notable low-income and/or minority populations. It is not yet known if displacements would have a direct impact on low income or minority individuals.
* Other demographic data will need to be reviewed to update or validate the census data.
Key Findings River Crossing
The river crossings would displace approximately 5 to 15 floating homes on the Oregon Slough, with no significant difference between the different crossing options. The greatest variability in displacements is due to the interchange configurations for roadways north and south and the transit mode (see below).
Transit LRT and BRT have higher potential to affect residential properties than BRT-Lite or Express Bus because they necessitate wider structures across the Oregon Slough, which may displace approximately 5 floating homes for most bridge options. According to current census data, residential acquisitions and displacements do not cluster in areas with notable low-income and/or minority populations.
Roadways North and Roadways South
The majority of residential displacements from this project would occur in the vicinity of the Oregon Slough, immediately east and west of I-5. This area is split by three Census block groups, all of which are in Oregon:
Tract 72.01, BG 1 – West of I-5, Hayden Island and Oregon Slough (north side of Slough) Tract 72.01, BG 2 – East of I-5, Hayden Island and Oregon Slough (north side of Slough) Tract 72.02, BG 1 – Portland, southern bank of the Oregon Slough, east and west of I-5.
Demographic Summary of Census Tracts Potentially Affected by Alternative Packages* Tract Number Percent
Minority Percent
Hispanic Median HH
Income Percent Below
Poverty Tract 72.01, BG 1 11 5 $30,778 10 Tract 72.01, BG 2 4 1 $50,938 6 Tract 72.02, BG 1 24 1 $49,256 9 City of Portland 22 7 $40,146 13 City of Vancouver 16 6 $41,618 12
*Data is according to current census data Under most Alternative Packages, the majority of residential displacements would occur in Census Tract 72.01, Block Group 1 (north side of Oregon Slough). The interchanges at Marine Drive and on Hayden Island will affect how many floating homes may be displaced. A more complex interchange at Marine Drive widens the structures over the Oregon Slough, impacting additional floating homes. Removing an I-5 interchange on Hayden Island necessitates an arterial crossing over the Oregon Slough, which would displace floating homes. Total displacements would be approximately 0 to 15 for the Roadways South options. Residential acquisitions and displacements do not cluster in areas with notable low-income and/or minority populations.
Other (Bike/Ped, Freight, TSM/TDM, Tolling)

Evaluation of Component Packages – FORM A Page 27
Criterion Performance Criterion 7.2 – Provide for equitable distribution of benefits to low income and minority populations (Part of Value 7 – Distribution of Benefits and Impacts)
Performance Measure(s) • 7.2.1 Which block groups experience improved access to the freeway, downtown, or other resources? • 7.2.2 Which block groups experience the greatest improvements in transit service?
Best Performing Package(s) and/or Component(s) • The Supplemental and Replacement bridge options offer similar access improvements. The exception would be
Supplemental Bridge options that do not include an interchange on Hayden Island (packages 3, 4 and 5) would provide poorer access to jobs, housing and retail businesses, and poorer access by Hayden Island residents to other locations.
• Transit options that provide either LRT or BRT, combined with Express Bus, offer the greatest improvements in transit service to all populations. There is no notable difference in the distribution of benefits.
Key Findings
River Crossing The Replacement bridge options and some of the Supplemental Bridge options (packages 6 and 7) offer similar access improvements to a wide range of populations. Supplemental Bridge options with no Hayden Island interchange (packages 3, 4, and 5) would remove the existing I-5 interchange on Hayden Island. This would provide poorer access to jobs, housing and retail businesses on the island, and poorer access by Hayden Island residents to jobs, housing and other destinations off the island. It is unclear whether this would differentially affect low income or minority populations. The Replacement bridges provide the greatest benefit to transit service. The Supplemental Bridge options placing LRT or BRT on the existing bridges (Alternative Packages 4, 5, and 6) provide substantially less reliable service than on the new, fixed span bridge. Bridge lifts cause transit service interruptions, increase travel time and reduce reliability. Currently, a bridge lift causes at least 17 minutes of delay to transit vehicles trying to cross the river during the lift period. This delay would have substantial impacts to BRT and even more so to LRT because it would cause system-wide schedule disruptions. Placing auto users on the new fixed span bridge and transit users on the older lift span bridge could have transportation equity implications. Analysis of the demographics of transit users and auto users would be required to evaluate the effect on the distribution of benefits.
Transit
Transit options that provide either LRT or BRT, combined with Express Bus, offer the greatest improvements in transit service to all populations. Analysis of the demographics of transit users and auto users would be required to evaluate the effect on the distribution of benefits.
Roadways North and Roadways South
Other (Bike/Ped, Freight, TSM/TDM, Tolling)

Evaluation of Component Packages – FORM A Page 28
Criterion Performance Criterion 8.1 – Minimize the cost of construction (Part of Value 8– Cost Effectiveness and Financial Resources)
Performance Measure(s) • Estimated total capital costs for each alternative package.
Best Performing Package(s) and/or Component(s) • Information pending for river crossing options. • Using national averages, Express Bus and BRT have the lowest capital costs.
Key Findings
River Crossing Information pending.
Transit Until the CRC transit capital cost estimates are developed, the project is reporting the national average capital cost ranges (cost per mile in 2006 dollars) per mode. All costs include some measure of right-of-way acquisitions and percentage additions for environmental mitigation, erosion control, mobilization, traffic control during construction, unmeasured items, preliminary studies and engineering, contractor’s cost, and construction management owners cost. The high end of the cost range for BRT reflects the cost to build a BRT guideway so that it could be more readily converted to LRT in the future (“rail ready”). Per-Mile Transit Capital Costs
LRT BRT BRT-Lite Express BusLow $60 million $25 million $20 million $10 millionHigh $120 million $110 million $40 million $30 million For LRT (included in Alternative Packages 3, 4, 8 and 9) on the representative HCT alignment, for the construction of an exclusive guideway from Kiggins Bowl to the Exposition Station, is 4.5 miles. For LRT the estimated capital cost range per mile is $60-$120 million. This estimate includes the cost to construct the trackway, trackway electrification and signalization, signal communication and substation buildings, trains, a maintenance facility, signage, structures over land, retaining walls, stations with full amenities, park-and-ride structures and surface spaces, bus transfer stations, utility relocations, full streetscape rebuild on city streets, traffic signal changes, environmental mitigation, and connecting roadways and pedestrian facilities where needed. For BRT (Alternative Package 5 and 10) the representative HCT alignment for the construction of an exclusive guideway is 5 miles; the additional alignment length for BRT is because the guideway would connect farther south to the Delta Park/PIR station. For BRT the estimated capital cost range per mile is $25-110 million. BRT has similar costs to LRT, with the exception that BRT does not require electrification and signalization and the accompanying buildings, and the vehicle purchased would be buses instead of trains. In addition, the guideway for BRT is paved; it does not include tracks. Stations and amenities would be the same as LRT. A future conversion of BRT to LRT would place the total capital cost at least 25% higher than building LRT alone. The conversion costs would include removing the guideway paving and adding tracks, updating the HCT signaling system, re-mobilizing, creating temporary stations on adjoining roadways, buying two transit fleets and constructing new LRT maintenance facilities. The conversion would also disrupt transit service. For BRT-Lite (Alternative Packages 6 and 11) the estimated capital cost range per mile is $20-40 million. BRT-Lite travels in general purpose and managed lanes and so does not include the cost of a guideway; for downtown Vancouver BRT-Lite would include the cost to construct street signal changes or re-striping. BRT-Lite would also have smaller passenger stations with fewer amenities than LRT or BRT. BRT-Lite would require park-and-ride structures and surface spaces, similar to LRT and BRT, and it would require direct access ramps from park-and-rides. The costs for BRT-Lite would also include the vehicles and a maintenance facility.

Evaluation of Component Packages – FORM A Page 29
For express bus the estimated capital cost range per mile is $10-$30 million. In Alternative Packages 7 and 12 express bus provides the main transit service. The estimated capital cost range includes the construction of a maintenance facility, vehicle costs, signage changes to the Portland Transit Mall and bus bypass lanes on several I-5 on-ramps. With Alternative Packages 7 and 12 the capital cost for express bus service would also include the cost to construct the park-and-ride facilities. In Alternative Package 7, where express buses would operate in managed lanes the cost to construct a direct access ramp would also be included. Alternative Packages 3 and 8 combine express bus service is combined with LRT. With these Alternative Packages, in addition to the capital cost requirements for LRT, express bus service would require costs for the bus vehicles and a bus maintenance facility. This would be less than simply adding the Express Bus capital costs listed above to the LRT costs, due to existing complementary infrastructure.
Roadways North and Roadways South Information pending.
Other (Bike/Ped, Freight, TSM/TDM, Tolling) Information pending.

Evaluation of Component Packages – FORM A Page 30
FORM A: Criterion Performance Criterion 8.3 – Ensure transportation system maintenance and operation cost effectiveness (Part of Value 8– Cost Effectiveness and Financial Resources)
Performance Measure(s) • Facilities maintenance cost rates. • Total HCT and Transit System operating costs as defined by operating cost per vehicle mile traveled.
Best Performing Package(s) and/or Component(s) • Alternative Package 12 would have the lowest annual operating cost because it would include a replacement bridge
and express bus and local bus transit service only (no high capacity transit (HCT) service). • For an Alternative Package that would include HCT service, the lowest annual operating cost would be with
Alternative Package 9 that includes LRT and a replacement bridge. • A newly constructed bridge over the Columbia River would have much lower annual operating costs than the
existing I-5 bridges.
Key Findings
River Crossing Build alternatives that reuse the existing bridges (packages 3-7) have an estimated operation and maintenance (O&M) cost of approximately $3 million/year. Replacement alternatives would have an estimated O&M cost of $35,000/year. O&M costs for the existing bridges are estimated at $2.9 million per year. This includes the cost of staffing the lift structure (all day, every day) as well as annual maintenance of the structures. Also included is the annualized cost of capital improvements that would be necessary during the planning period (2035) such as re-painting and resurfacing the bridges. A newly constructed bridge over the Columbia River would have minimal O&M cost for the project design-life period (through 2035). Using the O&M costs of the I-205 Glenn Jackson Bridge as a representative example, the estimated annual cost to maintain a new bridge would be approximately $35,000 (in 2006 dollars).
Transit The transit annual operating costs were estimated using the total daily vehicle miles traveled (VMT) for the transit system. Each of the transit modes would have different operating costs, based on the frequency and route length. The operating cost estimates provide an order of magnitude estimate to compare the alternatives and are not intended to be final. LRT, BRT and BRT-Lite would operate approximately 352 days per year and would operate continuous for about 18 hours a day. An express bus system would primarily operate only during the AM and PM peak periods and only on weekdays (approximately 255 days out of the year). The LRT service proposed with the CRC project is an extension of the TriMet Yellow Line from the existing Exposition LRT station to Kiggins Bowl. In essence, much of the cost of operating the Yellow line to the Exposition Station is already funded by TriMet. Because what the CRC project proposes is a shorter length the total daily VMT proposed with the CRC project is less for LRT; 1,453 daily VMT for LRT plus 2,818 daily VMT for express/local buses for a total daily VMT of 4,271. With LRT only (Alternative Packages 4 and 9) the annual operating cost is estimated to be $5.1 million for LRT and $3.6 million for a supporting express/local bus service, for a total of $8.7 million. When LRT is combined with express bus service, as it is in Alternative Packages 3 and 8, the total daily VMT would increase to 5,791 (1,453 daily VMT for LRT and 4,338 for express/local buses). The annual transit operating cost would increase to $10.6 million with an estimated annual cost for the bus service of $5.5 million (the annual operating cost for the LRT service remains at $5.1 million). The BRT service proposed with the CRC project would operate from Kiggins Bowl to downtown Portland. BRT (Alternative Packages 5 and 10) does not have an existing funded line segment in Portland. For BRT the estimated annual operating cost is a total of $13.3 million ($9.7 million for BRT and $3.6 million for express/local bus service). The daily VMT for BRT would be 2,543 miles and 2,818 miles for express/local buses for a total transit daily VMT of 5,361 miles. BRT-Lite (Alternative Packages 6 and 11) would have the highest estimated total annual transit operating cost, with an estimated cost of $17 million to operate the BRT-Lite system and $1.7 million to operate the local buses, for a total

Evaluation of Component Packages – FORM A Page 31
annual operating cost of $18.7 million. BRT-Lite has a higher annual operating cost because the service proposed with the CRC project would extend north to 219th Street, whereas in the other HCT modes service ends at Kiggins Bowl, and as a result the daily VMT would be higher. For BRT-Lite the daily VMT would be 4,824 miles plus an additional 1,350 miles for express/local buses for a total of 6,174 miles. Although BRT-Lite travels farther north in the I-5 corridor to provide greater coverage, the peak period mode split for transit is less than LRT or BRT which both end service at Kiggins Bowl. See criterion 2.5 for further details. Alternative Packages 7 and 12 use only express buses and local buses to serve the I-5 transit market. Express buses would have relatively low annual operating costs since an express bus system would primarily operate only during the AM and PM peak periods and only on weekdays (approximately 255 days out of the year). The total daily VMT would be 5,456 miles and the estimated annual operating cost would be $7 million. The figure below presents the annual operating cost in 2006 dollars divided by the amount of transit capacity provided (or seats in buses and trains). Overall, annual operating cost per annual transit seat varies substantially across the modes. Express bus alternatives have moderate operating costs per seat due to their AM and PM peak period operation and lower bus capacity. The BRT and BRT-Lite alternatives have higher operating costs per seat, reflecting a full, all day operation between downtown Portland and Kiggins Bowl. The LRT alternatives have lower operating costs per seat due to the large LRT train capacity and the already funded Yellow Line in Portland.
Annual Operating Costs per Annual Transit Seat (2006$)
$0.67
$1.37
$1.92
$0.33 $0.35
$0.00
$0.50
$1.00
$1.50
$2.00
Express Bus BRT BRT-Lite LRT LRT and Express Bus
In D
ollar
s
Roadways North and Roadways South The O&M costs for I-5 and other structures associated with roadways north and south of the Columbia River are similar for all of the build alternatives (Alternative Packages 3 through 12). In addition, both Oregon and Washington have an annual maintenance program to cover the cost to maintain the highway; therefore, the cost difference to maintain a new highway compared to the existing highway would be minimal.
Other (Bike/Ped, Freight, TSM/TDM, Tolling)

Page 25
Criterion Performance Criterion 9.1 – Support adopted regional growth management and comprehensive plans (Part of Value 9– Bi-State Cooperation)
Performance Measure(s) • Does the package support/ uphold principles of multi-modalism and compact growth? • Which package options are included in the RTP and MTP, project lists, and modeling? • Is the package consistent with other plan policies in regional plans listed in the land use MDR?
Best Performing Package(s) and/or Component(s) • Alternatives with LRT are most consistent with regional plans. HCT, and specifically LRT, is included in regional
plans, such as the Bi-State Trade and Transportation Study. • Packages that include a balance of transit and highway improvements are generally more likely to support multi-
modalism and compact growth (Alternative Packages 3, 4, 8, and 9). • Medium performing packages include Alternative Packages 5, 6, 10, and 11 (HCT). • Low performing packages include Alternative Packages 1, 2, 7, and 12 (no HCT mode/stations).
Key Findings
River Crossing River crossings that require less ROW acquisitions on Hayden Island and in downtown Vancouver will better support regional economic development goals. The supplemental arterial bridge appears to have the least impacts to downtown Vancouver. The replacement bridge options provide the most reliable LRT service and are therefore more supportive of regional plans and policies that call for improved HCT service.
Transit Components with Express Bus fail to provide HCT as explicitly called for in regional plans. Only the LRT component is consistent with plan policies that speak to the regional transit network and with the recommendations of the Bi-State Trade and Transportation Study which are referenced in numerous plans (including the Regional Transportation Council’s Metropolitan Transportation Plan and Metro’s Regional Transportation Plan.)
Roadways North and Roadways South There is no discernable difference between packages for this criterion.
Other (Bike/Ped, Freight, TSM/TDM, Tolling)

Welcome and Announcements
Welcome and Announcements
CRC Task ForceNovember 29, 2006

Public CommentPublic CommentCRC Task Force
November 29, 2006

Major Trends and Traffic PerformanceMajor Trends and
Traffic PerformanceCRC Task Force
November 29, 2006

Major Trends
• Population
• Employment
• Historic traffic growth
• Trip origins and destinations using Interstate Bridge
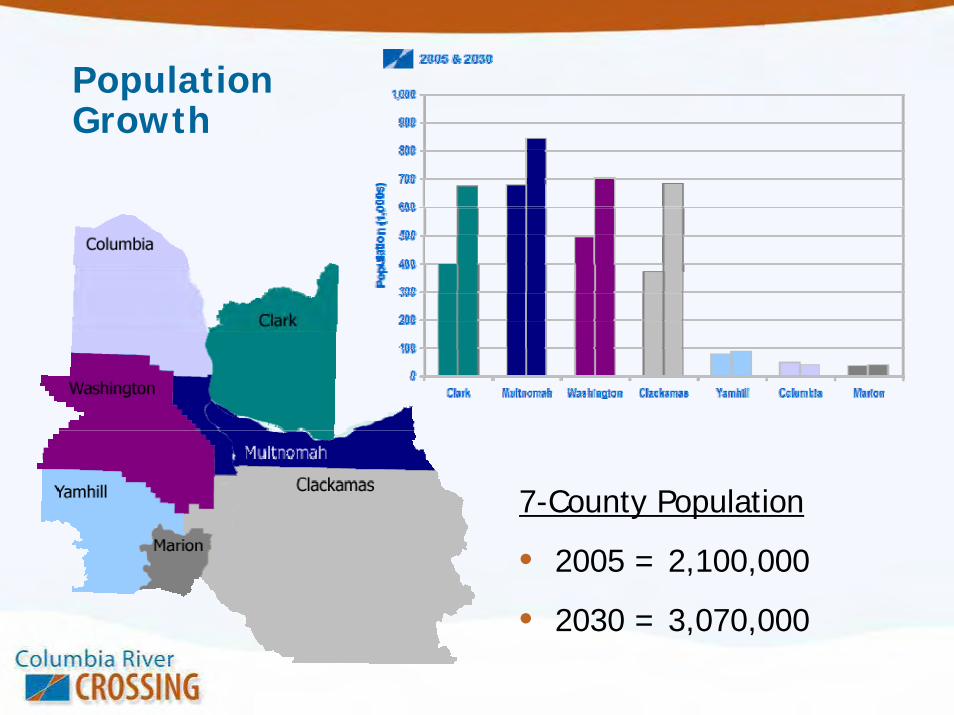
Population Growth
7-County Population
• 2005 = 2,100,000
• 2030 = 3,070,000
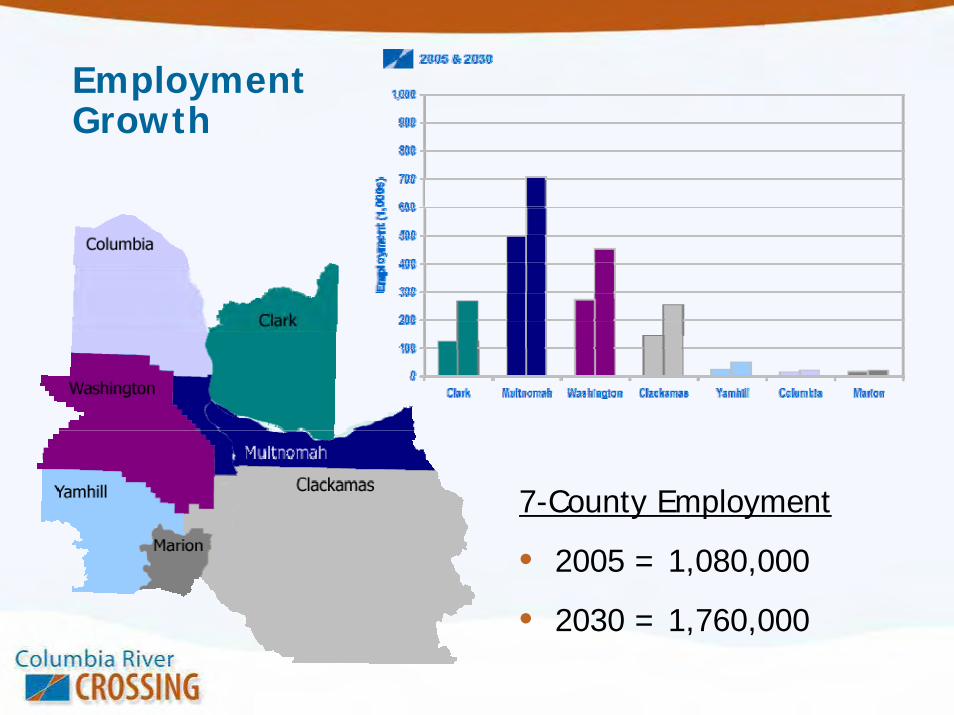
Employment Growth
7-County Employment
• 2005 = 1,080,000
• 2030 = 1,760,000

I-5 Traffic Growth at Interstate Bridge
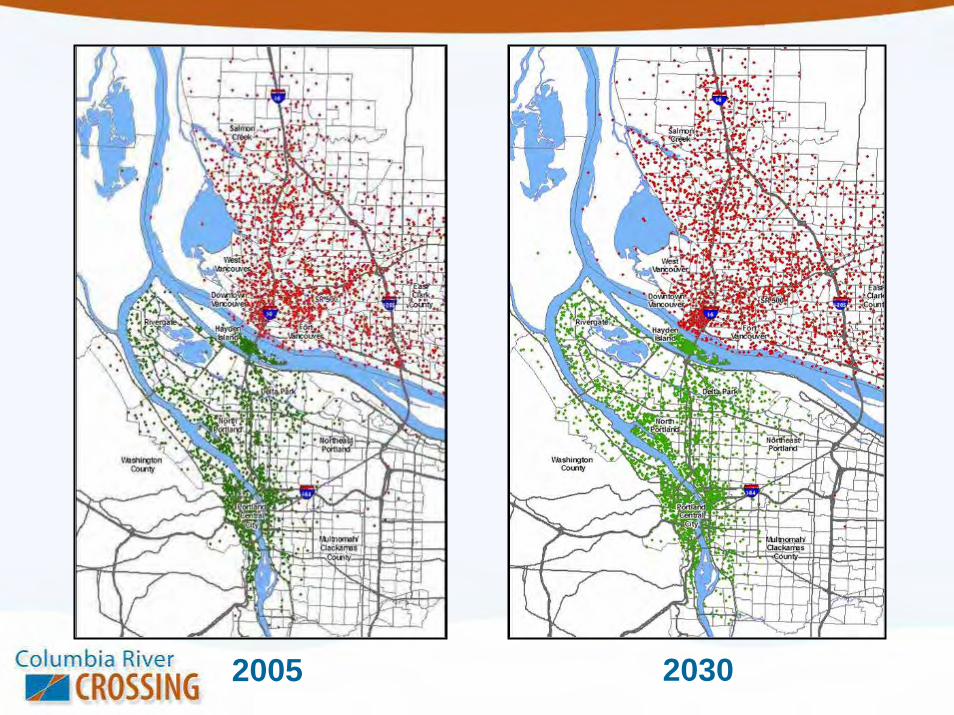
2005 2030
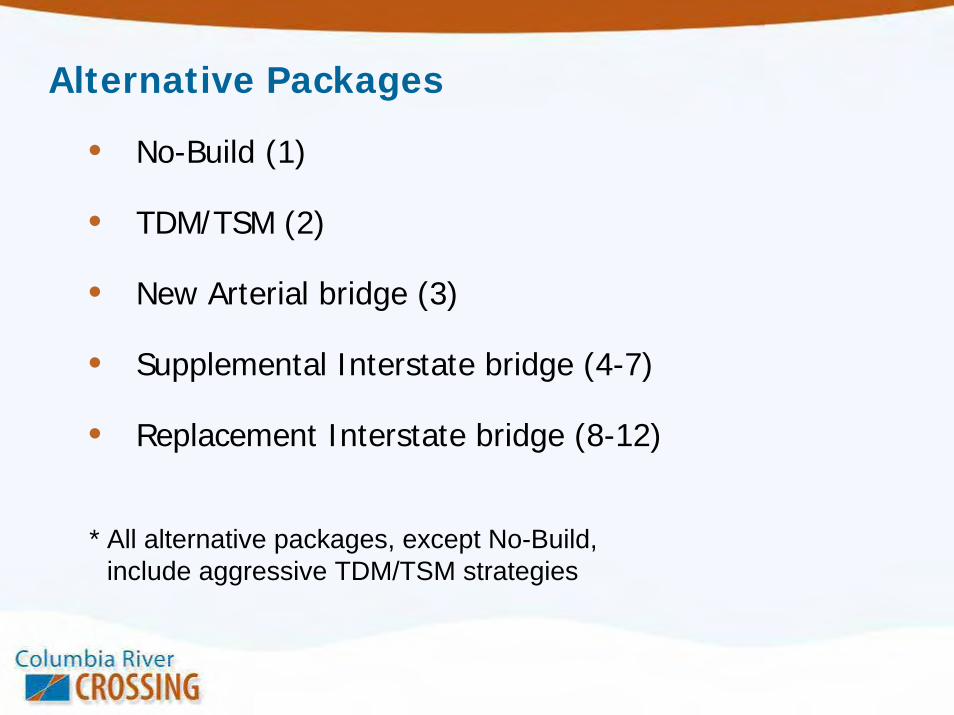
Alternative Packages
• No-Build (1)
• TDM/TSM (2)
• New Arterial bridge (3)
• Supplemental Interstate bridge (4-7)
• Replacement Interstate bridge (8-12)
* All alternative packages, except No-Build, include aggressive TDM/TSM strategies
Criteria Related to Traffic Performance
• Person throughput
• Vehicle throughput
• Truck throughput
• Traffic congestion
• Safety and collisions
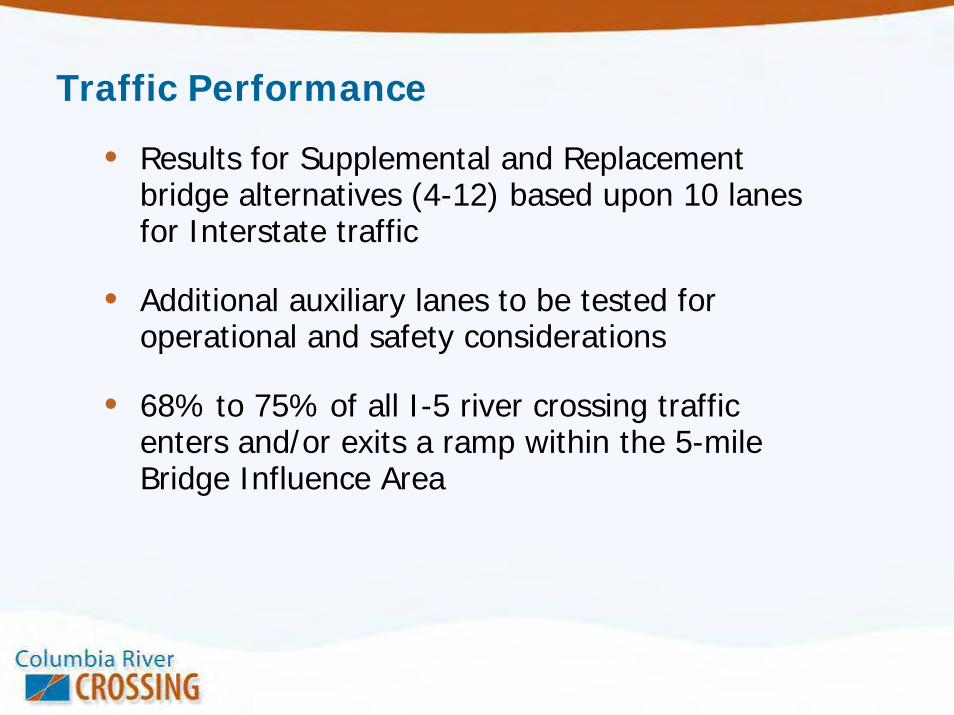
Traffic Performance
• Results for Supplemental and Replacement bridge alternatives (4-12) based upon 10 lanes for Interstate traffic
• Additional auxiliary lanes to be tested for operational and safety considerations
• 68% to 75% of all I-5 river crossing traffic enters and/or exits a ramp within the 5-mile Bridge Influence Area

Person ThroughputCriterion 2.5
Person Throughput in Vehicles on I-5 Bridge (Year 2030*)
24,60025,90026,300
32,20029,800
31,200
22,90025,700
38,50036,600
25,300 25,000 25,300
33,700
0
5,000
10,000
15,000
20,000
25,000
30,000
35,000
40,000
45,000
Existing(2005)
No-Build TDM/TSM New Arterial SupplementalInterstate w/
Hayden Island IC
SupplementalInterstate w/o
Hayden Island IC
Replacement Bridge
Peak
4-H
our P
erso
n Th
roug
hput
Southbound AM Northbound PM
*Except for Existing Conditions (Year 2005)

Vehicle ThroughputCriterion 2.6
Vehicle Throughput on I-5 Bridge (Year 2030*)
26,80024,800
26,000
19,10021,40021,900 21,60021,100 20,800 21,100
28,100
20,500
30,50032,100
0
5,000
10,000
15,000
20,000
25,000
30,000
35,000
Existing(2005)
No-Build TDM/TSM New Arterial SupplementalInterstate w/
Hayden Island IC
SupplementalInterstate w/o
Hayden Island IC
Replacement Bridge
Peak
4-H
our V
ehic
le T
hrou
ghpu
t
Southbound AM Northbound PM
*Except for Existing Conditions (Year 2005)

Truck ThroughputCriterion 5.4
Truck Throughput on I-5 Bridge (Year 2030*)
1,025
900
1,250 1,2251,275
1,025 1,025 1,025
725725725700
1,075 1,100
0
200
400
600
800
1,000
1,200
1,400
Existing(2005)
No-Build TDM/TSM New Arterial SupplementalInterstate w/
Hayden Island IC
SupplementalInterstate w/o
Hayden Island IC
Replacement Bridge
Peak
4-H
our T
ruck
Thr
ough
put
Southbound AM Northbound PM
*Except for Existing Conditions (Year 2005)

Duration of CongestionCriterion 2.3

Duration of Congestion – NorthboundCriterion 2.3
Northbound I-5 Daily Highway Congestion at I-5 Bridge (Year 2030*)
1.25 hrs
1.5 hrs
1.5 hrs
7.25 hrs
7.75 hrs
0-2 hrs
0-2 hrs
0-2 hrs
7.5 hrs
4 hrs
5:00 AM 6:00 AM 7:00 AM 8:00 AM 9:00 AM 10:00 AM 11:00 AM 12:00 PM 1:00 PM 2:00 PM 3:00 PM 4:00 PM 5:00 PM 6:00 PM 7:00 PM 8:00 PM 9:00 PM
Existing (2005)
No-Build
TDM/TSM
New Arterial
Supplemental Interstate w/ Hayden Island IC
Supplemental Interstate w/o Hayden Island IC
Replacement Bridge
Congested Hours (Travel Speed < 30 mph)
*Except for Existing Conditions (Year 2005)

Duration of Congestion – SouthboundCriterion 2.3
Southbound I-5 Daily Highway Congestion at the I-5 Bridge (Year 2030*)
0.75
0.75
0.75
4.75 hrs
6.25 hrs
2 hrs
6 hrs
5.5 hrs
4.5 hrs
4.5 hrs
5:00 AM 6:00 AM 7:00 AM 8:00 AM 9:00 AM 10:00 AM 11:00 AM 12:00 PM 1:00 PM 2:00 PM 3:00 PM 4:00 PM 5:00 PM 6:00 PM 7:00 PM 8:00 PM 9:00 PM
Existing (2005)
No-Build
TDM/TSM
New Arterial
Supplemental Interstate w/ Hayden Island IC
Supplemental Interstate w/o Hayden Island IC
Replacement Bridge
Congested Hours (Travel Speed < 30 mph)
*Except for Existing Conditions (Year 2005)

Vehicle Travel Times – NorthboundCriterion 2.1
Northbound I-5 Travel Times (Year 2030*)
1214 14 13
9 9 9
50 4946
30 30 30
38
0
10
20
30
40
50
60
Existing(2005)
No-Build TDM/TSM New Arterial SupplementalInterstate w/
Hayden Island IC
SupplementalInterstate w/o
Hayden Island IC
ReplacementBridge
2-H
our P
M P
eak
Ave
rage
Tra
vel T
ime
(min
)
Columbia Boulevard to SR-500 I-84 to 179th Street
*Except for Existing Conditions (Year 2005)

Vehicle Travel Times – SouthboundCriterion 2.1
Southbound I-5 Travel Times (Year 2030*)
1619 19 18
49
19+19+19+
44434446
31
48
0
10
20
30
40
50
60
Existing(2005)
No-Build TDM/TSM New Arterial SupplementalInterstate w/
Hayden Island IC
SupplementalInterstate w/o
Hayden Island IC
Replacement Bridge
2-H
our A
M P
eak
Ave
rage
Tra
vel T
ime
(min
)
SR-500 to Columbia Boulevard 179th Street to I-84
*Except for Existing Conditions (Year 2005)

Vehicle and Freight SafetyCriterion 4.1
• Over 2,200 reported crashes on I-5 mainline and ramps within Bridge Influence Area in last 5 years
• Average of 1.21 reported crashes per day
• Crash rate is over twice as high as average for similar urban city interstate freeways

Vehicle and Freight SafetyCriterion 4.1
• There is a strong correlation between existing non-standard features and frequency and type of collisions
• Crashes generally proportional to traffic volumes except during periods of congestion when number of crashes appear to increase two-fold by comparison
• From 3 to 5 time more collisions occur on I-5 approaching the bridge during bridge lifts/traffic stops compared to when lifts/stops do not occur
Vehicle and Freight SafetyCriterion 4.1
• Under No-Build, TDM/TSM and the New Arterial alternatives, crashes would be expected to increase up to 70% over existing conditions due to continued presence of non-standard features and increased traffic congestion
• Under these options, bridge lifts would continue, further affecting vehicle and freight safety

Major Trends and Traffic PerformanceMajor Trends and
Traffic PerformanceCRC Task Force
November 29, 2006

Major Trends
• Population
• Employment
• Historic traffic growth
• Trip origins and destinations using Interstate Bridge

Population Growth
7-County Population
• 2005 = 2,100,000
• 2030 = 3,070,000

Employment Growth
7-County Employment
• 2005 = 1,080,000
• 2030 = 1,760,000

I-5 Traffic Growth at Interstate Bridge

2005 2030

Alternative Packages
• No-Build (1)
• TDM/TSM (2)
• New Arterial bridge (3)
• Supplemental Interstate bridge (4-7)
• Replacement Interstate bridge (8-12)
* All alternative packages, except No-Build, include aggressive TDM/TSM strategies

Criteria Related to Traffic Performance
• Person throughput
• Vehicle throughput
• Truck throughput
• Traffic congestion
• Safety and collisions

Traffic Performance
• Results for Supplemental and Replacement bridge alternatives (4-12) based upon 10 lanes for Interstate traffic
• Additional auxiliary lanes to be tested for operational and safety considerations
• 68% to 75% of all I-5 river crossing traffic enters and/or exits a ramp within the 5-mile Bridge Influence Area

Person ThroughputCriterion 2.5
Person Throughput in Vehicles on I-5 Bridge (Year 2030*)
24,60025,90026,300
32,20029,800
31,200
22,90025,700
38,50036,600
25,300 25,000 25,300
33,700
0
5,000
10,000
15,000
20,000
25,000
30,000
35,000
40,000
45,000
Existing(2005)
No-Build TDM/TSM New Arterial SupplementalInterstate w/
Hayden Island IC
SupplementalInterstate w/o
Hayden Island IC
Replacement Bridge
Peak
4-H
our P
erso
n Th
roug
hput
Southbound AM Northbound PM
*Except for Existing Conditions (Year 2005)

Vehicle ThroughputCriterion 2.6
Vehicle Throughput on I-5 Bridge (Year 2030*)
26,80024,800
26,000
19,10021,40021,900 21,60021,100 20,800 21,100
28,100
20,500
30,50032,100
0
5,000
10,000
15,000
20,000
25,000
30,000
35,000
Existing(2005)
No-Build TDM/TSM New Arterial SupplementalInterstate w/
Hayden Island IC
SupplementalInterstate w/o
Hayden Island IC
Replacement Bridge
Peak
4-H
our V
ehic
le T
hrou
ghpu
t
Southbound AM Northbound PM
*Except for Existing Conditions (Year 2005)

Truck ThroughputCriterion 5.4
Truck Throughput on I-5 Bridge (Year 2030*)
1,025
900
1,250 1,2251,275
1,025 1,025 1,025
725725725700
1,075 1,100
0
200
400
600
800
1,000
1,200
1,400
Existing(2005)
No-Build TDM/TSM New Arterial SupplementalInterstate w/
Hayden Island IC
SupplementalInterstate w/o
Hayden Island IC
Replacement Bridge
Peak
4-H
our T
ruck
Thr
ough
put
Southbound AM Northbound PM
*Except for Existing Conditions (Year 2005)

Duration of CongestionCriterion 2.3

Duration of Congestion – NorthboundCriterion 2.3
Northbound I-5 Daily Highway Congestion at I-5 Bridge (Year 2030*)
1.25 hrs
1.5 hrs
1.5 hrs
7.25 hrs
7.75 hrs
0-2 hrs
0-2 hrs
0-2 hrs
7.5 hrs
4 hrs
5:00 AM 6:00 AM 7:00 AM 8:00 AM 9:00 AM 10:00 AM 11:00 AM 12:00 PM 1:00 PM 2:00 PM 3:00 PM 4:00 PM 5:00 PM 6:00 PM 7:00 PM 8:00 PM 9:00 PM
Existing (2005)
No-Build
TDM/TSM
New Arterial
Supplemental Interstate w/ Hayden Island IC
Supplemental Interstate w/o Hayden Island IC
Replacement Bridge
Congested Hours (Travel Speed < 30 mph)
*Except for Existing Conditions (Year 2005)

Duration of Congestion – SouthboundCriterion 2.3
Southbound I-5 Daily Highway Congestion at the I-5 Bridge (Year 2030*)
0.75
0.75
0.75
4.75 hrs
6.25 hrs
2 hrs
6 hrs
5.5 hrs
4.5 hrs
4.5 hrs
5:00 AM 6:00 AM 7:00 AM 8:00 AM 9:00 AM 10:00 AM 11:00 AM 12:00 PM 1:00 PM 2:00 PM 3:00 PM 4:00 PM 5:00 PM 6:00 PM 7:00 PM 8:00 PM 9:00 PM
Existing (2005)
No-Build
TDM/TSM
New Arterial
Supplemental Interstate w/ Hayden Island IC
Supplemental Interstate w/o Hayden Island IC
Replacement Bridge
Congested Hours (Travel Speed < 30 mph)
*Except for Existing Conditions (Year 2005)

Vehicle Travel Times – NorthboundCriterion 2.1
Northbound I-5 Travel Times (Year 2030*)
1214 14 13
9 9 9
50 4946
30 30 30
38
0
10
20
30
40
50
60
Existing(2005)
No-Build TDM/TSM New Arterial SupplementalInterstate w/
Hayden Island IC
SupplementalInterstate w/o
Hayden Island IC
ReplacementBridge
2-H
our P
M P
eak
Ave
rage
Tra
vel T
ime
(min
)
Columbia Boulevard to SR-500 I-84 to 179th Street
*Except for Existing Conditions (Year 2005)

Vehicle Travel Times – SouthboundCriterion 2.1
Southbound I-5 Travel Times (Year 2030*)
1619 19 18
49
19+19+19+
44434446
31
48
0
10
20
30
40
50
60
Existing(2005)
No-Build TDM/TSM New Arterial SupplementalInterstate w/
Hayden Island IC
SupplementalInterstate w/o
Hayden Island IC
Replacement Bridge
2-H
our A
M P
eak
Ave
rage
Tra
vel T
ime
(min
)
SR-500 to Columbia Boulevard 179th Street to I-84
*Except for Existing Conditions (Year 2005)

Vehicle and Freight SafetyCriterion 4.1
• Over 2,200 reported crashes on I-5 mainline and ramps within Bridge Influence Area in last 5 years
• Average of 1.21 reported crashes per day
• Crash rate is over twice as high as average for similar urban city interstate freeways

Vehicle and Freight SafetyCriterion 4.1
• There is a strong correlation between existing non-standard features and frequency and type of collisions
• Crashes generally proportional to traffic volumes except during periods of congestion when number of crashes appear to increase two-fold by comparison
• From 3 to 5 times more collisions occur on I-5 approaching the bridge during bridge lifts/traffic stops compared to when lifts/stops do not occur

Vehicle and Freight SafetyCriterion 4.1
• Under No-Build, TDM/TSM and the New Arterial alternatives, crashes would be expected to increase up to 70% over existing conditions due to continued presence of non-standard features and increased traffic congestion
• Under these options, bridge lifts would continue, further affecting vehicle and freight safety

Transit RecommendationsTransit Recommendations
CRC Task ForceNovember 29, 2006

Today’s Presentation
• Recommended Alternatives for the DEIS
• Evaluation and Lessons Learned Regarding:
– Markets
– Reliability
– Operations
– Connectivity
• Next Steps

Evaluation Criteria
• Analysis structured around CRC Evaluation Framework
– Derived from Task Force Vision and Values Statement
• Performance measures included:
– Transit markets – Criterion 2.5
– Travel speeds – Criterion 3.1
– Capital and operating costs – Criteria 8.1 and 8.3
– Others

Summary of Findings
• HCT alternatives increased transit use significantly over the 2030 No-Build
• HCT and Express Buses are needed to serve forecasted transit markets
• Strong 2030 transit market for reliable, fast, frequent and more accessible transit service
• Delays associated with lift spans degrade transit reliability
• HCT modes in exclusive guideways increase reliability and decrease delay
• Substantial cost differences between the modes
• Remaining transit modes can be optimized for better performance

Transit Modes Evaluated
• TR-1: Express buses in I-5 general purpose lanes
• TR-2: Express buses in I-5 managed lanes
• TR-3: Bus Rapid Transit LITE (BRT-LITE)
• TR-4: Bus Rapid Transit (BRT)
• TR-5: Light Rail Transit (LRT)

Recommendations
• DEIS Alternative # 1
– Bus Rapid Transitwith complementary express bus service.
• DEIS Alternative # 2
– Light Rail Transitwith complementary express bus service.
HCT Mode + Express Bus
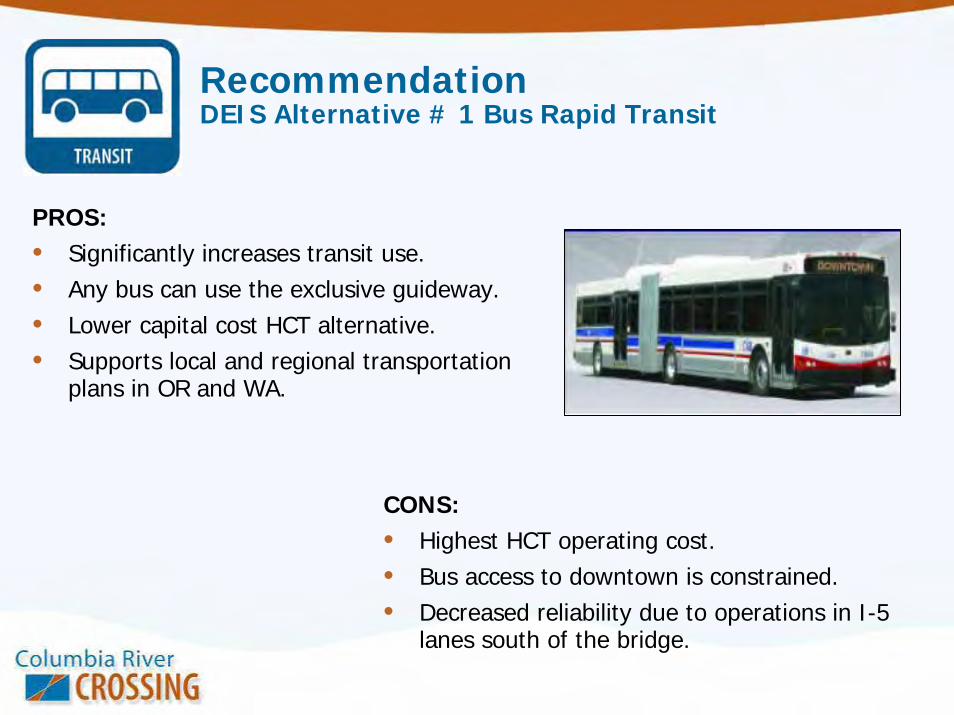
RecommendationDEIS Alternative # 1 Bus Rapid Transit
PROS:• Significantly increases transit use.• Any bus can use the exclusive guideway.• Lower capital cost HCT alternative.• Supports local and regional transportation
plans in OR and WA.
CONS:• Highest HCT operating cost.• Bus access to downtown is constrained.• Decreased reliability due to operations in I-5
lanes south of the bridge.

RecommendationDEIS Alternative # 2 Light Rail Transit
PROS:• Significantly increases transit use.• Highest passenger capacity.• Highest travel time reliability.• Takes advantage of existing LRT
infrastructure.• One-seat ride from Vancouver to Portland.• Lowest HCT operating cost.• Best supports local and regional plans.
CONS:• Highest capital cost of HCT
alternates.• Less flexibility than bus modes.

Lessons LearnedTransit Markets
• Inner Urban Market (Red)
• Suburban Commuter Market (Yellow)
• Maximum coverage and transit market share when HCT modes are paired with Express Buses
Suburban Commuter
Inner Urban
Inner Urban
Greater Downtown Portland
Criterion 2.5

I-5(19%)
I-205(17%)
(37%)
(8%) (19%)
Suburban Commuter Market
(36%)
Inner Urban Market(64%)
Lessons LearnedTransit Markets
Source: CRC Park-and-Ride Study 2006, C-TRAN Origin and Destination Study May 2006, TriMet #6 APC Average Daily Rider Census October 2005
Criterion 2.5

Lessons LearnedTransit Reliability
• Schedule reliability is one of the most important transit attributes.
Source: CRC On-Board Survey October 2006 N=860Source: C-TRAN On-Board Survey October 2006 N=535
Inner Urban Market - Top Four Public Transit Attributes
4.5
4.34.4
4.3
4.0
4.1
4.2
4.3
4.4
4.5
4.6
4.7
4.8
4.9
5.0
Schedule Reliability On-Time Arrival Frequent Service Personal Safety
Attr
ibut
e Sc
ale
Suburban Market - Top Four Public Transit Attributes
4.6
4.4
4.6 4.6
4.0
4.1
4.2
4.3
4.4
4.5
4.6
4.7
4.8
4.9
5.0
Not Drive in CommuteTraffic
Express Service On-Time Arrival No Transfers
Attr
ibut
e Sc
ale

Public Input from Transit Survey
“I need a faster way than the #6 (TriMet) to get to downtown Portland and Vancouver.”
-Passenger comment from CRC on-board survey
“I would like this bus to be reliable. Almost never on-time—have to wait up to 20-45 minutes most days.”
-Passenger comment from CRC on-board survey
“Mass transit is a hard sell. If it’s not reliable – it’s worthless.”
-Passenger comment from CRC on-board survey
“I love the express bus. One time it was late and I drove – it ended up passing me on I-5 and I learned my lesson.”
-Passenger comment from CRC on-board survey

Lessons LearnedTransit Reliability
• Congestion, bridge lifts, and incident delay on a portion of a transit route can deteriorate reliability on the entire route.
• A bridge without a lift span would be beneficial.
Source: CRC Travel Time Study 2006
Value 3

Lessons LearnedTransit Reliability
Source: Metro’s Regional Travel Demand Model
Criterion 2.2
Transit Vehicle Hours of Delay (Year 2030)
3.54.9
21.4
5.4
13.0
9.3
0.0
5.0
10.0
15.0
20.0
25.0
No-Build Buses in GPLanes
Buses inManaged
Lanes
BRT Lite BRT LRT
Dai
ly P
M P
eak
Hou
rs o
f Del
ay

Lessons LearnedTransit Operations
• Vehicle passenger capacities are different
• Frequencies would be lower for LRT and higher for BRT and BRT-Lite.
– BRT at 4 minutes or less.
– LRT between 5 to 10 minutes.
Source: 80% of Maximum Vehicle Capacity
Transit Vehicle Passenger Capacities
5275
266
0
50
100
150
200
250
300
Standard Bus Articulated Bus LRT
Seat
ed a
nd S
tand
ing
Cap
acity
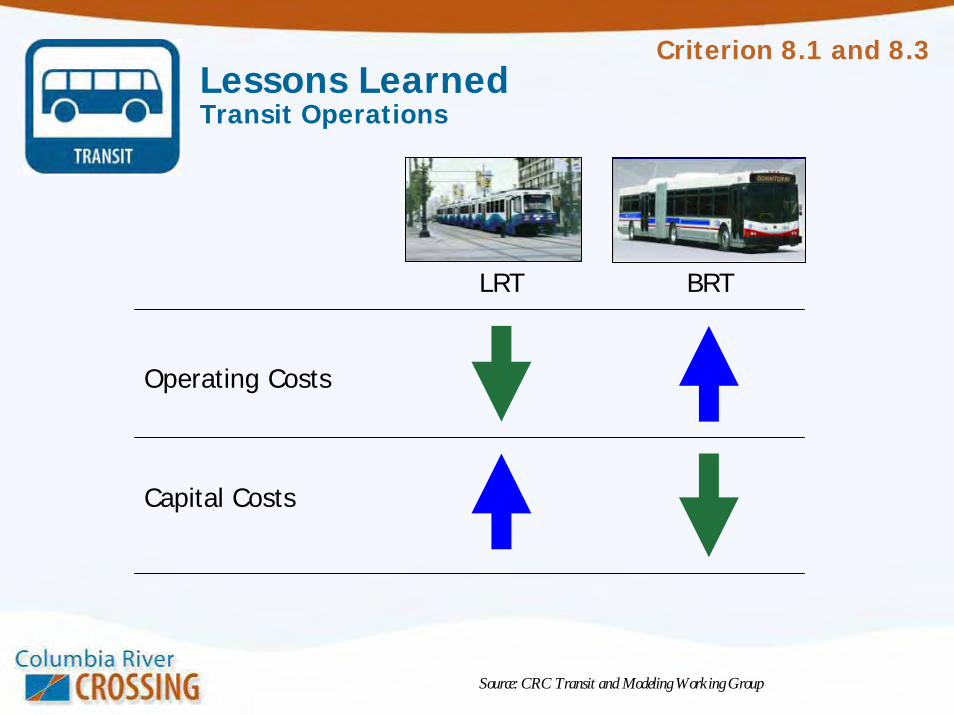
Lessons LearnedTransit Operations
Operating Costs
Capital Costs
Source: CRC Transit and Modeling Working Group
Criterion 8.1 and 8.3
LRT BRT
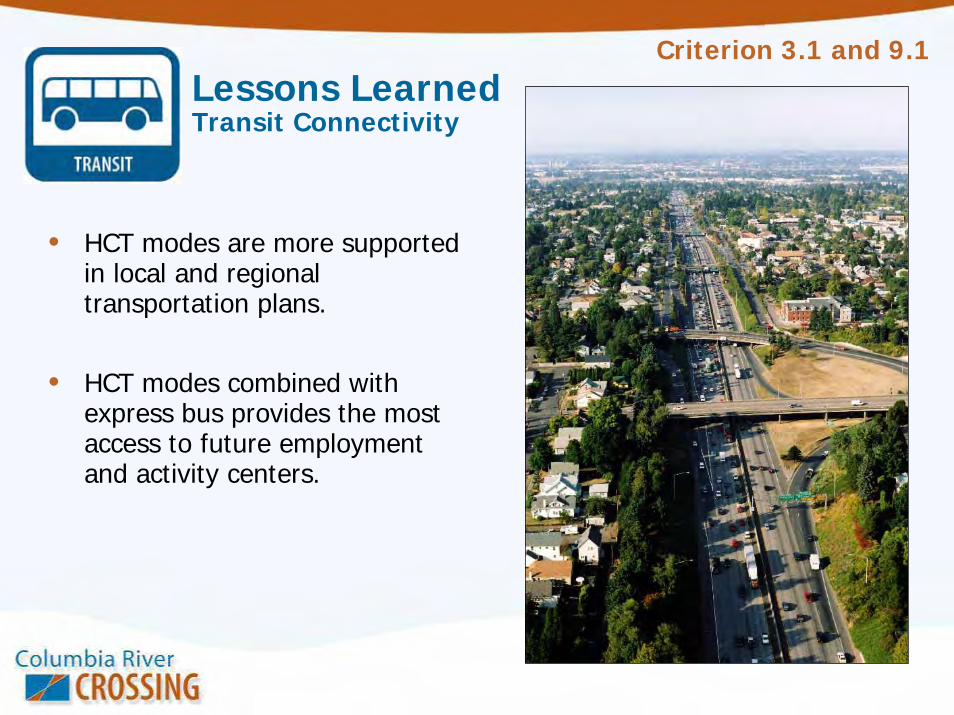
Lessons LearnedTransit Connectivity
• HCT modes are more supported in local and regional transportation plans.
• HCT modes combined with express bus provides the most access to future employment and activity centers.
Criterion 3.1 and 9.1

Recommendation Recap
• DEIS Alternative # 1
– Bus Rapid Transitwith complementary express bus service.
• DEIS Alternative # 2
– Light Rail Transitwith complementary express bus service.
HCT Mode + Express Bus

• Tie the BRT service to the Interstate MAX Line
• Avoid travel on I-5 and reduce operating costs
• Locate bus/rail transfer facility• Determine exclusive guideway
segments• Determine appropriate number of
buses to be accommodated in downtown PDX and VAN
DEIS Activities to Optimize BRT

• Better match LRT frequencies to passenger demand
• Confirm station locations• Optimize local bus and LRT
transfer locations• Evaluate alignment
alternatives• Select terminal location
DEIS Activities to Optimize LRT

• Work with local project sponsors to optimize alternatives.
• Obtain public input on alignments and station locations at:
– Open houses– Community Events– Neighborhood and Business Association Meetings– Project Sponsor Meetings
• Refine cost estimates.
• Optimize the supporting local and express bus networks.
• Evaluate alignment options and determine park and ride lot configuration.
DEIS Activities for Both Alternatives

River Crossing Recommendations
River Crossing Recommendations
CRC Task ForceNovember 29, 2006

River Crossing Concepts for Consideration
• Replacement Bridge Downstream Midlevel• Replacement Bridge Upstream Midlevel• Supplemental Bridge Downstream Midlevel• Arterial Crossing with I-5 Improvements

Arterial Crossing, Supplemental Downstream (Alt 3)
WashingtonOregon
(Hayden Island)

Supplemental Downstream (Alt’s 4, 5, 6, 7)
Oregon (Hayden Island) Washington

Replacement Downstream (Alt’s 8, 9, 11)

Replacement Upstream (Alt’s 10 & 12)
WashingtonOregon
(Hayden Island)

What we learned from the Performance Criteria
• I-5 Needs to be on a new structure.
• A parallel arterial bridge that leaves I-5 traffic on the existing I-5 Bridges doesn’t meet Purpose and Need.
• Replacement bridges work better than supplemental bridges in all cases.
• There is a compelling case to remove the existing bridges.

The case for a new I-5 Bridge
Existing bridges are obsolete for Interstate traffic
- They don’t meet current design standards- They can’t handle current and projected
traffic volumes- They aren’t safe- Transit and freight are stuck in traffic with
everyone else- Bridge lifts further impact congestion- They don’t meet current seismic
standards

I-5 Northbound Bridge Opened in 1917
Designed when 50% of US vehicles were Model T’s.
Built for horses, trolleys and cars.
Originally posted for speed of 15 mph – now 50 mph.
Re-striped for three lanes in each direction.
A1

Slide 72
A1 Administrator, 11/27/2006

Why a new arterial/transit bridge won’t work• Keeps I-5 traffic on the existing bridges
• Traffic demand across the river far exceeds the capacity of arterial bridges
• Clogs streets in downtown Vancouver, Hayden Island and impacts Marine Drive Interchange
• Freight movement is not improved
• Does not address the bridge lift problems
• Does not solve safety problems for I-5 and Marine Navigation


Alternative 3: 2030 4-Hour Volumes
26,1005,700
PM
4,900
AM
3,900
4,00026,700

Alternative 3: Impacts to Local Street Networks
Downtown Vancouver
Hayden Island
Marine Drive

Downtown Vancouver
C St
reet
Was
hing
ton M
ain
Colu
mbi
a
Broa
dway
Alternative 3: Downtown Vancouver Effects
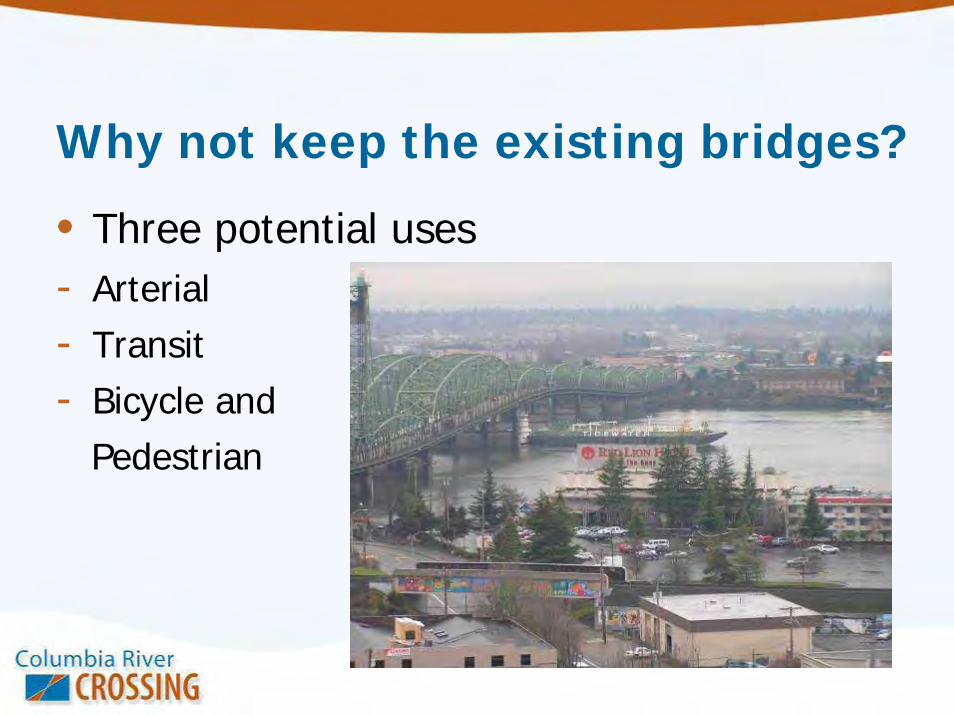
Why not keep the existing bridges?
• Three potential uses- Arterial- Transit- Bicycle and
Pedestrian

Arterial use of existing bridges• Arterial crossing lanes are less efficient than new I-5 lanes• Traffic congestion would increase in downtown Vancouver,
on Hayden Island, and in the vicinity of Marine Drive• Arterial traffic would be impacted by bridge lifts

Transit use on the existing bridges
• Potential need for costly seismic upgrades• Potential for unrestricted bridge lifts that would
disrupt service• HCT service would be inferior and more costly
compared to a new I-5 Bridge

Bicycle and pedestrian use
• A very expensive option that could be served as well on a new I-5 Bridge

River Navigation for Supplemental BridgePier Locations, Bridge and Barge Channels

Other impacts to keeping existing bridges
• Ownership is a significant consideration• M&O costs estimated at nearly $3 million a year
(excluding seismic upgrade costs)• Adverse land use and ROW impacts• Natural resource impacts
A Replacement Bridge• Accommodates all types of travel over the Columbia River- Provides a safe and efficient bridge for vehicles, freight,
public transit, bicycles and pedestrians- Can be built high enough to avoid the need for a lift span- Can be designed to avoid impacts to Pearson Air Park- Improves river navigation- Has fewer natural resource impacts- Has less land use/ROW impacts
Staff Recommended Range of AlternativesStaff Recommended
Range of Alternatives
Task ForceNovember 29, 2006

Staff Recommended Range of Alternatives to Carry Forward into the DEIS
• Alternative 1: No Action
• Alternative 2: Replacement Bridge and Bus Rapid Transit (BRT) with complementary express bus
• Alternative 3: Replacement Bridge and Light Rail Transit (LRT) with complementary express bus

Other Elements of the Build Alternatives
• HCT alignment and station area refinement
• Interchange designs linking to river crossing
• Freight features
• TDM/TSM measures
• Managed lanes
• Tolling
• Number of lanes
• Bridge type, alignment and appearance

Public Outreach and Involvement
Public Outreach and Involvement
Task ForceNovember 29, 2006

Public Participation• Bi-State Task Force • Community and Environmental
Justice Group• Discussions with
neighborhood, business and community groups
• Outreach to schools, low income and minority communities
• Web site, monthly e-news updates, education
• Since March, we’ve talked in person with over 3,726 people.

Public Discussion
Open HousesJanuary 17, 20075:30pm – 7:30pmBattleground January 20, 20079:30 a.m. - 1 p.m. Lincoln Elementary School, Vancouver January 25, 20074:30 p.m. - 7:30 p.m. OAME in Portland
Community EventsJanuary 18 - African American Community Unity Breakfast Listening sessions in Clark County and PortlandPresentations to neighborhood groups Agency briefings

Task ForceNovember 29, 2006
Overview of Budget and Schedule
Overview of Budget and Schedule

Project Development Schedule and Potential Federal Funding

CRC Planned Expenditures vs. Anticipated Funds(Funds Needed)

Columbia River Crossing Funding

Value Performance

Page 1
Value Performance
Value 1 – COMMUNITY LIVABILITY AND HUMAN RESOURCES
Best Performing Package(s) and/or Component(s) The alternatives with the least physical improvements (Alternative Packages 1 and 2) have the lowest direct impacts on existing community resources. However, these packages can do little to enhance access or livability, do not support the community’s future vision as expressed in local plans, and would do little to manage or address the impacts that future population and traffic growth will have on communities and livability. The diversity of objectives within this value provides no clear winning component or package. Current evaluations have yielded the following conclusions among the Build alternatives:
• LRT, and to a lesser extent BRT, supports local planning goals and provides potential to improve vitality and access to downtown Vancouver and Hayden Island. However, these transit modes require more direct impacts to residential and commercial properties and potentially to existing historic and archaeological resources because of their exclusive ROW.
• Replacement bridges and the new arterial bridge better support LRT or BRT, and generally require slightly less ROW through downtown Vancouver and Hayden Island. However, a replacement bridge would entail removal of the northbound bridge that is a historic resource.
• Upstream replacement bridges require complete removal of the Safeway on Hayden Island, while design refinements may allow other bridge options to avoid or minimize impacts to the only grocery store on the island.
Key Findings
River Crossing
Alternatives using a replacement bridge (Alternative Packages 8 – 12) would have a greater adverse effect on historic resources because they would remove the existing northbound bridge which is on the National Register of Historic Places. Alternatives using a supplemental bridge (Alternative Packages 3 - 7) would also impact this existing bridge due to seismic retrofits and design upgrades. Only No-Build alternatives would avoid impact to the existing bridge. Alternative Packages 4 - 12 would all impact the historic Apple Tree Park.
All of the Build alternatives (Alternative Packages 3 - 12) could affect the recreational trails crossing under them. Property acquisitions in the river crossing area (from SR 14 to Marine Drive) are a function of several factors, only one of which is the river crossing option itself. Interchange designs at SR 14, Hayden Island, and Marine Drive are a major factor. River crossings require the acquisition or relocation of approximately 5 to 15 houseboats. This range varies largely on whether HCT is present and on the interchange configurations at Marine Drive and on Hayden Island. Supplemental and replacement bridges in all Build alternatives require acquisition of at least portions of approximately 30 commercial parcels.
No neighborhoods will be bisected by new construction and no neighborhoods will lose more than 10 percent of their total area for construction. Upstream replacement bridges require complete acquisition of Safeway, the only grocery store on Hayden Island and a significant resource for the neighborhood. A downstream replacement bridge and supplemental interstate bridge may require partial or full acquisition of Safeway as well due to interchange improvements. Safeway could likely be relocated on Hayden Island.

Page 2
Transit Performance
LRT and BRT would have the greatest potential to affect unknown archaeological resources beneath downtown Vancouver roadways, as well as the locally-designated historic district, because they introduce a new transit ROW through Vancouver. They would also have the greatest opportunity to enhance this district.
LRT and BRT necessitate widening river crossings across the Oregon Slough which requires acquisition of approximately 5 additional houseboats for most bridge options.
LRT and BRT would affect up to 30 commercial properties, mostly partial acquisitions. BRT-Lite (Alternative Packages 5 and 11) affects fewer properties and Express Bus only (Alternative Packages 7 and 12) impacts no commercial properties.
None of the transit options would bisect neighborhoods or affect more than 10 percent of any neighborhood. LRT and BRT add high capacity transit to Vancouver and Hayden Island neighborhoods, helping to improve residents’ access to resources.
Alternative Packages with LRT or BRT meet local plans better than those with BRT-Lite or Express Bus only. LRT performs best on a replacement bridge, making Alternative Packages 8 and 9 appear to best meet local plans and uphold principles of multi-modalism.
Roadways North and South
Interchange configurations at SR 500 are the primary contributor to the limited range of residential acquisitions occurring from roadways north. Potential commercial property acquisitions from Roadways South options are smaller, ranging from 0 to 14 largely depending upon the interchange configuration on Hayden Island. Likewise, commercial acquisitions from Roadways North are also small, ranging from 5 to 15.
The SR 14 interchange is a key factor for effects on Fort Vancouver and on the Apple Tree Park. Impacts to these historic resources are largely determined by the design of this interchange. Designs seeking to minimize ROW requirements and include three levels of ramps would have less physical impacts but would cause visual impacts to Fort Vancouver. Conversely, interchange designs that expand outward and minimize vertical stacking of ramps could encroach further on Apple Tree Park and downtown Vancouver.
The interchanges at Marine Drive and on Hayden Island can affect the number of houseboats that would be acquired. A more extensive interchange at Marine Drive pushes the bridge over the Oregon Slough north slightly, impacting additional houseboats. Removing an I-5 interchange on Hayden Island, necessitates an arterial crossing over the Oregon Slough which would consume additional house boats.
Other (Bike/Ped, Freight, TSM/TDM, Tolling)

Value Performance
Value 2 – MOBILITY, RELIABILITY, ACCESSIBILITY, CONGESTION REDUCTION, AND EFFICIENCY
Best Performing Package(s) and/or Component(s) [Summarize your findings regarding the components and combination of components that perform best for this value.]
o Overall, alternative packages with a replacement bridge and LRT (packages 8 and 9) perform best for measures relating to mobility, reliability, accessibility, congestion reduction, and efficiency.
o The LRT, BRT, BRT-Lite and Express Bus options all enable access to more households than the TDM/TSM, and No-build alternatives. Higher levels of transit access are provided in the HCT alternatives.
o Supplemental Interstate and Replacement Bridge alternatives provide significantly more vehicle throughput and substantially reduce the duration of daily congestion over the New Arterial, TDM/TSM or No-build alternatives.
o HCT modes (LRT, BRT, and BRT-Lite) have significantly lower vehicle hours of delay (VHD) and more person throughput than other modes. LRT performs better than BRT for most measures.
Key Findings River Crossing
Overall, a Replacement bridge performs best for this value. The Supplemental Interstate and Replacement bridge alternatives provide the highest traffic volume throughput, greatest reduction in congestion, and lowest overall travel times. Replacement bridges reduce transit vehicle hours of delay by placing transit on a new fixed-span crossing, whereas Supplemental Interstate bridge options subject transit to delay from bridge lifts on the existing bridges.
The TDM/TSM and New Arterial alternatives provide similar peak period throughput across the I-5 Bridge as the No Build alternative. The TDM/TSM and New Arterial alternatives do not accommodate I-5 Bridge travel demands, resulting in substantial congestion and increased travel times. The Supplemental Interstate alternatives accommodate about 15% to 20% higher southbound AM peak period traffic volumes and about 35% to 45% higher northbound PM peak period traffic volumes than the TDM/TSM and New Arterial alternatives. The Replacement Bridge alternatives perform best, accommodating about 20% to 25% higher southbound AM peak period traffic volumes and about 50% to 55% higher northbound PM peak period traffic volumes than the TDM/TSM and New Arterial alternatives.
The Supplemental Interstate and Replacement Bridge alternatives provide the greatest reduction (55% to 60% lower) in daily highway congestion on the I-5 Bridge compared to No-Build. The TDM/TSM alternative would be similar to the No Build alternative. The New Arterial alternative reduces the duration of daily congestion by about 5% compared to the TSM/TDM alternative.
The Supplemental Interstate and Replacement Bridge alternatives result in the shortest overall travel times. These alternative packages reduce northbound I-5 travel times compared to the TDM/TSM and New Arterial alternatives by about 50% or more. However, southbound I-5 travel times during the AM peak period are similar or slightly higher compared to the TDM/TSM and New Arterial alternatives because Supplemental Interstate and Replacement alternatives would carry more vehicles and still be constrained by limitations on I-5 south of the BIA. A New Arterial bridge provides similar travel times as No-build and TDM/TSM.
Replacement bridges reduce transit vehicle hours of delay (VHD). Supplemental bridge alternatives place transit vehicles on the existing bridges, subjecting them to bridge lift interruptions. Bridge lifts add substantial delay – at least 17 minutes – to vehicles directly affected. Bridge lifts also cause system-wide disruption for LRT.
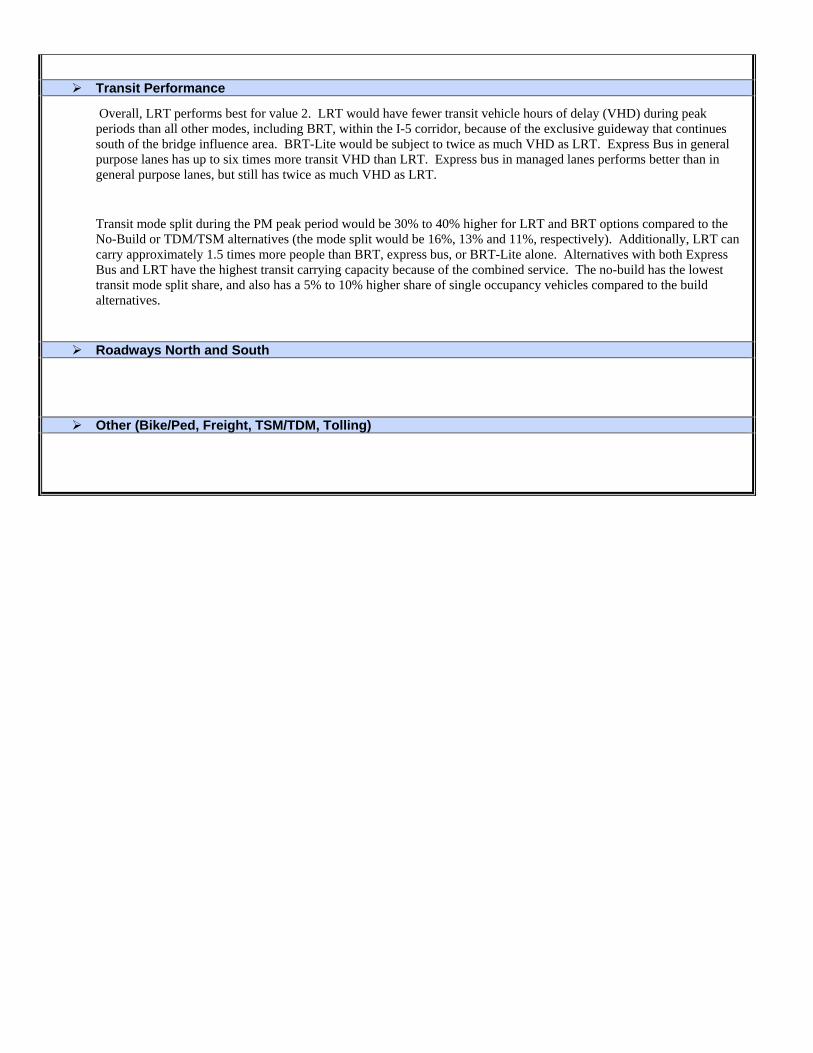
Transit Performance
Overall, LRT performs best for value 2. LRT would have fewer transit vehicle hours of delay (VHD) during peak periods than all other modes, including BRT, within the I-5 corridor, because of the exclusive guideway that continues south of the bridge influence area. BRT-Lite would be subject to twice as much VHD as LRT. Express Bus in general purpose lanes has up to six times more transit VHD than LRT. Express bus in managed lanes performs better than in general purpose lanes, but still has twice as much VHD as LRT.
Transit mode split during the PM peak period would be 30% to 40% higher for LRT and BRT options compared to the No-Build or TDM/TSM alternatives (the mode split would be 16%, 13% and 11%, respectively). Additionally, LRT can carry approximately 1.5 times more people than BRT, express bus, or BRT-Lite alone. Alternatives with both Express Bus and LRT have the highest transit carrying capacity because of the combined service. The no-build has the lowest transit mode split share, and also has a 5% to 10% higher share of single occupancy vehicles compared to the build alternatives.
Roadways North and South
Other (Bike/Ped, Freight, TSM/TDM, Tolling)

Value Performance
Value 3 – Modal Choice
Best Performing Package(s) and/or Component(s) • Pairing LRT and Express Bus provides the best performance overall for the Modal Choice value since this
combination provides the highest access to transit markets, transit in exclusive guideway (LRT) throughout the BIA and south of the BIA, and the non-stop service of Express Bus. BRT with Express Bus provides similarly strong performance on the Modal Choice criteria but unlike LRT, it would be delayed by I-5 traffic congestion south of the BIA. BRT-lite has relatively good transit access but would have the longest travel times.
• The Replacement Bridge options and the New Arterial Bridge option perform best for Modal Choice primarily because they would operate LRT or BRT on a new fixed-span bridge, thus avoiding travel time delays and service interruptions associated with bridge lifts (as occurs with the Supplemental Bridge options). The Replacement and Supplemental bridge options provide the best bike and pedestrian connectivity (compared to the New Arterial and TSM/TDM options)
Key Findings River Crossing
Improve Transit Service to Target Markets
Most of the supplemental bridge alternatives (packages 4-6) would operate transit on the existing I-5 bridge. This would subject high capacity transit service to interruptions from bridge lifts. The US Coast Guard has indicated that the current restrictions on bridge lifts (lifts are not allowed during peak travel times) would likely be removed if I-5 traffic were no longer on these bridges. Thus, bridge lifts would occur much more frequently than today and would occur during peak travel periods. Each bridge lift currently results in at least 17 minutes of delay. During the peak period, this would cause 3 to 4 LRT trains or BRT vehicles to be stopped at each end of the bridge, with each bridge lift. The impacts to schedules, travel time, service reliability and operations costs would extend to other parts of the system. There would be no bridge lift impacts on high capacity transit with the New Arterial bridge option (package 3) and all the Replacement Bridge options (packages 8-12) because they would operate transit on the new fixed-span bridge.
Improve Bike and Pedestrian Connectivity
• The TDM/TSM alternative would provide improved connections to existing pathways at either end of the bridge but would not improve connections beyond that and would not improve sub-standard conditions on the bridge bike path.
• The New Arterial Bridge option would provide a multi-use pathway on the existing bridge and connect it to existing pathways on both ends of the bridge.
• The Supplemental Interstate and Replacement Bridge options would provide the greatest improvements for bike and pedestrian connectivity by adding a new multi-use pathway with an improved network of paths and connections in the I-5 Bridge Influence Area.
Transit Performance
The best performing packages are those that include both an HCT mode and Express Bus, followed by those with either an HCT mode or Express Bus. The No Build and the TSM/TDM would provide the least amount of transit access.

• The local bus network for all of the alternatives would result in approximately 88% of the 2030 population in Clark County within ¼ mile of a bus route.
• In addition, with LRT or BRT service, about 8% of the population and 12% of employment in Clark County would be within ½ mile of a proposed HCT station.
• With Express Bus, approximately 17% of the population and 12% of employment in Clark County would be within ½ mile of a newly planned or existing park-and-ride lot (a total of 10 park-and-ride lots with 4,500 spaces).
Transit travel-times from Clark County transit markets to Oregon transit markets (in vehicle travel times in the AM and PM peak periods for two representative pairs) were also compared with the following conclusions:
• Due to an exclusive guideway, LRT alternatives have the most reliable overall travel time between the BIA and downtown Portland.
• BRT provides similar travel times to LRT through the BIA, but south of the BIA| BRT vehicles operate in general traffic. This increases southbound AM peak travel times but decreases northbound PM peak travel times because the BRT makes no stops south of the BIA and the I-5 traffic improvements allow free-flow traffic in the NB direction.
• Express Bus travel times are 10 to 90% longer than LRT in the AM peak (southbound) and the same as or up to 50% shorter than LRT in the PM peak (northbound). With the I-5 traffic improvements and no stops south of the BIA, northbound Express Buses would travel in largely free flow traffic conditions.
• BRT-Lite alternatives have the longest travel times due to their use of downtown general purpose lanes and I-5 managed lanes in lieu of an exclusive guideway.
Roadways North and South
Other (Bike/Ped, Freight, TSM/TDM, Tolling)

Page 3
Value Performance
Value 4 – SAFETY
Best Performing Package(s) and/or Component(s) • With all modes of transportation (bicycle/pedestrian, highway, air, and marine), safety increases when points
of conflict are removed and congestion is decreased. • Overall, Alternative Package 10 includes the most improvements and components that would enhance safety
such as providing a replacement bridge, a transit mode that would operate in a separate guideway, removing short weaving sections north and south of the river crossing, and adding freight bypass lanes at difficult merge locations.
• Alternative Packages 8 and 9 would next best enhance safety by providing a replacement bridge and HCT in a separate guideway.
Key Findings
River Crossing
Operating I-5 on a new supplemental or replacement bridge constructed to current seismic standards would best maintain a highway life-line connection across the Columbia River in the event of an earthquake. This connection would have adequate capacity and would maintain a direct connection through the I-5 corridor.
A replacement bridge (Alternative Packages 8 – 12) provides the greatest safety improvements because it would provide separate facilities for bicycle and pedestrian travel; increase vehicle capacity over I-5 and provide full shoulders for incident response; eliminate bridge lifts which would alleviate both highway and marine conflicts and congestion; result in fewer piers and bridges, thus further simplifying navigation; and, particularly for downstream replacement bridges (Alternative Packages 8, 9, and 11), reduce encroachment into the desirable clearance zone for Pearson Airpark. In addition, the replacement bridges would be constructed to current seismic standards. Therefore, overall, a replacement bridge would best enhance safety.
Using a supplemental bridge for interstate traffic (Alternative Packages 4 – 7) would provide some of the safety benefits as a replacement bridge except that the existing bridges would remain, thus maintaining the obstruction into Pearson Airpark’s airspace and resulting in greater obstructions to marine navigation. Also, the existing bridges, even with seismic upgrades, will likely be more vulnerable to earthquake damage.
Using a supplemental bridge for arterial traffic and continuing to operate I-5 on the existing bridges (Alternative Package 3) would have a negative impact on highway safety as congestion would increase, which would also likely increase the “no bridge lift” periods and further impact marine safety.
Transit Performance
Transit modes that would operate on a guideway separate from vehicle traffic would help reduce conflicts and congestion in I-5 general purpose lanes. Therefore, providing HCT with either LRT or BRT in an exclusive guideway (on a new supplemental or replacement bridge) would best enhance safety.
Roadways North and South
North of the river crossing, a new supplemental or replacement bridge for I-5, which would include widening I-5 through the Bridge Influence Area, would increase safety because full highway shoulders along I-5 could be provided. Widening I-5 would also require reconstruction of the existing 39th Street over-crossing, which is a route to Discovery Middle School. The over-crossing would be constructed with a greater sidewalk width. Accessibility at SR 500 would also be improved because ramps would be added to and from the north.
At the 39th Street interchange removing the ramps to and from the north on I-5 would improve bicycle and pedestrian safety on 39th Street by reducing the number of ramp crossings. This improvement could be packaged with a new supplemental or replacement bridge for I-5; it is currently included as an option in four of the Alternative Packages.
Page 4
Removing a short weaving section at Marine Drive and Hayden Island would improve safety. This improvement could be accomplished with the supplemental bridge options by eliminating the Hayden Island interchange, or with the replacement bridge options by adding braided ramps.
Other (Bike/Ped, Freight, TSM/TDM, Tolling)
Bicycle and pedestrian safety would be best improved by providing separate facilities across the river and connections to the north and south.
Adding freight bypass lanes in areas where trucks currently have difficulty entering and exiting I-5 would enhance safety. This improvement could be packaged with a new supplemental or replacement bridge for I-5; it is currently included as an option in four of the Alternative Packages.
Re-striping I-5 (in both directions) between 39th Street and SR 500 to add a managed lane could improve safety by increasing capacity on I-5, however, it would also result in substandard shoulder widths which decrease safety.

Value Performance
Value 5 – Regional Economy, Freight Mobility
Best Performing Package(s) and/or Component(s) • The Replacement Bridge options provide the greatest overall benefit to the Regional Economy and Freight
Mobility value. The Supplemental Interstate bridge options also perform well on most criteria, but provide much less benefit to marine navigation efficiency.
Key Findings River Crossing
Reduce truck travel times in the Bridge Influence Area (SR 500 to Columbia Boulevard)
• The TDM/TSM and New Arterial options provide similar I-5 truck travel times as the No-Build • The Supplemental Interstate and Replacement Bridge options reduce, by 50 to 60%, I-5 northbound, pm peak truck travel
times compared to the TDM/TSM and New Arterial options • The Supplemental Interstate and Replacement Bridge options result in higher I-5 southbound, am peak travel times
compared to the TDM/TSM and New Arterial options. This is due to carrying more trips than the other options and to constraints on I-5 south of the Bridge Influence Area. Overall duration of congestion is reduced and throughput is increased for these options compared to the TDM/TSM and New Arterial.
Reduce Truck Travel Times in the I-5 corridor (179th to I-84)
• The TDM/TSM and New Arterial options provide similar truck travel times along I-5 as the No-Build alternative. • The Supplemental Interstate and Replacement Bridge options reduce, by 50% or more, I-5 northbound, pm peak travel times
compared to the TDM/TSM and New Arterial options. • The Supplemental Interstate and Replacement Bridge options reduce, by 5 to 10%, I-5 southbound, am peak truck travel
times compared to the TDM/TSM and New Arterial options.
Marine navigation Efficiency
The greatest benefit to the efficiency of marine navigation would be with the Replacement Bridge options because they would:
• Eliminate the existing liftspan bridges, thus eliminating the “no bridge lift” period that restricts marine vessels • Result in fewer total bridge piers in the water (approximately 5, compared to 14 with the Supplemental options) • Provide a permanently open, direct path to the downriver, BNSF railroad swing-span.
Improve Freight Truck Throughput in the Bridge Influence Area
• The TDM/TSM and New Arterial options provide similar peak period truck throughput across the I-5 Bridge as the No Build alternative. The TDM/TSM and New Arterial options do not accommodate I-5 bridge travel demands, including truck traffic, resulting in substantial congestion and increased travel times (see Criteria 2.1 and 2.3)
• The Supplemental Interstate options accommodate about 20% higher southbound AM peak period truck traffic volumes and about 30% (without a Hayden Island interchange) to 50% (with a Hayden Island interchange) higher northbound PM peak period truck traffic volumes than the TDM/TSM and New Arterial options
• The Replacement Bridge options accommodate about 25% higher southbound AM peak period truck traffic volumes and about 50% higher northbound PM peak period truck traffic volumes than the TDM/TSM and New Arterial options.
Avoid or minimize impacts to parallel freight rail corridor
• None of the alternatives would result in traffic back-ups that would affect at-grade freight rail crossings. The nearest crossing to the Bridge Influence Area is about 1.3 miles west of I-5.
Enhance or maintain access to port, freight or industrial facilities
• The TDM/TSM and New Arterial options would provide minimal accessibility improvements to I-5 Bridge Influence Area interchanges.
• The Supplemental Interstate and Replacement Bridge options would provide improvements to most or all interchanges thereby improving accessibility to port, freight, and industrial facilities
Transit Performance
Roadways North and South
Other (Bike/Ped, Freight, TSM/TDM, Tolling)

Page 5
Value Performance
Value 6 – STEWARDSHIP OF NATURAL RESOURCES
Best Performing Package(s) and/or Component(s) • Alternative Package 12 would have the least direct impact on natural resources but could miss potential
indirect benefits associated with more robust high capacity transit options. • BRT-Lite and Express Bus have a smaller footprint than BRT and LRT. • Replacement bridges perform slightly better than supplemental bridges because of their smaller footprint in
the water and greater ability to manage stormwater runoff.
Key Findings River Crossing
Alternative Packages 1 and 2 (No-Build and TSM/TDM) have the least direct impact on natural resources but they would not meet the project’s Purpose and Need. They would also likely continue to discharge untreated stormwater runoff from the bridge into the Columbia River.
Replacement bridges perform moderately better than supplemental bridges. Replacement bridges can better treat stormwater runoff and would have a smaller total footprint. Replacement bridges would also require fewer in-water piers than supplemental bridges. Short-term impacts are similar for replacement and supplemental bridge alternatives: the replacement alternatives require in-water work to deconstruct the existing bridges and remove piers and foundations, which would likely be accomplished quicker than pier and foundation seismic upgrades associated with the supplemental alternatives.
Transit Performance
The Express Bus and BRT-Lite options would have a smaller footprint and less direct impacts than either BRT or LRT.
BRT and LRT, as designed, would impact the Burnt Bridge Creek riparian area, City of Portland Environmental Zones, Metro Goal 5 habitats, and habitats identified in field surveys. However, these impacts are based on a sample alignment and could likely be reduced through design refinement. LRT and (to a lesser extent) BRT are also likely to increase transit mode share and better support growth management, reducing secondary impacts to natural resources.
Roadways North and South
The SR 500 Tunnel Access performs better than SR 500 Flyover Access because it impacts less of the Burnt Bridge Creek riparian and open space area.
Hayden Island Access and Hayden Island Folded Diamond Access perform slightly better than Hayden Island Arterial and Full Standard options because they have fewer crossings across the Oregon Slough, and do not come as close to the wetland area southwest of the Marine Drive interchange.
Other (Bike/Ped, Freight, TSM/TDM, Tolling)

Value Performance
Value 7 – DISTRIBUTION OF BENEFITS AND IMPACTS
Best Performing Package(s) and/or Component(s) • Replacement bridge options provide the greatest equity between transit and auto users by operating both transit and auto
modes on equivalent structures over the river. Supplemental bridge options that locate high capacity transit on the existing lift span bridge and autos on the new, fixed span bridge could have transportation equity concerns.
• The Replacement bridge options and the Supplemental Bridge options that provide an interchange on Hayden Island (Alternative Packages 6 and 7) offer the greatest access improvements for all populations and do not appear to have notable disproportionate adverse effects.
• Transit options that combine either LRT or BRT with Express Bus, offer the greatest improvements in transit service to all populations, and do not appear to have notable disproportionate adverse effects.
Key Findings River Crossing
Property acquisitions in the river crossing area (from SR 14 to Marine Drive) are a function of several factors, only one of which is the river crossing option itself. Interchange designs at Hayden Island and Marine Drive interchanges are a major factor. River crossings would likely displace 5-15 floating homes on the Oregon Slough. The number depends partly on the specific crossing option but depends more on the interchange designs at Marine Drive and Hayden Island, and on whether the river crossing would accommodate LRT or BRT. Residential acquisitions and displacements do not cluster in areas with notable low-income and/or minority populations.
Replacement bridge options provide the greatest potential benefit to transit users by locating transit on a new, fixed span bridge that would not be subject to bridge lift interruptions. Analysis of the demographics of transit users and auto users would be required to evaluate the effect on the distribution of benefits.
The Replacement bridge options and some of the Supplemental Bridge options (packages 6 and 7) offer similar access improvements to a wide range of populations. Supplemental Bridge options with no Hayden Island interchange (packages 3, 4, and 5) would remove the existing I-5 interchange on Hayden Island. This would provide poorer access to jobs, housing and retail businesses on the island, and poorer access by Hayden Island residents to jobs, housing and other destinations off the island. It is unclear whether this would differentially affect low income or minority populations.
Transit Performance
LRT and BRT have higher potential to affect residential properties than BRT-Lite or Express Bus because they necessitate wider structures across the Oregon Slough, which may displace approximately 5 floating homes for most bridge options. However, residential acquisitions and displacements do not cluster in areas with notable low-income and/or minority populations.
Transit options that provide either LRT or BRT, combined with Express Bus, offer the greatest improvements in transit service to all populations. There is no notable difference in the distribution of benefits.
Roadways North and South
Other (Bike/Ped, Freight, TSM/TDM, Tolling)

FORM B: Value Performance
Value 8 – COST EFFECTIVENESS AND FINANCIAL RESOURCES
Best Performing Package(s) and/or Component(s) [Summarize your findings regarding the components and combination of components that perform best for this value.]
Transit
• Express buses would have the lowest capital cost to construct and the lowest annual transit operating cost. • LRT has the lowest annual operating costs for the HCT modes, and the highest capital costs. • Cost effectiveness: LRT has the lowest annual operating cost per annual transit seat, followed by Express
Bus, and then BRT and BRT-Lite with the highest annual operating cost per annual transit seat.
River Crossing
• Capital cost estimates are not yet available • The replacement bridge options would have much lower annual operating and maintenance costs
(approximately $35,000/yr compared to approximately $3 million/yr for the supplemental bridge options).
Key Findings River Crossing
• Capital cost estimates are being developed for the river crossing options. • Alternatives that reuse the existing bridges require vastly more annual maintenance and operation costs than
replacement alternatives – $3 million versus $35,000. This is due to higher operation costs (largely because of staffing the lift structure) and capital improvements that will be required for the existing bridges. A new bridge would not require 24-hour staffing and would be constructed to operate without any capital improvements during the planning period (2035).
Transit Performance
Table 1. Per-Mile Transit Capital CostsLRT BRT BRT-Lite Express Bus
Low $60 million $25 million $20 million $10 millionHigh $120 million $110 million $40 million $30 million
Table 1 shows the possible range of cost per-mile of the various transit modes. LRT would run for approximately 4.5 miles, whereas the bus lines would run for 5 miles. Alternative Packages 3 and 8 combine express bus service with LRT. With these Alternative Packages, in addition to the capital cost requirements for LRT, express bus service would require costs for the bus vehicles and a bus maintenance facility. This would be less than simply adding the Express Bus capital costs listed in Table 1 to the LRT costs. The high end of the BRT cost range reflects the cost to build BRT “rail ready” (so that it could be more readily converted to an LRT line in the future).
Table 2. Annual Operating Costs
Raw CostsLRT + Express Bus $10,600,000 $0.35LRT $8,700,000 $0.33BRT $13,300,000 $1.92BRT-Lite $17,000,000 $1.37Express Bus $7,000,000 $0.67
Cost per transit seat

Table 2 presents the annual operating cost in 2006 dollars divided by the amount of transit capacity provided (or seats in buses and trains). Overall, annual operating cost per annual transit seat varies substantially across the modes. Express bus alternatives have moderate operating costs per seat due to their AM and PM peak period operation and lower bus capacity. The BRT and BRT-Lite alternatives have higher operating costs per seat, reflecting a full, all day operation between downtown Portland and Kiggins Bowl. The LRT alternatives have lower operating costs per seat due to the large LRT train capacity and the already funded Yellow Line in Portland.
Roadways North and South
Other (Bike/Ped, Freight, TSM/TDM, Tolling)

Page 6
Value Performance
Value 9 – BISTATE COOPERATION
Best Performing Package(s) and/or Component(s) Alternative Packages 8 and 9 perform the best because they include LRT as the transit mode, which is supported in regional plans, and would not result in cut-through traffic associated with separate arterial bridges (Alternative Packages 3 - 7). Alternative Packages 3 and 4 include LRT but also include arterial bridges.
Key Findings
River Crossing
Replacement bridges better support goals for regional economic development than supplemental bridges (Alternative Packages 3 – 7) because they require less total ROW on Hayden Island and in downtown Vancouver. Replacement bridges and the new arterial bridge option, because they would place LRT on a new bridge without a lift span, better support regional goals for provision of HCT.
However, supplemental bridges and No-Build alternatives better support Clark County planning policies that include historic preservation because replacement bridges remove the existing northbound bridge that is on the National Register of Historic Places.
Transit Performance
Alternative Packages 3, 4, 8, and 9 best support regional plans and policies because they include LRT. BRT (Alternative Packages 5 and 10) does not satisfy regional plans calling for LRT but would support multi-modalism and compact growth. BRT-Lite (Alternative Packages 6 and 11) is less supportive. Express Bus only (Alternative Packages 1, 2, 7, and 12) performs the worst.
Roadways North and South
There is no discernable difference between Alternative Packages for this criterion. Other (Bike/Ped, Freight, TSM/TDM, Tolling)
Alternative Package 3 is the best option from a bicycle and pedestrian standpoint because it provides the shortest distance to travel, provides easy access onto the facility, and places bikers and pedestrians next to low-speed traffic traveling locally on an arterial bridge.
All packages that provide full-width bike and pedestrian lanes on the new bridge would be a substantial improvement over existing conditions.

Page 7
Value Performance Value 10 – CONSTRUCTABILITY
Best Performing Package(s) and/or Component(s) • Alternative Packages 1 and 2 would have the least amount of construction impacts. • Among the Build alternatives, Alternative Package 3 would have the least amount of construction impacts
because work would occur in a smaller area and it would have the shortest construction period. • Alternative Packages 4 - 12, which would provide a new supplemental or replacement bridge for I-5, would have
a similar duration of construction and would include components that would provide comparable flexibility to accommodate future transportation system improvements. However, a seismic retrofit of the existing bridges (with supplemental bridge options) would take longer than removing the bridges (with replacement bridge options).
Note: Many aspects of constructability are a function of design details that will not be determined until later phases of the project.
Key Findings
River Crossing
Constructing a new supplemental arterial bridge and continuing to use the existing bridges for I-5 (Alternative Package 3) would have the least amount of construction impacts because work would occur in a smaller area and would have the shortest construction period. Its temporary impacts to navigation would be similar to the other Build alternatives.
The construction duration of a new supplemental bridge for I-5, which would include subsequent improvements to seismically retrofit the existing bridges, would be similar to constructing a replacement bridge for I-5, which would include the subsequent removal of the existing bridges. The construction impacts to traffic, navigation, and residences and businesses would be similar.
With a new supplemental or replacement bridge for I-5, future improvements to the transportation system could be constructed by either using the width of the highway shoulders or by constructing further additions to the width of the bridges (such as by cantilevering an additional section). Such flexibility will be determined by future design decisions.
Transit Performance
An Express Bus and Local Bus transit system requires less infrastructure and modifications to the existing transportation network to operate and, therefore, would have lower construction impacts.
Those transit modes that require the construction of an exclusive guideway for operation (either a trackway for LRT or exclusive lanes for BRT) would have the greatest amount of temporary construction impacts. The construction of the guideway would impact a larger area (including the route streets in Vancouver) and would require more time to construct.
BRT-Lite includes infrastructure that would have construction impacts, but less than with LRT or BRT, especially in downtown Vancouver.
Roadways North and South
Improvements at SR 500 would create construction impacts but make future transportation improvements easier to construct.
Construction of improvements at Marine Drive would have associated impacts, but would likely make future transportation improvements easier to construct.

Page 8
Other (Bike/Ped, Freight, TSM/TDM, Tolling)
Bicycle and pedestrian improvements would have associated construction impacts but would make future improvements easier to construct.
Constructing freight bypass lanes would have associated impacts but would likely make future transportation improvements easier to construct. This improvement could be packaged with a new supplemental or replacement bridge for I-5; it is currently included as an option in four Alternative Packages.