Embed Size (px)
Citation preview
1
DRAFT SEPTEMBER 24, 2021
REPORT TO AD HOC ADVISORY COMMITTEE
FALLBROOK PUD AND RAINBOW MWD WHOLESALER
REORGANIZATION
Submitted by
Professor Michael Hanemann
DRAFT
September 24, 2021
2
DRAFT SEPTEMBER 24, 2021
TABLE OF CONTENTS
EXECUTIVE SUMMARY (in preparation)
1. HOW SAN DIEGO COUNTY GETS ITS WATER
Q. If I am served by a member agency of the San Diego County Water Authority (SDCWA),
where does my water come from?
Q. What are local supplies?
Q. How did San Diego County’s local supplies come to be augmented?
Q. Where does SDCWA get its water from?
Q. Why did SDCWA decide to broaden its source of water beyond water from MWD?
Q. What happened to SDCWA during the drought in 1991?
Q. What were the consequences of the 1991 drought experience?
Q. Where does MWD get its water from?
Q. Where does Fallbrook Public Utility District (FPUD) get its water from?
Q. Will FPUD’s local supplies increase in the future?
Q. Where does Rainbow Municipal Water District (RMWD) get its water from?
Q. Will RMWD develop some local supply in the future?
Q. In its 2020 Urban Water Management Plan, FPUD states that it has historically purchased
its water from “our two wholesalers, SDCWA and MWD.” Is that a correct statement?
Q. Why does FPUD claim that MWD is its wholesale supplier?
Q. Are there any other SDCWA member agencies that have turnouts on a portion of the
pipeline from Lake Skinner owned by MWD?
Q. Does the fact that MWD owns a turnout from which FPUD or RMWD receives water make
MWD a wholesale supplier to FPUD or RMWD?
Q. Does the fact that SDCWA waives its Transportation Charge for water received by FPUD
and RMWD from a turnout owned by MWD make that not SDCWA water?
Q. Is it the case that, if FPUD and RMWD exit from SDCWA, they still would end up receiving
the same MWD water from the same turnouts on the same pipes? Nothing would really
change?
Q. Why will it not be the same water?
3
DRAFT SEPTEMBER 24, 2021
Q. How is water supplied by MWD different from water supplied by SDCWA?
Q. Isn’t it true that MWD currently delivers to SDCWA some water from the SWP?
Q. What is the difference between MWD’s role as a supplier of water versus its role as a
conveyor of water?
Q, Is conveying water the same as wheeling water?
Q. Is MWD selling or conveying the QSA water it delivers to SDCWA?
Q. When MWD delivers SWP water to SDCWA in exchange for QSA water, does it own that
SWP water?
Q. Is most of the water delivered by MWD to SDCWA QSA water (i.e., MWD acts as a
conveyor of water) rather than MWD-owned water (i.e., MWD acts as a supplier)?
2. HOW DID DETACHMENT COME TO BE AN ISSUE
Q. Are FPUD and RMWD different from other SDCWA member agencies?
Q. What caused SDCWA’s all-in melded water rate to rise significantly?
Q. Could the sharp increase in SDCWA’s all-in water rate be due to the introduction of QSA
water?
Q. Could the sharp increase in SDCWA’s all-in water rate be due to the desalinated seawater
from the Carlsbad Facility?
Q. Did anything else change that could explain the sharp increase in SDCWA’s all-in water rate
after 2010?
Q. Could the reduction in SDCWA sales to member agencies between 2008 and 2020 have had
an impact on SDCWA’s all-in water rate over that period?
3. THE FINANCIAL IMPACT OF DETACHMENT
Q. How large are FPUD and RMWD in relation to the other SDCWA member agencies?
Q. What are the revenues that SDCWA receives from member agencies?
Q. If FPUD and/or RMWD leave SDCWA’s service area, which of SDCWA’s revenue sources
would be reduced?
Q. If FPUD and RMWD were not member agencies of SDCWA, how much lower would
SDCWA’s annual revenue be?
4
DRAFT SEPTEMBER 24, 2021
Q. If FPUD and RMWD were not member agencies of SDCWA, how much lower would
SDCWA’s expenditures be?
Q. Is a one-year analysis of the net financial impact conclusive?
Q. What does a multi-year analysis of the net financial impact of detachment show?
Q. How large is this net financial impact in relation to SDCWA’s total water-related revenue
and water-related operating expenses?
Q. Is this just a one-year impact to net revenue?
Q. Why does it impose a net cost on SDCWA when it sells less water to a member agency?
4. A DEPARTURE FEE
Q. Is there a sound economic justification for requiring a departure fee?
Q. What is the purpose of a departure fee?
Q. What portion of SDCWA’s outstanding water-supply related obligations should serve as
the basis for a departure fee?
Q. What is the amount of SDCWA’s outstanding obligations that relates to QSA water?
Q. What is a fair share of the QSA contractual obligation to assign to FPUD and RMWD?
Q. Using the CY 2021 cost of SDCWA’s contractual supply obligation for QSA water, what
annual payment would be assigned to FPUD and RMWD?
Q. Over how long a period should an annual departure fee be required of FPUD and RMWD?
5. WATER SUPPLY RELIABILITY: SDCWA vs EASTERN MWD (In preparation)
6. OTHER IMPLICATIONS (In preparation)
BACKUP TABLE

5
DRAFT SEPTEMBER 24, 2021
EXECUTIVE SUMMARY (in preparation)
6
DRAFT SEPTEMBER 24, 2021
1. HOW SAN DIEGO COUNTY GETS ITS WATER
Q. If I am served by a member agency of the San Diego County Water Authority (SDCWA),
where does my water come from?
A. Your water comes from one of two sources: (1) local supplies -- water your member agency
obtains from local sources that it controls, and (2) water supplied to your member agency by
SDCWA.
Q. What are local supplies?
A. Historically, local sources were groundwater and surface water within the local area of the
urban water agency. Before 1947, the San Diego region relied entirely on local surface water
runoff and groundwater pumped from local aquifers.
Over time, local sources have expanded to include the use of treated wastewater from local
wastewater plants, the use of desalinated local groundwater and, also, desalinated seawater
(some of the seawater at the Carlsbad Facility is contracted for by SDCWA member agencies
Carslbad MWD and Vallecitos WD, and counts as part of their local supplies).
However, as the region’s population and economy have grown, local supplies became
insufficient to meet the region’s water needs.
Q. How did San Diego County’s local supplies come to be augmented?
A. In 1928, the Metropolitan Water District of Southern California (MWD) was formed to
develop, store and distribute supplemental water in Southern California, with the specific
intention of importing water to the region from the Colorado River. MWD built the Colorado
River Aqueduct (CRA) during the 1930s to convey this water, with the aqueduct coming into
operation in 1941. The founding members were Los Angeles and its neighboring cities in Los
Angeles County.
World War II caused a great increase in water consumption in San Diego and threatened to
deplete the region’s available local water supply. The solution was to connect the region to the
Los Angeles area CRA and import Colorado River water from MWD. In 1943, engineering studies
were completed in 1943 for an aqueduct that would connect with the terminus of the CRA at
what is now called Lake Mathews and convey water south across Riverside County and into San
Diego County. The San Diego County Water Authority was organized with nine original
members in June 1944 under an enabling act of the California State Legislature known as the
7
DRAFT SEPTEMBER 24, 2021
County Water Act.1 The primary purpose was to contract with MWD as a member agency and
supply imported MWD water to the region. The San Diego Aqueduct was completed and placed
in operation in December 1947. Between the 1950s and the 1980s, SDCWA constructed four
additional aqueducts that are all connected to MWD’s distribution system and import water to
the County.
SDCWA supplies from 75% to 95% of the region’s water consumption, depending on hydrologic
conditions and yield from local supplies.
Q. Where does SDCWA get its water from?
A. For almost sixty years, from 1947 to 2003, MWD was the sole provider of imported water to
SDCWA. This changed in 2003; starting that year, SDCWA began to receive water purchased in a
transfer agreement with Imperial Irrigation District (IID). In 2007, SDCWA started to receive an
amount of water from projects that lined portions of the All-American Canal (AAC) and the
Coachella Canal (CC) in order to conserve water that infiltrated into the ground while the canals
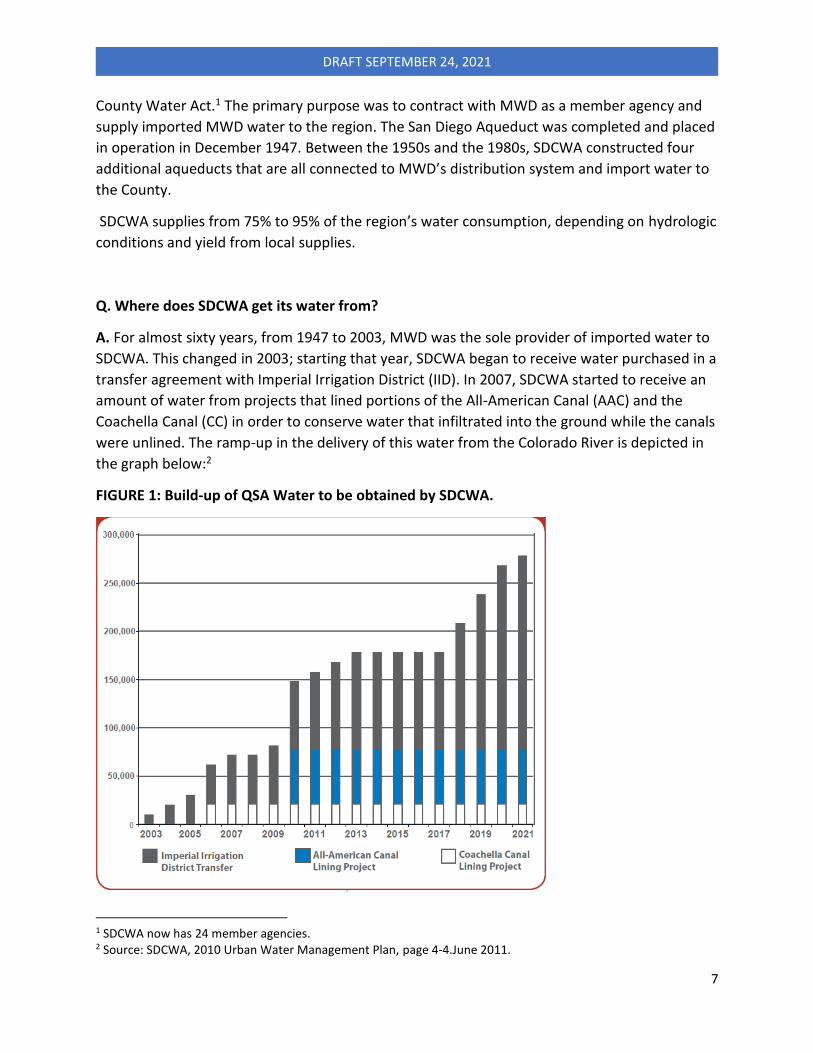
were unlined. The ramp-up in the delivery of this water from the Colorado River is depicted in
the graph below:2
FIGURE 1: Build-up of QSA Water to be obtained by SDCWA.
1 SDCWA now has 24 member agencies. 2 Source: SDCWA, 2010 Urban Water Management Plan, page 4-4.June 2011.
8
DRAFT SEPTEMBER 24, 2021
The water obtained by SDCWA from IID and from the canal lining is referred to as QSA water. It
is conveyed from the Colorado River to the SDCWA service area by MWD using the CRA under a
2003 agreement known as the Exchange Agreement.
In addition, in 2016, SDCWA started to receive desalinated seawater from the Carlsbad
Desalination Facility.
Q. Why did SDCWA decide to broaden its source of water beyond water from MWD?
A. SDCWA decided it needed to expand the sources from which it received water in the light of
its experience with MWD during the drought in 1991.
Q. What happened to SDCWA during the drought in 1991?
A. The period from 1987 to 1992 saw one of the major droughts in California’s history.
This was by no means California’s first drought. There had been multi-year droughts in
California in 1918-1920, 1928-1934, 1947-1950, 1976-1977 and, subsequently, there were
droughts in 2007-2009 and 2012-2016. But, the droughts prior to 1976-1977 occurred when
California’s population was much smaller and before major reservoirs had been constructed.
What made the droughts of 1976-1977, 1987-1992, 2007-2009 and 2012-2016 so significant
was the combination of very low precipitation, low runoff, and severely depleted reservoir
storage.
1976-1977 was the single most severe drought in terms of precipitation and runoff, but it was
just a two-year drought and the water supply impact was not as severe as in the subsequent
longer droughts starting with 1987-1992.
The drought of 1987-1992 came as a major shock to Southern California’s water system. In April
1990, MWD’s Board had approved a first-ever drought management plan, calling on agricultural
and municipal water users within its service area to voluntarily reduce their usage of water.
Adopting a tougher approach, in December 1990 MWD mandated cutbacks in water use by
agricultural and municipal users. In January 1991 it mandated sharper cutbacks. It increased the
mandated cutbacks in February 1991 and again in March 1991, when it ended up by cutting
deliveries of water for agricultural use by 90% and deliveries for municipal use by 30%. MWD
came within a few weeks of an even more severe cutback – it had given notice of an upcoming
cutback of 50% in the County’s water supply. This was unexpectedly avoided when heavy rains
fell during the March Miracle of 1991.
The 30/90% cutbacks that were implemented were still devasting to SDCWA. SDCWA was
almost entirely dependent on delivered water from MWD – MWD deliveries accounted for 95%
9
DRAFT SEPTEMBER 24, 2021
of the water supply in San Diego County in that year, with local supplies making up only 5%. By
contrast, the City of Los Angeles relied on MWD for about 60% of its water, having its own
supplies for the remainder. A 30% cutback on 60% of Los Angeles’ municipal water supply
equated to an 18% cutback, while a 30% cutback on 95% of San Diego County’s water supply
equated to a 28.5 percent cutback. MWD’s cutback of deliveries for agricultural users was even
more draconian for SDCWA since, in 1991, it accounted for 62.67 percent of MWD’s total
agricultural water sales.
In the event, the SDCWA Board decided to meld MWD’s water supply cutbacks and impose a
uniform rate on all member agencies and their customers, regardless of whether those were
agricultural or municipal uses of water.
Q. What were the consequences of the 1991 drought experience?
A. The experience during drought in 1991 had important consequences both for SDCWA and
also for MWD.
For SDCWA, the consequence was a desire for less dependence on MWD and “a unified
regional resolve to use visionary planning and smart investments to ensure San Diego’s water
supplies would be more resilient to shortage.”3 This led to the 1998 agreement between
SDCWA and IID under which SDCWA would purchase water from IID, and also to the
negotiations between SDCWA and Poseidon Resources, initiated in 2002 and finally
consummated in 2012, for the construction of the Carlsbad Desalination Facility.
For MWD, too, the consequence was a desire for greater resilience in its water supply, including
more water marketing transactions and the acquisition of more water storage capacity outside
MWD’s service area.4
Q. Where does MWD get its water from?
A. MWD has two core sources of water. The first source, as noted above, was water from the
Colorado River, for which MWD was established in 1928, and which it started to deliver in 1941.
The second is water from the State Water Project (SWP), which is owned by the State of
California.
The SWP stretches more than 600 miles from Lake Oroville on the Feather River in Butte County
down to Lake Perris in Riverside County. MWD contracted with California’s Department of
3 Pete Wilson, Foreword on To Quench a Thirst: A Brief History of Water in the San Diego Region as quoted in SDCWA Combined Response, 9-18-2020, p. 18. 4 MWD’s planning for the Eastside Reservoir (Diamond Valley Lake) had begun in 1987, and so predated the 1991 drought.
10
DRAFT SEPTEMBER 24, 2021
Water Resources (CDWR) in 1960 when the project was planned. MWD is one of 29 water
agencies that have long-term contracts with the SWP. SWP was initially planned to deliver
about 4.2 million acre-feet (MAF) of water, and MWD contracted for about 2 MAF, or about
48% of the total. MWD received its first deliveries of SWP water in 1972.
An important feature of the SWP contracts is that the full amount of water was not anticipated
to be needed for at least the first 20-30 years. Facilities needed to transport the full 4.2 MAF
were expected to be constructed over time as demands on the system increased. However, in a
famous ballot in 1982, California voters rejected what was known as the Peripheral Canal Act
that would have authorized building a canal around the periphery of the Sacramento-San
Joaquin River Delta to move additional SWP water down to Central and Southern California.
That left the SWP delivery capacity at about 2.7 MAF on average, and only about 1.2 MAF in a
dry year. Following amendments to the SWP contracts under the 1994 Monterey Agreement,
all SWP supplies are allocated to contractors in proportion to their original contractual
entitlements. Thus, MWD’s 48% share of total SWP contract entitlements allows it to receive
about 1.35 MAF of average year SWP supplies, and about 0.6 MAF in a dry year depending on
the severity of the drought.
In addition to a reduced supply of SWP water, MWD has also had to deal with a reduced supply
of Colorado River water. Until 1963, MWD had a firm allocation of 1.2 MAF of Colorado River
water through contracts with the U.S. department of Interior, which was enough to keep the
CRA full. However, as the results of the U.S. Supreme Court’s 1963 ruling in Arizona v.
California, California’s supply of Colorado River water was reduced to a total of 4.4 MAF and
MWD’s supply was reduced to 550,000 AF.
That ruling had little effect at first because Arizona and Nevada did not make use of the full
apportionment of Colorado River water awarded to them by the U.S. Supreme court. In the
interim, California water users, including MWD, took advantage of the situation to divert more
Colorado River water than their allocation.
By the 1990s, the situation was different. By then, Las Vegas had grown into a large
metropolitan area, and the Central Arizona Project, authorized by Congress in 1968 to deliver
Arizona’s apportionment of Colorado River water, had been completed. Arizona and Nevada
were ready to take their full allocation of Colorado River water (2.8 MAF and 0.3 MAF,
respectively). However, California water agencies, notably IID and MWD continued their high
rates of diversion. On average during the 1990s, MWD was able to fill the CRA and California
overall took 5.1 MAF of Colorado River water.5 At this point the Secretary of the Interior
stepped into the situation and moved to enforce the limits on California’s use of Colorado River
water.
5 The years 1996-2000 were relatively wet in the Colorado River watershed and the Secretary of the Interior was able to declare that surplus water was available, which benefited California’s water users and gave them some time to prepare for the coming change.
11
DRAFT SEPTEMBER 24, 2021
The new arrangement on the Colorado River took effect when the Quantification Settlement
Agreement (QSA) was signed in October 2003. This enforced the limits on California’s use of
Colorado River water, including MWD’s limit of 550,000 AF.6
In addition to its contractual rights to SWP water and Colorado River water, MWD has
augmented its water supply through water leasing and transfer arrangements with other
parties outside its service area, including other holders of Colorado River water rights, other
SWP contractors, and other California water agencies. To store this water, MWD developed
additional storage, both the Eastside Reservoir (which was completed in 2000) and additional
storage outside its service area, including storage in groundwater banks and storage in Lake
Meade through the Colorado River ‘s Intentionally Created Surplus program.
Q. Where does Fallbrook Public Utility District (FPUD) get its water from?
A. FPUD obtains its water from (i) some small local supplies and (ii) mainly from SDCWA.
Local supplies: according to FPUD’s 2020 Urban water Management Plan, in Calendar Year (CY)
2020 FPUD obtained 100 AF from local groundwater and 517 AF of recycled water from its
Fallbrook Water Reclamation Plant, for a total local supply of 617 AF.
SDCWA: In addition, FPUD obtained 8,303 AF from SDCWA in CY 2020.
Q, Will FPUD’s local supplies increase in the future?
A. Yes: there are three projects that will increase FPUD’s local supplies.
FPUD recently completed a rehabilitation of its Fallbrook Water Reclamation Plant which will
allow it to increase the use of recycled water from 517 AF to 830 AF.
FPUD has been a developing a major new local supply project, the Santa Margarita Conjunctive-
Use Project, in collaboration with Camp Pendleton. The project involves capturing surface
water flows during storms along the Santa Margarita, a short intermittent river that runs
through Camp Pendleton, and storing the surplus flow in an aquifer on Camp Pendleton.
Facilities to pump raw water from the aquifer near the Pendleton/FPUD boundary have been
completed, and FPUD is currently constructing an advanced water treatment plant to
desalinate the brackish groundwater extracted from the aquifer. It is estimated that the project
will come online in 2022. The amount of water yielded is expected to vary with hydrological
conditions; it has been assessed conservatively at an average annual yield of 4,200 AF.
6 In addition, MWD had completed a water transfer agreement with IID in 1988 to obtain about 106,000 AF out of IID’s right to Colorado River water. Under certain conditions, however, MWD must provide 50,000 AF to the Coachella Valley Water District. Therefore, MWD’s firm supply from the Colorado River is about 600,000 AF.
12
DRAFT SEPTEMBER 24, 2021
FPUD is also working on a project to obtain 300 AF of surface water by relocating a water right
it held to the Santa Margarita but could not utilize to a diversion point on a tributary of the river
outside its service area, upstream of Lake Skinner in Riverside County. Lake Skinner is MWD’s
reservoir that feeds MWD’s Skinner Drinking Water Treatment Plant which provides drinking
water to MWD’s member agencies in Riverside and San Diego Counties. FPUD will stored the
water it diverts from the tributary in Lake Skinner, and MWD will wheel (convey) the water to
FPUD via the SDCWA pipeline that connects SDCWA and MWD in return for a treatment charge
plus a wheeling charge to be levied by MWD. When this comes into operation, it is
conservatively expected to provide a yield of 300 AF for FPUD.
Q. Where does Rainbow Municipal Water District (RMWD) get its water from?
A. RMWD, like FPUD, is a member agency of SDCWA. It currently has no local supply and relies
on SDCWA for the entirety of its water supply, which amounted to 14,297 AF in CY 2020.
Q. Will RMWD develop some local supply in the future?
A. RMWD is investigating the feasibility of developing local San Luis Rey River basin
groundwater resources as a local supply of water. This would require the construction of a
desalting plant or some other appropriate form of treatment facility for the groundwater
extracted. In its 2020 Urban Water Management Plan, RMWD anticipates that this groundwater
project might provide a local supply of 2,000 AF by 2030.
Q. In its 2020 Urban Water Management Plan, FPUD states that it has historically purchased
its water from “our two wholesalers, SDCWA and MWD.”7 Is that a correct statement?
A. No, it is not correct.
So far in its history, PFUD has had no supply relationship with MWD. FPUD is not a member
agency of MWD, and MWD does not sell water to non-member agencies. FPUD is a member
agency of SDCWA and SDCWA is its sole wholesale supplier.
If FPUD starts to receive a surface water diversion from upstream of Lake Skinner, wheeled to it
by MWD, then it will have a relationship with MWD. But MWD will then be serving in the roles
of a treater of the water and a (partial) conveyor of the water, not as a supplier of that water.
7 FPUD 2020 Urban Water Management Plan, p2.
13
DRAFT SEPTEMBER 24, 2021
Q. Why does FPUD claim that MWD is its wholesale supplier?
A. FPUD is focusing on a detail of the water distribution system in the northern part of San
Diego County.
MWD’s water distribution line that comes down from Riverside County and connects to
SDCWA’s distribution system is owned by MWD for some of its length and by SDCA for the rest.
Although the county line demarcates the boundary of SDCWA’s service area, the county line did
not serve as the demarcation point between the portion of the pipeline controlled by MWD and
the portion controlled by SDCWA. Instead, the control demarcation points for Aqueducts 1, 2, 3
and 4 are located at varying distances into San Diego County.
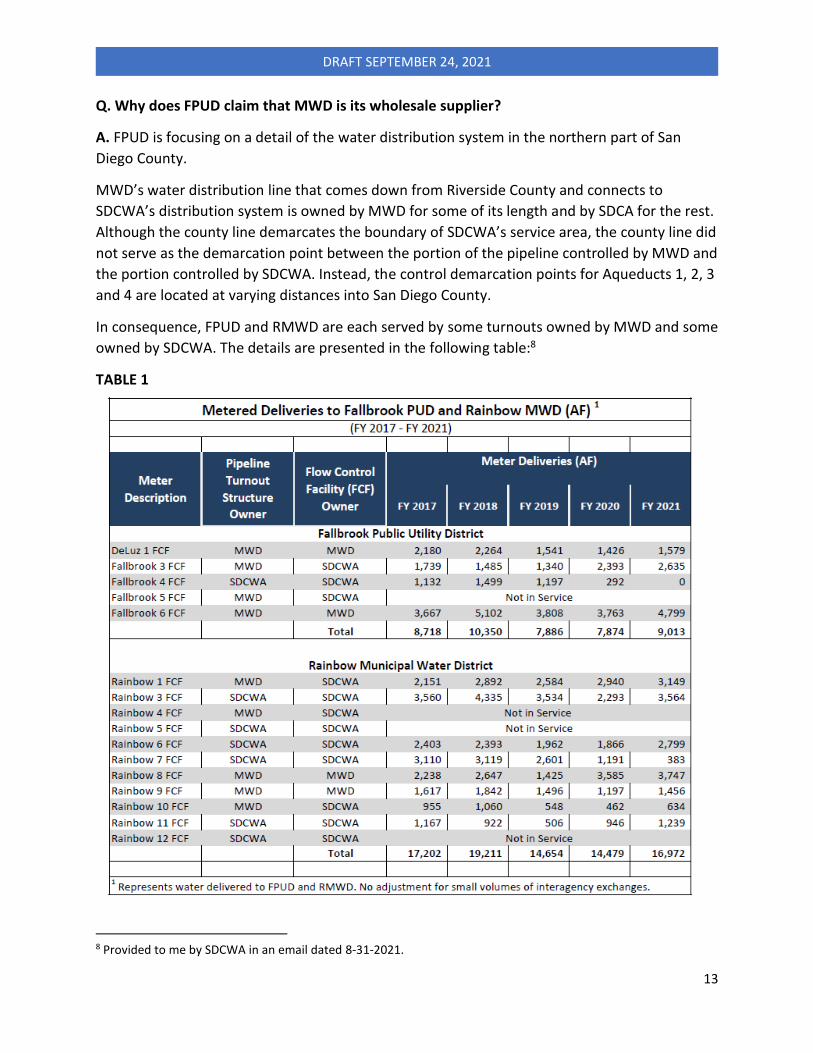
In consequence, FPUD and RMWD are each served by some turnouts owned by MWD and some
owned by SDCWA. The details are presented in the following table:8
TABLE 1
8 Provided to me by SDCWA in an email dated 8-31-2021.
14
DRAFT SEPTEMBER 24, 2021
As shown, FPUD is currently being served by three pipeline turnouts owned by MWD and one
owned by SDCWA. In 2021, for the first time, FPUD took delivery of no water from the turnout
owned by SDCWA.
RMUD is currently being served by four pipeline turnouts owned by MWD and by four owned
by SDCWA.
Q. Are there any other SDCWA member agencies that have turnouts on a portion of the
pipeline from Lake Skinner owned by MWD?
A. No. FPUD and RMWD are the only SDCWA member agencies located sufficiently far north in
San Diego County that they receive water from turnouts owned by MWD rather than SDCWA.
Q. Does the fact that MWD owns a turnout from which FPUD or RMWD receives water make
MWD a wholesale supplier to FPUD or RMWD?
A. No. The fact that MWD owns a turnout from which a SDCWA member agency receives water
does not make that member agency a wholesale customer – or any other form of customer – of
MWD. The member agency is solely a customer of SDCWA.
This is so for several reasons.
SDCWA is the entity that acquired the water from MWD.
SDCWA is the entity billed by MWD for the water.
SDCWA owns the water it obtains from MWD.
SDCWA, through its Board of Directors, controls the disposition of the water obtained from
MWD. The extent to which such water is made available to an SDCWA member agency is
decided by SDCWA’s Board of Directors.
Q. Does the fact that SDCWA waives its Transportation Charge for water received by FPUD
and RMWD from a turnout owned by MWD make that not SDCWA water?
A. No. The fact that SDCWA has decided to waive its Transportation Charge for water received
by FPUD and RMWD does not make this something other than SDCWA water, for the reasons
stated above.
15
DRAFT SEPTEMBER 24, 2021
Q. Is it the case that, if FPUD and RMWD exit from SDCWA, they still would end up receiving
the same MWD water from the same turnouts on the same pipes? Nothing would really
change?
A. No – that is not the case.
FPUD and RMWD would not receive water from turnouts owned by SDCWA.
More importantly, FPUD and RMWD would NOT be receiving the same water as they receive as
member agencies of SDCWA.
Q. Why will it not be the same water?
A. It will be water belonging to MWD and supplied by MWD, rather than water belonging to
SDCWA and supplied to FPUD and RMWD by SDCWA.
Q. How is water supplied by MWD different from water supplied by SDCWA?
A. It is different in source, it is different in supply reliability, it is different in pricing, and it is
different in Delta reliance.
Q. How is MWD water physically delivered by MWD to FPUD and RMWD different in source
from SDCWA water physically delivered by MWD to FPUD and RMWD?
A. SDCWA, as an MWD member agency, purchases water from MWD. But this is supplemental
water. SDCWA’s base water supply – water that it owns directly – consists of QSA water from
the Colorado River (canal lining water and IID Transfer water) and desalinated water from the
Carlsbad Facility.
MWD base supply – water that it owns directly – consists of water obtained under its right to
Colorado River and water purchased from IID, totaling approximately 600,000 AF, plus water
obtained by MWD through its 48% share of the SWP supply.
Q. Isn’t it true that MWD currently delivers to SDCWA some water from the SWP?
A. It is more complicated than that. MWD delivers molecules of SWP water to SDCWA in two
distinct capacities.
MWD delivers water to SDCWA as a supplier of water. MWD also delivers water as a conveyor
(wheeler) of water.
16
DRAFT SEPTEMBER 24, 2021
Q. What is the difference between MWD’s role as a supplier of water versus its role as a
conveyor of water?
A. As a supplier of water, MWD is both selling the water and transporting the water to SDCWA.
MWD owns the water supplied and it owns the conveyance facility. It charges for both the
water supplied and for the conveyance.
As a conveyor of water, MWD is just transporting water which it does not itself own – the water
is owned by SDCWA – and it is charging just for conveyance of SDCWA-owned water.
Q, Is conveying water the same as wheeling water?
A. A dictionary definition of wheeling water is the following:
“The conveying of water through the unused capacity in a pipeline or aqueduct by someone
other than the owner.”
There is a subtle distinction between wheeling water and what MWD does for SDCWA under
the 2003 Exchange Agreement between those two parties. Typically, wheeling occurs only if
there is available capacity in the pipeline. In this case, however, MWD committed to making
capacity available. SDCWA pays MWD a volumetric rate to cover MWD’s expenses in exchange
for the conveyance of water. “Unlike the wheeling context, the Exchange Agreement does not
literally call for the conveyance of water but instead for the exchange of water.”9
Q. Is MWD selling or conveying the QSA water it delivers to SDCWA?
A. This question was resolved in the course of rate litigation between SDCWA and MWD.
MWD had argued that the Exchange Agreement involved a purchase of water by SDCWA
because, under the agreement, SDCWA gives MWD water (QSA water) and money and obtains
from MWD different water – some blend of Colorado River water and SWP water.
The trial judge in San Francisco Superior court ruled against MWD and in favor of SDCWA. He
held that “San Diego is not purchasing water from Met. San Diego is exchanging water with Met
to make use of its own independent supplies. The parties agreed to exchange an equal amount
of water; the only water quality requirement was for Met to provide San Diego with water of at
least the same quality as the water Met received from San Diego. These facts underscore that
the Exchange Agreement was not an agreement pursuant to which San Diego obtained water
from Met, but instead an agreement pursuant to which Met in effect conveyed water on behalf
of San Diego. That the Exchange Agreement differs in some respects from a wheeling contract
9 Karnow, August 28, 2015, p.27.
17
DRAFT SEPTEMBER 24, 2021
does not mean that the Exchange Agreement was not in substance an agreement to convey,
rather than purchase water.”10
The trial judge’s ruling was relitigated before the California Court of Appeals in 2017. The Court
of Appeals upheld the trial court on this point. It stated:
“The trial court found ‘the Exchange Agreement was not an agreement pursuant to which [the
Water Authority] obtained water from [Metropolitan], but instead an agreement pursuant to
which [Metropolitan] in effect conveyed water on behalf of [the Water Authority].’ … We agree
with this conclusion.”11
The Appeals Court further stated: “The purpose, structure and terms of the [exchange] contract
make it clear that the Water Authority is not purchasing water from Metropolitan but from
Imperial. As the trial court rightly discerned, the Water Authority is exchanging water with
Metropolitan ‘to make use of its own independent supplies.’ … In agreeing to pay rates equal to
the Metropolitan-supplied water rates, the Water Authority did not agree it was purchasing
Metropolitan water. There was no purchase of Metropolitan water…”12
Q. When MWD delivers SWP water to SDCWA in exchange for QSA water, does it own that
SWP water?
A. When MWD delivers water to SDCWA in its role as a supplier of water, some of the MWD
supply is SWP water, and MWD can be considered to own that water.
When MWD delivers water to SDCWA in its role as a conveyor of QSA water, the water being
conveyed is water owned by SDCWA, regardless of whether it is actually Colorado River water
or SWP water being conveyed in exchange for SDCWA’s QSA water.
The water that MWD delivers to SDCWA under the exchange agreement in its role as conveyor
of water is owned by SDCWA, not by MWD; it counts as Colorado River water; and it comes
under SDCWA’s water right to Colorado River water, not under either MWD’s water right to
Colorado River water nor under MWD’s right to SWP water.
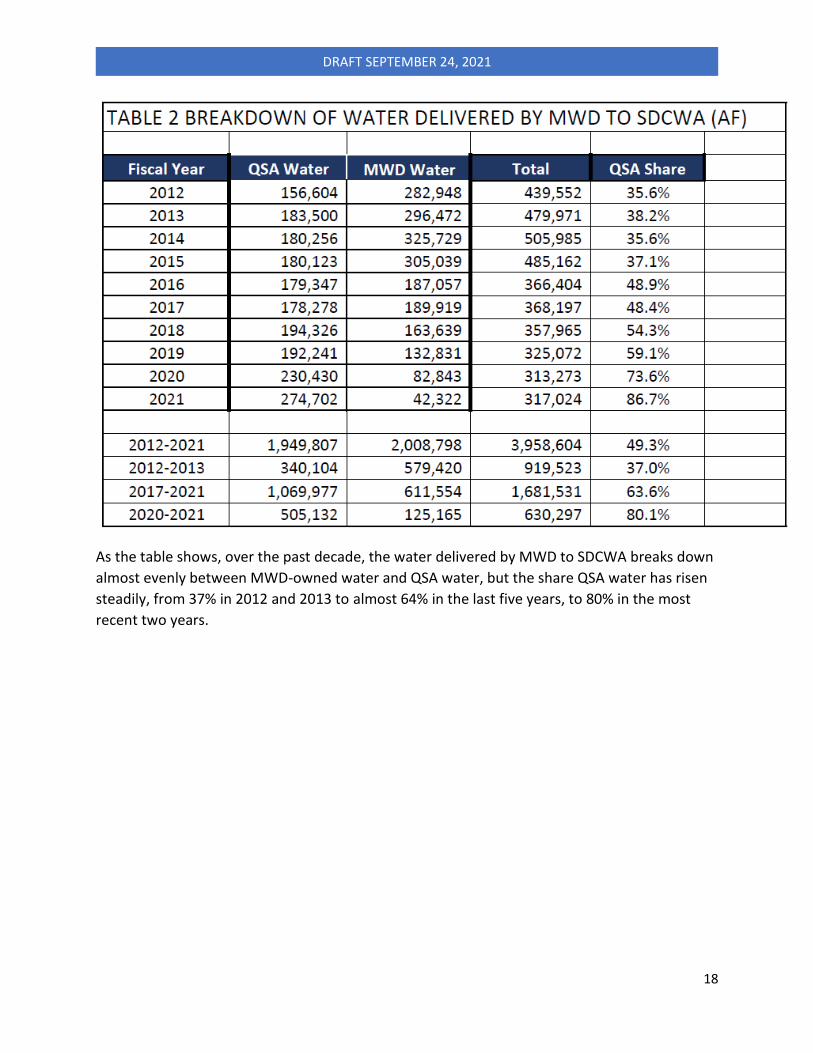
Q. Is most of the water delivered by MWD to SDCWA QSA water (i.e., MWD acts as a
conveyor of water) rather than MWD-owned water (i.e., MWD acts as a supplier)?
A. That was not true at first, but it is true now – see Table 2 below:13
10 Karnow, August 28, 2015, pp. 28-29. 11 12 13 This uses data provided to me by SDCWA in an email dated 9-2-2021.
18
DRAFT SEPTEMBER 24, 2021
As the table shows, over the past decade, the water delivered by MWD to SDCWA breaks down
almost evenly between MWD-owned water and QSA water, but the share QSA water has risen
steadily, from 37% in 2012 and 2013 to almost 64% in the last five years, to 80% in the most
recent two years.
19
DRAFT SEPTEMBER 24, 2021
2. HOW DID DETACHMENT COME TO BE AN ISSUE
Q. Are FPUD and RMWD different from other SDCWA member agencies?
A. Two features stand out as points of some difference between FPUD and RMWD versus other
SDCWA member agencies.
First, as noted above, FPUD and RMWD are the only member agencies located sufficiently far
north in San Diego County that they receive water from turnouts owned by MWD rather than
by SDCWA.
Second, FPUD and RMWD are heavily agricultural users of water. Agricultural water use in
SDCWA’s service area overall amounted to about 37,050 AF, or 8% of total water use in the
service area in 2020.14 However, in RMWD agricultural use amounted to 8,876 AF out of a total
use of 14,297 AF in 2020, or 62%. 15 FPUD had about 2,676 AF of agricultural use, or about 30%
of total water use.16
Other SDCWA member agencies with significant levels of agricultural use include Valley Center
MWD, Ramona MWD, Yuima MWD and the City of Escondido, all located in the northern parts
of the County.
The primary crops grown by SDCWA’s agricultural water users include avocado, citrus, cut-
flowers, vegetables, vine crops and nursery products. These are generally high value
agricultural crops. Nevertheless, a high price for water is an issue for many agricultural
producers, even of high value crops. And SDCWA’s charges for water have risen significantly
over the past 20 years.
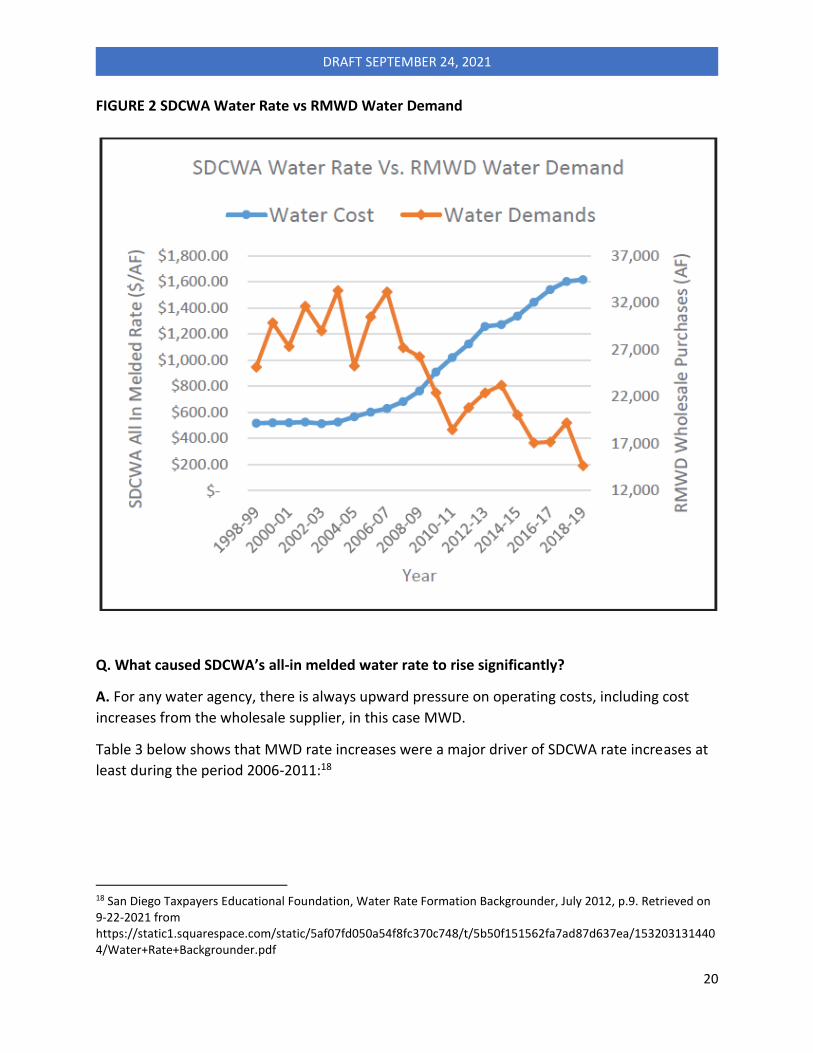
As an illustration of the upward trend in the cost of SDCWA water, Figure 2 reproduces a chart
prepared by RMWD and presented to the RMWD Board of Directors on December 3, 2019
plotting the SDCWA all-in melded water rate from FY 1999 through FY 2019.17
The all-in melded rate was roughly $500/AF in FY 1999 and had been at about that level for at
least two years earlier and it started to rise significantly around 2008, reaching around
$1,000/AF around 2010 and $1,600/AF in 2019.
14 SDCWA 2020 Urban Water Management Plan p. ES-1. 15 RMWD 20202 Urban Water Management Plan, Table 4-1, p. 4-1. 16 FPUD 2020 Urban Water Management Plan p. 12. 17 Memorandum Subject: Consider Adoption of a Resolution of Application Authorizing the General Manager to Prepare and Submit an Application to the San Diego LAFCO to detach from SDCWA and Annex to EMWD.” Page 46 of 238.
20
DRAFT SEPTEMBER 24, 2021
FIGURE 2 SDCWA Water Rate vs RMWD Water Demand
Q. What caused SDCWA’s all-in melded water rate to rise significantly?
A. For any water agency, there is always upward pressure on operating costs, including cost
increases from the wholesale supplier, in this case MWD.
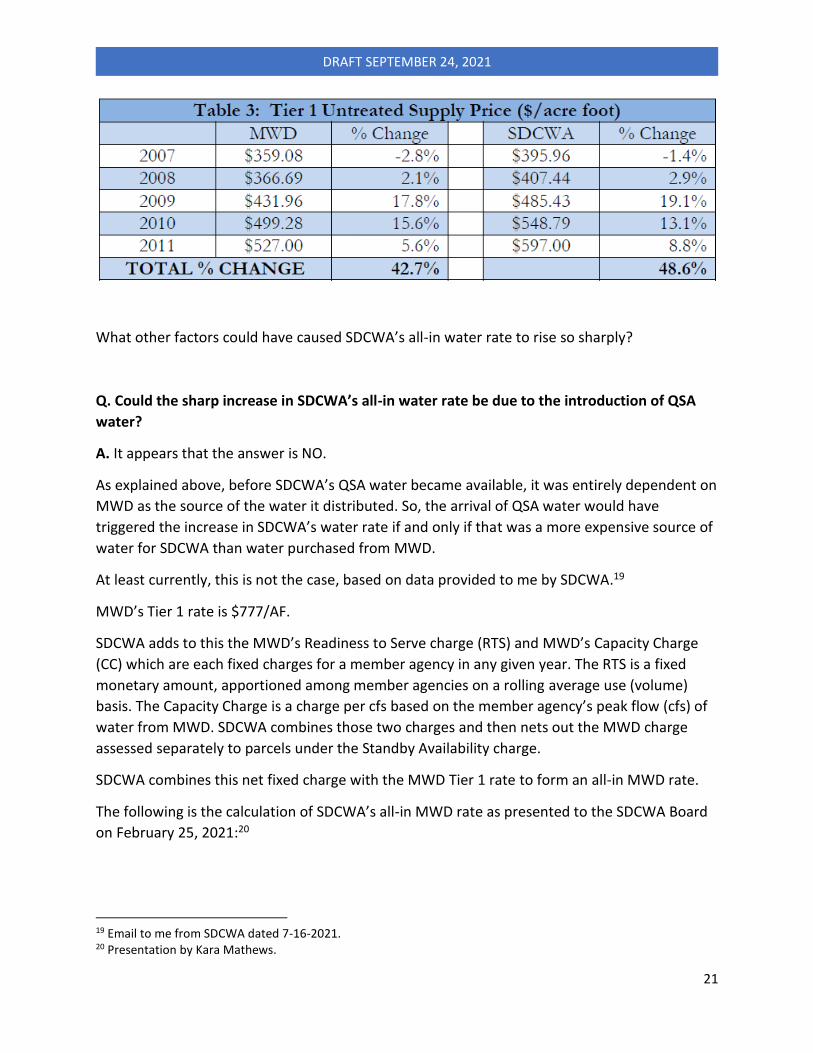
Table 3 below shows that MWD rate increases were a major driver of SDCWA rate increases at
least during the period 2006-2011:18
18 San Diego Taxpayers Educational Foundation, Water Rate Formation Backgrounder, July 2012, p.9. Retrieved on 9-22-2021 from https://static1.squarespace.com/static/5af07fd050a54f8fc370c748/t/5b50f151562fa7ad87d637ea/1532031314404/Water+Rate+Backgrounder.pdf
21
DRAFT SEPTEMBER 24, 2021
What other factors could have caused SDCWA’s all-in water rate to rise so sharply?
Q. Could the sharp increase in SDCWA’s all-in water rate be due to the introduction of QSA
water?
A. It appears that the answer is NO.
As explained above, before SDCWA’s QSA water became available, it was entirely dependent on
MWD as the source of the water it distributed. So, the arrival of QSA water would have
triggered the increase in SDCWA’s water rate if and only if that was a more expensive source of
water for SDCWA than water purchased from MWD.
At least currently, this is not the case, based on data provided to me by SDCWA.19
MWD’s Tier 1 rate is $777/AF.
SDCWA adds to this the MWD’s Readiness to Serve charge (RTS) and MWD’s Capacity Charge
(CC) which are each fixed charges for a member agency in any given year. The RTS is a fixed
monetary amount, apportioned among member agencies on a rolling average use (volume)
basis. The Capacity Charge is a charge per cfs based on the member agency’s peak flow (cfs) of
water from MWD. SDCWA combines those two charges and then nets out the MWD charge
assessed separately to parcels under the Standby Availability charge.
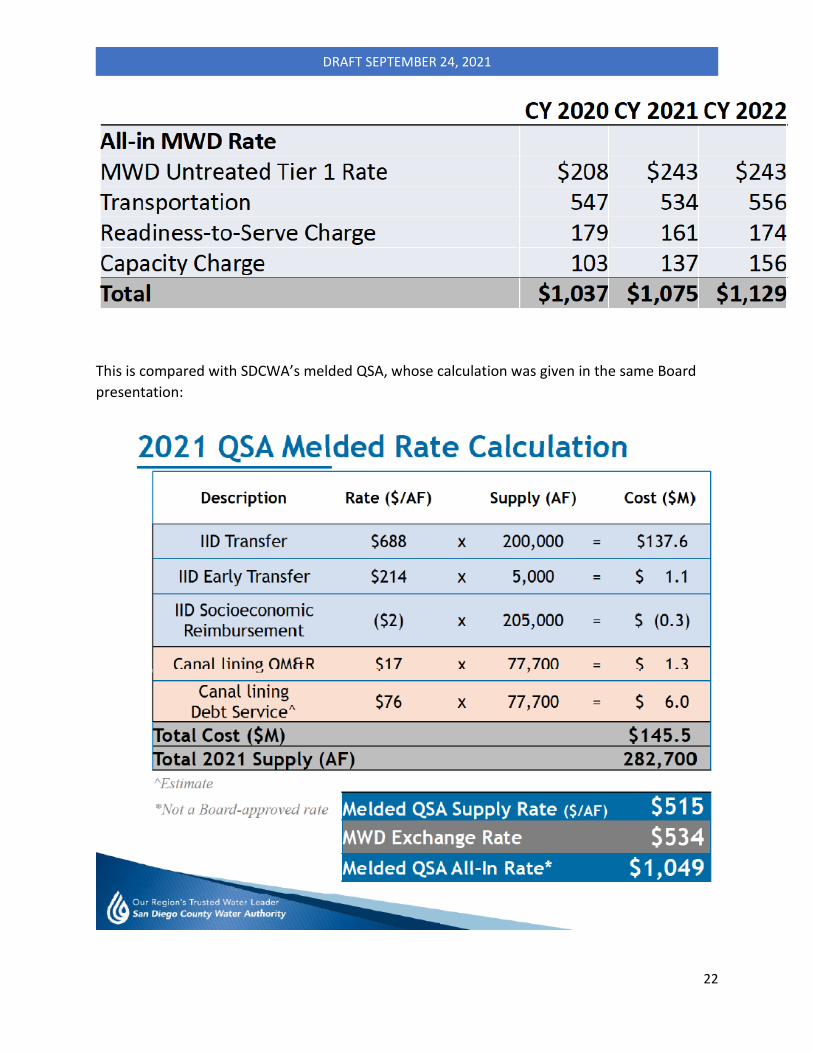
SDCWA combines this net fixed charge with the MWD Tier 1 rate to form an all-in MWD rate.
The following is the calculation of SDCWA’s all-in MWD rate as presented to the SDCWA Board
on February 25, 2021:20
19 Email to me from SDCWA dated 7-16-2021. 20 Presentation by Kara Mathews.
22
DRAFT SEPTEMBER 24, 2021
This is compared with SDCWA’s melded QSA, whose calculation was given in the same Board
presentation:
23
DRAFT SEPTEMBER 24, 2021
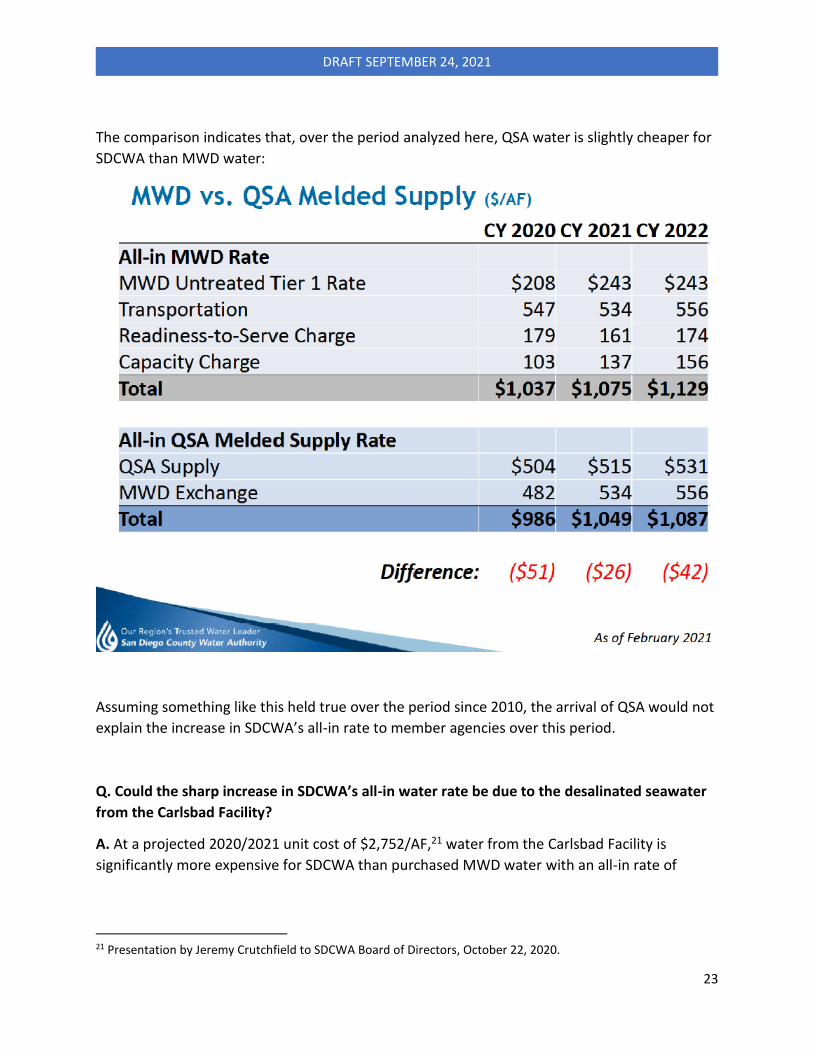
The comparison indicates that, over the period analyzed here, QSA water is slightly cheaper for
SDCWA than MWD water:
Assuming something like this held true over the period since 2010, the arrival of QSA would not
explain the increase in SDCWA’s all-in rate to member agencies over this period.
Q. Could the sharp increase in SDCWA’s all-in water rate be due to the desalinated seawater
from the Carlsbad Facility?
A. At a projected 2020/2021 unit cost of $2,752/AF,21 water from the Carlsbad Facility is
significantly more expensive for SDCWA than purchased MWD water with an all-in rate of
21 Presentation by Jeremy Crutchfield to SDCWA Board of Directors, October 22, 2020.
24
DRAFT SEPTEMBER 24, 2021
$1,075/AF. But this is unlikely to explain most of the escalation in the SDCWA’s all-in water rate
for two reasons.
First, the sharp increase in SDCWA’s all-in rate began around 2010, but SDCWA did not start
receiving Carlsbad water until 2016.
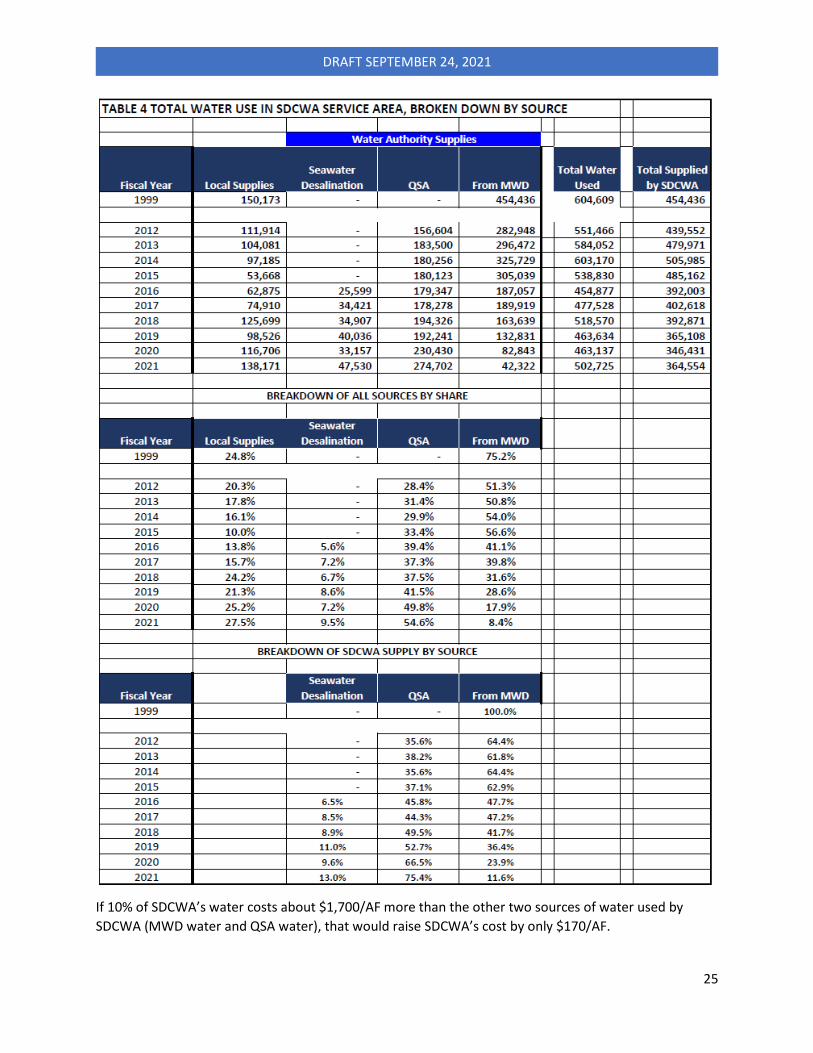
Second, between 2016 and 2020, Carlsbad water accounted for only 10% or less of the water
delivered by SDCWA -- see Table 4.
25
DRAFT SEPTEMBER 24, 2021
If 10% of SDCWA’s water costs about $1,700/AF more than the other two sources of water used by
SDCWA (MWD water and QSA water), that would raise SDCWA’s cost by only $170/AF.
26
DRAFT SEPTEMBER 24, 2021
Therefore, it does not appear that bringing online water from the Carlsbad Desalination Facility provides
a major explanation for the sharp increase in SDCWA’s all-in water rate after 2010.
Q. Did anything else change that could explain the sharp increase in SDCWA’s all-in water rate
after 2010?
A. Figure 2 depicts something else that changed over this period – a dramatic reduction in the
amount of water purchased by RMWD from SDCWA – this fell by half, from being somewhere in
the range of 27,000 – 32,0000 AF through about 2006 to around 15,000 AF by 2019.
The reduction in water use demand may have been especially pronounced in RMWD because of
the large component of agricultural water use, which is likely to be more price-sensitive than
urban use generally. However, striking reduction in water use was occurring at this time
throughout SDCWA’s service area. This phenomenon was not limited to RMWD.
Figures 3 and 4 provide evidence of a general decline in water use throughout SDCWA’s service
area.
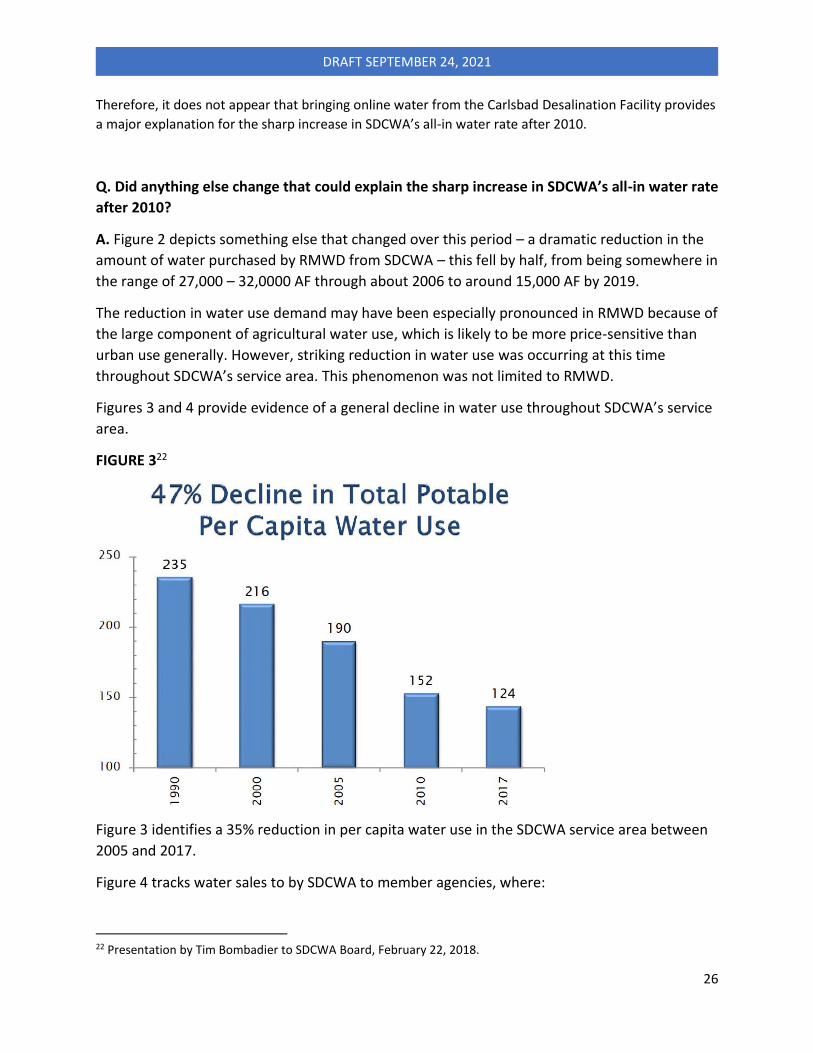
FIGURE 322
Figure 3 identifies a 35% reduction in per capita water use in the SDCWA service area between
2005 and 2017.
Figure 4 tracks water sales to by SDCWA to member agencies, where:
22 Presentation by Tim Bombadier to SDCWA Board, February 22, 2018.
27
DRAFT SEPTEMBER 24, 2021
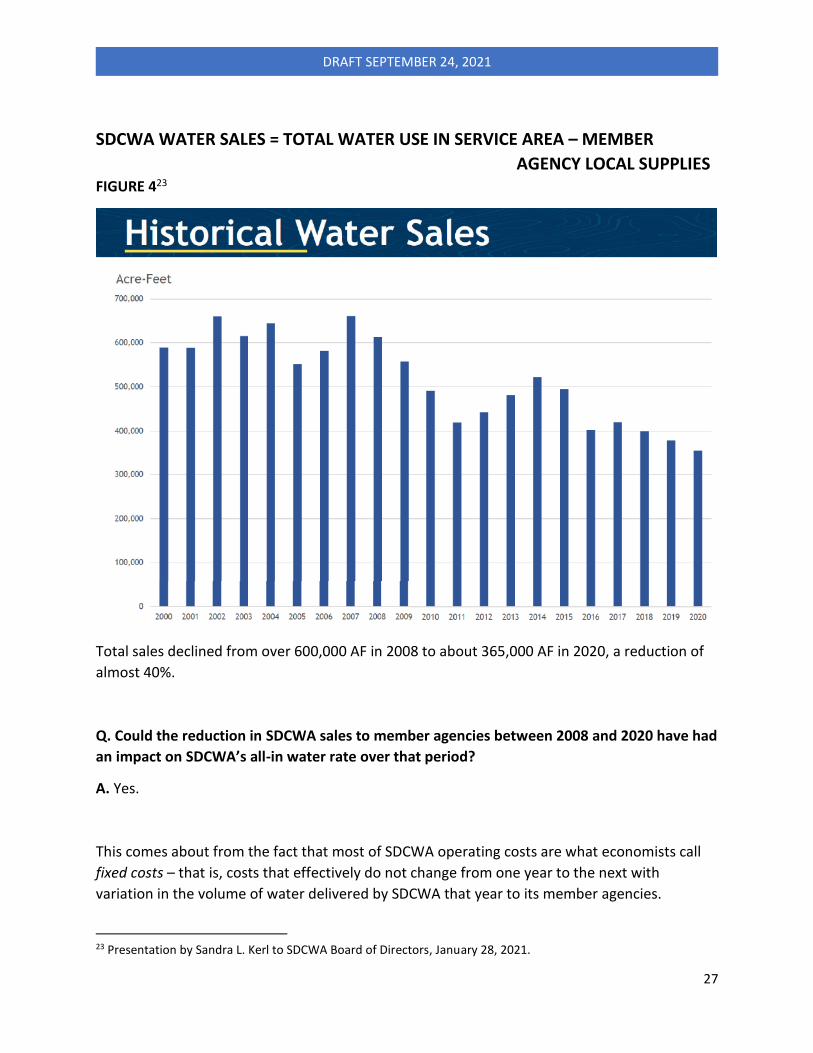
SDCWA WATER SALES = TOTAL WATER USE IN SERVICE AREA – MEMBER
AGENCY LOCAL SUPPLIES FIGURE 423
Total sales declined from over 600,000 AF in 2008 to about 365,000 AF in 2020, a reduction of
almost 40%.
Q. Could the reduction in SDCWA sales to member agencies between 2008 and 2020 have had
an impact on SDCWA’s all-in water rate over that period?
A. Yes.
This comes about from the fact that most of SDCWA operating costs are what economists call
fixed costs – that is, costs that effectively do not change from one year to the next with
variation in the volume of water delivered by SDCWA that year to its member agencies.
23 Presentation by Sandra L. Kerl to SDCWA Board of Directors, January 28, 2021.
28
DRAFT SEPTEMBER 24, 2021
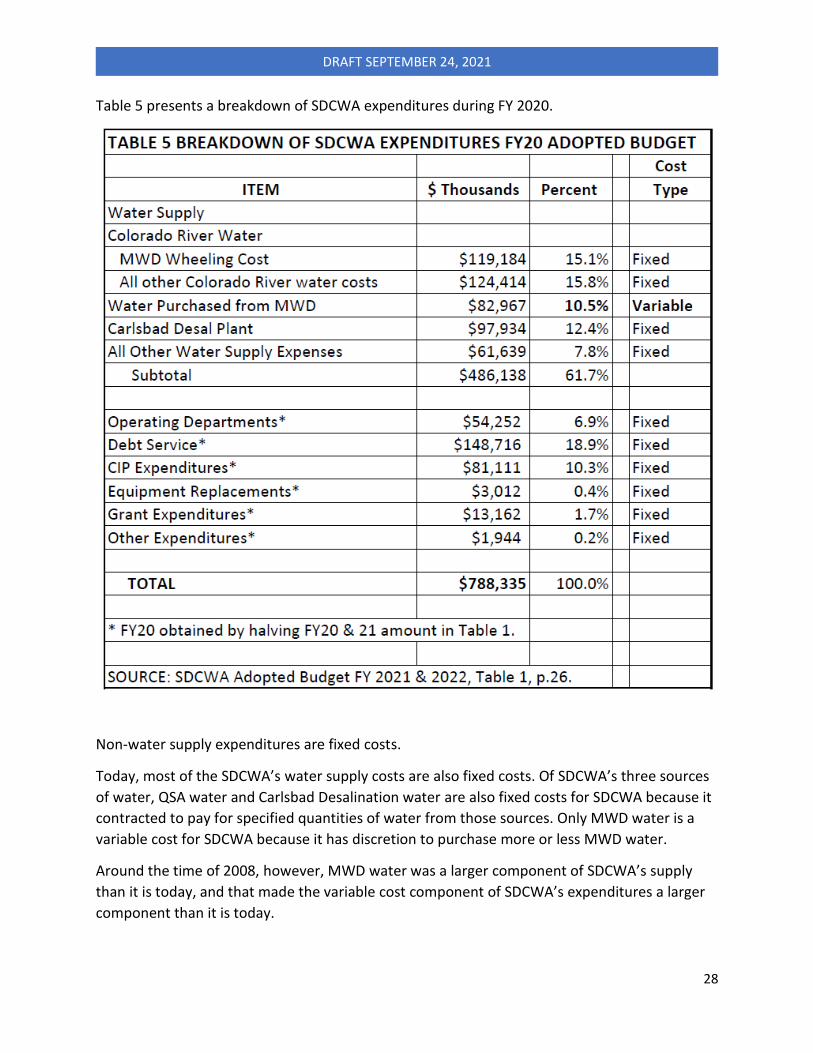
Table 5 presents a breakdown of SDCWA expenditures during FY 2020.
Non-water supply expenditures are fixed costs.
Today, most of the SDCWA’s water supply costs are also fixed costs. Of SDCWA’s three sources
of water, QSA water and Carlsbad Desalination water are also fixed costs for SDCWA because it
contracted to pay for specified quantities of water from those sources. Only MWD water is a
variable cost for SDCWA because it has discretion to purchase more or less MWD water.
Around the time of 2008, however, MWD water was a larger component of SDCWA’s supply
than it is today, and that made the variable cost component of SDCWA’s expenditures a larger
component than it is today.
29
DRAFT SEPTEMBER 24, 2021
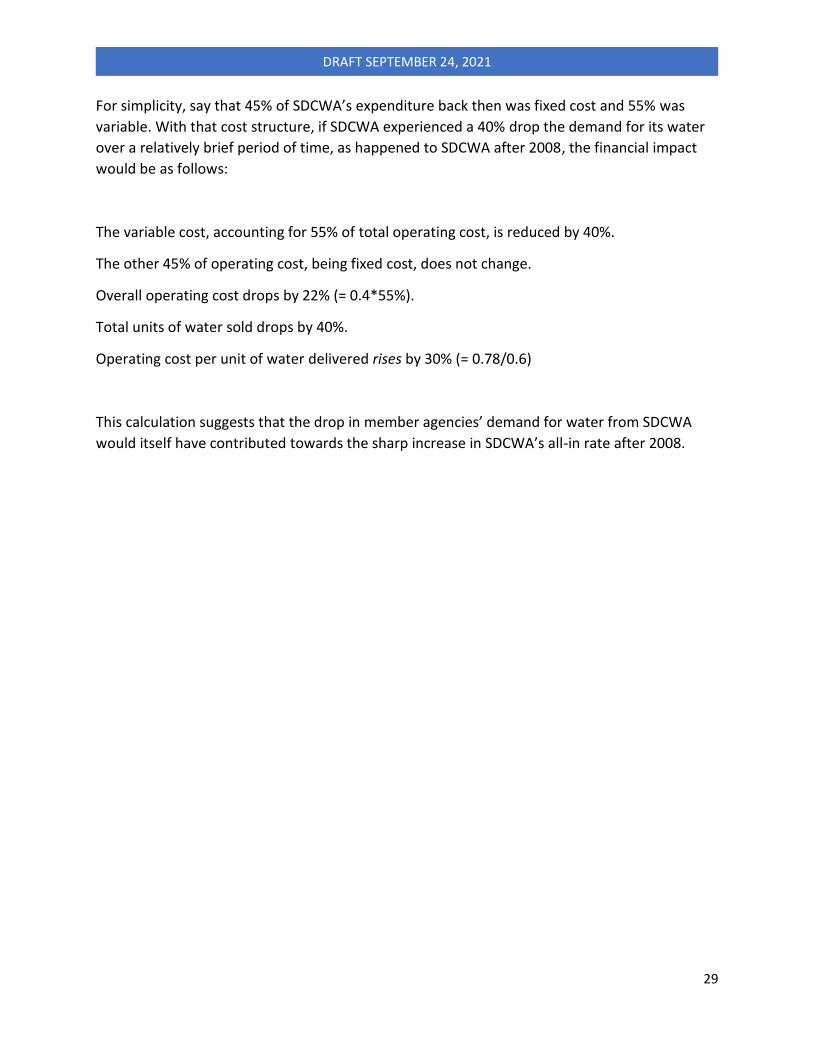
For simplicity, say that 45% of SDCWA’s expenditure back then was fixed cost and 55% was
variable. With that cost structure, if SDCWA experienced a 40% drop the demand for its water
over a relatively brief period of time, as happened to SDCWA after 2008, the financial impact
would be as follows:
The variable cost, accounting for 55% of total operating cost, is reduced by 40%.
The other 45% of operating cost, being fixed cost, does not change.
Overall operating cost drops by 22% (= 0.4*55%).
Total units of water sold drops by 40%.
Operating cost per unit of water delivered rises by 30% (= 0.78/0.6)
This calculation suggests that the drop in member agencies’ demand for water from SDCWA
would itself have contributed towards the sharp increase in SDCWA’s all-in rate after 2008.
30
DRAFT SEPTEMBER 24, 2021
3. THE FINANCIAL IMPACT OF DETACHMENT
This section analyzes the financial impact on the other member agencies of SDCWA is FPUD
or/and RMWD detach from SDCWA.
The detachment of a member agency reduces the revenues received by SDCWA. It also may
reduce the expenses incurred by SDCWA in operating in water supply and distribution system.
The key question will be the net impact: will revenues be reduced by more or less than
operations expenses?
Q. How large are FPUD and RMWD in relation to the other SDCWA member agencies?
A. FPUD and RMWD accounted for 1.7%24 of the population served by SDCWA in FY 2020 and
8.1%25 of the acreage in SDCWA’s service area.26 In FY2020, FPUD and RMWD together
received 6.4%27 of the water delivered by SDCWA in FY 2020 to member agencies, which
represents a higher rate of usage per capita, but not per acre, than the average across all
member agencies.
In FY 2019, FPUD and RMWD together accounted for 5.9% of the water supplied by SDCWA to
member agencies, while at the same time accounting for 2.9% of the meter equivalents.
Specifically, In FY 2019 FPUD and RMWD received 22,253 AF from SDCWA for use by their
26,542 meter equivalents (ME), amounting to a usage of 0.8384 AF per ME. In FY 2019, the
other member agencies combined received 356,277 AF for use by 898,551 ME, amounting to an
average usage of 0.3965 AF per ME.
The average usage of SDCWA water per meter equivalent within the FPUD and RMWD service
areas in FY 2019 was more than twice that of the other member agencies (0.8384 AF/ME versus
0.3965 AF/ME).
Going forward, FPUD’s share of water delivered to SDCWA member agencies will fall as the
Santa Margarita Conjunctive-Use Project comes on line.
Moreover, about 42% of the water received by FPUD and RMWD has come under the SDCWA’s
Permanent Special Agricultural Water Rate (PSAWR) program for agricultural water users in the
SDCWA service area. Under this program, eligible agricultural users served by member agencies
pay a reduced rate water, which sets the supply charge as equivalent to MWD’s Tier 1 rate and
adds in SDCWA’s charges for treatment, transportation and customer service while omitting
SDCWA’s storage and supply reliability charges. For CY 2021, this lowers SDCWA’s melded all-in
24 = 54,944/323,060.6. 25 = 75,658/934,777.5. 26 These and the following statistics are taken from the SDCWA Annual Report FY 2020, consulted online at sdcwa.org/annualreport/2020/diversification-and-operation/water-sources-and-uses.php on 6/11/2021. 27 =22,278.9/346,430.9.
31
DRAFT SEPTEMBER 24, 2021
rate for treated water from $1,769/AF for municipal and industrial (M&I) users to $1,295/AF for
agricultural users under the PSAWR program. In exchange for the lower water rate, agricultural
users receive a less reliably water supply. They are subject to higher cutbacks compared to M&I
users in the event of a supply limit imposed by MWD (“an allocation”) or other water shortages
faced by SDCWA. If MWD imposes a reduction in its supply of MWD water (as opposed to QSA
water), deliveries to PSAWR users will be cut in the proportion used by MWD even if SDCWA
cuts deliveries to M&I users by less due to the availability of QSA water and Carlsbad water.
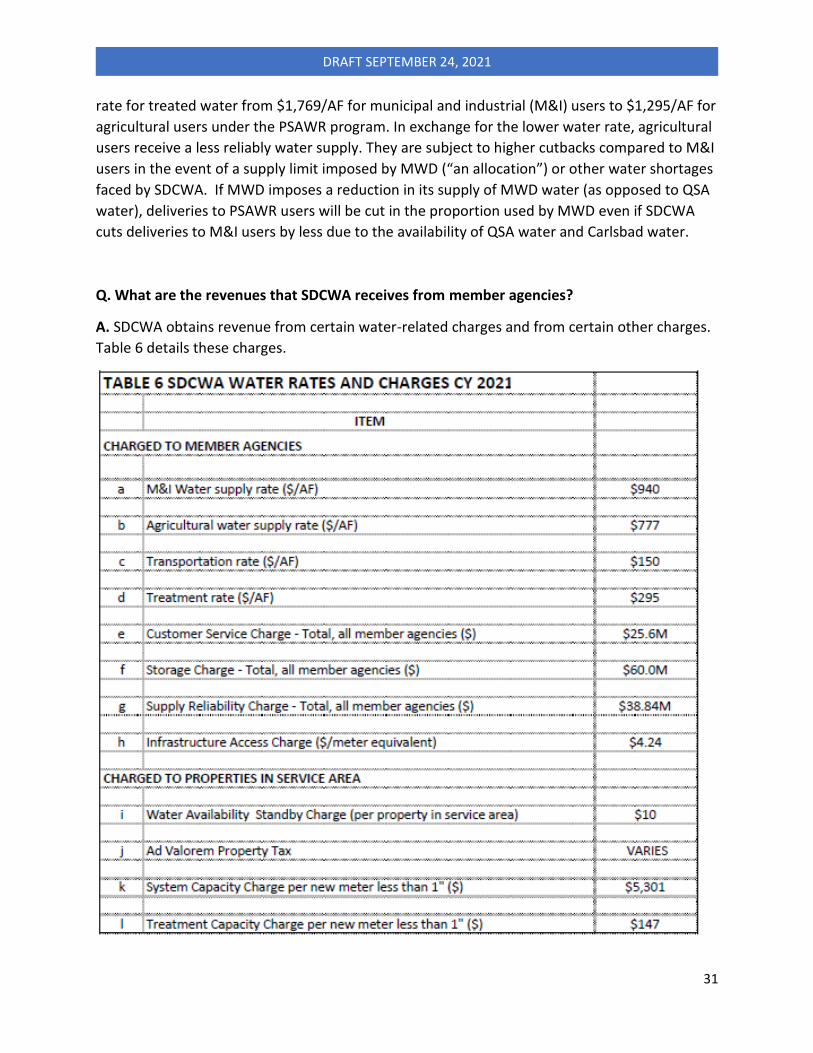
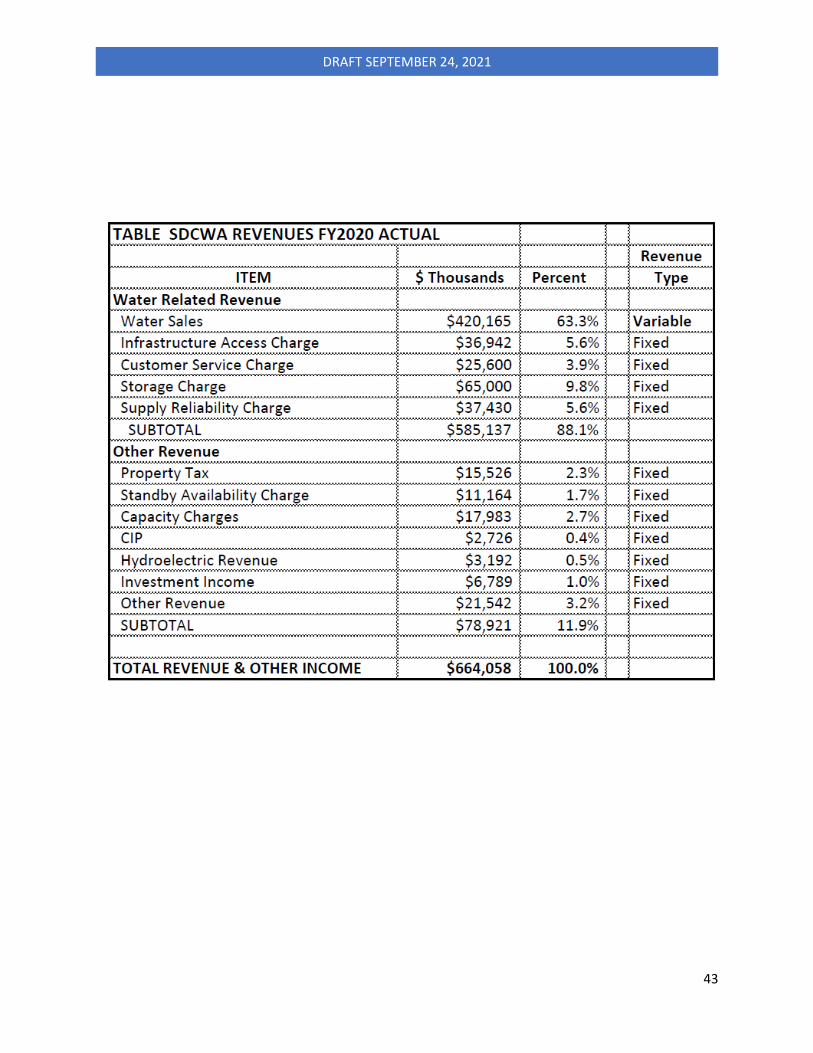
Q. What are the revenues that SDCWA receives from member agencies?
A. SDCWA obtains revenue from certain water-related charges and from certain other charges.
Table 6 details these charges.
32
DRAFT SEPTEMBER 24, 2021
Some of the items are charged to member agencies (items a-h), and others are charged to
properties in the SDCWA service area (i-l).
Depending on the item, charges to member agencies vary by acre-feet of water supplied each
month (items a-d), by the individual agency’s share of the acre-feet supplied to all member
agencies over a past three-year period (e,f) or five-year period (g), or by the number of
individual meter equivalents served by the agency in the previous year (h).
Q. If FPUD and/or RMWD leave SDCWA’s service area, which of SDCWA’s revenue sources
would be reduced?
A. If FPUD and/or RMWD leave SDCWA’s service area, SDCWA’s revenue from each item in the table will
be reduced.
For each acre-foot less of water supplied by SDCWA, it foregoes $1,090 (= 940 + 150) if the water is
untreated and delivered by a member agency for M&I use, and $1,385 (= 1,090 + 295) if it is treated.
If the water is delivered for agricultural use, SDCWA charges a member agency only $927 (= 777 + 150) if
the water is untreated, and $1,222 (= 927 + 295) if it is treated. In doing this, SDCWA is reducing the
commodity supply rate for water for agricultural use from the standard level of $940 to a rate of $777,
which corresponds to MWD’s Tier 1 rate for untreated water. In exchange for receiving the lower supply
rate, agricultural customers of a member agency receive a less reliable water supply with a higher
likelihood of being cut back in the event of shortage than M&I customers.28
The volumetric rates (a-d) represent the most highly variable sources of revenue for SDCWA. The least
variable sources of revenue are the Water Availability Standby Charge and the ad valorem property tax
(items i and j).29 Intermediate in variability are items (e - h). These are fixed annual charges to member
agencies designed to cover specific types of fixed costs incurred in connection with SDCWA’s supply
system.
Q. If FPUD and RMWD were not member agencies of SDCWA, how much lower would
SDCWA’s annual revenue be?
A. SDCWA submitted its analysis of this question in its memorandum to LAFCO on 9-18-2020.30
That analysis was conducted using SDCWA’s internal financial model, run in two modes: (1)
28 This reflects the lower supply reliability of water obtained by SDCWA from MWD as compared to SDCWA’s own
sources (Colorado River and desalination). In the event of a shortage, SDCWA deliveries to member agencies for
agricultural customers are cut back by the same percentage that MWD cuts its deliveries.
29 The capacity charges (items k and l) are a one-time fee collected whenever a water delivery system is expanded to include new development. 30 SDCWA Combined Response to Reorganization Applications by Fallbrook/Rainbow, Sep 18, 2020, pp. 54-62.
33
DRAFT SEPTEMBER 24, 2021
with FPUD and RMWD members (the present situation), and (2) with FPUD and RMWD not
members (i.e. detachment).
I conducted an independent analysis using readily available published data, including SDCWA’s
Comprehensive Annual Financial Report and Carollo Inc’s CY 2022 Cost of Service Study for
SDCWA.31
SDCWA calculated that its revenue would be $40.0 million lower if FPUD and RMWD both
detached, broken down as a $13.8 million revenue reduction if FPUD detached and a $26.3
revenue reduction if RMWD detached. My own analysis, which was necessarily less precise,
supported that conclusion: my estimate was a combined revenue reduction of $39.1 million.
Q. If FPUD and RMWD were not member agencies of SDCWA, how much lower would
SDCWA’s expenditures be?
A. SDCWA and I each analyzed this question, but my analysis lacked one element of the SDCWA
analysis.
We both examined SDCWA’s water-related operating expenses. Here, SDCWA estimated an
expenditure reduction of $27.2 million. My estimate was essentially identical – an expenditure
reduction of $27.5 million.
The element I could not assess was SDCWA’s management of its reserve accounts. Like any
other utility, SDCWA holds certain reserve accounts which are required to cover covenants on
its outstanding debt or are designed to provide some cover against future volatility in sales.
Depending on the circumstances, in any given year, SDCWA may find it needs to add to its
reserves (requiring it to raise its rates that year so as to bring in additional revenue to meet the
requirement for increased reserves) or it may find that it can draw down its reserves to some
degree (permitting it to have lower rates that year because it can use funds drawn from the
reserves to cover some of its cost of operations).
SDCWA included the reserve component into its analysis, but I was not able to account for this.
SDCWA concluded that, with detachment of FPUD and RMWD, it would have been able to draw
on $3.6 million less of its reserve.
SDCWA calculated the current-year net effect of detachment at $16.4 million in reduced net
revenue, which would have to be made up in higher payments by the other member agencies.
This was broken down into a net impact of $5.7 million for FPUD detachment and $10.7 million
for RMWD detachment. Given that my own analysis dovetails with SDCWA’s analysis with
respect to the impacts of detachment on SDCWA water-related revenue and on water-related
31 I presented my preliminary analysis to the Ad Hoc Advisory Committee at its meeting on June 14, 2021, and I presented a revised analysis to the Ad Hoc Advisory Committee at its meeting on July 12, 2021.
34
DRAFT SEPTEMBER 24, 2021
operating expenses, the estimate of $16.4 million for the current year net impact of
detachment seems reasonable.
Q. Is a one-year analysis of the net financial impact conclusive?
A. No.
In the water business, conditions can vary from one year to another, as Table 4 above suggests.
Weather conditions are different. Water use varies. Member agencies’ demands on SDCWA
vary. Streamflow that supports supplies available to SDCWA from both the Colorado River and
the SWP vary. Also, what is needed to support SDCWA’s reserves accounts varies.
The consequence is that one obtains a more realistic assessment of the financial impact of
detachment by performing a multi-year assessment rather than an analysis of a single year
Q. What does a multi-year analysis of the net financial impact of detachment show?
A. SDCWA also presented a multi-year analysis of the financial impact of detachment as
projected over the decade from CY 2022 through CY 2031. For this purpose, SDCWA used its
internal projection of member agencies’ annual demands for SDCWA water over this future
decade, combined with the internal financial model for planning reserve additions and draw
downs.
In that analysis, the annual financial impact of detachment by both FPUD and RMWD varied
from year to year, depending on circumstances. The largest annual impact was a reduction of
$45.7 million in net revenue, and the smallest a reduction of $11.2 million. The median was an
annual reduction of $33.9 million.
Q. How large is this net financial impact in relation to SDCWA’s total water-related revenue
and water-related operating expenses?
A. In FY 2020, SDCWA’s operating revenues and expenses totaled around $569 million. If one
takes the range of $16.4 million to $33,9 million as the central estimate for the reduction in
annual net revenue, that corresponds to a reduction ranging from 2.9% to 6.0% of annual
operating revenue.
Q. Is this just a one-year impact to net revenue?
A. No.
35
DRAFT SEPTEMBER 24, 2021
It is a recurring annual loss of net revenue once the detachment occurs, lasting for as long as
SDCWA does not have another buyer for the water that it would have sold to FPUD and RMWD.
Q. Why does it impose a net cost on SDCWA when it sells less water to a member agency?
A. There is a fiscal imbalance between SDCWA’s cost structure and its revenue structure.
In FY 2020, SDCWA supplied 354,007 AF to member agencies and earned $585.1 million in
water related revenue. That corresponds to an all-in rate of $1,653/AF (= 420,165
million/354,007 AF).
If SDCWA supplied one less acre-foot to a member agency in FY 2020, it surrendered about
$1,188 of water-related operating revenue, since the per-acre-foot component of SDCWA’s
water charges account for about 71.9% of its total water related revenue, the rest being the
fixed charges – the Infrastructure Access Charge, the Customer Service Charge, the Storage
Charge and the Supply Reliability Charge.32
However, if SDCWA supplied one less acre-foot to a member agency in FY 2020, it reduced its
operating expenses by about $253, since I estimate that variable water costs amount to about
15.3% of its operating expenses.33
The fiscal imbalance for SDCWA is that, if it supplies one less acre-foot to member agencies, it
surrenders about $1,188 in revenue but it lowers its expenses by only about $253, generating a
potential deficit of $935.
32 1188 = 0.719*1653. 33 253 = 0.153*1653.
36
DRAFT SEPTEMBER 24, 2021
4. A DEPARTURE FEE
One of the items I was asked to address is a potential departure fee. I was tasked with
quantifying what - if any - departure fee (also referred to as exit charge) should be made a
condition if the San Diego County LAFCO Commission approves either or both of the de-
annexation proposals submitted by FPUD and RMWD.
I am aware that there is currently disagreement among some of the parties with respect to
whether LAFCO has the legal authority to prescribe conditions of approval that include financial
terms such as a departure fee. I am not being asked to opine on this legal question. I am being
asked, instead, to examine whether there is a sound economic justification for requiring a
departure fee and, if so, what is an appropriate amount for that fee.
Q. Is there a sound economic justification for requiring a departure fee?
A. Yes.
Since 1990, SDCWA has made major infrastructure investments and has taken on substantial
contractual commitments for a more reliable water supply. The infrastructure investments and
supply commitments have benefited all member agencies. These commitments are long-term
in nature, and they impose a fixed and ongoing financial burden on SDCWA and its member
agencies.
Q. What is the purpose of a departure fee?
A. The purpose of a departure fee is to provide an appropriate level of protection for SDCWA
and the remaining member agencies in the short run while they adjust to the changed situation
of a departure. The purpose is to cover SDCWA financial obligations that are fixed, ongoing and
unavoidable after the departure for the duration of a period of adjustment.
The aim is to promote flexibility and efficiency in the management of scarce water resources
and in the operation of a supply network that is essential to the wellbeing of the regional
economy. It is not appropriate that the departure fee afford such protection in perpetuity. It is
important that SDCWA and all its member agencies receive an economic signal about the need
for efficient network organization and rationalization. Compensation in perpetuity would work
against the objective of promoting the efficient use of the region’s water infrastructure assets.
Q. What portion of SDCWA’s outstanding water-supply related obligations should serve as
the basis for a departure fee?
A. That is a judgment call.
37
DRAFT SEPTEMBER 24, 2021
On the one hand, like every other SDCWA member agency, FPUD and RMWD have benefited
from all of the financial obligations incurred by SDCWA because member agencies are bound
together by an integrated infrastructure network. Each member agency benefits to some
degree from all investments in the infrastructure either directly or indirectly.
A member agency benefits directly from an investment in a particular source of supply or in a
particular component of the infrastructure if it is directly served by that particular
infrastructure component or it directly receives water from that particular supply source. But,
even if a member agency is not served directly by that particular component and does not
directly receive water from that particular supply source, the member agency still benefits
indirectly through being part of an integrated water distribution network. If other member
agencies receive water from particular source or through that particular component, it makes it
possible for this member agency to receive water from another source within SDCWA’s
portfolio, thereby benefiting indirectly.
On the other hand, it is reasonable to recognize that FPUD and RMWD are in a somewhat
special situation by virtue of both their particular location at the furthest end of SDCWA’s
distribution system and their rural and agricultural local economies.
In the light of these factors, I recommend that a departure fee target the portion of SDCWA’s
outstanding obligations that relates specifically to QSA water.
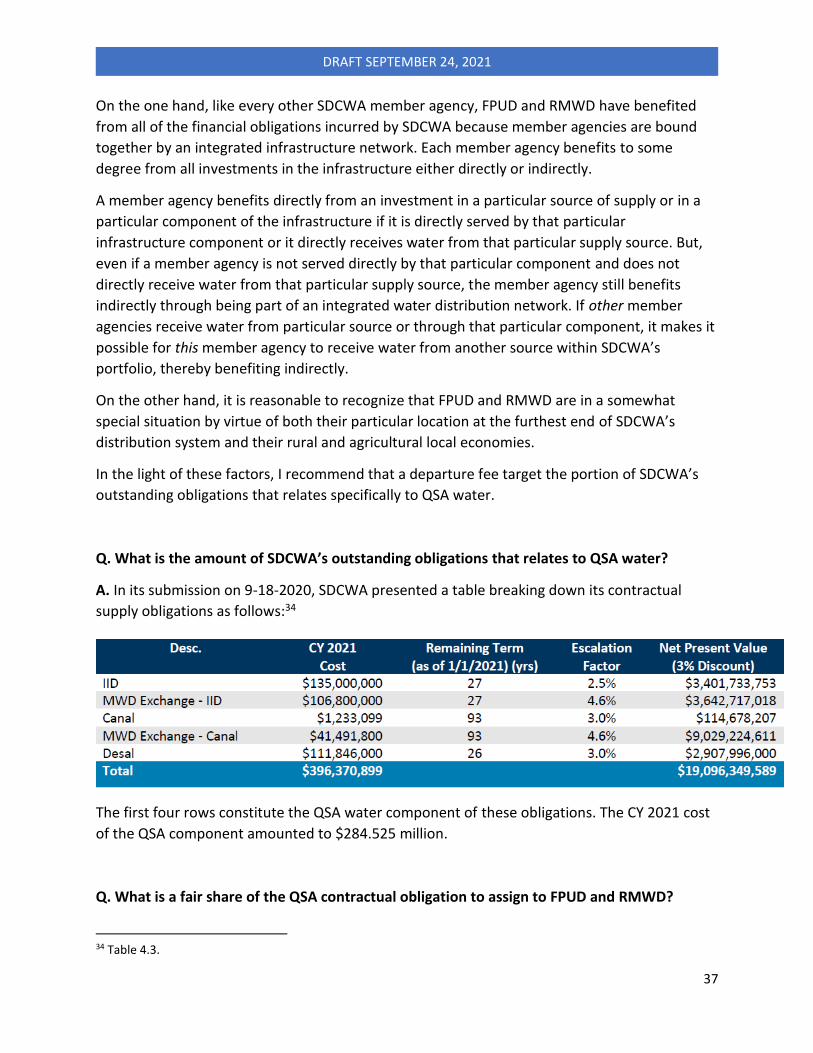
Q. What is the amount of SDCWA’s outstanding obligations that relates to QSA water?
A. In its submission on 9-18-2020, SDCWA presented a table breaking down its contractual
supply obligations as follows:34
The first four rows constitute the QSA water component of these obligations. The CY 2021 cost
of the QSA component amounted to $284.525 million.
Q. What is a fair share of the QSA contractual obligation to assign to FPUD and RMWD?
34 Table 4.3.
38
DRAFT SEPTEMBER 24, 2021
A. I suggest that this be based on FPUD and RMWD shares of either total deliveries to SDCWA
member agencies or of deliveries for municipal and industrial use, as opposed to deliveries
made under SDCWA’s special agricultural water rate program.
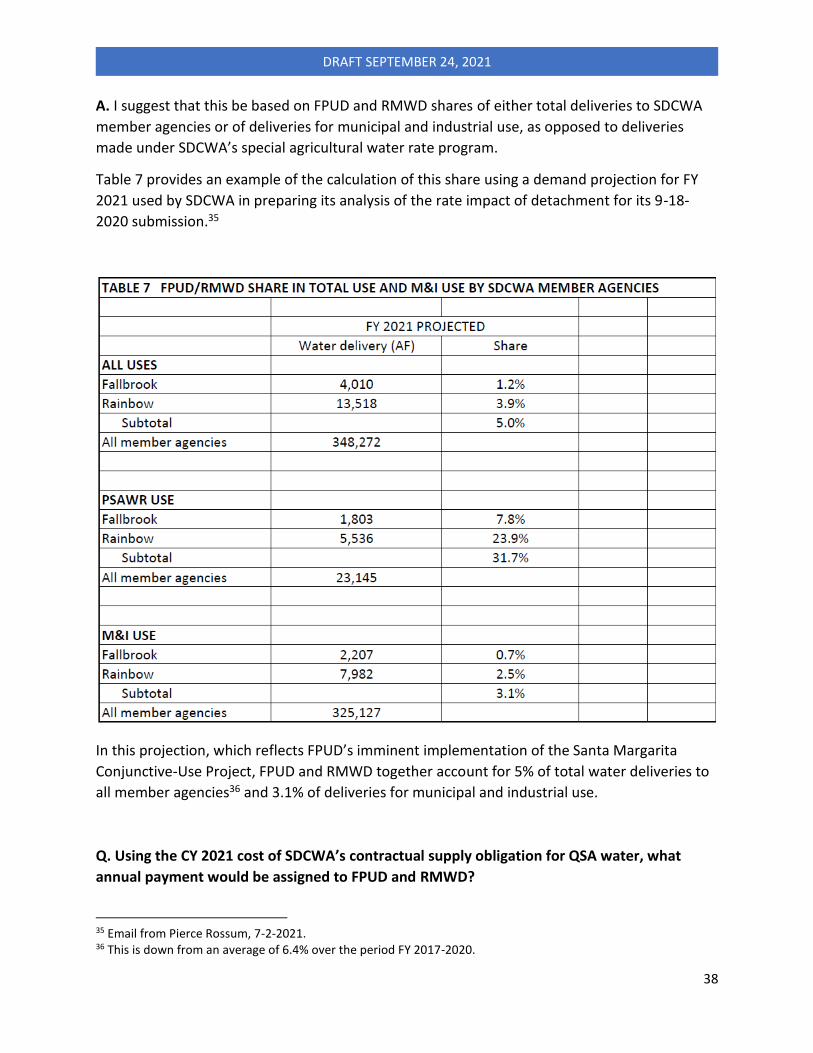
Table 7 provides an example of the calculation of this share using a demand projection for FY
2021 used by SDCWA in preparing its analysis of the rate impact of detachment for its 9-18-
2020 submission.35
In this projection, which reflects FPUD’s imminent implementation of the Santa Margarita
Conjunctive-Use Project, FPUD and RMWD together account for 5% of total water deliveries to
all member agencies36 and 3.1% of deliveries for municipal and industrial use.
Q. Using the CY 2021 cost of SDCWA’s contractual supply obligation for QSA water, what
annual payment would be assigned to FPUD and RMWD?
35 Email from Pierce Rossum, 7-2-2021. 36 This is down from an average of 6.4% over the period FY 2017-2020.
39
DRAFT SEPTEMBER 24, 2021
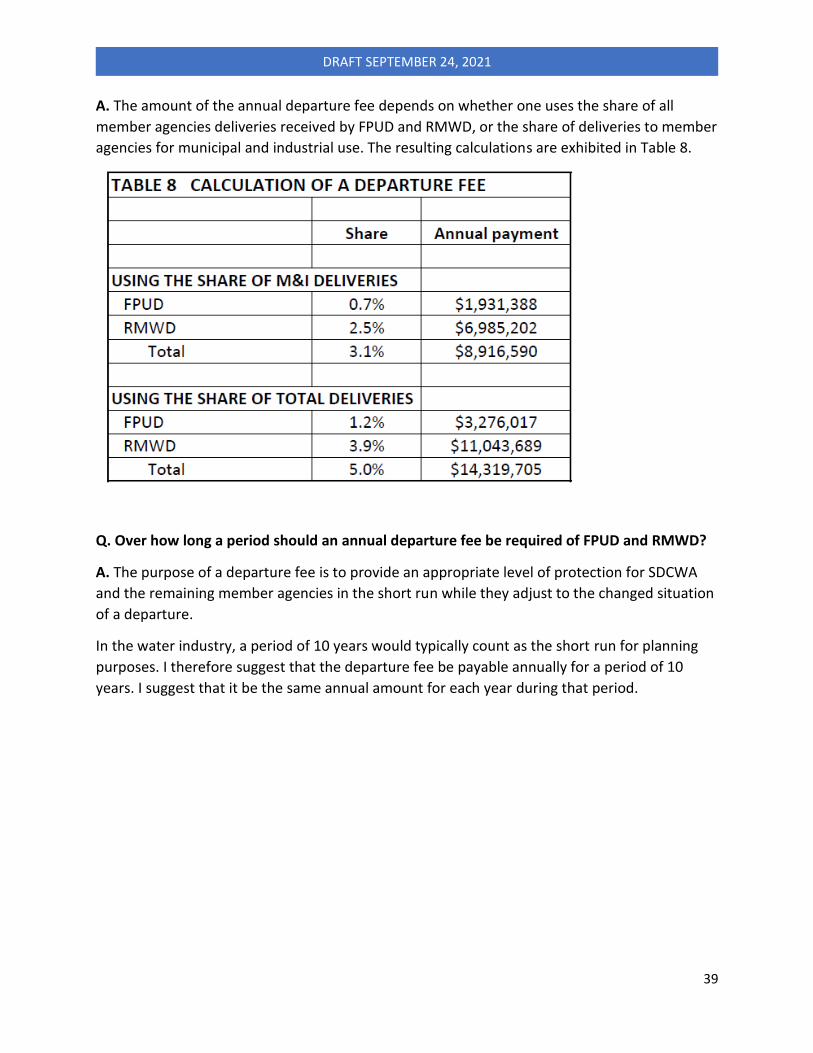
A. The amount of the annual departure fee depends on whether one uses the share of all
member agencies deliveries received by FPUD and RMWD, or the share of deliveries to member
agencies for municipal and industrial use. The resulting calculations are exhibited in Table 8.
Q. Over how long a period should an annual departure fee be required of FPUD and RMWD?
A. The purpose of a departure fee is to provide an appropriate level of protection for SDCWA
and the remaining member agencies in the short run while they adjust to the changed situation
of a departure.
In the water industry, a period of 10 years would typically count as the short run for planning
purposes. I therefore suggest that the departure fee be payable annually for a period of 10
years. I suggest that it be the same annual amount for each year during that period.
40
DRAFT SEPTEMBER 24, 2021
5. WATER SUPPLY RELIABILITY: SDCWA vs EASTERN MWD (In preparation)

41
DRAFT SEPTEMBER 24, 2021
6. OTHER IMPLICATIONS (In preparation)
42
DRAFT SEPTEMBER 24, 2021
BACKUP TABLE
43
DRAFT SEPTEMBER 24, 2021