Embed Size (px)
Citation preview
DRAFT
WATER AND SEWER CAPACITY FEE STUDY
MCKINLEYVILLE COMMUNITY SERVICES DISTRICT
MAY 5, 2011
MCSD | Capacity Fee Study 1
OVERVIEW
McKinleyville Community Services District (the District) retained Willdan to prepare a capacity fee study for District’s water and sewer utility systems. Capacity fees are one-time charges used to fund capital improvements necessary for the expansion of a utility system. The recommended capacity fees for the District are proportionate and reasonably related to the capital facility demands of new development. This report documents the data, methodology, and results of the capacity fee study.
The District applies two types of one-time fees to its water and wastewater system users: Capacity Fees and Connection Fees. A capacity fee is a one-time fee that is charged for new, additional, or larger connections to the District’s utility system. Capacity fees recover the costs associated with providing additional facility capacity to new users and existing users requiring additional capacity. Connection fees are used to recover costs associated with the physical installation of lateral connections to the utility system, and can be thought of as “plumbing charges”. The scope of this study is limited to a review of the capacity fees.
It has been some time since the District last updated the current water and wastewater capacity fees in 1991 and 1999 respectively. The current fees do not adequately reflect updated system demands and needs for expanded or additional facilities. In addition, several anticipated projects (Ramey Pump Station Upgrade, Murray Road Water Tanks, Waste Water Management Facility upgrade, Mad River Bridge crossing pipeline) will improve water and wastewater services.
EXISTING CAPACITY FEES
The District’s existing capacity charge, for both water and sewer is based on Equivalent Residential Units (ERU) and is a one-time charge determined per District Rule 1.21. An ERU is defined as any single-family residential structure. Other types of structures are evaluated by the District on an individual basis with respect to average monthly flows, and the capacity charge imposed thereon is adjusted to be appropriately proportionate to the standard charged imposed on ERU
Current water capacity fee rates were established in 1991 at $154 per Equivalent Residential Unit (ERU). Current wastewater capacity fee rates were established in 1999 at $1,761 per ERU. Consequently, the District’s existing water and sewer capacity charges are insufficient and do not adequately cover the costs associated with serving new development.
OBJECTIVE AND REGULATORY REQUIREMENTS
The primary objectives of establishing a full cost recovery capacity fee are to achieve equity in distributing costs and to provide a means by which new users can pay for the costs of the facilities required to serve them without burdening existing users.
The legal requirements for enactment of development impact fee program (capacity fees) are set forth in Government Code §§ 66000-66025 (the "Mitigation Fee Act"), the bulk of which were adopted as 1987’s AB 1600 and thus are commonly referred to as “AB 1600 requirements.” A development impact fee is not a tax or special assessment; by its definition, a fee is voluntary and must be reasonably related to the cost of the service provided by the local agency. If a development impact fee does not relate to the impact created by development or exceeds the reasonable cost of providing the public service, then the fee may be declared a special tax and must then be subject to a two-thirds voter approval.
MCSD | Capacity Fee Study 2
CALCULATION METHODOLOGIES
Anyone of several legitimate methods may be used to calculate utility capacity fees. The choice of a particular method depends primarily on the service characteristics and planning requirements for the facility type being addressed.
Reduced to its simplest form, the process of calculating capacity fees involves two steps: determining the cost of development-related capital improvements, and allocating those costs equitably to various types of development. However, the calculation of capacity fees can become complicated due to the many variables involved in defining the relationship between development and the needs for facilities.
There are three basic methods used to calculate the components of the District’s capacity fees. The methodologies are used to determine the best measure of demand created by new development for each component of the capacity fees. The methodologies can be classified as looking at the past, present, and future capacities of infrastructure.
In instances where infrastructure has been built in advance of new development and there is excess capacity available to be utilized by new development, the buy-in methodology is utilized. Under this methodology, new development repays the community for previous capacity investments via the capacity fee.
The incremental expansion methodology is used when a community plans to provide new development the same level-of-service (LOS) that is currently being provided to existing development in increments. Generally, utility infrastructure does not lend itself to this methodology given its nature of having to be in place prior to new development and capacity being constructed in large segments.
The plan-based methodology utilizes the District’s capital improvement plan (CIP) and related master plans to determine new development’s share of planned projects. Projects that do not add capacity, such as routine maintenance or replacement of existing facilities, are not included in the fees. Projects that add capacity are further evaluated as to the percentage of the project attributable to existing development versus new development. Only the portion of planned projects attributable to new development is included in the capacity fees.
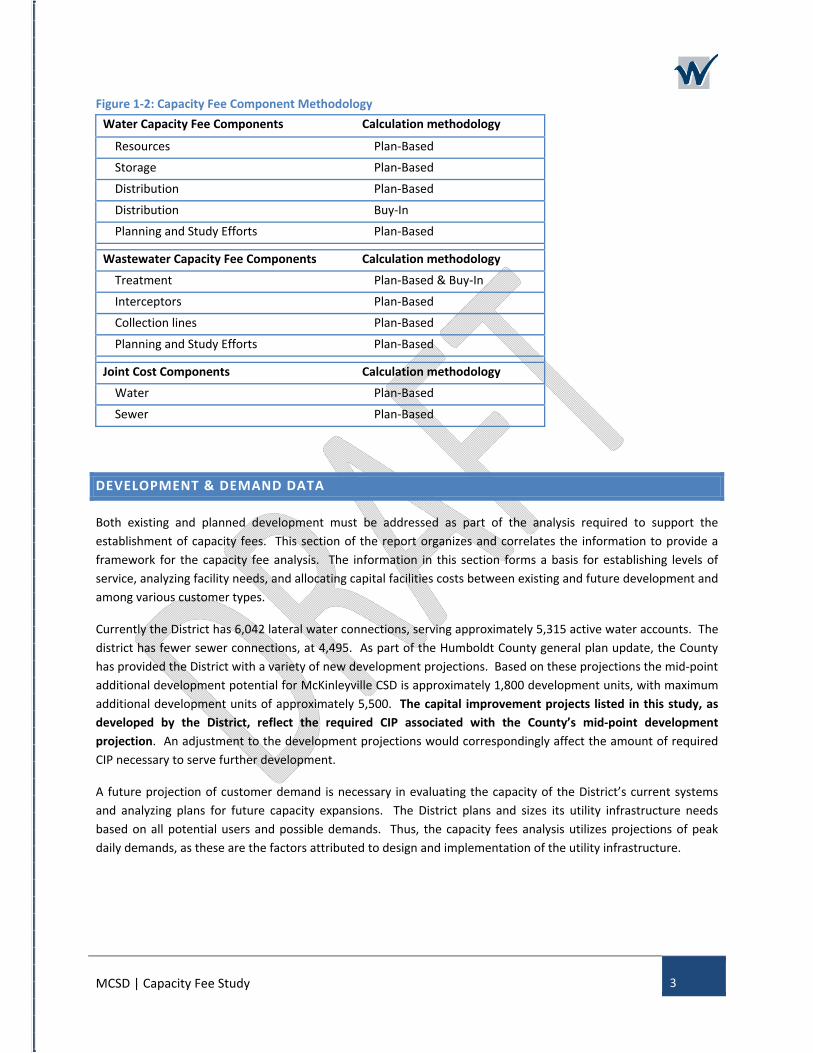
Based on the available data, the majority of the facility components analyzed and incorporated into the proposed capacity fees utilize the plan-based methodology, with the buy-in methodology used to recover costs associated with excess distribution and treatment capacity. A summary of the capacity fee components and methodologies are shown in the Figure 1-2:
MCSD | Capacity Fee Study 3
Figure 1-2: Capacity Fee Component Methodology Water Capacity Fee Components Calculation methodology
Resources Plan-Based
Storage Plan-Based
Distribution Plan-Based
Distribution Buy-In
Planning and Study Efforts Plan-Based
Wastewater Capacity Fee Components Calculation methodology
Treatment Plan-Based & Buy-In
Interceptors Plan-Based
Collection lines Plan-Based
Planning and Study Efforts Plan-Based
Joint Cost Components Calculation methodologyWater Plan-Based
Sewer Plan-Based
DEVELOPMENT & DEMAND DATA
Both existing and planned development must be addressed as part of the analysis required to support the establishment of capacity fees. This section of the report organizes and correlates the information to provide a framework for the capacity fee analysis. The information in this section forms a basis for establishing levels of service, analyzing facility needs, and allocating capital facilities costs between existing and future development and among various customer types.
Currently the District has 6,042 lateral water connections, serving approximately 5,315 active water accounts. The district has fewer sewer connections, at 4,495. As part of the Humboldt County general plan update, the County has provided the District with a variety of new development projections. Based on these projections the mid-point additional development potential for McKinleyville CSD is approximately 1,800 development units, with maximum additional development units of approximately 5,500. The capital improvement projects listed in this study, as developed by the District, reflect the required CIP associated with the County’s mid-point development projection. An adjustment to the development projections would correspondingly affect the amount of required CIP necessary to serve further development.
A future projection of customer demand is necessary in evaluating the capacity of the District’s current systems and analyzing plans for future capacity expansions. The District plans and sizes its utility infrastructure needs based on all potential users and possible demands. Thus, the capacity fees analysis utilizes projections of peak daily demands, as these are the factors attributed to design and implementation of the utility infrastructure.
MCSD | Capacity Fee Study 4
WATER CONSUMPTION CHARACTERISTICS
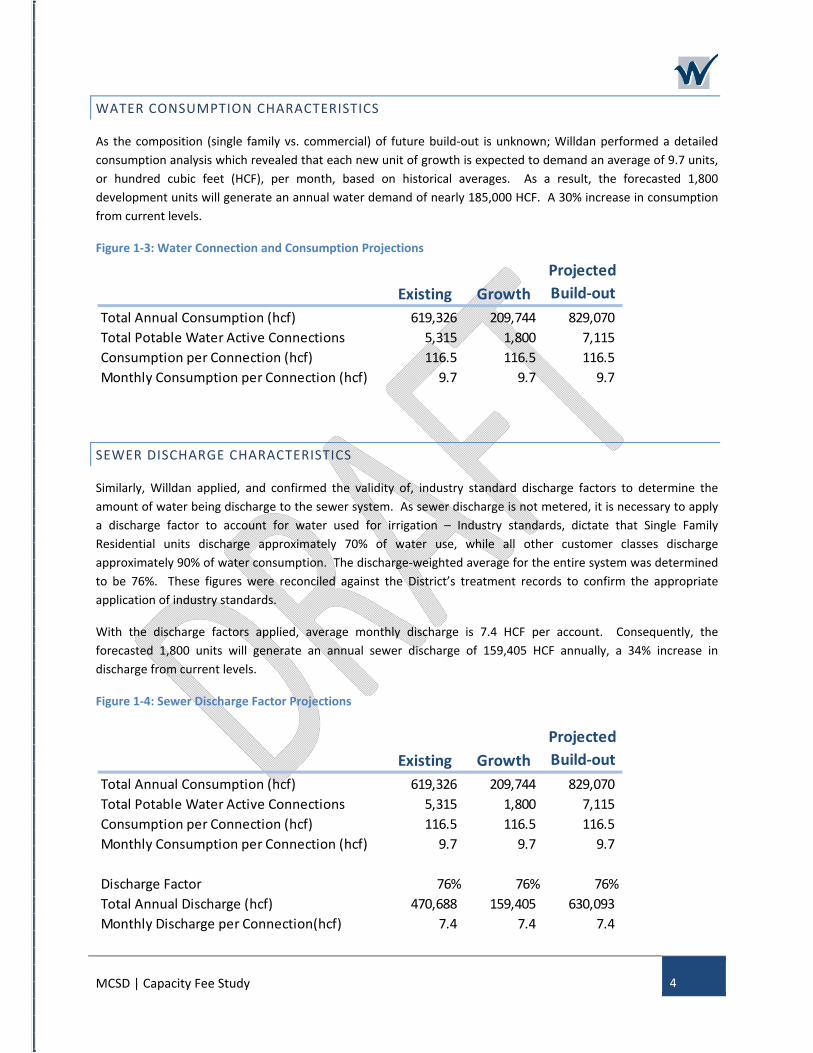
As the composition (single family vs. commercial) of future build-out is unknown; Willdan performed a detailed consumption analysis which revealed that each new unit of growth is expected to demand an average of 9.7 units, or hundred cubic feet (HCF), per month, based on historical averages. As a result, the forecasted 1,800 development units will generate an annual water demand of nearly 185,000 HCF. A 30% increase in consumption from current levels.
Figure 1-3: Water Connection and Consumption Projections
SEWER DISCHARGE CHARACTERISTICS
Similarly, Willdan applied, and confirmed the validity of, industry standard discharge factors to determine the amount of water being discharge to the sewer system. As sewer discharge is not metered, it is necessary to apply a discharge factor to account for water used for irrigation – Industry standards, dictate that Single Family Residential units discharge approximately 70% of water use, while all other customer classes discharge approximately 90% of water consumption. The discharge-weighted average for the entire system was determined to be 76%. These figures were reconciled against the District’s treatment records to confirm the appropriate application of industry standards.
With the discharge factors applied, average monthly discharge is 7.4 HCF per account. Consequently, the forecasted 1,800 units will generate an annual sewer discharge of 159,405 HCF annually, a 34% increase in discharge from current levels.
Figure 1-4: Sewer Discharge Factor Projections
Existing GrowthProjected Build-out
Total Annual Consumption (hcf) 619,326 209,744 829,070 Total Potable Water Active Connections 5,315 1,800 7,115 Consumption per Connection (hcf) 116.5 116.5 116.5 Monthly Consumption per Connection (hcf) 9.7 9.7 9.7
Existing GrowthProjected Build-out
Total Annual Consumption (hcf) 619,326 209,744 829,070 Total Potable Water Active Connections 5,315 1,800 7,115 Consumption per Connection (hcf) 116.5 116.5 116.5 Monthly Consumption per Connection (hcf) 9.7 9.7 9.7
Discharge Factor 76% 76% 76%Total Annual Discharge (hcf) 470,688 159,405 630,093 Monthly Discharge per Connection(hcf) 7.4 7.4 7.4
MCSD | Capacity Fee Study 5
WATER CAPACITY FEES
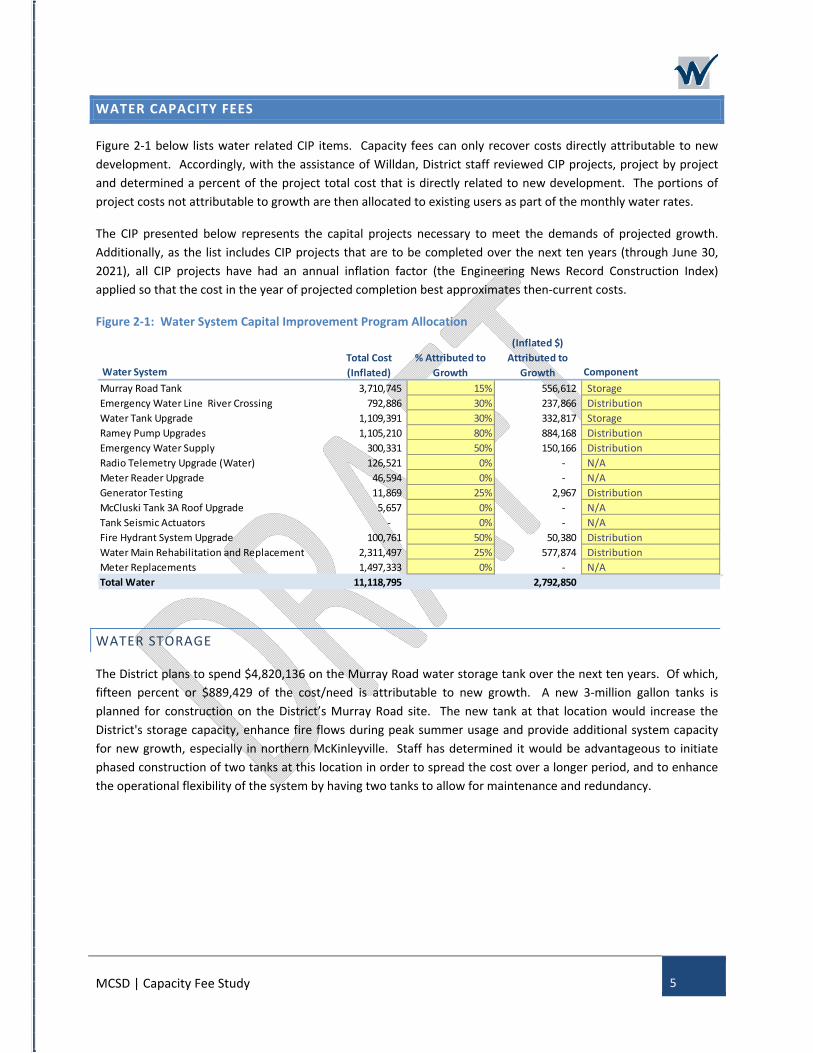
Figure 2-1 below lists water related CIP items. Capacity fees can only recover costs directly attributable to new development. Accordingly, with the assistance of Willdan, District staff reviewed CIP projects, project by project and determined a percent of the project total cost that is directly related to new development. The portions of project costs not attributable to growth are then allocated to existing users as part of the monthly water rates.
The CIP presented below represents the capital projects necessary to meet the demands of projected growth. Additionally, as the list includes CIP projects that are to be completed over the next ten years (through June 30, 2021), all CIP projects have had an annual inflation factor (the Engineering News Record Construction Index) applied so that the cost in the year of projected completion best approximates then-current costs.
Figure 2-1: Water System Capital Improvement Program Allocation
WATER STORAGE
The District plans to spend $4,820,136 on the Murray Road water storage tank over the next ten years. Of which, fifteen percent or $889,429 of the cost/need is attributable to new growth. A new 3-million gallon tanks is planned for construction on the District’s Murray Road site. The new tank at that location would increase the District's storage capacity, enhance fire flows during peak summer usage and provide additional system capacity for new growth, especially in northern McKinleyville. Staff has determined it would be advantageous to initiate phased construction of two tanks at this location in order to spread the cost over a longer period, and to enhance the operational flexibility of the system by having two tanks to allow for maintenance and redundancy.
Water System ComponentMurray Road Tank 3,710,745 15% 556,612 StorageEmergency Water Line River Crossing 792,886 30% 237,866 DistributionWater Tank Upgrade 1,109,391 30% 332,817 StorageRamey Pump Upgrades 1,105,210 80% 884,168 DistributionEmergency Water Supply 300,331 50% 150,166 DistributionRadio Telemetry Upgrade (Water) 126,521 0% - N/AMeter Reader Upgrade 46,594 0% - N/AGenerator Testing 11,869 25% 2,967 DistributionMcCluski Tank 3A Roof Upgrade 5,657 0% - N/ATank Seismic Actuators - 0% - N/AFire Hydrant System Upgrade 100,761 50% 50,380 DistributionWater Main Rehabilitation and Replacement 2,311,497 25% 577,874 DistributionMeter Replacements 1,497,333 0% - N/ATotal Water 11,118,795 2,792,850
Total Cost (Inflated)
% Attributed to Growth
(Inflated $) Attributed to
Growth
MCSD | Capacity Fee Study 6
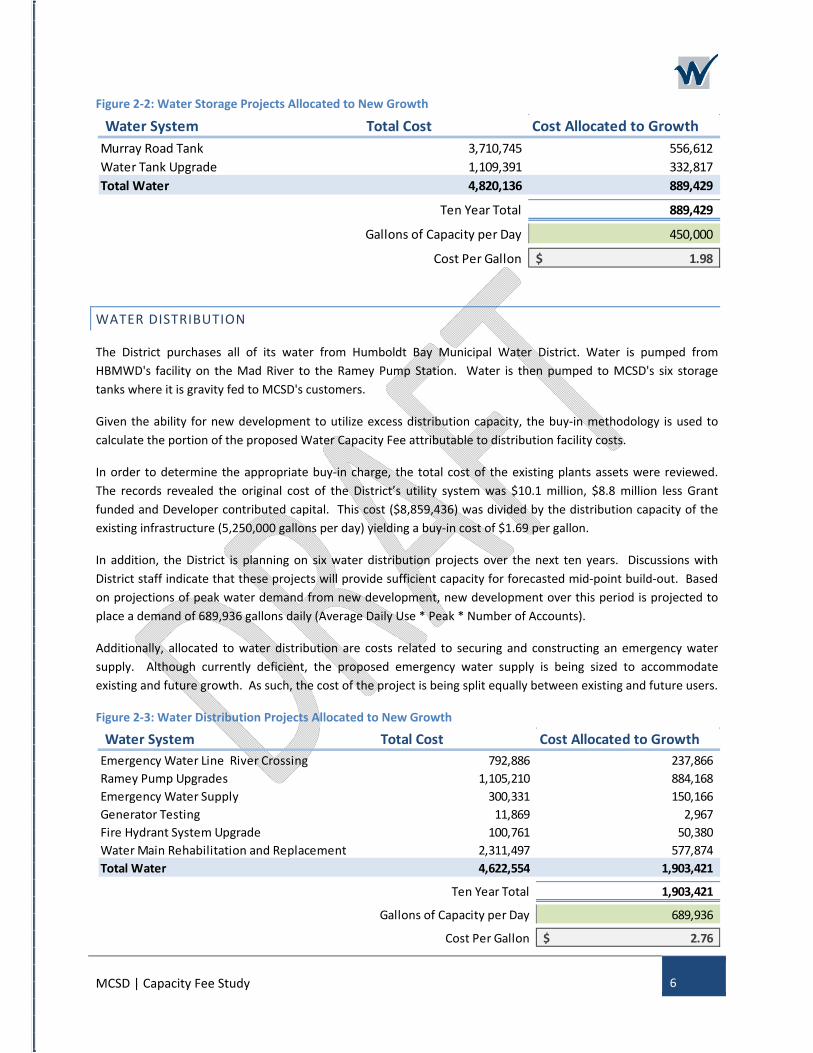
Figure 2-2: Water Storage Projects Allocated to New Growth
WATER DISTRIBUTION
The District purchases all of its water from Humboldt Bay Municipal Water District. Water is pumped from HBMWD's facility on the Mad River to the Ramey Pump Station. Water is then pumped to MCSD's six storage tanks where it is gravity fed to MCSD's customers.
Given the ability for new development to utilize excess distribution capacity, the buy-in methodology is used to calculate the portion of the proposed Water Capacity Fee attributable to distribution facility costs.
In order to determine the appropriate buy-in charge, the total cost of the existing plants assets were reviewed. The records revealed the original cost of the District’s utility system was $10.1 million, $8.8 million less Grant funded and Developer contributed capital. This cost ($8,859,436) was divided by the distribution capacity of the existing infrastructure (5,250,000 gallons per day) yielding a buy-in cost of $1.69 per gallon.
In addition, the District is planning on six water distribution projects over the next ten years. Discussions with District staff indicate that these projects will provide sufficient capacity for forecasted mid-point build-out. Based on projections of peak water demand from new development, new development over this period is projected to place a demand of 689,936 gallons daily (Average Daily Use * Peak * Number of Accounts).
Additionally, allocated to water distribution are costs related to securing and constructing an emergency water supply. Although currently deficient, the proposed emergency water supply is being sized to accommodate existing and future growth. As such, the cost of the project is being split equally between existing and future users.
Figure 2-3: Water Distribution Projects Allocated to New Growth
Water System Total Cost Cost Allocated to GrowthMurray Road Tank 3,710,745 556,612 Water Tank Upgrade 1,109,391 332,817 Total Water 4,820,136 889,429
889,429
450,000
1.98$
Ten Year Total
Gallons of Capacity per Day
Cost Per Gallon
Water System Total Cost Cost Allocated to GrowthEmergency Water Line River Crossing 792,886 237,866 Ramey Pump Upgrades 1,105,210 884,168 Emergency Water Supply 300,331 150,166 Generator Testing 11,869 2,967 Fire Hydrant System Upgrade 100,761 50,380 Water Main Rehabilitation and Replacement 2,311,497 577,874 Total Water 4,622,554 1,903,421
1,903,421
689,936
2.76$
Ten Year Total
Gallons of Capacity per Day
Cost Per Gallon
MCSD | Capacity Fee Study 7
JOINT COSTS
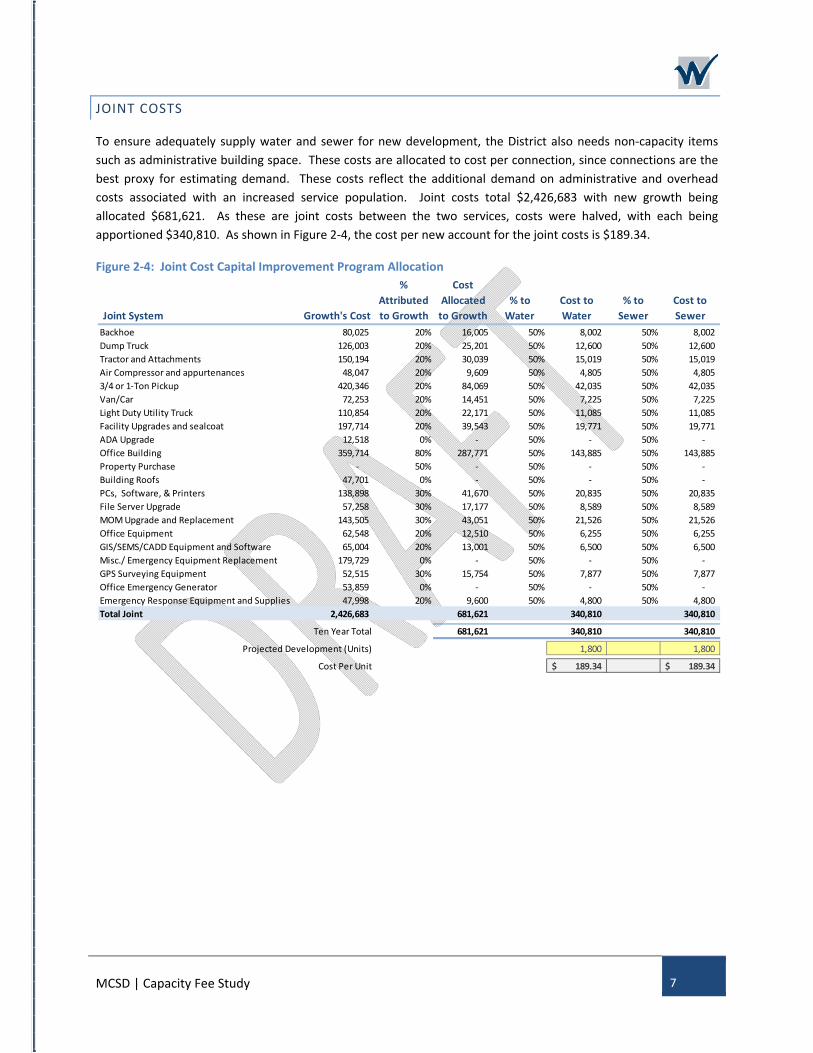
To ensure adequately supply water and sewer for new development, the District also needs non-capacity items such as administrative building space. These costs are allocated to cost per connection, since connections are the best proxy for estimating demand. These costs reflect the additional demand on administrative and overhead costs associated with an increased service population. Joint costs total $2,426,683 with new growth being allocated $681,621. As these are joint costs between the two services, costs were halved, with each being apportioned $340,810. As shown in Figure 2-4, the cost per new account for the joint costs is $189.34.
Figure 2-4: Joint Cost Capital Improvement Program Allocation
Joint System Growth's Cost
% Attributed to Growth
Cost Allocated
to Growth% to
WaterCost to Water
% to Sewer
Cost to Sewer
Backhoe 80,025 20% 16,005 50% 8,002 50% 8,002 Dump Truck 126,003 20% 25,201 50% 12,600 50% 12,600 Tractor and Attachments 150,194 20% 30,039 50% 15,019 50% 15,019 Air Compressor and appurtenances 48,047 20% 9,609 50% 4,805 50% 4,805 3/4 or 1-Ton Pickup 420,346 20% 84,069 50% 42,035 50% 42,035 Van/Car 72,253 20% 14,451 50% 7,225 50% 7,225 Light Duty Utility Truck 110,854 20% 22,171 50% 11,085 50% 11,085 Facility Upgrades and sealcoat 197,714 20% 39,543 50% 19,771 50% 19,771 ADA Upgrade 12,518 0% - 50% - 50% - Office Building 359,714 80% 287,771 50% 143,885 50% 143,885 Property Purchase - 50% - 50% - 50% - Building Roofs 47,701 0% - 50% - 50% - PCs, Software, & Printers 138,898 30% 41,670 50% 20,835 50% 20,835 File Server Upgrade 57,258 30% 17,177 50% 8,589 50% 8,589 MOM Upgrade and Replacement 143,505 30% 43,051 50% 21,526 50% 21,526 Office Equipment 62,548 20% 12,510 50% 6,255 50% 6,255 GIS/SEMS/CADD Equipment and Software 65,004 20% 13,001 50% 6,500 50% 6,500 Misc./ Emergency Equipment Replacement 179,729 0% - 50% - 50% - GPS Surveying Equipment 52,515 30% 15,754 50% 7,877 50% 7,877 Office Emergency Generator 53,859 0% - 50% - 50% - Emergency Response Equipment and Supplies 47,998 20% 9,600 50% 4,800 50% 4,800 Total Joint 2,426,683 681,621 340,810 340,810
681,621 340,810 340,810
1,800 1,800
189.34$ 189.34$
Projected Development (Units)
Ten Year Total
Cost Per Unit
MCSD | Capacity Fee Study 8
DEMAND & COST SUMMARY
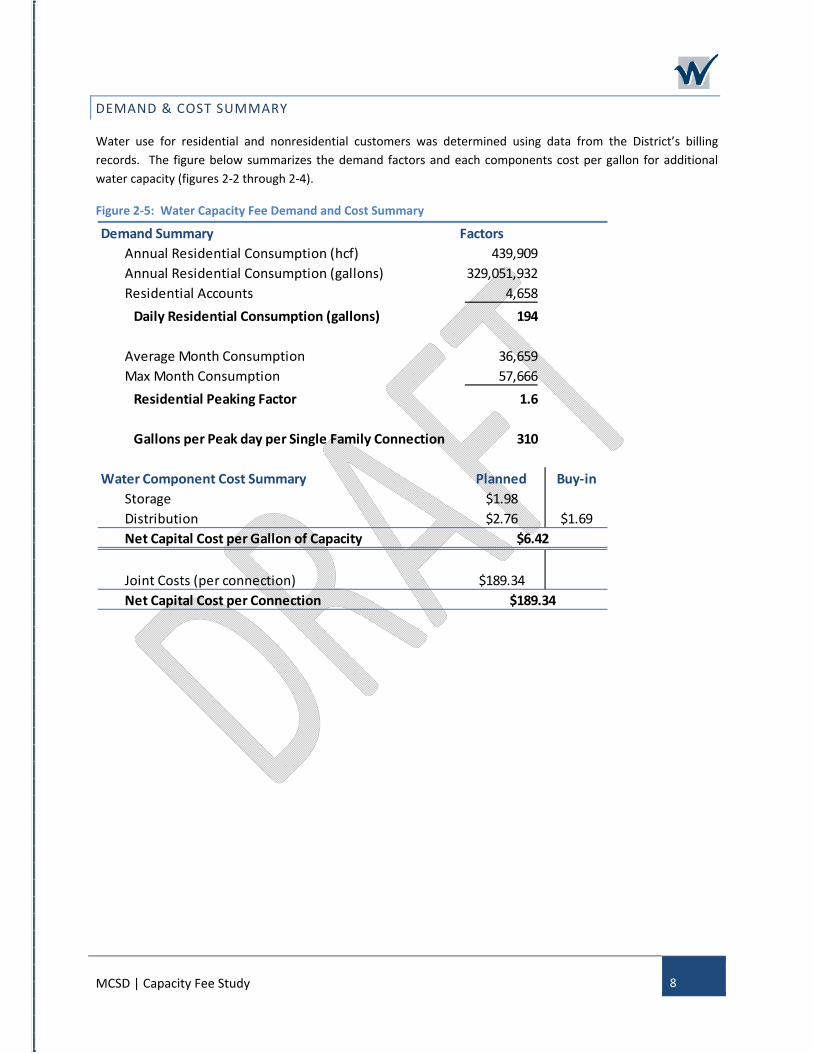
Water use for residential and nonresidential customers was determined using data from the District’s billing records. The figure below summarizes the demand factors and each components cost per gallon for additional water capacity (figures 2-2 through 2-4).
Figure 2-5: Water Capacity Fee Demand and Cost Summary
Demand Summary FactorsAnnual Residential Consumption (hcf) 439,909 Annual Residential Consumption (gallons) 329,051,932 Residential Accounts 4,658
Daily Residential Consumption (gallons) 194
Average Month Consumption 36,659 Max Month Consumption 57,666
Residential Peaking Factor 1.6
Gallons per Peak day per Single Family Connection 310
Water Component Cost Summary Planned Buy-inStorage $1.98Distribution $2.76 $1.69Net Capital Cost per Gallon of Capacity
Joint Costs (per connection) $189.34Net Capital Cost per Connection
$6.42
$189.34
MCSD | Capacity Fee Study 9
WATER CAPACITY FEES
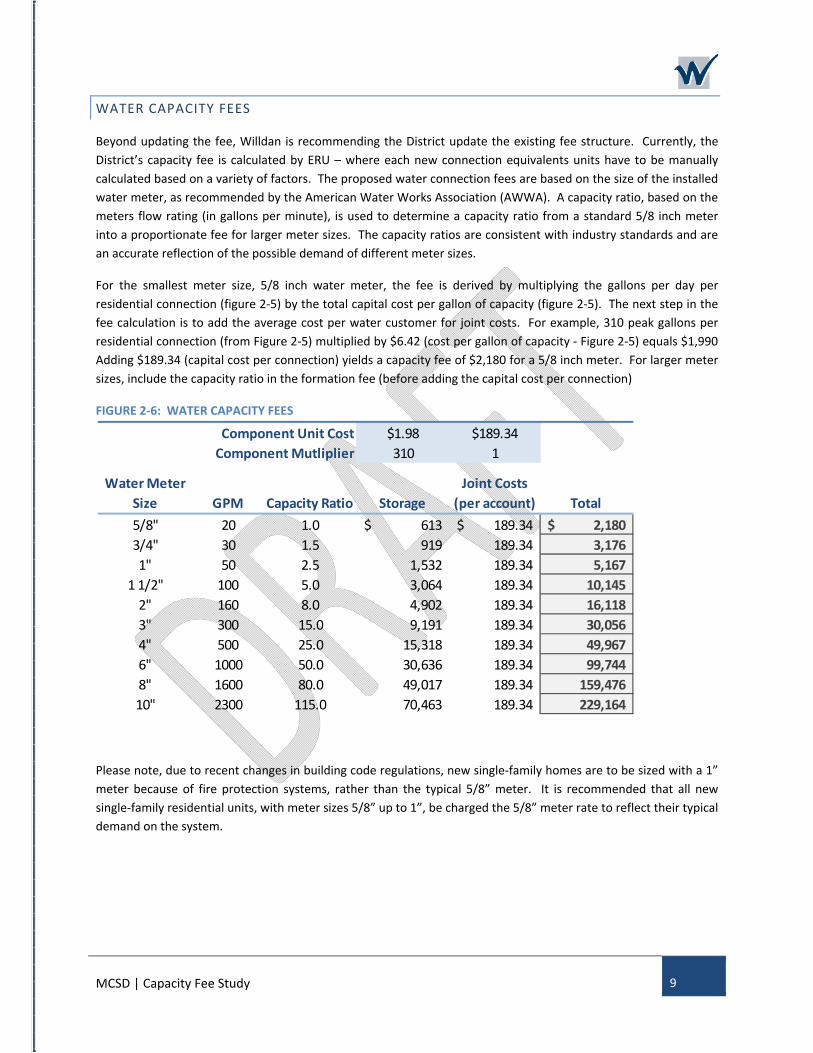
Beyond updating the fee, Willdan is recommending the District update the existing fee structure. Currently, the District’s capacity fee is calculated by ERU – where each new connection equivalents units have to be manually calculated based on a variety of factors. The proposed water connection fees are based on the size of the installed water meter, as recommended by the American Water Works Association (AWWA). A capacity ratio, based on the meters flow rating (in gallons per minute), is used to determine a capacity ratio from a standard 5/8 inch meter into a proportionate fee for larger meter sizes. The capacity ratios are consistent with industry standards and are an accurate reflection of the possible demand of different meter sizes.
For the smallest meter size, 5/8 inch water meter, the fee is derived by multiplying the gallons per day per residential connection (figure 2-5) by the total capital cost per gallon of capacity (figure 2-5). The next step in the fee calculation is to add the average cost per water customer for joint costs. For example, 310 peak gallons per residential connection (from Figure 2-5) multiplied by $6.42 (cost per gallon of capacity - Figure 2-5) equals $1,990 Adding $189.34 (capital cost per connection) yields a capacity fee of $2,180 for a 5/8 inch meter. For larger meter sizes, include the capacity ratio in the formation fee (before adding the capital cost per connection)
FIGURE 2-6: WATER CAPACITY FEES
Please note, due to recent changes in building code regulations, new single-family homes are to be sized with a 1” meter because of fire protection systems, rather than the typical 5/8” meter. It is recommended that all new single-family residential units, with meter sizes 5/8” up to 1”, be charged the 5/8” meter rate to reflect their typical demand on the system.
Component Unit Cost $1.98 $189.34Component Mutliplier 310 1
Water Meter Size GPM Capacity Ratio Storage
Joint Costs (per account) Total
5/8" 20 1.0 613$ 189.34$ 2,180$ 3/4" 30 1.5 919 189.34 3,176 1" 50 2.5 1,532 189.34 5,167
1 1/2" 100 5.0 3,064 189.34 10,145 2" 160 8.0 4,902 189.34 16,118 3" 300 15.0 9,191 189.34 30,056 4" 500 25.0 15,318 189.34 49,967 6" 1000 50.0 30,636 189.34 99,744 8" 1600 80.0 49,017 189.34 159,476 10" 2300 115.0 70,463 189.34 229,164
MCSD | Capacity Fee Study 10
SEWER CAPACITY FEES
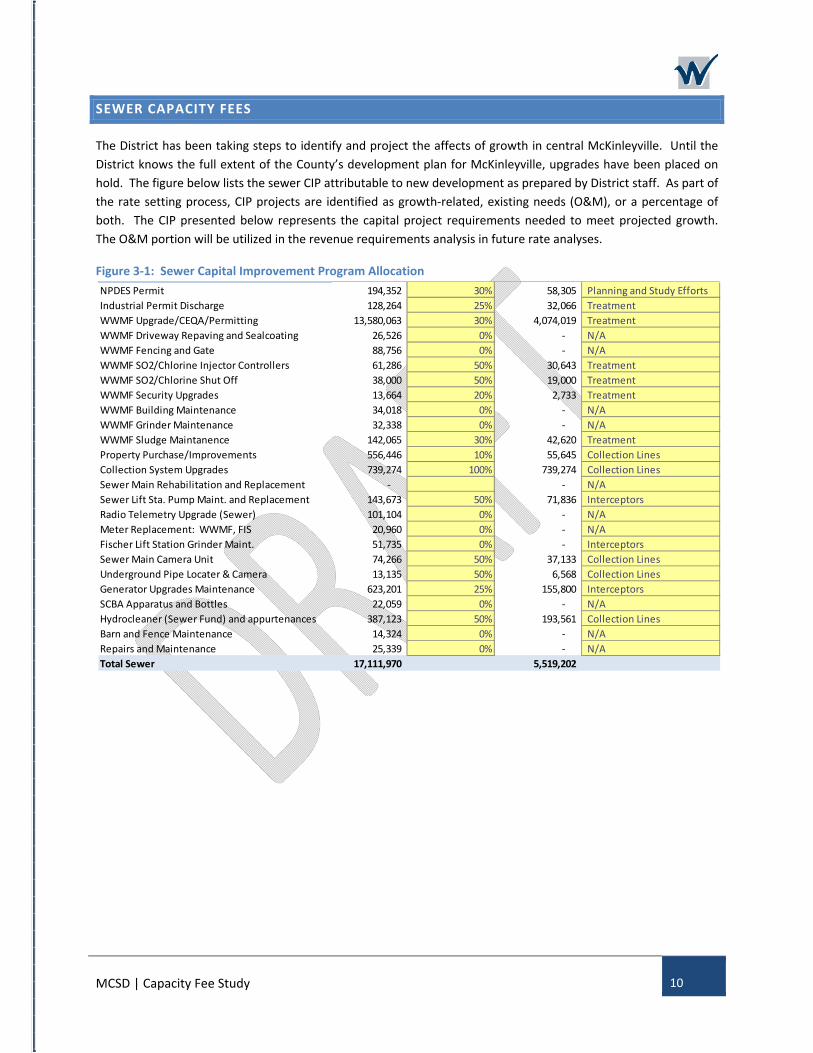
The District has been taking steps to identify and project the affects of growth in central McKinleyville. Until the District knows the full extent of the County’s development plan for McKinleyville, upgrades have been placed on hold. The figure below lists the sewer CIP attributable to new development as prepared by District staff. As part of the rate setting process, CIP projects are identified as growth-related, existing needs (O&M), or a percentage of both. The CIP presented below represents the capital project requirements needed to meet projected growth. The O&M portion will be utilized in the revenue requirements analysis in future rate analyses.
Figure 3-1: Sewer Capital Improvement Program Allocation
NPDES Permit 194,352 30% 58,305 Planning and Study EffortsIndustrial Permit Discharge 128,264 25% 32,066 TreatmentWWMF Upgrade/CEQA/Permitting 13,580,063 30% 4,074,019 TreatmentWWMF Driveway Repaving and Sealcoating 26,526 0% - N/AWWMF Fencing and Gate 88,756 0% - N/AWWMF SO2/Chlorine Injector Controllers 61,286 50% 30,643 TreatmentWWMF SO2/Chlorine Shut Off 38,000 50% 19,000 TreatmentWWMF Security Upgrades 13,664 20% 2,733 TreatmentWWMF Building Maintenance 34,018 0% - N/AWWMF Grinder Maintenance 32,338 0% - N/AWWMF Sludge Maintanence 142,065 30% 42,620 TreatmentProperty Purchase/Improvements 556,446 10% 55,645 Collection LinesCollection System Upgrades 739,274 100% 739,274 Collection LinesSewer Main Rehabilitation and Replacement - - N/ASewer Lift Sta. Pump Maint. and Replacement 143,673 50% 71,836 InterceptorsRadio Telemetry Upgrade (Sewer) 101,104 0% - N/AMeter Replacement: WWMF, FIS 20,960 0% - N/AFischer Lift Station Grinder Maint. 51,735 0% - InterceptorsSewer Main Camera Unit 74,266 50% 37,133 Collection LinesUnderground Pipe Locater & Camera 13,135 50% 6,568 Collection LinesGenerator Upgrades Maintenance 623,201 25% 155,800 InterceptorsSCBA Apparatus and Bottles 22,059 0% - N/AHydrocleaner (Sewer Fund) and appurtenances 387,123 50% 193,561 Collection LinesBarn and Fence Maintenance 14,324 0% - N/ARepairs and Maintenance 25,339 0% - N/ATotal Sewer 17,111,970 5,519,202
MCSD | Capacity Fee Study 11
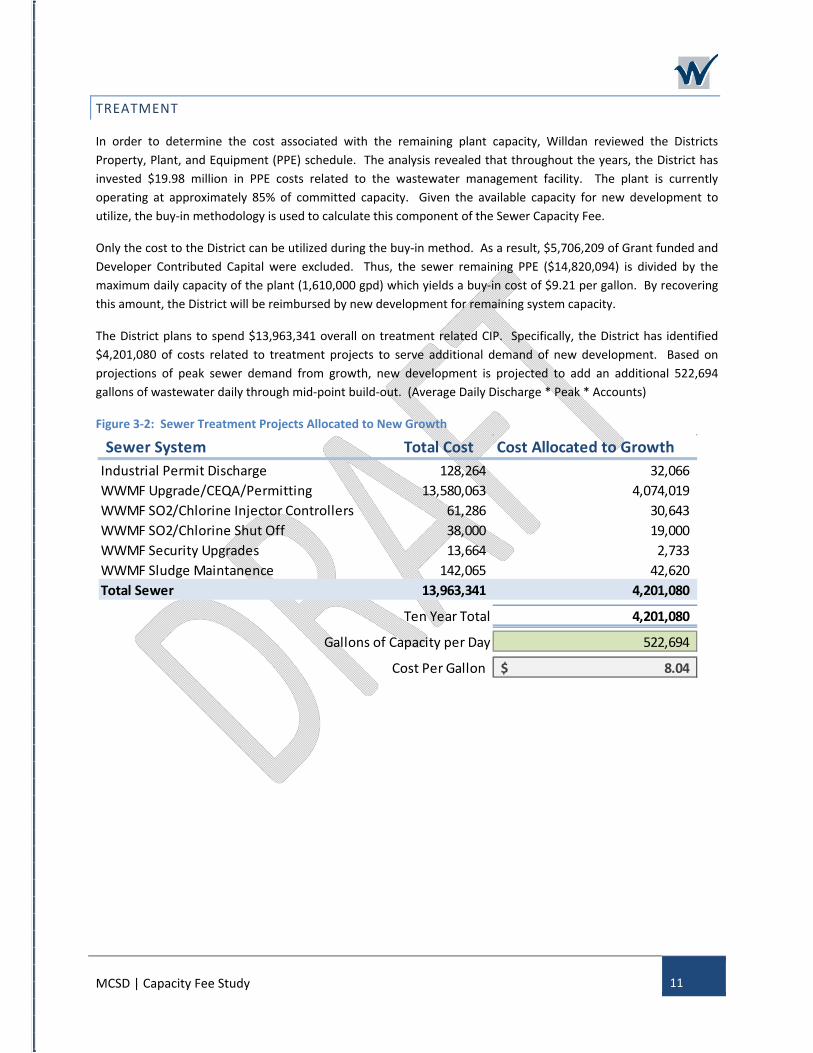
TREATMENT
In order to determine the cost associated with the remaining plant capacity, Willdan reviewed the Districts Property, Plant, and Equipment (PPE) schedule. The analysis revealed that throughout the years, the District has invested $19.98 million in PPE costs related to the wastewater management facility. The plant is currently operating at approximately 85% of committed capacity. Given the available capacity for new development to utilize, the buy-in methodology is used to calculate this component of the Sewer Capacity Fee.
Only the cost to the District can be utilized during the buy-in method. As a result, $5,706,209 of Grant funded and Developer Contributed Capital were excluded. Thus, the sewer remaining PPE ($14,820,094) is divided by the maximum daily capacity of the plant (1,610,000 gpd) which yields a buy-in cost of $9.21 per gallon. By recovering this amount, the District will be reimbursed by new development for remaining system capacity.
The District plans to spend $13,963,341 overall on treatment related CIP. Specifically, the District has identified $4,201,080 of costs related to treatment projects to serve additional demand of new development. Based on projections of peak sewer demand from growth, new development is projected to add an additional 522,694 gallons of wastewater daily through mid-point build-out. (Average Daily Discharge * Peak * Accounts)
Figure 3-2: Sewer Treatment Projects Allocated to New Growth
Sewer System Total Cost Cost Allocated to GrowthIndustrial Permit Discharge 128,264 32,066 WWMF Upgrade/CEQA/Permitting 13,580,063 4,074,019 WWMF SO2/Chlorine Injector Controllers 61,286 30,643 WWMF SO2/Chlorine Shut Off 38,000 19,000 WWMF Security Upgrades 13,664 2,733 WWMF Sludge Maintanence 142,065 42,620 Total Sewer 13,963,341 4,201,080
4,201,080
522,694
8.04$ Cost Per Gallon
Ten Year Total
Gallons of Capacity per Day
MCSD | Capacity Fee Study 12
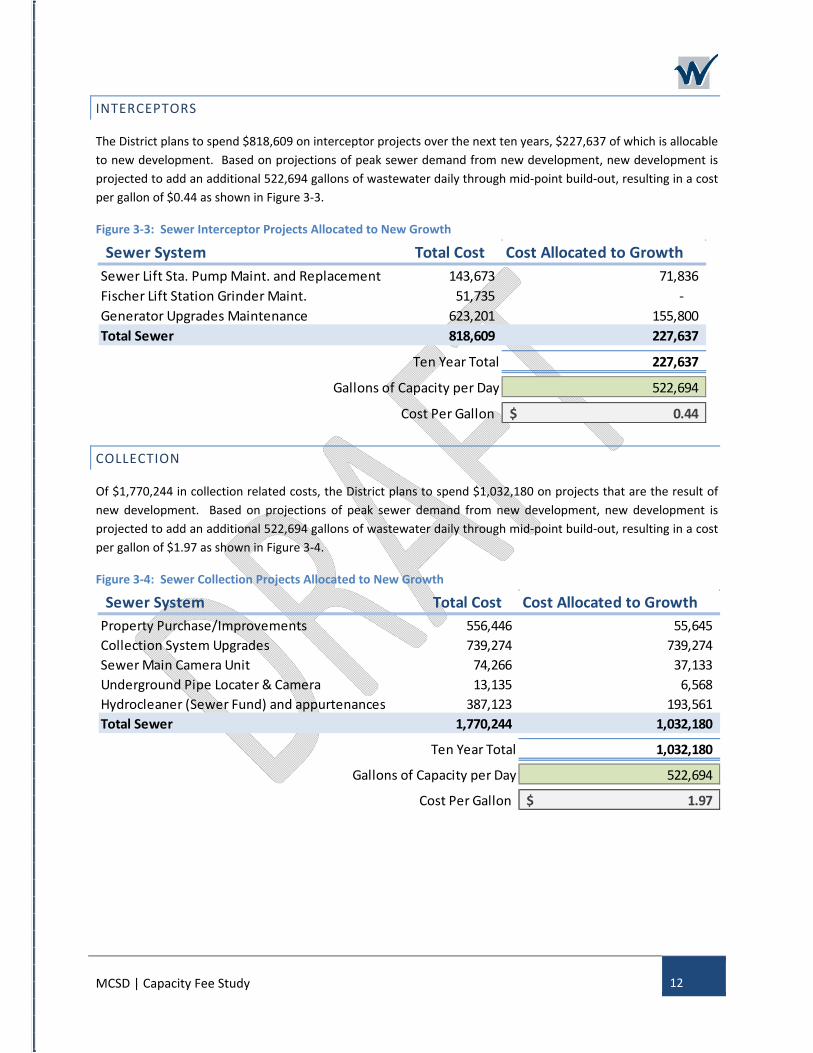
INTERCEPTORS
The District plans to spend $818,609 on interceptor projects over the next ten years, $227,637 of which is allocable to new development. Based on projections of peak sewer demand from new development, new development is projected to add an additional 522,694 gallons of wastewater daily through mid-point build-out, resulting in a cost per gallon of $0.44 as shown in Figure 3-3.
Figure 3-3: Sewer Interceptor Projects Allocated to New Growth
COLLECTION
Of $1,770,244 in collection related costs, the District plans to spend $1,032,180 on projects that are the result of new development. Based on projections of peak sewer demand from new development, new development is projected to add an additional 522,694 gallons of wastewater daily through mid-point build-out, resulting in a cost per gallon of $1.97 as shown in Figure 3-4.
Figure 3-4: Sewer Collection Projects Allocated to New Growth
Sewer System Total Cost Cost Allocated to GrowthSewer Lift Sta. Pump Maint. and Replacement 143,673 71,836 Fischer Lift Station Grinder Maint. 51,735 - Generator Upgrades Maintenance 623,201 155,800 Total Sewer 818,609 227,637
227,637
522,694
0.44$ Cost Per Gallon
Ten Year Total
Gallons of Capacity per Day
Sewer System Total Cost Cost Allocated to GrowthProperty Purchase/Improvements 556,446 55,645 Collection System Upgrades 739,274 739,274 Sewer Main Camera Unit 74,266 37,133 Underground Pipe Locater & Camera 13,135 6,568 Hydrocleaner (Sewer Fund) and appurtenances 387,123 193,561 Total Sewer 1,770,244 1,032,180
1,032,180
522,694
1.97$ Cost Per Gallon
Ten Year Total
Gallons of Capacity per Day
MCSD | Capacity Fee Study 13
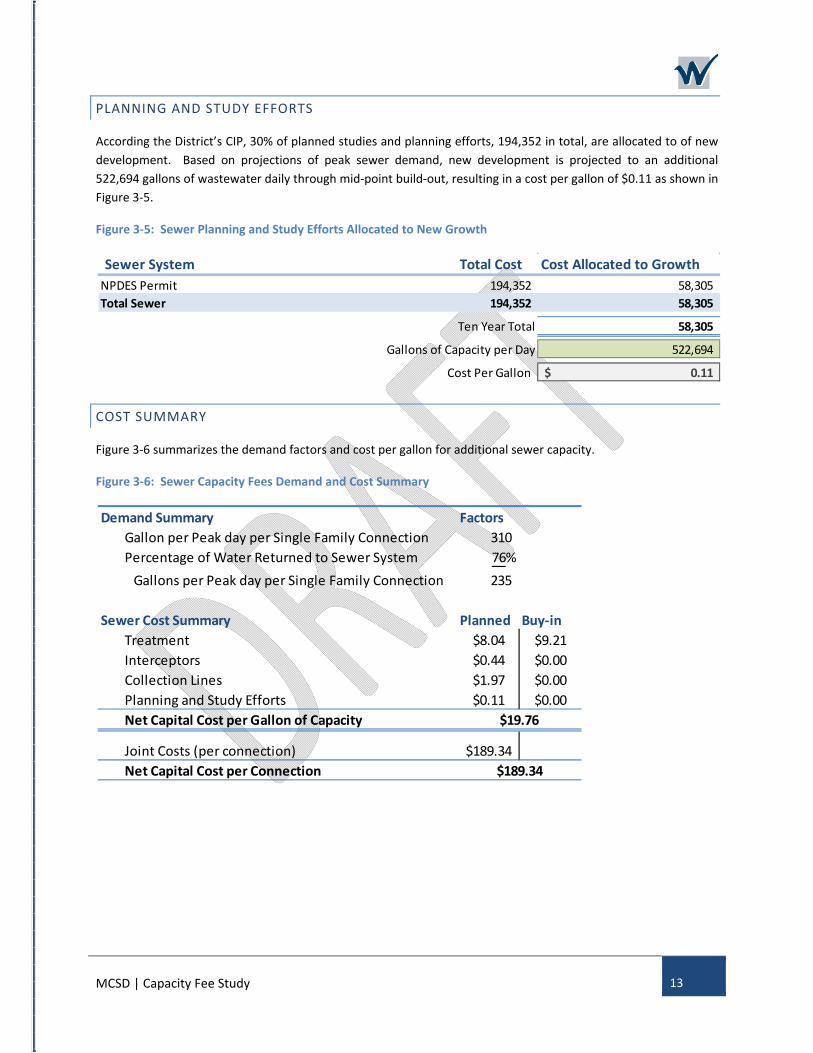
PLANNING AND STUDY EFFORTS
According the District’s CIP, 30% of planned studies and planning efforts, 194,352 in total, are allocated to of new development. Based on projections of peak sewer demand, new development is projected to an additional 522,694 gallons of wastewater daily through mid-point build-out, resulting in a cost per gallon of $0.11 as shown in Figure 3-5.
Figure 3-5: Sewer Planning and Study Efforts Allocated to New Growth
COST SUMMARY
Figure 3-6 summarizes the demand factors and cost per gallon for additional sewer capacity.
Figure 3-6: Sewer Capacity Fees Demand and Cost Summary
Sewer System Total Cost Cost Allocated to GrowthNPDES Permit 194,352 58,305 Total Sewer 194,352 58,305
58,305
522,694
0.11$ Cost Per Gallon
Ten Year Total
Gallons of Capacity per Day
Demand Summary FactorsGallon per Peak day per Single Family Connection 310 Percentage of Water Returned to Sewer System 76%
Gallons per Peak day per Single Family Connection 235
Sewer Cost Summary Planned Buy-inTreatment $8.04 $9.21Interceptors $0.44 $0.00Collection Lines $1.97 $0.00Planning and Study Efforts $0.11 $0.00Net Capital Cost per Gallon of Capacity
Joint Costs (per connection) $189.34Net Capital Cost per Connection
$19.76
$189.34
MCSD | Capacity Fee Study 14
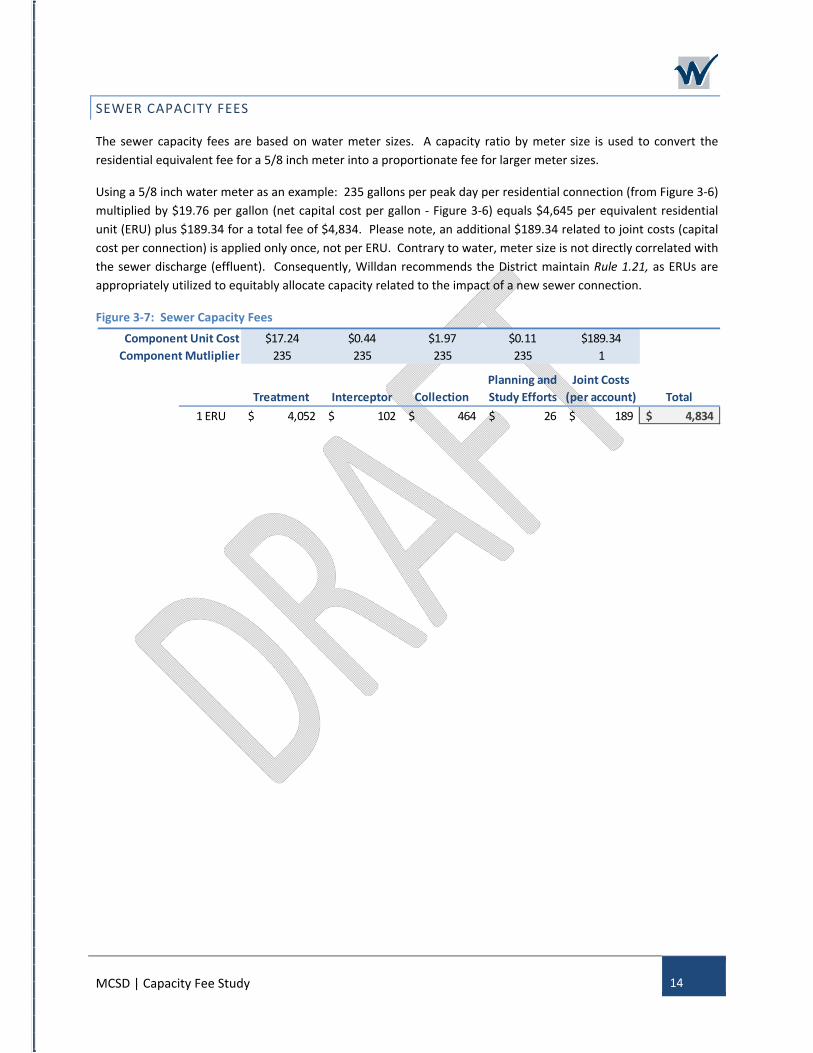
SEWER CAPACITY FEES
The sewer capacity fees are based on water meter sizes. A capacity ratio by meter size is used to convert the residential equivalent fee for a 5/8 inch meter into a proportionate fee for larger meter sizes.
Using a 5/8 inch water meter as an example: 235 gallons per peak day per residential connection (from Figure 3-6) multiplied by $19.76 per gallon (net capital cost per gallon - Figure 3-6) equals $4,645 per equivalent residential unit (ERU) plus $189.34 for a total fee of $4,834. Please note, an additional $189.34 related to joint costs (capital cost per connection) is applied only once, not per ERU. Contrary to water, meter size is not directly correlated with the sewer discharge (effluent). Consequently, Willdan recommends the District maintain Rule 1.21, as ERUs are appropriately utilized to equitably allocate capacity related to the impact of a new sewer connection.
Figure 3-7: Sewer Capacity Fees
Component Unit Cost $17.24 $0.44 $1.97 $0.11 $189.34Component Mutliplier 235 235 235 235 1
Treatment Interceptor CollectionPlanning and Study Efforts
Joint Costs (per account) Total
1 ERU 4,052$ 102$ 464$ 26$ 189$ 4,834$
MCSD | Capacity Fee Study 15
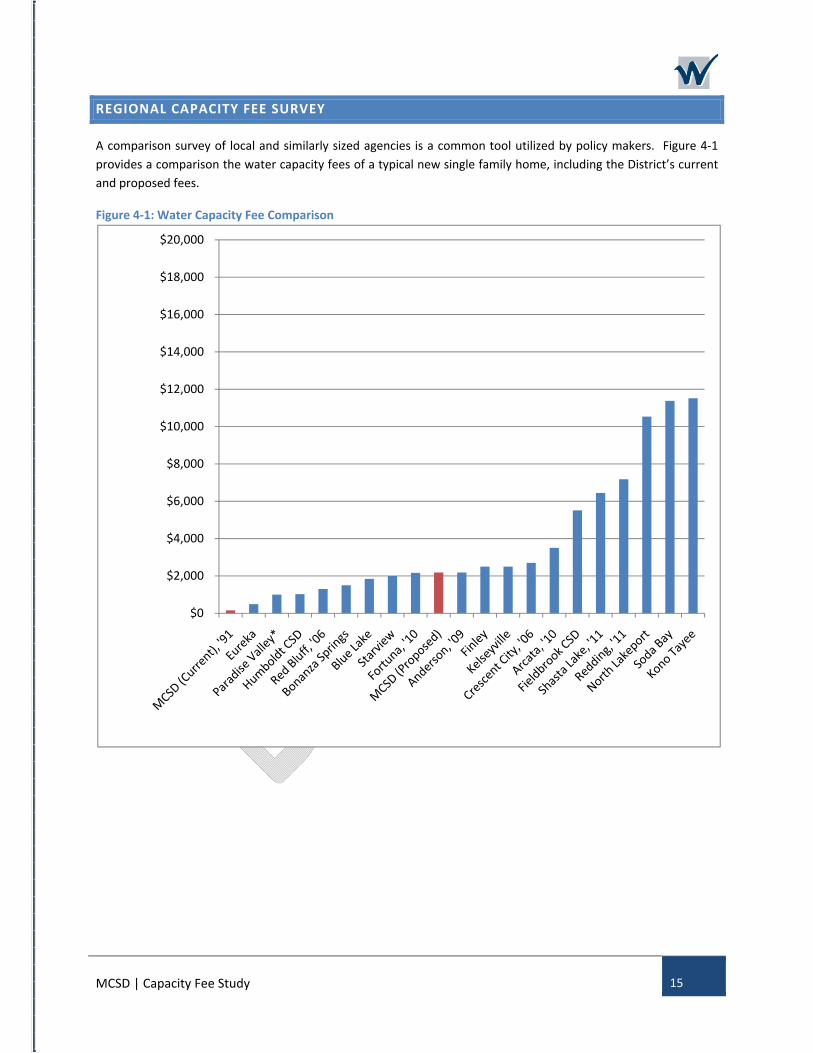
REGIONAL CAPACITY FEE SURVEY
A comparison survey of local and similarly sized agencies is a common tool utilized by policy makers. Figure 4-1 provides a comparison the water capacity fees of a typical new single family home, including the District’s current and proposed fees.
Figure 4-1: Water Capacity Fee Comparison
$0
$2,000
$4,000
$6,000
$8,000
$10,000
$12,000
$14,000
$16,000
$18,000
$20,000
MCSD | Capacity Fee Study 16
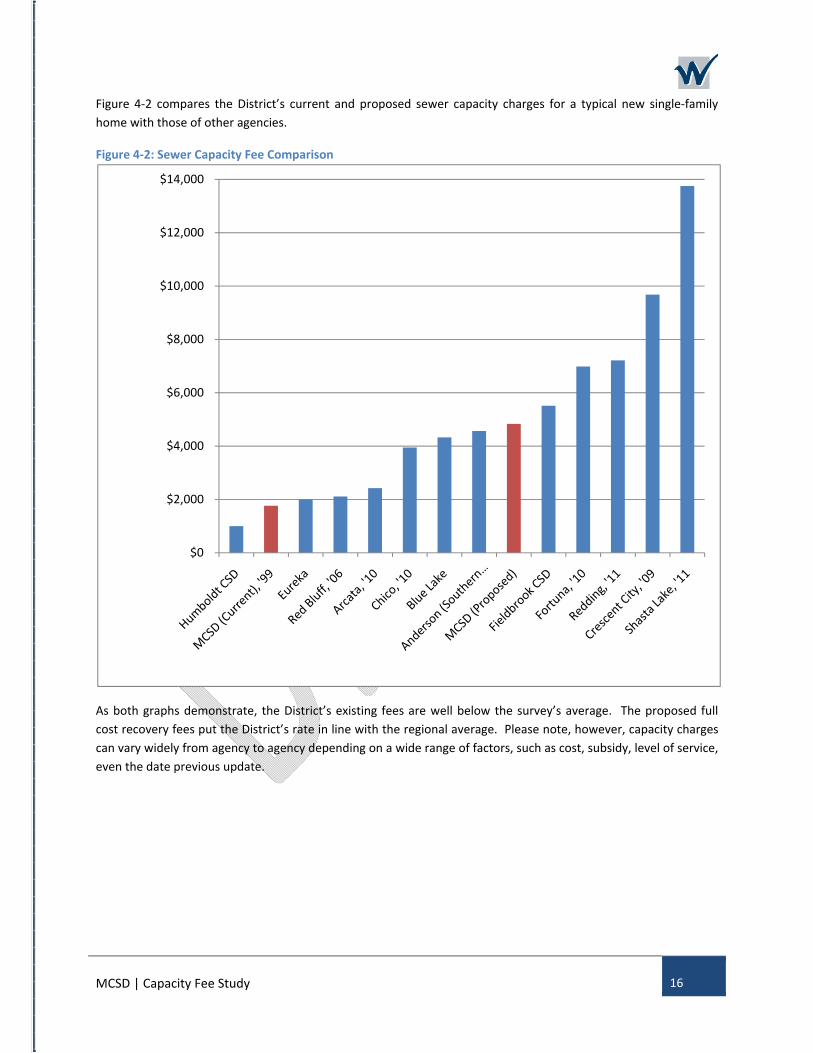
Figure 4-2 compares the District’s current and proposed sewer capacity charges for a typical new single-family home with those of other agencies.
Figure 4-2: Sewer Capacity Fee Comparison
As both graphs demonstrate, the District’s existing fees are well below the survey’s average. The proposed full cost recovery fees put the District’s rate in line with the regional average. Please note, however, capacity charges can vary widely from agency to agency depending on a wide range of factors, such as cost, subsidy, level of service, even the date previous update.
$0
$2,000
$4,000
$6,000
$8,000
$10,000
$12,000
$14,000