Embed Size (px)
Citation preview
Drillpipe Failure and its Prediction
Master Thesis
Author: Claudia Stelzer
Mining University Leoben
Chair for Drilling Engineering
in cooperation with
Statoil ASA
Industry Advisor University Advisor
MSc. Terje Grøttum Univ. Prof. DI Dr. Gerhard Thonhauser
I declare in lieu of oath that I did this Master’s Thesis
Drillpipe Failure and its Prediction
by myself using only the literature cited in the references.
____________________________
Claudia Stelzer, Leoben in October 2007
Acknowledgements
First of all, I want to thank my advisor Mr. Terje Grøttum from Statoil ASA for his support and encouragement. His experience and ideas were a great help and his engagement was very much appreciated.
Furthermore, for making this work possible, I would like to thank Univ. Prof. DI Dr. Thonhauser from the Drilling Engineering Department at the Mining University of Leoben, whose advice was greatly acknowledged as were several proposals for improvements to the work, and Mr. Tore Weltzin from Statoil ASA.
I also very much appreciated the advice and time of Mr. Brikt Rathour Hansen from Statoil ASA, who introduced me to the alternative materials used for drillpipes. Moreover, I want to thank Mr. Alex Adelman from Drilling Research & Development and Mr. William Ogilvie from Grant Prideco for the information provided.
I especially want to thank my colleagues from Statoil ASA for their hints, motivating words and the great working environment they created.
With all my heart I want to thank my parents for their love and support, not only during the time of the thesis, but during my whole life.
Executive Summary
Drillpipes need to resist ever higher stresses as the drilling environments are getting more and more challenging, leading to possible failures that in the worst case of a pipe twist off can result in tremendous costs. These expenses can on the one hand be attributed to costly fishing jobs and on the other hand to potential side tracks including the costs of additional drilling time and the lost of equipment in hole.
Although many investigations have been done previously on this topic and lots of prediction models to avoid failure can be found, the frequency of drillpipe failure still remains high. This is partly due to the insufficiency of these models as they do not take all failure influencing factors into account. Most of these models consider bending stress as the main source of fatigue and do not include other stresses or stress raisers leading to a shorter life of the components than predicted.
Therefore the following work provides a discussion of the different types of failure, their prediction, the effect of drillpipe inspection and potential alternatives to steel. Furthermore, and most important, it explains the parameters that influence drillpipe failure and shows by means of flowcharts which of these factors are already able to be included into a prediction model and which need further investigations.
Besides that, a workflow was developed how a prediction model could be build if all necessary information was available. Nevertheless, a lot of the unknown parameters cannot be measured with nowadays technology as they need to be known for each length increment of the drillstring. For developing such measuring devices, though, a positive cost-benefit ratio is necessary as well as the limited space found downhole needs to be considered when costructing the device.
Table of Contents i
Table of Contents
1 Introduction........................................................................................................................... 7 2 Manufacturing Process of Drillpipe................................................................................... 8
2.1 Manufacturing Process of Tool Joints ................................................................................................ 8 2.2 Manufacturing Process of Drillpipe Bodies ......................................................................................10 2.3 Welding of Drillpipe Tube and Tool Joint..........................................................................................11
3 Metallurgy of Drillpipe ....................................................................................................... 13 4 Types of Failure.................................................................................................................. 16
4.1 Fatigue Failure ..................................................................................................................................16 4.1.1 Wear Leads to Fatigue ...................................................................................................................................18 4.1.2 Slip Marks ........................................................................................................................................................19
4.2 Overloading Failure...........................................................................................................................19 4.3 Corrosion Failure...............................................................................................................................22 4.4 Elevated Temperature Failure..........................................................................................................24
5 Drillpipes and Challenges................................................................................................. 26 5.1 Through-Tubing Rotary Drilling (TTRD)...........................................................................................26 5.2 Standard Wells..................................................................................................................................28 5.3 Extended Reach Drilling (ERD)........................................................................................................28 5.4 HP/HT Wells......................................................................................................................................30
6 Prediction of Drillpipe Failures ........................................................................................ 31 6.1 Fatigue Testing..................................................................................................................................32
6.1.1 Cyclic Axial Tension Test................................................................................................................................32 6.1.2 Simple Bending Fatigue Test .........................................................................................................................32 6.1.3 Rotating Bending Test ....................................................................................................................................33
6.2 Fatigue Life Estimation with S-N Curves..........................................................................................35 6.2.1 Notch Effects ...................................................................................................................................................37 6.2.2 Size Effect........................................................................................................................................................37 6.2.3 Effects of Surface Finish.................................................................................................................................38
6.3 Von Mises Stress ..............................................................................................................................38 6.4 Cumulative Fatigue Damage............................................................................................................39 6.5 Fracture Mechanics ..........................................................................................................................40 6.6 Residual Stresses .............................................................................................................................41
7 Parameters Influencing the Prediction ........................................................................... 43 7.1 General Parameters..........................................................................................................................44
7.1.1 Bending Stress and Dogleg Severity.............................................................................................................44 7.1.2 Operating Torque............................................................................................................................................49 7.1.3 Surface Damage .............................................................................................................................................50 7.1.4 Existence of Corrosion....................................................................................................................................51
7.2 Parameters Acting on Tool Joints ....................................................................................................52 7.2.1 Preloading........................................................................................................................................................52 7.2.2 Bending Strength Ratio...................................................................................................................................55 7.2.3 Make Up Torque .............................................................................................................................................56 7.2.4 Connection Threads........................................................................................................................................58 7.2.5 Single and Double Shoulder Connections.....................................................................................................60 7.2.6 Residual Stresses ...........................................................................................................................................60
7.3 Parameters Acting on the Pipe Body ...............................................................................................61 7.3.1 Buckling ...........................................................................................................................................................61 7.3.2 Vibrations.........................................................................................................................................................63 7.3.3 Drillpipe Upsets ...............................................................................................................................................64 7.3.4 Side Loads.......................................................................................................................................................64
7.4 Additional Factors Influencing Fatigue Life ......................................................................................65 7.4.1 History of Drillpipe ...........................................................................................................................................65
Table of Contents ii
7.4.2 Critical Events..................................................................................................................................................67 7.4.3 Stiffness Ratio..................................................................................................................................................67 7.4.4 Dimensions of the Drillpipe.............................................................................................................................68 7.4.5 Formation Type ...............................................................................................................................................69 7.4.6 Toughness of Material ....................................................................................................................................70 7.4.7 Personnel Awareness.....................................................................................................................................71 7.4.8 Hardbanding on Tool Joints............................................................................................................................71
7.5 Approach to a Prediction Model .......................................................................................................72 8 Inspection of Drillpipe ....................................................................................................... 78
8.1 Standards in the Oil Industry.............................................................................................................80 8.1.1 DS-1 Standard.................................................................................................................................................80 8.1.2 NS-2 Standard.................................................................................................................................................81
8.2 Inspection Methods...........................................................................................................................81 8.2.1 Visual Inspection .............................................................................................................................................82 8.2.2 Electromagnetic Inspection ............................................................................................................................83 8.2.3 Ultrasonic Inspection.......................................................................................................................................84 8.2.4 X-ray Inspection...............................................................................................................................................84
8.3 Frequency of Inspection....................................................................................................................85 8.4 Quality of Inspection..........................................................................................................................85
9 Alternative Materials for Drillpipes.................................................................................. 87 9.1 Aluminium..........................................................................................................................................88 9.2 Composite .........................................................................................................................................90 9.3 Titanium.............................................................................................................................................91
10 Conclusion.................................................................................................................... 93 11 Nomenclature ............................................................................................................... 94 12 References.................................................................................................................... 96 13 Appendix ..................................................................................................................... 103
List of Figures iii
List of Figures
Figure 2-1: Raised, smooth [62] (left) and flushed [2] (right) hardbanding on tool joint ................................. 10 Figure 2-2: Weld neck/upset design [2] ......................................................................................................... 11 Figure 3-1: Body-centered tetragonal unit cell [4] ......................................................................................... 13 Figure 3-2: Photomicrograph of martensitic structure [4] ............................................................................. 14 Figure 3-3: Comparison of the TTT diagrams of a steel with a content of 2% Mo (left) and a steel with
0.2% Mo (right) [5]................................................................................................................................... 14 Figure 3-4: CCT diagram [5] .......................................................................................................................... 15 Figure 4-1: Washout on drillpipe [8]( (left) and broken pipe [62] (right)............................................................ 17 Figure 4-2: Most likely position for failure to occur on the pipe body [14]..................................................... 18 Figure 4-3: Position of failure on connections [14]......................................................................................... 18 Figure 4-4: Burst failure [28]............................................................................................................................ 20 Figure 4-5: Collapse failure [28]...................................................................................................................... 20 Figure 4-6: Box swell (top left) develops to the extreme stage (top right); pin stretch (bottom left) leads
to separation of the pin neck (bottom right) [26]..................................................................................... 21 Figure 4-7: Tension failure [27] ....................................................................................................................... 21 Figure 4-8: Combined load failure with helical shape fracture [29]............................................................... 22 Figure 4-9: Sulphide stress cracking [73]....................................................................................................... 22 Figure 4-10: Effects of corrosion on drillpipes [62] ........................................................................................ 23 Figure 4-11: Failure due to frictional heating [12] .......................................................................................... 25 Figure 5-1: Principal of Through-Tubing Rotary Drilling [61]......................................................................... 27 Figure 6-1: Fatigue testing machine (compressive and tensile loads) [19].................................................. 32 Figure 6-2: Rotating/bending test setup [16].................................................................................................. 33 Figure 6-3: 50° dogleg bending test [62] ........................................................................................................ 34 Figure 6-4: Rotating bending test for 2 ⅞” drillpipe [62] ................................................................................ 34 Figure 6-5: Definition of terms relating to S-N curves [23] ............................................................................ 35 Figure 6-6: Typical S-N diagram [14].............................................................................................................. 36 Figure 6-7: Influence from surface condition on fatigue resistance [14]....................................................... 38 Figure 6-8: Fatigue life duration [20]............................................................................................................... 40 Figure 6-9: Paris’ law [19]................................................................................................................................ 41 Figure 7-1: Actual dogleg severity (red) versus expected dogleg severity (dashed blue line) [74] ............ 45 Figure 7-2: Maximum bending of drillpipe in tension (left) and compression (right) [19]............................. 48 Figure 7-3: Corrosion pits [62]......................................................................................................................... 51 Figure 7-4: Preloading and the effect on external load [47] .......................................................................... 53 Figure 7-5: Deformation at preloading with externally applied tension [49] ................................................. 54 Figure 7-6: Deformation at preloading with dynamic external loading [49] .................................................. 54 Figure 7-7: Applied make up and cyclic loading [32]..................................................................................... 56 Figure 7-8: Distribution of tensile load carried by threads [2] ....................................................................... 59 Figure 7-9: Comparison of SST thread form with a standard API thread profile [2] ................................... 59 Figure 7-10: Double shoulder tool joints [48] ................................................................................................. 60 Figure 7-11: Sinusoidal buckling (right) and helical buckling (left) [38] ........................................................ 62 Figure 7-12: Internal-External upset [37]........................................................................................................ 64 Figure 7-13: Tag integrated in the tool joint (right) and the reading/writing antenna (left) [40] ................... 66 Figure 7-14: Failure frequency versus hole size [45] .................................................................................... 69 Figure 7-15: Comparative fatigue performance and final fracture of two materials of different
toughness [46] ......................................................................................................................................... 70 Figure 7-16: Necessary input for a prediction of drillpipe failure ............................................................... 74 Figure 7-17: Use of Miner’s rule to predict the endurance limit [47] ............................................................. 75 Figure 7-18: Use of Manson’s method to predict the endurance limit [47]................................................... 76 Figure 8-1: Wet fluorescent magnetic particle image of a fracture surface with cracks originating from ID
and OD [13].............................................................................................................................................. 84 Figure 9-1: The Serov Mechanical Plant assembles steel tool joint-aluminum pipe, (top left) [53] ............ 89 Figure 9-2: 10 ft full diameter tension test [57]............................................................................................... 90

List of Figures iv
Figure 9-3: Holding a titanium pipe [59].......................................................................................................... 92 Figure 13-1: Manufacturing process of tool joints [2]..................................................................................103 Figure 13-2: Manufacturing process of drillpipe including welding [2] .......................................................104 Figure 13-3: Stresses acting on the pipe body.........................................................................................112 Figure 13-4: Stresses acting on the tool joint ...........................................................................................113 Figure 13-5: Stress raisers on the pipe body............................................................................................114 Figure 13-6: Stress raisers on the tool joint ..............................................................................................115
List of Tables v
List of Tables
Table 5-1: Maximum operational load comparison [62] [75], [65] ........................................................................ 26 Table 7-1: Comparison of maximum permissible doglegs ......................................................................... 46 Table 7-2: Comparison of bending stresses ............................................................................................... 47 Table 7-3: Handling practices of drill string [35].............................................................................................. 71 Table 8-1: Important properties in drillstring components [25]....................................................................... 79 Table 8-2: Properties covered by API Specifications [25].............................................................................. 79 Table 8-3: Common inspection methods for used drillpipes and BHA components [19] ............................ 82 Table 8-4: Recommended DS-1 inspection programs for drillpipe [22]........................................................ 86 Table 9-1: Strength-to-weight ratio comparison of many steel grades to non-steel alternative materials
including attached steel tool joints [50].................................................................................................... 87 Table 13-1: Drillpipe properties for a new pipe [68]......................................................................................105 Table 13-2: Tool joint properties [68].............................................................................................................107
List of Equations vi
List of Equations
Stress ratio: Eq. ( 6-1).................................................... 35 Basquin’s equation Eq. ( 6-2).................................................... 36 Notch sensitivity factor Eq. ( 6-3).................................................... 37 Von Mises stress Eq. ( 6-4).................................................... 38 Miner’s Rule Eq. ( 6-5).................................................... 39 Cumulative damage Eq. ( 6-6).................................................... 39 Paris’ law Eq. ( 6-7).................................................... 40 Maximum permissible dogleg severity Eq. ( 7-1).................................................... 45 Maximum permissible bending stress for Grade E Eq. ( 7-2).................................................... 45 Maximum permissible bending stress for Grade S Eq. ( 7-3).................................................... 45 Bending stress Eq. ( 7-4).................................................... 46 Bending Strength Ratio Eq. ( 7-5).................................................... 55 Section modulus of the box Eq. ( 7-6).................................................... 55 Section modulus of the pin Eq. ( 7-7).................................................... 55 Fatigue Strength Ratio Eq. ( 7-8).................................................... 56 Make up torque Eq. ( 7-9).................................................... 57 Axial load from make up Eq. ( 7-10).................................................. 57 Recommended make up inner stress for new tool joints Eq. ( 7-11).................................................. 57 Rotary shoulder connection’s friction factor Eq. ( 7-12).................................................. 57 Frictional torque on shoulder face Eq. ( 7-13).................................................. 57 Frictional torque on thread mating surfaces Eq. ( 7-14).................................................. 57 Frictional torque from the angle of the thread helix Eq. ( 7-15).................................................. 57 Sinusoidal Buckling Eq. ( 7-16).................................................. 62 Helical Buckling Eq. ( 7-17).................................................. 62 Axial force Eq. ( 7-18).................................................. 62 Critical RPM for axial vibration Eq. ( 7-19).................................................. 63 Critical RPM for nodal vibration Eq. ( 7-20).................................................. 63 Miner’s rule Eq. ( 7-21).................................................. 76
1 Introduction
Page: 7
1 Introduction
Drillpipe failure has been a serious concern for the oil industry for many years as it can be extremely costly. Considering an average rate for drilling operations in the Norwegian Sea of 200,000 to 500,000 € per day[62], a failure of the drillpipe downhole can dramatically influence the total costs for the project.
Increasing expenses for the projects follow on one hand from the delay in drilling operations, as fishing jobs become necessary, and on the other hand from sidetracks which may become inevitable if fishing was not successful. In the latter case this would on one side imply the loss of the drillpipe and bottom hole assembly as they need to be left in hole, and on the other side the costs for drilling a new borehole parallel to the old one, which can take from several days up to weeks.
Although many investigations to solve this problem, especially in the prediction of drillstring lives, have been done, no satisfying solutions could be found to prevent failures of the drillpipe body as well as of the tool joints. Therefore this work will give an overview of the different methods used for prediction, like the cumulative fatigue or the fracture mechanics approach. The importance of testing will be underlined, whereat the different influence on prediction of small scale and full scale testing is shown.
Besides that, parameters influencing drillpipe failure are described pointing out the difficulty in constructing a prediction model as all these factors are interacting. This attempt demonstrating the complexity of failure prediction will be supported by flowcharts showing which information is already known for possibly predicting the life of the body or tool joint and the information that needs further investigations to be finally able to be integrated into a satisfying model.
Finally, the work also gives an introduction on the metallurgy and production of drillpipes as well as on alternative materials to steel, like aluminium, composite and titanium. Both the problems associated with drillpipe inspection and the different types of failure are also discussed. Furthermore, a chapter with different drilling environments and thereby occurring challenges is included for broader understanding of the topic.
2 Manufacturing Process of Drillpipe
Page: 8
2 Manufacturing Process of Drillpipe
A lot of drillpipe suppliers, like Grant Prideco, Tenaris or Mannesmann can be found on the market. In this case the manufacturing process[2] of Grant Prideco, one of the suppliers of Statoil, will be described. To explain this process in the best possible way, some illustrations can be found in the Appendix in Figures 13-1 and 13-2. These show the manufacturing steps beginning with the tool joint and the drillpipe followed by the welding process of these two. Additionally, it should be mentioned that for both, the tool joint and the tube a different composition of steel is used depending on the manufacturer. Furthermore, it is stated that the manufacturing process, chemical composition, mechanical properties requirements, tests and so on are given in the API specification 5D[37].
2.1 Manufacturing Process of Tool Joints
The material with specific metallurgical chemistries, which is delivered from the steel industry, arrives with a certificate to state these properties; furthermore, the material undergoes a visual inspection, where the tubes bore, straightness, and length are verified. Additionally, 10% of the material gets tested by magnetic particle inspection (MPI) to check for cracks, and is given a full surface examination for any laps, or surface/near surface inclusions. Finally, sections are taken for lab examination to check the chemistry from the mill.[7]
Tool Joints are produced from forgings, solid round bars, or thick wall tubing, which is dependent on the configuration and size. The further process, if forging is necessary, is to cut the steel to length, preheat it to an adequate temperature, and form the specimen into a tool joint blank. Quality inspections accompany the whole manufacturing process to be able to guarantee the best possible results.
The next step in processing will be to blank and bore the specimen. Then the austenitizing is done to heat the steel to a temperature above 1,334 °F, and start the cooling process right after. This controlled rate of cooling determines
2 Manufacturing Process of Drillpipe
Page: 9
the hardness1 of the tool joint and is called quenching. In the manufacturing process of tool joints an oil quenching is used, which is slow, but prevents from cracks formed due to rapid cooling. To cool the material rapidly to a much lower temperature allows the austenite to be transformed into martensite, which is the strongest and hardest form of steel.[3]
Subsequently the tempering process starts. After the specimen has hardened it shows to be hard and brittle with high residual stresses, this means the steel is instable, especially if external loads are applied. To relieve these internal stresses and soften the material tempering is done. Therefore the specimen is reheated for some time to a temperature below the critical temperature and then is allowed to cool. The metallurgical process releases the carbon held in the martensite and forms carbide crystals.[3]
A quality inspection again follows to verify that all requirements are met. If this applies, the specimen can be finished and threaded; in the next step the tool joint will be exposed to a phosphate bath. This procedure has two purposes. On one side it helps in generating a work hardened surface on the threads, but on the other side and more important it micro pits the threaded surface so that the dope has something to adhere to.[7] After a final inspection the tool joints are ready for being weld on the pipe.
Optional tool joint break-in and optional hardbanding can be ordered. Tool joint break-in generally hardens the top few microns of steel on the threads and thus, increases the life of the tool joint dramatically because it is protected from bumps and bangs as it is made up. This process needs to be done anyway, but can be ordered to be carried out at the factory to assure a well done work, which maybe is not found at the rig due to lack in time. The hardbanding is applied around the tool joint to minimize tool joint wear and achieve a maximum casing wear protection. After the hardbanding has been applied, high spots are removed with a hand held sander. Sometimes additional sanding or machining of the hardbanding is requested.[7] For Statoil this is the preferred finishing as it results in a smooth surface thereby reducing friction and wear during drilling operations.[62]
1 A measure of the hardness of a metal, as determined by pressing a hard steel ball or diamond penetrator into a smooth surface under standard conditions. Results are often expressed in terms of Rockwell hardness number or Brinell hardness number.[36]
2 Manufacturing Process of Drillpipe
Page: 10
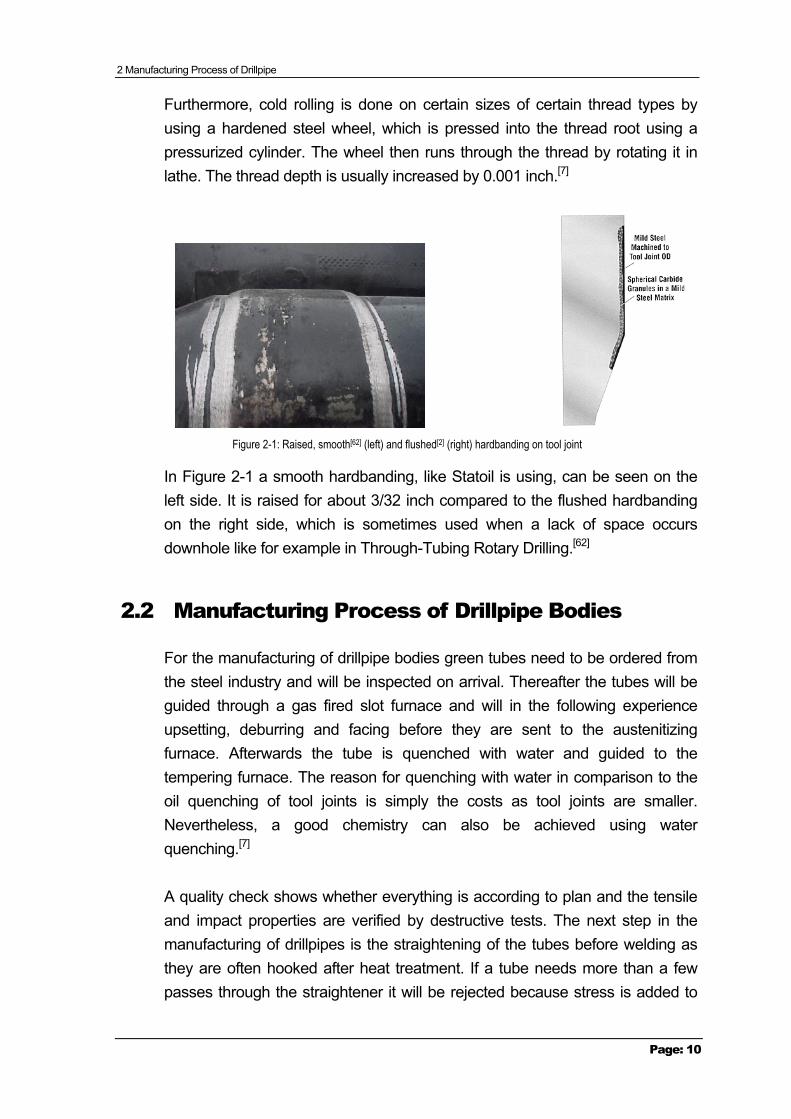
Furthermore, cold rolling is done on certain sizes of certain thread types by using a hardened steel wheel, which is pressed into the thread root using a pressurized cylinder. The wheel then runs through the thread by rotating it in lathe. The thread depth is usually increased by 0.001 inch.[7]
Figure 2-1: Raised, smooth[62] (left) and flushed[2] (right) hardbanding on tool joint
In Figure 2-1 a smooth hardbanding, like Statoil is using, can be seen on the left side. It is raised for about 3/32 inch compared to the flushed hardbanding on the right side, which is sometimes used when a lack of space occurs downhole like for example in Through-Tubing Rotary Drilling.[62]
2.2 Manufacturing Process of Drillpipe Bodies
For the manufacturing of drillpipe bodies green tubes need to be ordered from the steel industry and will be inspected on arrival. Thereafter the tubes will be guided through a gas fired slot furnace and will in the following experience upsetting, deburring and facing before they are sent to the austenitizing furnace. Afterwards the tube is quenched with water and guided to the tempering furnace. The reason for quenching with water in comparison to the oil quenching of tool joints is simply the costs as tool joints are smaller. Nevertheless, a good chemistry can also be achieved using water quenching.[7]
A quality check shows whether everything is according to plan and the tensile and impact properties are verified by destructive tests. The next step in the manufacturing of drillpipes is the straightening of the tubes before welding as they are often hooked after heat treatment. If a tube needs more than a few passes through the straightener it will be rejected because stress is added to
2 Manufacturing Process of Drillpipe
Page: 11
the material by straightening.[7] After this process a full length inspection and a magnetic particle end area inspection needs to be done to be able to exclude longitudinal and transverse defects and to verify the wall thickness. Now the drillpipe tube is finished and ready for welding.
Drillpipe bodies and tool joints also can be ordered with internal plastic coating to prevent the inside of the pipe from corrosion. This can help in avoiding notches or cracks, which are formed due to corrosion, and eases inspection as internal pipe inspection is often more insecure because of the difficult accessibility.
2.3 Welding of Drillpipe Tube and Tool Joint
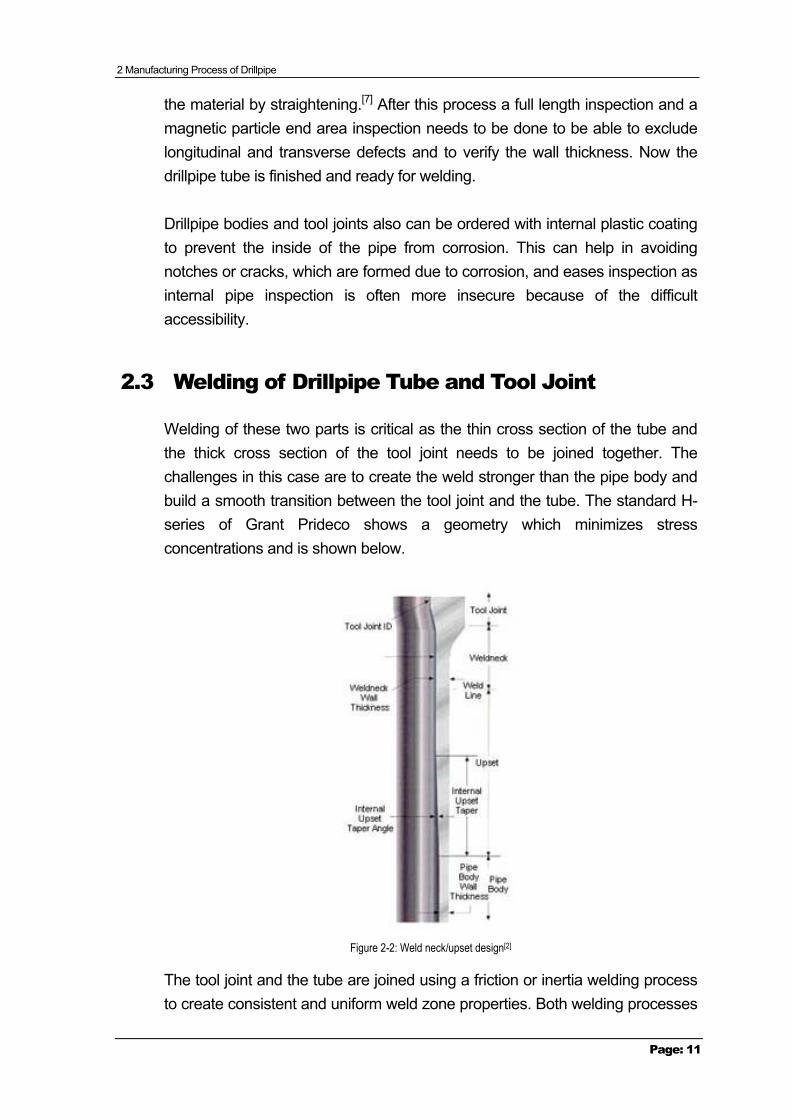
Welding of these two parts is critical as the thin cross section of the tube and the thick cross section of the tool joint needs to be joined together. The challenges in this case are to create the weld stronger than the pipe body and build a smooth transition between the tool joint and the tube. The standard H-series of Grant Prideco shows a geometry which minimizes stress concentrations and is shown below.
Figure 2-2: Weld neck/upset design[2]
The tool joint and the tube are joined using a friction or inertia welding process to create consistent and uniform weld zone properties. Both welding processes
2 Manufacturing Process of Drillpipe
Page: 12
are based on the rotation of one surface against a second surface under high pressure and high speed. The difference is that friction welding uses constant rotations per minute with the contact pressure being varied to ensure a good weld. In inertia welding the tool joint is mounted in a massive flywheel which is spun up to a pre-determined speed and a constant pressure is then applied during the weld. Friction welding has been used for a long time and takes longer to perform.[7] After a stress relieve, the weld zone needs to be machined and cleaned before stepping into the next procedure. There the welded zone will be heated to austenitic temperatures with the help of an inductive coil and is then quenched by air or a water-polymer spray on the inside and outside of that zone. Straight after the tempering process takes place, allowing the steel to relieve stresses and produce tougher, stronger and more uniform weld zone properties, a final weld inspection is conducted, where drift, hardness, visual and dimensional aspects are verified as well as ultra sonic and wet magnetic inspections are done on the zone.
Finally, a quenched and tempered martensitic, seamless steel drillpipe is ready for service.
3 Metallurgy of Drillpipe
Page: 13
3 Metallurgy of Drillpipe
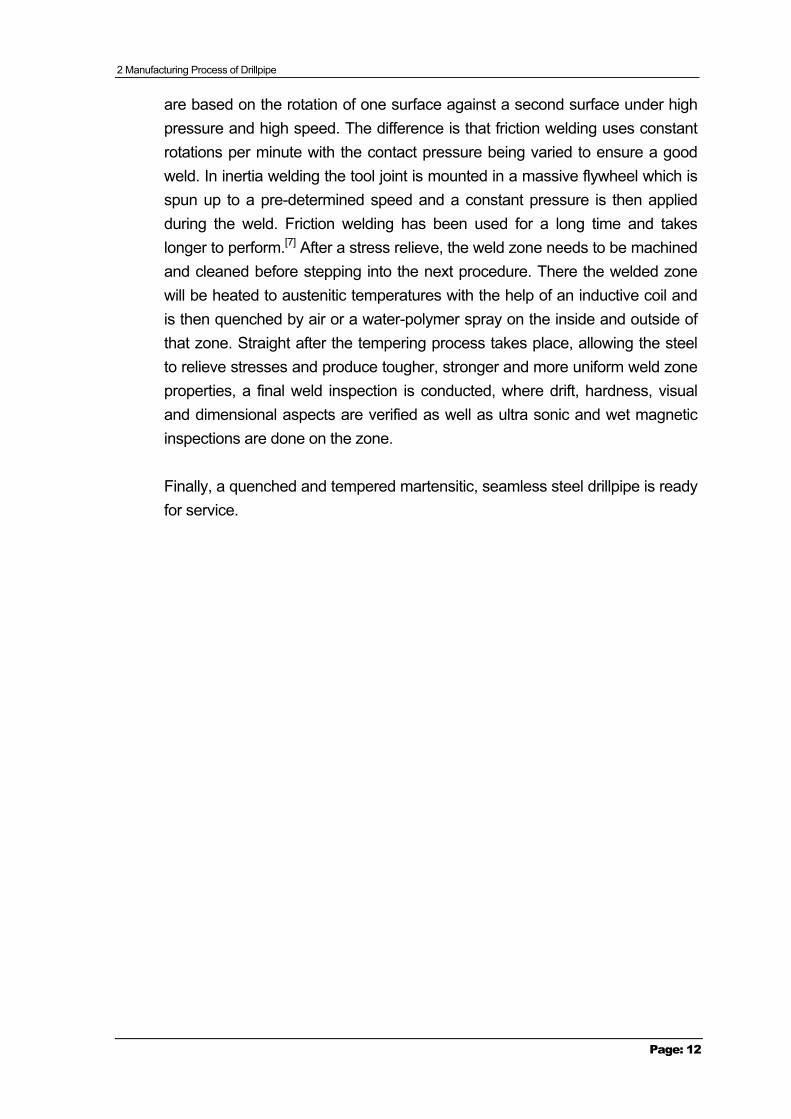
Ferrite, pearlite, bainite, martensite, and austenite are the names of the micro structural constituents in steel. Concerning these, the most important one for the oil industry is the martensite, which is a supersaturated solid solution of carbon in iron. As martensite stores more carbon than ferrite, the cubic form is distorted to hold the carbon atoms and therefore becomes tetragonal[4] as can be seen in Figure 3-1.
Figure 3-1: Body-centered tetragonal unit cell[4]
Martensite is usually produced by rapid cooling – so the carbon atoms cannot come out of solution - from the austenite phase to avoid building of ferrite, pearlite, and bainite. The result of this quenching process mainly depends on the geometry of the specimen and the composition of steel. If the wall thickness of the tool joint or tube is thinner the probability for the steel to get fully martensitic is naturally bigger than for a thicker wall thickness. Therefore alloying elements are added to reduce the critical rate of cooling.[5] These suppress the formation of other constituents (ferrite, pearlite, and bainite) during the cooling phase, which means those form during slower cooling rates. This allows martensite to be build during oil and water quenching. This ability is referred to as hardenability.[6] If this rate could not be achieved this will result in martensitic outer regions on the drillpipe as these cool faster, but the core may transform to ferrite, pearlite or bainite as slower cooling takes place. A fully martensitic structure can be seen in Figure 3-2:
3 Metallurgy of Drillpipe
Page: 14
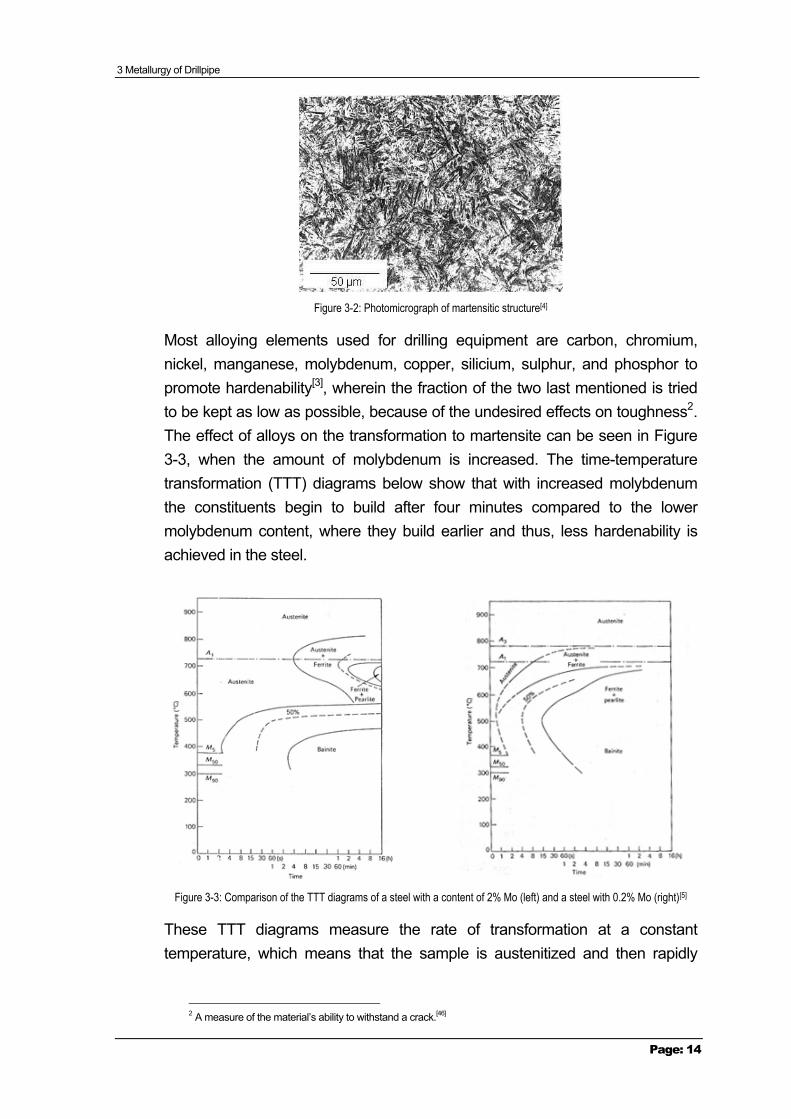
Figure 3-2: Photomicrograph of martensitic structure[4]
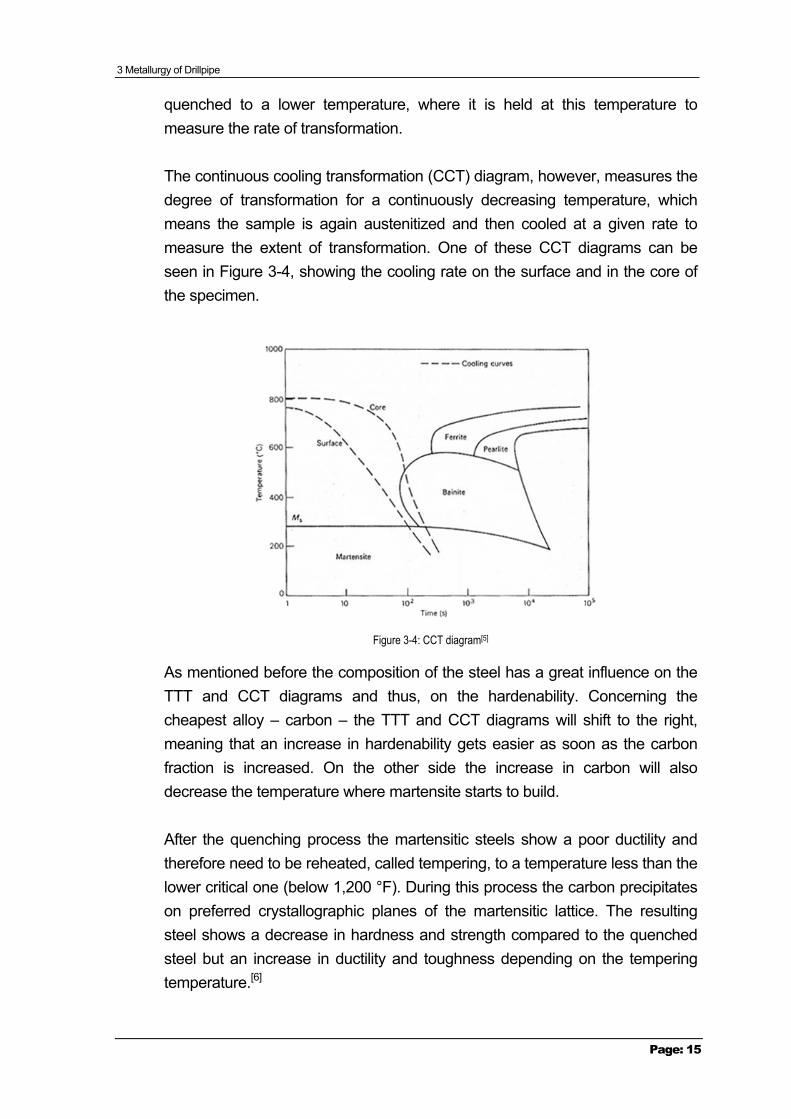
Most alloying elements used for drilling equipment are carbon, chromium, nickel, manganese, molybdenum, copper, silicium, sulphur, and phosphor to promote hardenability[3], wherein the fraction of the two last mentioned is tried to be kept as low as possible, because of the undesired effects on toughness2. The effect of alloys on the transformation to martensite can be seen in Figure 3-3, when the amount of molybdenum is increased. The time-temperature transformation (TTT) diagrams below show that with increased molybdenum the constituents begin to build after four minutes compared to the lower molybdenum content, where they build earlier and thus, less hardenability is achieved in the steel.
Figure 3-3: Comparison of the TTT diagrams of a steel with a content of 2% Mo (left) and a steel with 0.2% Mo (right)[5]
These TTT diagrams measure the rate of transformation at a constant temperature, which means that the sample is austenitized and then rapidly
2 A measure of the material’s ability to withstand a crack.[46]
3 Metallurgy of Drillpipe
Page: 15
quenched to a lower temperature, where it is held at this temperature to measure the rate of transformation.
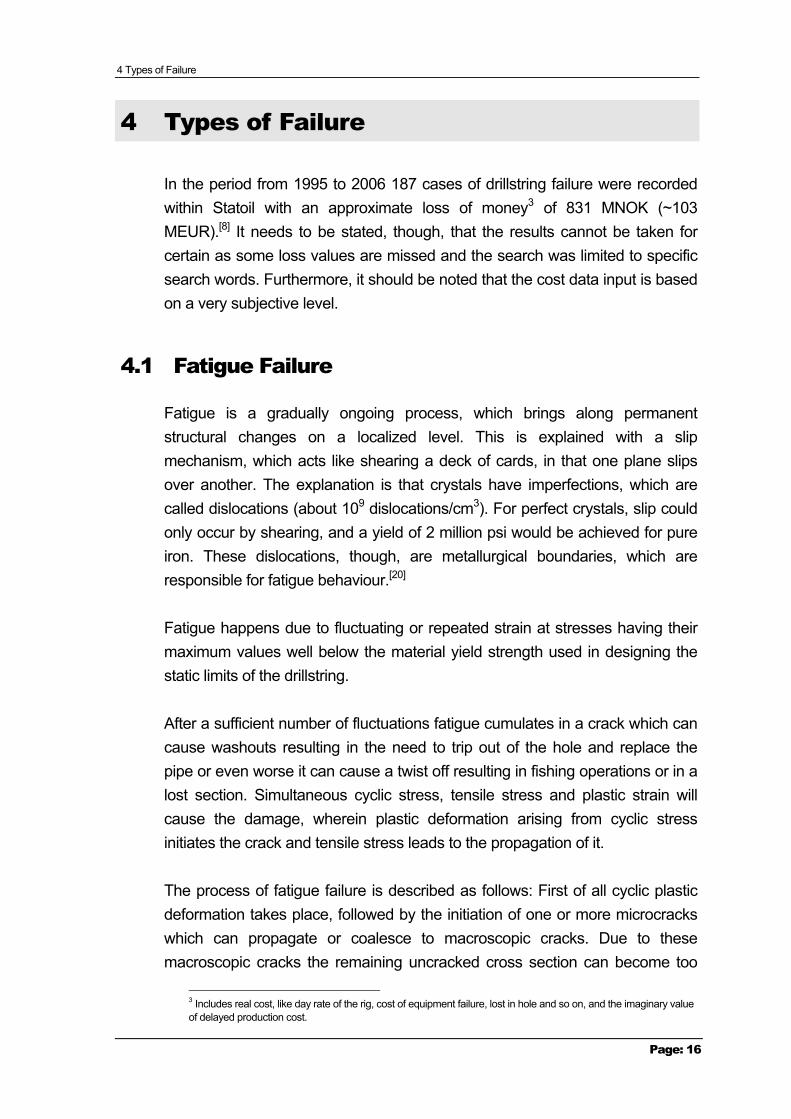
The continuous cooling transformation (CCT) diagram, however, measures the degree of transformation for a continuously decreasing temperature, which means the sample is again austenitized and then cooled at a given rate to measure the extent of transformation. One of these CCT diagrams can be seen in Figure 3-4, showing the cooling rate on the surface and in the core of the specimen.
Figure 3-4: CCT diagram[5]
As mentioned before the composition of the steel has a great influence on the TTT and CCT diagrams and thus, on the hardenability. Concerning the cheapest alloy – carbon – the TTT and CCT diagrams will shift to the right, meaning that an increase in hardenability gets easier as soon as the carbon fraction is increased. On the other side the increase in carbon will also decrease the temperature where martensite starts to build.
After the quenching process the martensitic steels show a poor ductility and therefore need to be reheated, called tempering, to a temperature less than the lower critical one (below 1,200 °F). During this process the carbon precipitates on preferred crystallographic planes of the martensitic lattice. The resulting steel shows a decrease in hardness and strength compared to the quenched steel but an increase in ductility and toughness depending on the tempering temperature.[6]
4 Types of Failure
Page: 16
4 Types of Failure
In the period from 1995 to 2006 187 cases of drillstring failure were recorded within Statoil with an approximate loss of money3 of 831 MNOK (~103 MEUR).[8] It needs to be stated, though, that the results cannot be taken for certain as some loss values are missed and the search was limited to specific search words. Furthermore, it should be noted that the cost data input is based on a very subjective level.
4.1 Fatigue Failure
Fatigue is a gradually ongoing process, which brings along permanent structural changes on a localized level. This is explained with a slip mechanism, which acts like shearing a deck of cards, in that one plane slips over another. The explanation is that crystals have imperfections, which are called dislocations (about 109 dislocations/cm3). For perfect crystals, slip could only occur by shearing, and a yield of 2 million psi would be achieved for pure iron. These dislocations, though, are metallurgical boundaries, which are responsible for fatigue behaviour.[20]
Fatigue happens due to fluctuating or repeated strain at stresses having their maximum values well below the material yield strength used in designing the static limits of the drillstring.
After a sufficient number of fluctuations fatigue cumulates in a crack which can cause washouts resulting in the need to trip out of the hole and replace the pipe or even worse it can cause a twist off resulting in fishing operations or in a lost section. Simultaneous cyclic stress, tensile stress and plastic strain will cause the damage, wherein plastic deformation arising from cyclic stress initiates the crack and tensile stress leads to the propagation of it.
The process of fatigue failure is described as follows: First of all cyclic plastic deformation takes place, followed by the initiation of one or more microcracks which can propagate or coalesce to macroscopic cracks. Due to these macroscopic cracks the remaining uncracked cross section can become too
3 Includes real cost, like day rate of the rig, cost of equipment failure, lost in hole and so on, and the imaginary value of delayed production cost.
4 Types of Failure
Page: 17
weak to withstand the loads applied. If undetected this leads to a sudden fracture and thus, cause a catastrophic failure.[6] Fatigue damage and failure can occur at operating stresses as low as 10 to 20% of the components yield stress. The fatigue mechanism is driven by stress concentrators, which are a geometric discontinuity on or in a component increasing the stress near that discontinuity. These are for instance corrosion pits, thread roots, slip cuts or internal upsets. [9]
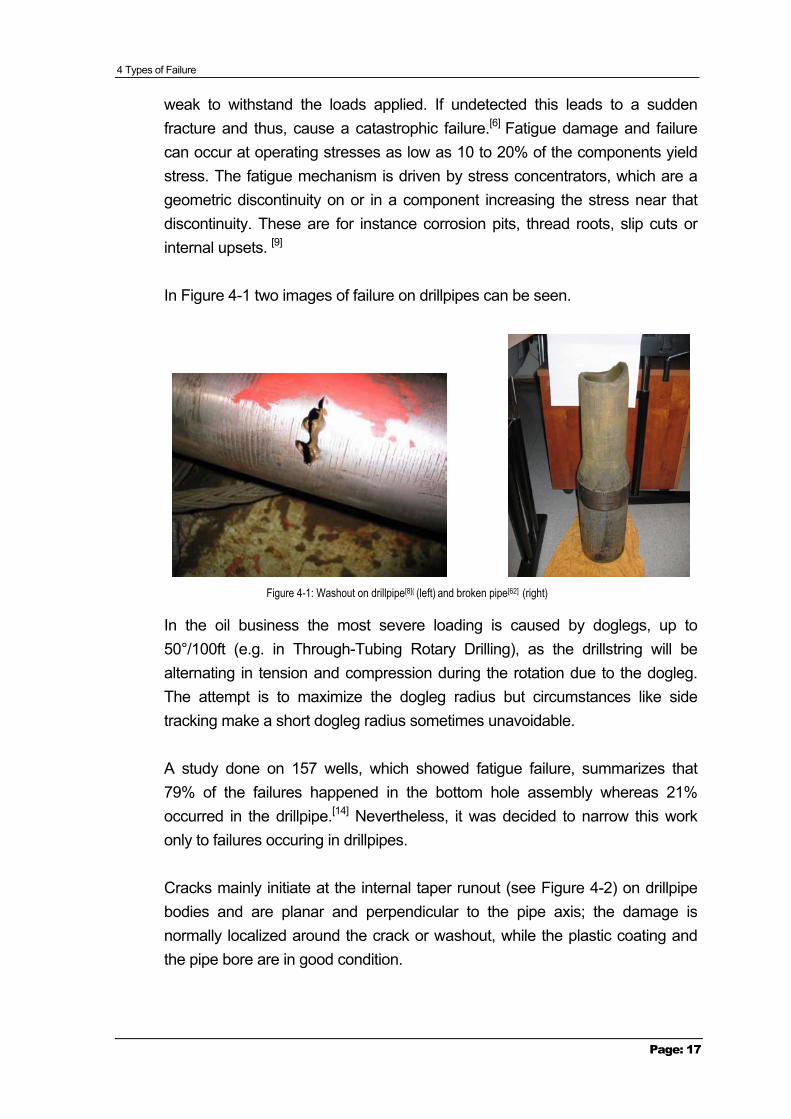
In Figure 4-1 two images of failure on drillpipes can be seen.
Figure 4-1: Washout on drillpipe[8]( (left) and broken pipe[62] (right)
In the oil business the most severe loading is caused by doglegs, up to 50°/100ft (e.g. in Through-Tubing Rotary Drilling), as the drillstring will be alternating in tension and compression during the rotation due to the dogleg. The attempt is to maximize the dogleg radius but circumstances like side tracking make a short dogleg radius sometimes unavoidable.
A study done on 157 wells, which showed fatigue failure, summarizes that 79% of the failures happened in the bottom hole assembly whereas 21% occurred in the drillpipe.[14] Nevertheless, it was decided to narrow this work only to failures occuring in drillpipes.
Cracks mainly initiate at the internal taper runout (see Figure 4-2) on drillpipe bodies and are planar and perpendicular to the pipe axis; the damage is normally localized around the crack or washout, while the plastic coating and the pipe bore are in good condition.
4 Types of Failure
Page: 18
Figure 4-2: Most likely position for failure to occur on the pipe body[14]
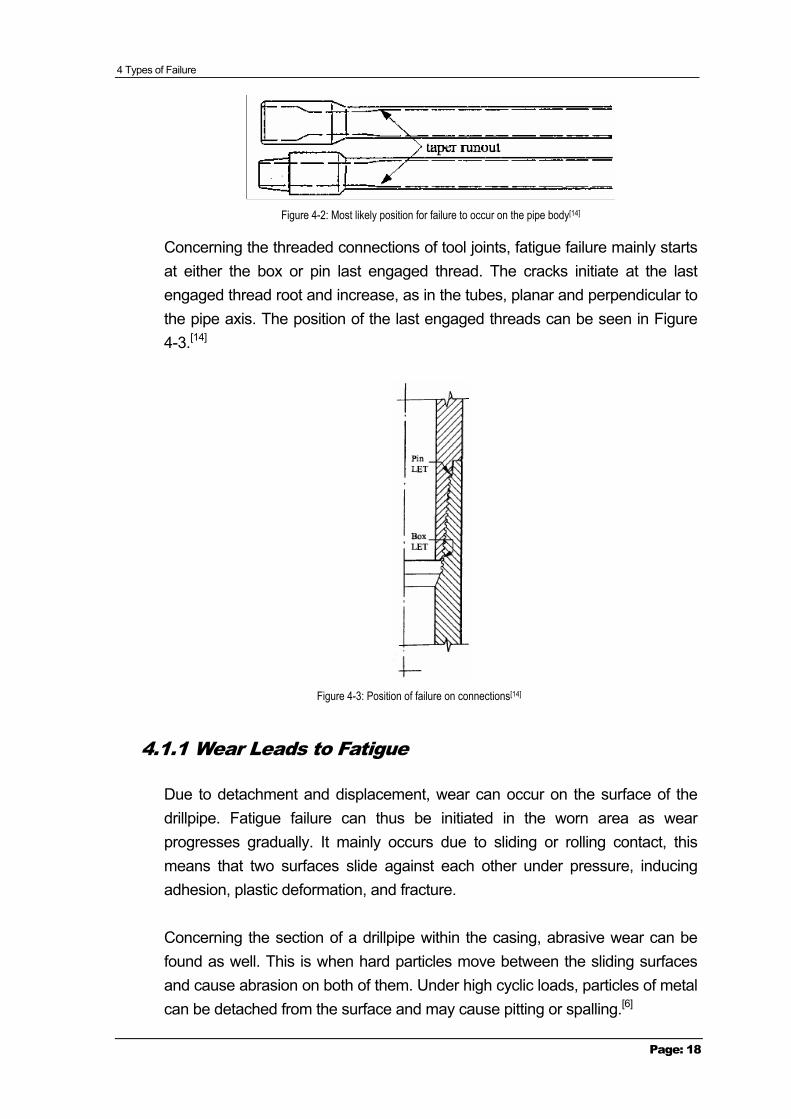
Concerning the threaded connections of tool joints, fatigue failure mainly starts at either the box or pin last engaged thread. The cracks initiate at the last engaged thread root and increase, as in the tubes, planar and perpendicular to the pipe axis. The position of the last engaged threads can be seen in Figure 4-3.[14]
Figure 4-3: Position of failure on connections[14]
4.1.1 Wear Leads to Fatigue
Due to detachment and displacement, wear can occur on the surface of the drillpipe. Fatigue failure can thus be initiated in the worn area as wear progresses gradually. It mainly occurs due to sliding or rolling contact, this means that two surfaces slide against each other under pressure, inducing adhesion, plastic deformation, and fracture.
Concerning the section of a drillpipe within the casing, abrasive wear can be found as well. This is when hard particles move between the sliding surfaces and cause abrasion on both of them. Under high cyclic loads, particles of metal can be detached from the surface and may cause pitting or spalling.[6]
4 Types of Failure
Page: 19
4.1.2 Slip Marks
Slips and tongs create marks on the tool joint and on the pipe body, which generate high stress concentrations that again reduce the strength of the pipe. Roughly one third of drillpipe fatigue failures can be associated to slip cuts.[9] Especially vulnerable to failure are small diameter pipes, nevertheless, the effect of slip marks on the pipe can be reduced by using the right gripping system.
A number of dies of a gripping system are carrying the whole weight of the drillstring, dividing the load between each other and causing radial penetration into the surface of the pipe. Therefore it seems obviously that an increase in the number of dies on the slip of a gripping system would decrease the damage on the pipe surface, even though the contact area increases.[15]
An even more severe damage is achieved if the pipe for some reason is rotated in the slip as this will create marks perpendicular to the pipe axis, which will lead to rapid crack propagation due to externally applied tension compared to marks parallel to the axis, which will propagate on a slower level.
4.2 Overloading Failure
If the loads applied on drillpipes exceed their capacity to carry loads, an overloading takes place, which can lead to failure fast, as for example torsion failure, tension failure or failure resulting from combined loads.
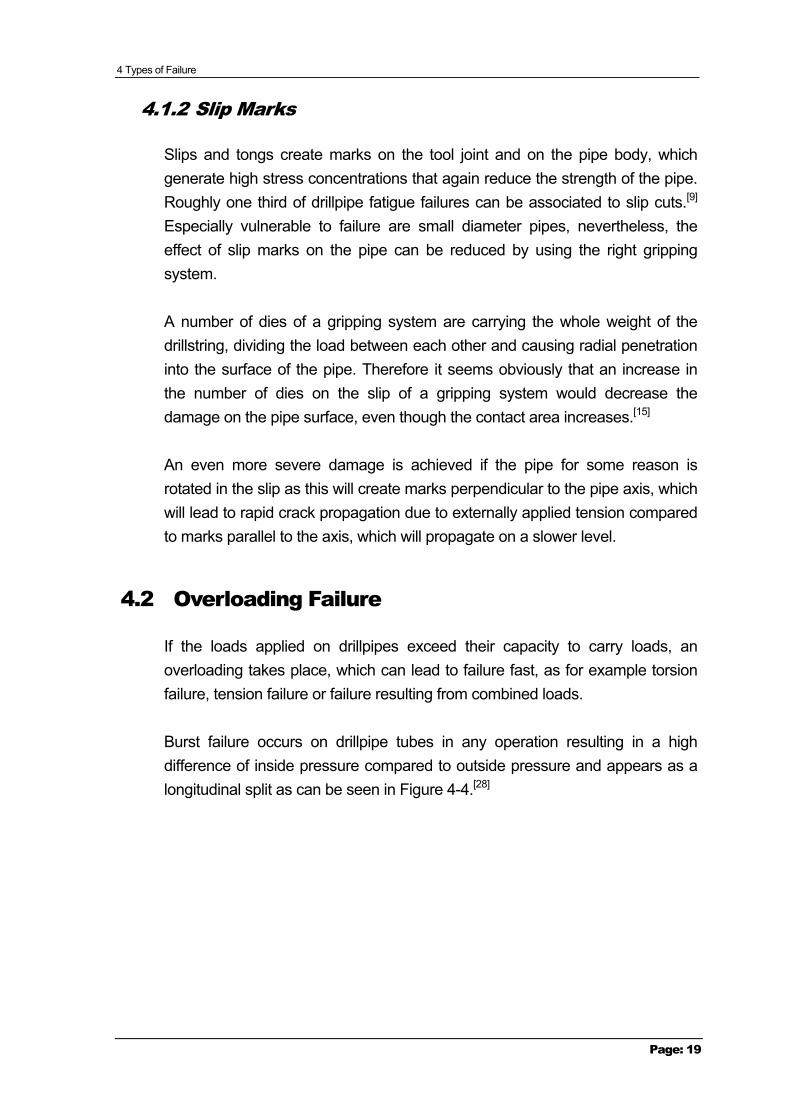
Burst failure occurs on drillpipe tubes in any operation resulting in a high difference of inside pressure compared to outside pressure and appears as a longitudinal split as can be seen in Figure 4-4.[28]
4 Types of Failure
Page: 20
Figure 4-4: Burst failure[28]
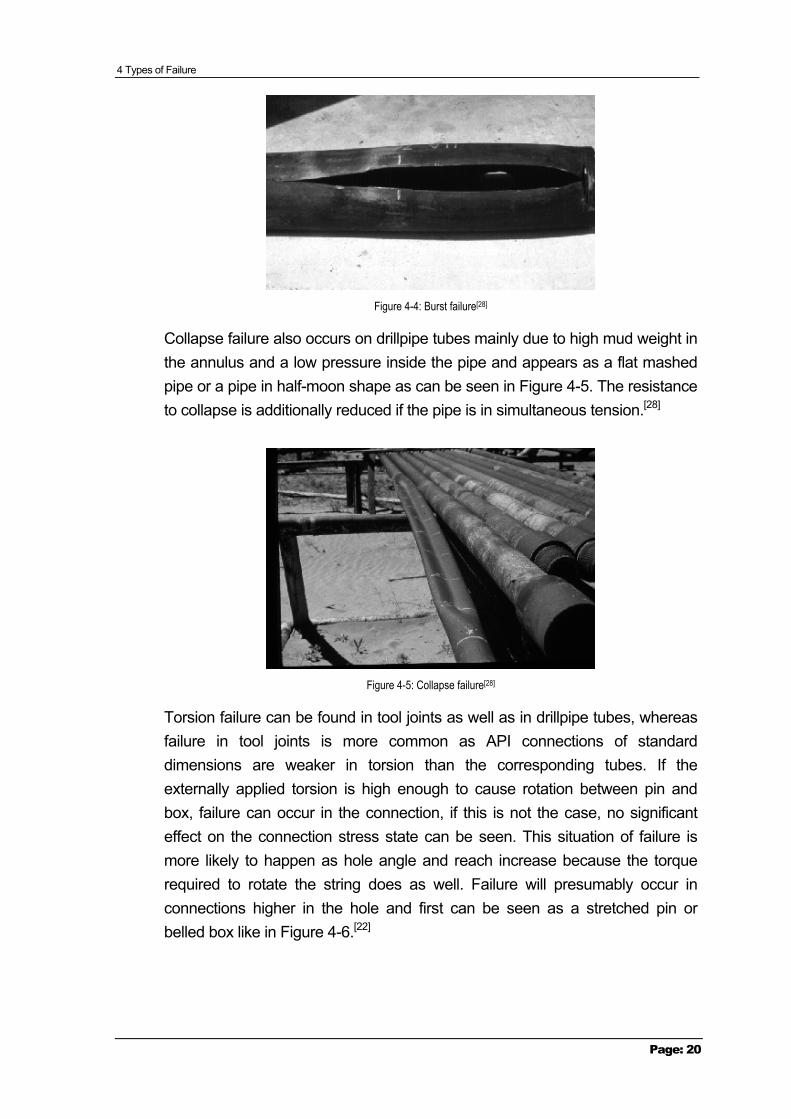
Collapse failure also occurs on drillpipe tubes mainly due to high mud weight in the annulus and a low pressure inside the pipe and appears as a flat mashed pipe or a pipe in half-moon shape as can be seen in Figure 4-5. The resistance to collapse is additionally reduced if the pipe is in simultaneous tension.[28]
Figure 4-5: Collapse failure[28]
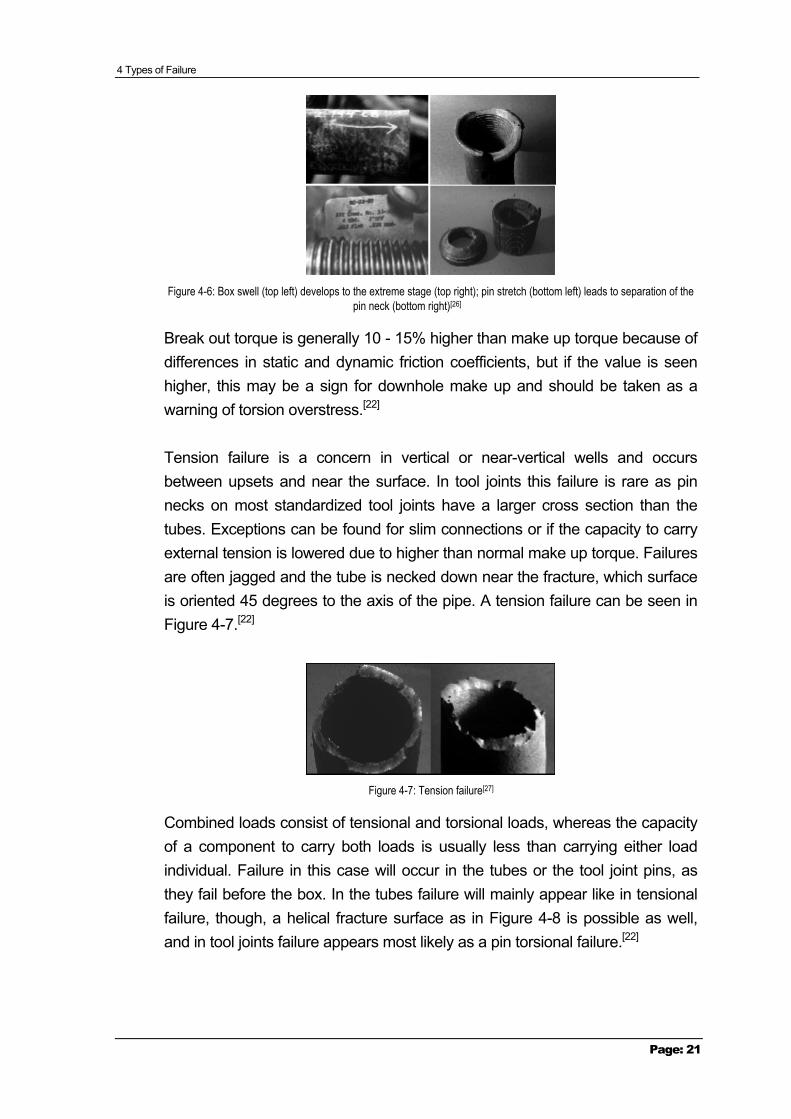
Torsion failure can be found in tool joints as well as in drillpipe tubes, whereas failure in tool joints is more common as API connections of standard dimensions are weaker in torsion than the corresponding tubes. If the externally applied torsion is high enough to cause rotation between pin and box, failure can occur in the connection, if this is not the case, no significant effect on the connection stress state can be seen. This situation of failure is more likely to happen as hole angle and reach increase because the torque required to rotate the string does as well. Failure will presumably occur in connections higher in the hole and first can be seen as a stretched pin or belled box like in Figure 4-6.[22]
4 Types of Failure
Page: 21
Figure 4-6: Box swell (top left) develops to the extreme stage (top right); pin stretch (bottom left) leads to separation of the
pin neck (bottom right)[26]
Break out torque is generally 10 - 15% higher than make up torque because of differences in static and dynamic friction coefficients, but if the value is seen higher, this may be a sign for downhole make up and should be taken as a warning of torsion overstress.[22]
Tension failure is a concern in vertical or near-vertical wells and occurs between upsets and near the surface. In tool joints this failure is rare as pin necks on most standardized tool joints have a larger cross section than the tubes. Exceptions can be found for slim connections or if the capacity to carry external tension is lowered due to higher than normal make up torque. Failures are often jagged and the tube is necked down near the fracture, which surface is oriented 45 degrees to the axis of the pipe. A tension failure can be seen in Figure 4-7.[22]
Figure 4-7: Tension failure[27]
Combined loads consist of tensional and torsional loads, whereas the capacity of a component to carry both loads is usually less than carrying either load individual. Failure in this case will occur in the tubes or the tool joint pins, as they fail before the box. In the tubes failure will mainly appear like in tensional failure, though, a helical fracture surface as in Figure 4-8 is possible as well, and in tool joints failure appears most likely as a pin torsional failure.[22]
4 Types of Failure
Page: 22
Figure 4-8: Combined load failure with helical shape fracture[29]
4.3 Corrosion Failure
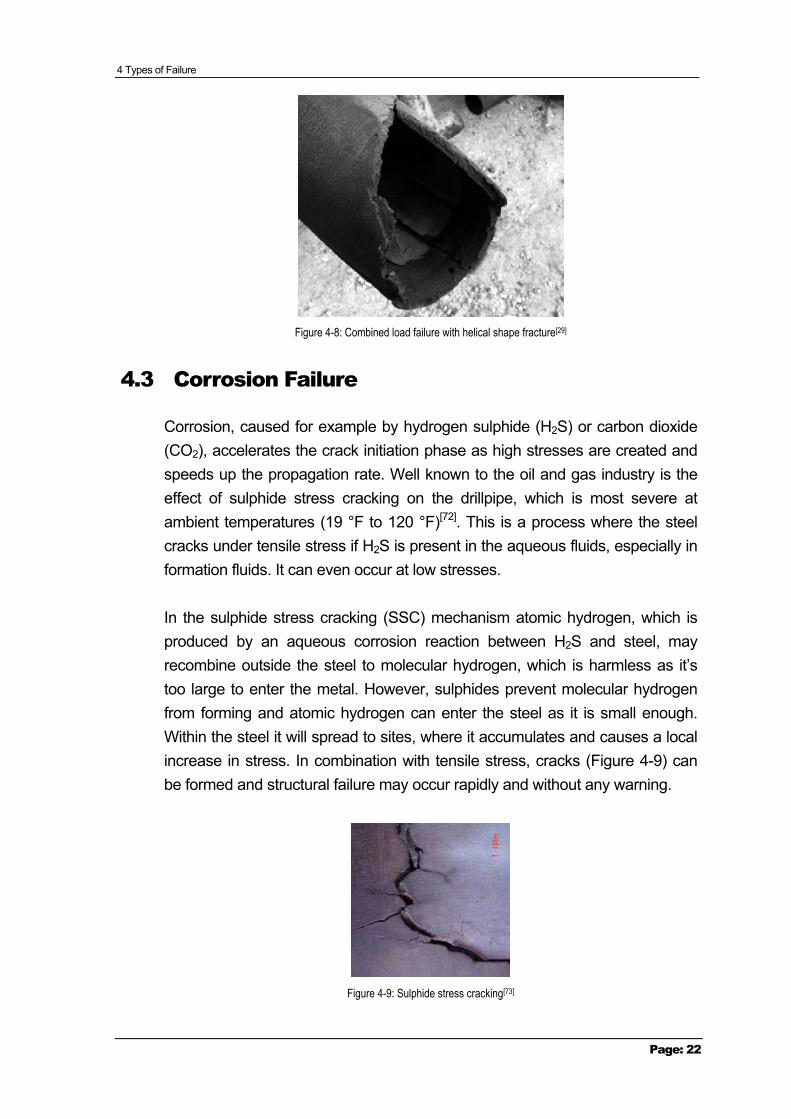
Corrosion, caused for example by hydrogen sulphide (H2S) or carbon dioxide (CO2), accelerates the crack initiation phase as high stresses are created and speeds up the propagation rate. Well known to the oil and gas industry is the effect of sulphide stress cracking on the drillpipe, which is most severe at ambient temperatures (19 °F to 120 °F)[72]. This is a process where the steel cracks under tensile stress if H2S is present in the aqueous fluids, especially in formation fluids. It can even occur at low stresses.
In the sulphide stress cracking (SSC) mechanism atomic hydrogen, which is produced by an aqueous corrosion reaction between H2S and steel, may recombine outside the steel to molecular hydrogen, which is harmless as it’s too large to enter the metal. However, sulphides prevent molecular hydrogen from forming and atomic hydrogen can enter the steel as it is small enough. Within the steel it will spread to sites, where it accumulates and causes a local increase in stress. In combination with tensile stress, cracks (Figure 4-9) can be formed and structural failure may occur rapidly and without any warning.
Figure 4-9: Sulphide stress cracking[73]
4 Types of Failure
Page: 23
For preventing SSC three possibilities are given: First of all the drilling program should be designed in a way to avoid H2S entering the wellbore. Scavengers can be used to remove the amounts of H2S that are unavoidable. Secondly, the mud pH level should be kept at an elevated level, higher than 10.5, and corrosion inhibitors should be used to retard the reaction producing atomic hydrogen. Thirdly, the least susceptible drill string material should be used. Thus, the softest, lowest strength materials that are permitted by operating loads, should be used if H2S is expected.[9] In drilling operations where H2S is expected, Statoil uses a drillpipe, the XDTM-105 manufactured by Grant Prideco, with 105 kpsi minimum yield strength, which is resistant against H2S.[62],[2]
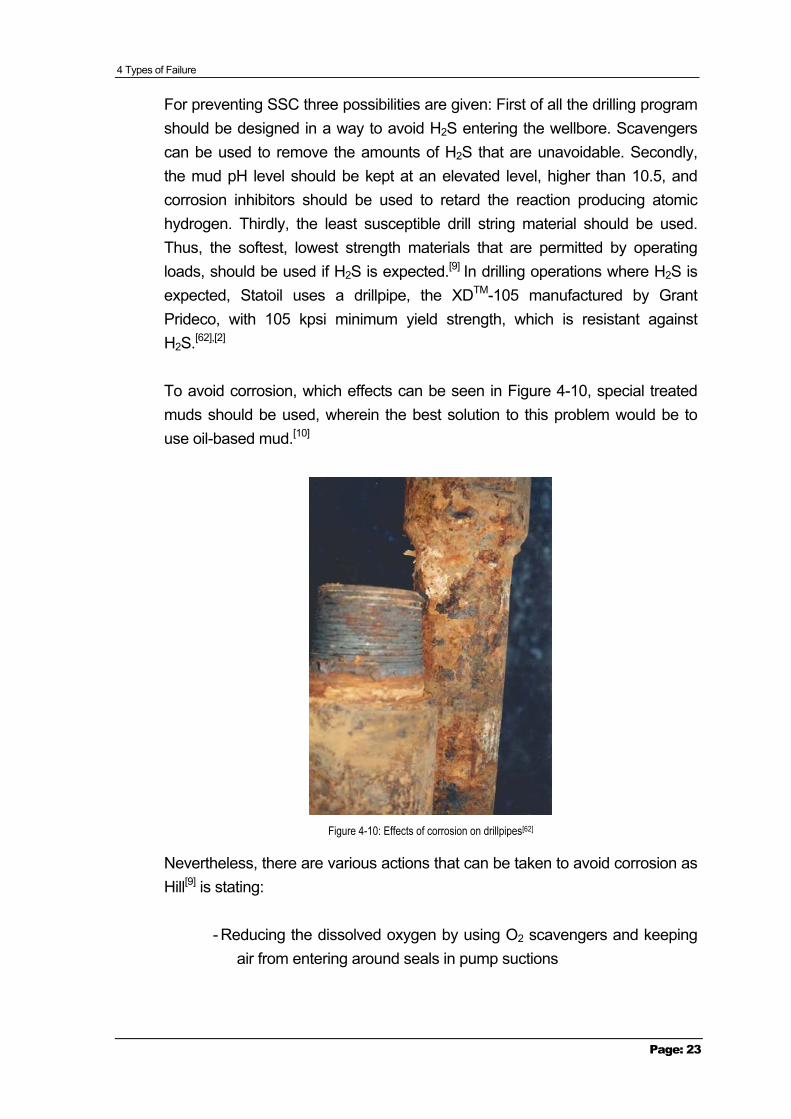
To avoid corrosion, which effects can be seen in Figure 4-10, special treated muds should be used, wherein the best solution to this problem would be to use oil-based mud.[10]
Figure 4-10: Effects of corrosion on drillpipes[62]
Nevertheless, there are various actions that can be taken to avoid corrosion as Hill[9] is stating:
- Reducing the dissolved oxygen by using O2 scavengers and keeping air from entering around seals in pump suctions
4 Types of Failure
Page: 24
- Increasing the pH value for controlling corrosion as the solubility of gases like O2 and CO2 is reduced.
- Reduce the level of CO2 and chlorides for elongation of the drillstring fatigue life
- Plastic coating can be used as an barrier even if it’s only found on the inside of the pipe and therefore does not help against corrosion on the outside of the pipe.
Another reason leading to corrosion is the storage of the pipe. Depending on the location and situation where the pipe is kept, severe, corrosive damage can be found. Most corrosion is generated offshore, if pipes are kept too long and if they are in seldom use, like for example the 2 7/8” pipe, which is often used for cleaning operations. The pipes necessary for the actual drilling process, which are about 16,000 ft to 26,000 ft, are kept on the rig and are stored in a vertical position in the derrick. The pins and boxes are doped for preservation. For inspection, possible recut of the threads and new hardbanding the pipes are sent onshore. Service companies performing drilling have a stock of pipes onshore, which are stored outdoor, the threads doped and covered with protectors. [62]
4.4 Elevated Temperature Failure
The literature[11],[12],[13] shows that the effect of drillstring failures due to downhole frictional heating is getting more and more common. Therefore some information about this type of failure will be included in the work.
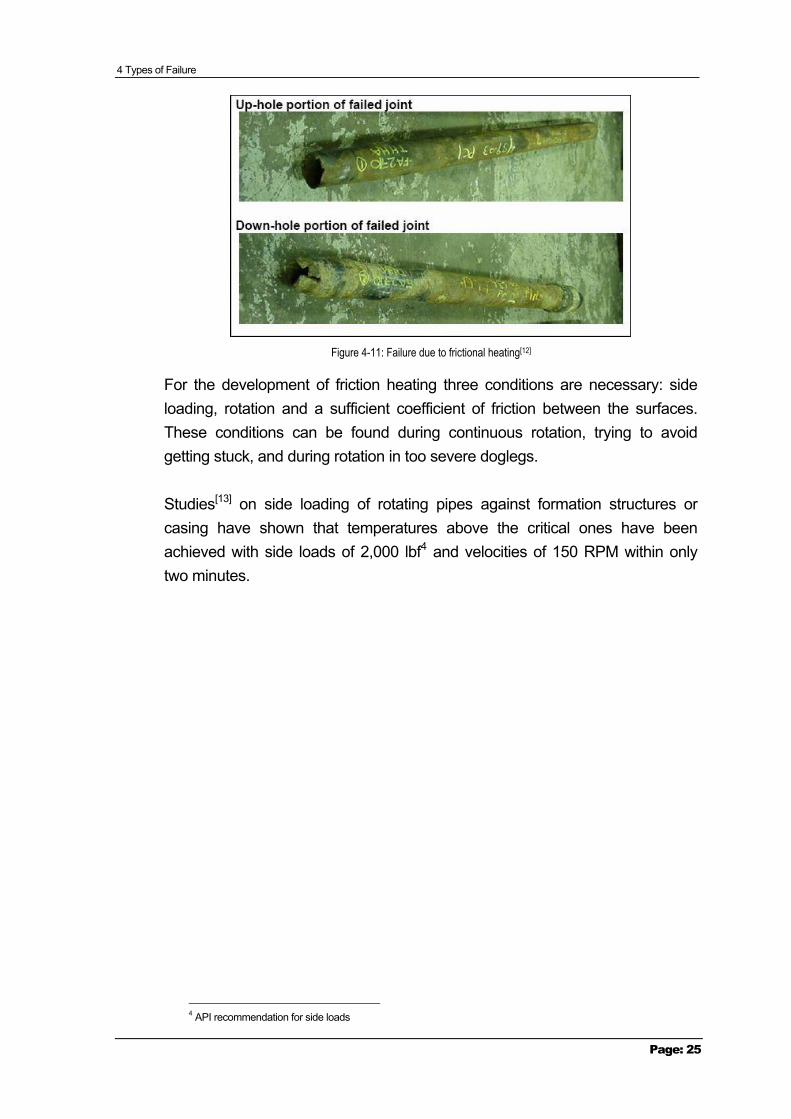
To free a stuck pipe the drillstring is often tried to be rotated and pulled at the same time. As a result the pipe is heated above the critical temperature due to friction and undergoes a rapid decrease in tensile strength resulting in failure under a tension loading which is below the rated capacity of the pipe. Another failure mode is mentioned where the steel has been heated above the critical temperature and then was rapidly cooled by the drilling fluid resulting in brittle, low toughness steel. The consequences of the frictional heating can be seen in Figure 4-11.
4 Types of Failure
Page: 25
Figure 4-11: Failure due to frictional heating[12]
For the development of friction heating three conditions are necessary: side loading, rotation and a sufficient coefficient of friction between the surfaces. These conditions can be found during continuous rotation, trying to avoid getting stuck, and during rotation in too severe doglegs.
Studies[13] on side loading of rotating pipes against formation structures or casing have shown that temperatures above the critical ones have been achieved with side loads of 2,000 lbf4 and velocities of 150 RPM within only two minutes.
4 API recommendation for side loads
5 Drillpipes and Challenges
Page: 26
5 Drillpipes and Challenges
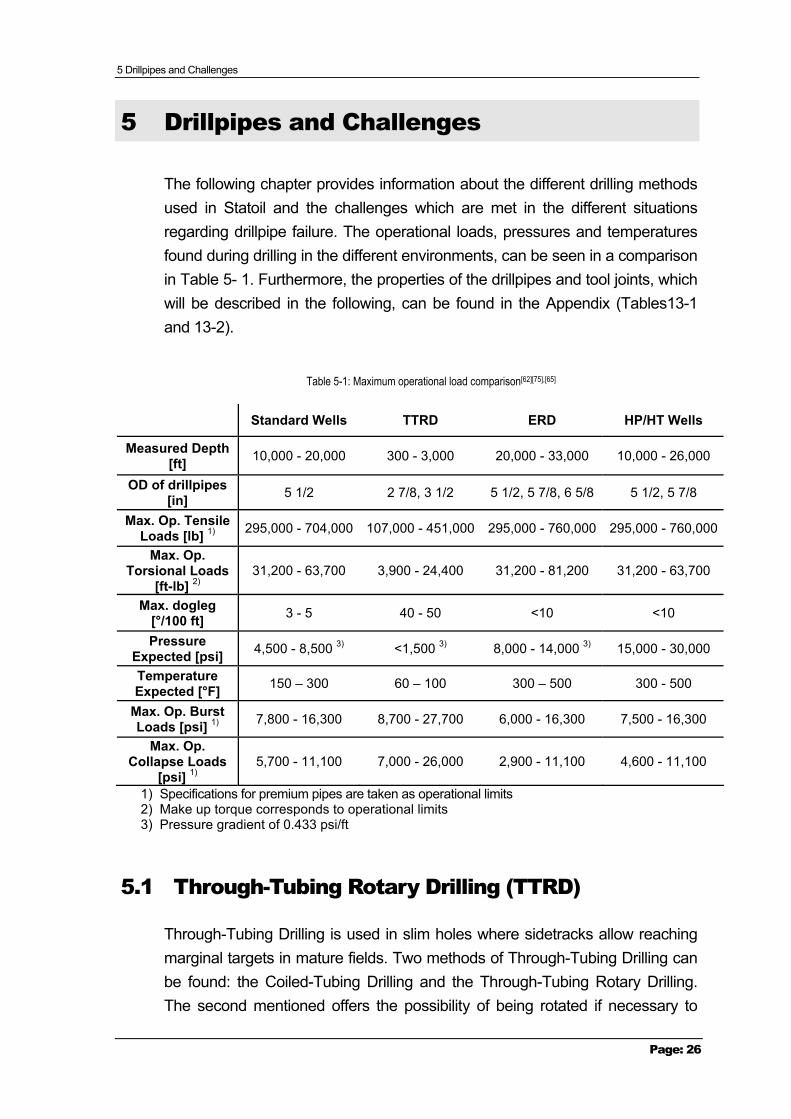
The following chapter provides information about the different drilling methods used in Statoil and the challenges which are met in the different situations regarding drillpipe failure. The operational loads, pressures and temperatures found during drilling in the different environments, can be seen in a comparison in Table 5- 1. Furthermore, the properties of the drillpipes and tool joints, which will be described in the following, can be found in the Appendix (Tables13-1 and 13-2).
Table 5-1: Maximum operational load comparison[62][75],[65]
Standard Wells TTRD ERD HP/HT Wells
Measured Depth [ft] 10,000 - 20,000 300 - 3,000 20,000 - 33,000 10,000 - 26,000
OD of drillpipes [in] 5 1/2 2 7/8, 3 1/2 5 1/2, 5 7/8, 6 5/8 5 1/2, 5 7/8
Max. Op. Tensile Loads [lb] 1) 295,000 - 704,000 107,000 - 451,000 295,000 - 760,000 295,000 - 760,000
Max. Op. Torsional Loads
[ft-lb] 2) 31,200 - 63,700 3,900 - 24,400 31,200 - 81,200 31,200 - 63,700
Max. dogleg [°/100 ft] 3 - 5 40 - 50 <10 <10
Pressure Expected [psi] 4,500 - 8,500 3) <1,500 3) 8,000 - 14,000 3) 15,000 - 30,000
Temperature Expected [°F] 150 – 300 60 – 100 300 – 500 300 - 500
Max. Op. Burst Loads [psi] 1) 7,800 - 16,300 8,700 - 27,700 6,000 - 16,300 7,500 - 16,300
Max. Op. Collapse Loads
[psi] 1) 5,700 - 11,100 7,000 - 26,000 2,900 - 11,100 4,600 - 11,100
1) Specifications for premium pipes are taken as operational limits 2) Make up torque corresponds to operational limits 3) Pressure gradient of 0.433 psi/ft
5.1 Through-Tubing Rotary Drilling (TTRD)
Through-Tubing Drilling is used in slim holes where sidetracks allow reaching marginal targets in mature fields. Two methods of Through-Tubing Drilling can be found: the Coiled-Tubing Drilling and the Through-Tubing Rotary Drilling. The second mentioned offers the possibility of being rotated if necessary to
5 Drillpipes and Challenges
Page: 27
reduce differential sticking and to improve the cuttings return, furthermore, it doesn’t need special equipment as Coiled-Tubing Drilling does.
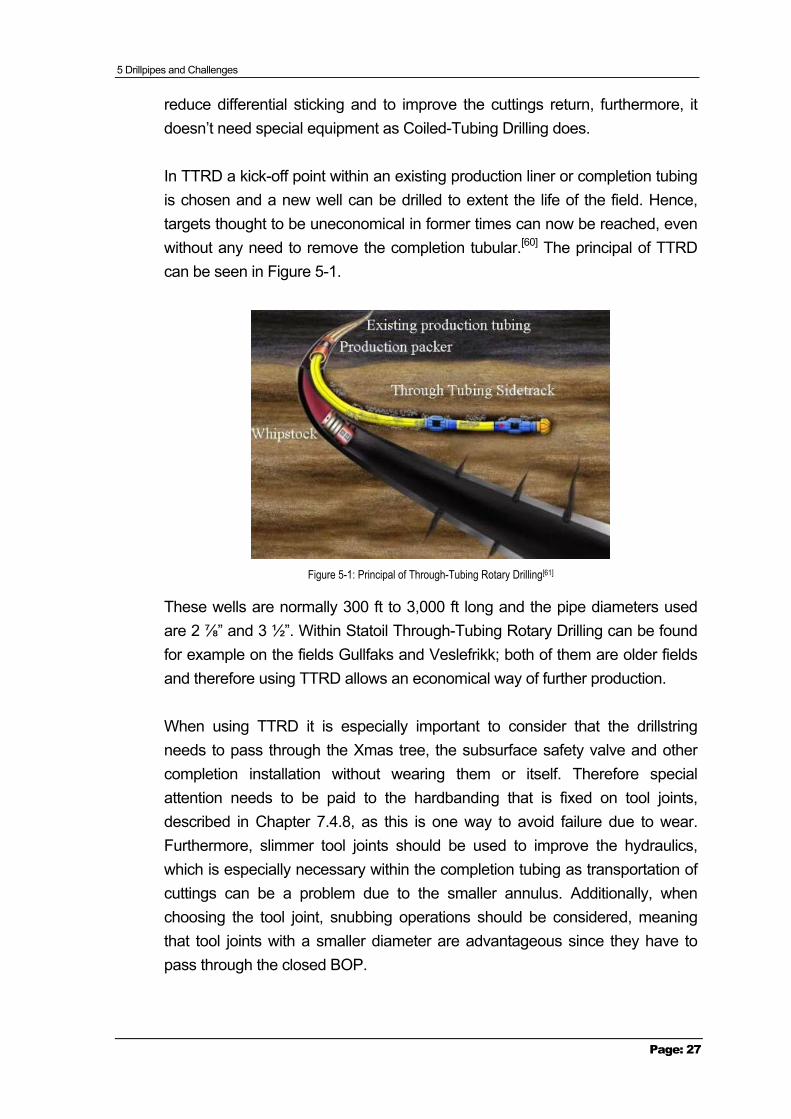
In TTRD a kick-off point within an existing production liner or completion tubing is chosen and a new well can be drilled to extent the life of the field. Hence, targets thought to be uneconomical in former times can now be reached, even without any need to remove the completion tubular.[60] The principal of TTRD can be seen in Figure 5-1.
Figure 5-1: Principal of Through-Tubing Rotary Drilling[61]
These wells are normally 300 ft to 3,000 ft long and the pipe diameters used are 2 ⅞” and 3 ½”. Within Statoil Through-Tubing Rotary Drilling can be found for example on the fields Gullfaks and Veslefrikk; both of them are older fields and therefore using TTRD allows an economical way of further production.
When using TTRD it is especially important to consider that the drillstring needs to pass through the Xmas tree, the subsurface safety valve and other completion installation without wearing them or itself. Therefore special attention needs to be paid to the hardbanding that is fixed on tool joints, described in Chapter 7.4.8, as this is one way to avoid failure due to wear. Furthermore, slimmer tool joints should be used to improve the hydraulics, which is especially necessary within the completion tubing as transportation of cuttings can be a problem due to the smaller annulus. Additionally, when choosing the tool joint, snubbing operations should be considered, meaning that tool joints with a smaller diameter are advantageous since they have to pass through the closed BOP.
5 Drillpipes and Challenges
Page: 28
In TTRD high doglegs of up to 40° to 50° per 100 ft5 can be expected, leading to severe stresses on the pipe especially if the string is rotated, although the pipe is normally slided into the borehole if the angle is high. Nevertheless, both methods can lead to failure and thus, additional stress raisers like for example caused by slips should be avoided. The correct use of slips is especially important in TTRD since the pipe diameter is smaller than normally in drilling operations. Therefore the used slips are often too large and cannot grip the string effectively thereby causing marks, which then can act as stress raisers and accelerate the propagation of cracks. Furthermore, it needs to be taken into account that during rotary drilling operations the drilling torque has to be smaller than the make up torque to avoid downhole make up as described in Chapter 7.2.3.[62]
5.2 Standard Wells
Standard wells are considered to have a length between 10,000 ft and 20,000 ft without any exceptional challenges, like high doglegs, high torque and tension or hydraulic concerns. Therefore it should be concentrated, for example, on choosing the right inspection intervals and trying to prevent from wear by using a high quality hardbanding. Furthermore, wrong storing or handling of pipes can also lead to wear and thus, should be avoided.[62]
A lot of general problems, like some of them mentioned above, can be taken care of when drilling these standard wells, maybe even allowing to develop some kind of scheme showing how to avoid them. This could help to deal easier with challenges when drilling in another environment as the crew already knows how to handle the general factors influencing failure.
These standard wells, drilled with a 5 ½” drillpipe can be found within Statoil for example on the Veslefrikk, the Gullfaks or the Statfjord field.
5.3 Extended Reach Drilling (ERD)
Extended reach drilling makes it possible to drill into economical targets by reducing the number of rig site constructions like offshore platforms or artificial islands and thereby decreasing the total costs of the field development.
5 A maximum dogleg of 50°/100ft can be drilled with a 2 ⅞” drillpipe, whereas a 3 ½” drillpipe can be used for
5 Drillpipes and Challenges
Page: 29
Besides that, ERD also allows to exploit reservoirs in environmental sensitive areas, where it is not allowed to build a rig site. For ERD the wellbore is kicked off from the vertical and then built with an inclination to the target, where it is tilted again to the near horizontal and then drilled into the reservoir. An extended reach well has a stepout ratio, which is the horizontal displacement over the true vertical depth at total depth, of one or more.[63] This is according to a length of 20,000 ft to 33,000 ft.
Fields within Statoil, where extended reach wells have been drilled, are, for instance, Visund, Gullfaks or Statfjord, where drillpipes with a diameter of 5 ½”, 5 ⅞” and 6 ⅝” are used.[62] Concerning the diameter it needs to be mentioned that the 5 ⅞” pipe has often replaced the other two sizes due to problems experienced with these. The 5 ½” pipe shows hydraulic problems in long 12 ¼” or larger hole sections because of the high pressure losses. This is leading to an unsatisfying removal of the cuttings and thus, to slower penetration rates and higher probability of differential sticking. The 6 ⅝” pipe has actually no problems with the hydraulics but therefor this size is difficult to handle as it requires a lot of rig-handling equipment modifications. Furthermore, the larger pipe diameter results in higher torques, which are necessary to rotate the drillstring. Additionally, this pipe size requires lots of space on the rig, which is especially a disadvantage on offshore platforms, where space is valuable.[64] Resulting from these problems a drillpipe with 5 ⅞” was designed and seems to be the better choice when drilling in the long sections of extended reach wells.
Concerning the distances in ERD good hydraulics are essential for the success of the project and hence, be one of the challenges. It is difficult to keep the fluid in motion when drilling horizontal sections. This can be improved by rotating the string, leading, however, to stresses on the pipe due to the doglegs, which can end in washouts and twist offs.
Further challenges in drilling extended reach wells are the required high torque and high tension. For seeing the bit rotating, if the well is up to 33,000 ft deep, high torque is necessary, which reaches its highest level at the top region, thus, may causing failures. To reduce the necessary torque for rotating the bit the friction needs to be reduced, which can be achieved by using the right drilling fluid and additives, attempting a good hole cleaning and considering the
doglegs up to 25°/100ft[62]
5 Drillpipes and Challenges
Page: 30
surface roughness of the drillpipe and casing. The friction can be decreased by using good quality hardbanding as the surface gets polished during operation and besides that, it again helps reducing the wear. On pipes being in use for ERD no marks and scratches should be generated as this could significantly reduce their lives; a danger especially in these long wells as the costs in the case of a twist off can be tremendous. Thus, only new or short used drillpipes without any surface damage should be chosen when drilling long reach targets.
5.4 HP/HT Wells
High pressure-high temperature (HP/HT) reservoirs are traditionally defined as exceeding a pressure of 10,000 psi and a temperature of 300 °F. This original definition of HP/HT situations was first given by the Department of Trade Industry for the United Kingdom continental shelf. The field of activity has then been pushed to 15,000 psi and 400 °F and is nowadays even further pushed to 20,000-30,000 psi and temperatures of about 400-500 °F.[65]
HP/HT wells have a length of 10,000 ft to 26,000 ft and are drilled with 5 ½” and 5 ⅞” drillpipes. Within Statoil the fields Kvitebjørn, Kristin and Huldra are examples for HP/HT applications.[62]
Important to remember when drilling in these environments is to use gastight tool joints to seal against the expected high pressures. This can be done by either using an elastomeric seal or a metal-to-metal seal. Another question arising under these circumstances is the meaningfulness of using internal coating, which normally should protect the pipe from corrosion, at least at the inside, where it is more difficult recognizing cracks. In high temperature applications, though, this coating can be easily lost and the cost-benefit should be analysed. The length of HP/HT applications shows that similar challenges as for ERD occur and therefore high tension, high torque and so on should also be considered when drilling in these environments.
6 Prediction of Drillpipe Failures
Page: 31
6 Prediction of Drillpipe Failures
Failure and cracking because of fatigue have been experienced and analysed since the 1830’s and many incidents as airline crashes, railway accidents, and loss of ships and oilrigs have been induced by fatigue.[14] Since the early 1950’s drillpipe fatigue data has been collected to be able to develop fatigue models for creating limits within which there is a high probability to prevent from fatigue damage.
In the oil industry three major sources of drillpipe fatigue data, which are the basis of most cumulative fatigue damage models and studies, can be found. These are Bachman’s data set, which has been published in 1951, Morgan and Roblin’s data set published in 1969 and Grondin and Kulak’s data set published in 1991. The guidelines in API RP 7G[24] go back to the work of Hansford and Lubinski in 1964, which is based on the Bachman data.[1] Nevertheless, it needs to be considered that the above mentioned data sets are only valid for a special grade of drillpipes. Therefore most of the tests accomplished to get data for S-N curves are done on small samples of varying grades of structural steel, as this approach is basically applicable to drillpipes.
For a better understanding it also needs to be known that the fatigue fracture in an intact specimen occurs in three stages: In stage one a fatigue crack, caused during operation, is initiated and starts growing in a shear mode, in stage two the crack progresses faster as the stress concentration effect becomes greater until it reaches nearly its full length in a direction which is perpendicular to the principal stress and in stage three the final fracture occurs. Fatigue failure doesn’t give any warnings, therefore it is dangerous. It’s relatively simple to design against overloading modes, like burst or collapse, but variable loadings are difficult to predict.
As discussed in Chapter 4.1 the fracture initiation is associated with a microscopic plastic strain which is triggered off from macroscopic elastic strain that was intensified by small inclusions or defects. Under high cycle-low stress fatigue, which is the case in this analysis, the deformation occurs mainly elastically and the failure time under these circumstances is described as a function of the stress range.[14]
6 Prediction of Drillpipe Failures
Page: 32
6.1 Fatigue Testing
In order to identify the fatigue strength of a specimen, several identical samples need to be tested, as a large scatter in the test results can be expected. These tests need to be done to determine the S-N curve, which will be described more precisely later on. To get an impression how fatigue testing of drillpipe is done, three types of fatigue tests will be described in the following.
6.1.1 Cyclic Axial Tension Test
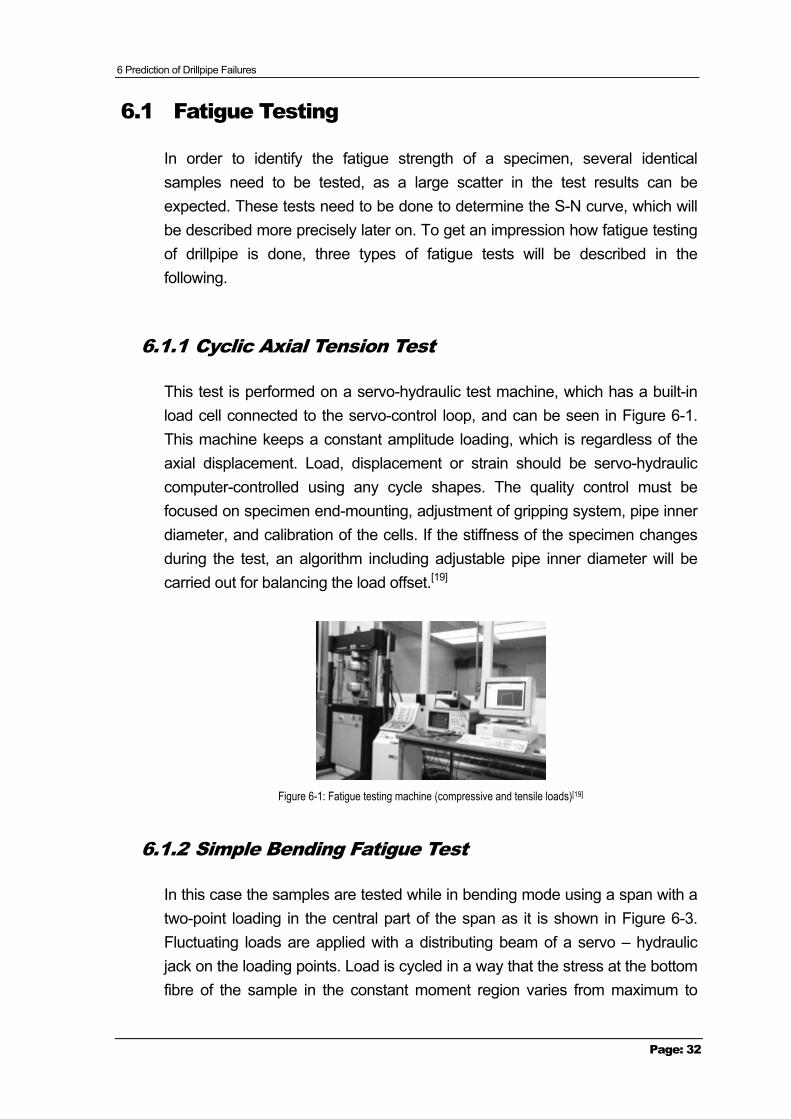
This test is performed on a servo-hydraulic test machine, which has a built-in load cell connected to the servo-control loop, and can be seen in Figure 6-1. This machine keeps a constant amplitude loading, which is regardless of the axial displacement. Load, displacement or strain should be servo-hydraulic computer-controlled using any cycle shapes. The quality control must be focused on specimen end-mounting, adjustment of gripping system, pipe inner diameter, and calibration of the cells. If the stiffness of the specimen changes during the test, an algorithm including adjustable pipe inner diameter will be carried out for balancing the load offset.[19]
Figure 6-1: Fatigue testing machine (compressive and tensile loads)[19]
6.1.2 Simple Bending Fatigue Test
In this case the samples are tested while in bending mode using a span with a two-point loading in the central part of the span as it is shown in Figure 6-3. Fluctuating loads are applied with a distributing beam of a servo – hydraulic jack on the loading points. Load is cycled in a way that the stress at the bottom fibre of the sample in the constant moment region varies from maximum to
6 Prediction of Drillpipe Failures
Page: 33
minimum tension. For simulating the weight of the drillstring at a dogleg, a superimposed static axial load can additionally be applied.[19]
6.1.3 Rotating Bending Test
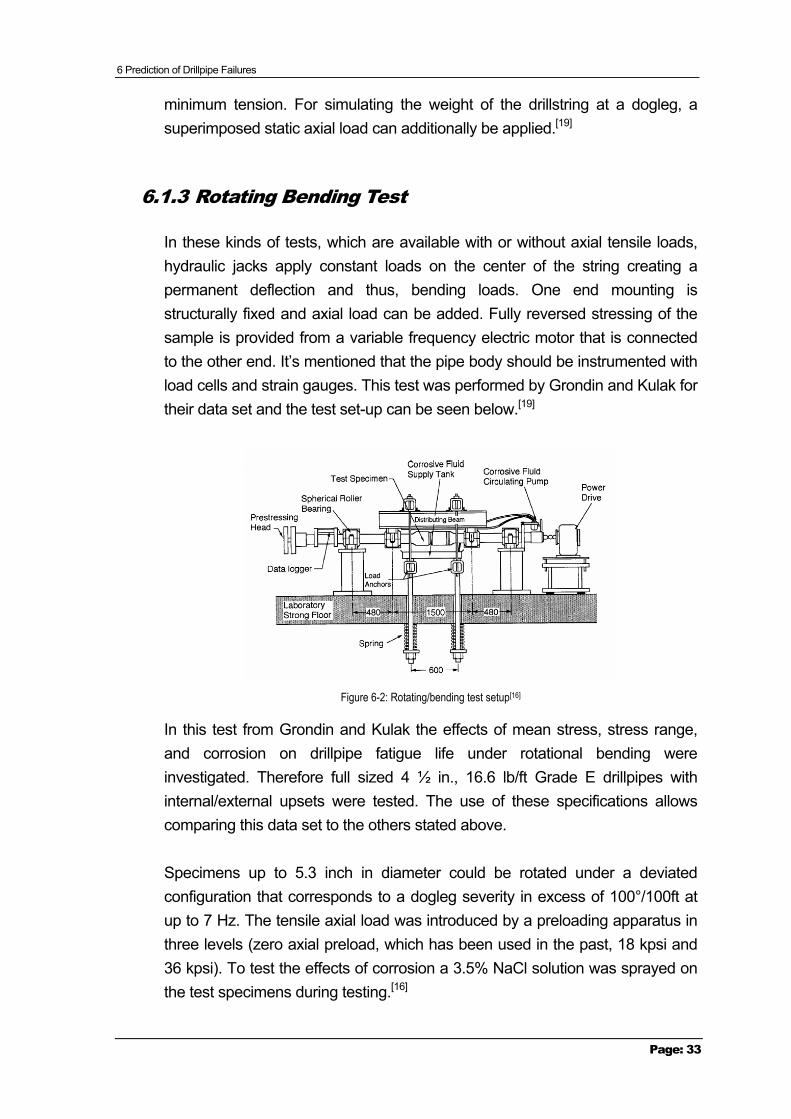
In these kinds of tests, which are available with or without axial tensile loads, hydraulic jacks apply constant loads on the center of the string creating a permanent deflection and thus, bending loads. One end mounting is structurally fixed and axial load can be added. Fully reversed stressing of the sample is provided from a variable frequency electric motor that is connected to the other end. It’s mentioned that the pipe body should be instrumented with load cells and strain gauges. This test was performed by Grondin and Kulak for their data set and the test set-up can be seen below.[19]
Figure 6-2: Rotating/bending test setup[16]
In this test from Grondin and Kulak the effects of mean stress, stress range, and corrosion on drillpipe fatigue life under rotational bending were investigated. Therefore full sized 4 ½ in., 16.6 lb/ft Grade E drillpipes with internal/external upsets were tested. The use of these specifications allows comparing this data set to the others stated above.
Specimens up to 5.3 inch in diameter could be rotated under a deviated configuration that corresponds to a dogleg severity in excess of 100°/100ft at up to 7 Hz. The tensile axial load was introduced by a preloading apparatus in three levels (zero axial preload, which has been used in the past, 18 kpsi and 36 kpsi). To test the effects of corrosion a 3.5% NaCl solution was sprayed on the test specimens during testing.[16]
6 Prediction of Drillpipe Failures
Page: 34
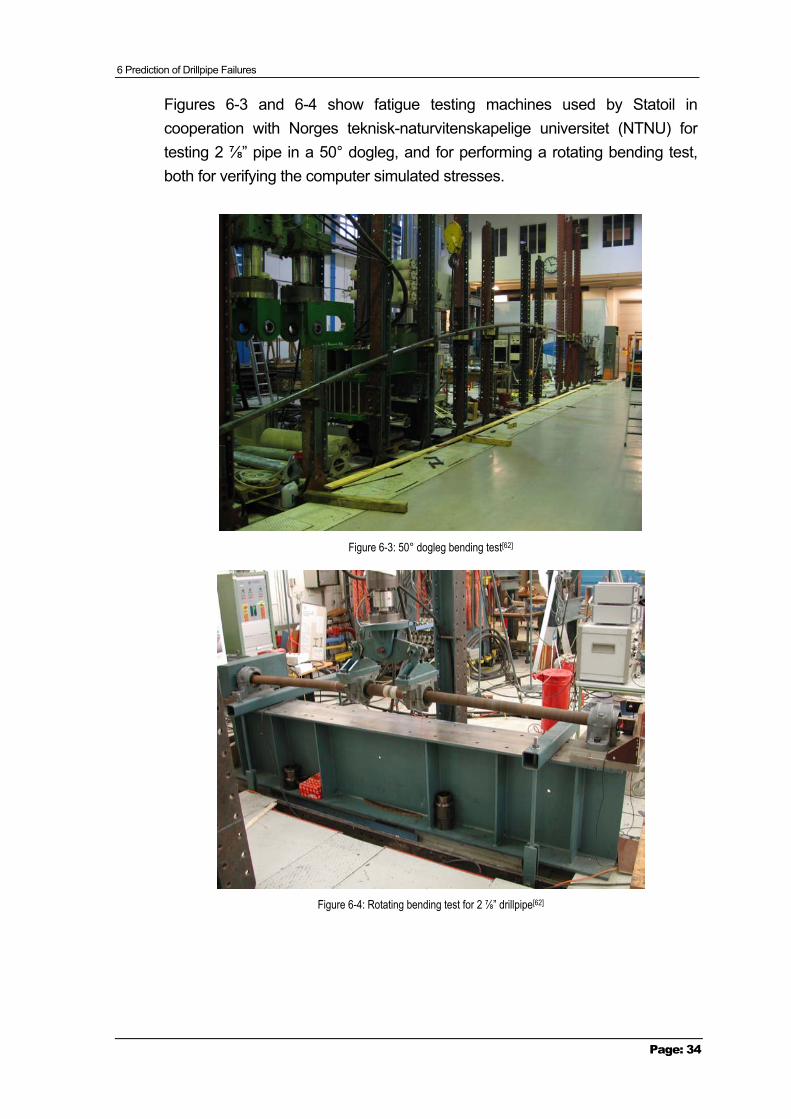
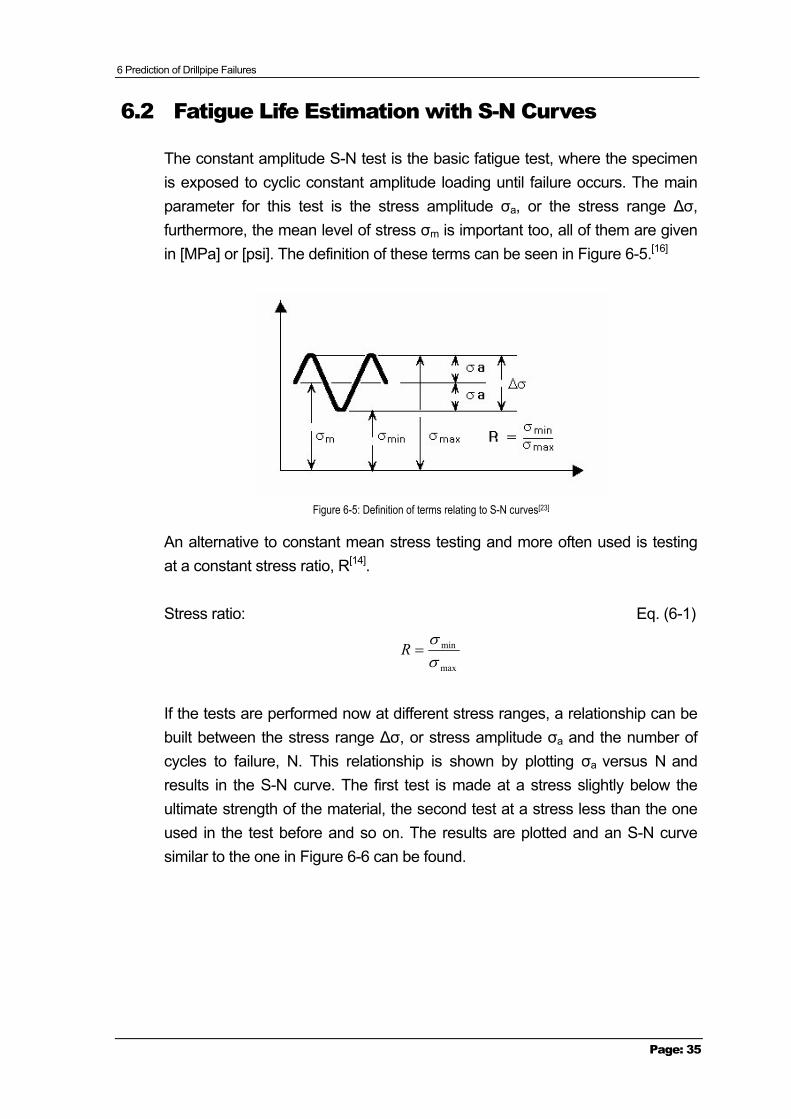
Figures 6-3 and 6-4 show fatigue testing machines used by Statoil in cooperation with Norges teknisk-naturvitenskapelige universitet (NTNU) for testing 2 ⅞” pipe in a 50° dogleg, and for performing a rotating bending test, both for verifying the computer simulated stresses.
Figure 6-3: 50° dogleg bending test[62]
Figure 6-4: Rotating bending test for 2 ⅞” drillpipe[62]
6 Prediction of Drillpipe Failures
Page: 35
6.2 Fatigue Life Estimation with S-N Curves
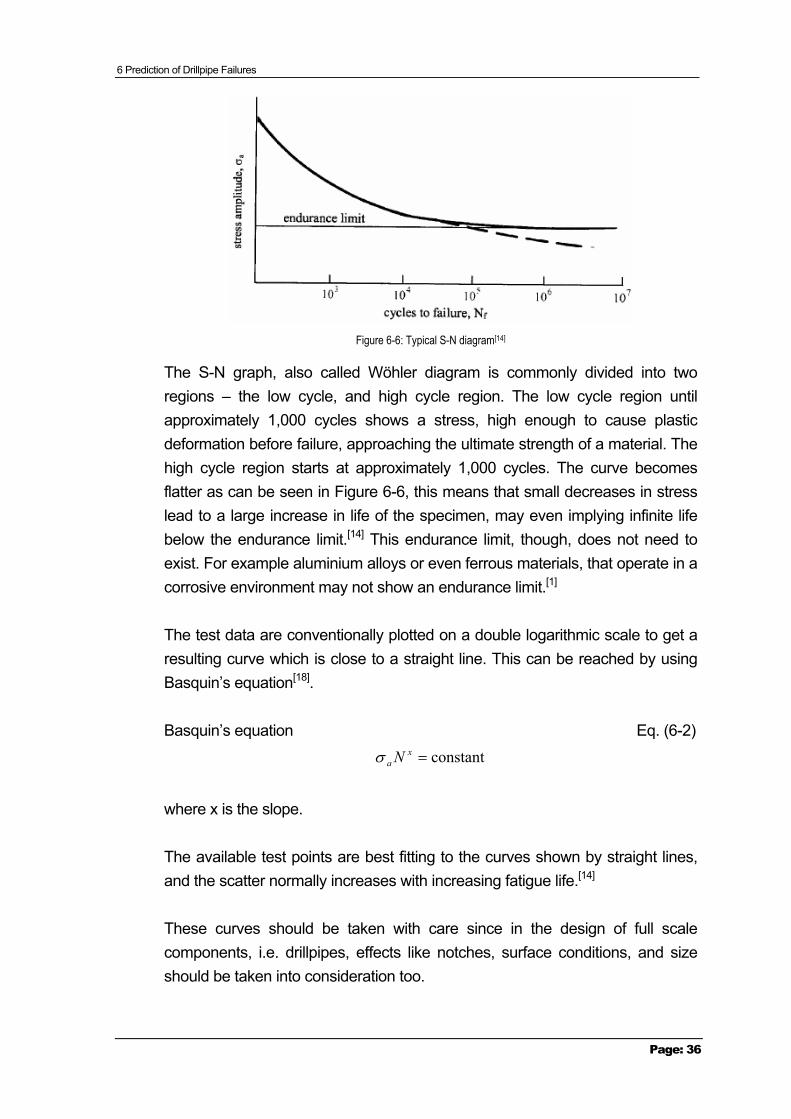
The constant amplitude S-N test is the basic fatigue test, where the specimen is exposed to cyclic constant amplitude loading until failure occurs. The main parameter for this test is the stress amplitude σa, or the stress range ∆σ, furthermore, the mean level of stress σm is important too, all of them are given in [MPa] or [psi]. The definition of these terms can be seen in Figure 6-5.[16]
Figure 6-5: Definition of terms relating to S-N curves[23]
An alternative to constant mean stress testing and more often used is testing at a constant stress ratio, R[14].
Stress ratio: Eq. (6-1)
max
min
σσ
=R
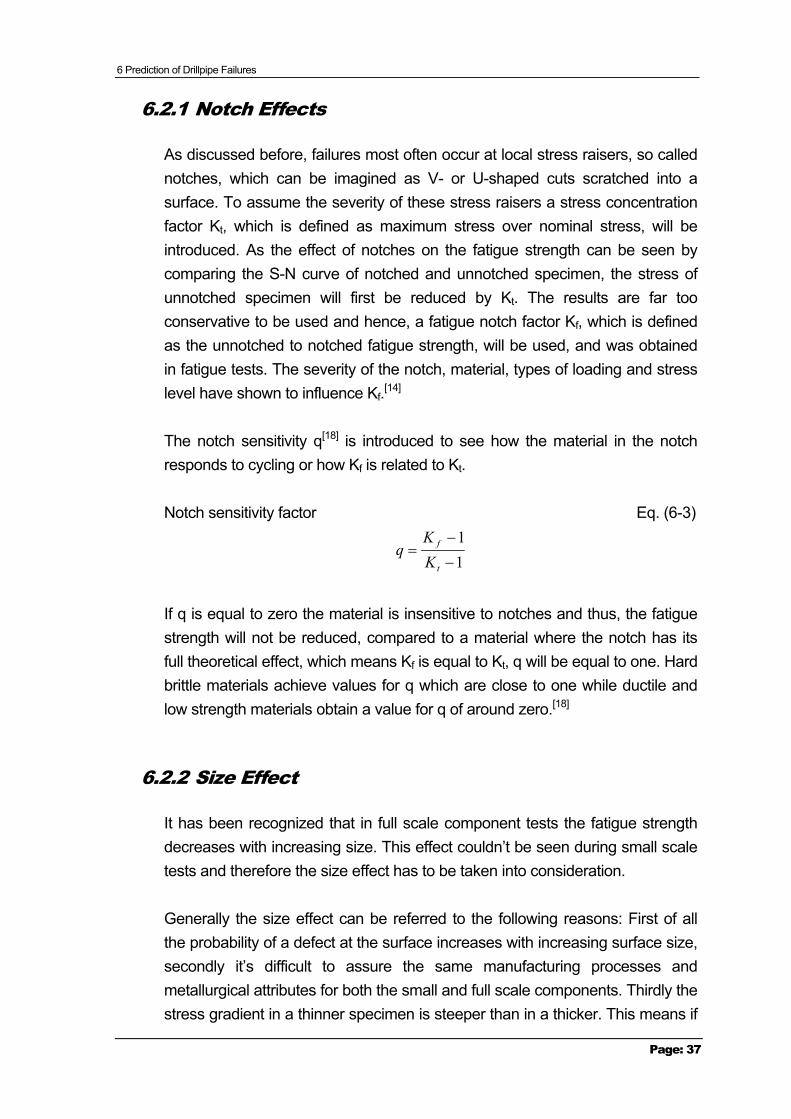
If the tests are performed now at different stress ranges, a relationship can be built between the stress range ∆σ, or stress amplitude σa and the number of cycles to failure, N. This relationship is shown by plotting σa versus N and results in the S-N curve. The first test is made at a stress slightly below the ultimate strength of the material, the second test at a stress less than the one used in the test before and so on. The results are plotted and an S-N curve similar to the one in Figure 6-6 can be found.
6 Prediction of Drillpipe Failures
Page: 36
Figure 6-6: Typical S-N diagram[14]
The S-N graph, also called Wöhler diagram is commonly divided into two regions – the low cycle, and high cycle region. The low cycle region until approximately 1,000 cycles shows a stress, high enough to cause plastic deformation before failure, approaching the ultimate strength of a material. The high cycle region starts at approximately 1,000 cycles. The curve becomes flatter as can be seen in Figure 6-6, this means that small decreases in stress lead to a large increase in life of the specimen, may even implying infinite life below the endurance limit.[14] This endurance limit, though, does not need to exist. For example aluminium alloys or even ferrous materials, that operate in a corrosive environment may not show an endurance limit.[1]
The test data are conventionally plotted on a double logarithmic scale to get a resulting curve which is close to a straight line. This can be reached by using Basquin’s equation[18].
Basquin’s equation Eq. (6-2) constant=xa Nσ
where x is the slope.
The available test points are best fitting to the curves shown by straight lines, and the scatter normally increases with increasing fatigue life.[14]
These curves should be taken with care since in the design of full scale components, i.e. drillpipes, effects like notches, surface conditions, and size should be taken into consideration too.
6 Prediction of Drillpipe Failures
Page: 37
6.2.1 Notch Effects
As discussed before, failures most often occur at local stress raisers, so called notches, which can be imagined as V- or U-shaped cuts scratched into a surface. To assume the severity of these stress raisers a stress concentration factor Kt, which is defined as maximum stress over nominal stress, will be introduced. As the effect of notches on the fatigue strength can be seen by comparing the S-N curve of notched and unnotched specimen, the stress of unnotched specimen will first be reduced by Kt. The results are far too conservative to be used and hence, a fatigue notch factor Kf, which is defined as the unnotched to notched fatigue strength, will be used, and was obtained in fatigue tests. The severity of the notch, material, types of loading and stress level have shown to influence Kf.[14]
The notch sensitivity q[18] is introduced to see how the material in the notch responds to cycling or how Kf is related to Kt.
Notch sensitivity factor Eq. (6-3)
11
−
−=
t
f
KK
q
If q is equal to zero the material is insensitive to notches and thus, the fatigue strength will not be reduced, compared to a material where the notch has its full theoretical effect, which means Kf is equal to Kt, q will be equal to one. Hard brittle materials achieve values for q which are close to one while ductile and low strength materials obtain a value for q of around zero.[18]
6.2.2 Size Effect
It has been recognized that in full scale component tests the fatigue strength decreases with increasing size. This effect couldn’t be seen during small scale tests and therefore the size effect has to be taken into consideration.
Generally the size effect can be referred to the following reasons: First of all the probability of a defect at the surface increases with increasing surface size, secondly it’s difficult to assure the same manufacturing processes and metallurgical attributes for both the small and full scale components. Thirdly the stress gradient in a thinner specimen is steeper than in a thicker. This means if
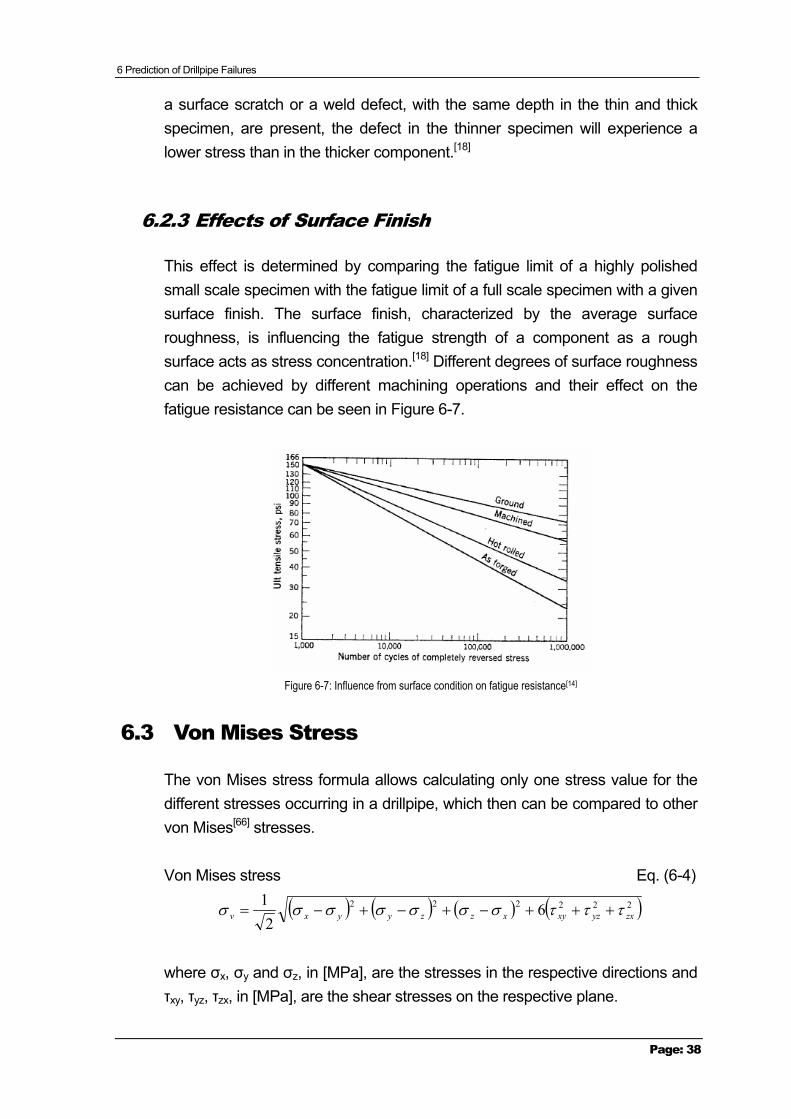
6 Prediction of Drillpipe Failures
Page: 38
a surface scratch or a weld defect, with the same depth in the thin and thick specimen, are present, the defect in the thinner specimen will experience a lower stress than in the thicker component.[18]
6.2.3 Effects of Surface Finish
This effect is determined by comparing the fatigue limit of a highly polished small scale specimen with the fatigue limit of a full scale specimen with a given surface finish. The surface finish, characterized by the average surface roughness, is influencing the fatigue strength of a component as a rough surface acts as stress concentration.[18] Different degrees of surface roughness can be achieved by different machining operations and their effect on the fatigue resistance can be seen in Figure 6-7.
Figure 6-7: Influence from surface condition on fatigue resistance[14]
6.3 Von Mises Stress
The von Mises stress formula allows calculating only one stress value for the different stresses occurring in a drillpipe, which then can be compared to other von Mises[66] stresses.
Von Mises stress Eq. (6-4)
( ) ( ) ( ) ( )222222 62
1zxyzxyxzzyyxv τττσσσσσσσ +++−+−+−=
where σx, σy and σz, in [MPa], are the stresses in the respective directions and τxy, τyz, τzx, in [MPa], are the shear stresses on the respective plane.
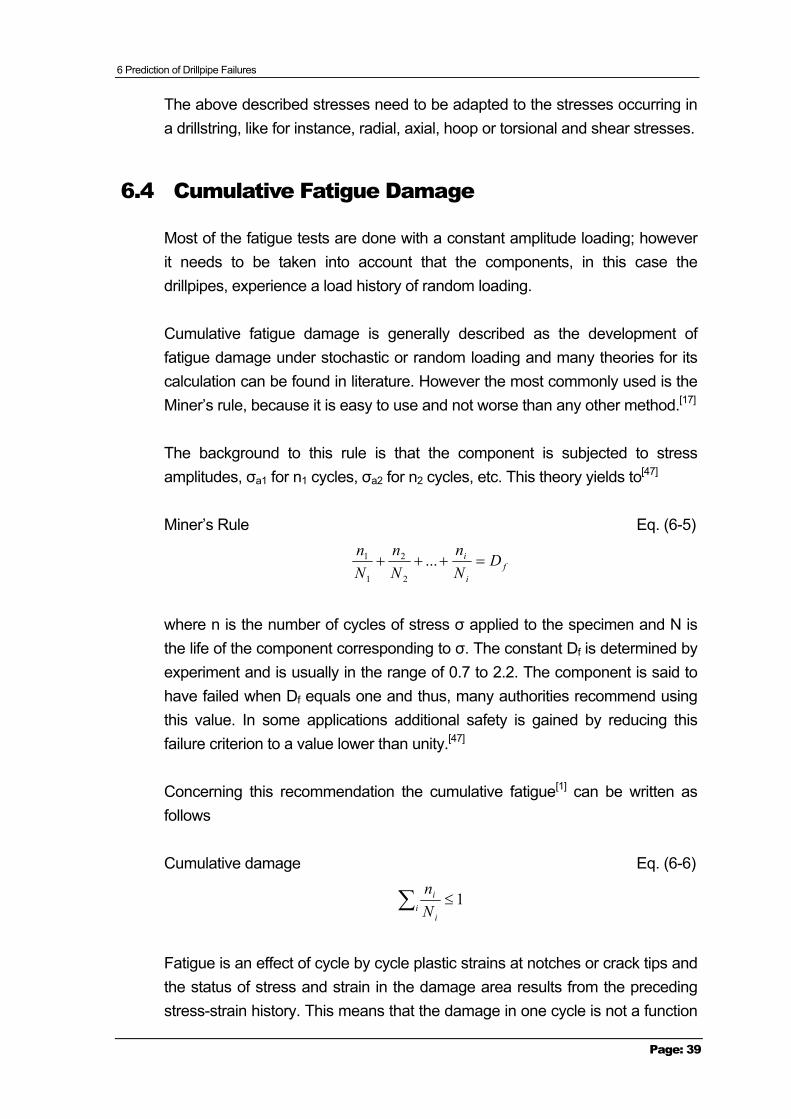
6 Prediction of Drillpipe Failures
Page: 39
The above described stresses need to be adapted to the stresses occurring in a drillstring, like for instance, radial, axial, hoop or torsional and shear stresses.
6.4 Cumulative Fatigue Damage
Most of the fatigue tests are done with a constant amplitude loading; however it needs to be taken into account that the components, in this case the drillpipes, experience a load history of random loading.
Cumulative fatigue damage is generally described as the development of fatigue damage under stochastic or random loading and many theories for its calculation can be found in literature. However the most commonly used is the Miner’s rule, because it is easy to use and not worse than any other method.[17]
The background to this rule is that the component is subjected to stress amplitudes, σa1 for n1 cycles, σa2 for n2 cycles, etc. This theory yields to[47]
Miner’s Rule Eq. (6-5)
fi
i DNn
Nn
Nn
=+++ ...2
2
1
1
where n is the number of cycles of stress σ applied to the specimen and N is the life of the component corresponding to σ. The constant Df is determined by experiment and is usually in the range of 0.7 to 2.2. The component is said to have failed when Df equals one and thus, many authorities recommend using this value. In some applications additional safety is gained by reducing this failure criterion to a value lower than unity.[47]
Concerning this recommendation the cumulative fatigue[1] can be written as follows
Cumulative damage Eq. (6-6)
1≤∑ii
i
Nn
Fatigue is an effect of cycle by cycle plastic strains at notches or crack tips and the status of stress and strain in the damage area results from the preceding stress-strain history. This means that the damage in one cycle is not a function
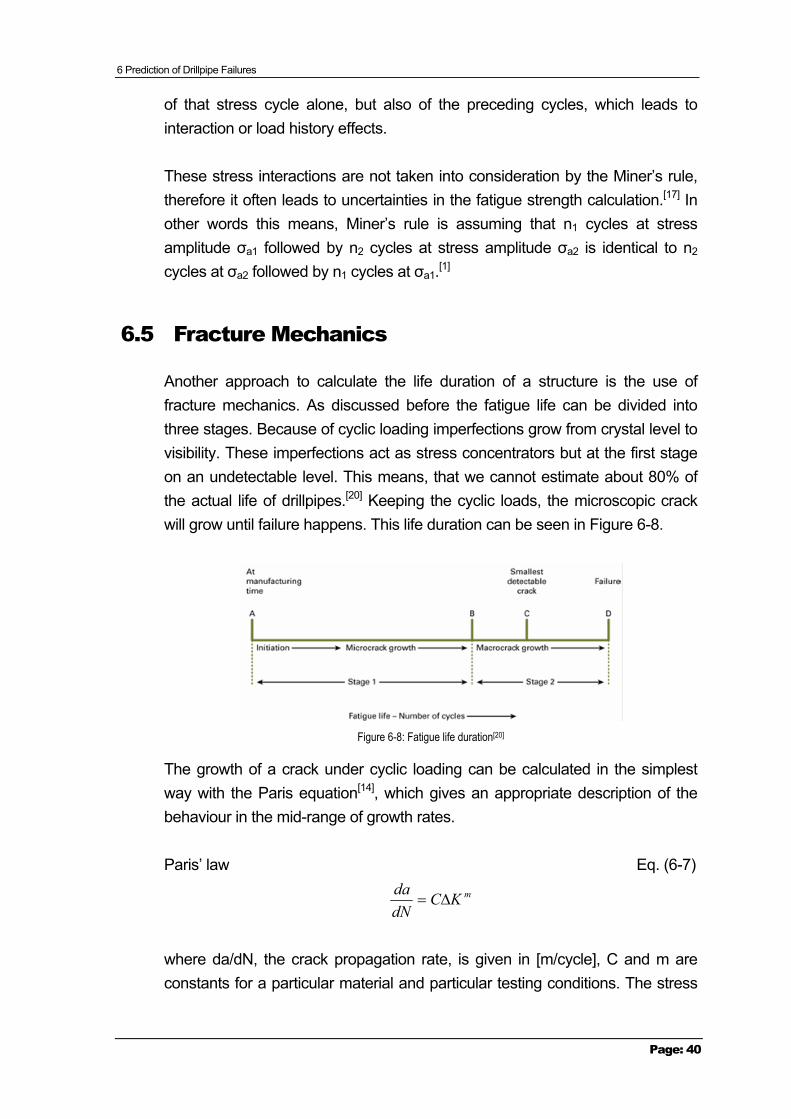
6 Prediction of Drillpipe Failures
Page: 40
of that stress cycle alone, but also of the preceding cycles, which leads to interaction or load history effects.
These stress interactions are not taken into consideration by the Miner’s rule, therefore it often leads to uncertainties in the fatigue strength calculation.[17] In other words this means, Miner’s rule is assuming that n1 cycles at stress amplitude σa1 followed by n2 cycles at stress amplitude σa2 is identical to n2 cycles at σa2 followed by n1 cycles at σa1.[1]
6.5 Fracture Mechanics
Another approach to calculate the life duration of a structure is the use of fracture mechanics. As discussed before the fatigue life can be divided into three stages. Because of cyclic loading imperfections grow from crystal level to visibility. These imperfections act as stress concentrators but at the first stage on an undetectable level. This means, that we cannot estimate about 80% of the actual life of drillpipes.[20] Keeping the cyclic loads, the microscopic crack will grow until failure happens. This life duration can be seen in Figure 6-8.
Figure 6-8: Fatigue life duration[20]
The growth of a crack under cyclic loading can be calculated in the simplest way with the Paris equation[14], which gives an appropriate description of the behaviour in the mid-range of growth rates.
Paris’ law Eq. (6-7)
mKCdNda
∆=
where da/dN, the crack propagation rate, is given in [m/cycle], C and m are constants for a particular material and particular testing conditions. The stress
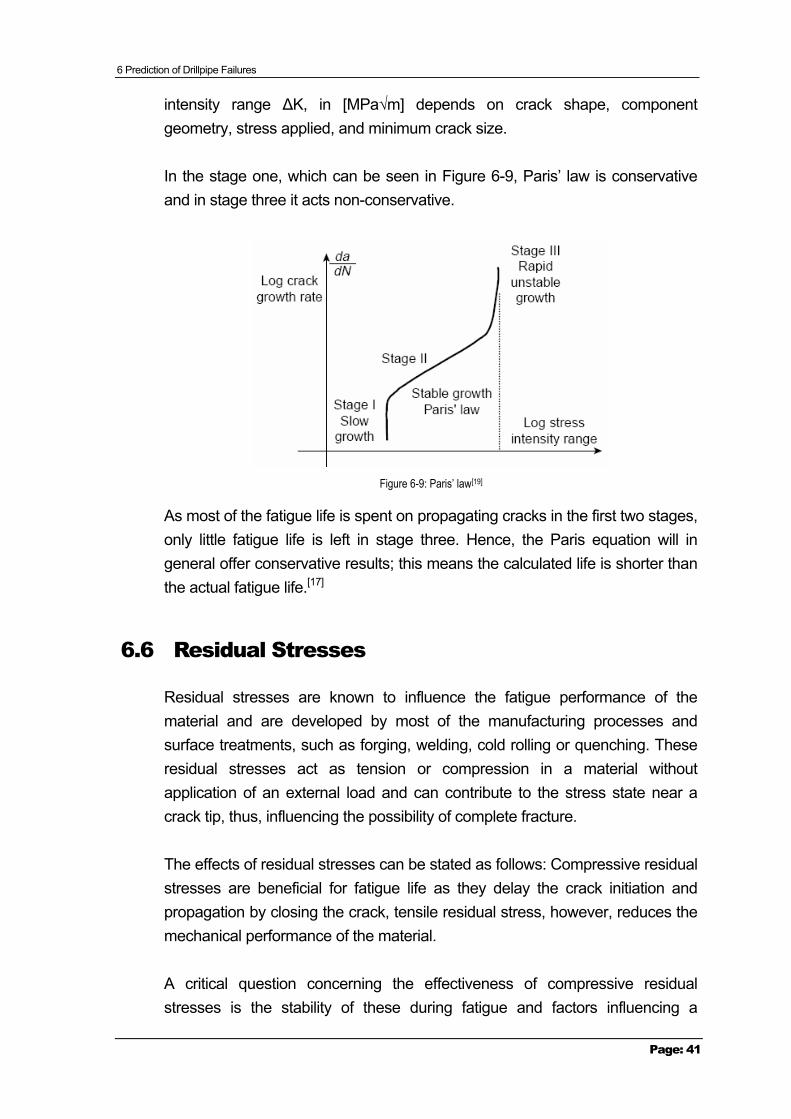
6 Prediction of Drillpipe Failures
Page: 41
intensity range ∆K, in [MPa√m] depends on crack shape, component geometry, stress applied, and minimum crack size.
In the stage one, which can be seen in Figure 6-9, Paris’ law is conservative and in stage three it acts non-conservative.
Figure 6-9: Paris’ law[19]
As most of the fatigue life is spent on propagating cracks in the first two stages, only little fatigue life is left in stage three. Hence, the Paris equation will in general offer conservative results; this means the calculated life is shorter than the actual fatigue life.[17]
6.6 Residual Stresses
Residual stresses are known to influence the fatigue performance of the material and are developed by most of the manufacturing processes and surface treatments, such as forging, welding, cold rolling or quenching. These residual stresses act as tension or compression in a material without application of an external load and can contribute to the stress state near a crack tip, thus, influencing the possibility of complete fracture.
The effects of residual stresses can be stated as follows: Compressive residual stresses are beneficial for fatigue life as they delay the crack initiation and propagation by closing the crack, tensile residual stress, however, reduces the mechanical performance of the material.
A critical question concerning the effectiveness of compressive residual stresses is the stability of these during fatigue and factors influencing a

6 Prediction of Drillpipe Failures
Page: 42
possible relaxation. If total stress exceeds the yield strength of the material, it will be plastically deformed and this leads to a change of the residual stress field. The structure adapts to the applied load. In cyclic loading a relaxation of the residual stress takes place and again an adaptation of the structure to the applied load can be seen.[21]

7 Parameters Influencing the Prediction
Page: 43
7 Parameters Influencing the Prediction
After research on technical papers and articles, enough information has been collected to start the process of developing a prediction model. First of all it needs to be stated that this work will not be able to develop an already usable model as to achieve this, test data is necessary. The general process of establishing a model is to consider the desired output of the model, as well as the necessary input. Thereafter, solutions to show the input in a mathematical way need to be adopted, in the case of failure prediction a rather difficult part as many influencing factors cannot be calculated mathematically. Subsequently, if mathematical solutions exist, a model can be developed. But this is not the end, as after designing a simulation model verification and testing of the model needs to be done. This is a long process maybe even extending over some years or a decade.
The main purpose of this chapter is to show the reader the immense number of factors influencing failure on drillpipes and thus, make it comprehensible that accurate prediction of failures is not done by only measuring some factors. Failure prediction is connecting numerous criteria and has not been done yet on a satisfying level, though tried many times, as a lot of necessary information is unknown which, however, is needed to develop such a model.
Considering the result, which a model should deliver, different possibilities are given. The most satisfying result of failure prediction would be to know how many feet or meters or how many hours a drillpipe can be used before failure. Regarding the discussion above, however, states that this is not possible due to too many unknowns. An alternative could be to simply compare real and calculated values and then to tell if failure may occur. This, though, is again a rather uncertain method and not always applicable for the same reasons as discussed above.
Nevertheless, it will be tried to explain the different factors influencing failure, to show which data is necessary to build a prediction model and which of them are known.
The access to the problem was to consider the wanted output, which is an S-N curve for a specified single pipe. This would allow, as long as the stress is
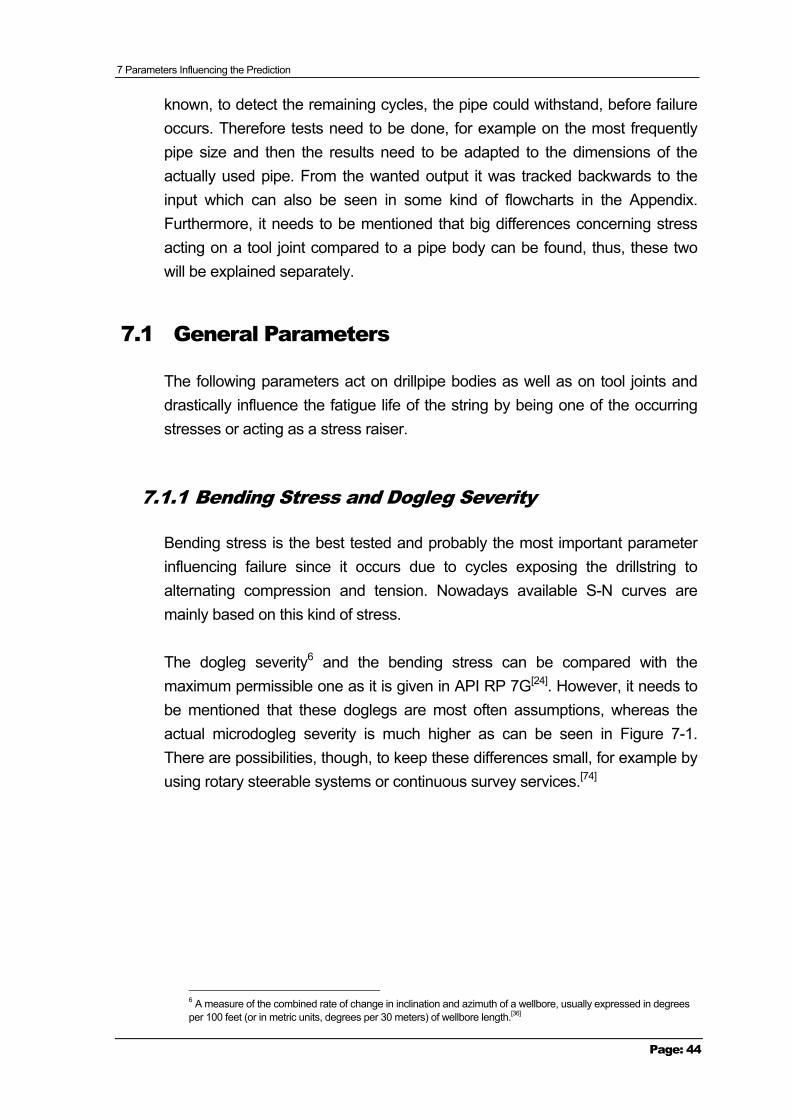
7 Parameters Influencing the Prediction
Page: 44
known, to detect the remaining cycles, the pipe could withstand, before failure occurs. Therefore tests need to be done, for example on the most frequently pipe size and then the results need to be adapted to the dimensions of the actually used pipe. From the wanted output it was tracked backwards to the input which can also be seen in some kind of flowcharts in the Appendix. Furthermore, it needs to be mentioned that big differences concerning stress acting on a tool joint compared to a pipe body can be found, thus, these two will be explained separately.
7.1 General Parameters
The following parameters act on drillpipe bodies as well as on tool joints and drastically influence the fatigue life of the string by being one of the occurring stresses or acting as a stress raiser.
7.1.1 Bending Stress and Dogleg Severity
Bending stress is the best tested and probably the most important parameter influencing failure since it occurs due to cycles exposing the drillstring to alternating compression and tension. Nowadays available S-N curves are mainly based on this kind of stress.
The dogleg severity6 and the bending stress can be compared with the maximum permissible one as it is given in API RP 7G[24]. However, it needs to be mentioned that these doglegs are most often assumptions, whereas the actual microdogleg severity is much higher as can be seen in Figure 7-1. There are possibilities, though, to keep these differences small, for example by using rotary steerable systems or continuous survey services.[74]
6 A measure of the combined rate of change in inclination and azimuth of a wellbore, usually expressed in degrees per 100 feet (or in metric units, degrees per 30 meters) of wellbore length.[36]
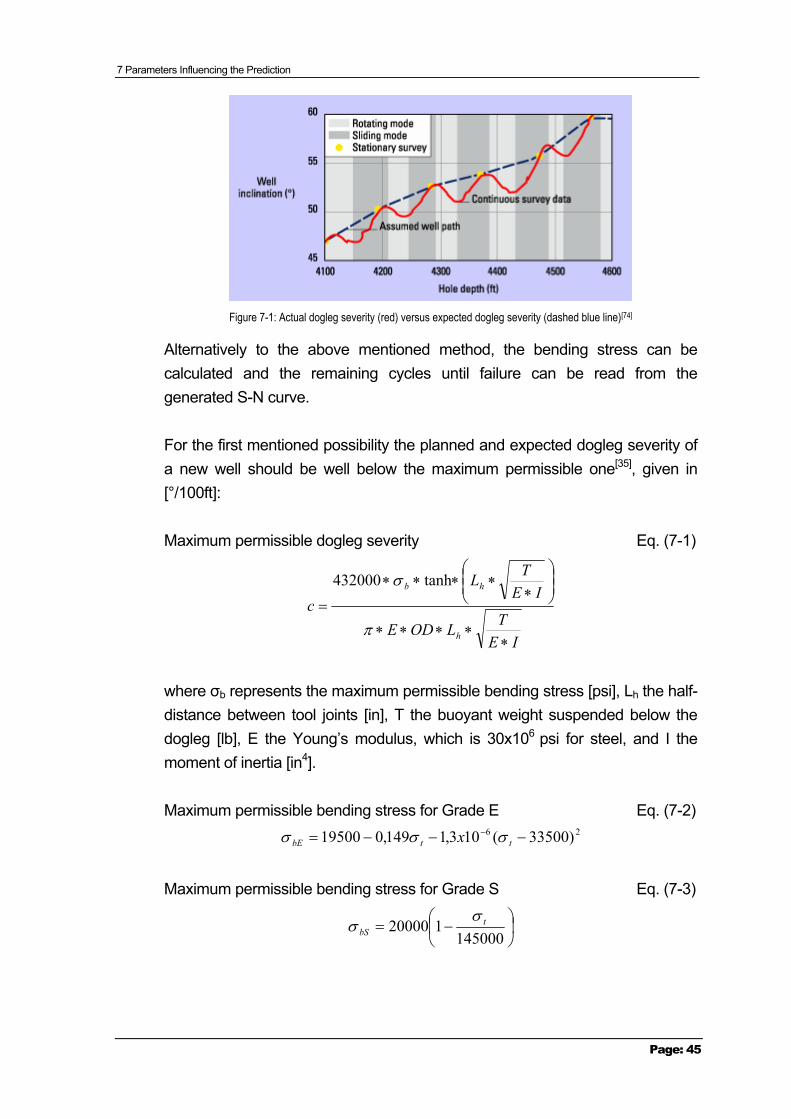
7 Parameters Influencing the Prediction
Page: 45
Figure 7-1: Actual dogleg severity (red) versus expected dogleg severity (dashed blue line)[74]
Alternatively to the above mentioned method, the bending stress can be calculated and the remaining cycles until failure can be read from the generated S-N curve.
For the first mentioned possibility the planned and expected dogleg severity of a new well should be well below the maximum permissible one[35], given in [°/100ft]:
Maximum permissible dogleg severity Eq. (7-1)
IETLODE
IETL
c
h
hb
∗∗∗∗∗
∗∗∗∗∗
=π
σ tanh432000
where σb represents the maximum permissible bending stress [psi], Lh the half-distance between tool joints [in], T the buoyant weight suspended below the dogleg [lb], E the Young’s modulus, which is 30x106 psi for steel, and I the moment of inertia [in4].
Maximum permissible bending stress for Grade E Eq. (7-2) 26 )33500(103,1149,019500 −−−= −
ttbE x σσσ
Maximum permissible bending stress for Grade S Eq. (7-3)
−=
145000120000 t
bSσ
σ
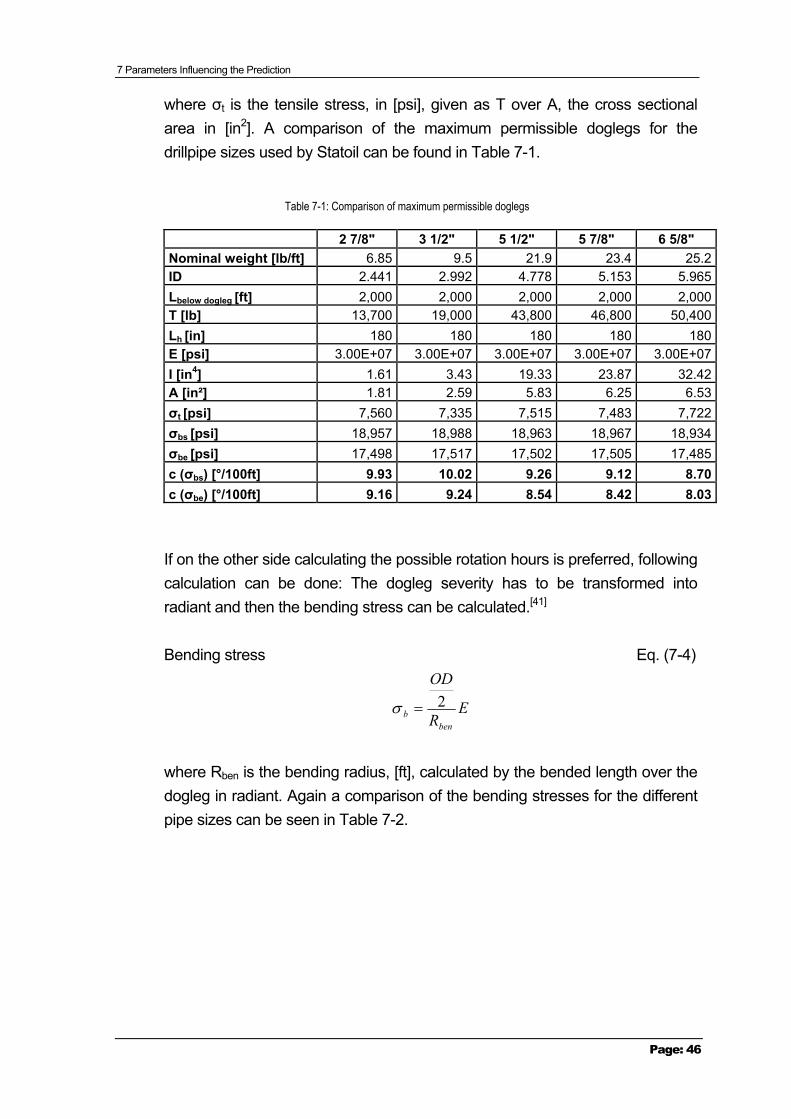
7 Parameters Influencing the Prediction
Page: 46
where σt is the tensile stress, in [psi], given as T over A, the cross sectional area in [in2]. A comparison of the maximum permissible doglegs for the drillpipe sizes used by Statoil can be found in Table 7-1.
Table 7-1: Comparison of maximum permissible doglegs
2 7/8" 3 1/2" 5 1/2" 5 7/8" 6 5/8" Nominal weight [lb/ft] 6.85 9.5 21.9 23.4 25.2ID 2.441 2.992 4.778 5.153 5.965Lbelow dogleg [ft] 2,000 2,000 2,000 2,000 2,000T [lb] 13,700 19,000 43,800 46,800 50,400Lh [in] 180 180 180 180 180E [psi] 3.00E+07 3.00E+07 3.00E+07 3.00E+07 3.00E+07I [in4] 1.61 3.43 19.33 23.87 32.42A [in²] 1.81 2.59 5.83 6.25 6.53σt [psi] 7,560 7,335 7,515 7,483 7,722σbs [psi] 18,957 18,988 18,963 18,967 18,934σbe [psi] 17,498 17,517 17,502 17,505 17,485c (σbs) [°/100ft] 9.93 10.02 9.26 9.12 8.70c (σbe) [°/100ft] 9.16 9.24 8.54 8.42 8.03
If on the other side calculating the possible rotation hours is preferred, following calculation can be done: The dogleg severity has to be transformed into radiant and then the bending stress can be calculated.[41]
Bending stress Eq. (7-4)
ER
OD
benb
2=σ
where Rben is the bending radius, [ft], calculated by the bended length over the dogleg in radiant. Again a comparison of the bending stresses for the different pipe sizes can be seen in Table 7-2.

7 Parameters Influencing the Prediction
Page: 47
Table 7-2: Comparison of bending stresses
With the appropriate S-N chart for the drillpipe a probable amount of cycles until failure can now be determined. Still it needs to be pointed out that these cycles only represent the life of a pipe exposed to bending stress. Other stresses and stress raisers are not taken into account.
Nevertheless, with the expected cycles and the rotary speed the number of hours until the drillpipe will fail can be calculated.
7 Parameters Influencing the Prediction
Page: 48
Furthermore, it needs to be taken into consideration that the made up connections are prestressed (Chapter 7.2.1) and therefore the bending stress in the tool joint is according to the preload. This means, as will be explained later on, that the connection is made up to 60% of its yield strength and thus, additionally applied load will affect the fatigue life starting at this level. Hence, a longer life can be achieved. These different perceptions of pipe body and tool joint make prediction difficult as both parts need to be tested separately and then in some way combined.
The fatigue damage can then be calculated by using the Miner’s rule, described in Chapter 6.4, where the total damage consists of the addition of each damage at each cycle.
Another important aspect not included into the calculations of API is the contact of the pipe with the wellbore wall. The axial tensile load straightens the middle portion of the drillpipes in a dogleg, resulting in a maximum bending stress located next to the tool joint. For axial compressive stress load the middle portion of the drillpipe is deflected further in the build section of the wells and thus, the maximum bending stress occurs in the middle of the pipe as can be seen in Figure 7-2.
Figure 7-2: Maximum bending of drillpipe in tension (left) and compression (right)[19]
The maximum stresses, though, were derived based on the assumption that there is no contact between borehole wall and pipe body. For high tensile or compressive loads, however, the body is contacting the borehole wall and thus, the bending stress distribution is getting changed. In fact the maximum bending stress will be smaller than predicted as the drillpipe bending deflection
7 Parameters Influencing the Prediction
Page: 49
is limited within the wellbore and thus, even higher build rates can be achieved.[42]
It has to be considered, however, that contact of the pipe with the wall or the casing can cause wear and maybe therefore protectors, which are thickened sections of the same diameter as the tool joint, ought to be applied. Additionally, the contact with the wall increases the needed torque to rotate the string, which needs to be especially taken into account in long wells.
These cases show that even criteria that are well tested and where prediction of failure seems possible are interacting with other criteria and thus, failure may occur despite a correct prediction. These circumstances apply all the time; two or more criteria affect each other in leading to failure and hence, making a prediction, after how many hours failure happens, so difficult.
7.1.2 Operating Torque
Generally the torque, which is required to rotate the drillstring, develops from the frictional resistance between the rotating drill string and the casing or borehole wall. Contributors to increased torque are especially long reach wells; and not only there it needs to be considered that make up torque should always be higher than downhole torque to prevent downhole make up and failure as described in Chapter 4.2.
Operating torque is a value that is measurable, but including it into a prediction model may be difficult. The recommended make up torque from the different components can be found in tables and is compared to the operating torque. Although a safety factor is included in the given make up torque and thus, the component could withstand a higher torque, operating torque should not exceed make up torque to prevent failure. If this still happens, downhole make up can proceed and lead to failure.
Operating torque can be predicted beforehand by computer programs such as Landmark’s WellplanTM enabling the engineer to make a proper design for the expected situation. Nevertheless, control about the actual value always has to be maintained during the drilling process. If the downhole torque is expected to reach make up torque for some reason, the make up torque application devices need to be calibrated to assure the right value for make up torque.[26]
7 Parameters Influencing the Prediction
Page: 50
Especially in extended reach drilling a proper calculation of the operating torque gets important because the success of drilling these wells strongly depends on this factor. The main parameter influencing torque is the friction occurring downhole. It is mainly caused by contacts of the drillstring with the borehole wall, created, for example, from side loads, but also by differential sticking, drilling fluid parameters, hole cleaning or surface roughness of the pipe. Hence, controlling the mentioned parameters increases the probability of drilling to target depth.
Besides that, it needs to be visualized that torque is highest at the top of the drillstring near the top drive but the stresses acting on the drillstring are more critical in doglegs since in these surroundings combined loads of torque and bending stresses can be found, leading to a further reduction of the drillpipe life.
7.1.3 Surface Damage
Slip marks and wear, as discussed in Chapters 4.1.2 and 4.1.1 accordingly, damage the surface and act therefore as stress raiser. These areas contribute to faster crack propagations and thus, there is a need of measuring the extent of damage, though inspection methods are still not able to identify wear or die marks at an early stage.
As mentioned before wear appears on the pipe body when passing through Xmas trees in TTRD or doglegs or due to other reasons where the string contacts the borehole wall or casing. Notches are thereby developed leading to an increased stress concentration.
The influence of slip marks on drillpipe fatigue life is estimated high and therefore some bending tests on marked and unmarked RSA-6K pipes have been done by Hossain[15] showing the fatigue life for different mark depths. The stress concentration factor for the slip marks has been multiplied to the determined bending stress and as this factor is increasing with increasing mark depth an approximation of the pipe’s life duration could be done. Nevertheless, the final stress acting on the pipe has only taken bending stresses and die marks into account and neglected other occurring stresses and stress raisers.
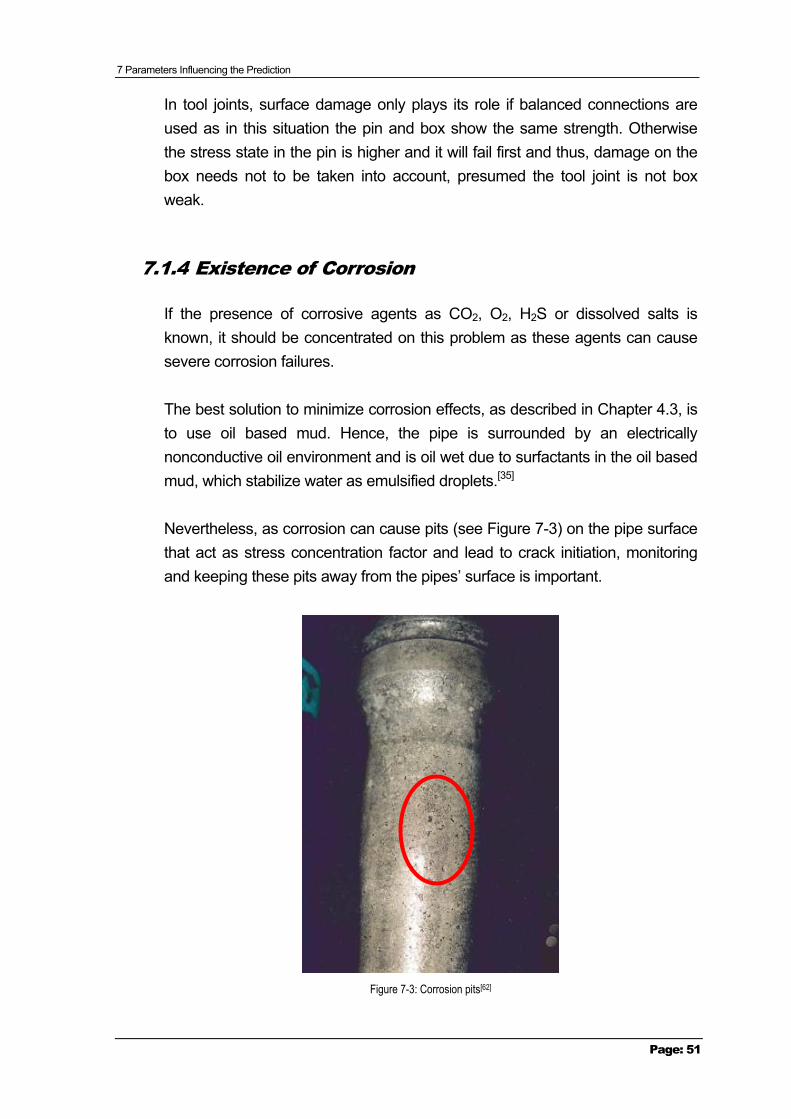
7 Parameters Influencing the Prediction
Page: 51
In tool joints, surface damage only plays its role if balanced connections are used as in this situation the pin and box show the same strength. Otherwise the stress state in the pin is higher and it will fail first and thus, damage on the box needs not to be taken into account, presumed the tool joint is not box weak.
7.1.4 Existence of Corrosion
If the presence of corrosive agents as CO2, O2, H2S or dissolved salts is known, it should be concentrated on this problem as these agents can cause severe corrosion failures.
The best solution to minimize corrosion effects, as described in Chapter 4.3, is to use oil based mud. Hence, the pipe is surrounded by an electrically nonconductive oil environment and is oil wet due to surfactants in the oil based mud, which stabilize water as emulsified droplets.[35]
Nevertheless, as corrosion can cause pits (see Figure 7-3) on the pipe surface that act as stress concentration factor and lead to crack initiation, monitoring and keeping these pits away from the pipes’ surface is important.
Figure 7-3: Corrosion pits[62]
7 Parameters Influencing the Prediction
Page: 52
One way to measure the mud corrosion rate is to insert rings into the tool joint box at the end of the pin having the same diameter as the tool joint. The weight and visual loss can be measured thereafter and the corrosiveness of the mud can be assessed. The constraint in this method, though, is the time, up to several days, that this ring needs to be exposed to the mud to show results. In some cases, though, damage is already done to the drillpipe after this time period.[9]
Besides that, it should be considered that the storage of the pipe can be another important factor since, if stored inadequate, corrosion can start and thus, the drillpipe life is reduced.
Some studies[16],[69][70] have been done on the fatigue life of pipes, which are exposed to corrosion, and thus, some S-N curves exist, though mainly considering bending in a corrosive environment.
7.2 Parameters Acting on Tool Joints
The main purpose of tool joints is to connect the different pipe joints. To ease the sliding of the pin into the box, the connection is constructed in a tapered form and is then made up to avoid separation downhole or leakage between the connections. Furthermore, the tool joint needs to transform externally applied stresses like tension or torsion.
In tool joints stresses act mainly on the threads which are connecting the two pipes, therefore their effect needs to be simulated with the help of a Finite Element Analysis. Additionally, the results need to be verified by testing different dimensions.
7.2.1 Preloading
The biggest difference between tool joints and pipe bodies is the fact that tool joints are preloaded with some tensile stress when they are made up. This improves the fatigue resistance and gives a locking effect. The additional, external stresses act now according to the prestress. This can be explained by a 150 lb weight fixed on a fish scale according to a tensile preload in the connections. A block is forced in position and the 150 lb weight is replaced with
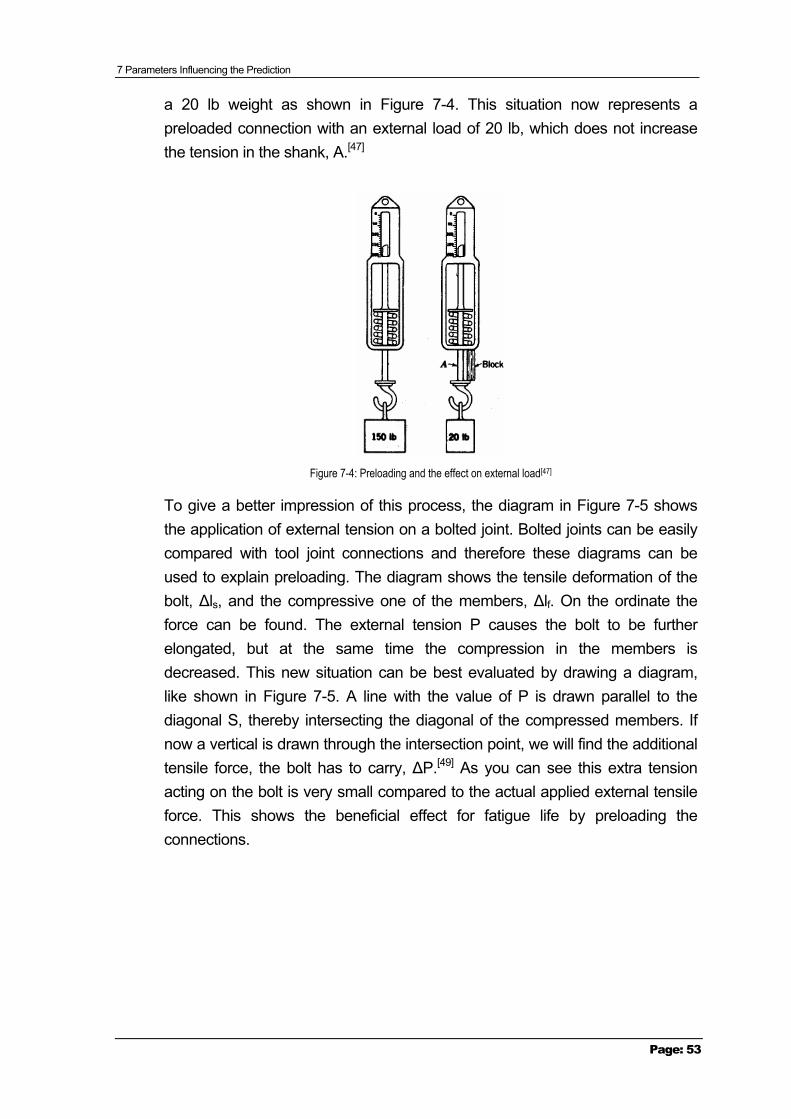
7 Parameters Influencing the Prediction
Page: 53
a 20 lb weight as shown in Figure 7-4. This situation now represents a preloaded connection with an external load of 20 lb, which does not increase the tension in the shank, A.[47]
Figure 7-4: Preloading and the effect on external load[47]
To give a better impression of this process, the diagram in Figure 7-5 shows the application of external tension on a bolted joint. Bolted joints can be easily compared with tool joint connections and therefore these diagrams can be used to explain preloading. The diagram shows the tensile deformation of the bolt, ∆ls, and the compressive one of the members, ∆lf. On the ordinate the force can be found. The external tension P causes the bolt to be further elongated, but at the same time the compression in the members is decreased. This new situation can be best evaluated by drawing a diagram, like shown in Figure 7-5. A line with the value of P is drawn parallel to the diagonal S, thereby intersecting the diagonal of the compressed members. If now a vertical is drawn through the intersection point, we will find the additional tensile force, the bolt has to carry, ∆P.[49] As you can see this extra tension acting on the bolt is very small compared to the actual applied external tensile force. This shows the beneficial effect for fatigue life by preloading the connections.
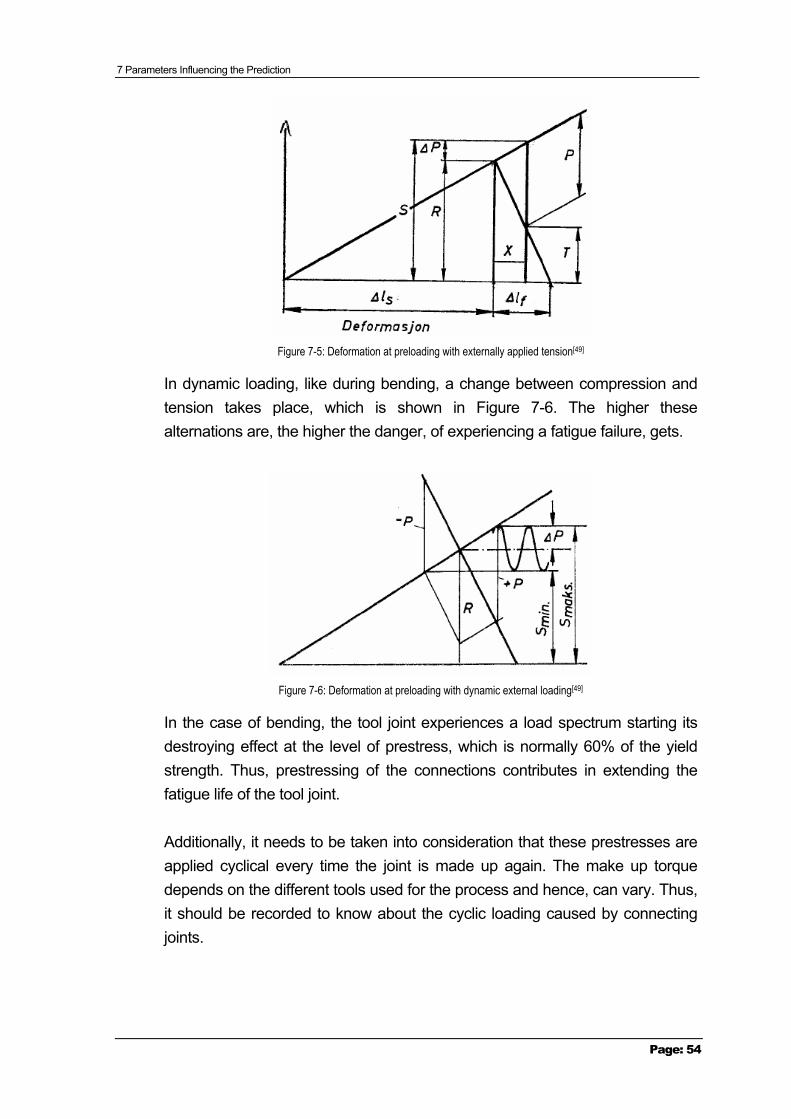
7 Parameters Influencing the Prediction
Page: 54
Figure 7-5: Deformation at preloading with externally applied tension[49]
In dynamic loading, like during bending, a change between compression and tension takes place, which is shown in Figure 7-6. The higher these alternations are, the higher the danger, of experiencing a fatigue failure, gets.
Figure 7-6: Deformation at preloading with dynamic external loading[49]
In the case of bending, the tool joint experiences a load spectrum starting its destroying effect at the level of prestress, which is normally 60% of the yield strength. Thus, prestressing of the connections contributes in extending the fatigue life of the tool joint.
Additionally, it needs to be taken into consideration that these prestresses are applied cyclical every time the joint is made up again. The make up torque depends on the different tools used for the process and hence, can vary. Thus, it should be recorded to know about the cyclic loading caused by connecting joints.
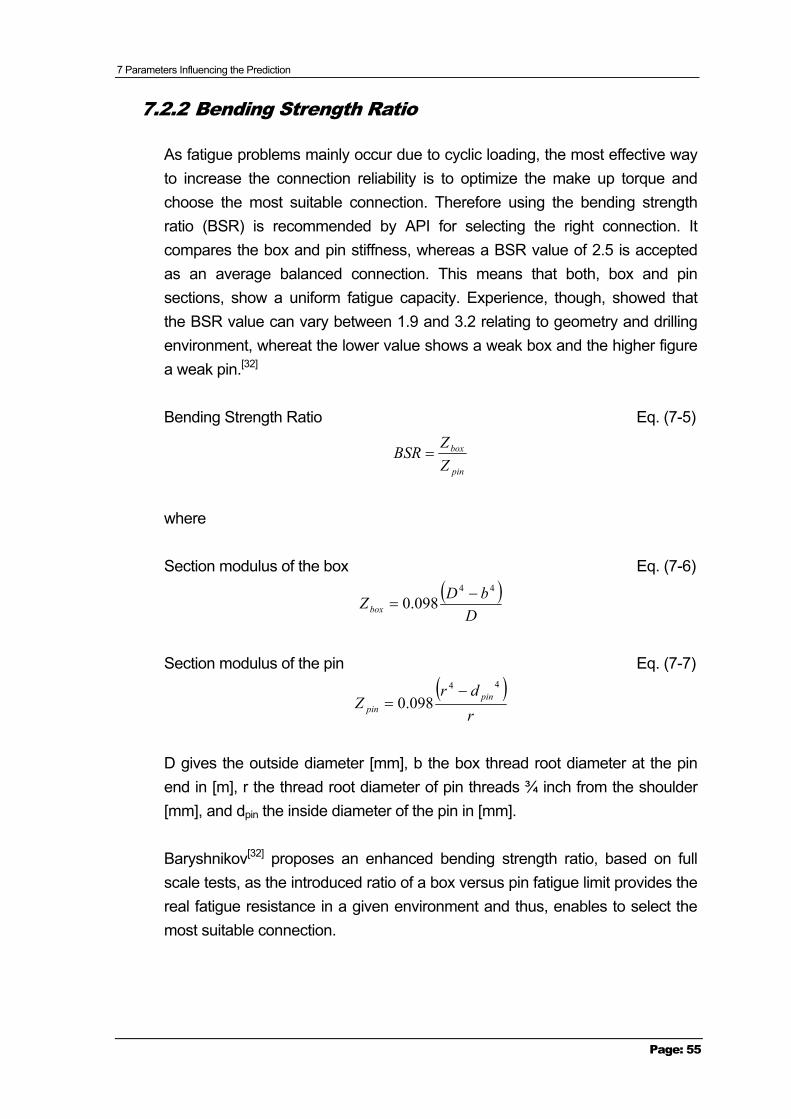
7 Parameters Influencing the Prediction
Page: 55
7.2.2 Bending Strength Ratio
As fatigue problems mainly occur due to cyclic loading, the most effective way to increase the connection reliability is to optimize the make up torque and choose the most suitable connection. Therefore using the bending strength ratio (BSR) is recommended by API for selecting the right connection. It compares the box and pin stiffness, whereas a BSR value of 2.5 is accepted as an average balanced connection. This means that both, box and pin sections, show a uniform fatigue capacity. Experience, though, showed that the BSR value can vary between 1.9 and 3.2 relating to geometry and drilling environment, whereat the lower value shows a weak box and the higher figure a weak pin.[32]
Bending Strength Ratio Eq. (7-5)
pin
box
ZZ
BSR =
where
Section modulus of the box Eq. (7-6)
( )DbDZbox
44
098.0 −=
Section modulus of the pin Eq. (7-7)
( )rdr
Z pinpin
44
098.0−
=
D gives the outside diameter [mm], b the box thread root diameter at the pin end in [m], r the thread root diameter of pin threads ¾ inch from the shoulder [mm], and dpin the inside diameter of the pin in [mm].
Baryshnikov[32] proposes an enhanced bending strength ratio, based on full scale tests, as the introduced ratio of a box versus pin fatigue limit provides the real fatigue resistance in a given environment and thus, enables to select the most suitable connection.
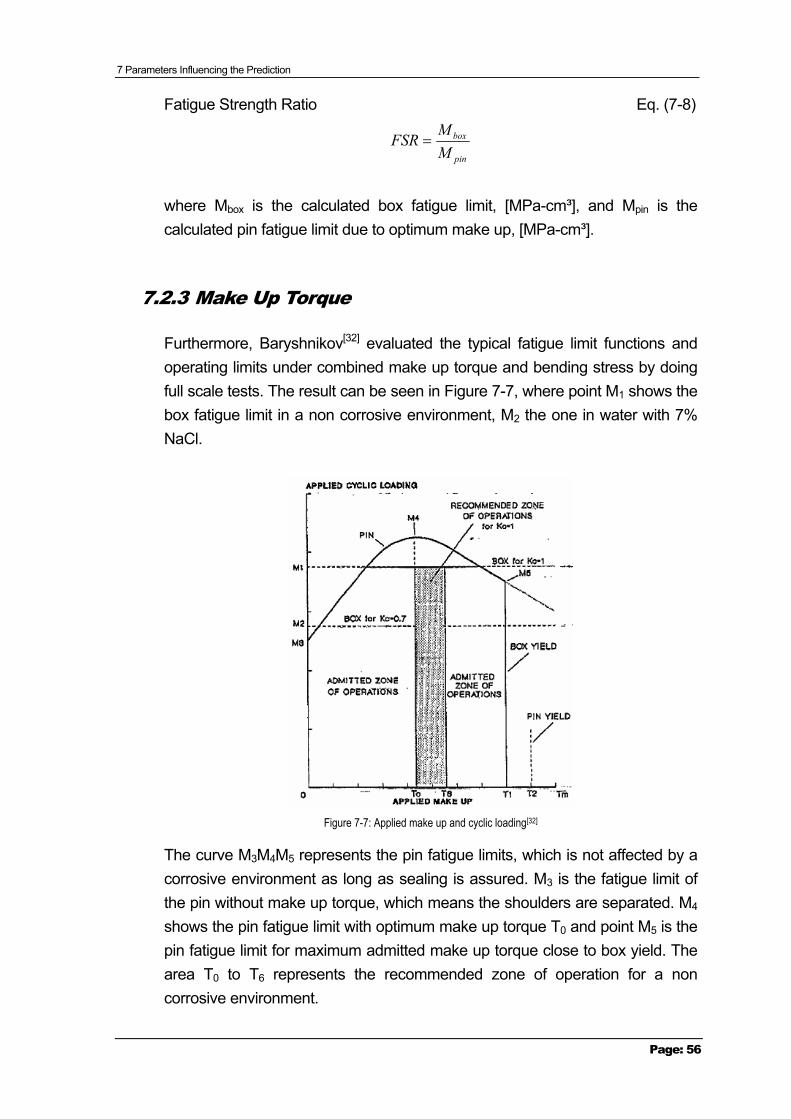
7 Parameters Influencing the Prediction
Page: 56
Fatigue Strength Ratio Eq. (7-8)
pin
box
MM
FSR =
where Mbox is the calculated box fatigue limit, [MPa-cm³], and Mpin is the calculated pin fatigue limit due to optimum make up, [MPa-cm³].
7.2.3 Make Up Torque
Furthermore, Baryshnikov[32] evaluated the typical fatigue limit functions and operating limits under combined make up torque and bending stress by doing full scale tests. The result can be seen in Figure 7-7, where point M1 shows the box fatigue limit in a non corrosive environment, M2 the one in water with 7% NaCl.
Figure 7-7: Applied make up and cyclic loading[32]
The curve M3M4M5 represents the pin fatigue limits, which is not affected by a corrosive environment as long as sealing is assured. M3 is the fatigue limit of the pin without make up torque, which means the shoulders are separated. M4 shows the pin fatigue limit with optimum make up torque T0 and point M5 is the pin fatigue limit for maximum admitted make up torque close to box yield. The area T0 to T6 represents the recommended zone of operation for a non corrosive environment.
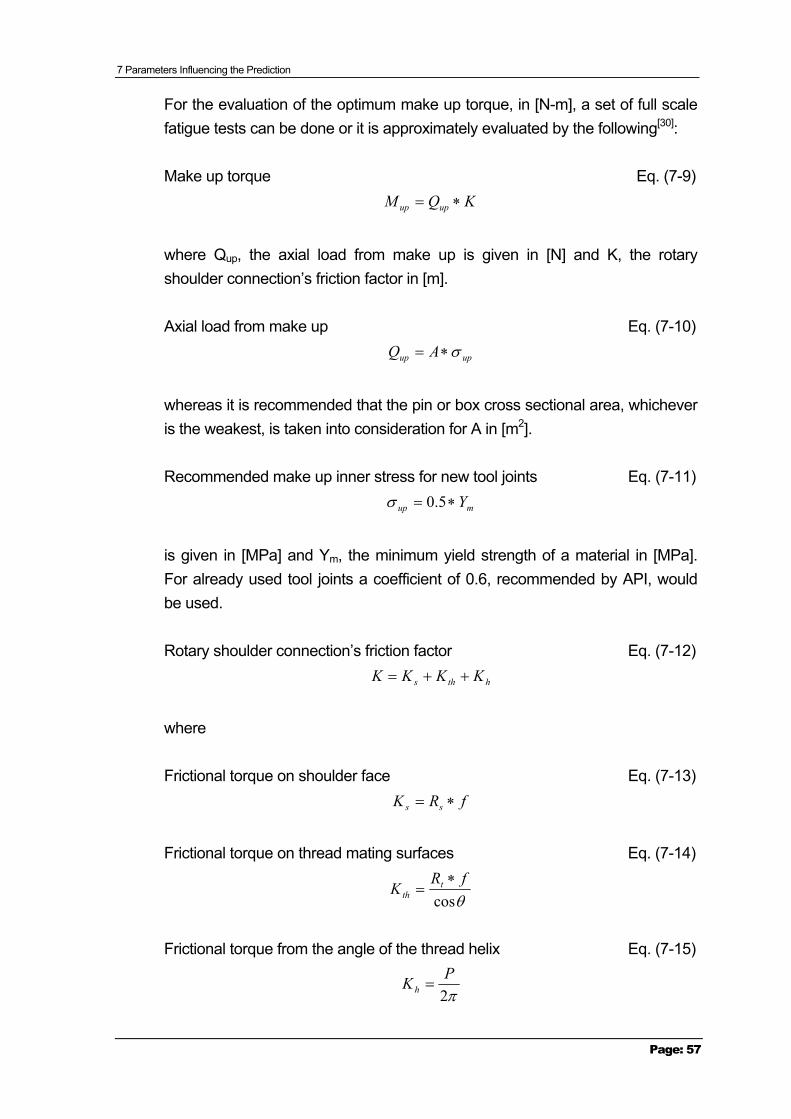
7 Parameters Influencing the Prediction
Page: 57
For the evaluation of the optimum make up torque, in [N-m], a set of full scale fatigue tests can be done or it is approximately evaluated by the following[30]:
Make up torque Eq. (7-9) KQM upup ∗=
where Qup, the axial load from make up is given in [N] and K, the rotary shoulder connection’s friction factor in [m].
Axial load from make up Eq. (7-10)
upup AQ σ∗=
whereas it is recommended that the pin or box cross sectional area, whichever is the weakest, is taken into consideration for A in [m2].
Recommended make up inner stress for new tool joints Eq. (7-11)
mup Y∗= 5.0σ
is given in [MPa] and Ym, the minimum yield strength of a material in [MPa]. For already used tool joints a coefficient of 0.6, recommended by API, would be used.
Rotary shoulder connection’s friction factor Eq. (7-12)
hths KKKK ++=
where
Frictional torque on shoulder face Eq. (7-13) fRK ss ∗=
Frictional torque on thread mating surfaces Eq. (7-14)
θcosfR
K tth
∗=
Frictional torque from the angle of the thread helix Eq. (7-15)
π2PKh =
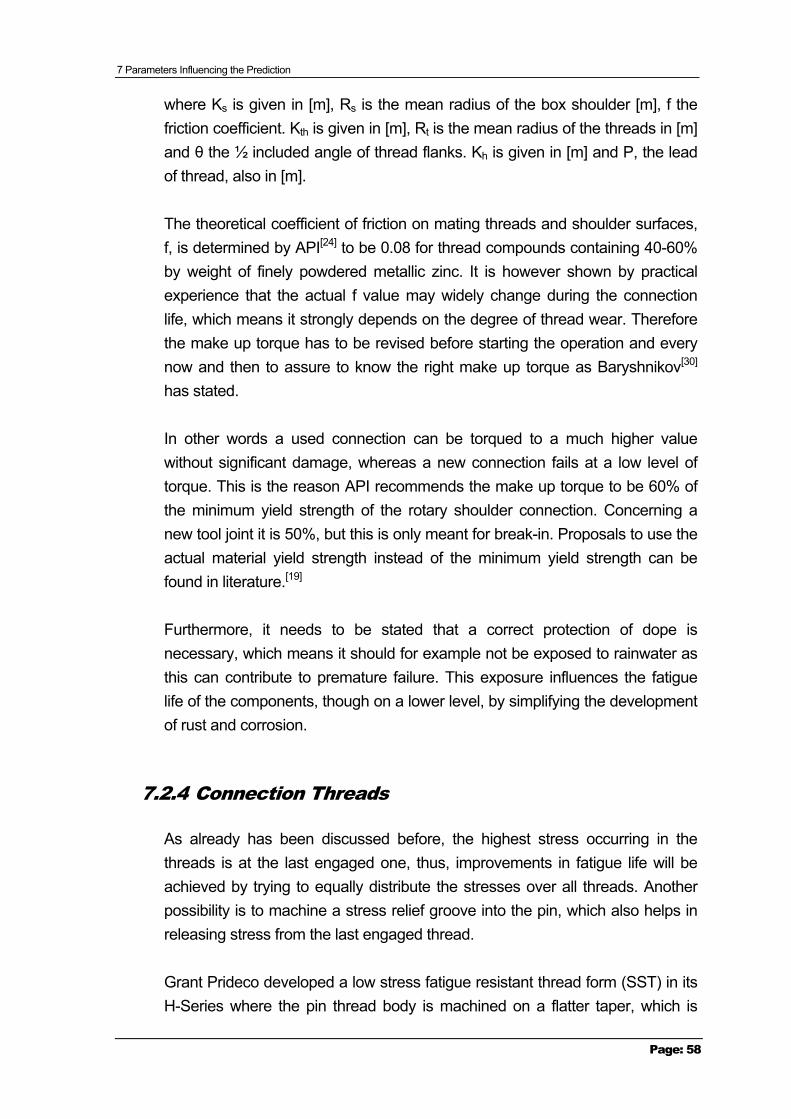
7 Parameters Influencing the Prediction
Page: 58
where Ks is given in [m], Rs is the mean radius of the box shoulder [m], f the friction coefficient. Kth is given in [m], Rt is the mean radius of the threads in [m] and θ the ½ included angle of thread flanks. Kh is given in [m] and P, the lead of thread, also in [m].
The theoretical coefficient of friction on mating threads and shoulder surfaces, f, is determined by API[24] to be 0.08 for thread compounds containing 40-60% by weight of finely powdered metallic zinc. It is however shown by practical experience that the actual f value may widely change during the connection life, which means it strongly depends on the degree of thread wear. Therefore the make up torque has to be revised before starting the operation and every now and then to assure to know the right make up torque as Baryshnikov[30] has stated.
In other words a used connection can be torqued to a much higher value without significant damage, whereas a new connection fails at a low level of torque. This is the reason API recommends the make up torque to be 60% of the minimum yield strength of the rotary shoulder connection. Concerning a new tool joint it is 50%, but this is only meant for break-in. Proposals to use the actual material yield strength instead of the minimum yield strength can be found in literature.[19]
Furthermore, it needs to be stated that a correct protection of dope is necessary, which means it should for example not be exposed to rainwater as this can contribute to premature failure. This exposure influences the fatigue life of the components, though on a lower level, by simplifying the development of rust and corrosion.
7.2.4 Connection Threads
As already has been discussed before, the highest stress occurring in the threads is at the last engaged one, thus, improvements in fatigue life will be achieved by trying to equally distribute the stresses over all threads. Another possibility is to machine a stress relief groove into the pin, which also helps in releasing stress from the last engaged thread.
Grant Prideco developed a low stress fatigue resistant thread form (SST) in its H-Series where the pin thread body is machined on a flatter taper, which is
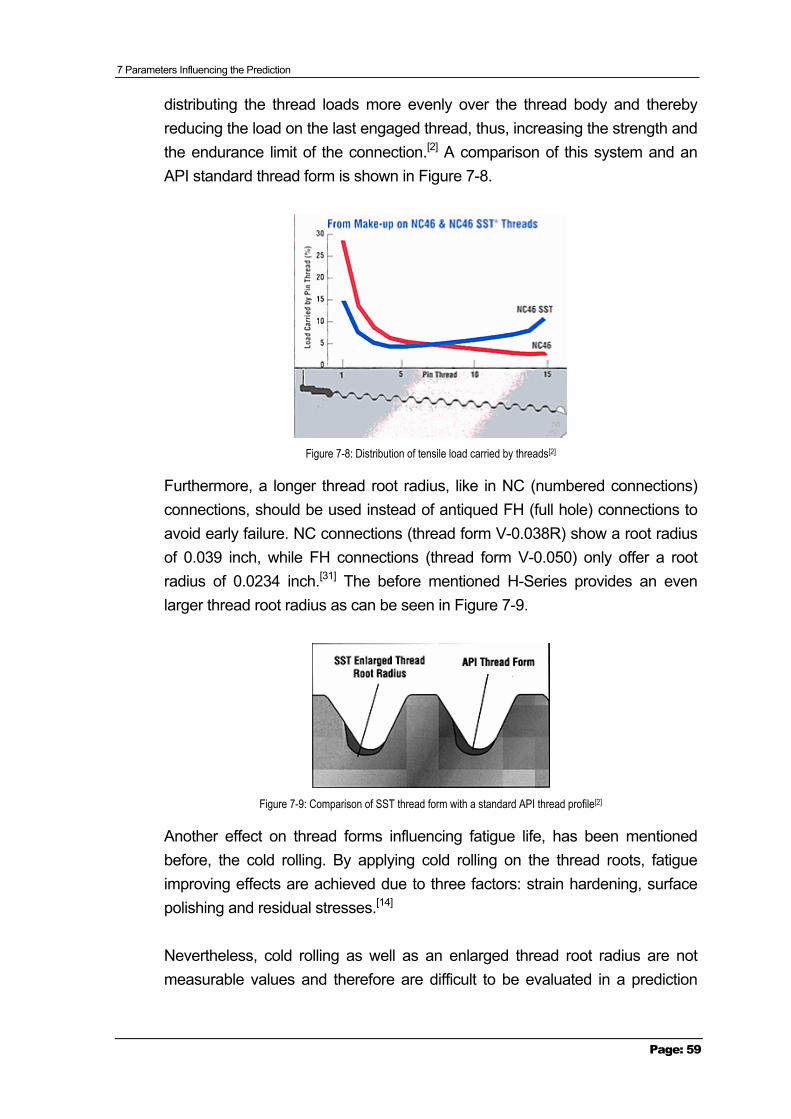
7 Parameters Influencing the Prediction
Page: 59
distributing the thread loads more evenly over the thread body and thereby reducing the load on the last engaged thread, thus, increasing the strength and the endurance limit of the connection.[2] A comparison of this system and an API standard thread form is shown in Figure 7-8.
Figure 7-8: Distribution of tensile load carried by threads[2]
Furthermore, a longer thread root radius, like in NC (numbered connections) connections, should be used instead of antiqued FH (full hole) connections to avoid early failure. NC connections (thread form V-0.038R) show a root radius of 0.039 inch, while FH connections (thread form V-0.050) only offer a root radius of 0.0234 inch.[31] The before mentioned H-Series provides an even larger thread root radius as can be seen in Figure 7-9.
Figure 7-9: Comparison of SST thread form with a standard API thread profile[2]
Another effect on thread forms influencing fatigue life, has been mentioned before, the cold rolling. By applying cold rolling on the thread roots, fatigue improving effects are achieved due to three factors: strain hardening, surface polishing and residual stresses.[14]
Nevertheless, cold rolling as well as an enlarged thread root radius are not measurable values and therefore are difficult to be evaluated in a prediction
7 Parameters Influencing the Prediction
Page: 60
model. It is known that these factors can contribute to an extended fatigue life, but it cannot be said to which extent.
7.2.5 Single and Double Shoulder Connections
Furthermore, it needs to be distinguished between single and double shouldered connections as the second mentioned increases the torsion capacity of a tool joint up to 40 – 60% of a conventional API single shoulder.[19] The differences in torsional strength between this connection and conventional tool joints can be seen in Figure 7-10.
Figure 7-10: Double shoulder tool joints[48]
Besides that, these connections use a smaller outer diameter and a larger inner diameter, which leads to an improved hydraulic efficiency, pressure losses in the pipe are therefore decreased and annular velocities increased. These two advantages are suitable for extended reach drilling as well as Through-Tubing Rotary Drilling.[33]
7.2.6 Residual Stresses
As discussed in Chapter 6.6 residual stresses have a great influence on the life of a component but can experience a relaxation during repeated cycles. Studies like the one from Kristoffersen[14] have been done to better understand the beneficial effects of compressive residual stresses as achieved, for example, with cold rolling on threads.
Nevertheless, to be able to give correct estimations on the extension or shortening of drillpipe lives due to residual stresses, more tests need to be done to get a better understanding of the process and the effect itself. For the moment it can only be said that compressive residual stresses contribute to the
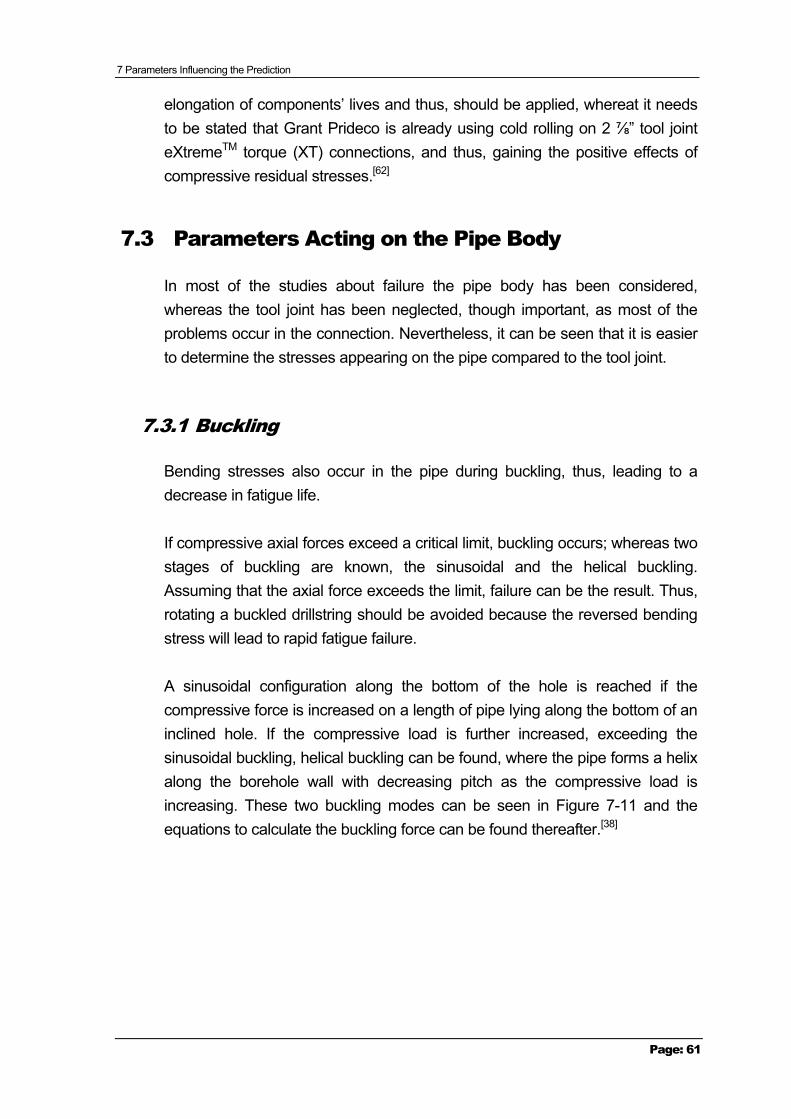
7 Parameters Influencing the Prediction
Page: 61
elongation of components’ lives and thus, should be applied, whereat it needs to be stated that Grant Prideco is already using cold rolling on 2 ⅞” tool joint eXtremeTM torque (XT) connections, and thus, gaining the positive effects of compressive residual stresses.[62]
7.3 Parameters Acting on the Pipe Body
In most of the studies about failure the pipe body has been considered, whereas the tool joint has been neglected, though important, as most of the problems occur in the connection. Nevertheless, it can be seen that it is easier to determine the stresses appearing on the pipe compared to the tool joint.
7.3.1 Buckling
Bending stresses also occur in the pipe during buckling, thus, leading to a decrease in fatigue life.
If compressive axial forces exceed a critical limit, buckling occurs; whereas two stages of buckling are known, the sinusoidal and the helical buckling. Assuming that the axial force exceeds the limit, failure can be the result. Thus, rotating a buckled drillstring should be avoided because the reversed bending stress will lead to rapid fatigue failure.
A sinusoidal configuration along the bottom of the hole is reached if the compressive force is increased on a length of pipe lying along the bottom of an inclined hole. If the compressive load is further increased, exceeding the sinusoidal buckling, helical buckling can be found, where the pipe forms a helix along the borehole wall with decreasing pitch as the compressive load is increasing. These two buckling modes can be seen in Figure 7-11 and the equations to calculate the buckling force can be found thereafter.[38]
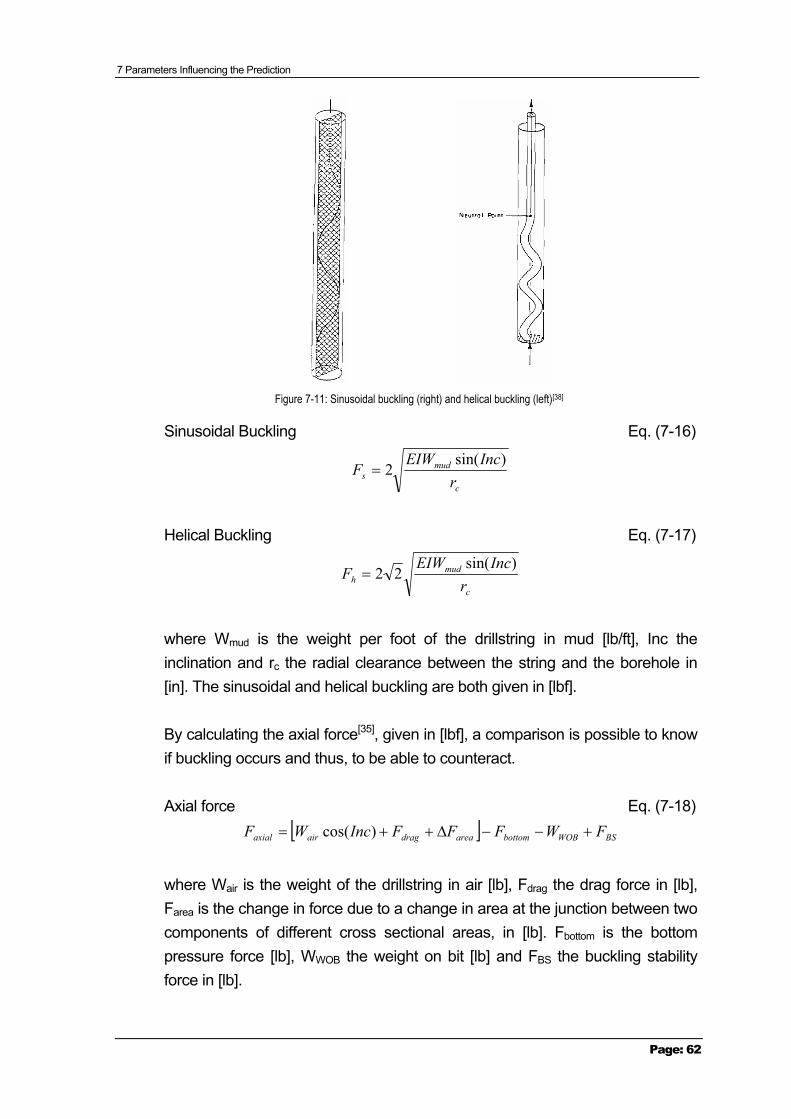
7 Parameters Influencing the Prediction
Page: 62
Figure 7-11: Sinusoidal buckling (right) and helical buckling (left)[38]
Sinusoidal Buckling Eq. (7-16)
c
muds r
IncEIWF
)sin(2=
Helical Buckling Eq. (7-17)
c
mudh r
IncEIWF
)sin(22=
where Wmud is the weight per foot of the drillstring in mud [lb/ft], Inc the inclination and rc the radial clearance between the string and the borehole in [in]. The sinusoidal and helical buckling are both given in [lbf].
By calculating the axial force[35], given in [lbf], a comparison is possible to know if buckling occurs and thus, to be able to counteract.
Axial force Eq. (7-18) [ ] BSWOBbottomareadragairaxial FWFFFIncWF +−−∆++= )cos(
where Wair is the weight of the drillstring in air [lb], Fdrag the drag force in [lb], Farea is the change in force due to a change in area at the junction between two components of different cross sectional areas, in [lb]. Fbottom is the bottom pressure force [lb], WWOB the weight on bit [lb] and FBS the buckling stability force in [lb].
7 Parameters Influencing the Prediction
Page: 63
These parameters can be easily calculated and their evaluation is already done in some models as for example in the torque and drag calculation of WellPlanTM from Landmark.
Nevertheless, it should be mentioned that the situation during drilling is not known and thus, no preventative actions can be taken to avoid any unwanted circumstances. If measure devices would be available, which allow getting information about the current situation downhole, many incidents could be avoided. This means a prediction is still possible but during the drilling process the detection of buckling or vibration is difficult.
7.3.2 Vibrations
Rotary speed at a critical value can cause vibrations in the drill string, occurring in a load spectrum, which often leads to wear, bent pipe or fatigue failure. These vibrations are of either axial or nodal type, whereas the first vibrates like a pendulum and the latter like a violin string. The critical speeds where vibrations can occur depend on size and length of the drillpipe.
The actual drilling RPM needs to be compared with the critical speed for axial vibration as well as with the one for nodal vibration and should stay below the calculated values to avoid failure. With the following equations the critical speed can be evaluated[35]:
Critical RPM for axial vibration Eq. (7-19)
LRPMa
000,258=
Critical RPM for nodal vibration Eq. (7-20)
2
22056,33S
IDODRPMn+
=
where L corresponds to the total length of the string [ft], and S to the length of one joint of pipe in [ft]. The outer and inner diameter (OD and ID) are given in [in].
In this case all the information needed is available thus, at least an assumption if failure may occur can be given. Nevertheless, the calculation methods are
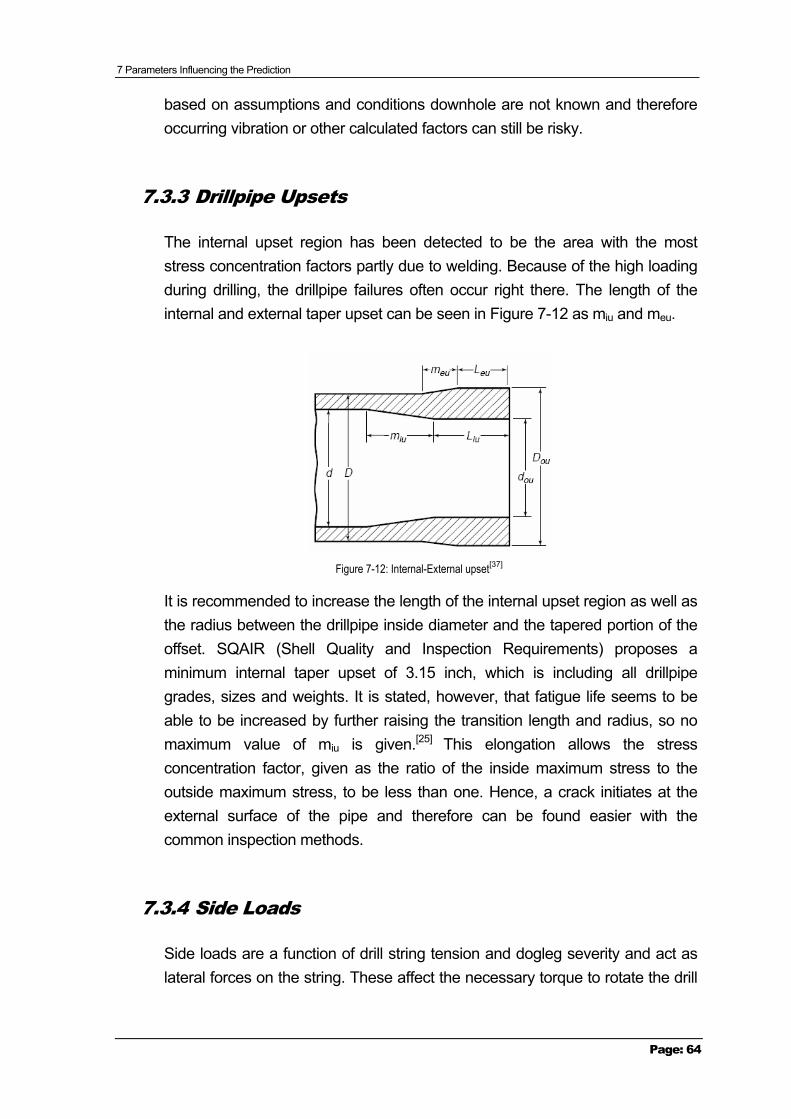
7 Parameters Influencing the Prediction
Page: 64
based on assumptions and conditions downhole are not known and therefore occurring vibration or other calculated factors can still be risky.
7.3.3 Drillpipe Upsets
The internal upset region has been detected to be the area with the most stress concentration factors partly due to welding. Because of the high loading during drilling, the drillpipe failures often occur right there. The length of the internal and external taper upset can be seen in Figure 7-12 as miu and meu.
Figure 7-12: Internal-External upset[37]
It is recommended to increase the length of the internal upset region as well as the radius between the drillpipe inside diameter and the tapered portion of the offset. SQAIR (Shell Quality and Inspection Requirements) proposes a minimum internal taper upset of 3.15 inch, which is including all drillpipe grades, sizes and weights. It is stated, however, that fatigue life seems to be able to be increased by further raising the transition length and radius, so no maximum value of miu is given.[25] This elongation allows the stress concentration factor, given as the ratio of the inside maximum stress to the outside maximum stress, to be less than one. Hence, a crack initiates at the external surface of the pipe and therefore can be found easier with the common inspection methods.
7.3.4 Side Loads
Side loads are a function of drill string tension and dogleg severity and act as lateral forces on the string. These affect the necessary torque to rotate the drill
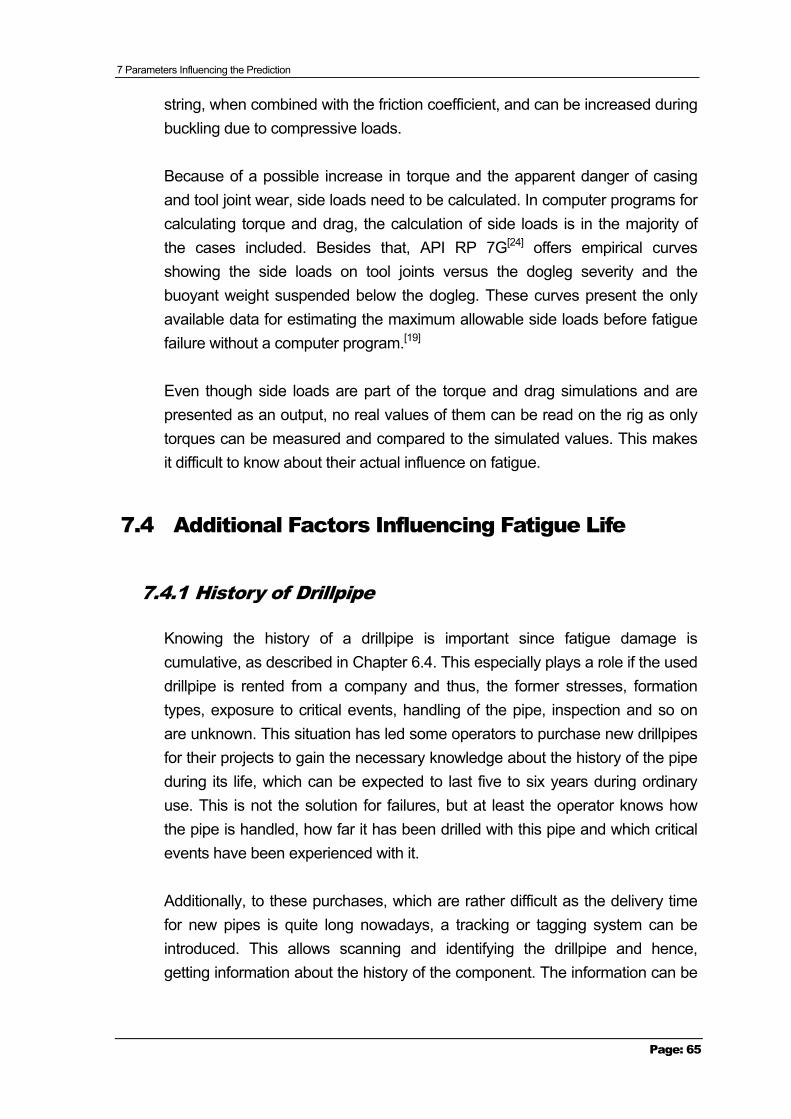
7 Parameters Influencing the Prediction
Page: 65
string, when combined with the friction coefficient, and can be increased during buckling due to compressive loads.
Because of a possible increase in torque and the apparent danger of casing and tool joint wear, side loads need to be calculated. In computer programs for calculating torque and drag, the calculation of side loads is in the majority of the cases included. Besides that, API RP 7G[24] offers empirical curves showing the side loads on tool joints versus the dogleg severity and the buoyant weight suspended below the dogleg. These curves present the only available data for estimating the maximum allowable side loads before fatigue failure without a computer program.[19]
Even though side loads are part of the torque and drag simulations and are presented as an output, no real values of them can be read on the rig as only torques can be measured and compared to the simulated values. This makes it difficult to know about their actual influence on fatigue.
7.4 Additional Factors Influencing Fatigue Life
7.4.1 History of Drillpipe
Knowing the history of a drillpipe is important since fatigue damage is cumulative, as described in Chapter 6.4. This especially plays a role if the used drillpipe is rented from a company and thus, the former stresses, formation types, exposure to critical events, handling of the pipe, inspection and so on are unknown. This situation has led some operators to purchase new drillpipes for their projects to gain the necessary knowledge about the history of the pipe during its life, which can be expected to last five to six years during ordinary use. This is not the solution for failures, but at least the operator knows how the pipe is handled, how far it has been drilled with this pipe and which critical events have been experienced with it.
Additionally, to these purchases, which are rather difficult as the delivery time for new pipes is quite long nowadays, a tracking or tagging system can be introduced. This allows scanning and identifying the drillpipe and hence, getting information about the history of the component. The information can be
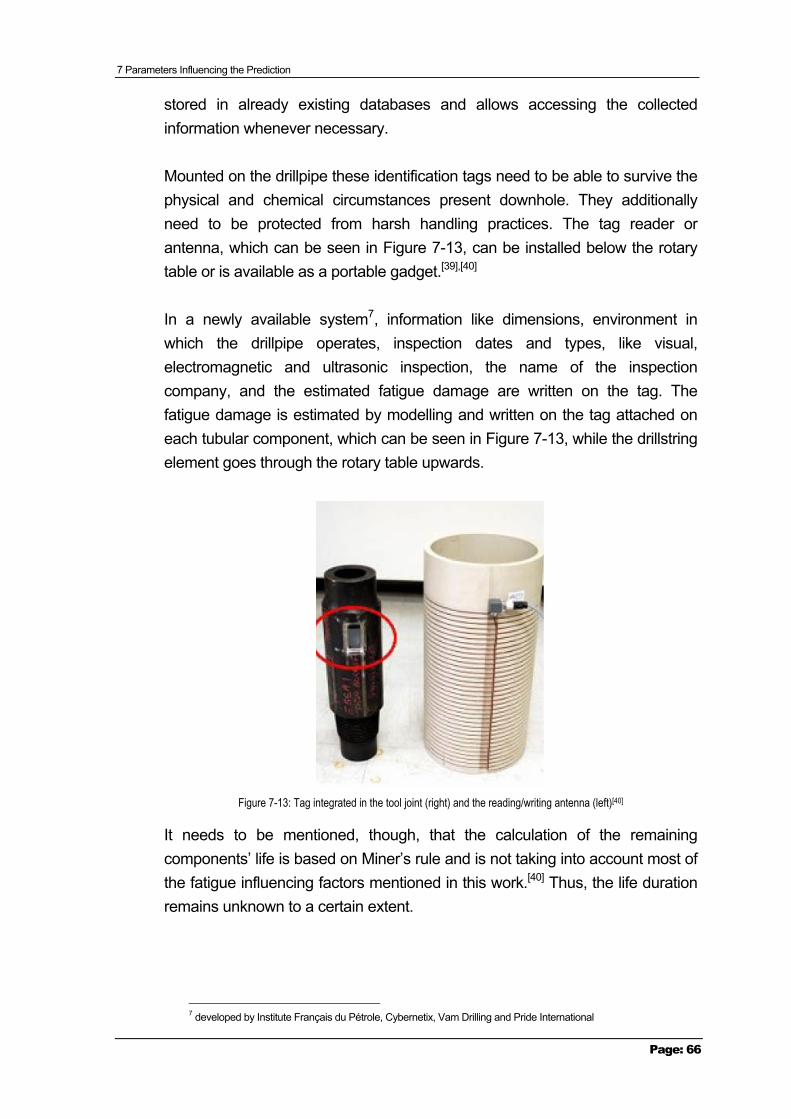
7 Parameters Influencing the Prediction
Page: 66
stored in already existing databases and allows accessing the collected information whenever necessary.
Mounted on the drillpipe these identification tags need to be able to survive the physical and chemical circumstances present downhole. They additionally need to be protected from harsh handling practices. The tag reader or antenna, which can be seen in Figure 7-13, can be installed below the rotary table or is available as a portable gadget.[39],[40]
In a newly available system7, information like dimensions, environment in which the drillpipe operates, inspection dates and types, like visual, electromagnetic and ultrasonic inspection, the name of the inspection company, and the estimated fatigue damage are written on the tag. The fatigue damage is estimated by modelling and written on the tag attached on each tubular component, which can be seen in Figure 7-13, while the drillstring element goes through the rotary table upwards.
Figure 7-13: Tag integrated in the tool joint (right) and the reading/writing antenna (left)[40]
It needs to be mentioned, though, that the calculation of the remaining components’ life is based on Miner’s rule and is not taking into account most of the fatigue influencing factors mentioned in this work.[40] Thus, the life duration remains unknown to a certain extent.
7 developed by Institute Français du Pétrole, Cybernetix, Vam Drilling and Pride International
7 Parameters Influencing the Prediction
Page: 67
Nevertheless, it is shown that a solution is possible to know the history of the drillpipe and be able to react on potentially fatigue life shortening events by reducing the operational duration of the affected components.
7.4.2 Critical Events
Critical events can occur and are sometimes difficult to avoid. Therefore an impact on failure life due to these cannot be excluded and some of the possible events will be mentioned. Furthermore, recording which joints where subjected to critical events is necessary in order to establish a prognosis about the life duration of the pipe.
As discussed before overtorque on tool joint connections should be avoided as this can lead to belled boxes, stretched pins or even twist offs. Cold welding, though, where two surfaces of similar metal strongly adhere to each other is no problem for fatigue and thus, is not influencing the components’ life duration.[62] Hence, it needs to be differentiated between cold welding and overtorque to know if failure may happen. The last mentioned can result from an irregular torque during the drilling procedure in, for instance, extended reach wells. Undertorque on the same side can lead to washouts or even separation of the connections.
Another critical event is the pulling on a stuck pipe, which gets especially dangerous if small diameter pipes are used as the tensile yield strength has a lower value for pipes with a smaller diameter than for the ones with larger diameter. However, as was mentioned before, pulling the stuck drillstring can additionally raise the friction coefficient and thus, lead to frictional heating and drillpipe failure.
7.4.3 Stiffness Ratio
A stiffness ratio should be calculated if a connection of for example drill collars to limber components as drillpipes needs to be done. These crossings are known to assist in creating failure and therefore a stiffness ratio lower than 3.5 should be aimed for. The ratio is given by the section modulus of the larger component below the change in diameter over the section modulus of the
7 Parameters Influencing the Prediction
Page: 68
smaller component above the crossing. For calculation the tube diameter is taken.[35],[36]
This ratio, though, does not apply to changes between different drillpipe sections and shows a simple way of calculations to prevent failure due to uncared changes in stiffness of the components.
7.4.4 Dimensions of the Drillpipe
Dimensions of the drillpipe are influencing failure as well as other criteria. Often some dimensional parameters cannot be chosen as the drillpipe is rented from another company but nevertheless, the effect should be considered.
Especially two parameters should be thought of; one is the wall thickness tolerance and the other the drillpipe length. The first one shows again the obsolescence of API, as it recommends a wall thickness tolerance of 12.5%. This, though, reduces the margin for corrosion, erosion and mechanical damage before the pipe is reclassified. In some situations, where strong erosion occurs, like for example in a dogleg, and may fatigue to a certain extent pre-existed, failure can occur without recognizing the reduction in wall thickness before.[43] Therefore a maximum tolerance of 5% should be aimed for, which is already often done.
The second parameter, the drillpipe length affects torque as well as wear as the longer drillpipe, for instance a range III (13.5 m – 14.8 m) instead a range II (9.2 m – 10.2 m) drillpipe, creates a larger contact area in the middle of each joint.[44]
Furthermore, it needs to be mentioned that the drillpipe diameter indirectly also influences failure. In some operations, like Through-Tubing Rotary Drilling for example, the diameter used is smaller than usual. Thus, in these cases the pipe is more exposed to wear or corrosion. Besides that, the torsional and tensile strength of these smaller pipes is less and therefore this should be especially considered when drilling through high doglegs as the make up torque may be affected.
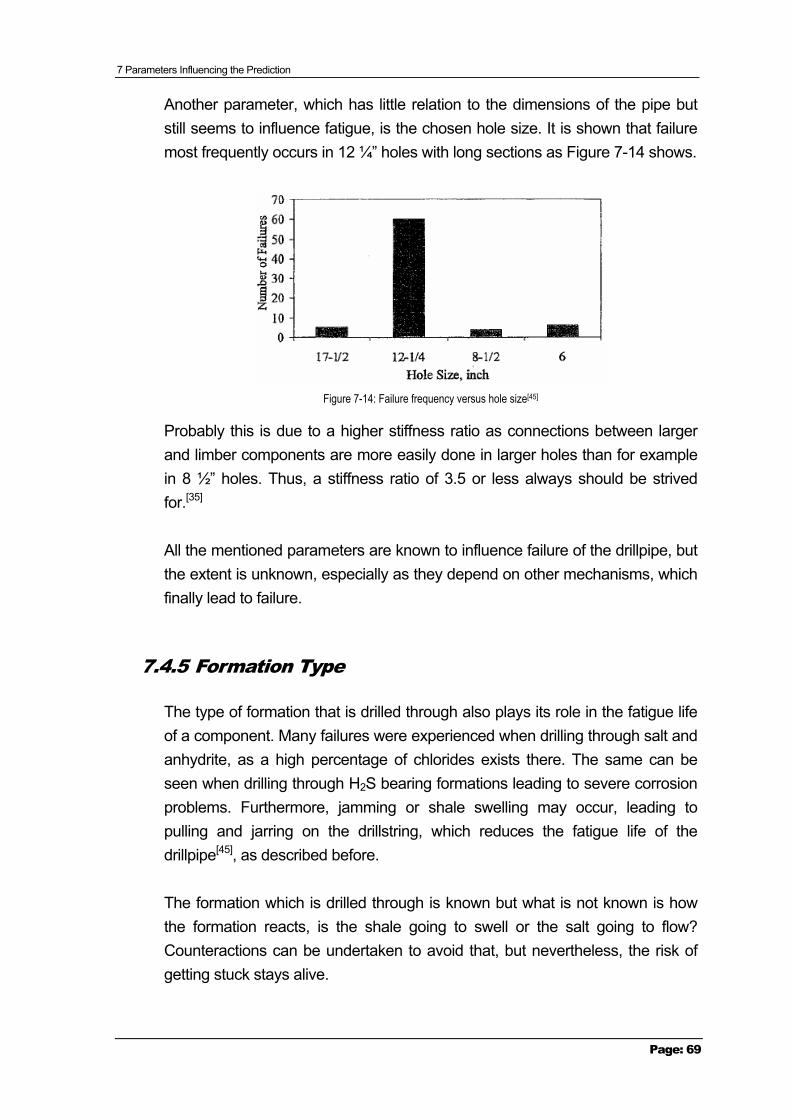
7 Parameters Influencing the Prediction
Page: 69
Another parameter, which has little relation to the dimensions of the pipe but still seems to influence fatigue, is the chosen hole size. It is shown that failure most frequently occurs in 12 ¼” holes with long sections as Figure 7-14 shows.
Figure 7-14: Failure frequency versus hole size[45]
Probably this is due to a higher stiffness ratio as connections between larger and limber components are more easily done in larger holes than for example in 8 ½” holes. Thus, a stiffness ratio of 3.5 or less always should be strived for.[35]
All the mentioned parameters are known to influence failure of the drillpipe, but the extent is unknown, especially as they depend on other mechanisms, which finally lead to failure.
7.4.5 Formation Type
The type of formation that is drilled through also plays its role in the fatigue life of a component. Many failures were experienced when drilling through salt and anhydrite, as a high percentage of chlorides exists there. The same can be seen when drilling through H2S bearing formations leading to severe corrosion problems. Furthermore, jamming or shale swelling may occur, leading to pulling and jarring on the drillstring, which reduces the fatigue life of the drillpipe[45], as described before.
The formation which is drilled through is known but what is not known is how the formation reacts, is the shale going to swell or the salt going to flow? Counteractions can be undertaken to avoid that, but nevertheless, the risk of getting stuck stays alive.
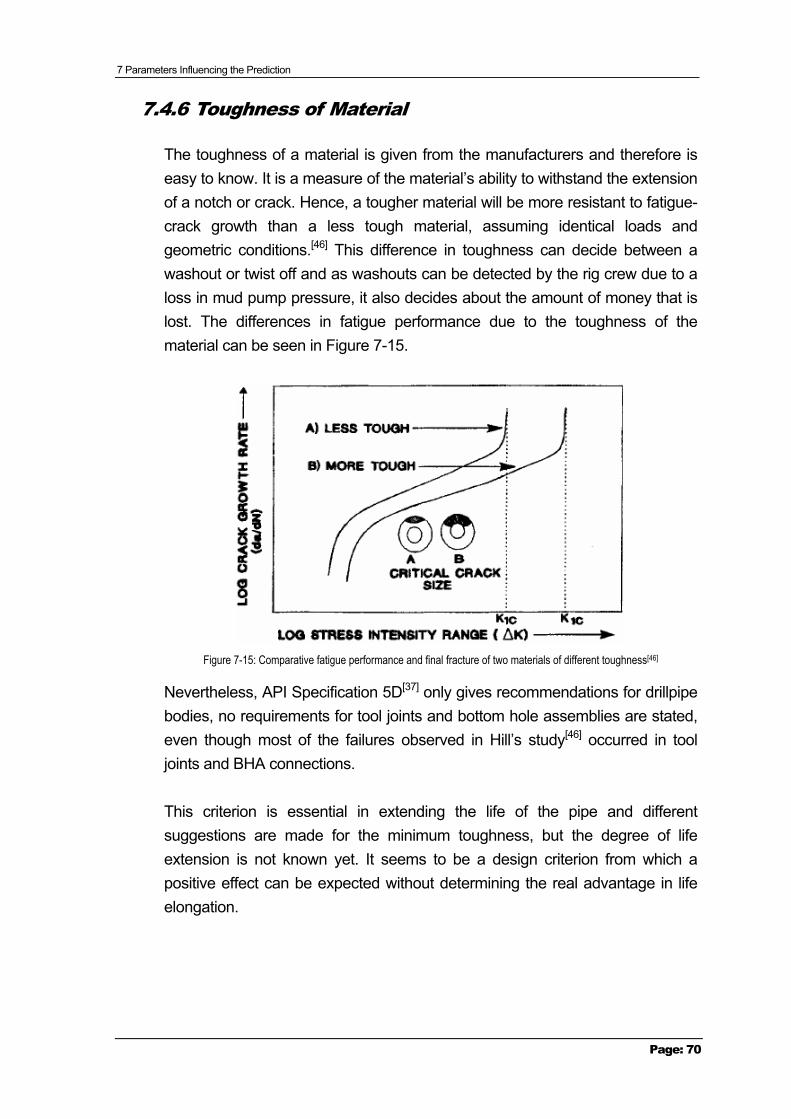
7 Parameters Influencing the Prediction
Page: 70
7.4.6 Toughness of Material
The toughness of a material is given from the manufacturers and therefore is easy to know. It is a measure of the material’s ability to withstand the extension of a notch or crack. Hence, a tougher material will be more resistant to fatigue-crack growth than a less tough material, assuming identical loads and geometric conditions.[46] This difference in toughness can decide between a washout or twist off and as washouts can be detected by the rig crew due to a loss in mud pump pressure, it also decides about the amount of money that is lost. The differences in fatigue performance due to the toughness of the material can be seen in Figure 7-15.
Figure 7-15: Comparative fatigue performance and final fracture of two materials of different toughness[46]
Nevertheless, API Specification 5D[37] only gives recommendations for drillpipe bodies, no requirements for tool joints and bottom hole assemblies are stated, even though most of the failures observed in Hill’s study[46] occurred in tool joints and BHA connections.
This criterion is essential in extending the life of the pipe and different suggestions are made for the minimum toughness, but the degree of life extension is not known yet. It seems to be a design criterion from which a positive effect can be expected without determining the real advantage in life elongation.
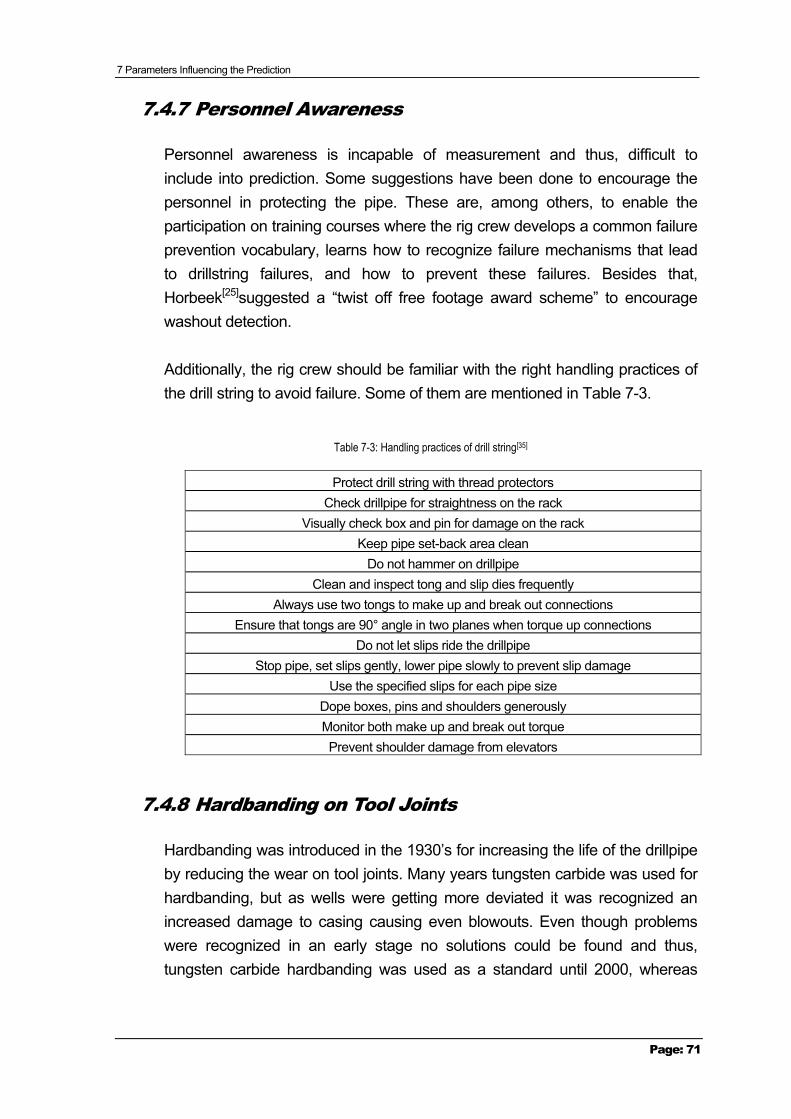
7 Parameters Influencing the Prediction
Page: 71
7.4.7 Personnel Awareness
Personnel awareness is incapable of measurement and thus, difficult to include into prediction. Some suggestions have been done to encourage the personnel in protecting the pipe. These are, among others, to enable the participation on training courses where the rig crew develops a common failure prevention vocabulary, learns how to recognize failure mechanisms that lead to drillstring failures, and how to prevent these failures. Besides that, Horbeek[25]suggested a “twist off free footage award scheme” to encourage washout detection.
Additionally, the rig crew should be familiar with the right handling practices of the drill string to avoid failure. Some of them are mentioned in Table 7-3.
Table 7-3: Handling practices of drill string[35]
Protect drill string with thread protectors Check drillpipe for straightness on the rack
Visually check box and pin for damage on the rack Keep pipe set-back area clean
Do not hammer on drillpipe Clean and inspect tong and slip dies frequently
Always use two tongs to make up and break out connections Ensure that tongs are 90° angle in two planes when torque up connections
Do not let slips ride the drillpipe Stop pipe, set slips gently, lower pipe slowly to prevent slip damage
Use the specified slips for each pipe size Dope boxes, pins and shoulders generously Monitor both make up and break out torque Prevent shoulder damage from elevators
7.4.8 Hardbanding on Tool Joints
Hardbanding was introduced in the 1930’s for increasing the life of the drillpipe by reducing the wear on tool joints. Many years tungsten carbide was used for hardbanding, but as wells were getting more deviated it was recognized an increased damage to casing causing even blowouts. Even though problems were recognized in an early stage no solutions could be found and thus, tungsten carbide hardbanding was used as a standard until 2000, whereas
7 Parameters Influencing the Prediction
Page: 72
Statoil abandoned it around 1990[62]. Nowadays the norm is to use casing-friendly hardbandings.
These casing-friendly hardbandings present a lower friction coefficient, hence, causing less wear on the tool joint as well as on the casing. Nevertheless, hardbanding only reduces the amount of wear, it’s not able to eliminate it as it is getting rubbed off the surface with time. Another benefit, though, is that hardbanding lowers the torque during drilling and tripping due to a polishing effect.[34]
Summarizing the benefits of hardbanding are to lower the wear on the tool joint in open hole as well as in the casing, to lower the wear on the casing, especially in deviated or horizontal wells and to reduce the friction, which is of special importance in extended reach drilling. Reduction of wear in completion tubings or blow out preventers in TTRD operations also comes along with this application.
It is known to be beneficial for drillpipe life to apply hardbanding, it reduces for example torque if it’s smooth fabricated, but it is not known to which extent the life can be elongated. Although comparisons of different materials for hardbanding have been done, this is no help in the evaluation of its positive effect.
7.5 Approach to a Prediction Model
As already could be seen during the precedent discussion, it is difficult to develop a model since most of the factors are influencing each other in some manner and are not known yet. To make it more understandable some charts were created showing which factors are needed to find out about the remaining life of a drillpipe. Nevertheless, it should be said that these charts can be pursued to an endless stage, thus, it was decided to stop at one point.
The charts are divided into the pipe body and the tool joint as the fatigue life of these two is influenced by different parameters. The stresses acting on body and tool joint and the occurring stress raisers for them are shown in the Appendix, in Figures 13-3 to 13-6, where it was tried to highlight which factors are already known and which still need to be investigated. The first mentioned are shown in green colours, the others in red. Besides that, it should be
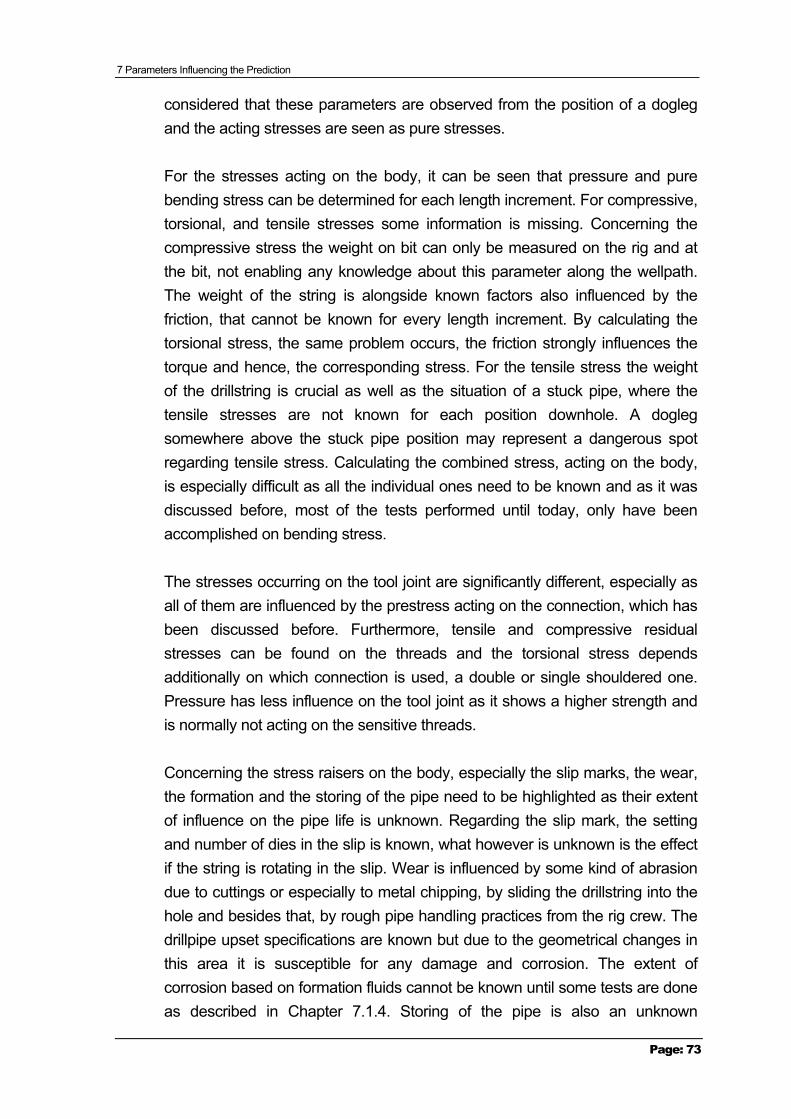
7 Parameters Influencing the Prediction
Page: 73
considered that these parameters are observed from the position of a dogleg and the acting stresses are seen as pure stresses.
For the stresses acting on the body, it can be seen that pressure and pure bending stress can be determined for each length increment. For compressive, torsional, and tensile stresses some information is missing. Concerning the compressive stress the weight on bit can only be measured on the rig and at the bit, not enabling any knowledge about this parameter along the wellpath. The weight of the string is alongside known factors also influenced by the friction, that cannot be known for every length increment. By calculating the torsional stress, the same problem occurs, the friction strongly influences the torque and hence, the corresponding stress. For the tensile stress the weight of the drillstring is crucial as well as the situation of a stuck pipe, where the tensile stresses are not known for each position downhole. A dogleg somewhere above the stuck pipe position may represent a dangerous spot regarding tensile stress. Calculating the combined stress, acting on the body, is especially difficult as all the individual ones need to be known and as it was discussed before, most of the tests performed until today, only have been accomplished on bending stress.
The stresses occurring on the tool joint are significantly different, especially as all of them are influenced by the prestress acting on the connection, which has been discussed before. Furthermore, tensile and compressive residual stresses can be found on the threads and the torsional stress depends additionally on which connection is used, a double or single shouldered one. Pressure has less influence on the tool joint as it shows a higher strength and is normally not acting on the sensitive threads.
Concerning the stress raisers on the body, especially the slip marks, the wear, the formation and the storing of the pipe need to be highlighted as their extent of influence on the pipe life is unknown. Regarding the slip mark, the setting and number of dies in the slip is known, what however is unknown is the effect if the string is rotating in the slip. Wear is influenced by some kind of abrasion due to cuttings or especially to metal chipping, by sliding the drillstring into the hole and besides that, by rough pipe handling practices from the rig crew. The drillpipe upset specifications are known but due to the geometrical changes in this area it is susceptible for any damage and corrosion. The extent of corrosion based on formation fluids cannot be known until some tests are done as described in Chapter 7.1.4. Storing of the pipe is also an unknown
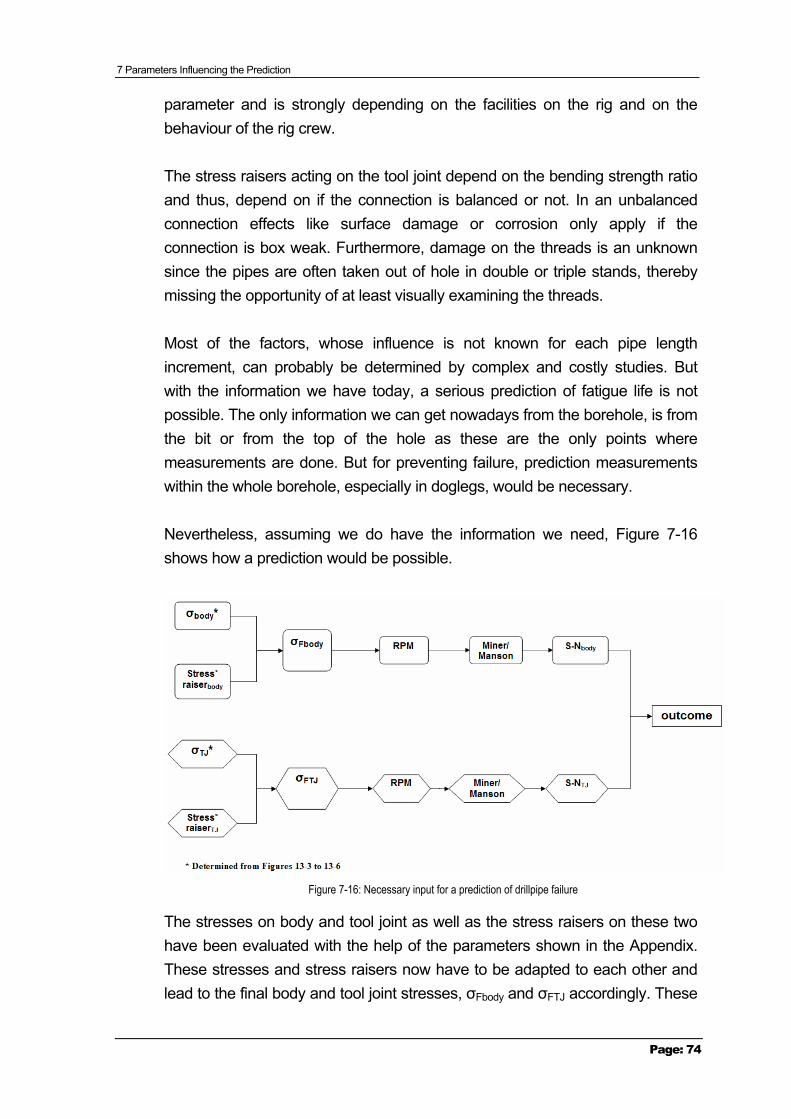
7 Parameters Influencing the Prediction
Page: 74
parameter and is strongly depending on the facilities on the rig and on the behaviour of the rig crew.
The stress raisers acting on the tool joint depend on the bending strength ratio and thus, depend on if the connection is balanced or not. In an unbalanced connection effects like surface damage or corrosion only apply if the connection is box weak. Furthermore, damage on the threads is an unknown since the pipes are often taken out of hole in double or triple stands, thereby missing the opportunity of at least visually examining the threads.
Most of the factors, whose influence is not known for each pipe length increment, can probably be determined by complex and costly studies. But with the information we have today, a serious prediction of fatigue life is not possible. The only information we can get nowadays from the borehole, is from the bit or from the top of the hole as these are the only points where measurements are done. But for preventing failure, prediction measurements within the whole borehole, especially in doglegs, would be necessary.
Nevertheless, assuming we do have the information we need, Figure 7-16 shows how a prediction would be possible.
Figure 7-16: Necessary input for a prediction of drillpipe failure
The stresses on body and tool joint as well as the stress raisers on these two have been evaluated with the help of the parameters shown in the Appendix. These stresses and stress raisers now have to be adapted to each other and lead to the final body and tool joint stresses, σFbody and σFTJ accordingly. These
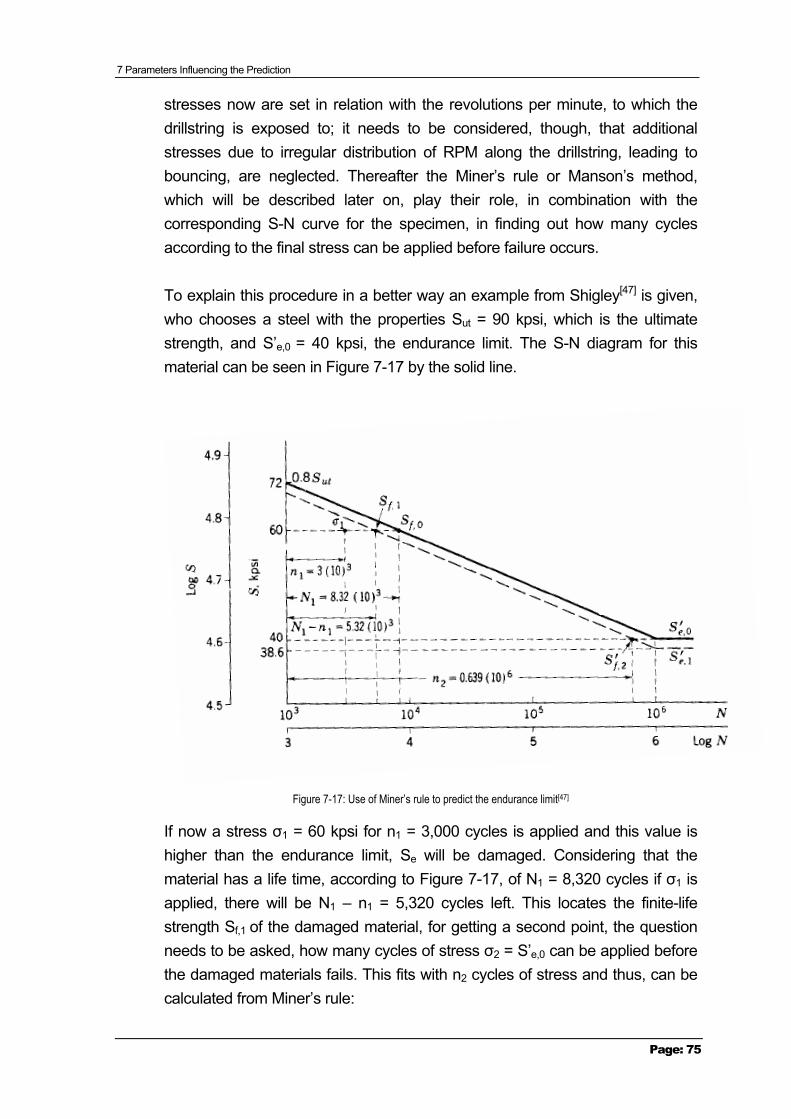
7 Parameters Influencing the Prediction
Page: 75
stresses now are set in relation with the revolutions per minute, to which the drillstring is exposed to; it needs to be considered, though, that additional stresses due to irregular distribution of RPM along the drillstring, leading to bouncing, are neglected. Thereafter the Miner’s rule or Manson’s method, which will be described later on, play their role, in combination with the corresponding S-N curve for the specimen, in finding out how many cycles according to the final stress can be applied before failure occurs.
To explain this procedure in a better way an example from Shigley[47] is given, who chooses a steel with the properties Sut = 90 kpsi, which is the ultimate strength, and S’e,0 = 40 kpsi, the endurance limit. The S-N diagram for this material can be seen in Figure 7-17 by the solid line.
Figure 7-17: Use of Miner’s rule to predict the endurance limit[47]
If now a stress σ1 = 60 kpsi for n1 = 3,000 cycles is applied and this value is higher than the endurance limit, Se will be damaged. Considering that the material has a life time, according to Figure 7-17, of N1 = 8,320 cycles if σ1 is applied, there will be N1 – n1 = 5,320 cycles left. This locates the finite-life strength Sf,1 of the damaged material, for getting a second point, the question needs to be asked, how many cycles of stress σ2 = S’e,0 can be applied before the damaged materials fails. This fits with n2 cycles of stress and thus, can be calculated from Miner’s rule:
7 Parameters Influencing the Prediction
Page: 76
Miner’s rule Eq. (7-21)
12
2
1
1 =+Nn
Nn
Determining n2 corresponds to the second point, the finite-life strength Sf,2 in Figure 7-17. A new line (dashed in Figure 7-17) through these points will give the S-N curve for the damaged material. This procedure can be applied for each time the final stresses change and a new S-N curve needs to be determined.
The Miner’s rule, however, fails in two points, which are determined by experiment. First, this theory states, that the ultimate strength is decreased because of σ1, as can be seen at N = 10³ cycles. This prediction is not verified by experiments. Second, Miner’s rule is not defining the order of the applied stresses and thus, disregards stresses less than S’e,0. Nevertheless, it can be seen that a stress σ3 in the range S’e,1 < σ3 > S’e,0 causes damage if applied after the endurance limit had been damaged by σ1.
Manson’s attempt, however, found a solution for these two deficiencies. Figure 7-18 shows a slightly modified diagram for Manson as the intersection of N = 10³ cycles with S = 0.8Sut is arbitrarily selected and not determined by experiment, as Manson did. This method consists of having both lines, for the damaged as well as for the virgin material, converge at the same point. Furthermore, the lines must be build in the same order in which the stresses occur.
Figure 7-18: Use of Manson’s method to predict the endurance limit[47]
7 Parameters Influencing the Prediction
Page: 77
Figure 7-18 uses the same values as for the foregoing example. The finite-life strength Sf,1 is found in the same way as before. Through this point and through 0.8Sut at 10³ cycles the heavy dashed line is drawn to N = 106 cycles and hence, defines the S-N diagram for the damaged material. It can now be seen that a stress of σ = 36 kpsi would not harm the endurance limit of the virgin material, but it would harm, if σ is applied after the material had been damaged by σ1 = 60 kpsi.[47] Again this procedure can be applied for each time the final stresses change and a new S-N curve needs to be determined.
The results obtained from the pipe body and the tool joint are compared with each other and the one, which is more likely to fail first will be taken as bench mark.
It needs to be taken into consideration, though, that design parameters like the toughness of the steel, the stiffness ratio or the thread form are additionally influencing the life of the drillpipe and therefore their effects should be tested, evaluated and included into the model.
This discussion shows the complexity of drillpipe failure and the difficulty in predicting it. This may explains why there have been so many attempts in building such a model without reasonable success as only some parameters have been considered. Further investigations need to be done to be able to understand this complex process and insert it into some kind of forecast.
8 Inspection of Drillpipe
Page: 78
8 Inspection of Drillpipe
Inspection generally means to examine a single drillstring component and thus, to ensure the metallurgical and dimensional attributes of this part as well as to detect possible cracks to be able to reject this component before a failure happens.
Inspection can be divided into three steps: First it will be decided on the acceptance criteria, second the inspection methods are chosen and third it needs to be ensured that the inspections are correctly accomplished. Acceptance criteria for used drillpipes were first written in API RP 7G[24] and aid the industry to classify drillpipes according to their tear and wear. Originally five classes, from class one, the new pipe, to class five, the junk, were established and later completed by the Premium class between class one and two. Furthermore, the pipe is classified based on several attributes, which will be examined during inspection and subsequent the pipe is graded at the highest class at which all necessary attributes are met or exceeded. Nowadays class three, four and sometimes even two are considered to be too worn for use.
The objectives of inspection are on one side to ensure an appropriate load capacity in each component, which is determined by pipe grade, inner and outer diameter of the component and the tube wall thickness and on the other side to reject components showing fatigue cracks or having a high risk of developing them.[22]
It should be considered, though, that the available inspection methods are sufficient to achieve the requirements demanded from the standards, but, as mentioned in Chapter 6.5, are not good enough to recognize cracks at an early stage and thus, inspection may come too late for preventing washouts or twist offs. Furthermore, some important properties of a new drillstring are not even mentioned in API, which can be seen in Tables 8-1 and 8-2, where first the important properties of drillstring components are listed and then the properties, covered by API, can be seen.
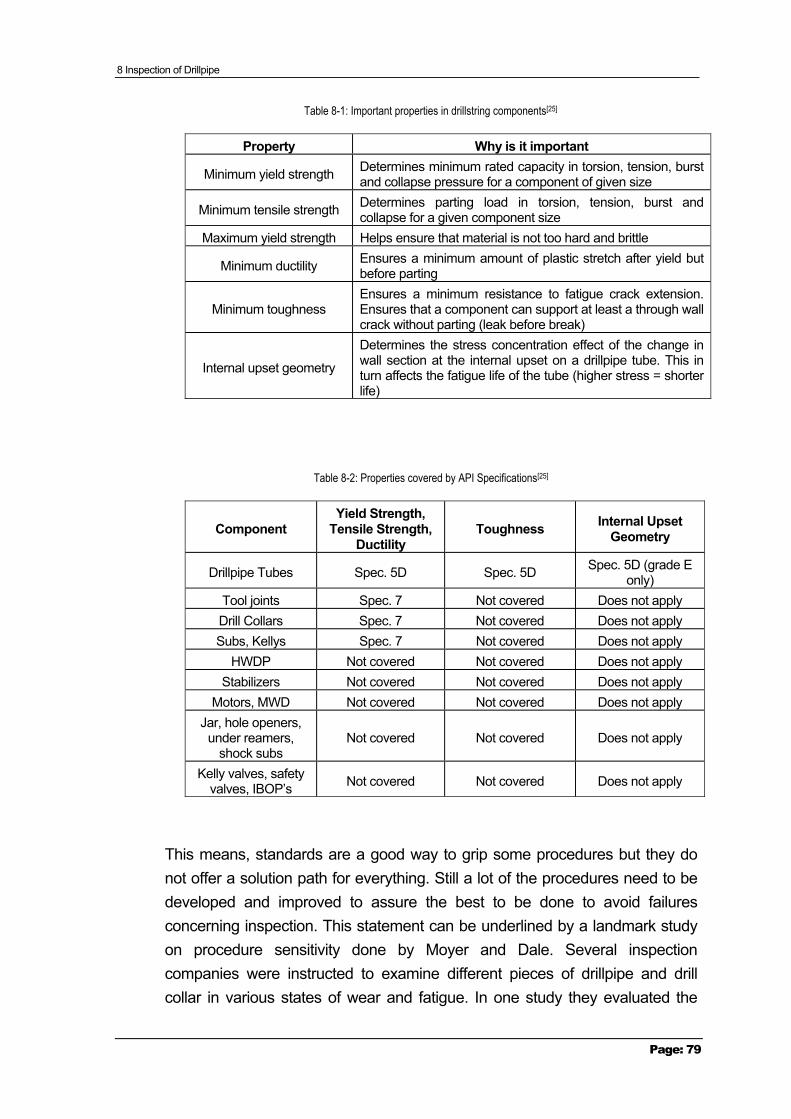
8 Inspection of Drillpipe
Page: 79
Table 8-1: Important properties in drillstring components[25]
Property Why is it important
Minimum yield strength Determines minimum rated capacity in torsion, tension, burst and collapse pressure for a component of given size
Minimum tensile strength Determines parting load in torsion, tension, burst and collapse for a given component size
Maximum yield strength Helps ensure that material is not too hard and brittle
Minimum ductility Ensures a minimum amount of plastic stretch after yield but before parting
Minimum toughness Ensures a minimum resistance to fatigue crack extension. Ensures that a component can support at least a through wall crack without parting (leak before break)
Internal upset geometry
Determines the stress concentration effect of the change in wall section at the internal upset on a drillpipe tube. This in turn affects the fatigue life of the tube (higher stress = shorter life)
Table 8-2: Properties covered by API Specifications[25]
Component Yield Strength,
Tensile Strength, Ductility
Toughness Internal Upset Geometry
Drillpipe Tubes Spec. 5D Spec. 5D Spec. 5D (grade E only)
Tool joints Spec. 7 Not covered Does not apply Drill Collars Spec. 7 Not covered Does not apply Subs, Kellys Spec. 7 Not covered Does not apply
HWDP Not covered Not covered Does not apply Stabilizers Not covered Not covered Does not apply
Motors, MWD Not covered Not covered Does not apply Jar, hole openers,
under reamers, shock subs
Not covered Not covered Does not apply
Kelly valves, safety valves, IBOP’s Not covered Not covered Does not apply
This means, standards are a good way to grip some procedures but they do not offer a solution path for everything. Still a lot of the procedures need to be developed and improved to assure the best to be done to avoid failures concerning inspection. This statement can be underlined by a landmark study on procedure sensitivity done by Moyer and Dale. Several inspection companies were instructed to examine different pieces of drillpipe and drill collar in various states of wear and fatigue. In one study they evaluated the
8 Inspection of Drillpipe
Page: 80
probability that inspection companies will find cracks in drill collar connections. As an acceptance criterion the absence of any fatigue cracks in connections was given, which means every component with a crack, independent how big it was, needed to be rejected. The inspection was done using black-light. The study shows the differences in quality of commercial black-light inspection and black-light inspection done by the two researchers and the result was an increased probability of 10 to 20% that very large cracks and 400% that very small cracks were found by Moyer and Dale compared to the commercial inspection companies.[22] Consequentially can be seen that trying to minimize inspection costs will result in a loss of procedure control and thus, in inspection quality. Additionally it needs to be mentioned that humans may make mistakes in interpreting pictures of inspection again leading to a bad inspection quality.
8.1 Standards in the Oil Industry
To simplify the communication and improve the performance of transactions between manufacturers, buyers and users standards have been developed. Thereby three different standards for inspection are used by the industry; the DS-1 standard[22], the NS-2 standard[23] and the inspection procedure mentioned in API RP 7G[24]. In the following only the DS-1 and NS-2 standard will be described further, as API RP 7G does not mention the second step in inspection, the choice of the inspection method, and hence, does not seem to be the best standard to use.
8.1.1 DS-1 Standard
As discussed above API RP 7G is giving acceptance criteria, but is not covering the procedures to evaluate these criteria. Therefore, to supplement API RP 7G a new standard, DS-1, was published in 1992 under the sponsorship of the Drilling Engineers Association as DEA Project 74, whereas the acceptance criteria of RP 7G were taken unchanged into DS-1.
Generally 31 inspection methods can be done by either the rig crew or the inspection company and many of these methods are specific to a certain component. The inspection program is set by the customer and should consist of the following: the list of equipment which should be examined; guidelines from the customer which methods should be used for each component;
8 Inspection of Drillpipe
Page: 81
instructions, which attributes must be met or exceeded to keep a component; and the time interval between inspections. DS-1 defines six different service categories to ease the decision of the right method by the customer. Category one applies for routine wells in developed areas, which means that if failure happens the cost will be minimal, thus, intensive inspection would not be economically. Category five is used in severe drilling conditions, where intense inspection is justified by very high cost if failure occurs. The sixth category is called HDLS and regards heavy duty landing strings.
In service categories four and five DS-1 determines a few attributes, which are assumed or ignored in RP 7G and thus, the drillpipe inspected under standard DS-1 may be rejected while may be accepted by using RP 7G.[22]
8.1.2 NS-2 Standard
The North Sea Drilling Standard was originally used by Exxon in the USA and then was handed to Shell Expro to be part of a project to reduce drill string failures. In 1999 O.C.T.G. Procter owned the standard to develop it further and spread it to the industry for a wider use. Basically the DS-1 and NS-2 standard are the same; the only differences can be found in the inspection categories: The DS-1 offers five whereas the NS-2 standard has no subcategories and accomplishes only one matching the highest category of the DS-1, thus, assuming the most severe drilling condition, to which the drillstring is exposed to.[23]
8.2 Inspection Methods
Inspection is done by non-destructive tests, which means that the components are not damaged during inspection. Common methods for drillpipes and BHA will be shown in Table 8-3 and thereafter explained.
8 Inspection of Drillpipe
Page: 82
Table 8-3: Common inspection methods for used drillpipes and BHA components[19]
8.2.1 Visual Inspection
Visual inspections always should take place as they can detect larger fatigue cracks or damage on threads. This inspection should be done on the upset external surface, the seal and the threads; furthermore, the hardbanding, the box shoulder width, the tong space and the shoulder flatness should be controlled as well as if box swell or pin stretch took place. This surface examination needs to be done both on the inside and on the outside of the drillpipe, whereas crooked pipes need to be rejected.
Furthermore, the conditions after refacing need to be examined, especially if the pitch diameter of the pin or box threads is equal to avoid thread interference and possible leakage.
Nevertheless, visual inspection is not able to detect discontinuities on the pipe and therefore additional inspection methods should be applied.[19]
8 Inspection of Drillpipe
Page: 83
8.2.2 Electromagnetic Inspection
8.2.2.1 Electromagnetic Inspection (EMI)
Electromagnetic inspection locates three dimensional flaws and therefore is widespread. The system consists of a motorized drive unit which has an inspection head scanner, encircled by an active field DC electromagnet. This head sends signals from suspected damaged spots to the chart recorder that shows them graphically, while moving along the pipe. When the head passes over a discontinuity in the induced magnetic flux path, a wire search coil may be stimulated with a voltage in any of eight shoes located in the head. These search coils, however, may send incorrect signals due to abrupt changes in wall thickness at the transition zone.
For the detection of corrosion pitting a magnetization of the pipe is used, which is developed by stationary coil arrays, distributed around the pipe and driven by computer controlled currents to achieve a rotating magnetic field. Separate stationary coil arrays are then detecting the signals; this process is based on the magnetic flux leakage method.[19]
8.2.2.2 Magnetic Particle Inspection (MPI)
This method, the wet fluorescent magnetic particle or black-light inspection, is used to detect transverse surface flaws in tool joints. A magnetic flux, which leaks in the presence of an unsteadiness like a crack, is created by an AC coil, an AC yoke or a DC coil. Because of this flux leakage soft iron particles, suspended in a liquid medium and sprayed on the tested component, get attracted and held in place. If the component is then examined under ultraviolet or black light, the iron particles, which are coated with a fluorescent material, will shine bright as seen in Figure 8-1.
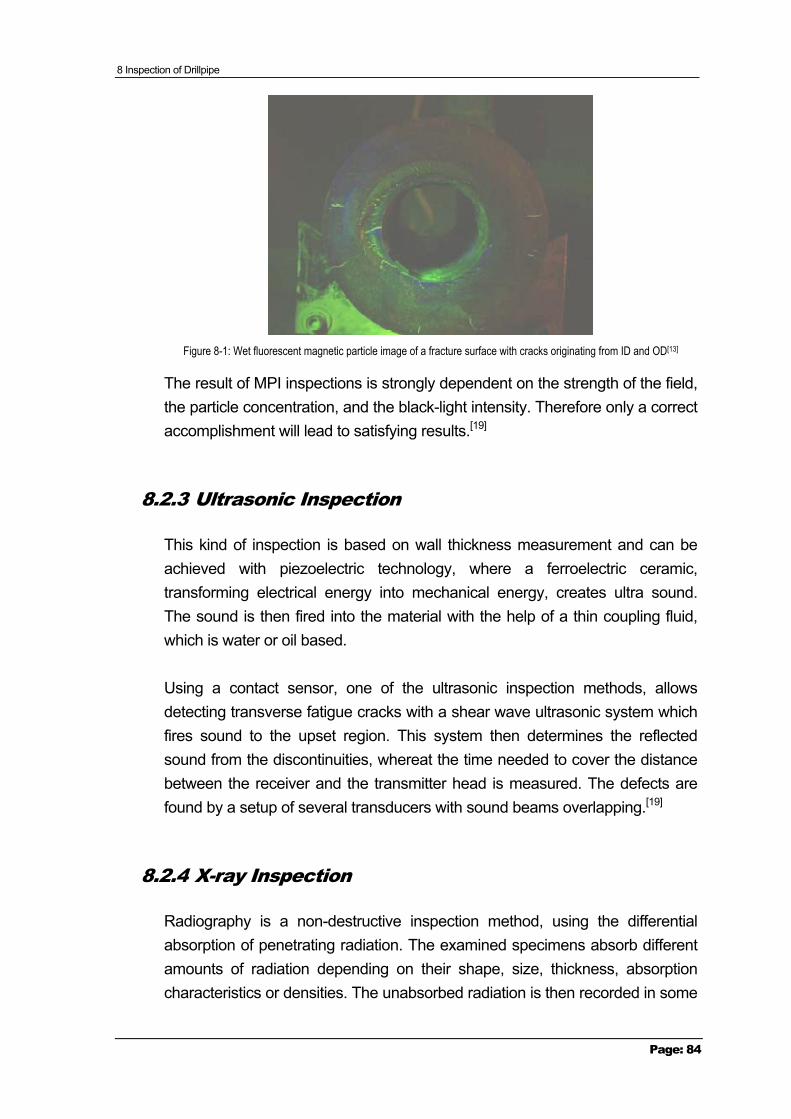
8 Inspection of Drillpipe
Page: 84
Figure 8-1: Wet fluorescent magnetic particle image of a fracture surface with cracks originating from ID and OD[13]
The result of MPI inspections is strongly dependent on the strength of the field, the particle concentration, and the black-light intensity. Therefore only a correct accomplishment will lead to satisfying results.[19]
8.2.3 Ultrasonic Inspection
This kind of inspection is based on wall thickness measurement and can be achieved with piezoelectric technology, where a ferroelectric ceramic, transforming electrical energy into mechanical energy, creates ultra sound. The sound is then fired into the material with the help of a thin coupling fluid, which is water or oil based.
Using a contact sensor, one of the ultrasonic inspection methods, allows detecting transverse fatigue cracks with a shear wave ultrasonic system which fires sound to the upset region. This system then determines the reflected sound from the discontinuities, whereat the time needed to cover the distance between the receiver and the transmitter head is measured. The defects are found by a setup of several transducers with sound beams overlapping.[19]
8.2.4 X-ray Inspection
Radiography is a non-destructive inspection method, using the differential absorption of penetrating radiation. The examined specimens absorb different amounts of radiation depending on their shape, size, thickness, absorption characteristics or densities. The unabsorbed radiation is then recorded in some
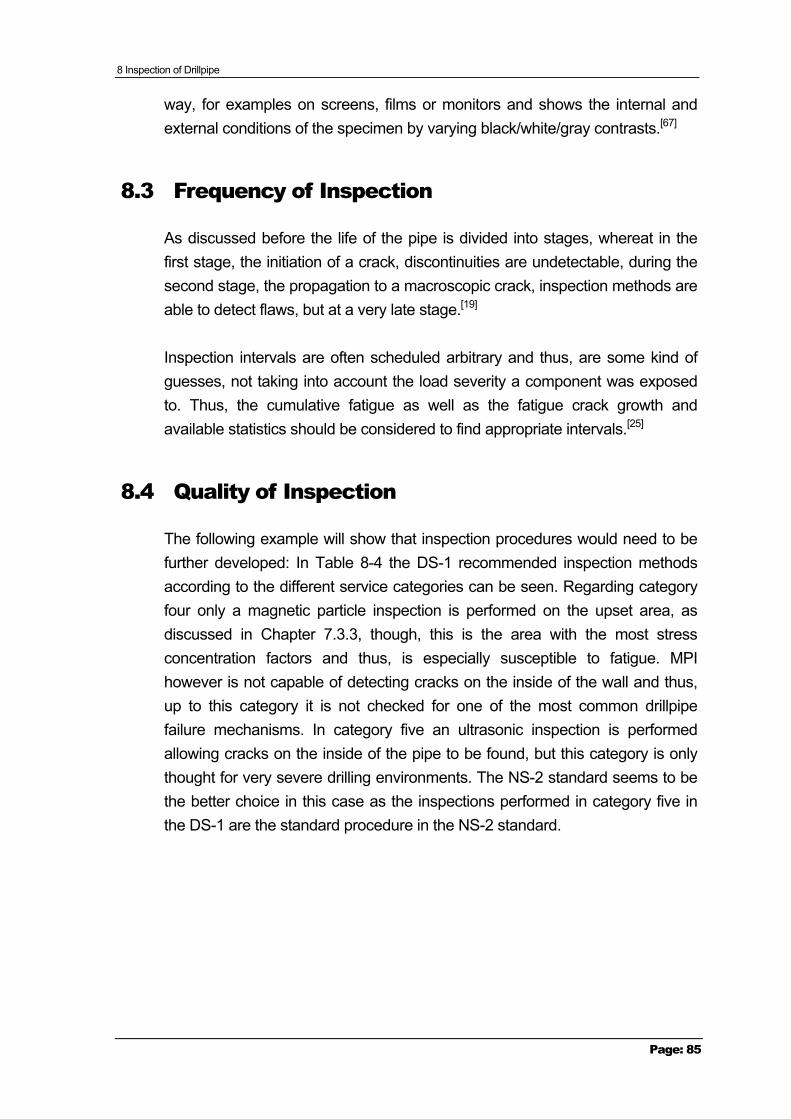
8 Inspection of Drillpipe
Page: 85
way, for examples on screens, films or monitors and shows the internal and external conditions of the specimen by varying black/white/gray contrasts.[67]
8.3 Frequency of Inspection
As discussed before the life of the pipe is divided into stages, whereat in the first stage, the initiation of a crack, discontinuities are undetectable, during the second stage, the propagation to a macroscopic crack, inspection methods are able to detect flaws, but at a very late stage.[19]
Inspection intervals are often scheduled arbitrary and thus, are some kind of guesses, not taking into account the load severity a component was exposed to. Thus, the cumulative fatigue as well as the fatigue crack growth and available statistics should be considered to find appropriate intervals.[25]
8.4 Quality of Inspection
The following example will show that inspection procedures would need to be further developed: In Table 8-4 the DS-1 recommended inspection methods according to the different service categories can be seen. Regarding category four only a magnetic particle inspection is performed on the upset area, as discussed in Chapter 7.3.3, though, this is the area with the most stress concentration factors and thus, is especially susceptible to fatigue. MPI however is not capable of detecting cracks on the inside of the wall and thus, up to this category it is not checked for one of the most common drillpipe failure mechanisms. In category five an ultrasonic inspection is performed allowing cracks on the inside of the pipe to be found, but this category is only thought for very severe drilling environments. The NS-2 standard seems to be the better choice in this case as the inspections performed in category five in the DS-1 are the standard procedure in the NS-2 standard.
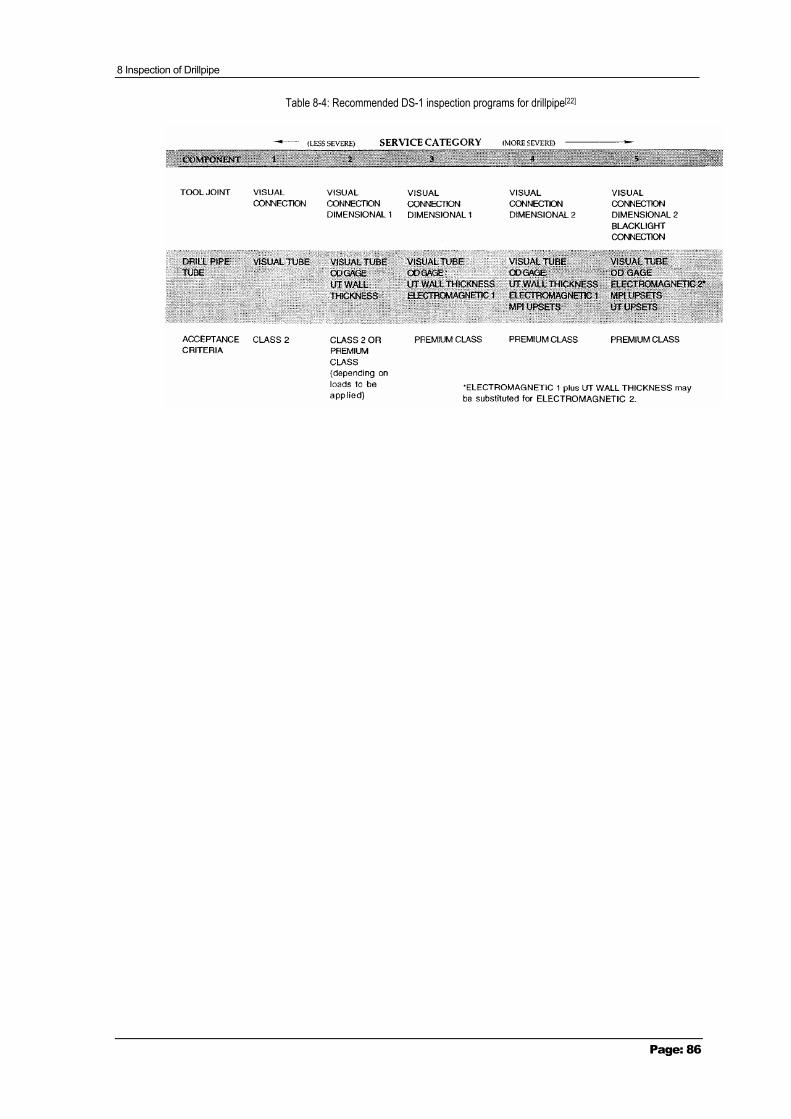
8 Inspection of Drillpipe
Page: 86
Table 8-4: Recommended DS-1 inspection programs for drillpipe[22]
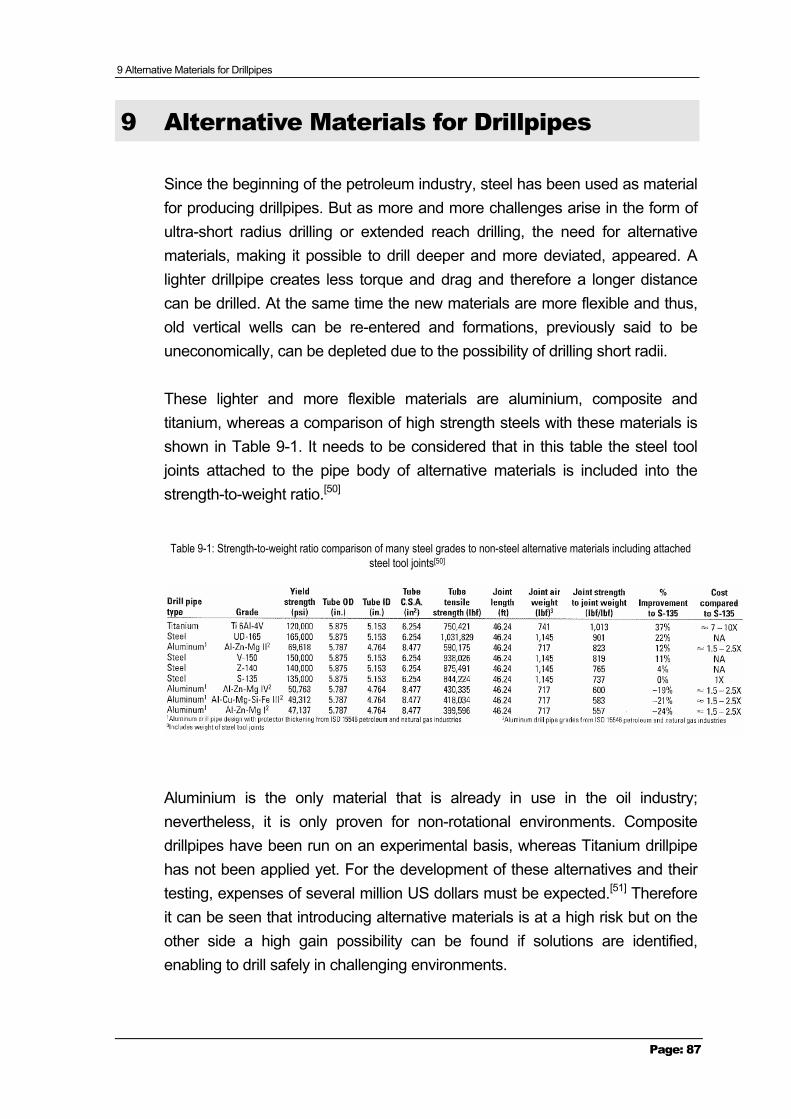
9 Alternative Materials for Drillpipes
Page: 87
9 Alternative Materials for Drillpipes
Since the beginning of the petroleum industry, steel has been used as material for producing drillpipes. But as more and more challenges arise in the form of ultra-short radius drilling or extended reach drilling, the need for alternative materials, making it possible to drill deeper and more deviated, appeared. A lighter drillpipe creates less torque and drag and therefore a longer distance can be drilled. At the same time the new materials are more flexible and thus, old vertical wells can be re-entered and formations, previously said to be uneconomically, can be depleted due to the possibility of drilling short radii.
These lighter and more flexible materials are aluminium, composite and titanium, whereas a comparison of high strength steels with these materials is shown in Table 9-1. It needs to be considered that in this table the steel tool joints attached to the pipe body of alternative materials is included into the strength-to-weight ratio.[50]
Table 9-1: Strength-to-weight ratio comparison of many steel grades to non-steel alternative materials including attached steel tool joints[50]
Aluminium is the only material that is already in use in the oil industry; nevertheless, it is only proven for non-rotational environments. Composite drillpipes have been run on an experimental basis, whereas Titanium drillpipe has not been applied yet. For the development of these alternatives and their testing, expenses of several million US dollars must be expected.[51] Therefore it can be seen that introducing alternative materials is at a high risk but on the other side a high gain possibility can be found if solutions are identified, enabling to drill safely in challenging environments.
9 Alternative Materials for Drillpipes
Page: 88
9.1 Aluminium
Aluminium alloys have been used for decades as construction material in the automotive, marine, aerospace and civil industry. In the oil industry it wasn’t considered, though, for a long time as steel was sufficient for the completed projects. An exception to this were Russia and the Former Soviet Union, which did the first research work and experiments in the 1950’s and therefore can be said to be the most experienced countries in the use of aluminium drillpipes. When the deepest well ever constructed by humans, the Kola Superdeep Borehole, was drilled, after 10 years of construction, in 1989 to a depth of 40,229 ft, aluminium was already used in parts of the drillstring.[52]
Worldwide 985,000 ft of aluminium drillpipe manufactured by Aquatic Company are in use, thereof 95% in the Former Soviet Union, but also in Brazil, Canada, The Netherlands, Papua New Guinea, Italy, and Ecuador. In addition there is an estimation that 2,133,000 ft of old style aluminium drillpipes are still in use.[71] For comparison, in Norway 100,000 steel pipes are in use, assuming 30 feet per pipe this gives an amount of three million feet of steel drillpipes just within Norway.[51]
The advantages of aluminium drillpipes are predominantly its light weight, furthermore, it is non-magnetic, and shows a good corrosion and fatigue resistance. Nevertheless, it should be considered that there is no more precise information available especially concerning fatigue failures. Regarding the expenses aluminium drillpipes cost around twice as much as conventional steel pipes.[50] Furthermore, Diyashev et al.[54] state that aluminium drillpipe wears less than steel as the tension in the string is lower, thereby reducing the axial and torsional drag.
One of the disadvantages is a relatively low yield strength of about 69,000 psi, even if the highest yield strength alloy has been used, which may be insufficient when drilling to extended reservoirs. Thus, a lower strength-to-weight ratio is achieved than for ultra-high-strength steel pipes if the steel tool joints on the aluminium pipe are taken into account as in Table 9-1.[50] The main reason for using steel tool joints is the possibility to use the drilling rig handling system in the same manner as for steel pipes. The design and specifications of aluminium drillpipe with a steel tool joint can be found in the
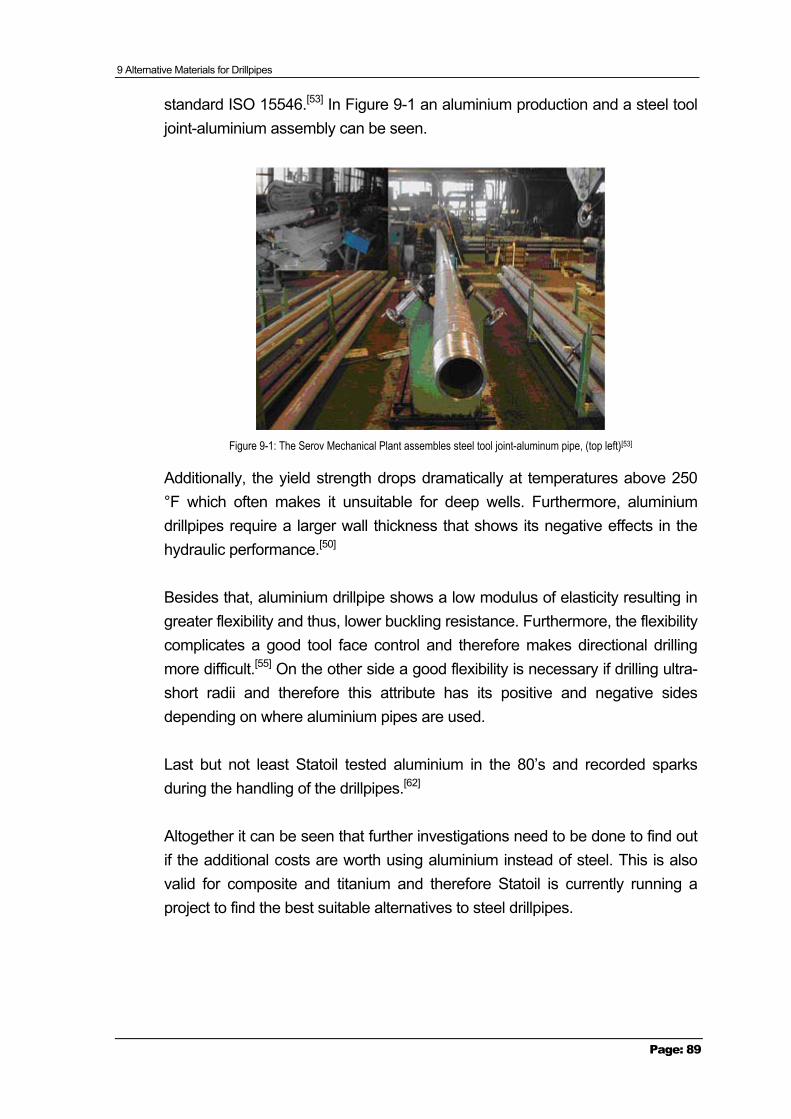
9 Alternative Materials for Drillpipes
Page: 89
standard ISO 15546.[53] In Figure 9-1 an aluminium production and a steel tool joint-aluminium assembly can be seen.
Figure 9-1: The Serov Mechanical Plant assembles steel tool joint-aluminum pipe, (top left)[53]
Additionally, the yield strength drops dramatically at temperatures above 250 °F which often makes it unsuitable for deep wells. Furthermore, aluminium drillpipes require a larger wall thickness that shows its negative effects in the hydraulic performance.[50]
Besides that, aluminium drillpipe shows a low modulus of elasticity resulting in greater flexibility and thus, lower buckling resistance. Furthermore, the flexibility complicates a good tool face control and therefore makes directional drilling more difficult.[55] On the other side a good flexibility is necessary if drilling ultra-short radii and therefore this attribute has its positive and negative sides depending on where aluminium pipes are used.
Last but not least Statoil tested aluminium in the 80’s and recorded sparks during the handling of the drillpipes.[62]
Altogether it can be seen that further investigations need to be done to find out if the additional costs are worth using aluminium instead of steel. This is also valid for composite and titanium and therefore Statoil is currently running a project to find the best suitable alternatives to steel drillpipes.
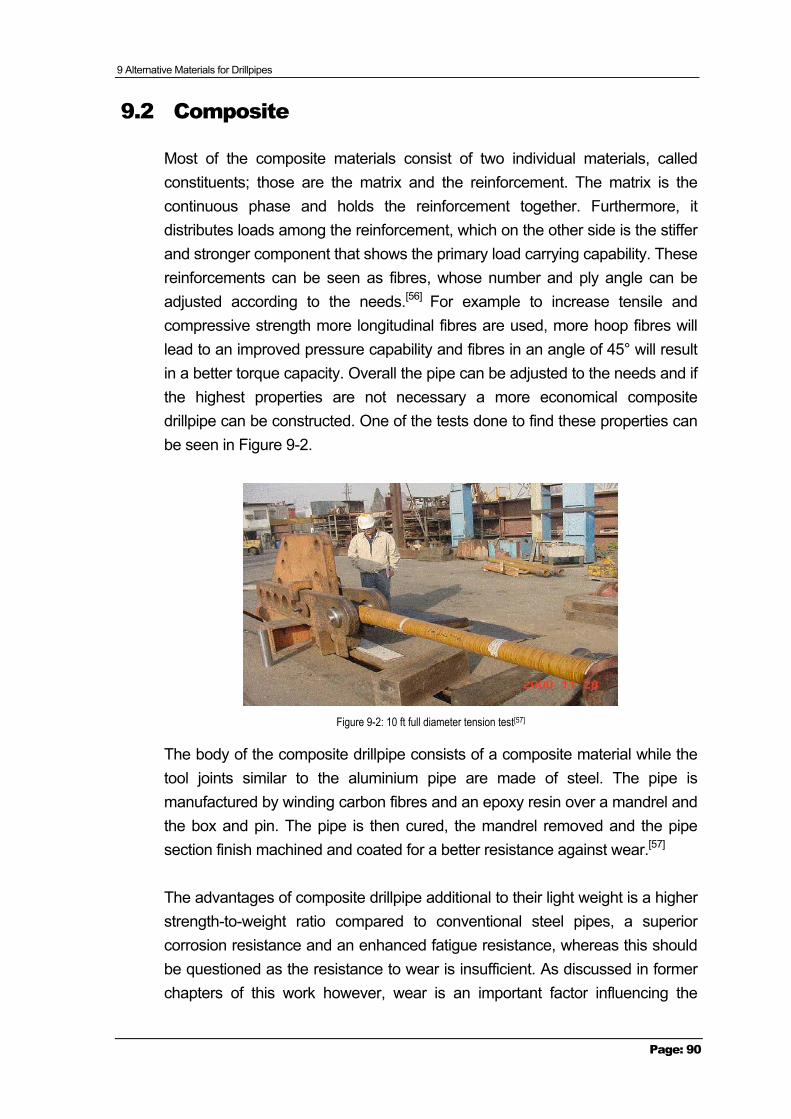
9 Alternative Materials for Drillpipes
Page: 90
9.2 Composite
Most of the composite materials consist of two individual materials, called constituents; those are the matrix and the reinforcement. The matrix is the continuous phase and holds the reinforcement together. Furthermore, it distributes loads among the reinforcement, which on the other side is the stiffer and stronger component that shows the primary load carrying capability. These reinforcements can be seen as fibres, whose number and ply angle can be adjusted according to the needs.[56] For example to increase tensile and compressive strength more longitudinal fibres are used, more hoop fibres will lead to an improved pressure capability and fibres in an angle of 45° will result in a better torque capacity. Overall the pipe can be adjusted to the needs and if the highest properties are not necessary a more economical composite drillpipe can be constructed. One of the tests done to find these properties can be seen in Figure 9-2.
Figure 9-2: 10 ft full diameter tension test[57]
The body of the composite drillpipe consists of a composite material while the tool joints similar to the aluminium pipe are made of steel. The pipe is manufactured by winding carbon fibres and an epoxy resin over a mandrel and the box and pin. The pipe is then cured, the mandrel removed and the pipe section finish machined and coated for a better resistance against wear.[57]
The advantages of composite drillpipe additional to their light weight is a higher strength-to-weight ratio compared to conventional steel pipes, a superior corrosion resistance and an enhanced fatigue resistance, whereas this should be questioned as the resistance to wear is insufficient. As discussed in former chapters of this work however, wear is an important factor influencing the
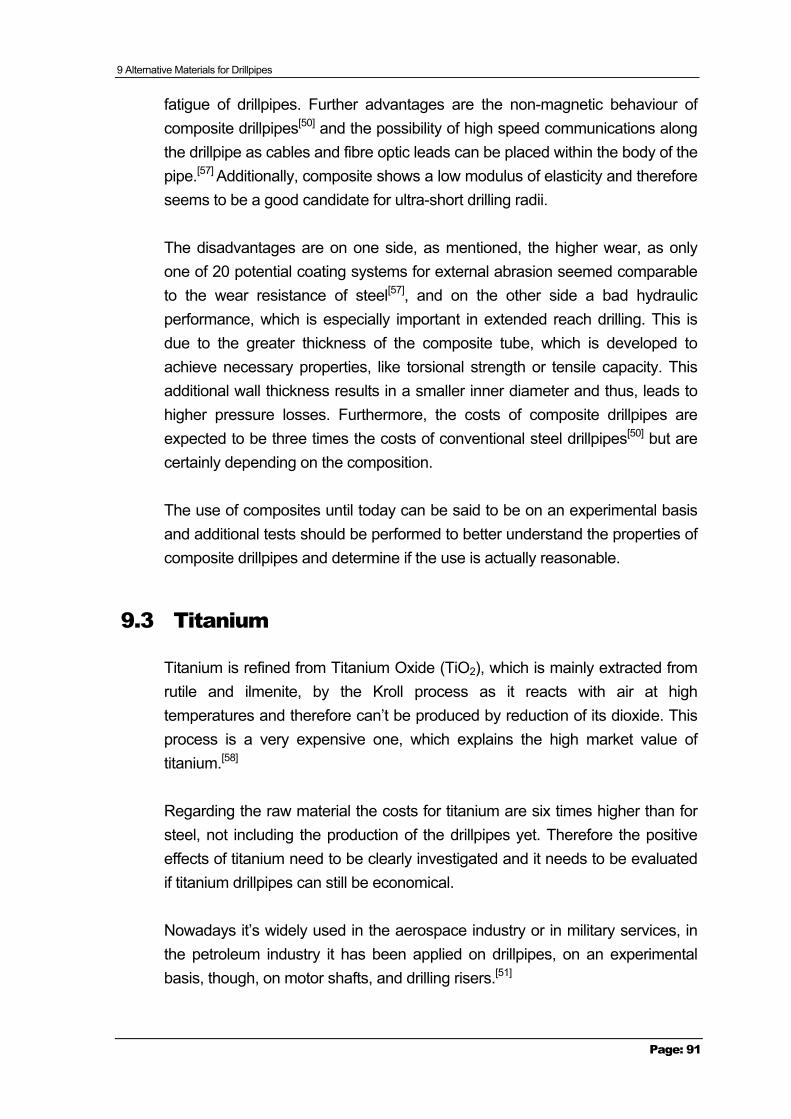
9 Alternative Materials for Drillpipes
Page: 91
fatigue of drillpipes. Further advantages are the non-magnetic behaviour of composite drillpipes[50] and the possibility of high speed communications along the drillpipe as cables and fibre optic leads can be placed within the body of the pipe.[57] Additionally, composite shows a low modulus of elasticity and therefore seems to be a good candidate for ultra-short drilling radii.
The disadvantages are on one side, as mentioned, the higher wear, as only one of 20 potential coating systems for external abrasion seemed comparable to the wear resistance of steel[57], and on the other side a bad hydraulic performance, which is especially important in extended reach drilling. This is due to the greater thickness of the composite tube, which is developed to achieve necessary properties, like torsional strength or tensile capacity. This additional wall thickness results in a smaller inner diameter and thus, leads to higher pressure losses. Furthermore, the costs of composite drillpipes are expected to be three times the costs of conventional steel drillpipes[50] but are certainly depending on the composition.
The use of composites until today can be said to be on an experimental basis and additional tests should be performed to better understand the properties of composite drillpipes and determine if the use is actually reasonable.
9.3 Titanium
Titanium is refined from Titanium Oxide (TiO2), which is mainly extracted from rutile and ilmenite, by the Kroll process as it reacts with air at high temperatures and therefore can’t be produced by reduction of its dioxide. This process is a very expensive one, which explains the high market value of titanium.[58]
Regarding the raw material the costs for titanium are six times higher than for steel, not including the production of the drillpipes yet. Therefore the positive effects of titanium need to be clearly investigated and it needs to be evaluated if titanium drillpipes can still be economical.
Nowadays it’s widely used in the aerospace industry or in military services, in the petroleum industry it has been applied on drillpipes, on an experimental basis, though, on motor shafts, and drilling risers.[51]
9 Alternative Materials for Drillpipes
Page: 92
The advantages of titanium are certainly the light weight as can be seen in Figure 9-3, it’s high yield strength and strength-to-weight ratio and its corrosion and erosion resistance. Furthermore, it has a modulus of elasticity of 17 million psi compared to 30 million psi for steel, which makes it more flexible, a benefit especially in short radius drilling.
Figure 9-3: Holding a titanium pipe[59]
In extended reach drilling this could be a disadvantage as buckling is more probable to occur and steering of the string is getting more difficult. Furthermore, titanium is reacting sensitive on contact with steel as it gets worn fast and another major disadvantage as mentioned before are the extremely high costs compared to conventional steel drillpipes.[50]
10 Conclusion
Page: 93
10 Conclusion
During the last decades drilling operations became more and more challenging in terms of extended reach wells, high pressure – high temperature surroundings or mature fields. These environments imply an increase in requirements on the drillpipes, which will be exposed to rough conditions downhole like high doglegs, high torques, and high tensions. These stresses, the pipe has to deal with, will be further increased by stress raisers, for instance slip marks or corrosion, acting on the pipe and leading to a reduction of the drillpipes’ life.
Many attempts can be found to predict the service life of the drillpipe, but most of these are only considering the main cause for failures, the bending stress. Some approaches also include a second factor like for example corrosion, but none actually managed to find a satisfying solution. Therefore this work tries to examine all the different stresses and stress raisers acting on both, the pipe body and the tool joint, and to show the complexity of parameters influencing drillpipe failure.
The developed flowcharts should help identifying, which factors acting on the pipe, and thereby reducing its life, are known and which still need investigations to be able to develop a satisfying model in a later stage. An approach how this model possibly can be build was also presented, thereby including a well established theoretical prediction method, the Miner’s rule.
For completing the prediction model, the unknown factors would need to be measured along each length increment of the pipe, which is nowadays impossible since measuring devices only can be found at the bit and on the rig. In between no devices can be installed and therefore the missing parameters for drillpipe failure cannot be determined. This is on one side due to a lack of space downhole and on the other side due to the high costs associated with the desire to measure along the wellpath. An optimum balance between the cost for failure prevention and the cost in the case of a failure needs to be found.
11 Nomenclature
Page: 94
11 Nomenclature
σa = stress amplitude [MPa] ∆σ = nominal stress range = σmax - σmin [MPa] σm = mean stress [MPa] R = stress ratio [ ] σmin = minimum cyclic stress [MPa] σmax = maximum cyclic stress [MPa] N = number of cycles to failure [ ] x = slope in the S-N curve Kf = fatigue notch factor [ ] Kt = stress concentration factor [ ] q = notch sensitivity factor [ ] σv = von Mises stress [MPa] σx,y,z = stresses in respective directions of the coordinate system [MPa] τxy,yz,zx = shear stresses on respective planes [ MPa] Df = damage [ ] ni = number of cycles with same stress amplitude [ ] da/dN = crack propagation rate [m/cycle] ∆K = stress intensity range [MPa√m] C = fatigue coefficient [ ] m = fatigue exponent [ ] c = maximum permissible dogleg severity [degrees/100ft] σb = maximum permissible bending stress [psi] Lh = half the distance between tool joints [in] T = buoyant weight suspended below the dogleg [lb] E = Young’s modulus [psi] I = moment of inertia of string cross section [in4] σbE = maximum permissible bending stress for Grade E drillpipe [psi] σt = buoyant tensile stress [psi] σbS = maximum permissible bending stress for Grade E drillpipe [psi] Rben = bending radius [ft] BSR = Bending Strength Ratio [ ] Zbox = section modulus of the box [ ] Zpin = section modulus of the pin [ ] D = outside diameter [m] b = box thread root diameter at pin end [m] dpin = inside diameter of pin [m]
11 Nomenclature
Page: 95
r = thread root diameter of pin threads ¾ inch from the shoulder [m] FSR = Fatigue Strength Ratio [ ] Mbox = calculated box fatigue limit for a connection [MPa] Mpin = calculated pin fatigue limit due to optimum make up [MPa] Mup = make up torque [N-m] Qup = axial load from make up [N] K = factor for frictional torque due to RSC make up [m] A = cross sectional area [m2] σup
= make up inner stress [MPa] Ym = minimum yield strength of material [MPa] Ks = factor for frictional torque on shoulder face [m] Kth = factor for frictional torque on thread mating surfaces [m] Kh = factor for frictional torque from the angle of the thread helix [m] Rs = mean radius of box shoulder [m] f = friction coefficient [ ] Rt = mean radius of threads [m] θ = ½ included angle of thread flanks [°] P = lead of thread [m] Fs = critical axial load to begin sinusoidal buckling [lbf] Wmud = weight per foot of the drillstring in mud [lb/ft] Inc = inclination [degree] rc = radial clearance between string and borehole [in] Fh = critical axial load to begin helical buckling [lbf] Faxial = axial force [lbf] Wair = weight of the drillsting in air [lb] Fdrag = drag force [lb] Farea = change in force due to a change in area [lb] Fbottom = bottom pressure force [ft] WWOB = weight on bit [lb] FBS = Buckling stability force [lb] RPMa = critical speed of axial type [revolutions per minute] L = total length of string [ft] RPMn = critical speed of nodal type [revolutions per minute] OD = outside diameter [in] ID = inside diameter [in] S = length of one joint of pipe [ft] Sut = ultimate strength [psi] Se = endurance limit [psi] Sf = finite-life strength [psi]
12 References
Page: 96
12 References
[1] Sathuvalli, U.B. et al.: "Advanced Assessment of Drillpipe Fatigue and Application to Critical Well Engineering", paper SPE/IADC 92591, presented at the SPE/IADC Drilling Conference, Amsterdam, The Netherlands, 23-25 February 2005.
[2] Grant Prideco: “Drill Pipe”, www.grantprideco.com/drilling/products/drilling_products_drillpipe.asp
[3] Mechanical Engineering Design, 5th ed., Shigley, J.E. and Mischke, C.R., McGraw-Hill, Inc., New York, NY (1989).
[4] Berglund, P.L.: “Martensite”, www.threeplanes.net/martensite.html
[5] Key to Metals AG: “Hardenability of Steels”, http://www.key-to-steel.com/es/default.aspx?ID=CheckArticle&NM=146
[6] Metals Handbook, 2nd ed., Davis, J.R., AMS International Handbook Committee, U.S.A. (1998).
[7] Personal Correspondence, William Ogilvie, Marketing Engineer, Grant Prideco Middle East.
[8] Hansen, B.R.: “Future Tubulars – Drill pipe failures, 1995-2006”, Statoil, 2007.
[9] Standard DS-1TM Drill Stem Design and operation, Volume 2, TH Hill Associates, Inc., 3rd ed., January 2004.
[10] Wilson, G.: "How to reduce drillstring fatigue failures in a corrosive environment", World Oil, Vol. 219, No. 10 (October 1998), 40-42.
[11] Vernon, R.J. and Wade, E. H. R.: "Beyond 'Heat checking' - Frictional Heating Causes Drillpipe Failure in an Extended Reach Well", paper SPE 86562, 2003.
12 References
Page: 97
[12] Gokhale, S. et al.: "Rotating While Packed off May Cause Unexpected Heat-Induced Drill Pipe Tensile Failures", paper SPE 92429, presented at the SPE/IADC Drilling Conference, Amsterdam, The Netherlands, 23-25 February 2005.
[13] Hehn, L. et al.: “Catastrophic Drillstring Failures Caused by Downhole Friction Heating-An Increasing Trend”, paper SPE/IADC 105026, presented at the SPE/IADC Drilling Conference, Amsterdam, the Netherlands, 20-22 February 2007.
[14] Kristoffersen, S.: “Improved Fatigue Performance of Threaded Drillstring Connections by Cold Rolling”, PhD dissertation, NTNU Trondheim, Trondheim, Norway (2002).
[15] Hossain, M.M. et al.: ”Fatigue Life Evaluation: A Key to Avoid Drillpipe Failure Due to Die-marks”, paper IADC/SPE 47789, presented at the
1998 IADC/SPE Asia Pacific Drilling Conference, Jakarta, Indonesia, 7-9 September 1998.
[16] Grondin, G.Y. and Kulak, G.L.: "Fatigue Testing of Drillpipe", SPEDC, (June 1994), 95-102.
[17] Fatigue Handbook, Offshore Steel Structures, Almar-Næss, A., Tapir, Trondheim, Norway (1985).
[18] ESDEP – the European Steel Design Education Programme: “Advanced introduction to fatigue”, http://www.kuleuven.ac.be/bwk/materials/Teaching/master/wg12/l0200.htm
[19] Vaisberg, O. et al.: “Fatigue of Drillstring: State of the Art”, Oil & Gas Science and Technology – Rev. IFP, Vol. 57, No. 1 (2002), 7-37.
[20] Zafar, R.H.: "North Sea data yield insight on fatigue life of drill pipe", Oil & Gas Journal, Vol. 105, No. 2 (January 8, 2007).
[21] Physique & industrie: “Residual Stress Theory”, http://www.physiqueindustrie.com/residual_stress.php
12 References
Page: 98
[22] Standard DS-1TM Drill Stem inspection, Volume 3, TH Hill Associates, Inc., 3rd ed., January 2004.
[23] Drillstring Inspection Standard (NS-2), O.C.T.G. Procter Consultancy Limited, Rev 0, November 1999.
[24] API Recommended Practice for Drill Stem Design and Operating Limits, API RP 7G, 16th ed., August 1998.
[25] Horbeek, J.H., et al.: "Successful Reduction of North Sea Drillstring Failures", paper SPE 30348, presented at Offshore Europe, Aberdeen, 5-8 September 1995.
[26] TH Hill Associates, Inc.: “Torsion Failures”, http://www.thhill.com/torsion.php
[27] TH Hill Associates, Inc.: “Tension Failures”, http://www.thhill.com/tension.php
[28] TH Hill Associates, Inc.: “Burst and Collapse Failures”, http://www.thhill.com/burst.php
[29] TH Hill Associates, Inc.: “Combined Tension/Torsion Failures”, http://www.thhill.com/combined_failure.php
[30] Baryshnikov, A. et al.: "Eliminating twist-offs as a cause of drillstring failure", World Oil, Vol. 220, No. 7 (July 1999), 81-82, 85-89.
[31] Drilling Data Handbook, Institute Français du Pétrole Publications, 7th ed., Gabolde, G. and Nguyen, Éditions Technip, Paris, France.
[32] Baryshnikov, A. et al.: "Optimization of Rotary-Shouldered Connection Reliability and Failure Analysis", paper IADC/SPE 27535, presented at 1994 IADC/SPE Drilling Conference, Dallas, Texas, 15-18 February 1994.
[33] Grant Prideco: “High Performance Rotary Shoulder Connections”, http://www.grantprideco.com/drilling/products/drilling_products_connection.asp
12 References
Page: 99
[34] Mobley, J.G.: “Finally, the truth about drill string hardbanding”, Drilling Contractor, March/April 2007, 58.
[35] Abul-Hamd, I.A. et al.: "A new interactive program for detecting, diagnosing, and remedying drill-string failure before and during drilling", NAFTA, Vol. 55, No. 5 (May 2004), 191-197.
[36] Grant Prideco: “Engineering Toolkit, Glossary”, http://www.grantprideco.com/apps/glossary/simplesearch.asp
[37] API Specification for Drill Pipe, API Spec 5D, 5th ed., October 2001.
[38] Coiled-Tubing Stress Analysis Model, Stress /Drag/Hydraulic/Buckling, Theory and User’s Manual, Maurer Engineering Inc., August 1993.
[39] Binmore, I.: “Rapid Identification of Downhole Tubulars Saves Significant Operational Dollars”, Merrick Systems, Inc., June 2005.
[40] Vincké, O. et al.: “A New Drillstring Supervision System”, paper SPE/IADC 105842, presented at the 2007 SPE/IADC Drilling Conference, Amsterdam, The Netherlands, 20-22 February 2007.
[41] Haagensen, P.J.: “Utmatting og analyse av bøyespenninger i 2 7/8” borerør i hull med 50° avvik”, report No. R-15-03, NTNU, November 2003.
[42] Wu, J.: "Model predicts drill pipe fatigue in horizontal wells", Oil & Gas Journal, Vol. 95, No. 5 (February 3, 1997).
[43] Shepard, J.S.: “Extended Drillpipe Life With Tighter Specifications”, paper IADC/SPE 23843, presented at the IADC/SPE Drilling Conference, New Orleans, Louisiana, 18-21 February 1992.
[44] Schamp, J.H. et al.: "Torque Reduction Techniques in ERD Wells", paper IADC/SPE 98969, presented at the IADC/SPE Drilling Conference, Miami, Florida, U.S.A., 21-23 February 2006.
[45] Abul-Hamd, I.A. et al.: "Hot ranges for drilling parameters caused drill string failure", NAFTA, Vol. 55, No.4 (April 2004), 163 - 168.
12 References
Page: 100
[46] Hill, T.H. et al.: "A Unified Approach to Drillstem-Failure Prevention", SPE Drilling Engineering, Vol. 7, No. 4 (December 1992), 254-260.
[47] Mechanical Engineering Design, 4th ed., Shigley, J.E. and Mitchell, L.D., McGraw-Hill, Inc., Singapore (1983).
[48] Kessler, F. and Smith, J.: "Double-Shouldered Tool Joints Increase Torsional Strength", Journal of Petroleum Technology, Vol. 48, No. 6 (June 1996), 514, 517.
[49] Maskindeler 1, Aspen, J.S., Yrkesopplæringsrådet for håndverk og industri, Universitetsforlaget, Trondhjem (1970).
[50] Chandler, B.R. et al.: ”Advanced and emerging drillstring technologies overcome operational challenges”, World Oil, Vol. 227, No. 10 (October 2006), 23-34.
[51] Personal Correspondence, Brikt Rathour Hansen, Senior Engineer, Statoil ASA.
[52] Gelfgat, M.Y. et al.: “Drillstring With Aluminium Alloy Pipes Design and Practices”, paper SPE/IADC 79873, presented at the SPE/IADC Drilling Conference, Amsterdam, The Netherlands, 19-21 February 2003.
[53] Gelfgat, M.Y. et al.: “Aluminum alloy tubulars for oil and gas industry”, World Oil, Vol. 227, No. 7, (July 2006).
[54] Diyashev, I. et al.: “Successful Horizontal Drilling in Western Siberia: Use of Appropriate, Cost-Effective Technology Solutions to Increase Well Productivity”, paper IADC/SPE 87122, presented at the IADC/SPE Drilling Conference Dallas, Texas, U.S.A., 2-4 March 2004.
[55] Solvang, K.A.: “Performance Prediction of Titanium Drill Pipe”, Master Thesis, The University of Tulsa, Tulsa, Oklahoma, U.S.A. (1998).
[56] About.com, Composite/Plastics: “What’s a Composite?”, http://composite.about.com/od/aboutcompositesplastics/l/aa060297.htm

12 References
Page: 101
[57] Leslie, J.C. et al.: “Composite Drill Pipe for Extended-Reach and Deep Water Applications”, paper OTC 14266, presented at the 2002 Offshore Technology Conference, Houston, Texas, U.S.A., 6-9 May 2002.
[58] Wikipedia, the free encyclopedia: “Titanium”, http://en.wikipedia.org/wiki/Titanium
[59] CSIRO, the Commonwealth Scientific and Industrial Research Organisation: “Light Metals Flagship overview”, http://www.csiro.au/org/ps2p.html
[60] Reynolds, H. and Watson, G.: "String Design and Application in Through-Tubing Rotary Drilling (TTRD)", paper SPE 81096, presented at SPE Latin American and Caribbean Petroleum Engineering Conference, Port-of-Spain, Trinidad, West Indies, 27-30 April 2003.
[61] Teknisk Ukeblad: “Ufattelig mye mer penger”, http://www.tu.no/nyheter/offshore/article45902.ece
[62] Personal Correspondence, Terje Grøttum, Chief Engineer for Drilling Technology, Statoil ASA.
[63] Gupta, A.: “Planning and Identifying the Best Technologies for Extended Reach Wells”, paper SPE 106346, presented at the 2006 SPE Technical Symposium of Saudi Arabia Section, Dhahran, Saudi Arabia, 21-23 May 2006.
[64] Jellison, M.J. and Payne, M.: “New drill pipe size improves ERD and deepwater drilling”, World Oil, Vol. 221, No. 1 (January 2000).
[65] Maldonado, B. et al.: “Ultradeep HP/HT Completions: Classification, Design Methodologies, and Technical Challenges”, paper OTC 17927, presented at the 2006 Offshore Technology Conference, Houston, Texas, U.S.A., 1-4 May 2006.
[66] Wikipedia, the free encyclopedia: “Von Mises failure criteria”, http://en.wikipedia.org/wiki/Von_Mises_stress
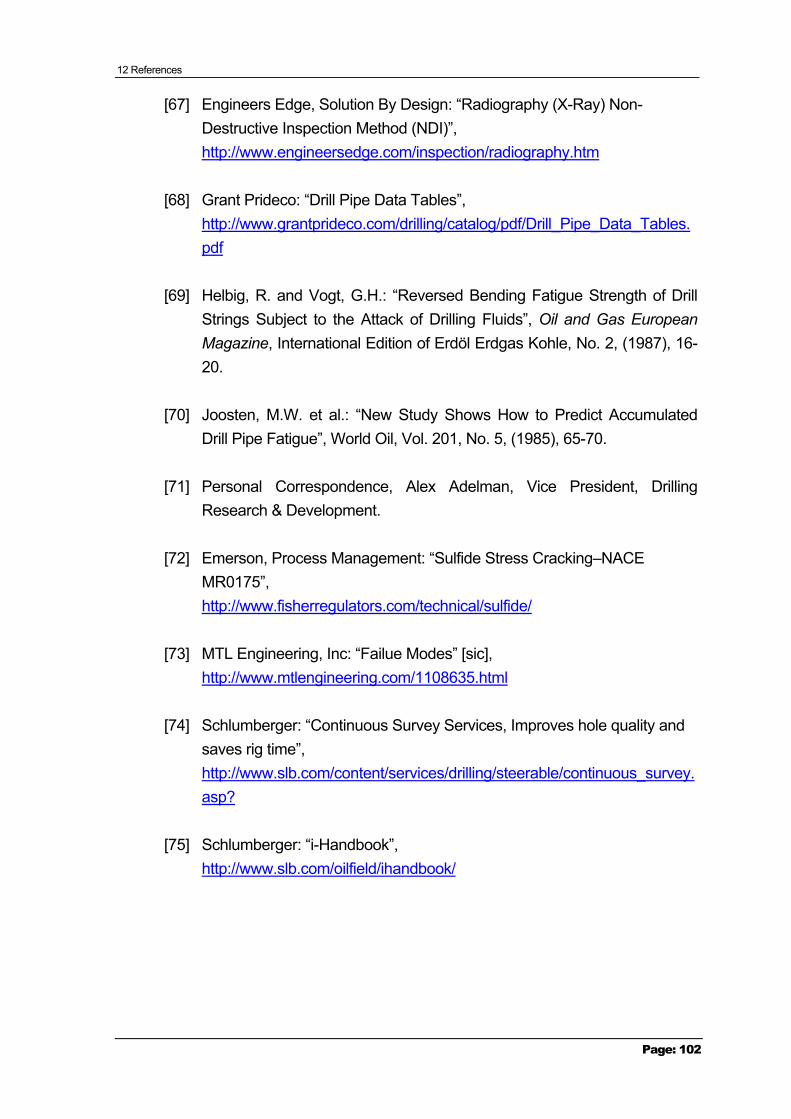
12 References
Page: 102
[67] Engineers Edge, Solution By Design: “Radiography (X-Ray) Non-Destructive Inspection Method (NDI)”, http://www.engineersedge.com/inspection/radiography.htm
[68] Grant Prideco: “Drill Pipe Data Tables”, http://www.grantprideco.com/drilling/catalog/pdf/Drill_Pipe_Data_Tables.pdf
[69] Helbig, R. and Vogt, G.H.: “Reversed Bending Fatigue Strength of Drill Strings Subject to the Attack of Drilling Fluids”, Oil and Gas European Magazine, International Edition of Erdöl Erdgas Kohle, No. 2, (1987), 16-20.
[70] Joosten, M.W. et al.: “New Study Shows How to Predict Accumulated Drill Pipe Fatigue”, World Oil, Vol. 201, No. 5, (1985), 65-70.
[71] Personal Correspondence, Alex Adelman, Vice President, Drilling Research & Development.
[72] Emerson, Process Management: “Sulfide Stress Cracking–NACE MR0175”, http://www.fisherregulators.com/technical/sulfide/
[73] MTL Engineering, Inc: “Failue Modes” [sic], http://www.mtlengineering.com/1108635.html
[74] Schlumberger: “Continuous Survey Services, Improves hole quality and saves rig time”, http://www.slb.com/content/services/drilling/steerable/continuous_survey.asp?
[75] Schlumberger: “i-Handbook”, http://www.slb.com/oilfield/ihandbook/
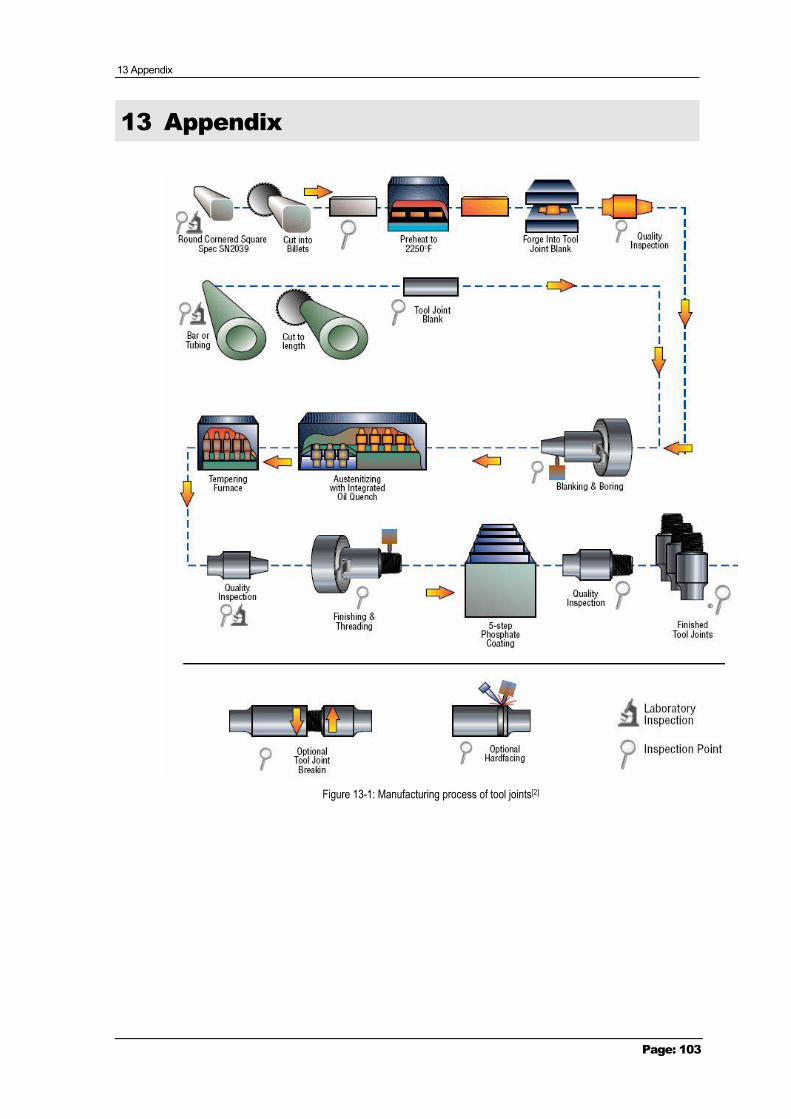
13 Appendix
Page: 103
13 Appendix
Figure 13-1: Manufacturing process of tool joints[2]
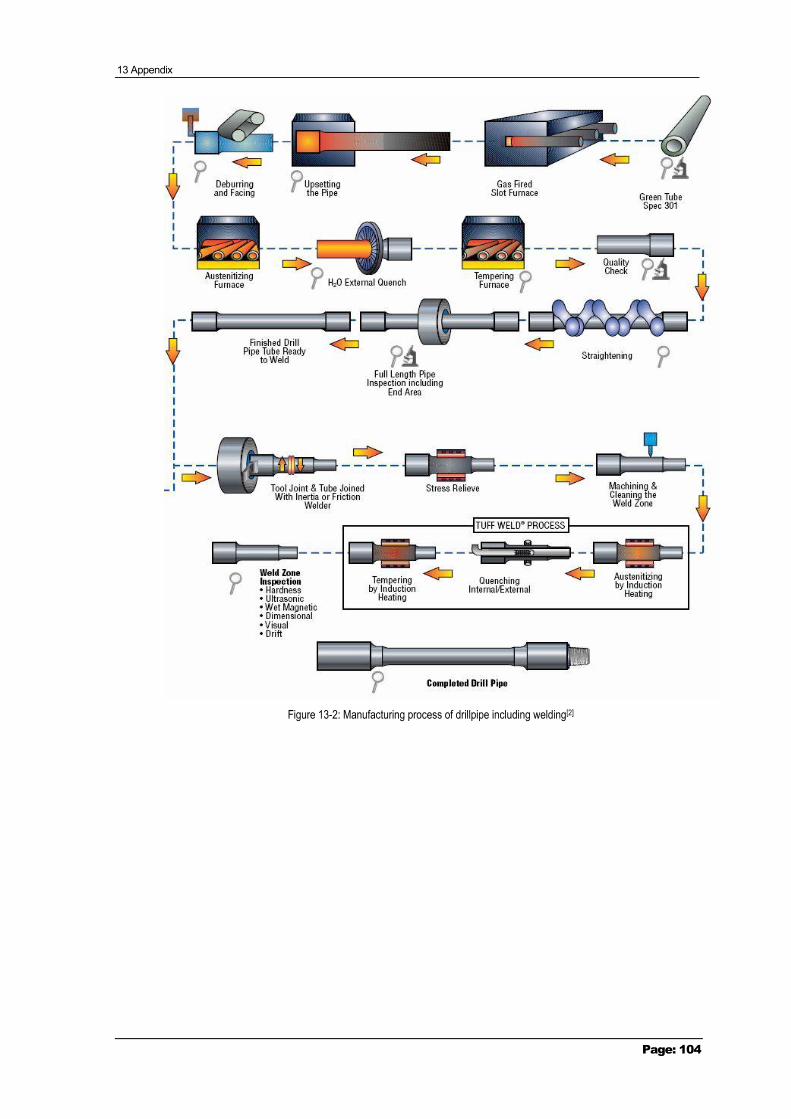
13 Appendix
Page: 104
Figure 13-2: Manufacturing process of drillpipe including welding[2]
13 Appendix
Page: 105
Table 13-1: Drillpipe properties for a new pipe[68]
OD Nominal Weight Grade
Torsional Yield
Strength
Tensile Yield
Strength Wall
ThicknessNominal
ID Internal
Pressure Collapse Pressure
[in] [lb/ft] [ft-lb] [lb] [in] [in] [psi] [psi] 2 7/8 6.85 E-75 8,100 135,900 0.217 2.441 9,907 10,467 2 7/8 6.85 X-95 10,200 172,100 0.217 2.441 12,548 12,940 2 7/8 6.85 G-105 11,300 190,300 0.217 2.441 13,869 14,020 2 7/8 6.85 S-135 14,500 244,600 0.217 2.441 17,832 17,034 2 7/8 6.85 Z-140 15,100 253,700 0.217 2.441 18,492 17,500 2 7/8 6.85 V-150 16,200 271,800 0.217 2.441 19,813 18,398 2 7/8 10.40 E-75 11,600 214,300 0.362 2.151 16,526 16,509 2 7/8 10.40 X-95 14,600 271,500 0.362 2.151 20,933 20,911 2 7/8 10.40 G-105 16,200 300,100 0.362 2.151 23,137 23,112 2 7/8 10.40 S-135 20,800 385,800 0.362 2.151 29,747 29,716 2 7/8 10.40 Z-140 21,600 400,100 0.362 2.151 30,849 30,817 2 7/8 10.40 V-150 23,100 428,700 0.362 2.151 33,052 33,018 3 1/2 9.50 E-75 14,100 194,300 0.254 2.992 9,525 10,001 3 1/2 9.50 X-95 17,900 246,100 0.254 2.992 12,065 12,077 3 1/2 9.50 G-105 19,800 272,000 0.254 2.992 13,335 13,055 3 1/2 9.50 S-135 25,500 349,700 0.254 2.992 17,145 15,748 3 1/2 9.50 Z-140 26,400 362,600 0.254 2.992 17,780 16,158 3 1/2 9.50 V-150 28,300 388,500 0.254 2.992 19,050 16,943 3 1/2 13.30 E-75 18,600 271,600 0.368 2.764 13,800 14,113 3 1/2 13.30 X-95 23,500 344,000 0.368 2.764 17,480 17,877 3 1/2 13.30 G-105 26,000 380,200 0.368 2.764 19,320 19,758 3 1/2 13.30 S-135 33,400 488,800 0.368 2.764 24,840 25,404 3 1/2 13.30 Z-140 34,600 506,900 0.368 2.764 25,760 26,345 3 1/2 13.30 V-150 37,100 543,100 0.368 2.764 27,600 28,226 3 1/2 15.50 E-75 21,100 322,800 0.449 2.602 16,838 16,774 3 1/2 15.50 X-95 26,700 408,800 0.449 2.602 21,328 21,247 3 1/2 15.50 G-105 29,500 451,900 0.449 2.602 23,573 23,484 3 1/2 15.50 S-135 38,000 581,000 0.449 2.602 30,308 30,194 3 1/2 15.50 Z-140 39,400 602,500 0.449 2.602 31,430 31,312 3 1/2 15.50 V-150 42,200 645,500 0.449 2.602 33,675 33,549 5 1/2 21.90 E-75 50,700 437,100 0.361 4.778 8,615 8,413 5 1/2 21.90 X-95 64,200 553,700 0.361 4.778 10,912 10,019 5 1/2 21.90 G-105 71,000 612,000 0.361 4.778 12,061 10,753 5 1/2 21.90 S-135 91,300 786,800 0.361 4.778 15,507 12,679 5 1/2 21.90 Z-140 94,700 816,000 0.361 4.778 16,081 12,957 5 1/2 21.90 V-150 101,400 874,200 0.361 4.778 17,230 13,473 5 1/2 24.70 E-75 56,600 497,200 0.415 4.670 9,903 10,464 5 1/2 24.70 X-95 71,700 629,800 0.415 4.670 12,544 12,933 5 1/2 24.70 G-105 79,200 696,100 0.415 4.670 13,865 14,013 5 1/2 24.70 S-135 101,800 895,000 0.415 4.670 17,826 17,023 5 1/2 24.70 Z-140 105,600 928,100 0.415 4.670 18,486 17,489 5 1/2 24.70 V-150 113,100 994,400 0.415 4.670 19,807 18,386 5 7/8 23.40 E-75 58,600 469,000 0.361 5.153 8,065 7,453 5 7/8 23.40 X-95 74,200 594,100 0.361 5.153 10,216 8,775 5 7/8 23.40 G-105 82,000 656,600 0.361 5.153 11,291 9,362 5 7/8 23.40 S-135 105,500 844,200 0.361 5.153 14,517 10,825 5 7/8 23.40 Z-140 109,400 875,500 0.361 5.153 15,054 11,023 5 7/8 23.40 V-150 117,200 938,000 0.361 5.153 16,130 11,376 5 7/8 26.30 E-75 65,500 533,900 0.415 5.045 9,271 9,558 5 7/8 26.30 X-95 83,000 676,300 0.415 5.045 11,744 11,503 5 7/8 26.30 G-105 91,700 747,400 0.415 5.045 12,980 12,414 5 7/8 26.30 S-135 117,900 961,000 0.415 5.045 16,688 14,892 5 7/8 26.30 Z-140 122,300 996,600 0.415 5.045 17,306 15,266 5 7/8 26.30 V-150 131,000 1,067,800 0.415 5.045 18,543 15,976 6 5/8 25.20 E-75 70,600 489,500 0.330 5.965 6,538 4,788

13 Appendix
Page: 106
6 5/8 25.20 X-95 89,400 620,000 0.330 5.965 8,281 5,321 6 5/8 25.20 G-105 98,800 685,200 0.330 5.965 9,153 5,500 6 5/8 25.20 S-135 127,000 881,000 0.330 5.965 11,768 6,036 6 5/8 25.20 Z-140 131,700 913,700 0.330 5.965 12,204 6,121 6 5/8 25.20 V-150 141,200 978,900 0.330 5.965 13,075 6,260 6 5/8 27.70 E-75 76,300 534,200 0.362 5.901 7,172 5,894 6 5/8 27.70 X-95 96,600 676,700 0.362 5.901 9,084 6,755 6 5/8 27.70 G-105 106,800 747,900 0.362 5.901 10,040 7,103 6 5/8 27.70 S-135 137,300 961,600 0.362 5.901 12,909 7,813 6 5/8 27.70 Z-140 142,400 997,200 0.362 5.901 13,387 7,881 6 5/8 27.70 V-150 152,600 1,068,400 0.362 5.901 14,343 7,970
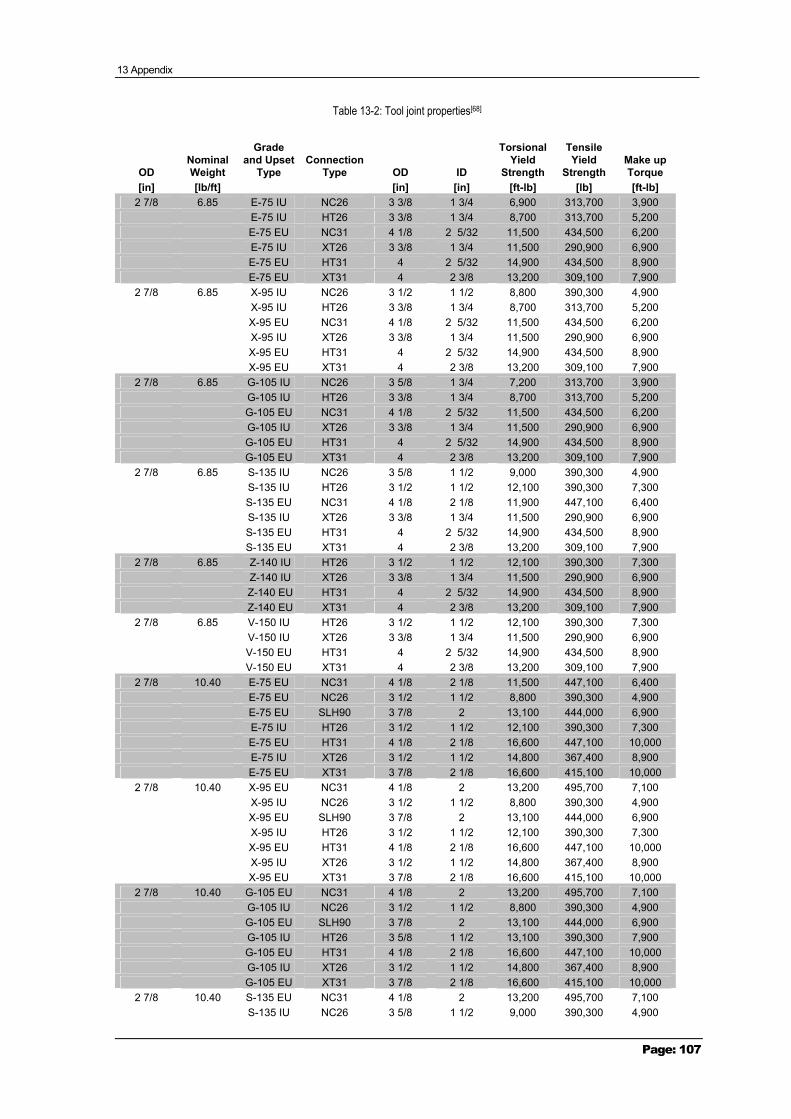
13 Appendix
Page: 107
Table 13-2: Tool joint properties[68]
OD Nominal Weight
Grade and Upset
Type Connection
Type OD ID
Torsional Yield
Strength
Tensile Yield
Strength Make up Torque
[in] [lb/ft] [in] [in] [ft-lb] [lb] [ft-lb] 2 7/8 6.85 E-75 IU NC26 3 3/8 1 3/4 6,900 313,700 3,900
E-75 IU HT26 3 3/8 1 3/4 8,700 313,700 5,200 E-75 EU NC31 4 1/8 2 5/32 11,500 434,500 6,200 E-75 IU XT26 3 3/8 1 3/4 11,500 290,900 6,900 E-75 EU HT31 4 2 5/32 14,900 434,500 8,900 E-75 EU XT31 4 2 3/8 13,200 309,100 7,900
2 7/8 6.85 X-95 IU NC26 3 1/2 1 1/2 8,800 390,300 4,900 X-95 IU HT26 3 3/8 1 3/4 8,700 313,700 5,200 X-95 EU NC31 4 1/8 2 5/32 11,500 434,500 6,200 X-95 IU XT26 3 3/8 1 3/4 11,500 290,900 6,900 X-95 EU HT31 4 2 5/32 14,900 434,500 8,900 X-95 EU XT31 4 2 3/8 13,200 309,100 7,900
2 7/8 6.85 G-105 IU NC26 3 5/8 1 3/4 7,200 313,700 3,900 G-105 IU HT26 3 3/8 1 3/4 8,700 313,700 5,200 G-105 EU NC31 4 1/8 2 5/32 11,500 434,500 6,200 G-105 IU XT26 3 3/8 1 3/4 11,500 290,900 6,900 G-105 EU HT31 4 2 5/32 14,900 434,500 8,900 G-105 EU XT31 4 2 3/8 13,200 309,100 7,900
2 7/8 6.85 S-135 IU NC26 3 5/8 1 1/2 9,000 390,300 4,900 S-135 IU HT26 3 1/2 1 1/2 12,100 390,300 7,300 S-135 EU NC31 4 1/8 2 1/8 11,900 447,100 6,400 S-135 IU XT26 3 3/8 1 3/4 11,500 290,900 6,900 S-135 EU HT31 4 2 5/32 14,900 434,500 8,900 S-135 EU XT31 4 2 3/8 13,200 309,100 7,900
2 7/8 6.85 Z-140 IU HT26 3 1/2 1 1/2 12,100 390,300 7,300 Z-140 IU XT26 3 3/8 1 3/4 11,500 290,900 6,900 Z-140 EU HT31 4 2 5/32 14,900 434,500 8,900 Z-140 EU XT31 4 2 3/8 13,200 309,100 7,900
2 7/8 6.85 V-150 IU HT26 3 1/2 1 1/2 12,100 390,300 7,300 V-150 IU XT26 3 3/8 1 3/4 11,500 290,900 6,900 V-150 EU HT31 4 2 5/32 14,900 434,500 8,900 V-150 EU XT31 4 2 3/8 13,200 309,100 7,900
2 7/8 10.40 E-75 EU NC31 4 1/8 2 1/8 11,500 447,100 6,400 E-75 EU NC26 3 1/2 1 1/2 8,800 390,300 4,900 E-75 EU SLH90 3 7/8 2 13,100 444,000 6,900 E-75 IU HT26 3 1/2 1 1/2 12,100 390,300 7,300 E-75 EU HT31 4 1/8 2 1/8 16,600 447,100 10,000 E-75 IU XT26 3 1/2 1 1/2 14,800 367,400 8,900 E-75 EU XT31 3 7/8 2 1/8 16,600 415,100 10,000
2 7/8 10.40 X-95 EU NC31 4 1/8 2 13,200 495,700 7,100 X-95 IU NC26 3 1/2 1 1/2 8,800 390,300 4,900 X-95 EU SLH90 3 7/8 2 13,100 444,000 6,900 X-95 IU HT26 3 1/2 1 1/2 12,100 390,300 7,300 X-95 EU HT31 4 1/8 2 1/8 16,600 447,100 10,000 X-95 IU XT26 3 1/2 1 1/2 14,800 367,400 8,900 X-95 EU XT31 3 7/8 2 1/8 16,600 415,100 10,000
2 7/8 10.40 G-105 EU NC31 4 1/8 2 13,200 495,700 7,100 G-105 IU NC26 3 1/2 1 1/2 8,800 390,300 4,900 G-105 EU SLH90 3 7/8 2 13,100 444,000 6,900 G-105 IU HT26 3 5/8 1 1/2 13,100 390,300 7,900 G-105 EU HT31 4 1/8 2 1/8 16,600 447,100 10,000 G-105 IU XT26 3 1/2 1 1/2 14,800 367,400 8,900 G-105 EU XT31 3 7/8 2 1/8 16,600 415,100 10,000
2 7/8 10.40 S-135 EU NC31 4 1/8 2 13,200 495,700 7,100 S-135 IU NC26 3 5/8 1 1/2 9,000 390,300 4,900
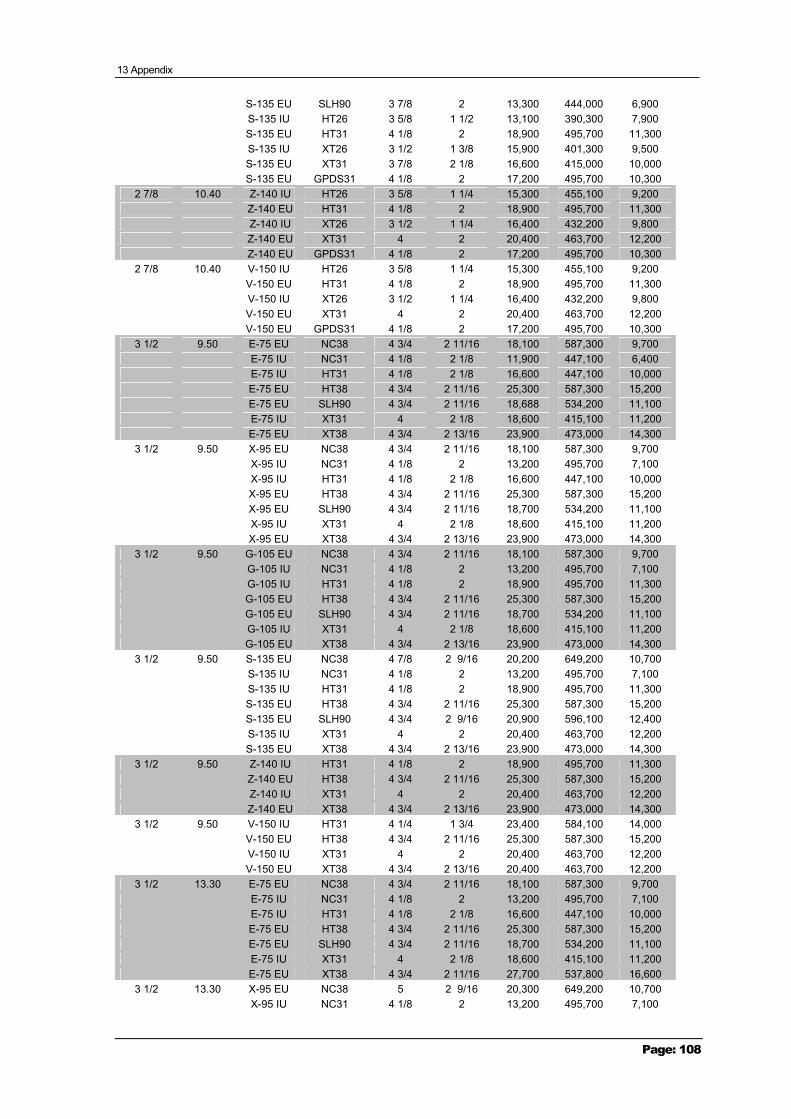
13 Appendix
Page: 108
S-135 EU SLH90 3 7/8 2 13,300 444,000 6,900 S-135 IU HT26 3 5/8 1 1/2 13,100 390,300 7,900 S-135 EU HT31 4 1/8 2 18,900 495,700 11,300 S-135 IU XT26 3 1/2 1 3/8 15,900 401,300 9,500 S-135 EU XT31 3 7/8 2 1/8 16,600 415,000 10,000 S-135 EU GPDS31 4 1/8 2 17,200 495,700 10,300
2 7/8 10.40 Z-140 IU HT26 3 5/8 1 1/4 15,300 455,100 9,200 Z-140 EU HT31 4 1/8 2 18,900 495,700 11,300 Z-140 IU XT26 3 1/2 1 1/4 16,400 432,200 9,800 Z-140 EU XT31 4 2 20,400 463,700 12,200 Z-140 EU GPDS31 4 1/8 2 17,200 495,700 10,300
2 7/8 10.40 V-150 IU HT26 3 5/8 1 1/4 15,300 455,100 9,200 V-150 EU HT31 4 1/8 2 18,900 495,700 11,300 V-150 IU XT26 3 1/2 1 1/4 16,400 432,200 9,800 V-150 EU XT31 4 2 20,400 463,700 12,200 V-150 EU GPDS31 4 1/8 2 17,200 495,700 10,300
3 1/2 9.50 E-75 EU NC38 4 3/4 2 11/16 18,100 587,300 9,700 E-75 IU NC31 4 1/8 2 1/8 11,900 447,100 6,400 E-75 IU HT31 4 1/8 2 1/8 16,600 447,100 10,000 E-75 EU HT38 4 3/4 2 11/16 25,300 587,300 15,200 E-75 EU SLH90 4 3/4 2 11/16 18,688 534,200 11,100 E-75 IU XT31 4 2 1/8 18,600 415,100 11,200 E-75 EU XT38 4 3/4 2 13/16 23,900 473,000 14,300
3 1/2 9.50 X-95 EU NC38 4 3/4 2 11/16 18,100 587,300 9,700 X-95 IU NC31 4 1/8 2 13,200 495,700 7,100 X-95 IU HT31 4 1/8 2 1/8 16,600 447,100 10,000 X-95 EU HT38 4 3/4 2 11/16 25,300 587,300 15,200 X-95 EU SLH90 4 3/4 2 11/16 18,700 534,200 11,100 X-95 IU XT31 4 2 1/8 18,600 415,100 11,200 X-95 EU XT38 4 3/4 2 13/16 23,900 473,000 14,300
3 1/2 9.50 G-105 EU NC38 4 3/4 2 11/16 18,100 587,300 9,700 G-105 IU NC31 4 1/8 2 13,200 495,700 7,100 G-105 IU HT31 4 1/8 2 18,900 495,700 11,300 G-105 EU HT38 4 3/4 2 11/16 25,300 587,300 15,200 G-105 EU SLH90 4 3/4 2 11/16 18,700 534,200 11,100 G-105 IU XT31 4 2 1/8 18,600 415,100 11,200 G-105 EU XT38 4 3/4 2 13/16 23,900 473,000 14,300
3 1/2 9.50 S-135 EU NC38 4 7/8 2 9/16 20,200 649,200 10,700 S-135 IU NC31 4 1/8 2 13,200 495,700 7,100 S-135 IU HT31 4 1/8 2 18,900 495,700 11,300 S-135 EU HT38 4 3/4 2 11/16 25,300 587,300 15,200 S-135 EU SLH90 4 3/4 2 9/16 20,900 596,100 12,400 S-135 IU XT31 4 2 20,400 463,700 12,200 S-135 EU XT38 4 3/4 2 13/16 23,900 473,000 14,300
3 1/2 9.50 Z-140 IU HT31 4 1/8 2 18,900 495,700 11,300 Z-140 EU HT38 4 3/4 2 11/16 25,300 587,300 15,200 Z-140 IU XT31 4 2 20,400 463,700 12,200 Z-140 EU XT38 4 3/4 2 13/16 23,900 473,000 14,300
3 1/2 9.50 V-150 IU HT31 4 1/4 1 3/4 23,400 584,100 14,000 V-150 EU HT38 4 3/4 2 11/16 25,300 587,300 15,200 V-150 IU XT31 4 2 20,400 463,700 12,200 V-150 EU XT38 4 3/4 2 13/16 20,400 463,700 12,200
3 1/2 13.30 E-75 EU NC38 4 3/4 2 11/16 18,100 587,300 9,700 E-75 IU NC31 4 1/8 2 13,200 495,700 7,100 E-75 IU HT31 4 1/8 2 1/8 16,600 447,100 10,000 E-75 EU HT38 4 3/4 2 11/16 25,300 587,300 15,200 E-75 EU SLH90 4 3/4 2 11/16 18,700 534,200 11,100 E-75 IU XT31 4 2 1/8 18,600 415,100 11,200 E-75 EU XT38 4 3/4 2 11/16 27,700 537,800 16,600
3 1/2 13.30 X-95 EU NC38 5 2 9/16 20,300 649,200 10,700 X-95 IU NC31 4 1/8 2 13,200 495,700 7,100
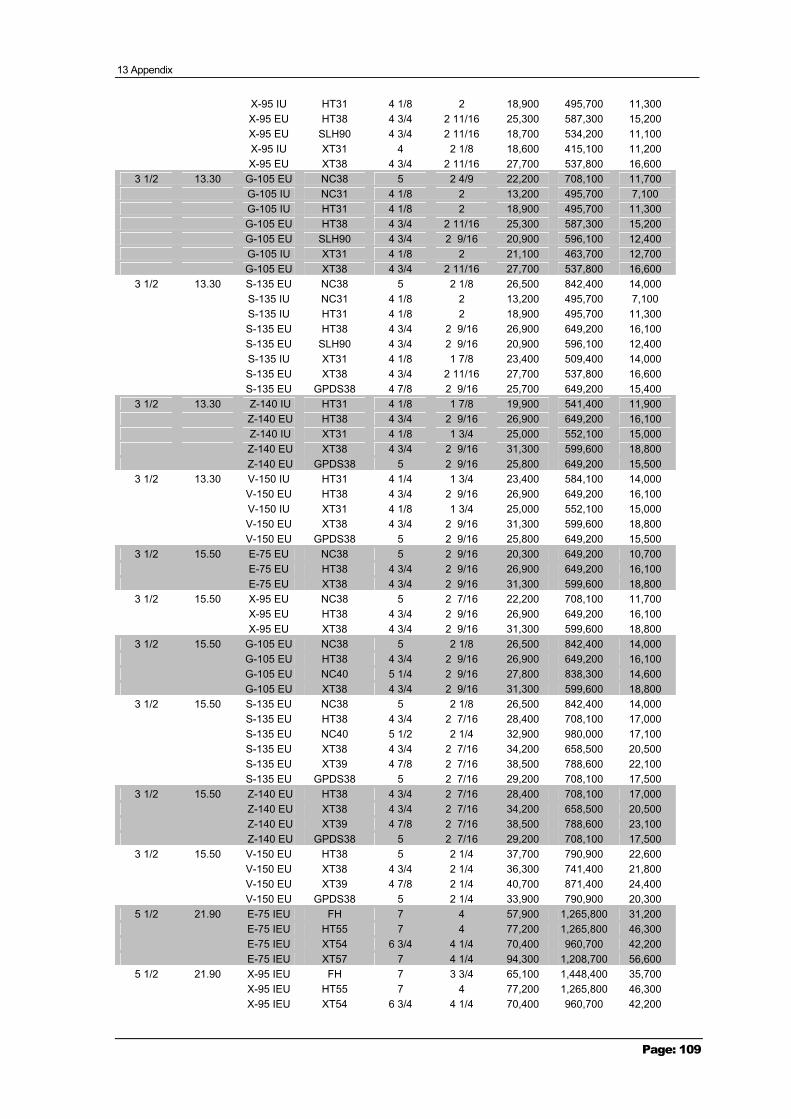
13 Appendix
Page: 109
X-95 IU HT31 4 1/8 2 18,900 495,700 11,300 X-95 EU HT38 4 3/4 2 11/16 25,300 587,300 15,200 X-95 EU SLH90 4 3/4 2 11/16 18,700 534,200 11,100 X-95 IU XT31 4 2 1/8 18,600 415,100 11,200 X-95 EU XT38 4 3/4 2 11/16 27,700 537,800 16,600
3 1/2 13.30 G-105 EU NC38 5 2 4/9 22,200 708,100 11,700 G-105 IU NC31 4 1/8 2 13,200 495,700 7,100 G-105 IU HT31 4 1/8 2 18,900 495,700 11,300 G-105 EU HT38 4 3/4 2 11/16 25,300 587,300 15,200 G-105 EU SLH90 4 3/4 2 9/16 20,900 596,100 12,400 G-105 IU XT31 4 1/8 2 21,100 463,700 12,700 G-105 EU XT38 4 3/4 2 11/16 27,700 537,800 16,600
3 1/2 13.30 S-135 EU NC38 5 2 1/8 26,500 842,400 14,000 S-135 IU NC31 4 1/8 2 13,200 495,700 7,100 S-135 IU HT31 4 1/8 2 18,900 495,700 11,300 S-135 EU HT38 4 3/4 2 9/16 26,900 649,200 16,100 S-135 EU SLH90 4 3/4 2 9/16 20,900 596,100 12,400 S-135 IU XT31 4 1/8 1 7/8 23,400 509,400 14,000 S-135 EU XT38 4 3/4 2 11/16 27,700 537,800 16,600 S-135 EU GPDS38 4 7/8 2 9/16 25,700 649,200 15,400
3 1/2 13.30 Z-140 IU HT31 4 1/8 1 7/8 19,900 541,400 11,900 Z-140 EU HT38 4 3/4 2 9/16 26,900 649,200 16,100 Z-140 IU XT31 4 1/8 1 3/4 25,000 552,100 15,000 Z-140 EU XT38 4 3/4 2 9/16 31,300 599,600 18,800 Z-140 EU GPDS38 5 2 9/16 25,800 649,200 15,500
3 1/2 13.30 V-150 IU HT31 4 1/4 1 3/4 23,400 584,100 14,000 V-150 EU HT38 4 3/4 2 9/16 26,900 649,200 16,100 V-150 IU XT31 4 1/8 1 3/4 25,000 552,100 15,000 V-150 EU XT38 4 3/4 2 9/16 31,300 599,600 18,800 V-150 EU GPDS38 5 2 9/16 25,800 649,200 15,500
3 1/2 15.50 E-75 EU NC38 5 2 9/16 20,300 649,200 10,700 E-75 EU HT38 4 3/4 2 9/16 26,900 649,200 16,100 E-75 EU XT38 4 3/4 2 9/16 31,300 599,600 18,800
3 1/2 15.50 X-95 EU NC38 5 2 7/16 22,200 708,100 11,700 X-95 EU HT38 4 3/4 2 9/16 26,900 649,200 16,100 X-95 EU XT38 4 3/4 2 9/16 31,300 599,600 18,800
3 1/2 15.50 G-105 EU NC38 5 2 1/8 26,500 842,400 14,000 G-105 EU HT38 4 3/4 2 9/16 26,900 649,200 16,100 G-105 EU NC40 5 1/4 2 9/16 27,800 838,300 14,600 G-105 EU XT38 4 3/4 2 9/16 31,300 599,600 18,800
3 1/2 15.50 S-135 EU NC38 5 2 1/8 26,500 842,400 14,000 S-135 EU HT38 4 3/4 2 7/16 28,400 708,100 17,000 S-135 EU NC40 5 1/2 2 1/4 32,900 980,000 17,100 S-135 EU XT38 4 3/4 2 7/16 34,200 658,500 20,500 S-135 EU XT39 4 7/8 2 7/16 38,500 788,600 22,100 S-135 EU GPDS38 5 2 7/16 29,200 708,100 17,500
3 1/2 15.50 Z-140 EU HT38 4 3/4 2 7/16 28,400 708,100 17,000 Z-140 EU XT38 4 3/4 2 7/16 34,200 658,500 20,500 Z-140 EU XT39 4 7/8 2 7/16 38,500 788,600 23,100 Z-140 EU GPDS38 5 2 7/16 29,200 708,100 17,500
3 1/2 15.50 V-150 EU HT38 5 2 1/4 37,700 790,900 22,600 V-150 EU XT38 4 3/4 2 1/4 36,300 741,400 21,800 V-150 EU XT39 4 7/8 2 1/4 40,700 871,400 24,400 V-150 EU GPDS38 5 2 1/4 33,900 790,900 20,300
5 1/2 21.90 E-75 IEU FH 7 4 57,900 1,265,800 31,200 E-75 IEU HT55 7 4 77,200 1,265,800 46,300 E-75 IEU XT54 6 3/4 4 1/4 70,400 960,700 42,200 E-75 IEU XT57 7 4 1/4 94,300 1,208,700 56,600
5 1/2 21.90 X-95 IEU FH 7 3 3/4 65,100 1,448,400 35,700 X-95 IEU HT55 7 4 77,200 1,265,800 46,300 X-95 IEU XT54 6 3/4 4 1/4 70,400 960,700 42,200
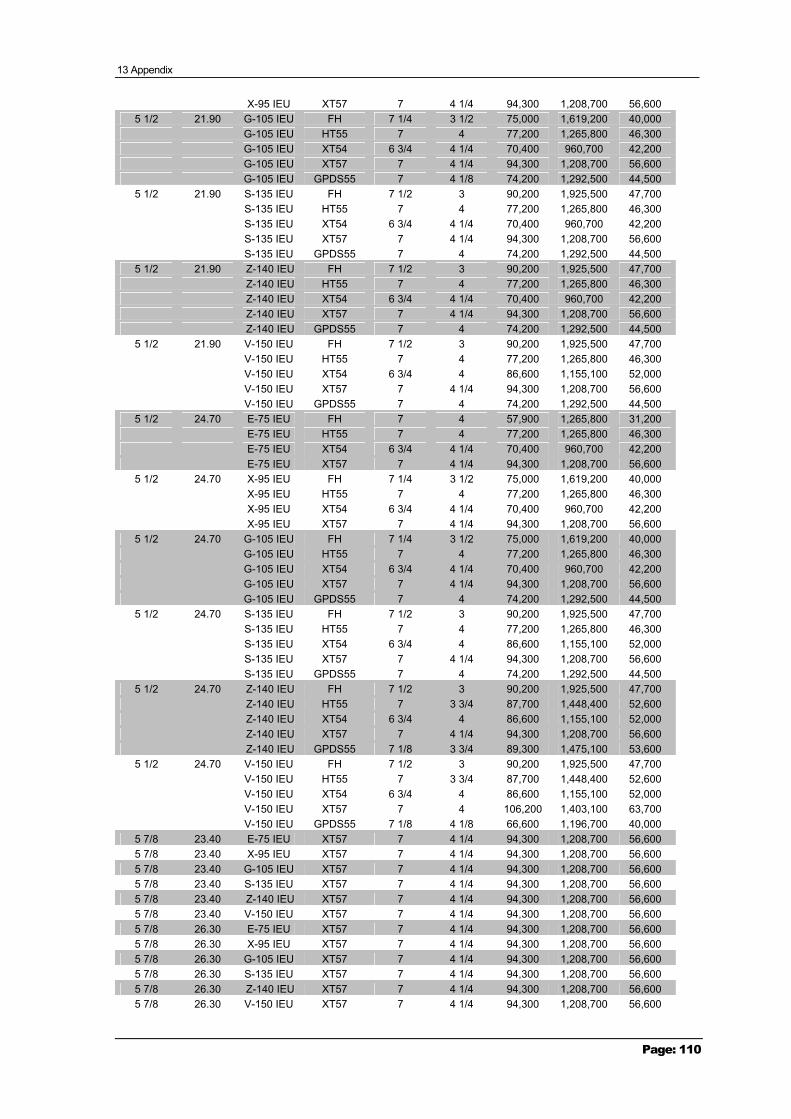
13 Appendix
Page: 110
X-95 IEU XT57 7 4 1/4 94,300 1,208,700 56,600 5 1/2 21.90 G-105 IEU FH 7 1/4 3 1/2 75,000 1,619,200 40,000
G-105 IEU HT55 7 4 77,200 1,265,800 46,300 G-105 IEU XT54 6 3/4 4 1/4 70,400 960,700 42,200 G-105 IEU XT57 7 4 1/4 94,300 1,208,700 56,600 G-105 IEU GPDS55 7 4 1/8 74,200 1,292,500 44,500
5 1/2 21.90 S-135 IEU FH 7 1/2 3 90,200 1,925,500 47,700 S-135 IEU HT55 7 4 77,200 1,265,800 46,300 S-135 IEU XT54 6 3/4 4 1/4 70,400 960,700 42,200 S-135 IEU XT57 7 4 1/4 94,300 1,208,700 56,600 S-135 IEU GPDS55 7 4 74,200 1,292,500 44,500
5 1/2 21.90 Z-140 IEU FH 7 1/2 3 90,200 1,925,500 47,700 Z-140 IEU HT55 7 4 77,200 1,265,800 46,300 Z-140 IEU XT54 6 3/4 4 1/4 70,400 960,700 42,200 Z-140 IEU XT57 7 4 1/4 94,300 1,208,700 56,600 Z-140 IEU GPDS55 7 4 74,200 1,292,500 44,500
5 1/2 21.90 V-150 IEU FH 7 1/2 3 90,200 1,925,500 47,700 V-150 IEU HT55 7 4 77,200 1,265,800 46,300 V-150 IEU XT54 6 3/4 4 86,600 1,155,100 52,000 V-150 IEU XT57 7 4 1/4 94,300 1,208,700 56,600 V-150 IEU GPDS55 7 4 74,200 1,292,500 44,500
5 1/2 24.70 E-75 IEU FH 7 4 57,900 1,265,800 31,200 E-75 IEU HT55 7 4 77,200 1,265,800 46,300 E-75 IEU XT54 6 3/4 4 1/4 70,400 960,700 42,200 E-75 IEU XT57 7 4 1/4 94,300 1,208,700 56,600
5 1/2 24.70 X-95 IEU FH 7 1/4 3 1/2 75,000 1,619,200 40,000 X-95 IEU HT55 7 4 77,200 1,265,800 46,300 X-95 IEU XT54 6 3/4 4 1/4 70,400 960,700 42,200 X-95 IEU XT57 7 4 1/4 94,300 1,208,700 56,600
5 1/2 24.70 G-105 IEU FH 7 1/4 3 1/2 75,000 1,619,200 40,000 G-105 IEU HT55 7 4 77,200 1,265,800 46,300 G-105 IEU XT54 6 3/4 4 1/4 70,400 960,700 42,200 G-105 IEU XT57 7 4 1/4 94,300 1,208,700 56,600 G-105 IEU GPDS55 7 4 74,200 1,292,500 44,500
5 1/2 24.70 S-135 IEU FH 7 1/2 3 90,200 1,925,500 47,700 S-135 IEU HT55 7 4 77,200 1,265,800 46,300 S-135 IEU XT54 6 3/4 4 86,600 1,155,100 52,000 S-135 IEU XT57 7 4 1/4 94,300 1,208,700 56,600 S-135 IEU GPDS55 7 4 74,200 1,292,500 44,500
5 1/2 24.70 Z-140 IEU FH 7 1/2 3 90,200 1,925,500 47,700 Z-140 IEU HT55 7 3 3/4 87,700 1,448,400 52,600 Z-140 IEU XT54 6 3/4 4 86,600 1,155,100 52,000 Z-140 IEU XT57 7 4 1/4 94,300 1,208,700 56,600 Z-140 IEU GPDS55 7 1/8 3 3/4 89,300 1,475,100 53,600
5 1/2 24.70 V-150 IEU FH 7 1/2 3 90,200 1,925,500 47,700 V-150 IEU HT55 7 3 3/4 87,700 1,448,400 52,600 V-150 IEU XT54 6 3/4 4 86,600 1,155,100 52,000 V-150 IEU XT57 7 4 106,200 1,403,100 63,700 V-150 IEU GPDS55 7 1/8 4 1/8 66,600 1,196,700 40,000
5 7/8 23.40 E-75 IEU XT57 7 4 1/4 94,300 1,208,700 56,600 5 7/8 23.40 X-95 IEU XT57 7 4 1/4 94,300 1,208,700 56,600 5 7/8 23.40 G-105 IEU XT57 7 4 1/4 94,300 1,208,700 56,600 5 7/8 23.40 S-135 IEU XT57 7 4 1/4 94,300 1,208,700 56,600 5 7/8 23.40 Z-140 IEU XT57 7 4 1/4 94,300 1,208,700 56,600 5 7/8 23.40 V-150 IEU XT57 7 4 1/4 94,300 1,208,700 56,600 5 7/8 26.30 E-75 IEU XT57 7 4 1/4 94,300 1,208,700 56,600 5 7/8 26.30 X-95 IEU XT57 7 4 1/4 94,300 1,208,700 56,600 5 7/8 26.30 G-105 IEU XT57 7 4 1/4 94,300 1,208,700 56,600 5 7/8 26.30 S-135 IEU XT57 7 4 1/4 94,300 1,208,700 56,600 5 7/8 26.30 Z-140 IEU XT57 7 4 1/4 94,300 1,208,700 56,600 5 7/8 26.30 V-150 IEU XT57 7 4 1/4 94,300 1,208,700 56,600
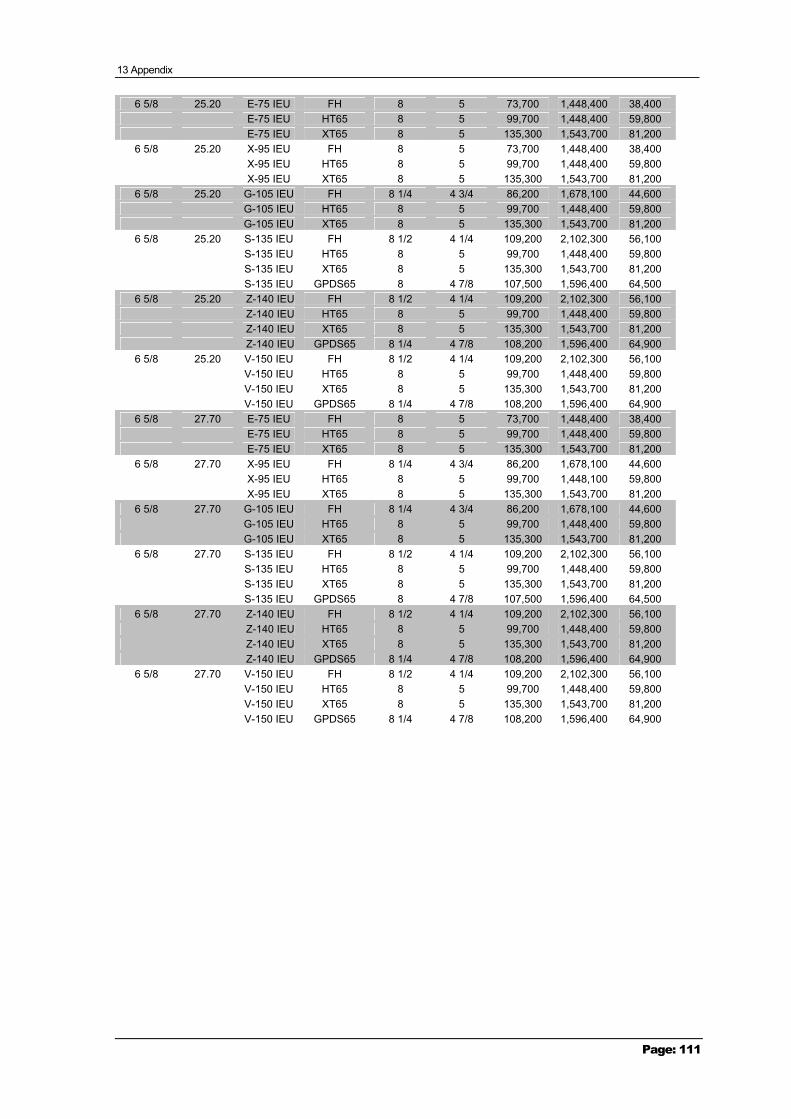
13 Appendix
Page: 111
6 5/8 25.20 E-75 IEU FH 8 5 73,700 1,448,400 38,400 E-75 IEU HT65 8 5 99,700 1,448,400 59,800 E-75 IEU XT65 8 5 135,300 1,543,700 81,200
6 5/8 25.20 X-95 IEU FH 8 5 73,700 1,448,400 38,400 X-95 IEU HT65 8 5 99,700 1,448,400 59,800 X-95 IEU XT65 8 5 135,300 1,543,700 81,200
6 5/8 25.20 G-105 IEU FH 8 1/4 4 3/4 86,200 1,678,100 44,600 G-105 IEU HT65 8 5 99,700 1,448,400 59,800 G-105 IEU XT65 8 5 135,300 1,543,700 81,200
6 5/8 25.20 S-135 IEU FH 8 1/2 4 1/4 109,200 2,102,300 56,100 S-135 IEU HT65 8 5 99,700 1,448,400 59,800 S-135 IEU XT65 8 5 135,300 1,543,700 81,200 S-135 IEU GPDS65 8 4 7/8 107,500 1,596,400 64,500
6 5/8 25.20 Z-140 IEU FH 8 1/2 4 1/4 109,200 2,102,300 56,100 Z-140 IEU HT65 8 5 99,700 1,448,400 59,800 Z-140 IEU XT65 8 5 135,300 1,543,700 81,200 Z-140 IEU GPDS65 8 1/4 4 7/8 108,200 1,596,400 64,900
6 5/8 25.20 V-150 IEU FH 8 1/2 4 1/4 109,200 2,102,300 56,100 V-150 IEU HT65 8 5 99,700 1,448,400 59,800 V-150 IEU XT65 8 5 135,300 1,543,700 81,200 V-150 IEU GPDS65 8 1/4 4 7/8 108,200 1,596,400 64,900
6 5/8 27.70 E-75 IEU FH 8 5 73,700 1,448,400 38,400 E-75 IEU HT65 8 5 99,700 1,448,400 59,800 E-75 IEU XT65 8 5 135,300 1,543,700 81,200
6 5/8 27.70 X-95 IEU FH 8 1/4 4 3/4 86,200 1,678,100 44,600 X-95 IEU HT65 8 5 99,700 1,448,100 59,800 X-95 IEU XT65 8 5 135,300 1,543,700 81,200
6 5/8 27.70 G-105 IEU FH 8 1/4 4 3/4 86,200 1,678,100 44,600 G-105 IEU HT65 8 5 99,700 1,448,400 59,800 G-105 IEU XT65 8 5 135,300 1,543,700 81,200
6 5/8 27.70 S-135 IEU FH 8 1/2 4 1/4 109,200 2,102,300 56,100 S-135 IEU HT65 8 5 99,700 1,448,400 59,800 S-135 IEU XT65 8 5 135,300 1,543,700 81,200 S-135 IEU GPDS65 8 4 7/8 107,500 1,596,400 64,500
6 5/8 27.70 Z-140 IEU FH 8 1/2 4 1/4 109,200 2,102,300 56,100 Z-140 IEU HT65 8 5 99,700 1,448,400 59,800 Z-140 IEU XT65 8 5 135,300 1,543,700 81,200 Z-140 IEU GPDS65 8 1/4 4 7/8 108,200 1,596,400 64,900
6 5/8 27.70 V-150 IEU FH 8 1/2 4 1/4 109,200 2,102,300 56,100 V-150 IEU HT65 8 5 99,700 1,448,400 59,800 V-150 IEU XT65 8 5 135,300 1,543,700 81,200 V-150 IEU GPDS65 8 1/4 4 7/8 108,200 1,596,400 64,900
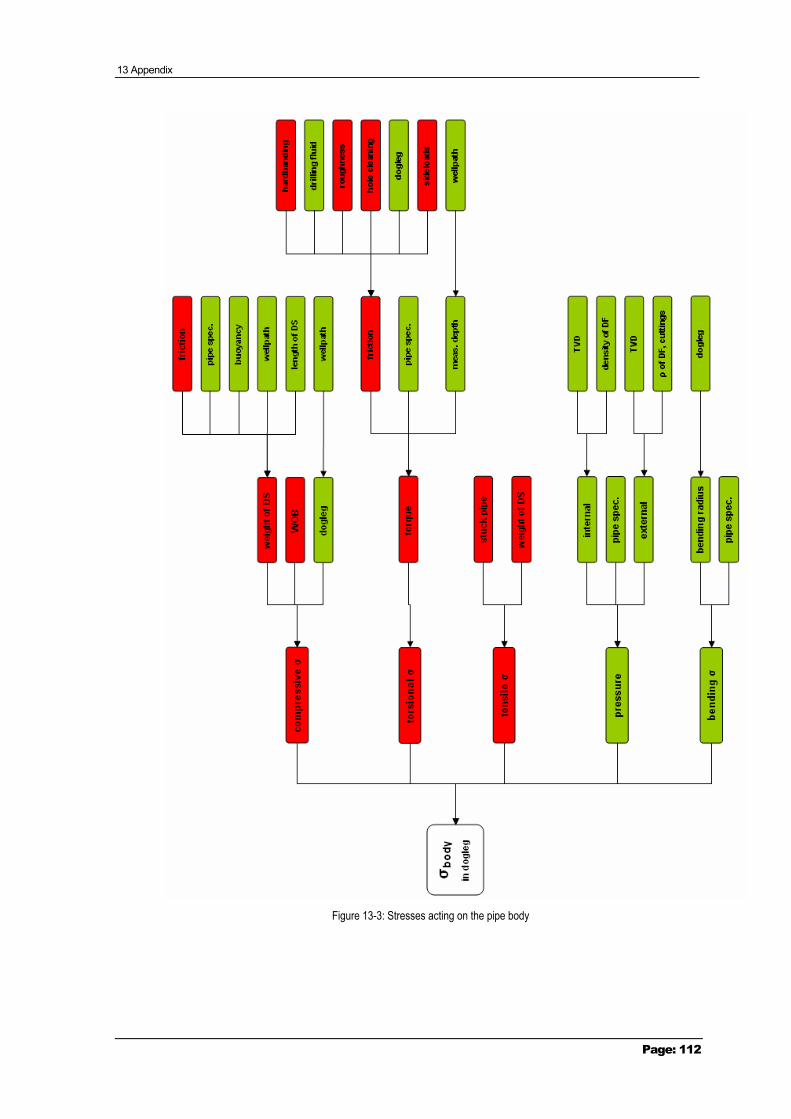
13 Appendix
Page: 112
Figure 13-3: Stresses acting on the pipe body
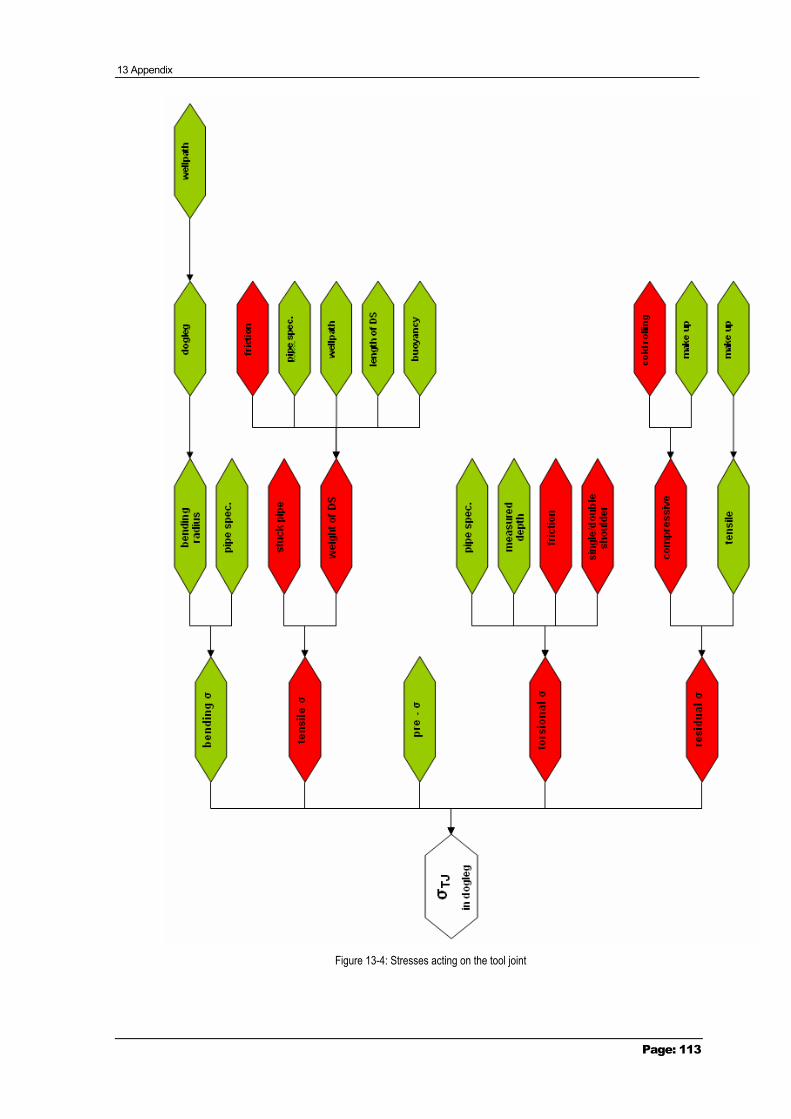
13 Appendix
Page: 113
Figure 13-4: Stresses acting on the tool joint
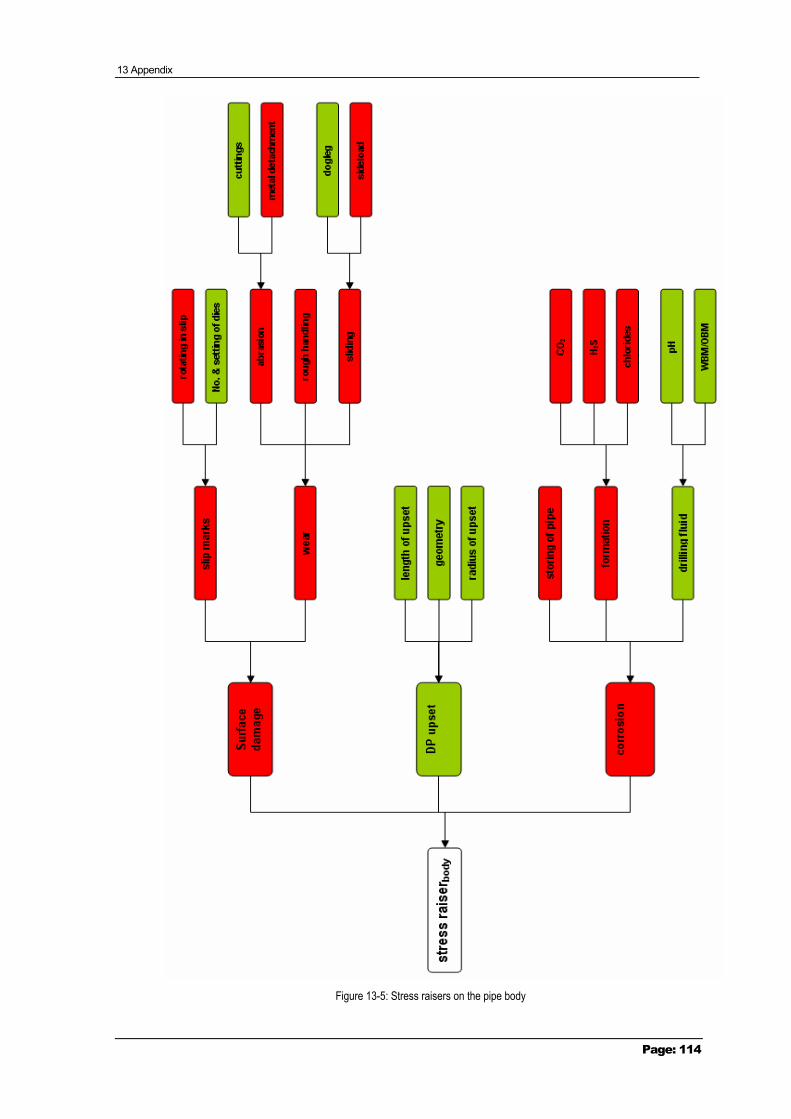
13 Appendix
Page: 114
Figure 13-5: Stress raisers on the pipe body
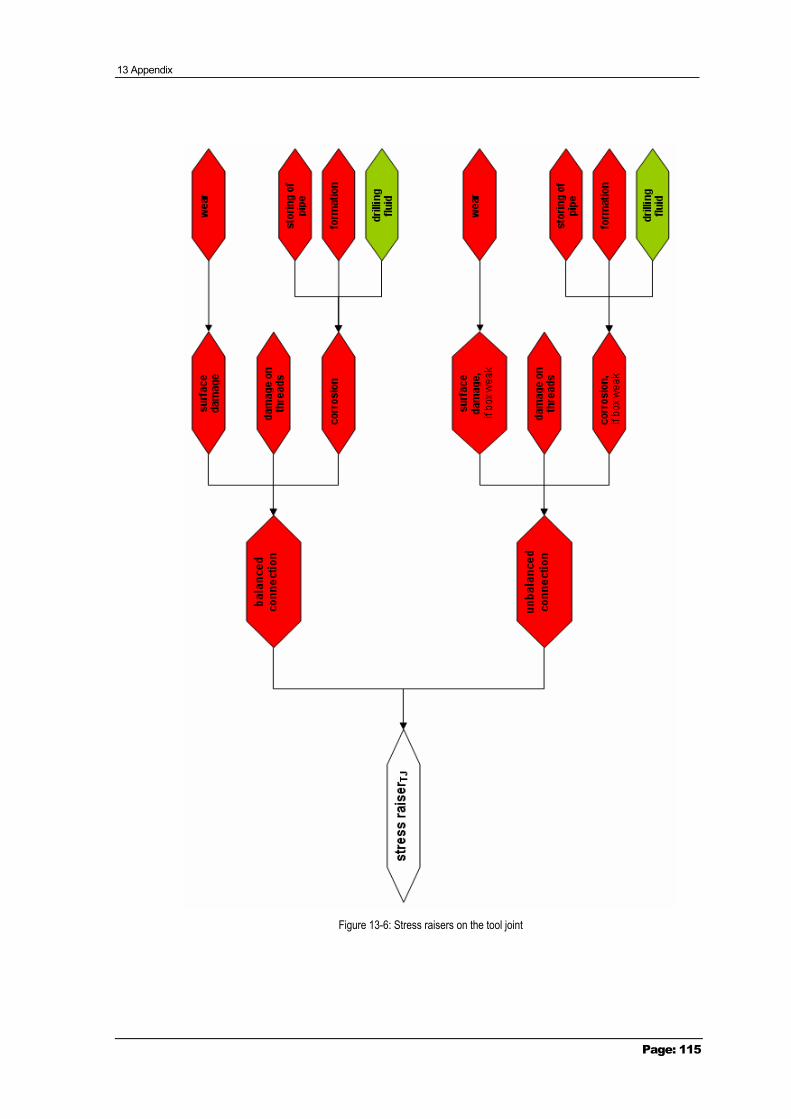
13 Appendix
Page: 115
Figure 13-6: Stress raisers on the tool joint