Embed Size (px)
Citation preview
F
N
MKa
b
c
d
e
a
ARRAA
KSSNS
1
wt(af
sb
mW
h0
Drug and Alcohol Dependence 161 (2016) 230–237
Contents lists available at ScienceDirect
Drug and Alcohol Dependence
j ourna l ho me pa g e: www.e l sev ier .com/ locate /druga l cdep
ull length article
etwork analysis of substance abuse and dependence symptoms
ijke Rhemtullaa,∗,1, Eiko I. Friedb,1, Steven H. Aggenc,d, Francis Tuerlinckxb,enneth S. Kendlerc,d,e, Denny Borsbooma
Department of Psychology, University of Amsterdam, The NetherlandsFaculty of Psychology and Educational Sciences, University of Leuven, BelgiumVirginia Institute for Psychiatric and Behavioral Genetics, Virginia Commonwealth University, Richmond, VA, USADepartment of Psychiatry, Virginia Commonwealth University, Richmond, VA, USADepartment of Human and Molecular Genetics, Virginia Commonwealth University, Richmond, VA, USA
r t i c l e i n f o
rticle history:eceived 3 September 2015eceived in revised form 15 January 2016ccepted 3 February 2016vailable online 6 February 2016
eywords:ubstance abuseubstance use disordersetwork analysisymptom interactions
a b s t r a c t
Background: The DSM uses one set of abuse and dependence criteria to assess multiple substance usedisorders (SUDs). Most SUD research aggregates across these symptoms to study the behavior of SUDas a static construct. We use an alternative approach that conceptualizes symptoms as directly inter-acting variables in psychopathological networks. We apply network models to symptom-level data toinvestigate the unique roles of individual symptoms and their interactions in SUD.Methods: We analyzed 11 DSM III-R/IV abuse and dependence criteria in a sample of 2405 adult twinswho reported use of at least one illicit substance six or more times from the Virginia Adult Twin Studyof Psychiatric and Substance Use Disorders (VATSPSUD). We estimated a symptom network for eachsubstance class as well as a global network collapsed across all substance classes. We examined similari-ties and differences across the 6 networks in terms of symptom-to-symptom connections and symptomcentrality.Results: The global network model revealed several interesting symptom connections, such as a strongpredictive relation between tolerance and more-than-planned substance use. The most central symp-tom was using a drug more than planned. In addition, several interesting differences across substances
emerged, both in the strength of symptom connections as well as the centrality of symptoms to eachnetwork.Conclusions: When analyzed as networks, abuse and dependence symptoms do not function equivalentlyacross illicit substance classes. These findings suggest the value of analyzing individual symptoms andtheir associations to gain new insight into the mechanisms of SUD.. Introduction
Drug abuse and dependence is a common and increasing world-ide public health concern (World Health Organization, 2010). In
he US, life-time prevalence estimates of substance use disordersSUD) range from 2–3% for illicit substances to 8% for alcohol use,nd 12-month rates of substance abuse or dependence increaserom 7% to 20% during adolescence (Merikangas and McClair, 2012).
Recent research in psychopathology indicates that the analy-is of individual symptoms can reveal crucial insights obfuscatedy other analytic strategies (Fried and Nesse, 2015; Smeets et al.,
∗ Corresponding author at: Programme Group Psychological Methods, Depart-ent of Psychology, University of Amsterdam, Nieuwe Achtergracht 129B, 1018S, Amsterdam, The Netherlands.
E-mail address: [email protected] (M. Rhemtulla).1 Both the authors contributed equally to this work.
ttp://dx.doi.org/10.1016/j.drugalcdep.2016.02.005376-8716/© 2016 Elsevier Ireland Ltd. All rights reserved.
© 2016 Elsevier Ireland Ltd. All rights reserved.
2014). A central tenet of symptom-based approaches is that inter-actions among symptoms may be central to understanding howdisorders arise, sustain themselves, and are cured (Borsboom andCramer, 2013; Buu et al., 2012; Cullen et al., 2013; Fergus et al.,2015; Fried, 2015; Jacobsen et al., 2001). A useful way to examinesuch symptom-level effects is to apply a network model, which usespairwise interactions among symptoms to represent a disorder asa web of mutually influencing symptoms (Borsboom and Cramer,2013). These models have been successfully applied to a numberof disorders such as posttraumatic stress disorder (McNally et al.,2015) and major depression (Fried et al., 2015).
The network framework is an appropriate and useful conceptualapproach to analyzing data whenever relations among symptoms
can be plausibly interpreted as interacting directly with each other.Similar to other disorders, there is evidence that SUD symptomsmay arise in a causal sequence; for example, drinking more alco-hol than planned is frequently the first symptom of alcohol use
ohol Dependence 161 (2016) 230–237 231
dtprmartnddsK
cdosistbwisdStdam
2
2
tcwtirF4m2sTifa1jscLrah
ireo
Table 1Substance abuse and dependence criteria used to determine diagnostic status foreach substance use disorder.
Variable Criterion
A1 . . . did you often use it when you were doing somethingimportant like being at school or work or taking care ofchildren?. . . did you stay away from work or school or missappointments because you were using it?
A2 . . . did you ever use it in a situation in which it might havebeen dangerous?
A3 . . . did you have legal problems or traffic accidents becauseyou were using it?
A4 . . . did your use of it cause problems with other peoplesuch as family members, friends, or people at work?
D1 . . . did you find that you needed to use a lot more in orderto (get high/feel its effects) than you did when you firststarted using it?
D2 . . . did you ever have withdrawal symptoms—that isfeeling sick when you cut down or stopped using it? . . . didyou often use it to keep from getting sick (with withdrawalsymptoms)?
D3 . . . did you often find that when you started using it, youended up taking much more than you had planned?
D4 . . . did you try to cut down or stop using it?D5 . . . did you spend a lot of time taking it or recovering from
using it, or doing whatever you had to do to get it?D6 . . . did you use it so often that you would use it instead of
working or spending time on hobbies or with your familyor friends?
D7 . . . did your use of it cause physical problems or make youdepressed or very nervous?
Note: the question stem for all items was, “During that time when you were using[drug] the most, . . . ”. Variables A1 and D2 were formed by collapsing two highlysimilar items; if either item was positively endorsed, the collapsed item was scored
cases were deleted.
M. Rhemtulla et al. / Drug and Alc
isorder to arise (Buu et al., 2012), which aligns with the findinghat impaired control over alcohol use is an important predictor ofroblem drinking in adolescents (Leeman et al., 2012). To date, noesearch has investigated such symptom interactions. A networkodel of SUD can give an overview of the connection patterns
mong symptoms, revealing which symptoms are most closelyelated to each other, and which symptoms are most central tohe disorder. In addition, network analyses allow us to compareetworks across several substance classes, and to locate importantifferences in the symptom-to-symptom pathways that may existue to distinct pharmacologic and psychological properties of theubstance and/or different patterns of use (Degenhardt et al., 2001;oob and Le Moal, 2006).
In the remainder of the paper, we present and interpret threeross-sectional network analyses of substance abuse and depen-ence symptoms. First, we examine a psychopathological networkf symptom data averaged over 6 illicit substance classes (cannabis,edatives, stimulants, cocaine, opioids, and hallucinogens) in 2,405ndividuals. We investigate the pairwise connections among 11ymptoms, and estimate measures of symptom centrality to iden-ify which symptoms may be most important in the maladaptiveehavior patterns of SUD. Second, we compute symptom net-orks for each of the substance classes separately. Our aim here
s to explore the important differences and similarities of sub-tance classes based on a network representation, and what theseifferences can tell us about the interconnectivity patterns ofUD symptoms. Finally, we estimate the variance of symptom-o-symptom connections across substance classes (i.e., how muchoes the strength of the association between symptom pairs varycross the six classes) to identify which of these connections varyost widely across substances.
. Method
.1. Sample
Data for the analyses carried out in this study come fromwins who participated in the Virginia Adult Twin Study of Psy-hiatric and Substance Use Disorders (VATSPSUD). Initial eligibilityas determined through successful matching of birth records, if
win members were Caucasian and born between 1940 and 1974n Virginia, USA. Detailed information about substance use andelated behaviors were obtained for 2 data collection samples.emale–female twins participating in the third follow-up (Wave, N = 1928 individuals interviewed by phone in 1995–1997) andale–male and male–female twins from the first follow-up (Wave
, N = 5,602 individuals personally interviewed in 1994–1998)erved as the sample pool of twins with valid substance use data.hese interviews included assessments of lifetime drug use andtems worded according to the DSM abuse and dependence criteriaor six categories of substances that were administered using andaptation of the Structured Clinical Interview (SCID; Spitzer et al.,987). Drug classes were defined as follows: cannabis (e.g., mari-
uana and hashish); sedatives (e.g., quaalude, Seconal and Valium);timulants (e.g., speed, ecstasy and Ritalin); cocaine (intranasal andrack); opioids (e.g., heroin and morphine); and hallucinogens (e.g.,SD and PCP). Of the sample pool of 7530 twins (44% female, ageange 20–63, mean age = 36.8, SD = 8.9), 2405 reported having usedt least one of the six substances more than 6 times during his orer life and were therefore retained for analysis.
The eleven SUD criteria are presented in Table 1. Each partic-
pant, based on his responses to the usage items, was asked toespond to some or all of the 4 abuse and 7 dependence criteria forach substance class using a 3 point response scale. The responseptions included two positive choices (e.g., “definitely” and “prob-as endorsed.
ably”) and one negative response (“no”). The individual symptomswere always asked for the time period in the respondent’s life whenthey were using that drug class the most. For the analyses reportedhere, responses were re-coded into binary variables1 by collapsingover the two positive response options.
2.1.1. Missing data. The analysis sample for each substance classincluded only those participants who reported having used the sub-stance 6 or more times. These participants were asked to indicatewhether they had ever used the substance at least 11 times duringa single month. Participants who reported not having used a par-ticular substance 11 times in a month were administered the setof abuse items (i.e., A1–A4), and were then administered the setof dependence items (i.e., D1–D7) only if they positively endorsedat least one of the abuse symptoms. For all analyses reportedhere, missing values generated by this imposed structured skip outwere set to zero, indicating an implied negative response for eachskipped item. Participants who reported having used a substance11 times in a month were administered all abuse and dependenceitems. Table 2 displays the number of participants falling into eachof these categories (i.e., 6 or more lifetime uses, endorsement of atleast one abuse criterion, and 11 or more uses in a month) for eachsubstance class. In addition to the structured skip-related missing-ness, 41 individuals had additional item-level missing data; these
1 There are two reasons for dichotomizing the responses. First, the category ‘prob-ably’ was, on average, much less endorsed than the other two, leading to smallcell optimization problems. Second, the behavior of potentially skewed polytomousvariables in network models is not well understood at present.
232 M. Rhemtulla et al. / Drug and Alcohol Dependence 161 (2016) 230–237
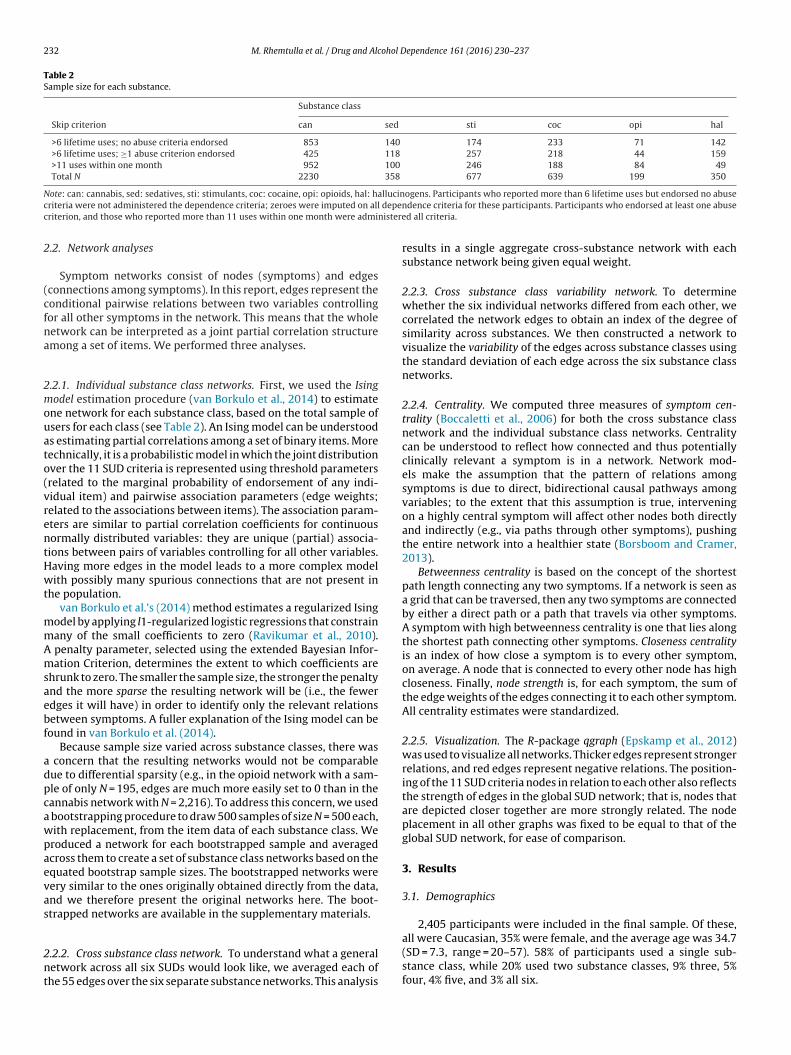
Table 2Sample size for each substance.
Substance class
Skip criterion can sed sti coc opi hal
>6 lifetime uses; no abuse criteria endorsed 853 140 174 233 71 142>6 lifetime uses; ≥1 abuse criterion endorsed 425 118 257 218 44 159>11 uses within one month 952 100 246 188 84 49Total N 2230 358 677 639 199 350
N llucinc depec nistere
2
(cfna
2mouato(vrentHwt
mmAmsaebf
adpcawpaevas
2nt
ote: can: cannabis, sed: sedatives, sti: stimulants, coc: cocaine, opi: opioids, hal: hariteria were not administered the dependence criteria; zeroes were imputed on allriterion, and those who reported more than 11 uses within one month were admi
.2. Network analyses
Symptom networks consist of nodes (symptoms) and edgesconnections among symptoms). In this report, edges represent theonditional pairwise relations between two variables controllingor all other symptoms in the network. This means that the wholeetwork can be interpreted as a joint partial correlation structuremong a set of items. We performed three analyses.
.2.1. Individual substance class networks. First, we used the Isingodel estimation procedure (van Borkulo et al., 2014) to estimate
ne network for each substance class, based on the total sample ofsers for each class (see Table 2). An Ising model can be understoods estimating partial correlations among a set of binary items. Moreechnically, it is a probabilistic model in which the joint distributionver the 11 SUD criteria is represented using threshold parametersrelated to the marginal probability of endorsement of any indi-idual item) and pairwise association parameters (edge weights;elated to the associations between items). The association param-ters are similar to partial correlation coefficients for continuousormally distributed variables: they are unique (partial) associa-ions between pairs of variables controlling for all other variables.aving more edges in the model leads to a more complex modelith possibly many spurious connections that are not present in
he population.van Borkulo et al.’s (2014) method estimates a regularized Ising
odel by applying l1-regularized logistic regressions that constrainany of the small coefficients to zero (Ravikumar et al., 2010).
penalty parameter, selected using the extended Bayesian Infor-ation Criterion, determines the extent to which coefficients are
hrunk to zero. The smaller the sample size, the stronger the penaltynd the more sparse the resulting network will be (i.e., the fewerdges it will have) in order to identify only the relevant relationsetween symptoms. A fuller explanation of the Ising model can beound in van Borkulo et al. (2014).
Because sample size varied across substance classes, there was concern that the resulting networks would not be comparableue to differential sparsity (e.g., in the opioid network with a sam-le of only N = 195, edges are much more easily set to 0 than in theannabis network with N = 2,216). To address this concern, we used
bootstrapping procedure to draw 500 samples of size N = 500 each,ith replacement, from the item data of each substance class. Weroduced a network for each bootstrapped sample and averagedcross them to create a set of substance class networks based on thequated bootstrap sample sizes. The bootstrapped networks wereery similar to the ones originally obtained directly from the data,nd we therefore present the original networks here. The boot-trapped networks are available in the supplementary materials.
.2.2. Cross substance class network. To understand what a generaletwork across all six SUDs would look like, we averaged each ofhe 55 edges over the six separate substance networks. This analysis
ogens. Participants who reported more than 6 lifetime uses but endorsed no abusendence criteria for these participants. Participants who endorsed at least one abused all criteria.
results in a single aggregate cross-substance network with eachsubstance network being given equal weight.
2.2.3. Cross substance class variability network. To determinewhether the six individual networks differed from each other, wecorrelated the network edges to obtain an index of the degree ofsimilarity across substances. We then constructed a network tovisualize the variability of the edges across substance classes usingthe standard deviation of each edge across the six substance classnetworks.
2.2.4. Centrality. We computed three measures of symptom cen-trality (Boccaletti et al., 2006) for both the cross substance classnetwork and the individual substance class networks. Centralitycan be understood to reflect how connected and thus potentiallyclinically relevant a symptom is in a network. Network mod-els make the assumption that the pattern of relations amongsymptoms is due to direct, bidirectional causal pathways amongvariables; to the extent that this assumption is true, interveningon a highly central symptom will affect other nodes both directlyand indirectly (e.g., via paths through other symptoms), pushingthe entire network into a healthier state (Borsboom and Cramer,2013).
Betweenness centrality is based on the concept of the shortestpath length connecting any two symptoms. If a network is seen asa grid that can be traversed, then any two symptoms are connectedby either a direct path or a path that travels via other symptoms.A symptom with high betweenness centrality is one that lies alongthe shortest path connecting other symptoms. Closeness centralityis an index of how close a symptom is to every other symptom,on average. A node that is connected to every other node has highcloseness. Finally, node strength is, for each symptom, the sum ofthe edge weights of the edges connecting it to each other symptom.All centrality estimates were standardized.
2.2.5. Visualization. The R-package qgraph (Epskamp et al., 2012)was used to visualize all networks. Thicker edges represent strongerrelations, and red edges represent negative relations. The position-ing of the 11 SUD criteria nodes in relation to each other also reflectsthe strength of edges in the global SUD network; that is, nodes thatare depicted closer together are more strongly related. The nodeplacement in all other graphs was fixed to be equal to that of theglobal SUD network, for ease of comparison.
3. Results
3.1. Demographics
2,405 participants were included in the final sample. Of these,
all were Caucasian, 35% were female, and the average age was 34.7(SD = 7.3, range = 20–57). 58% of participants used a single sub-stance class, while 20% used two substance classes, 9% three, 5%four, 4% five, and 3% all six.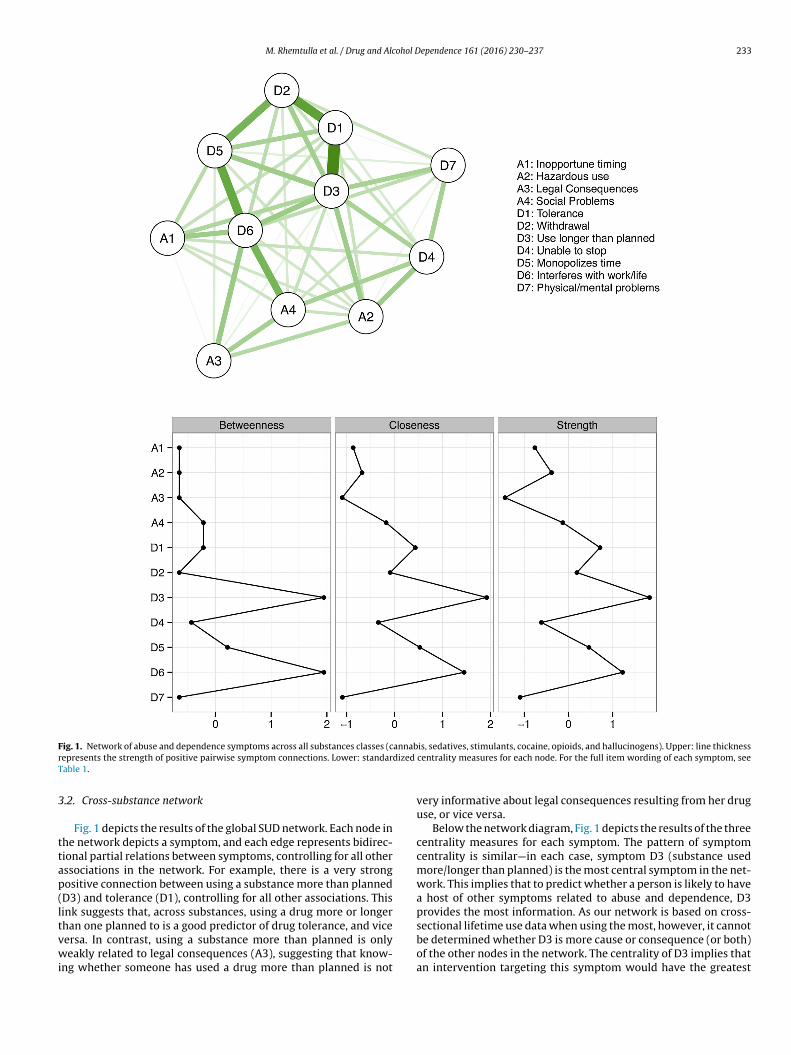
M. Rhemtulla et al. / Drug and Alcohol Dependence 161 (2016) 230–237 233
F annabr dized
T
3
ttap(ltvwi
ig. 1. Network of abuse and dependence symptoms across all substances classes (cepresents the strength of positive pairwise symptom connections. Lower: standarable 1.
.2. Cross-substance network
Fig. 1 depicts the results of the global SUD network. Each node inhe network depicts a symptom, and each edge represents bidirec-ional partial relations between symptoms, controlling for all otherssociations in the network. For example, there is a very strongositive connection between using a substance more than plannedD3) and tolerance (D1), controlling for all other associations. Thisink suggests that, across substances, using a drug more or longerhan one planned to is a good predictor of drug tolerance, and vice
ersa. In contrast, using a substance more than planned is onlyeakly related to legal consequences (A3), suggesting that know-ng whether someone has used a drug more than planned is not
is, sedatives, stimulants, cocaine, opioids, and hallucinogens). Upper: line thicknesscentrality measures for each node. For the full item wording of each symptom, see
very informative about legal consequences resulting from her druguse, or vice versa.
Below the network diagram, Fig. 1 depicts the results of the threecentrality measures for each symptom. The pattern of symptomcentrality is similar—in each case, symptom D3 (substance usedmore/longer than planned) is the most central symptom in the net-work. This implies that to predict whether a person is likely to havea host of other symptoms related to abuse and dependence, D3provides the most information. As our network is based on cross-sectional lifetime use data when using the most, however, it cannot
be determined whether D3 is more cause or consequence (or both)of the other nodes in the network. The centrality of D3 implies thatan intervention targeting this symptom would have the greatest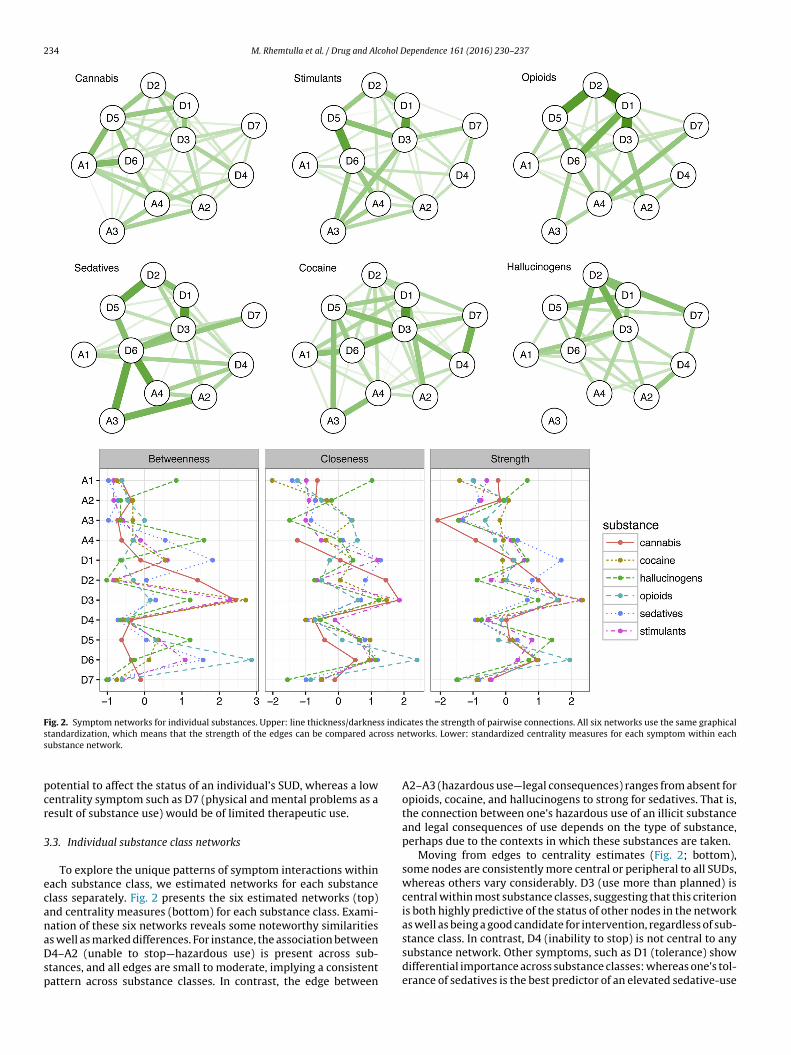
234 M. Rhemtulla et al. / Drug and Alcohol Dependence 161 (2016) 230–237
Fig. 2. Symptom networks for individual substances. Upper: line thickness/darkness indicates the strength of pairwise connections. All six networks use the same graphicals oss ns
pcr
3
ecanaDsp
tandardization, which means that the strength of the edges can be compared acrubstance network.
otential to affect the status of an individual’s SUD, whereas a lowentrality symptom such as D7 (physical and mental problems as aesult of substance use) would be of limited therapeutic use.
.3. Individual substance class networks
To explore the unique patterns of symptom interactions withinach substance class, we estimated networks for each substancelass separately. Fig. 2 presents the six estimated networks (top)nd centrality measures (bottom) for each substance class. Exami-ation of these six networks reveals some noteworthy similarities
s well as marked differences. For instance, the association between4–A2 (unable to stop—hazardous use) is present across sub-tances, and all edges are small to moderate, implying a consistentattern across substance classes. In contrast, the edge between
etworks. Lower: standardized centrality measures for each symptom within each
A2–A3 (hazardous use—legal consequences) ranges from absent foropioids, cocaine, and hallucinogens to strong for sedatives. That is,the connection between one’s hazardous use of an illicit substanceand legal consequences of use depends on the type of substance,perhaps due to the contexts in which these substances are taken.
Moving from edges to centrality estimates (Fig. 2; bottom),some nodes are consistently more central or peripheral to all SUDs,whereas others vary considerably. D3 (use more than planned) iscentral within most substance classes, suggesting that this criterionis both highly predictive of the status of other nodes in the networkas well as being a good candidate for intervention, regardless of sub-
stance class. In contrast, D4 (inability to stop) is not central to anysubstance network. Other symptoms, such as D1 (tolerance) showdifferential importance across substance classes: whereas one’s tol-erance of sedatives is the best predictor of an elevated sedative-use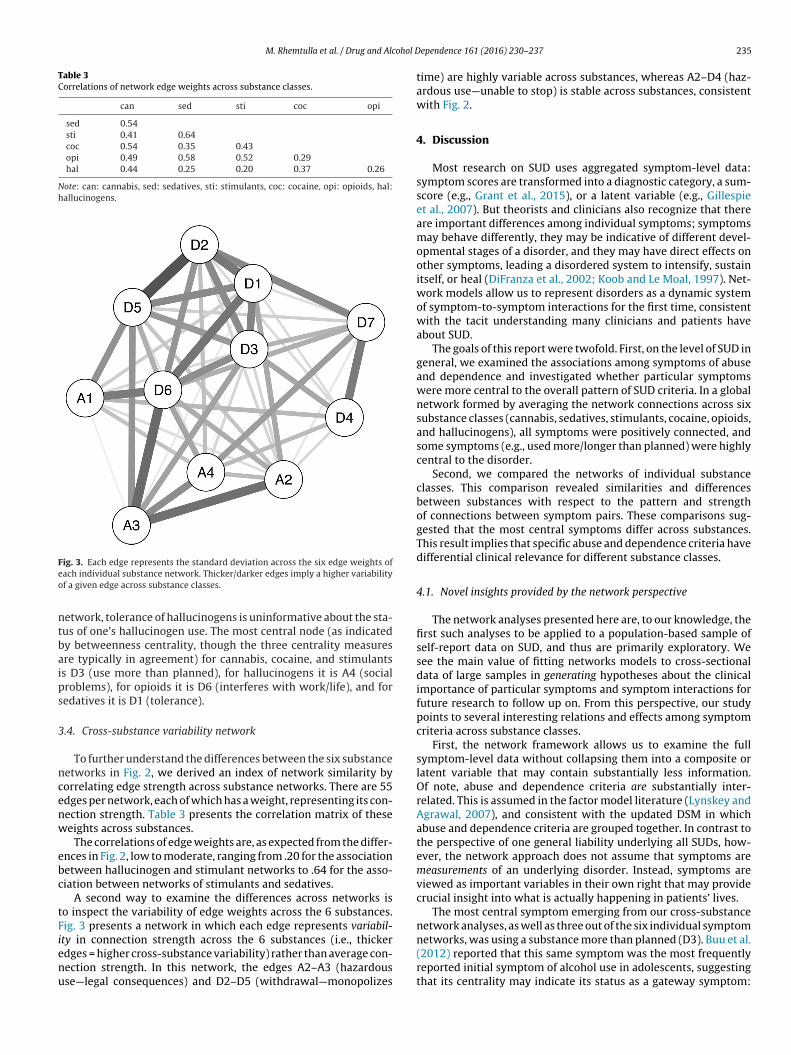
M. Rhemtulla et al. / Drug and Alcohol D
Table 3Correlations of network edge weights across substance classes.
can sed sti coc opi
sed 0.54sti 0.41 0.64coc 0.54 0.35 0.43opi 0.49 0.58 0.52 0.29hal 0.44 0.25 0.20 0.37 0.26
Note: can: cannabis, sed: sedatives, sti: stimulants, coc: cocaine, opi: opioids, hal:hallucinogens.
Feo
ntbaips
3
ncenw
ebc
tFienu
ig. 3. Each edge represents the standard deviation across the six edge weights ofach individual substance network. Thicker/darker edges imply a higher variabilityf a given edge across substance classes.
etwork, tolerance of hallucinogens is uninformative about the sta-us of one’s hallucinogen use. The most central node (as indicatedy betweenness centrality, though the three centrality measuresre typically in agreement) for cannabis, cocaine, and stimulantss D3 (use more than planned), for hallucinogens it is A4 (socialroblems), for opioids it is D6 (interferes with work/life), and foredatives it is D1 (tolerance).
.4. Cross-substance variability network
To further understand the differences between the six substanceetworks in Fig. 2, we derived an index of network similarity byorrelating edge strength across substance networks. There are 55dges per network, each of which has a weight, representing its con-ection strength. Table 3 presents the correlation matrix of theseeights across substances.
The correlations of edge weights are, as expected from the differ-nces in Fig. 2, low to moderate, ranging from .20 for the associationetween hallucinogen and stimulant networks to .64 for the asso-iation between networks of stimulants and sedatives.
A second way to examine the differences across networks iso inspect the variability of edge weights across the 6 substances.ig. 3 presents a network in which each edge represents variabil-
ty in connection strength across the 6 substances (i.e., thickerdges = higher cross-substance variability) rather than average con-ection strength. In this network, the edges A2–A3 (hazardousse—legal consequences) and D2–D5 (withdrawal—monopolizesependence 161 (2016) 230–237 235
time) are highly variable across substances, whereas A2–D4 (haz-ardous use—unable to stop) is stable across substances, consistentwith Fig. 2.
4. Discussion
Most research on SUD uses aggregated symptom-level data:symptom scores are transformed into a diagnostic category, a sum-score (e.g., Grant et al., 2015), or a latent variable (e.g., Gillespieet al., 2007). But theorists and clinicians also recognize that thereare important differences among individual symptoms; symptomsmay behave differently, they may be indicative of different devel-opmental stages of a disorder, and they may have direct effects onother symptoms, leading a disordered system to intensify, sustainitself, or heal (DiFranza et al., 2002; Koob and Le Moal, 1997). Net-work models allow us to represent disorders as a dynamic systemof symptom-to-symptom interactions for the first time, consistentwith the tacit understanding many clinicians and patients haveabout SUD.
The goals of this report were twofold. First, on the level of SUD ingeneral, we examined the associations among symptoms of abuseand dependence and investigated whether particular symptomswere more central to the overall pattern of SUD criteria. In a globalnetwork formed by averaging the network connections across sixsubstance classes (cannabis, sedatives, stimulants, cocaine, opioids,and hallucinogens), all symptoms were positively connected, andsome symptoms (e.g., used more/longer than planned) were highlycentral to the disorder.
Second, we compared the networks of individual substanceclasses. This comparison revealed similarities and differencesbetween substances with respect to the pattern and strengthof connections between symptom pairs. These comparisons sug-gested that the most central symptoms differ across substances.This result implies that specific abuse and dependence criteria havedifferential clinical relevance for different substance classes.
4.1. Novel insights provided by the network perspective
The network analyses presented here are, to our knowledge, thefirst such analyses to be applied to a population-based sample ofself-report data on SUD, and thus are primarily exploratory. Wesee the main value of fitting networks models to cross-sectionaldata of large samples in generating hypotheses about the clinicalimportance of particular symptoms and symptom interactions forfuture research to follow up on. From this perspective, our studypoints to several interesting relations and effects among symptomcriteria across substance classes.
First, the network framework allows us to examine the fullsymptom-level data without collapsing them into a composite orlatent variable that may contain substantially less information.Of note, abuse and dependence criteria are substantially inter-related. This is assumed in the factor model literature (Lynskey andAgrawal, 2007), and consistent with the updated DSM in whichabuse and dependence criteria are grouped together. In contrast tothe perspective of one general liability underlying all SUDs, how-ever, the network approach does not assume that symptoms aremeasurements of an underlying disorder. Instead, symptoms areviewed as important variables in their own right that may providecrucial insight into what is actually happening in patients’ lives.
The most central symptom emerging from our cross-substancenetwork analyses, as well as three out of the six individual symptom
networks, was using a substance more than planned (D3). Buu et al.(2012) reported that this same symptom was the most frequentlyreported initial symptom of alcohol use in adolescents, suggestingthat its centrality may indicate its status as a gateway symptom:
2 ohol D
losb(toustp
ftsiddtctaud
rFabcsLetcafhit
suasgirWaomsuwswwv
4
wie
36 M. Rhemtulla et al. / Drug and Alc
osing control over how much of a drug one takes, or how longne takes it, may precipitate a host of other abuse and dependenceymptoms. In addition, our analyses revealed a strong interactionetween using a substance more than planned (D3) and toleranceD1). This result aligns with Buu et al.’s finding that these two symp-oms tend to be the first symptoms that appear in the developmentf problematic alcohol use. These two symptoms may be key tonderstanding the development and maintenance of SUDs. Futuretudies should investigate the functional properties of these symp-oms, similar to work in depression (Fried and Nesse, 2015) andsychosis (Bentall et al., 2014; Coltheart et al., 2011).
Second, our findings suggest that symptoms differ in theirunctional properties across substance classes. One such func-ional property is centrality, which summarizes the probability thatymptoms trigger other symptoms and thus predict a negative clin-cal course. We have shown that different symptoms are central toifferent substance networks; for instance, the extent to which arug interferes with work and life in general (D6) is especially cen-ral for opioids compared to other SUDs. This sort of specificity isonsistent with previous findings that psychometric properties ofhese symptoms such as item difficulty and discrimination differcross substance classes (Gillespie et al., 2007), and suggest follow-p research to further explore functional differences of abuse andependence criteria.
Third, symptoms pairs vary in whether and how strongly theyelate to each other, depending on the type of substance consumed.rom a purely pharmacological perspective, several of these resultsre novel. For example, the correlation of edge weights is highetween stimulants and sedatives, despite quite different pharma-ologic properties, and low between cocaine and stimulants despiteimilar biological effects on brain dopamine systems (Koob ande Moal, 2006). At least two other important factors may influ-nce the structural properties of the specific substance networks:he social context in which drugs are taken, and the psychologi-al experiences sought by the drug user. For example, stimulantsre sometimes abused for their effects on attention and to reduceatigue while cocaine is most commonly consumed for its strongedonic effect (Koob and Le Moal, 2006). Further research may clar-
fy the meaning of these findings and elucidate the degree to whichhey result from biological versus social or psychological processes.
Fourth, there may be particular pathways common to all sub-tances; for example, we identified strong associations betweensing substances longer than planned, withdrawal, and toler-nce. Interestingly, the variability across substances for theseymptom-to-symptom associations was only moderate. This sug-ests a number of tentative path configurations that may benvolved in drug abuse that should be tested in prospectiveesearch, for instance in individuals at a high risk for relapse.
hile this path configuration of three symptoms was present forll individual substance classes (and most pronounced for opi-ids), differences between substance class networks suggest thatore drug-specific pathways may also exist. For example, the
edatives network featured strong connections between hazardousse, legal consequences, social problems, and interfering withork/life. The present cross-sectional analysis cannot reveal which
ymptoms are causes, consequences, or both; however, the net-ork approach gives new insight into relations among symptoms,hich insight is not possible when modeling sum scores or latent
ariables.
.2. Limitations
The present analyses offer a first look at what information net-ork models can provide about SUD, but these results should be
nterpreted in light of a number of limitations. Most critically, mod-ling cross-sectional data cannot reveal the causal nature of the
ependence 161 (2016) 230–237
connections between pairs of symptoms, leaving it unclear whichsymptoms cause which others, and leaving open the possibility offeedback loops among symptoms. To uncover how a dynamic sys-tem of symptoms behaves, intensive longitudinal symptom datawill be necessary (Wichers, 2013).
A related limitation is that the present networks aggregatesymptom-level data across participants (i.e., inter-individual dif-ferences), revealing patterns of partial correlations based onaggregating across the entire sample. These relations may or maynot hold at the level of the individual; that is, inter-individualsymptom interactions may not translate to intra-individual inter-actions. For example, when the SUD system varies dramaticallyacross individuals, the group network will reflect the average overmany individual networks, rather than one that describes any givenindividual. Furthermore, conclusions drawn about effective inter-ventions (e.g., based on symptom centrality) assume that the samesymptoms that are central in the inter-individual network will alsobe central in the network of a given individual. Network analysesof subgroups can begin to address this problem, when it is possibleto identify subgroups of participants who are likely to have similarnetworks (e.g., patients who remit vs. those who persist in theirdisorder, van Borkulo et al., 2014). To estimate individual patientnetworks, intensive longitudinal data from individuals is required(Molenaar, 2013).
The network approach makes the assumption that all variablesrelevant for the network are included in the analysis. If an impor-tant variable that has strong connections to two nodes in thenetwork is omitted, this omission may substantially alter the rela-tionships among these two nodes as well as others. One possiblyrelevant symptom that is missing in these data is craving, whichwas included in the DSM-5 SUD criteria.
The skip structure built into the substance use section of theinterview relies on the assumption that participants who reportednot using a particular substance at least 11 times in a month and didnot endorse any of the abuse symptoms would not have positivelyendorsed any dependence symptoms. For these participants in thenetwork analyses conducted in this study, dependence symptomswere coded as zero. Although unlikely, it is possible that someonecould endorse some dependence symptoms in the absence of abusesymptoms and without ever having used a substance 11 times in amonth.
Our dataset is limited in that participants were ethnically homo-geneous (i.e., they are White Virginians), which is both helpful toour analyses (subgroups may have introduced additional variabilityinto the network, and we lack power to investigate relevant sub-group differences) and also a detriment: the network results maynot generalize to other subpopulations.
Finally, we have 4406 SUD cases in 2405 participants, implyingthat about 42% of the study population were in multiple sub-stance use categories. For one, this means that a network such asthe cannabis network is not a network of individuals who usedonly cannabis, but a network of individuals who use either onlycannabis, or cannabis and one or more of the other five substances.To control for this dependency we could drop all participants withmultiple use from the data; however, the sample would be nearlycut in half, and individual substance samples would be too small toestimate Ising models. Moreover, excluding multiple users resultsin somewhat artificial samples and potentially decreased general-izability of the results, because nearly half of all individuals do usemore than one substance. A second possibility to address this fea-ture of these data is to randomly assign all multiple users to one oftheir multiple substance classes, leading to 2405 observations for
2405 individuals; this way, all individuals are retained in the analy-sis. However, individual substance networks become substantiallysmaller, and especially for the already small samples such as opi-oids (N = 195) this leads to samples in which an Ising model cannot
ohol D
ba
F
cntIfI
C
t
U
iUs
e
iUsG
t
C
A
tD
R
B
B
B
B
C
perspective of mental disorder that meets current challenges. Psychol. Med.
M. Rhemtulla et al. / Drug and Alc
e reliably estimated. In sum, multiple use remains a substantivend methodological challenge for future studies.
unding source
This work was supported by the European Research Coun-il (MR; FP7/2007-2013 no. 631145, and DB; consolidator granto. 647209), the Research Foundation Flanders (EIF; G.0806.13),he Belgian Federal Science Policy within the framework of thenteruniversity Attraction Poles program (EIF; IAP/P7/06), a grantrom the University of Leuven (EIF; GOA/15/003), and the Nationalnstitutes of Health (KSK; grants RO1DA037558 and R01DA03005).
ontributors
Mijke Rhemtulla, Department of Psychology, University of Ams-erdam, The Netherlands
Eiko I. Fried, Faculty of Psychology and Educational Sciences,niversity of Leuven, Belgium
Steven H. Aggen, Virginia Institute for Psychiatric and Behav-oral Genetics, Virginia Commonwealth University, Richmond, VA,SA; Department of Psychiatry, Virginia Commonwealth Univer-
ity, Richmond, VA, USAFrancis Tuerlinckx, Faculty of Psychology and Educational Sci-
nces, University of Leuven, BelgiumKenneth S. Kendler, Virginia Institute for Psychiatric and Behav-
oral Genetics, Virginia Commonwealth University, Richmond, VA,SA; Department of Psychiatry, Virginia Commonwealth Univer-
ity, Richmond, VA, USA; Department of Human and Molecularenetics, Virginia Commonwealth University, Richmond, VA, USA
Denny Borsboom, Department of Psychology, University of Ams-erdam, The Netherlands
*M. Rhemtulla and E.I. Fried contributed equally to this work
onflict of interest
None.
cknowledgements
We would like to express our gratitude to all participants ofhe Virginia Adult Twin Study of Psychiatric and Substance Useisorders study.
eferences
entall, R.P., de Sousa, P., Varese, F., Wickham, S., Sitko, K., Haarmans, M., Read, J.,2014. From adversity to psychosis: pathways and mechanisms from specificadversities to specific symptoms. Social Psychiatry Psychiatr. Epidemiol. 49,1011–1022.
occaletti, S., Latora, V., Moreno, Y., Chavez, M., Hwang, D., 2006. Complexnetworks: structure and dynamics. Phys. Rep. 424, 175–308.
orsboom, D., Cramer, A.O.J., 2013. Network analysis: an integrative approach tothe structure of psychopathology. Annu. Rev. Clin. Psychol. 9, 91–121.
uu, A., Wang, W., Schroder, S.A., Kalaida, N.L., Puttler, L.I., Zucker, R.A., 2012.Developmental emergence of alcohol use disorder symptoms and their
potential as early indicators for progression to alcohol dependence in a highrisk sample: a longitudinal study from childhood to early adulthood. J.Abnorm. Psychol. 121, 897–908.oltheart, M., Langdon, R., McKay, R., 2011. Delusional belief. Annu. Rev. Psychol.62, 271–298.
ependence 161 (2016) 230–237 237
Cullen, B.A., La Flair, L.N., Storr, C.L., Green, K.M., Alvanzo, A.A.H., Mojtabai, R.,Pacek, L.R., Crum, R.M., 2013. Association of comorbid generalized anxietydisorder and alcohol use disorder symptoms with health-related quality oflife: results from the national epidemiological survey on alcohol and relatedconditions. J. Addict. Med. 7, 394–400.
Degenhardt, L., Hall, W., Lynskey, M., 2001. Alcohol, cannabis and tobacco useamong Australians: a comparison of their associations with other drug use anduse disorders, affective and anxiety disorders, and psychosis. Addiction 96,1603–1614.
DiFranza, J.R., Savageau, J.A., Rigotti, N.A., Fletcher, K., Ockene, J.K., McNeill, A.D.,Coleman, M., Wood, C., 2002. Development of symptoms of tobaccodependence in youths: 30 month follow up data from the DANDY study. Tob.Control 11, 228–235.
Epskamp, S., Cramer, A.O.J., Waldorp, L.J., Schmittmann, V.D., Borsboom, D., 2012.qgraph: network visualizations of relationships in psychometric data. J. Stat.Softw. 48, 1–18.
Fergus, T.A., Valentiner, D.P., Wu, K.D., McGrath, P.B., 2015. Examining thesymptom-level specificity of negative problem orientation in a clinical sample.Cogn. Behav. Ther. 44, 153–161.
Fried, E.I., 2015. Problematic assumptions have slowed down depression research:why symptoms, not syndromes are the way forward. Front. Psychol. 6, 1–11.
Fried, E.I., Bockting, C., Arjadi, R., Borsboom, D., Amshoff, M., Cramer, A.O.,Epskamp, S., Tuerlinckx, F., Carr, D., Stroebe, M., 2015. From loss to loneliness:the relationship between bereavement and depressive symptoms. J. Abnorm.Psychol. 124, 256–265.
Fried, E.I., Nesse, R.M., 2015. Depression sum-scores do not add up: why analyzingspecific depression symptoms is essential. BMC Med. 13, 1–11.
Gillespie, N.A., Neale, M.C., Prescott, C.A., Aggen, S.H., Kendler, K.S., 2007. Factorand item-response analysis DSM-IV criteria for abuse of and dependence oncannabis, cocaine, hallucinogens, sedatives, stimulants and opioids. Addiction102, 920–930.
Grant, B.F., Goldstein, R.B., Smith, S.M., Jung, J., Zhang, H., Chou, S.P., Pickering, R.P.,Ruan, W.J., Huang, B., Saha, T.D., Aivadyan, C., 2015. The alcohol use disorderand associated disabilities interview schedule-5 (AUDADIS-5): reliability ofsubstance use and psychiatric disorder modules in a general populationsample. Drug Alcohol Depend. 148, 27–33.
Jacobsen, L.K., Southwick, S.M., Kosten, T.R., 2001. Substance use disorders inpatients with posttraumatic stress disorder: a review of the literature. Am. J.Psychiat. 158, 1184–1190.
Koob, G.F., Le Moal, M., 1997. Drug abuse: hedonic homeostatic dysregulation.Science 278, 52–58.
Koob, G.F., Le Moal, M., 2006. Neurobiology Of Addiction. Elsevier Inc., London, UK.Leeman, R.F., Patock-Peckham, J.A., Potenza, M.N., 2012. Impaired control over
alcohol use: an under-addressed risk factor for problem drinking in youngadults? Exp. Clin. Psychopharmacol. 20, 92–106.
Lynskey, M.T., Agrawal, A., 2007. Psychometric properties of DSM assessments ofillicit drug abuse and dependence: results from the National EpidemiologicSurvey on Alcohol and Related Conditions (NESARC). Psychol. Med. 37,1345–1355.
McNally, R.J., Robinaugh, D.J., Wu, G.W., Wang, L., Deserno, M.K., Borsboom, D.,2015. Mental disorders as causal systems a network approach to posttraumaticstress disorder. Clin. Psychol. Sci. 3, 836–849.
Merikangas, K.R., McClair, V.L., 2012. Epidemiology of substance use disorders.Hum. Genet. 131, 779–789.
Molenaar, P.C., 2013. On the necessity to use person-specific data analysisapproaches in psychology. Eur. J. Dev. Psychol. 10, 29–39.
Ravikumar, P., Wainwright, M.J., Lafferty, J.D., 2010. High-dimensional Ising modelselection using � 1—regularized logistic regression. Ann. Stat. 38, 1287–1319.
Smeets, F., Lataster, T., Viechtbauer, W., Delespaul, P., 2014. Evidence thatenvironmental and genetic risks for psychotic disorder may operate byimpacting on connections between core symptoms of perceptual alterationand delusional ideation. Schizophr. Bull., epub.
Spitzer, R., Williams, J., Gibbon, M., 1987. Structured Clinical Interview forDSM-III-R-Patient Version (SCID-P,4/1/87). New York State PsychiatricInstitute, New York.
van Borkulo, C.D., Borsboom, D., Epskamp, S., Blanken, T.F., Boschloo, L., Schoevers,R.A., Waldorp, L.J., 2014. A new method for constructing networks from binarydata. Sci. Rep. 4, 1–10.
Wichers, M.C., 2013. The dynamic nature of depression: a new micro-level
616, 1–12.World Health Organization, 2010. Atlas on Substance Use: Resources for the
Prevention and Treatment of Substance Use Disorders. World HealthOrganization Geneva, pp. 2010.