Embed Size (px)
Citation preview

Drug Impaired Driving: Importance of Toxicology in Assessing the Problem and
Developing Countermeasures
McGovern Award DinnerCosmos Club, Washington DC, June 2006
Barry K Logan PhD, DABFT
WA State Toxicologist
Director, Forensic Laboratory Services Bureau
Washington State Patrol

• How do we know if we have a problem?– Household surveys
– Trauma admissions
– Fatally injured drivers
– Surviving drivers in fatal crashes
– Drivers arrested for DUI
Alcohol, Drugs and Driving

• How do we know if we have a problem?– Household surveys
– Trauma admissions
– Fatally injured drivers
– Surviving drivers in fatal crashes
– Drivers arrested for DUI
Alcohol, Drugs and Driving

• Household Survey, 2004 (prior year)
– Any Illicit Drug Use 19.9 Million 8.3%
– Marijuana 14.6 million 6.1%
– Cocaine 2.0 Million 0.8%
– Methamphetamine 1.4 Million 0.5%
– Hallucinogens 0.93 Million 0.4%
Alcohol, Drugs and Driving
SAMHSA, Household Drug Use Survey, 2004

Alcohol, Drugs and Driving
Logan, J For Sci, 1996 41(3);457-464

• Household Survey, 2003-4 (Driving)– In 2004, an estimated 13.5 percent of persons aged 12 or older (~32
Million) drove under the influence of alcohol at least once in the past year. – In 2003, an estimated 10.9 million persons reported driving under the
influence of an illicit drug during the past year. This corresponds to 4.6 percent of the population aged 12 or older.
– The 2003 rates were 14.1 percent among young adults aged 18 to 25 and 3.1 percent among adults aged 26 or older. These rates were all similar to the 2002 rates.
Alcohol, Drugs and Driving
SAMHSA's National Surveys on Drug Use and Health, 2003, 2004

• Household Surveys, 2002-3 (DUI arrests)– 5.9% of drivers 21 and older reporting that they had
driven under the influence of alcohol and illicit drugs during the past year had been arrested for DUI in the past year
– 4.8% of those driving under the influence of only illicit drugs had been arrested for DUI in the past year
– 2.9% of those who had driven under the influence of only alcohol during the past year had been arrested for DUI in the past year.
Alcohol, Drugs and Driving
SAMHSA's National Surveys on Drug Use and Health in 2002 and 2003

• How do we know if we have a problem?– Household surveys
– Trauma admissions
– Fatally injured drivers
– Surviving drivers in fatal crashes
– Drivers arrested for DUI
Alcohol, Drugs and Driving

Drug and Alcohol Use Among Drivers Admitted to a Level-1 Trauma Center
Alcohol, Drugs and Driving
108 Drivers from MVC tested for illicit drug use
Walsh JM, Flegel R, et al Acc Anal Prev 37 (2005) 894–901
66% drug/ alcohol pos.
51% drug pos.

Drug and Alcohol Use Among Drivers Admitted to a Level-1 Trauma Center
Alcohol, Drugs and Driving
108 Drivers from MVC tested for illicit drug use
Walsh JM, Flegel R, et al Acc Anal Prev 37 (2005) 894–901
Alcohol 30.6%Marijuana 26.9%
(Alcohol also 37.9%)Cocaine 11.6%Methamphetamine 5.6%Benzodiazepines 11.2%Opiates 10.2%

• How do we know if we have a problem?– Household surveys
– Trauma admissions
– Fatally injured drivers
– Surviving drivers in fatal crashes
– Drivers arrested for DUI
Alcohol, Drugs and Driving

Combined Drug and Alcohol use in Fatally Injured Drivers in Washington State• Sample submissions from 39 counties; coroners/
medical examiners
• Drivers who died within 4hrs of traffic crash from February 1, 2001 to January 31, 2002
• 657 traffic fatalities 397 (60.4%) drivers 171 (26%) passengers 75 (11.4%) pedestrians
• N=370 (93%) driver cases suitable for testing
Schwilke, dos Santos, Logan, J For Sci, in press 2006

38%17%
18%
27%
No Alcohol or DrugsAlcohol OnlyAlcohol and DrugsDrugs Only
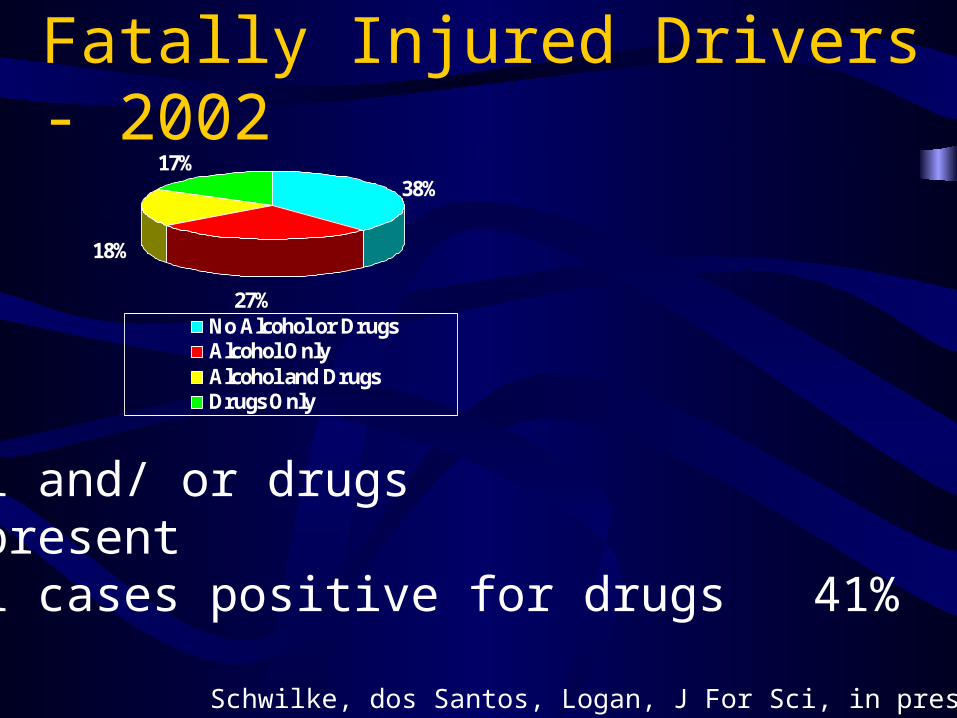
Fatally Injured Drivers - 2002
Schwilke, dos Santos, Logan, J For Sci, in press 2006
38%17%
18%
27%
No Alcohol or DrugsAlcohol OnlyAlcohol and DrugsDrugs Only
Fatally Injured Drivers - 2002
•Alcohol and/ or drugs 62%•Drugs present 35%•Alcohol cases positive for drugs 41%
Schwilke, dos Santos, Logan, J For Sci, in press 2006

Drug Positivity 1992/93% Pos 2001/02% Pos Marijuana 11.01 12.7
Cocaine/met 3.14 3.51
Amphetamines ** 1.89 4.86
Benzodiazepines ** 1.26 4.05
Diphenhydramine ** 0.63 2.70
Hydrocodone ** 0.31 1.89
Phenytoin ** 0 1.89
Morphine 1.26 1.62
Doxylamine 0.63 0
Amitriptyline 0.31 1.08
Schwilke, dos Santos, Logan, J For Sci, in press 2006

Fat
ally
Inj
ured
Dri
vers
BAC >0.00 (n=150)
n %
Cannabinoids 27 17.33
Cocaine 12 8.00
Diphenydramine 7 4.67
Methamphetamine 6 4.00
Methadone 4 2.67
Nordiazepam 4 2.67
Hydrocodone 3 2.00
Midazolam 2 1.33
MDMA 1 0.67
potentially impairing drug 62 41.33
Schwilke, dos Santos, Logan, J For Sci, in press 2006

• How do we know if we have a problem?– Household surveys
– Trauma admissions
– Fatally injured drivers
– Surviving drivers in fatal crashes
– Drivers arrested for DUI
Alcohol, Drugs and Driving

• % Drivers tested for Alcohol FARS Data Set, NHTSA
Alcohol, Drugs and Driving
0%10%20%30%40%50%60%70%80%90%
100%
New
Ham
psh
ire
Ver
mo
nt
Haw
aii
Wis
con
sin
Cal
ifo
rnia
New
Mex
ico
Illin
ois
Oh
ioN
ebra
ska
Wes
t V
irg
inia
Mai
ne
Was
hin
gto
nR
ho
de
Isla
nd
Okl
aho
ma
Ore
go
nD
istr
ict
of
Mo
nta
na
No
rth
Dak
ota
Mis
sou
riP
enn
sylv
ania
So
uth
Car
olin
aM
aryl
and
So
uth
Dak
ota
Nev
ada
Idah
oW
yom
ing
No
rth
Car
olin
aIn
dia
na
Mic
hig
anN
ew J
erse
yD
elaw
are
Uta
hM
inn
eso
taC
on
nec
ticu
tF
lori
da
Ken
tuck
yA
rkan
sas
New
Yo
rkA
rizo
na
Vir
gin
iaG
eorg
iaC
olo
rad
oK
ansa
sT
exas
Mis
siss
ipp
iL
ou
sian
aIo
wa
Ala
ska
Ten
nes
see
Mas
sach
use
tts
Ala
bam
a
% Deceased Drivers (64%)
% Surviving Drivers (25%)
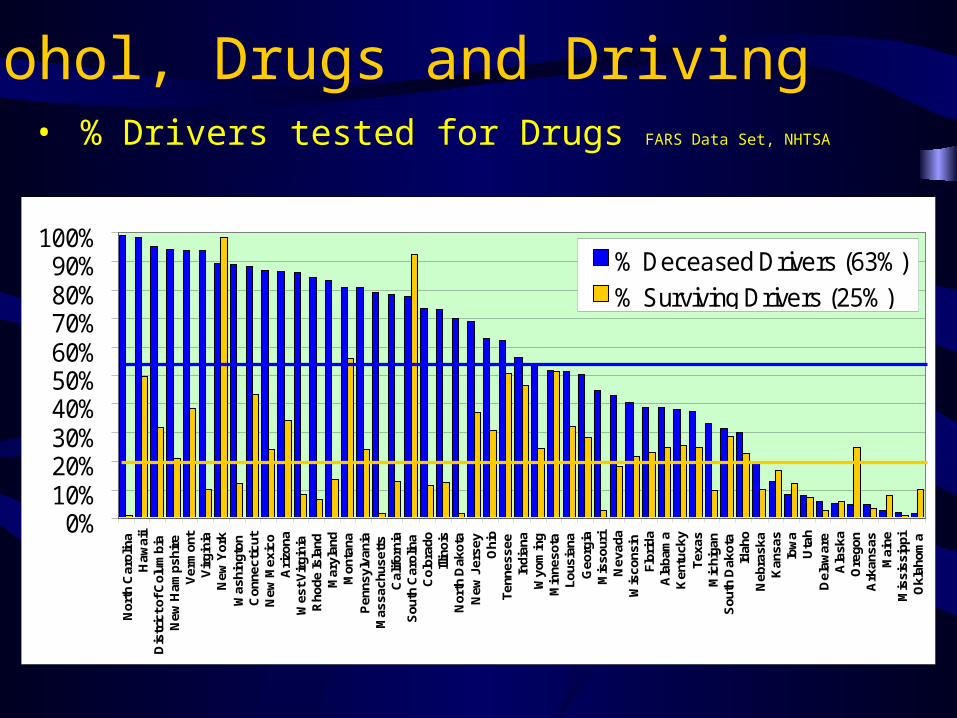
• % Drivers tested for Drugs FARS Data Set, NHTSA
Alcohol, Drugs and Driving
0%10%20%30%40%50%60%70%80%90%
100%
Nor
th C
arol
ina
Haw
aii
Dis
tric
t of C
olum
bia
New
Ham
pshi
reV
erm
ont
Vir
gini
aN
ew Y
ork
Was
hing
ton
Con
nect
icut
New
Mex
ico
Ari
zona
Wes
t Vir
gini
aR
hode
Isla
ndM
aryl
and
Mon
tana
Pen
nsyl
vani
aM
assa
chus
etts
Cal
iforn
iaS
outh
Car
olin
aC
olor
ado
Illin
ois
Nor
th D
akot
aN
ew J
erse
yO
hio
Tenn
esse
eIn
dian
aW
yom
ing
Min
neso
taLo
usia
naG
eorg
iaM
isso
uri
Nev
ada
Wis
cons
inFl
orid
aA
laba
ma
Ken
tuck
yTe
xas
Mic
higa
nS
outh
Dak
ota
Idah
oN
ebra
ska
Kan
sas
Iow
aU
tah
Del
awar
eA
lask
aO
rego
nA
rkan
sas
Mai
neM
issi
ssip
piO
klah
oma
% Deceased Drivers (63%)% Surviving Drivers (25%)

Alcohol and Traffic Fatalities 2004 Limitations of FARS data:“One of the major differences among States is in the degree of testing for driver and non-occupant BACs. These differences in testing affect the accuracy and reliability of the estimates presented, which for 2004 range from a low of 7-percent-known BACs to a high of 82-percent-known BACs. States with higher rates of known BACs yield estimates of fatal crash alcohol involvement with greater accuracy and precision.”
NCSA States Alcohol Estimates 2004

• How do we know if we have a problem?– Household surveys
– Trauma admissions
– Fatally injured drivers
– Surviving drivers in fatal crashes
– Drivers arrested for DUI
Alcohol, Drugs and Driving

Combined Drug and Alcohol Use in Drivers Suspected of Vehicular Assault and Homicide.
Samples collected:Based on circumstancesBased on appearance of subjectBased on DRE evaluationBased on subject requestBased on injuries to suspect, and exigent sample collection.
Logan BK, Barnes L, AAFS, Feb 2006

18%
82%
No Alcohol or Drugs
Alcohol and/or Drugs
Vehicular Assault and Homicide(2002-2003, n=700 drivers)
Logan BK, Barnes L, AAFS, Feb 2006

18%
82%
No Alcohol or Drugs
Alcohol and/or Drugs
Alcohol and Drug Use
38%
62%
•Fatally injured drivers
•Felony collisionsuspects
Logan BK, Barnes L, AAFS, Feb 2006

18%18%
33% 32%
No Alcohol or Drugs - 18%Alcohol only - 32%Alcohol and Drugs - 33%Drugs Only - 18%
Vehicular Assault and Homicide (2002-2003 n=700 drivers)
Logan BK, Barnes L, AAFS, Feb 2006
51%Drug
positive

38%17%
18%
27%
Combined Alcohol and Drug Use
•Fatally injured drivers
•Felony collisionsuspects
18%18%
33% 32%
No Alcohol or Drugs
Alcohol OnlyAlcohol and Drugs
Drugs Only

SummaryComparing felony suspects and fatally injured drivers.
Felony Deceased
Positive alc and/or drug
82% 62%
Any alcohol positive
55% 45%
Any drug positive
51% 35%
Logan BK, Barnes L, AAFS, Feb 2006

Felony Collisions – Drug use by BAC
ALCOHOL >0.08MarijuanaBenzodiazepinesOpiatesCocaineAmphetamines14%86%
>0.08BAC
58%
21%
28%7%
7%
•458 drivers had alcohol on board•43 of 66 (65%) were drug positive•66 (14%) had BAC <0.08
Logan BK, Barnes L, AAFS, Feb 2006

ConclusionsAbout 65% of suspects in vehicular
homicides and assaults with blood alcohol 0.01 - 0.08g/100mL, have impairing drugs on board.When impairment doesn’t match the BAC -
think about other drugs.
Synergistic drug effects can produce marked symptoms even with low BAC.
Predominantly drugs of abuse.

ALCOHOL <0.08MarijuanaBenzodiazepinesOpiatesCocaineAmphetamines
14%86%
>0.08BAC
26.7%
8.9%
12.8%4.8%
2.0%
•458 drivers (65%) had alcohol on board•392 (86%) had BAC >0.08•192 of 392 (49%) had drugs present also.
Felony Collisions – Drug use by BAC
Logan BK, Barnes L, AAFS, Feb 2006

ConclusionsAbout 49% of suspects in vehicular
homicides and assaults with blood alcohol greater than 0.08, have impairing drugs on board.The investigation usually stops with BAC
>0.08%.
Polysubstance use is the norm, rather than the exception.
Comprehensive toxicology is needed

Conclusions Combined alcohol and drug use is a frequent
finding in traffic trauma drivers, felony DUI suspects, and deceased drivers.
Lack of comprehensive testing obscures true rates of drug use by drivers in both populations.
Detection of drug use in impaired drivers is limited by officer awareness, lack of training, sample collection and laboratory resources.

Conclusions Toxicologists are ill-prepared to testify in drug
impairment cases, with few centralized resources, and limited relevant research
Prosecutors are often reluctant to take these cases to trial, as they are complex, require use of expert witnesses, involve extensive discovery, generate time consuming motions, and result in lengthy trials

When things go wrong…• School-bus driver charged in death;
allegedly took drugs
• Seattle Times February 28th 2004
• A 42-year-old woman was high on morphine when she drove a school bus that struck and killed a 13-year-old student in December, Pierce County police and prosecutors say in charges filed yesterday.

When things go wrong…• Subject seemed “upset”
• No SFSTs administered
• No DRE called
• “voluntary” blood draw.
• ToxicologyMorphine 0.13mg/LBupropionBupropion metabolites
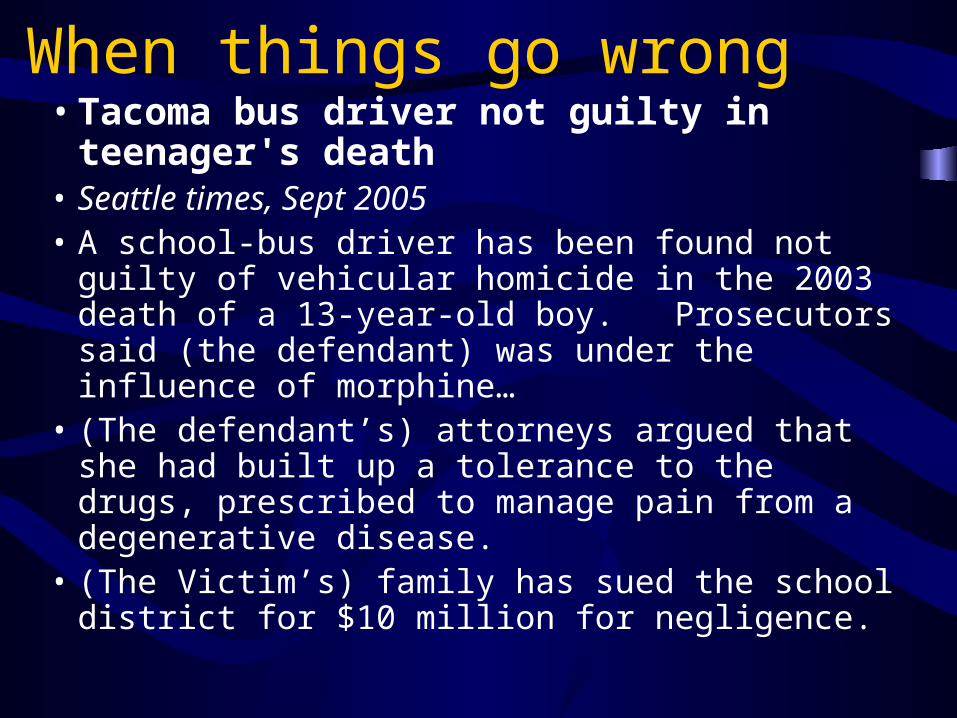
When things go wrong• Tacoma bus driver not guilty in teenager's
death • Seattle times, Sept 2005• A school-bus driver has been found not guilty of
vehicular homicide in the 2003 death of a 13-year-old boy. Prosecutors said (the defendant) was under the influence of morphine…
• (The defendant’s) attorneys argued that she had built up a tolerance to the drugs, prescribed to manage pain from a degenerative disease.
• (The Victim’s) family has sued the school district for $10 million for negligence.

• Goals Remove drug impaired drivers from the road.
Assess incidence and demographics of DUID
Educate about the effects of drugs and driving.
Discourage the drug-impaired from driving.
Change learned drug-driving behaviors.
DUID – Nowhere to go but up…

• Enforcement Make Traffic Law Enforcement a priority
Train officers to recognize drug impairment
Provide specialized training in documenting drug impairment
Screen all causing drivers for impairment
Provide toxicology resources to LEA’s
Raise awareness of DUID among prosecutors
Tried and True Approaches

Officers trained in recognizing drug impairment.
0
500
1000
1500
2000
2500
3000
3500
4000
4500
1996 1997 1998 1999 2000 2001 2002 2003

Drugs and Driving Cases Submitted
0
500
1000
1500
2000
2500
3000
1993 1994 1995 1996 1997 1998 1999 2000 2001 2002 2003 2004
DREDUI - Drugs

• ToxicologyHave a more comprehensive policy in testing
for drugs in traffic crimes
Test all deceased drivers for the presence of drugs and alcohol
Report to FARS
Test for both illicit and prescription drugs at realistic cut-offs
Tried and True Approaches

Drugs and Traffic Fatalities
0%10%20%30%40%50%60%70%80%90%
100%19
9319
9419
9519
9619
9719
9819
9920
0020
0120
0220
0320
04*
Deceased
Surviving
•WA Drivers tested for Drugs

Blood Screening Practices
Drug/Drug Class Cut Off (ng/mL)
Mode (ng/mL)
Amphetamines 20-1000 50
Barbiturates 2-1000 100
Benzodiazepines 1-300 100
Cannabinoids 2-50 20
Cocaine met. 20-300 50
Methadone 20-200 50
Morphine 20-200 50
PCP 2.5-100 10
Meprobamate 2-5000 1000SOFT/AAFS Survey 2005
• Government Provide incentives to states to pass DUID laws,
including per se approach for controlled substances
Provide incentives and resources targeted at traffic law enforcement
Collect and provide drug test data to document trends and demographics
Coordinate research efforts in DUID detection, technology, research and investigation
Tried and True Approaches

0
500
1000
1500
2000
2500
3000
Jan-
99
May
-99
Sep-9
9
Jan-
00
May
-00
Sep-0
0
Jan-
01
May
-01
Sep-0
1
Jan-
02
May
-02
Sep-0
2
Jan-
03
May
-03
Sep-0
3
Jan-
04
May
-04
Sep-0
4
DUI Arrests
Linear (DUIArrests)
Use of NHTSA Funding for DUI Emphasis*
WSP DUI Enforcement 1999-2004*402, 157 and 163 funds

Tried and True Approaches
http://www.nhtsa.dot.gov/people/injury/research/job185drugs/drugs_web.pdf
Couper and Logan (2005)
– Drug pharmacology
– Blood concentrations
– Effects on driving

• Washington State Patrol
• Washington State Toxicology Laboratory
• Friends and Colleagues in Forensic Toxicology.
Acknowledgements