Embed Size (px)
Citation preview

Dry$Bulk$Market: A$Primer
B reakwave $Dry $Bu lk $Sh ipp ing $ETF NYSE: $BDRY

Shipping$is$a$Global$Industry$and$a$Vital$Economic$Sector
“God%must%have%been%a%shipowner.%He%placed%the%raw%materials%far%from%where%they%were%needed%and%covered%
two%thirds%of%the%earth%with%water.”%%%%Erling%Naess,%Shipowner%1901C1993
• Shipping$is$a$vital$part$of$the$global$economy$and$an$integrated$part$of$commodity$trading
• Crude$Oil,$Iron$Ore$and$Coal$are$the$three$major$commodiMes$shipped$around$the$world
• China$dominates$the$demand$side,$with$more$than$80%$of$incremental$seaborne$volumes$going$to$China$over$the$last$decade
• The$source$of$commodiMes$is$quite$disperse,$with$both$the$AtlanMc$basin$and$the$Pacific$basin$supplying$cargoes$to$the$market

MAIN$USE NUMBER$OF$
SHIPS PRIMARY$SHIP$
USERS SHIP$SIZES FEATURE
Dry$Bulk
~11,100$worldwide
Commodity$Producers:$Vale,$Rio$Tinto,$BHP
Commodity$Traders:$Cargill,$Louis$Dreyfus
End$Users:$$ED&F$Man,$RWE
Capesize:$~180,000$tons
Largest$dry$bulk$ship;$Mainly$used$for$long]haul$iron$ore$
Panamax:$~75,000$tons
The$“workhorse”$of$the$industry;$Mainly$used$for$coal$and$grains;$Can$use$Panama$Canal
Supramax:$~55,000$tons
Largest$ship$with$onboard$cranes;$Most$versaMle$due$to$ability$to$access$small$ports
Handysize:$~32,000$tons
Smallest$category$of$ship;$Carries$various$cargoes
Tankers
~6,600$worldwide
Oil$Majors:$ExxonMobil,$BP,$Shell
Commodity$Traders:$VItol,$Trafigura
End$Users:$Valero,$CNOC
VLCC:$$~300,000$tons
Largest$cargo$ship;$Mainly$used$for$transporMng$crude$oil$to$US$and$Asia$from$Middle$East
Suezmax:$~150,000$tons
Half]size$of$VLCCs;$Mainly$used$in$the$AtlanMc;$Largest$tanker$that$can$use$the$Suez$Canal
Aframax:$~105,000$tons
Most$versaMle$crude$oil$tanker;$Can$access$most$ports
MR:$ ~45,000$tons
Mainly$used$for$refined$oil$product$trading
Crude$Oil Refined$Products Chemicals
CAPESIZE
SUPRAMAX
VLCC
Iron$Ore Coal Grains Other
Shipping$Overview:$Ships$&$Sizes

• Dry$bulk$vessels$are$involved$in$the$seaborne$transport$of$major$commodiMes$such$as$iron$ore,$coal,$grain,$and$other$commodiMes$such$as$bauxite$and$phosphate,$minerals,$ferMlizers$and$forestry$products
• Dry$bulk$carriers$are$ships$that$have$cargo$loaded$directly$into$the$ship's$storage$holds.$$As$a$result,$bulk$carriers$provide$economies$of$scale$that$enable$users$to$save$on$transportaMon$costs
• For$dry$bulk$shipping$to$be$economically$viable,$the$cargo$must$be$homogenous$so$that$it$can$be$loaded$directly$into$the$ship’s$holds,$and$available$in$large$quanMMes$to$enable$economies$of$scale
• Dry$bulk$carriers$load$and$unload$cargo$at$ports$using$either$the$port$equipment$or$on]board$self]unloading$cranes
• Presently,$there$are$approximately$11,100$such$vessels$in$the$world’s$dry$bulk$fleet,$generally$ranging$in$size$from$10,000$deadweight$tons$(Dwt)$to$400,000$Dwt
• The$total$dry$bulk$fleet$capacity$is$approximately$820m$dwt
• Dry$bulk$carriers$have$an$average$useful$life$of$about$25$years
Dry$Bulk$Shipping
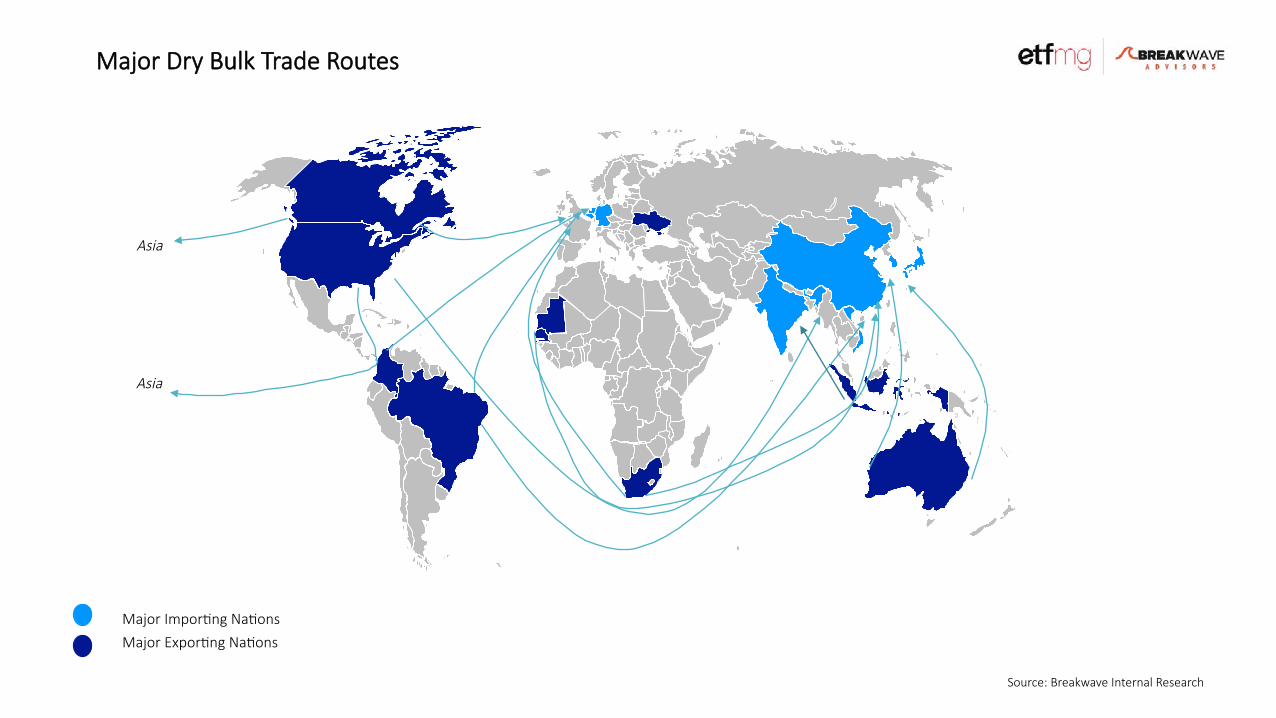
Major$ImporMng$NaMons
Major$ExporMng$NaMons
Asia
Asia
Source:$Breakwave$Internal$Research
Major$Dry$Bulk$Trade$Routes
Source:$Breakwave$Internal$Research$and$Clarksons$Research
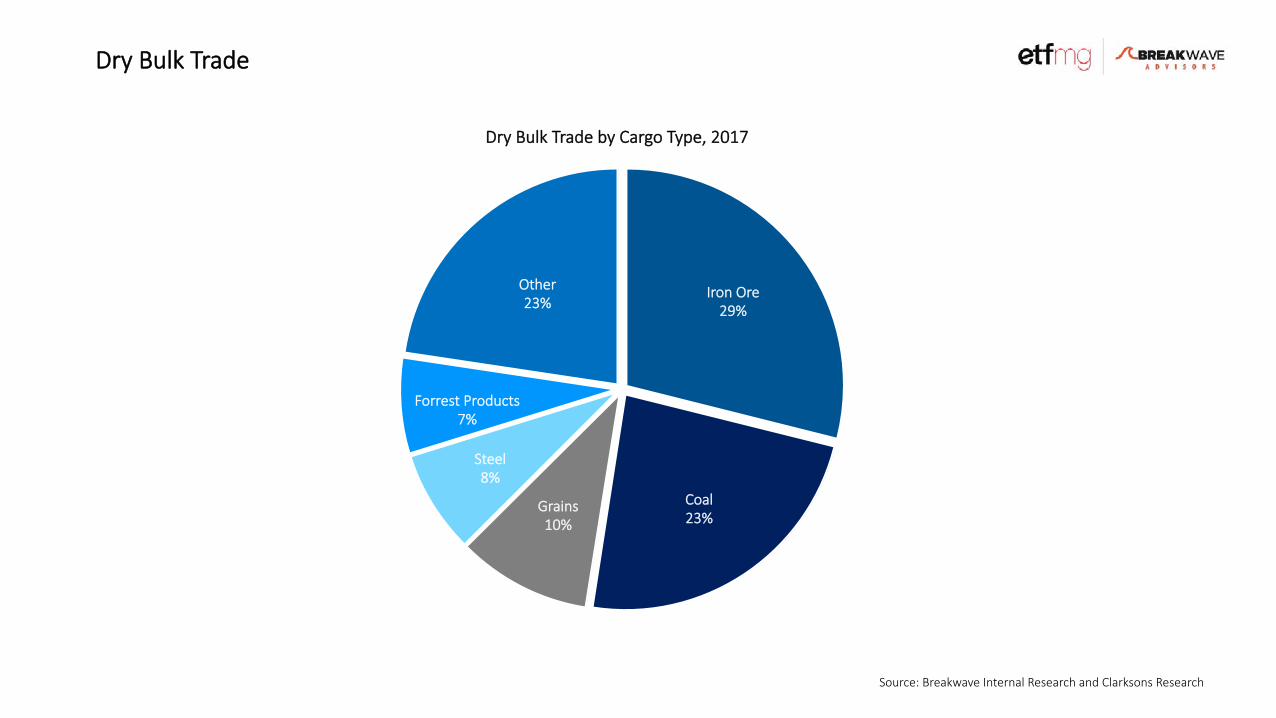
Dry$Bulk$Trade
Iron$Ore 29%
Coal 23%
Grains 10%
Steel 8%
Forrest$Products 7%
Other 23%
Dry$Bulk$Trade$by$Cargo$Type,$2017
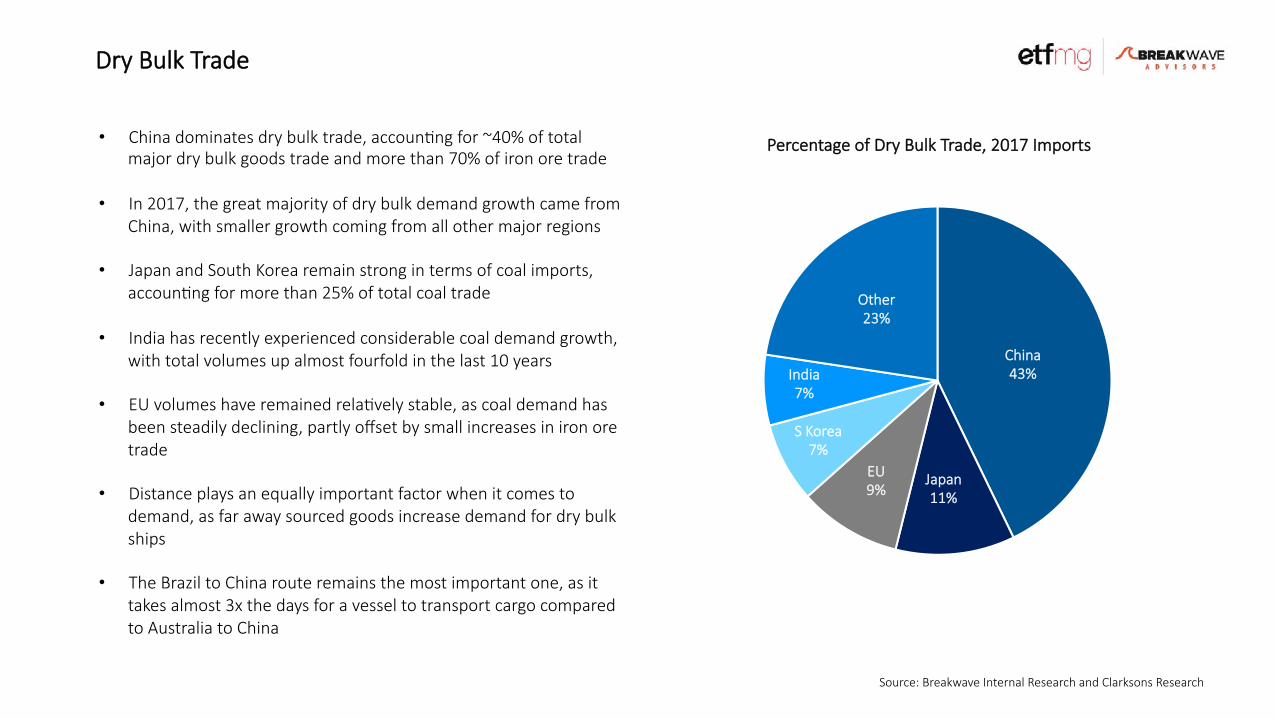
• China$dominates$dry$bulk$trade,$accounMng$for$~40%$of$total$major$dry$bulk$goods$trade$and$more$than$70%$of$iron$ore$trade
• In$2017,$the$great$majority$of$dry$bulk$demand$growth$came$from$China,$with$smaller$growth$coming$from$all$other$major$regions
• Japan$and$South$Korea$remain$strong$in$terms$of$coal$imports,$accounMng$for$more$than$25%$of$total$coal$trade
• India$has$recently$experienced$considerable$coal$demand$growth,$with$total$volumes$up$almost$fourfold$in$the$last$10$years
• EU$volumes$have$remained$relaMvely$stable,$as$coal$demand$has$been$steadily$declining,$partly$offset$by$small$increases$in$iron$ore$trade
• Distance$plays$an$equally$important$factor$when$it$comes$to$demand,$as$far$away$sourced$goods$increase$demand$for$dry$bulk$ships
• The$Brazil$to$China$route$remains$the$most$important$one,$as$it$takes$almost$3x$the$days$for$a$vessel$to$transport$cargo$compared$to$Australia$to$China
China 43%
Japan 11%
EU 9%
S$Korea 7%
India 7%
Other 23%
Percentage$of$Dry$Bulk$Trade,$2017$Imports
Source:$Breakwave$Internal$Research$and$Clarksons$Research
Dry$Bulk$Trade

• Dry$bulk$demand$is$driven$by$global$economic$growth,$emerging$markets$growth$infrastructure$spending$and,$to$a$lesser$extend,$populaMon$growth$
• Since$2000,$seaborne$dry$bulk$trade$has$increased$at$a$Compound$Annual$Growth$Rate$(CAGR)$of$4.6%
• China’s$admirance$into$the$World$Trade$OrganizaMon$(WTO)$in$2001$and$demand$growth$for$dry$bulk$goods$in$the$Far$East,$has$been$the$main$drivers$behind$the$strong$growth$over$the$past$15$years
• India’s$coal$demand$has$also$played$a$increasing$role$in$the$market$growth$since$2010
• Iron$ore$and$coal$account$for$the$majority$of$the$incremental$demand$over$the$period$as$grain$trade$has$seen$a$more$steadier$increase
$]$$$
$1,000$
$2,000$
$3,000$
$4,000$
$5,000$
$6,000$
2000 2001 2002 2003 2004 2005 2006 2007 2008 2009 2010 2011 2012 2013 2014 2015 2016 2017 million$tons
Dry$Bulk$Trade
4.6%$CAGR
Source:$Breakwave$Internal$Research$and$Clarksons$Research
Dry$Bulk$Demand
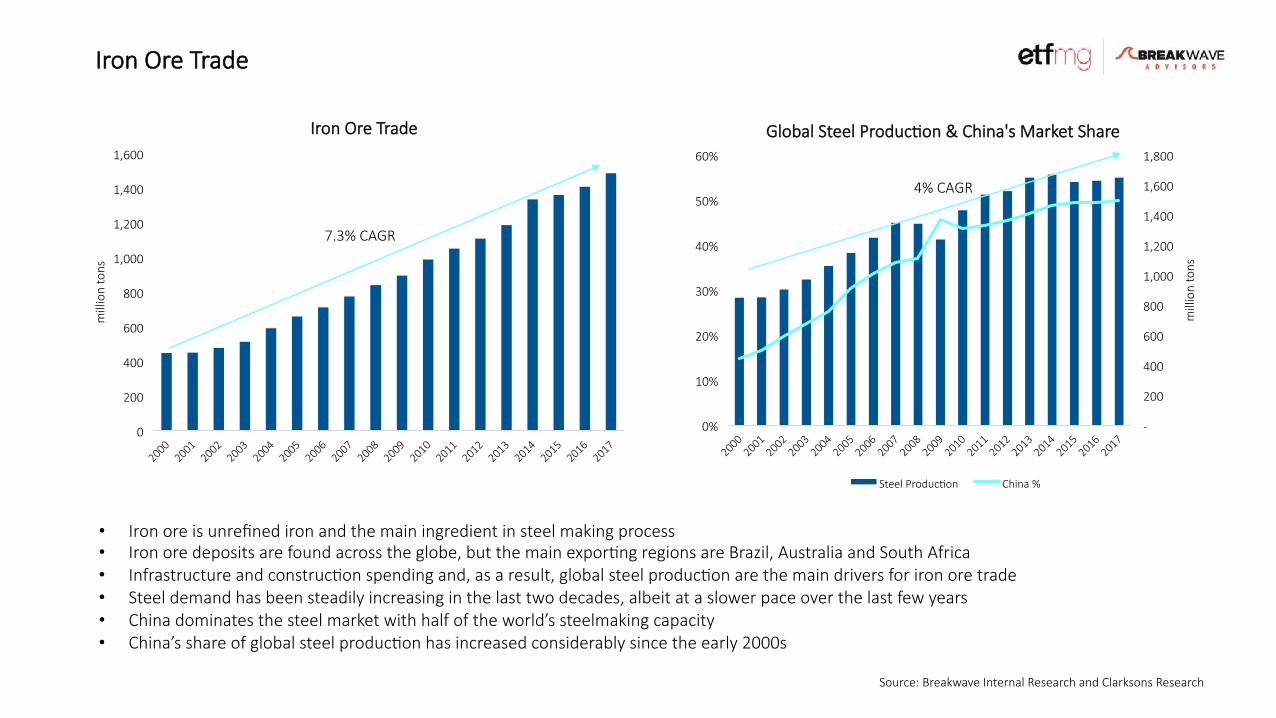
• Iron$ore$is$unrefined$iron$and$the$main$ingredient$in$steel$making$process • Iron$ore$deposits$are$found$across$the$globe,$but$the$main$exporMng$regions$are$Brazil,$Australia$and$South$Africa • Infrastructure$and$construcMon$spending$and,$as$a$result,$global$steel$producMon$are$the$main$drivers$for$iron$ore$trade • Steel$demand$has$been$steadily$increasing$in$the$last$two$decades,$albeit$at$a$slower$pace$over$the$last$few$years • China$dominates$the$steel$market$with$half$of$the$world’s$steelmaking$capacity$ • China’s$share$of$global$steel$producMon$has$increased$considerably$since$the$early$2000s
0
200
400
600
800
1,000
1,200
1,400
1,600
million$tons
Iron$Ore$Trade
7.3%$CAGR
$]$$$
$200$
$400$
$600$
$800$
$1,000$
$1,200$
$1,400$
$1,600$
$1,800$
0%
10%
20%
30%
40%
50%
60%
million$tons
Global$Steel$ProducMon$&$China's$Market$Share
Steel$ProducMon China$%
4%$CAGR
Source:$Breakwave$Internal$Research$and$Clarksons$Research
Iron$Ore$Trade
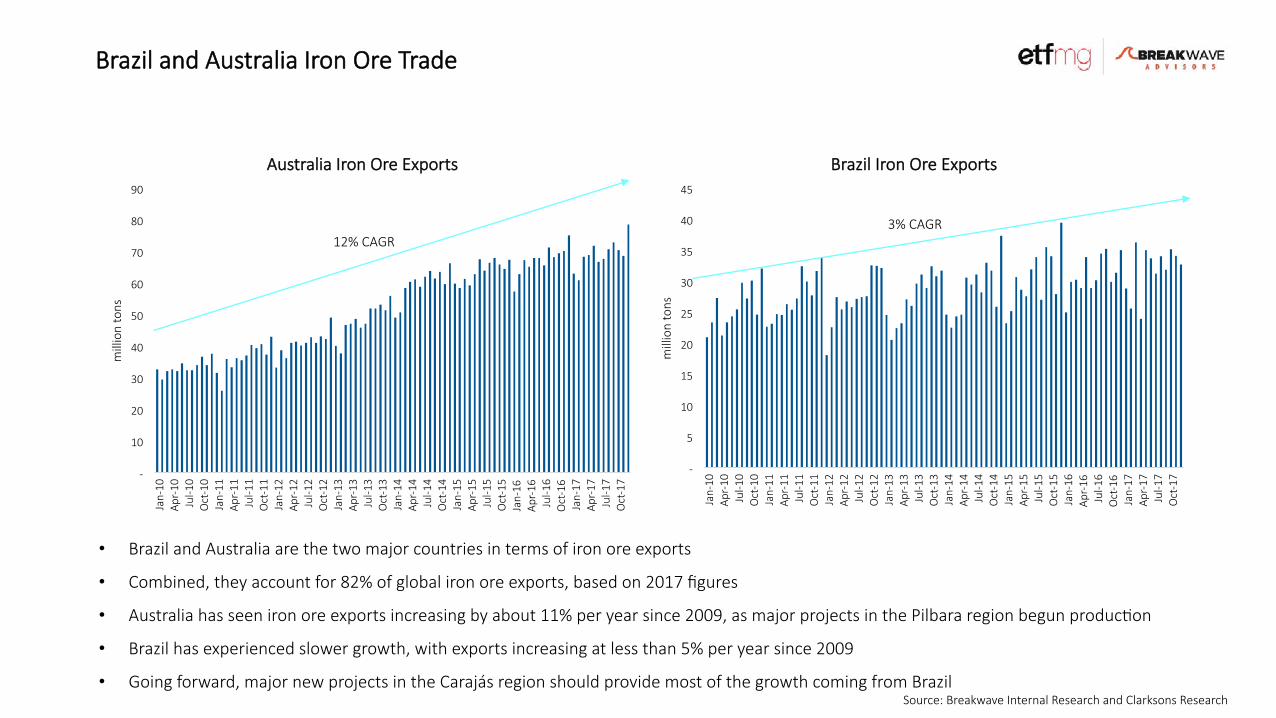
• Brazil$and$Australia$are$the$two$major$countries$in$terms$of$iron$ore$exports
• Combined,$they$account$for$82%$of$global$iron$ore$exports,$based$on$2017$figures
• Australia$has$seen$iron$ore$exports$increasing$by$about$11%$per$year$since$2009,$as$major$projects$in$the$Pilbara$region$begun$producMon
• Brazil$has$experienced$slower$growth,$with$exports$increasing$at$less$than$5%$per$year$since$2009
• Going$forward,$major$new$projects$in$the$Carajás$region$should$provide$most$of$the$growth$coming$from$Brazil Source:$Breakwave$Internal$Research$and$Clarksons$Research
Brazil$and$Australia$Iron$Ore$Trade
$]$
$10$
$20$
$30$
$40$
$50$
$60$
$70$
$80$
$90$
Jan]10
Apr]10
Jul]1
0 Oct]10
Jan]11
Apr]11
Jul]1
1 Oct]11
Jan]12
Apr]12
Jul]1
2 Oct]12
Jan]13
Apr]13
Jul]1
3 Oct]13
Jan]14
Apr]14
Jul]1
4 Oct]14
Jan]15
Apr]15
Jul]1
5 Oct]15
Jan]16
Apr]16
Jul]1
6 Oct]16
Jan]17
Apr]17
Jul]1
7 Oct]17
million$tons
Australia$Iron$Ore$Exports
12%$CAGR
$]$
$5$
$10$
$15$
$20$
$25$
$30$
$35$
$40$
$45$
Jan]10
Apr]10
Jul]1
0 Oct]10
Jan]11
Apr]11
Jul]1
1 Oct]11
Jan]12
Apr]12
Jul]1
2 Oct]12
Jan]13
Apr]13
Jul]1
3 Oct]13
Jan]14
Apr]14
Jul]1
4 Oct]14
Jan]15
Apr]15
Jul]1
5 Oct]15
Jan]16
Apr]16
Jul]1
6 Oct]16
Jan]17
Apr]17
Jul]1
7 Oct]17
million$tons
Brazil$Iron$Ore$Exports
3%$CAGR
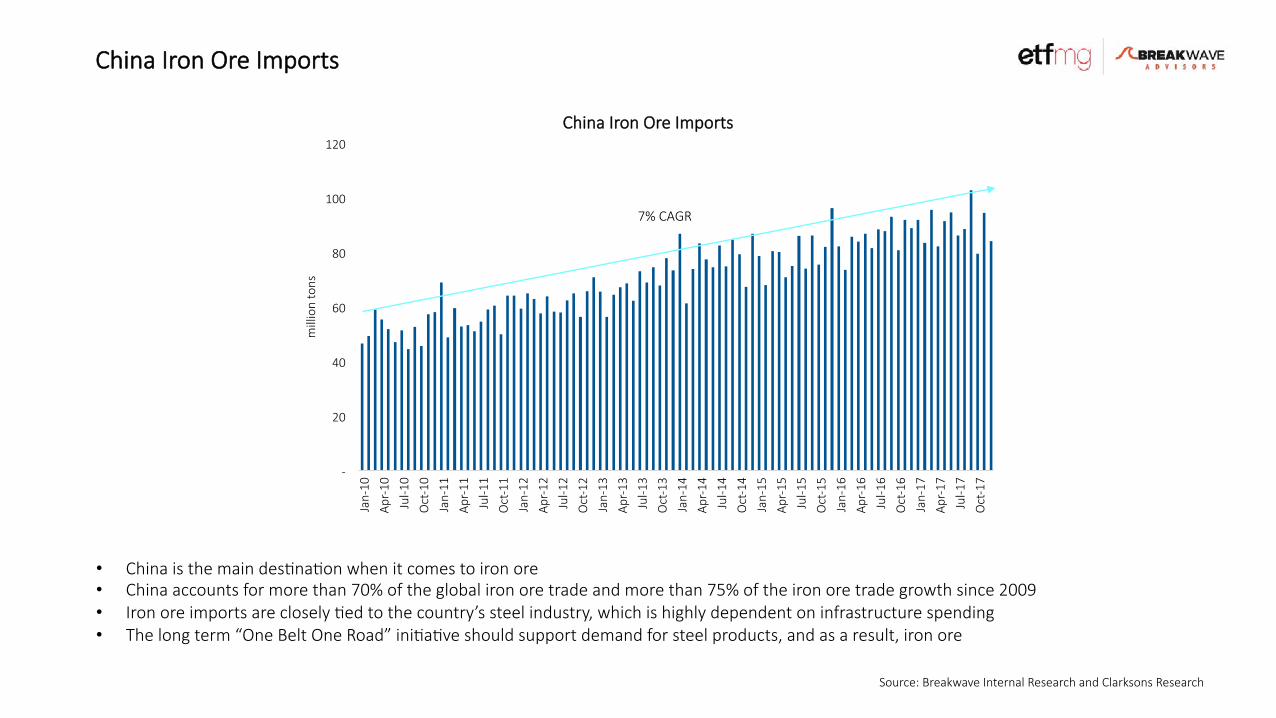
• China$is$the$main$desMnaMon$when$it$comes$to$iron$ore • China$accounts$for$more$than$70%$of$the$global$iron$ore$trade$and$more$than$75%$of$the$iron$ore$trade$growth$since$2009 • Iron$ore$imports$are$closely$Med$to$the$country’s$steel$industry,$which$is$highly$dependent$on$infrastructure$spending • The$long$term$“One$Belt$One$Road”$iniMaMve$should$support$demand$for$steel$products,$and$as$a$result,$iron$ore
Source:$Breakwave$Internal$Research$and$Clarksons$Research
China$Iron$Ore$Imports
$]$
$20$
$40$
$60$
$80$
$100$
$120$
Jan]10
Apr]10
Jul]1
0
Oct]10
Jan]11
Apr]11
Jul]1
1
Oct]11
Jan]12
Apr]12
Jul]1
2
Oct]12
Jan]13
Apr]13
Jul]1
3
Oct]13
Jan]14
Apr]14
Jul]1
4
Oct]14
Jan]15
Apr]15
Jul]1
5
Oct]15
Jan]16
Apr]16
Jul]1
6
Oct]16
Jan]17
Apr]17
Jul]1
7
Oct]17
million$tons
China$Iron$Ore$Imports
7%$CAGR

• Coal$consumpMon$has$been$in$a$steady$decline$over$the$last$few$years,$due$to$global$environmental$policies,$relaMve$pricing$and$new$renewable$energy$sources
• Coal$trade$has$seen$sizable$growth$since$the$early$2000s,$but$has$remained$fairly$flat$recently,$$as$relaMve$pricing$has$kept$physical$coal$trading$acMve$partly$offset$by$steady$demand
• China$conMnues$to$dominate$the$coal$trade$market,$accounMng$for$about$20%$of$thermal$coal$import$volumes;$Japan$is$second,$while$India$has$recently$seen$import$volumes$increasing
$]$$$
$500$
$1,000$
$1,500$
$2,000$
$2,500$
$3,000$
$3,500$
$4,000$
$4,500$
million$tons
Coal$ConsumpMon
0
200
400
600
800
1,000
1,200
1,400
million$tons
Coal$Trade
5.0$%$CAGR
Source:$Breakwave$Internal$Research$and$Clarksons$Research
Coal$Trade
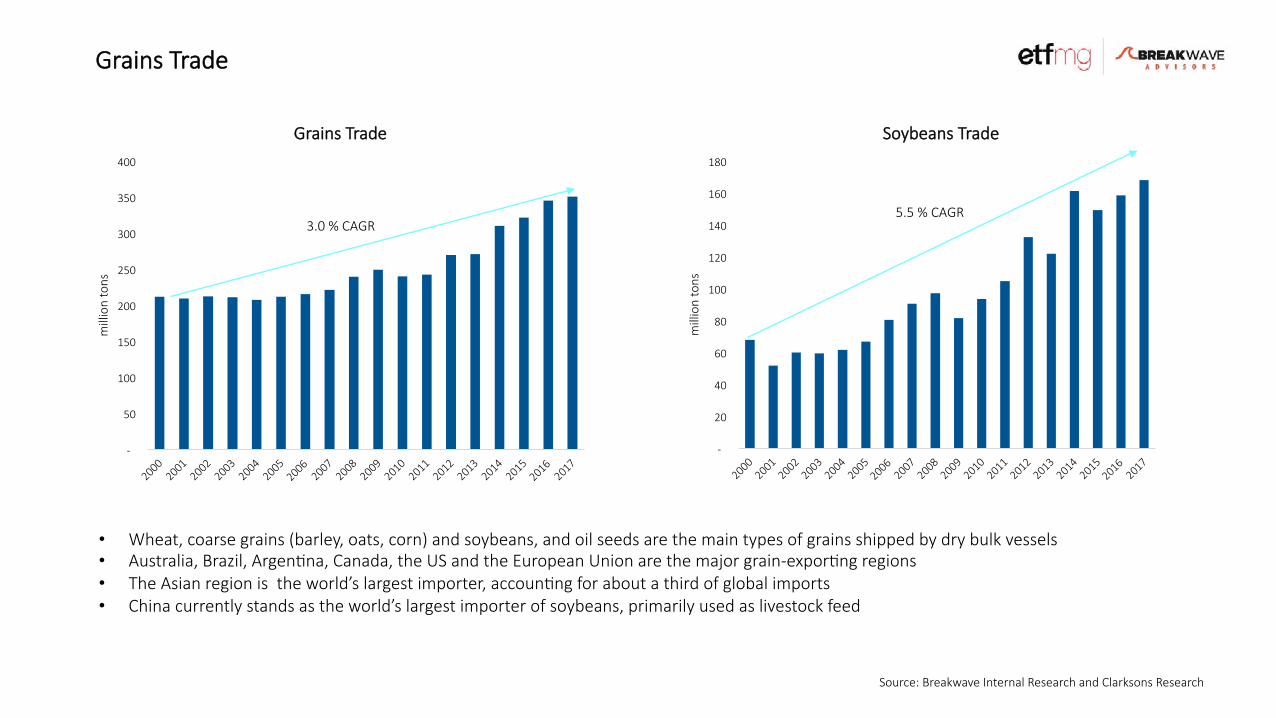
• Wheat,$coarse$grains$(barley,$oats,$corn)$and$soybeans,$and$oil$seeds$are$the$main$types$of$grains$shipped$by$dry$bulk$vessels • Australia,$Brazil,$ArgenMna,$Canada,$the$US$and$the$European$Union$are$the$major$grain]exporMng$regions • The$Asian$region$is$$the$world’s$largest$importer,$accounMng$for$about$a$third$of$global$imports • China$currently$stands$as$the$world’s$largest$importer$of$soybeans,$primarily$used$as$livestock$feed
$]$$$
$50$
$100$
$150$
$200$
$250$
$300$
$350$
$400$
million$tons
Grains$Trade
3.0$%$CAGR
$]$$$
$20$
$40$
$60$
$80$
$100$
$120$
$140$
$160$
$180$
million$tons
Soybeans$Trade
5.5$%$CAGR
Source:$Breakwave$Internal$Research$and$Clarksons$Research
Grains$Trade

• Largest$standard$dry$bulk$vessel$mainly$used$in$iron$ore$trade
• Capacity:$100kdwt$+ • Average$length:$~300$meters • Average$max$speed:$~15$knots • Average$consumpMon:$60$tons/day • Subcategories:$
• Newcastlemax%(190C250%kdwt) • Valemax%(320+kdwt)
• In$the$last$five$years,$the$price$of$a$5]year$old$Capesize$has$varied$between$23m$and$53m
• Largest$dry$bulk$vessel$able$to$transit$the$Panama$canal
• Capacity:$65kdwt$]100kdwt • Average$length:$~225$meters • Average$max$speed:$~14.5$knots • Average$consumpMon:$35$tons/day • Subcategories:$
• Kamsarmax%(80C85%kdwt) • PostCKamsarmax%(85+kdwt)
• In$the$last$five$years,$the$price$of$a$5]year$old$Panamax$has$varied$between$13m$and$28m
• Medium$size$dry$bulk$vessel$with$onboard$cranes
• Capacity:$40kdwt$–$65kdwt • Average$length:$~190$meters • Average$max$speed:$~14.5$knots • Average$consumpMon:$31$tons/day • Subcategories:$
• Supramax%(50C60%kdwt) • Ultramax%(60C65%kdwt)
• In$the$last$five$years,$the$price$of$a$5]year$old$Handymax$has$varied$between$12m$and$27m
• Small$size$dry$bulk$vessel$with$onboard$cranes
• Capacity:$10kdwt$–$40kdwt • Average$length:$~170$meters • Average$max$speed:$~14$knots • Average$consumpMon:$23$tons/day • In$the$last$five$years,$the$price$of$a$
5]year$old$Handymax$has$varied$between$9m$and$21m
Capesize Panamax Handymax Handysize
Source:$Breakwave$Internal$Research$and$Clarksons$Research
Dry$Bulk$Vessel$Types
Source:$Breakwave$Internal$Research$and$Clarksons$Research
Global$Dry$Bulk$Fleet
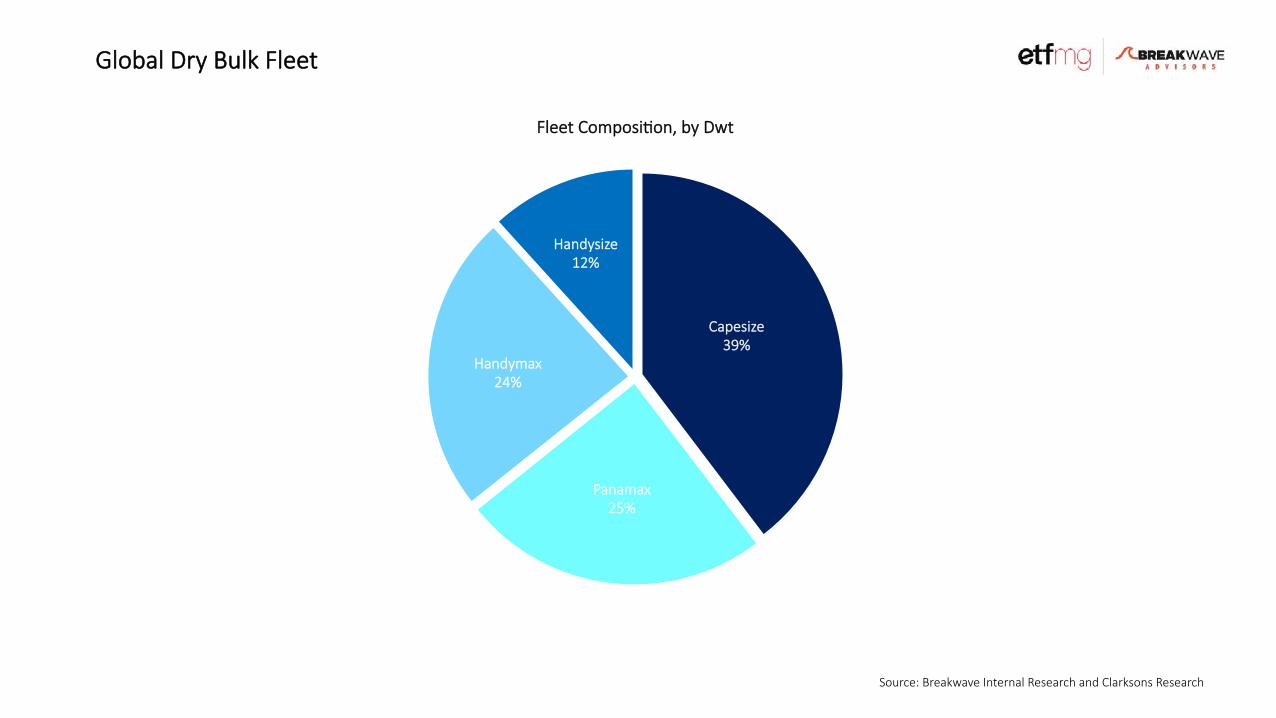
Capesize 39%
Panamax 25%
Handymax 24%
Handysize 12%
Fleet$ComposiMon,$by$Dwt

• Shipbuilding,$ship$demoliMon$and$fleet$uMlizaMon$usually$determine$the$supply$of$ships
• It$takes$roughly$two$years$to$build$a$new$ship,$while$the$useful$life$of$a$ship$is$approximately$25$years
• Ship$ordering$and$ship$scrapping$is$relaMvely$dynamic:$prevailing$freight$rates,$future$freight$rate$expectaMons$and$ship$operaMng$$economics$are$the$main$determinates$of$such$acMviMes
• Speed,$waiMng$Mme,$weather,$port$maintenance,$congesMon$are$also$factors$affecMng$ship$supply$over$shorter$periods$of$Mme
Ship$Building Ship$DemoliMon
Vessel$Supply
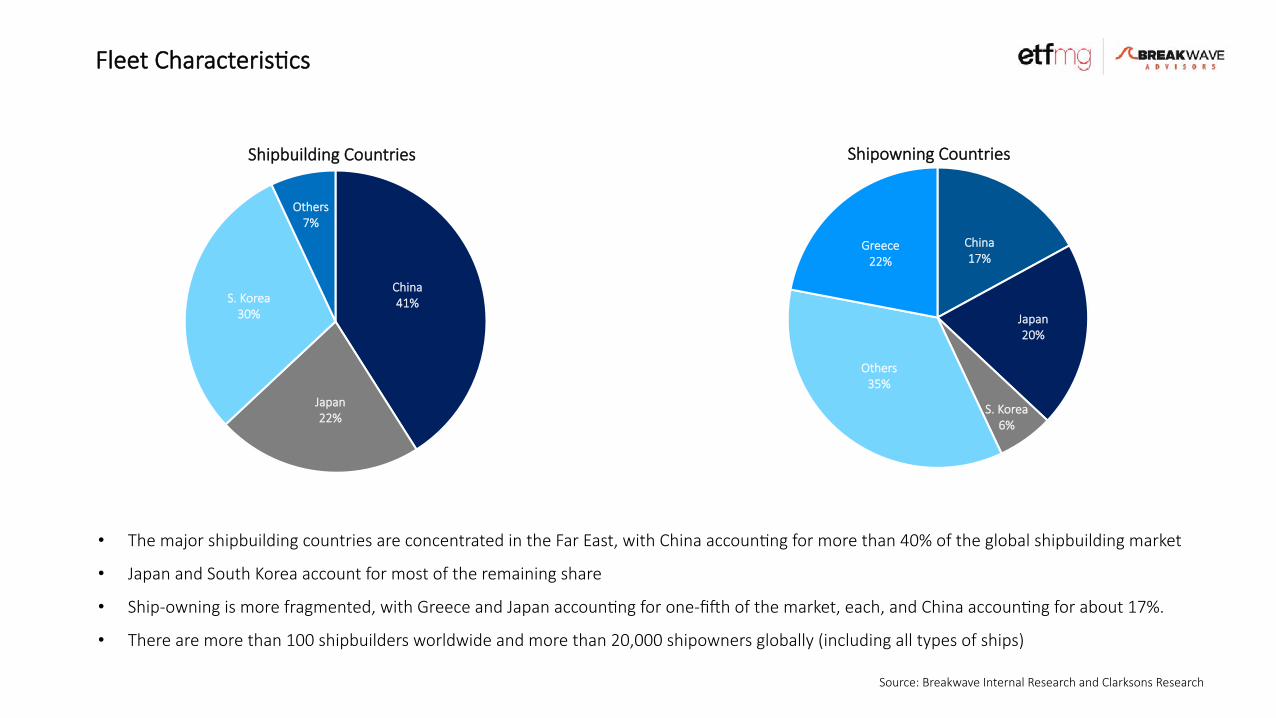
China 41%
Japan 22%
S.$Korea 30%
Others 7%
Shipbuilding$Countries
China 17%
Japan 20%
S.$Korea 6%
Others 35%
Greece 22%
Shipowning$Countries
• The$major$shipbuilding$countries$are$concentrated$in$the$Far$East,$with$China$accounMng$for$more$than$40%$of$the$global$shipbuilding$market
• Japan$and$South$Korea$account$for$most$of$the$remaining$share
• Ship]owning$is$more$fragmented,$with$Greece$and$Japan$accounMng$for$one]fiwh$of$the$market,$each,$and$China$accounMng$for$about$17%.$
• There$are$more$than$100$shipbuilders$worldwide$and$more$than$20,000$shipowners$globally$(including$all$types$of$ships)
Source:$Breakwave$Internal$Research$and$Clarksons$Research
Fleet$CharacterisMcs
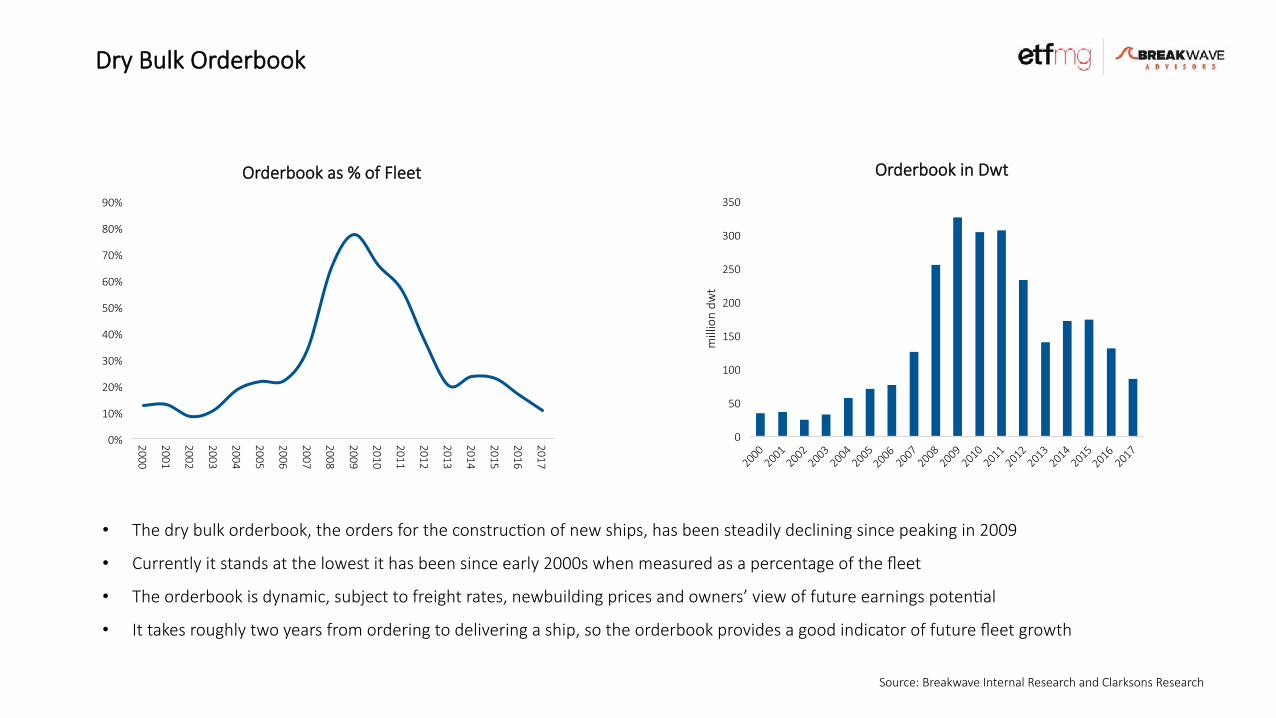
• The$dry$bulk$orderbook,$the$orders$for$the$construcMon$of$new$ships,$has$been$steadily$declining$since$peaking$in$2009
• Currently$it$stands$at$the$lowest$it$has$been$since$early$2000s$when$measured$as$a$percentage$of$the$fleet
• The$orderbook$is$dynamic,$subject$to$freight$rates,$newbuilding$prices$and$owners’$view$of$future$earnings$potenMal$
• It$takes$roughly$two$years$from$ordering$to$delivering$a$ship,$so$the$orderbook$provides$a$good$indicator$of$future$fleet$growth
0%
10%
20%
30%
40%
50%
60%
70%
80%
90%
2000
2001
2002
2003
2004
2005
2006
2007
2008
2009
2010
2011
2012
2013
2014
2015
2016
2017
Orderbook$as$%$of$Fleet
0
50
100
150
200
250
300
350
million$dw
t
Orderbook$in$Dwt
Source:$Breakwave$Internal$Research$and$Clarksons$Research
Dry$Bulk$Orderbook
0
20
40
60
80
100
120
million$dw
t
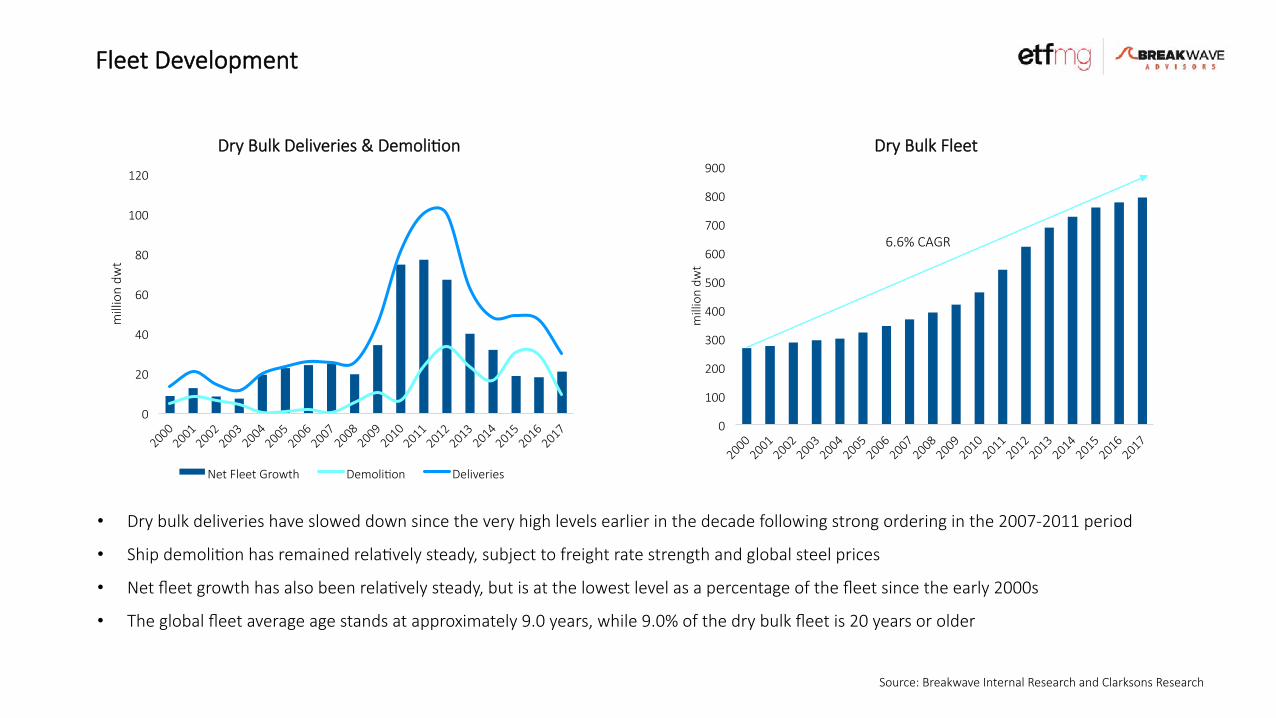
Dry$Bulk$Deliveries$&$DemoliMon
Net$Fleet$Growth DemoliMon Deliveries
• Dry$bulk$deliveries$have$slowed$down$since$the$very$high$levels$earlier$in$the$decade$following$strong$ordering$in$the$2007]2011$period$$
• Ship$demoliMon$has$remained$relaMvely$steady,$subject$to$freight$rate$strength$and$global$steel$prices
• Net$fleet$growth$has$also$been$relaMvely$steady,$but$is$at$the$lowest$level$as$a$percentage$of$the$fleet$since$the$early$2000s
• The$global$fleet$average$age$stands$at$approximately$9.0$years,$while$9.0%$of$the$dry$bulk$fleet$is$20$years$or$older$
0
100
200
300
400
500
600
700
800
900
million$dw
t
Dry$Bulk$Fleet$
6.6%$CAGR
Source:$Breakwave$Internal$Research$and$Clarksons$Research
Fleet$Development

• In$the$early$2000s,$demand$for$dry$bulk$shipping$exceeded$available$supply,$leading$to$strong$dry$bulk$rates$during$the$period • However,$a$combinaMon$a$strong$new$orders$for$dry$bulk$ships$and$the$Global$Financial$Crisis,$lead$to$a$sharp$decline$in$dry$bulk$rates • Since$2009,$supply$of$ships$has$exceeded$demand,$as$new$ship$deliveries$exceeded$slower$demand$growth • 2017$showed$a$Mghter$balance$between$supply$and$demand • Going$forward,$a$low$orderbook$combined$with$expected$increases$in$iron$ore$trade$out$of$Brazil$should$further$Mghten$the$balance
Source:$Breakwave$Internal$Research$and$Clarksons$Research
Supply$and$Demand
]5%
0%
5%
10%
15%
20%
2001 2002 2003 2004 2005 2006 2007 2008 2009 2010 2011 2012 2013 2014 2015 2016 2017
%$Change
Dry$Bulk$Trade$Growth$vs.$Dry$Bulk$Fleet$Growth
Dry$Bulk$Trade Dry$Bulk$Fleet
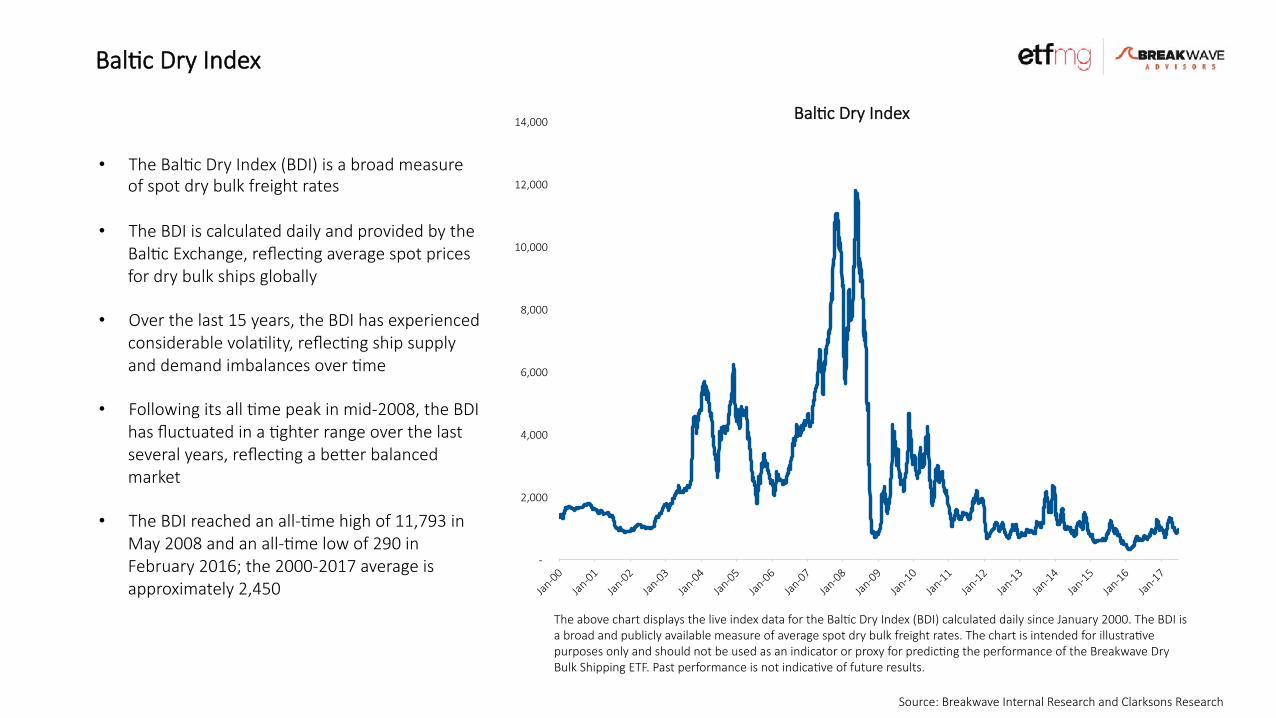
• The$BalMc$Dry$Index$(BDI)$is$a$broad$measure$of$spot$dry$bulk$freight$rates
• The$BDI$is$calculated$daily$and$provided$by$the$BalMc$Exchange,$reflecMng$average$spot$prices$for$dry$bulk$ships$globally
• Over$the$last$15$years,$the$BDI$has$experienced$considerable$volaMlity,$reflecMng$ship$supply$and$demand$imbalances$over$Mme
• Following$its$all$Mme$peak$in$mid]2008,$the$BDI$has$fluctuated$in$a$Mghter$range$over$the$last$several$years,$reflecMng$a$berer$balanced$market
• The$BDI$reached$an$all]Mme$high$of$11,793$in$May$2008$and$an$all]Mme$low$of$290$in$February$2016;$the$2000]2017$average$is$approximately$2,450
$]$$$
$2,000$
$4,000$
$6,000$
$8,000$
$10,000$
$12,000$
$14,000$ BalMc$Dry$Index
Source:$Breakwave$Internal$Research$and$Clarksons$Research
BalMc$Dry$Index
The$above$chart$displays$the$live$index$data$for$the$BalMc$Dry$Index$(BDI)$calculated$daily$since$January$2000.$The$BDI$is$a$broad$and$publicly$available$measure$of$average$spot$dry$bulk$freight$rates.$The$chart$is$intended$for$illustraMve$purposes$only$and$should$not$be$used$as$an$indicator$or$proxy$for$predicMng$the$performance$of$the$Breakwave$Dry$Bulk$Shipping$ETF.$Past$performance$is$not$indicaMve$of$future$results.$
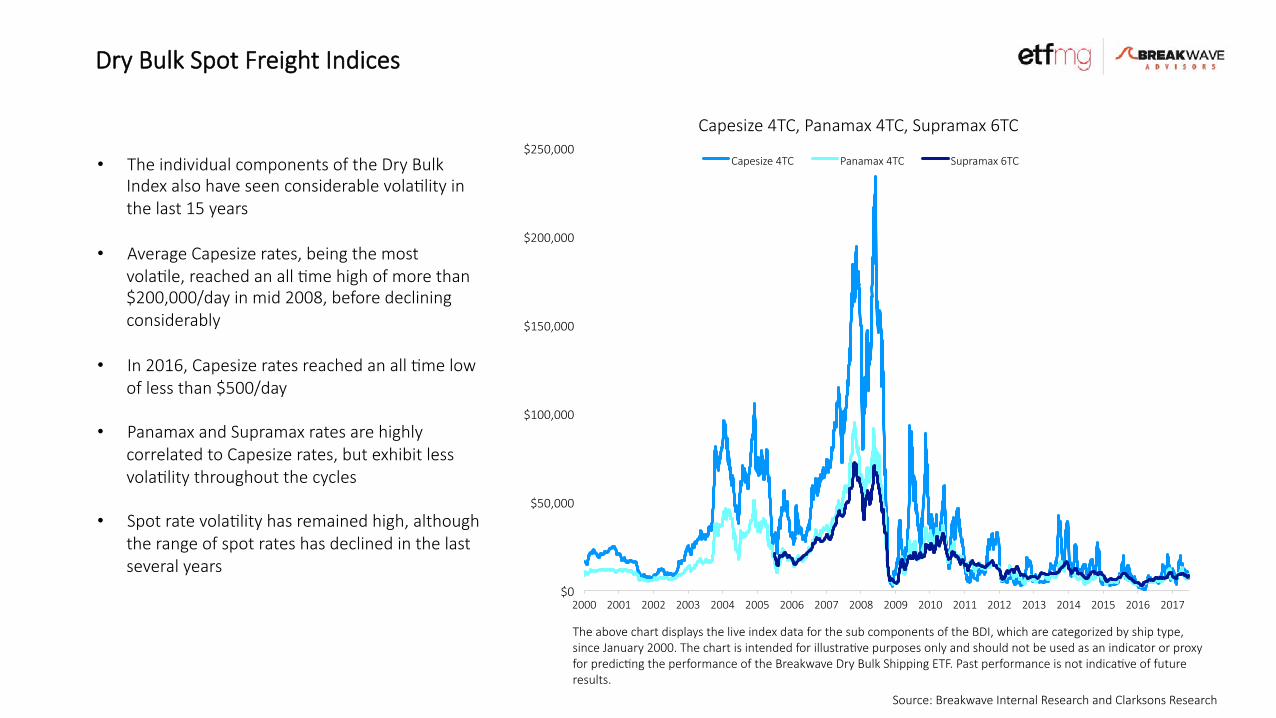
• The$individual$components$of$the$Dry$Bulk$Index$also$have$seen$considerable$volaMlity$in$the$last$15$years
• Average$Capesize$rates,$being$the$most$volaMle,$reached$an$all$Mme$high$of$more$than$$200,000/day$in$mid$2008,$before$declining$considerably
• In$2016,$Capesize$rates$reached$an$all$Mme$low$of$less$than$$500/day
• Panamax$and$Supramax$rates$are$highly$correlated$to$Capesize$rates,$but$exhibit$less$volaMlity$throughout$the$cycles
• Spot$rate$volaMlity$has$remained$high,$although$the$range$of$spot$rates$has$declined$in$the$last$several$years
$0
$50,000
$100,000
$150,000
$200,000
$250,000
2000 2001 2002 2003 2004 2005 2006 2007 2008 2009 2010 2011 2012 2013 2014 2015 2016 2017
Capesize$4TC,$Panamax$4TC,$Supramax$6TC
Capesize$4TC Panamax$4TC Supramax$6TC
Source:$Breakwave$Internal$Research$and$Clarksons$Research
Dry$Bulk$Spot$Freight$Indices
The$above$chart$displays$the$live$index$data$for$the$sub$components$of$the$BDI,$which$are$categorized$by$ship$type,$since$January$2000.$The$chart$is$intended$for$illustraMve$purposes$only$and$should$not$be$used$as$an$indicator$or$proxy$for$predicMng$the$performance$of$the$Breakwave$Dry$Bulk$Shipping$ETF.$Past$performance$is$not$indicaMve$of$future$results.$
Source:$Breakwave$Internal$Research$and$Clarksons$Research
Important%Risk%InformaVon%and%Disclosure
Inves&ng(in(freight(futures(can(be(vola&le(and(is(not(suitable(for(all(investors.((((Carefully(consider(the(Fund’s(investment(objec&ves,(risk(factors,(charges,(and(expenses(before(inves&ng.(This(material(must(be(accompanied(or(preceded(by(a(prospectus.(Please(read(the(prospectus(carefully(before(inves&ng.(((The(Fund(is(not(a(registered(investment(company(so(shareholders(do(not(have(the(protec&ons(of(the(Investment(Company(Act(of(1940.($ An$investment$in$the$Fund$involves$significant$risks.$You$could$lose$all$or$part$of$your$investment$in$the$Fund,$and$the$Fund’s$performance$could$trail$that$of$other$investments.$ $ The$value$of$the$Shares$of$the$Fund$relates$directly$to$the$value$of,$and$realized$profit$or$loss$from,$the$Freight$Futures$and$other$assets$held$by$the$Fund,$and$fluctuaMons$in$price$could$materially$affect$the$Fund’s$shares.$Investments$in$freight$futures$typically$fluctuate$in$value$with$changes$in$spot$charter$rates.$Charter$rates$for$dry$bulk$vessels$are$volaMle$and$have$declined$significantly$since$their$historic$highs$and$may$remain$at$low$levels$or$decrease$further$in$the$future. $$ The$Fund$will$not$take$defensive$posiMons$to$protect$against$declining$freight$rates,$which$could$cause$a$decline$to$the$value$of$the$Fund’s$shares. $ The$Trust$is$taxed$as$a$partnership$and$the$applicable$rules$are$complex$and$burdensome$on$investors. $ Although$the$Fund’s$shares$are$listed$and$traded$on$the$NYSE$Arca,$there$can$be$no$guarantee$that$an$acMve$trading$market$for$the$shares$will$be$maintained.$If$an$investor$needs$to$sell$shares$at$a$Mme$when$no$acMve$trading$market$for$them$exists,$the$price$the$investor$receives$upon$sale$of$the$shares,$assuming$they$were$able$to$be$sold,$likely$would$be$lower$than$if$an$acMve$market$existed. $ The$Fund$is$distributed$by$ETFMG$Financial$LLC,$which$is$not$affiliated$with$Breakwave$Advisors.
BDRY
Breakwave$Dry$Bulk$Shipping$ETF
www.DryBulkETF.com