Embed Size (px)
Citation preview

1
DUAL DISTRIBUTION AND INTANGIBLE FIRM VALUE: FRANCHISING IN RESTAURANT CHAINS
Raji Srinivasan Assistant Professor of Marketing
Red McCombs School of Business University of Texas at Austin
CBA 7.248, Austin, TX 78712-1176 Tel: 512-471-5441; fax: 512-471-1034
Email: [email protected]
November 2005
Forthcoming in the Journal of Marketing July 2006
The author thanks Reuben Raj, Gary L. Lilien, Manoj Agarwal, Sundar Bharadwaj, Inge Geyskens, Natalie Mizik, Vithala Rao, and Rajendra Srivastava for providing useful inputs on previous versions of the manuscript. The author also thanks the editor and reviewers of JM for their insightful and constructive comments.

2
DUAL DISTRIBUTION AND INTANGIBLE FIRM VALUE: FRANCHISING IN RESTAURANT CHAINS
Abstract
Dual distribution systems where firms simultaneously use vertical integration and market
governance are widely used across diverse marketing contexts (e.g., restaurants, retailing, and industrial selling). A prominent example of dual distribution includes business format franchising, where firms, the franchisors, license operation of some of its units to franchisees while simultaneously owning and operating some units themselves. Despite the widespread prevalence of dual distribution, there are few insights on their performance implications. In this paper, I examine the relationship between a firm’s dual distribution strategy and its intangible value. Franchising in restaurant chains serves as the empirical context for the study.
I propose that a firm’s dual distribution strategy will affect its intangible value both independently and jointly with a set of firm characteristics. I consider the firm’s age, the scope of its vertical integration, advertising, financial leverage, and financial liquidity as firm characteristics influencing the relationship between dual distribution strategy and intangible value. I measure the firm’s dual distribution strategy by the proportion of its franchised units to its total units and intangible value by its Tobin’s Q. I estimate the proposed model using panel data on 55 publicly-listed U.S. restaurant chains for the period 1992-2002. Unobserved firm heterogeneity is accommodated using latent class regression analysis. Results support a four segment model. Dual distribution increases intangible value for some firms, but decreases intangible value for others, both independently and, in conjunction with other firm characteristics.
Keywords: dual distribution, intangible value, Tobin’s Q, marketing channels, market-based assets, franchising

1
INTRODUCTION
Dual distribution systems where firms use vertical integration and market governance are
widely used across diverse marketing contexts including retailing, restaurants and industrial
selling. While the nature of dual distribution system varies by marketing context, in principle,
dual distribution implies that the firm contracts with market agents to manage parts of its
distribution system, while simultaneously owning and managing other parts of it. Given its
widespread prevalence, some observers have suggested that dual distribution has become the
dominant channel design with important implications for firms’ marketing strategies and
performance (Anderson, Day, and Rangan 1997; Stern and Weitz 1997).
In this paper, I examine the relationship between dual distribution strategy and intangible
value using the context of franchising in restaurant chains. In what is known as business format
franchising, the chains, i.e. the franchisors own and operate some restaurant units and
simultaneously license operation of some restaurant units to market agents, the franchisees.
Franchisors provide marketing and operations support to franchisees in return for royalty income
that is a fixed percentage of franchisees’ revenues. I first provide the motivation for this study.
Dual distribution has been extensively studied by marketing scholars variously as hybrid
channels, multiple channels, or plural governance. However, past research has primarily focused
on its various antecedents including information asymmetry (Heide 1994, 2003), transaction
costs (Anderson 1988; Anderson and Schmittlein 1984; Bergen, Dutta, and Walker 1992;
Dahlstrom and Nygaard 1994, 1999; Rindfleisch and Heide 1997; Weiss and Anderson 1992),
and uncertainty (Dutta et al. 1995; John and Weitz 1988). There are fewer insights on the
performance implications of dual distribution. As Heide (2003, p. 27) noted, “the specific

2
performance implications of plural systems remain unanswered...establishing a link between
particular governance approaches and outcome variables seems an important research priority.”
Relating dual distribution strategy to intangible value is also valuable from a marketing
metrics perspective (Bolton 2004; Rust et al. 2004). Recent developments in accounting suggest
that a firm’s accounting data alone cannot adequately explain its value because they do not
capture its intangible assets (Amir and Lev 1996). Accordingly, there is interest in identifying
value-relevant, non-accounting measures, including business strategies that may affect
shareholder value (e.g., Barth et al. 1998). Relating marketing strategies to firm value is
especially pertinent, as most marketing investments create intangible market-based assets not
reflected on balance sheets (Srivastava, Shervani, and Fahey 1998, 1999). i
Consistent with conceptual advances in the marketing metrics area (Srivastava, Shervani,
and Fahey 1998, 1999), empirical research has identified a value-relevant role for various aspects
of marketing strategy including branding (e.g., Rao, Agarwal, and Dahloff 2004; Simon and
Sullivan 1993), product management (Aaker and Jacobson 2001; Pauwels et al. 2004), and
customer relationship management (e.g., Anderson, Fornell, and Mazvancheryl 2004). However,
there are few insights on the relationship between distribution strategy, a key aspect of a firm’s
marketing strategy, and its value. In an exception, Banerji and Simon (1991) used survey data
from 34 restaurants and reported a positive relationship between the proportion of firms’
franchised units to their company units and their intangible value. More recently, two studies
(Geyskens, Gielens, and Dekimpe 2002; Lee and Grewal 2004) showed that a firm’s adoption of
the Internet as a distribution channel positively influenced its intangible value. These
developments raise questions about the value relevance of distribution strategy.

3
A study relating dual distribution strategy to firm value is also important for marketing
practice because of the increasing scrutiny of the financial accountability of marketing
investments from various stakeholders (Rust et al. 2004). Testifying to the potential managerial
significance of this issue, an empirical survey of restaurant chains, the industry context for this
paper, suggested an intriguing relationship between chains’ dual distribution strategies and
intangible values (Figure 1).
---- Insert Figure 1 ----
Interestingly, the scatter plot in Figure 1 indicates that restaurant chains, using a given
dual distribution strategy, have very different intangible values. For example, in 2002,
McDonald’s Corporation and Panera Bread Company which had similar dual distribution
strategies (0.72 of their system units were franchised) had intangible values of 1.290 and 5.300
respectively. Likewise, Benihana Inc. and California Pizza Kitchen Inc. which had similar dual
distribution strategies (0.18 of their system units were franchised) had intangible values of 0.990
and 2.780 respectively. I observed similar patterns in other industries where dual distribution is
prevalent (e.g., automotive repair services, hotels) suggesting a complex and perhaps contingent
relationship between dual distribution strategy and intangible value. Insights clarifying this
relationship will be useful to managers whose business strategies must be informed by their
performance implications. In this paper, I examine two research questions: Does a firm’s dual
distribution strategy affect its intangible value? Do the effects of dual distribution on intangible
value vary across firms?
Firms are urged to leverage synergy among elements of their marketing strategy to
optimize resource allocation (Capon, Farley and Hoenig 1990, pp. 1144-1159; Gatignon and
Hanssens 1987, p. 257). Surprisingly, however, past studies relating marketing to firm

4
performance have focused on one aspect of marketing such as new product introductions (e.g.,
Bayus, Erickson and Jacobson 2003) and brand management (e.g., Rao, Agarwal and Dahloff
2004) without consideration of potential synergies among them. Indeed, the considerable
variability in intangible values of firms, for a given dual distribution strategy, observed in Figure
1, suggests a contingent relationship between dual distribution strategy and other firm
characteristics on intangible value.
Accordingly, I apply contingency theory (Hambrick 1983; Zeithaml, Varadarajan, and
Zeithaml 1988) that proposes complementarities between various aspects of firm’s profile,
strategy and resources on its performance to relate a firm’s dual distribution strategy to its
intangible value. I propose that a firm’s dual distribution strategy will affect intangible value,
both independently and jointly, with other firm characteristics. I consider the firm’s age, the
scope of its vertical integration, advertising, financial leverage, and financial liquidity as
characteristics influencing the effects of its dual distribution strategy on its intangible value.
I estimate the model using panel data on 55 publicly-listed U.S. restaurant chains in the
period 1992-2002, resulting in 394 firm-years. Unobserved firm heterogeneity is accommodated
using latent class regression analysis that derives latent segments (for a review, see Wedel and
Kamakura 2000). I use the proportion of a chain’s franchised units to the total number of its units
in its distribution system as the indicator of its dual distribution strategy. I measure the chain’s
intangible value by its Tobin’s Q, a forward-looking, stock market-based measure (e.g.,
Bharadwaj, Bharadwaj, and Konsynski 1999).
The results support a four-segment model and indicate that a firm’s dual distribution
strategy influences its intangible value, both independently and jointly with other firm
characteristics. The effect of dual distribution on intangible value varies across firms in the four

5
segments supporting firm heterogeneity. The proposed model explains a firm’s intangible value
significantly better than its accounting data, strongly supporting the value-relevance of its dual
distribution strategy. The model also predicts a firm’s intangible value well, given its
characteristics.
The paper is organized as follows. In the next section, I first define dual distribution and
provide an overview of it, following which, the hypotheses are developed. The subsequent
sections describe the data, and the model estimation procedure followed by the results. The
paper concludes with a discussion of the paper’s contributions, its limitations, and opportunities
for further research.
THEORY
Definition of Dual Distribution
I conceptualize a firm’s dual distribution as a hybrid system, involving the simultaneous
use of vertical integration (termed vertical integrated channels or company units in franchising)
and market governance (market-based channels or franchised units).ii In the restaurant industry,
most chains use dual distribution although, some (e.g., Planet Hollywood International Inc.,
Lonestar Steakhouse Saloon Inc.) use only vertical integrated channels and others (e.g., Noble
Roman’s Inc., Triarc Companies Inc.) use only market-based channels.
I define the proportion of a chain’s franchised units to the total number of its system units
in its distribution system as the indicator of its dual distribution strategy for three reasons. First,
this definition captures the chain’s emphasis on market-based channels relative to its system size
reflecting the conceptualization of dual distribution as a hybrid system. Second, the definition
also captures the chain’s relative emphasis on the creation of intangible assets (i.e., franchised

6
units, franchisee relationships and knowledge) in its distribution system which is consistent with
the study’s focus on firm value, which is achieved through intangible market-based assets
(Srivastava, Shervani, and Fahey 1998). Finally, the proportion of a chain’s market-based
channels to its system size is a strategic choice variable as chains first determine their overall
distribution strategy (e.g., system size, location of units) and then determine which units should
be franchised (Lafontaine 1992). I next provide an overview of dual distribution, and discuss its
various advantages and disadvantages.
Overview of Dual Distribution
Vertical integrated channels and market-based channels embody different economic,
structural and managerial characteristics and serve different marketing functions (Dutta et al.
1995; Heide 1994, 2003). For example, firms own, operate and manage vertical integrated
channels through hierarchical, corporate control, while market-based channels are owned and
operated by market agents, and are managed primarily through provisions and incentives in a
relational contract between the firm and its agents (Williamson 1975, 1985).
Marketing scholars have examined the conditions when plural governance, in general,
and dual distribution, in particular, leads to greater efficiency using the theoretical lenses of
agency theory (Bergen, Dutta, and Walker 1992; Dutta et. al. 1995) and transaction cost
economics (Heide 1994, 2003; John and Weitz 1988; Rindfleisch and Heide 1997). The
emergent consensus is that, under some conditions, dual distribution eliminates problems
associated with either exclusive vertical integration or market governance. See Bergen, Dutta,
and Walker (1992, pp. 13-16), Heide (1994, pp. 74-78) and Rindfleisch and Heide (1997, pp. 32-
43) for discussions of agency theory and transaction cost economics as applicable to dual
distribution. I next review the advantages and disadvantages of dual distribution.

7
Advantages of Dual Distribution
As both vertical integration and market governance have distinctive economic and
structural characteristics and marketing functions, the advantages and disadvantages of dual
distribution arise from the aggregation of benefits and costs of each channel and the synergy
across the dual channels.iii
Greater control over operations in vertical integrated channels. Vertical integration, in
the presence of dual distribution, enhances the credibility of the firm’s contract termination
safeguard, curtails agents’ opportunism, and reduces its vulnerability (Dutta et al. 1995). Vertical
integration also provides a firm with greater control over its business processes, products, and
profits (Heide 1994). Consistent with greater control over company units, the Chief Executive
Officer (CEO) of McDonald’s stated: “We maintain a global base of company-operated
restaurants to generate profits, link our interest with franchisees, develop management talent,
gather research, and test ideas for better restaurant execution” (McDonald’s 1995 Annual Report,
p. 11).
Lower costs and higher returns in market-based channels. Market agents are an
important source of scarce financial and managerial resources bundled efficiently in the contract
(Alchian and Demsetz 1972; Grossman and Hart 1986; Jensen and Meckling 1976). As
Anderson and Weitz (1986; p. 13) noted: “administrative costs associated with external agents
are quite low…the ‘invisible hand’ of the market places substantial pressures on independent
agents to provide a marketing activity efficiently.”
For example, in restaurant chains, owner-managers of franchised units, with rights to
residual profits from their units, are more motivated and work more efficiently than salary-based
employees in company units, lowering operating costs. Chains monitor franchised units

8
infrequently, relying instead on provisions in the contract, lowering monitoring costs as well
(Lafontaine and Shaw 2005). Further, chains make no capital investment in franchised units,
even as they earn income, which is set as a fixed percentage of franchisees’ revenues. As the
Executive Vice-president at a leading fish and chips chain noted, “..with franchise units, you
receive a smaller margin but the return on investment approaches infinity because there is no
investment” (Bradach 1998, p. 68).
Market-based channels are more responsive to market needs. Owner-managers of
market-based channels follow complex strategies and are more responsive to market changes,
relative to bureaucratic, vertical integrated channels (Yin and Zajac 2004). As a Pizza Hut
franchisee noted (Bradach 1998, p. 127), “Franchisees have a faster reaction time. With all the
layers in the company, it takes a long time to get things done.” Being very responsive to market
needs, franchised units are an important source of innovations (Lewin-Solomons 1998). For
example, three of McDonald’s most successful products—The Big Mac, Filet-O-Fish and Egg
McMuffin—were originally introduced by its franchisees (Newsweek 1997).
Market-based channels provide low cost, low risk access to new markets. Market-based
channels provide firms with low risk, low cost access to markets, not economically worthwhile
for them to pursue with vertically integrated channels (Dahlstrom and Nygaard 1994). Indeed,
franchised units are frequently located in remote, low potential markets that achieve lower sales
per unit, on average, than company units (Brickley and Dark 1987). Further, the franchise
contract is designed such that the upside benefit of increased revenues accrues to chains, while
the downside risk of poor performance is borne solely by their franchisees. As CEO Robert
Nugent of Jack in the Box noted “The economic advantage to franchising is that there is less risk
to our income statement because we’re not affected by cost pressures” (Bradach 1998, p. 68).

9
Synergy between dual channels. In addition to these distinct advantages from vertical
integrated channels and market-based channels, synergy between the dual channels also provides
advantages (Lafontaine and Kaufmann 1994; Martin 1988). Chains leverage their experience in
company units, over which they have control, to model responses in franchised units, where they
have much less control, in what Bradach (1997) called the “ratcheting process”. In addition,
Bradach (1997) found evidence of two-way “mutual learning” processes between company units
and franchised units. Testifying to synergy between the dual channels, the CEO of a restaurant
chain noted (Bradach 1998, p. 2), “The chain [company units] gives you a system perspective,
while franchisees give you a local perspective. We are constantly working to balance both
perspectives. By having both company and franchised units, we are able to do that.”
Disadvantages of Dual Distribution
Moral hazard problems in market-based channels. Because agents invest only in their
business (i.e. the franchised unit), they experience higher risk relative to well-diversified
investors, and may invest sub-optimally in their unit, creating moral hazard problems for the firm
(Blair and Kaserman 1994; Fama and Jensen 1983). For example, franchisees may attract
customers based on the franchisor’s reputation but deliver inferior products (e.g., Pizza Hut
franchisees can reduce the quality and quantity of cheese in pizzas), profiting from such actions
with limited negative consequences to them while hurting the firm’s reputation. Such moral
hazard problems are especially common when franchised units are located in remote markets
characterized by high monitoring costs (Oxenfeldt and Kelly 1969).
Uncertainty about income from market-based channels. Restaurant chains that use dual
distribution rely on market-based channels not under their control for a portion of their income
resulting in uncertainty about this income stream (Bradach 1997). Indeed, the forward looking

10
statements in chains’ annual reports identify uncertainty in income from franchised units as an
important risk factor (e.g., Papa John’s Annual Report 2004 at http://www.papajohns.com).
However, this risk is partly mitigated by vertical integration, as discussed earlier. I next develop
hypotheses relating a firm’s dual distribution strategy to its intangible value.
Hypotheses
The considerable variability in intangible values of chains, for a given dual distribution
strategy, evident in Figure 1, suggests a contingent relationship between a dual distribution
strategy and other firm characteristics and its intangible value. Accordingly, I use the
contingency-based approach that argues for complementarities between a firm’s resources and
strategy on its performance (Hambrick 1983; Zeithaml, Varadarajan, and Zeithaml 1988).
Extending the contingency theory suggests that a firm’s dual distribution strategy will affect its
intangible value both independently and jointly with its other characteristics. Thus, in addition to
the main effect of dual distribution strategy on intangible value, I consider its interaction effects,
with the firm’s age, scope of vertical integration, advertising, financial leverage, and financial
liquidity, on its intangible value. Note that while age, financial leverage, financial liquidity are
not marketing variables, in the traditional sense, developments in agency theory (e.g., Bergen,
Dutta and Walker 1992) and transaction cost economics (e.g., Rindfleisch and Heide 1997)
suggest that they may influence the relationship between governance mode (i.e., dual distribution
strategy) and its performance.
Extending theoretical developments in market-based assets theory (Srivastava, Shervani
and Fahey 1998), I propose that, under some conditions, defined by these interaction effects, the
stock market will anticipate increasing cash flows, higher speed of cash flows, and lower risk of
these cash flows, which should increase the firm’s intangible value. Under other conditions, the

11
stock market will anticipate decreasing cash flows, lower speed of cash flows and higher risk of
these cash flows, lowering intangible value. As dual distribution offers both advantages and
disadvantages, I hypothesize opposing effects, where appropriate. The latent class regression
approach, described subsequently, accommodates opposing effects across firms in the different
segments.
Main Effect of Dual Distribution
As discussed, dual distribution offers several advantages including lowering a firm’s
capital requirements, operating costs, monitoring costs and risk. From a shareholder value
perspective, market-based channels create relational, knowledge and intellectual assets that
increase future cash flows while reducing their risk (Srivastava, Shervani, and Fahey 1998,
1999). From a real options perspective (Bowman and Hurry 1993; Kulatilaka and Trigeorgis
1994), market-based channels are an ‘options’ investment useful for managing demand growth
and uncertainty. Hence, an increasing proportion of market-based channels should increase a
firm’s intangible value.
However, as discussed earlier, agency theory accounts suggest some disadvantages of
dual distribution including potential under-investment and free-riding by market agents (Bergen,
Dutta, and Walker 1992). Hence, an increasing proportion of market-based channels in such
firms may decrease their future cash flows and increase the uncertainty of these cash flows,
negatively affecting their intangible values.
Given the opposing arguments, I expect a positive effect of the proportion of market-
based channels on intangible value for some firms and a negative effect for others. Thus,
H1a (H1b): The greater the proportion of market-based channels in a firm using a dual distribution strategy, the higher (lower) its intangible value.
12
Dual Distribution and Firm Age
Over time, most high potential markets may already be covered by a firm’s existing
distribution system so that its expansion may be limited to smaller, remote markets, which are
more efficiently served by market-based channels (Lafontaine and Shaw 2005). In such a
situation, the stock market may view an increasing proportion of market-based channels as a
cost-effective way to grow, strengthening the firm’s cash flows and increasing its intangible
value.
However, other arguments from the strategy and franchise literatures suggest an opposite
effect. The life cycles of firms influence their resource profiles and strategies (Penrose 1959).
Franchising is important in the early years of a firm when its resources are scarce (Carney and
Gedajlovic 1991). Over time, as resources increase, franchising may become less important
resulting in the well-documented reversion to company ownership of franchised units in older
firms (e.g., Lafontaine and Kaufmann 1994; Oxenfeldt and Kelly 1969). Thus, the older the firm,
and the greater the proportion of its market-based channels, the lower its future cash flows, the
higher the risk of these cash flows and lower its intangible value. Given, the opposing effects,
H2a (H2b): The interaction between the proportion of market-based channels in a firm using a dual distribution strategy and its age will increase (decrease) its intangible value.
Dual Distribution and Scope of Vertical Integration
I define the scope of a firm’s vertical integration as the proportion of the firm’s sales
from its vertical integrated channels to its total sales (John and Weitz 1988). Several factors
suggest a positive interaction effect between the scope of a firm’s vertical integration and dual
distribution on its intangible value.

13
A firm more dependent on its vertical integrated channels for sales will have higher fixed
investments in its integrated channels, offering a credible termination safeguard against agents’
opportunism, improving both the agents’ and the system’s performance (Heide 1994). Further, a
firm more dependent on its vertical integrated channels for sales will have higher marketing
expenditures (Lafontaine 1992; Lafontaine and Shaw 2005), creating positive marketing
spillovers for its market-based channels, again strengthening its performance.
In addition, when a firm has an increasing proportion of sales from its vertical integrated
channels and a large proportion of market-based channels, its market-based channels have lower
sales per unit than its vertical integrated channels, suggesting that they are covering smaller
markets with lower potential. In such a situation, the firm’s market-based channels are a cost-
effective way to reach these smaller markets, without attendant capital investment and risk. Thus,
the interaction between the scope of a firm’s vertical integration and an increasing proportion of
market-based channels may strengthen its future cash flows, reduce the risk of these cash flows,
and increase its intangible value. Hence,
H3: The interaction between the proportion of market-based channels in a firm using a dual distribution strategy and the scope of its vertical integration will increase its intangible value.
Dual Distribution and Advertising
Empirical studies indicate that the effects of advertising on performance are industry-
specific, varying in magnitude, timing and persistence (Comanor and Wilson 1967; Ravenscraft
and Scherer 1982). Our interest here is in the interaction effect between a firm’s advertising and
the proportion of its market-based channels on intangible value.
The firm’s and their market agents’ incentives are closely aligned when its brand equity,
consistent with high advertising, is high (Arrow 1985; Mathewson and Winter 1985). For

14
example, when a firm has high advertising, its market agents may be motivated to perform better
to extract higher rents from its higher brand reputation improving its system performance.
Further, when a firm with high advertising also has a high proportion of market-based channels,
its advertising investment may be efficiently recovered over the larger market increasing its cash
flows and reducing their uncertainty. Hence, the higher the firm’s advertising and the higher the
proportion of its market-based channels, the higher its intangible value.
However, other arguments suggest the opposite. Agency theorists (Brickley and Dark
1987) argue that market agents of firms with higher advertising may have an incentive to free-
ride on the firm’s reputation, especially in remote markets with high monitoring costs. For
example, franchisees of well-known brands located in remote markets may reduce product
quality, inferring that such actions bear no negative consequences for them or for the firm.
However, such actions can negatively affect the firm’s product perceptions, reputation and its
performance. Thus, when a firm with high advertising also has a high proportion of market-based
channels, the increased moral hazard threat may lower its future cash flows and increase the risk
of these cash flows, lowering its intangible value. Given these opposing effects,
H4a (H4b): The interaction between the proportion of market-based channels in a firm using a dual distribution strategy and its advertising will increase (decrease) its intangible value.
Dual Distribution and Financial Leverage I define financial leverage as the extent to which a firm uses debt to finance its assets
(Jensen and Meckling 1976). A firm’s financial leverage affects its strategy and performance
through agency problems between the firm and its bondholders, and its stockholders (Bradley,
Jarrell, and Kim 1984). As discussed next, these agency problems may result in an interaction
effect between a firm’s financial leverage and dual distribution strategy on its intangible value.

15
Stock and bond markets cannot differentiate between “good quality” and “bad quality”
firms. Thus, “good quality” firms with high financial leverage will signal their quality with
actions too costly for “bad quality” firms (Myers and Majluf 1984). For example, “good quality”
firms may invest in fixed assets, increasing the security for their bondholders, and reducing their
cost of capital (Myers 1977).
By the reverse logic, when a firm with high financial leverage has a high proportion of
market-based channels, an inexpensive source of financial resources (Carney and Gedajlovic
1991), the bond market may interpret this as a signal of low funds, infer the firm’s inability to
service its debt, lower its debt rating, and increase its cost of capital (Lang, Ofek, and Stulz
1996). In such a situation, the stock market may expect the firm’s future cash flows to decrease,
even as their risk increases, negatively affecting its intangible value. Thus,
H5: The interaction between the proportion of market-based channels in a firm using a dual distribution strategy and its financial leverage will decrease its intangible value.
Dual Distribution and Financial Liquidity
Firms vary in their financial liquidity or acid ratio, the extent to which current assets
cover current liabilities, with a higher acid ratio suggesting a larger proportion of current assets
relative to current liabilities. Financial liquidity affects a firm’s strategy and performance
through investment constraints (e.g., Bond and Meghir 1994), creating agency problems between
the firm and its shareholders (Fazzari, Hubbard, and Petersen 1988; Hsiao and Tahmiscioglu
1997). A high acid ratio suggests cash availability to fund investments with superior earnings
potential. Indeed, the stock market prefers a lower acid ratio over a higher one, because it views
current assets as less productive than fixed assets (Myers and Rajan 1998).

16
When a firm has a high proportion of market-based channels and a high acid ratio, the
stock market may infer that it is foregoing income generation opportunities by not investing in
vertical integrated channels. Hence, the stock market may expect a firm’s increasing liquidity
and an increasing proportion of its market-based channels to lower its intangible value. Thus,
H6: The interaction between the proportion of market-based channels in a firm using a dual distribution strategy and its financial liquidity will decrease its intangible value.
METHOD Data
I used an unbalanced panel data of publicly listed US restaurant chains for the period
1992-2002 obtained from various sources including Technomic, an industry market research
firm, COMPUSTAT, and firms’ annual reports. The data included 55 firms observed for 394
firm-years. Some firms entered after 1992 or exited before 2002, contributing fewer firm-years.
The average number of firm-years was 7.164 (minimum = 1 year; maximum = 11 years).
The firms in the study constituted 28% of publicly listed restaurant chains. The profile of
firms in the study did not differ from the population of firms in COMPUSTAT (N= 198) on
profit (t [profitability] = 1.012, ns), but were larger (t [sales] = 1.912, p < 0.10 and t [employees] = 1.987 p
< 0.05). The firms in the study, are representative of the population, although a little larger. This
is not surprising as larger firms are favored in public data sources.
Measures
Tobin’s Q is the measure of the firm’s intangible value. The Chung and Pruitt’s (1994)
method was used to calculate Tobin’s Q: TA
DEBTPSMVEQ ++= where MVE was the closing
price of shares at the financial year-end × number of common shares outstanding, PS was the

17
liquidation value of outstanding preferred stock, DEBT was the sum of book value of inventories,
long term debt, and current liabilities less current assets, and TA was the book value of total
assets.
As discussed earlier, the proportion of the restaurant chain’s franchised units to the total
number of its system units, a continuous measure bounded between 0 (only vertical integrated
channels) to 1 (only market-based channels) was the indicator of its dual distribution strategy.
The trends in dual distribution for the period 1992-2002 suggested variability in dual distribution
across chains and over time.
The firm’s age was measured by the number of years since its incorporation.
The scope of vertical integration was measured by the proportion of the firm’s sales from
its company units to its total sales. The firm’s sales from its company units and its total sales
were obtained from Technomic and COMPUSTAT, respectively.
The firm’s advertising was measured by its advertising stock using advertising
expenditure reported in COMPUSTAT. iv To account for persistence of advertising, advertising
stock was measured using one, two, and three year lags with annual discount rates of 0.45
(Hirschey and Weygandt 1985). Using information criteria, the three year lag was identified as
the appropriate lag.v
The firm’s financial leverage was measured as the ratio of its long-term debt to its total
assets (Jensen and Meckling 1976).
The firm’s financial liquidity was measured as the ratio of its cash, marketable securities,
notes receivable, and accounts receivables to its current liabilities (Schmidgall, Hayes, and

18
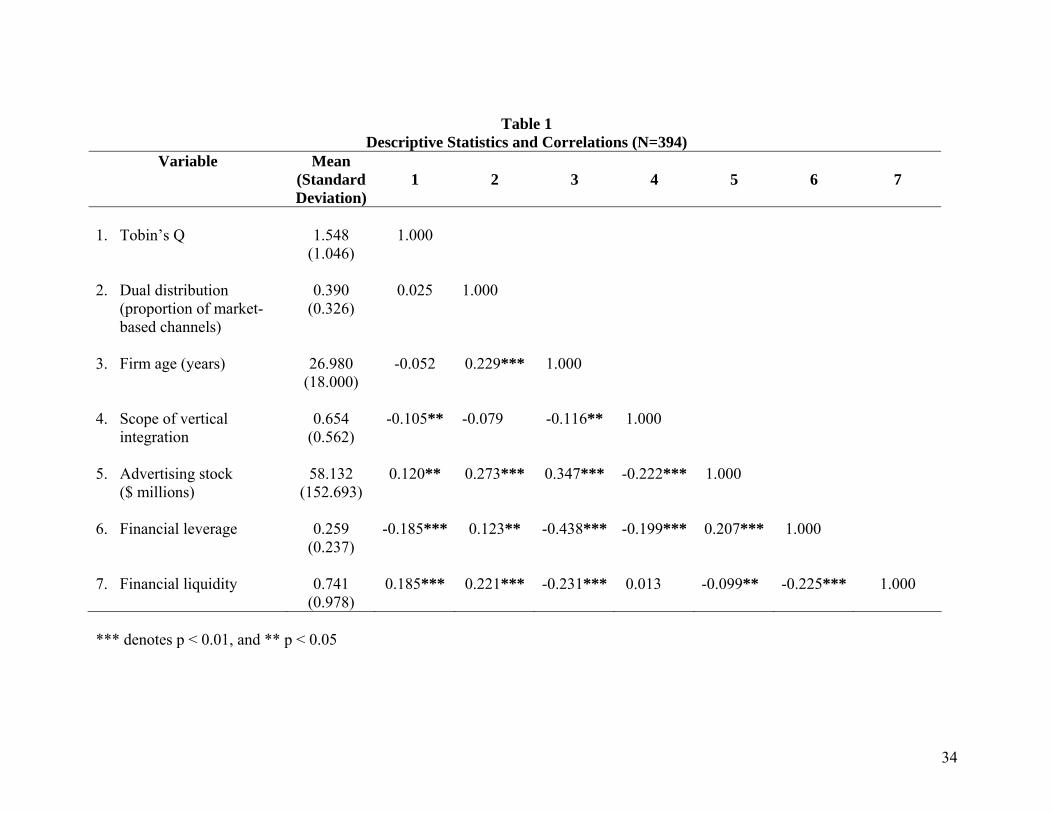
Ninemeier 2002). Table 1 contains the descriptive statistics and the correlation matrix of the
measures.
---- Insert Table 1 here ----
The correlations were within acceptable limits (highest correlation = -0.438 between firm
age and financial leverage). Following Belsley, Kuh, and Welsch (1980), I assessed potential
threats from multicollinearity. The VIF (Variance Inflation Factor) and condition numbers were
lower than 10 (average = 1.238; maximum = 3.456) and 15, respectively (average= 1.875;
maximum = 2.893), suggesting that multicollinearity may not be a threat to the validity of the
study’s findings.
Method: Latent Class Regression
To account for unobserved firm heterogeneity, I used latent class regression that
simultaneously classifies observations into latent segments and estimates regression models
within each segment (see Wedel and Kamakura 2000). The latent class regression approach
directly identifies latent segments on the basis of the inferred relationship between a response
variable (i.e., Tobin’s Q) and the set of explanatory variables (i.e., dual distribution and related
interactions) within each homogenous group (i.e., a given latent segment). An outline of latent
class regression models is provided in Appendix A.
RESULTS
Correction for Sample Selection Bias
Some firms (n=20) were not observed for the entire period. If the data were not missing
randomly and the model was estimated with the observed data, the parameter estimates may be
biased (Heckman 1979). I corrected for potential sample selection bias by including Lee’s λ

19
(Inverse Mill’s Ratio) obtained from a Heckman selection model in the regression model for
Tobin’s Q.vi
I first estimated the Probit selection model including the firm’s age, sales and its return
on assets as factors influencing its exit from the data set. The results supported the selection
model (χ2 = 20.342, degrees of freedom = 1, p < 0.01). The firm’s age (b = -0.063, p < 0.01), size
(b = -0.005, p < 0.01), and return on assets (b = -0.965, p < 0.01) had negative effects in the
selection model. Consistent with the liabilities of newness arguments in organizational sociology
(Brüderl and Schussler 1990), newer, smaller, and less profitable firms were more likely to exit.
Model Estimation and Selection
Following the procedure outlined in Appendix A, I estimated two sets of latent class
regression models: (1) with the restaurant chain’s class (i.e. whether it was casual dining, quick
service, and limited service) and the number of brands in its portfolio (e.g., Yum Brands! had
four brands including KFC, A & W, Pizza Hut, and Taco Bell) as profiling variables and (2) with
only a constant term (i.e. no restaurant characteristics) as the profiling variable. I included all
main effects of explanatory variables used to create the interaction effects to ensure complete
model specification. I also included the firm’s return on its shareholders’ equity measured as the
ratio of net income to shareholders’ equity and a quadratic term of the proportion of its market-
based channels as control variables in the regression model.vii
I used Bayesian Information Criterion (BIC) to compare the model with s segments with
a model with s+1 segments ∀ s = 1, 2, … until the model fit stopped improving to determine the
number of latent segments (Schwarz 1978). The 4-segment model, without restaurant
characteristics term for profiling, outperformed models with 1, 2, 3, and 5 segments, both with
and without profiling variables, and the 4-segment model with profiling variables. viii The

20
entropy of separation for the selected 4-segment model was 0.972, comparing well with results in
the literature (Wedel and Kamakura 2000).
Tests of Hypotheses
Table 2 contains the results of the 4-segment model with the constant term for profiling.
First, Lee’s λ significantly affected a firm’s intangible value in two segments (Segment 2: b = -
0.379, p < 0.01; Segment 4: b = 1.405, p < 0.01), supporting the correction for sample selection
bias. There were several un-hypothesized main effects of the explanatory variables. Specifically,
the negative effect of advertising stock on intangible value was counter-intuitive (Segment 2; b =
-0.001, p < 0.01; Segment 4 = -0.031, p < 0.01). I examine this result in detail subsequently.
---- Insert Table 2 here ----
I next discuss the hypothesized effects. As hypothesized in H1a and H1b respectively, the
results supported both the positive (Segment 2: b = 0.694, p < 0.01) and negative (Segment 1: b
= -0.321, p < 0.05) effects of the firm’s proportion of market-based channels on its intangible
value. In addition, the square of the proportion of market-based channels had an un-
hypothesized positive effect on intangible value in Segment 1 (b = 1.190, p < 0.01). As
hypothesized in H2a and H2b respectively, the results supported the positive (Segment 1: b =
0.022, p < 0.01) and negative (Segment 2: b = -0.034, p < 0.01; Segment 4: b = -0.091, p < 0.01)
interaction effects of the firm’s age with the proportion of its market-based channels on its
intangible value. As expected in H3, the scope of a firm’s vertical integration had positive
(Segment 2: b = 0.634, p < 0.05) interaction effects with the proportion of its market-based
channels on its intangible value. Somewhat, unexpectedly, the scope of a firm’s vertical
integration also had a negative interaction effect with the proportion of its market-based channels

21
on its intangible value (Segment 1: b = -0.413, p < 0.01). I examine this result in detail
subsequently.
The results also supported hypotheses H4a and H4b of the positive (Segment 1: b = 0.005,
p < 0.05; Segment 2: b = 0.005, p < 0.01) and negative (Segment 4: b = -0.073, p < 0.01)
interaction effects of a firm’s advertising stock with the proportion of its market-based channels
on its intangible value. As hypothesized in H5, a firm’s financial leverage had a negative
interaction effect with the proportion of its market-based channels on its intangible value
(Segment 2: b = -1.634, p < 0.01; Segment 3: b = -7.207, p < 0.05). Finally, as expected in H6,
financial liquidity also had a negative interaction effect with the proportion of a firm’s market-
based channels on its intangible value (Segment 1: b = -0.507, p < 0.01; Segment 4: b = -2.144, p
< 0.05). Thus, the results strongly supported the hypotheses.
Latent Segment Profiles
I next report on the post-hoc segment profiles of the four segments. Results from
ANOVA (analysis of variance), reported in Table 3, suggested significant differences across
firms in the four segments. I summarize, below, the Scheffé multiple comparisons of means of
variables across the four segments (Pedhazur 1997): ix
1. Intangible value: Firms in Segment 4 had higher intangible value than other firms (p < 0.01), firms in Segment 3 had higher intangible value than firms in Segments 1 and 2 (p < 0.01), and firms in Segment 2 had higher intangible value than firms in Segment 1 (p < 0.05).
2. Return on assets: Firms in Segment 1 had a much lower return on assets than other firms (p < 0.01).
3. Size: Firms in Segment 2 were larger in terms of system size, total assets, and sales than other firms (p < 0.01 respectively) while firms in Segment 4 were smaller in system size than other firms (p < 0.01).
4. Number of brands: Firms in Segments 3 had more brands than other firms (p < 0.01).
5. Advertising stock: Firms in Segment 2 had higher advertising stock than other firms (p < 0.01) while firms in Segment 4 had lower advertising stock than other firms (p < 0.05).
6. Financial leverage: Firms in Segment 4 had much lower financial leverage than firms in the other segments (p < 0.05).

22
---- Insert Table 3 here ----
I integrate the segment profiles with the regression results to explain the findings across
the segments. Firms in Segment 1 (e.g., Backyard Burgers Inc., Nathan’s Famous Inc., and
Carrols Corporation) performed poorly in this time period. For these firms, the proportion of
market-based channels had a U-shaped relationship (b(linear) = -0.321, p < 0.05; b(quadratic)= 1.190,
p. < 0.01) on their intangible values. Perhaps the stock market infers that, given their poor overall
performance, these firms have limited ability to manage market-based channels although,
somewhat interestingly, this negative effect disappears at very high proportions of market-based
channels. Interestingly, for firms in segment 1, the scope of vertical integration has a positive
main effect on intangible values (b = 0.001, p < 0.01), but this effect is reversed in conjunction
with the proportion of their market-based channels (b = -0.413, p < 0.01). The positive main
effect of vertical integration suggests that for these poorly performing firms, increasing their
sales from the company-based channels reassures the stock market of their future cash flows. On
the other hand, the negative main effect of the proportion of market-based channels, both
independently, and in conjunction, with the scope of vertical integration suggests that the stock
market may view these poorly performing firms as not being well-positioned to manage market-
based channels. However, as these firms grow old, the proportion of their market-based channels
positively affected their intangible values (b = 0.022, p < 0.01), suggesting that, over time,
market-based channels are an effective mechanism for these firms to achieve growth. Likewise,
as their advertising stock increases, the proportion of market-based channels positively affected
their intangible values (b = 0.005, p < 0.05), suggesting that market-based channels also enable
effective leverage of their advertising stocks.

23
Firms in Segment 2 (e.g., IHOP Corporation, McDonald’s Corporation, and Wendy’s
International Inc.) were large firms with large advertising stocks. For these firms, the proportion
of market-based channels positively affected their intangible values (b = 0.694, p < 0.01)
suggesting that perhaps, because of market saturation, market-based channels that tap small and
low-potential markets are an efficient way to grow. The interaction effects of the proportion of
market-based channels with both advertising (b = 0.005, p < 0.01) and scope of vertical
integration (b = 0.634, p < 0.05) positively affected their intangible values. Interestingly, the
main effects of both advertising (b = -0.001, p < 0.01) and scope of vertical integration (b = -
0.001, p < 0.10) for these firms are negative. Perhaps, for these large firms with large advertising
stocks, the ceiling effects of advertising results in the negative main effect. However, the stock
market may view these large firms as being able to effectively leverage their large advertising
stocks over a larger market using market-based channels, resulting in the observed positive
interaction effect of advertising stock with the proportion of market-based channels on intangible
values. The combined negative main and positive interaction effects (with the proportion of
market-based channels) respectively of the scope of vertical integration suggests that the stock
market may be viewing expansion through market-based channels as the most effective way for
these large firms to achieve growth.
Firms in Segment 3 (e.g., Brinker International Inc., CBRL Group Inc., and AFC
Enterprises Inc.) were small firms with a larger portfolio of brands than other firms.
Interestingly, most hypothesized effects of dual distribution on intangible value were not
supported for these firms (one exception: interaction between financial leverage and proportion
of market-based channels (b = -7.207, p < 0.05)). Overall, the intangible values of these firms

24
appeared to be impervious to their dual distribution strategies, perhaps because the stock market
views their brand portfolio diversification as sufficient hedge against market uncertainty.
Firms in Segment 4 (e.g., California Pizza Kitchen Inc., Panera Bread Company, and
Diedrich Coffee Inc.) were smaller firms with low advertising stocks and low financial leverage.
For these firms, there was no main effect of the proportion of market-based channels (b = -1.110,
ns) on their intangible values, while advertising had a negative main effect (b = -0.031, p < .01)
and the scope of vertical integration had a positive main effect (b = 0.001, p < 0.01) on their
intangible values. However, there was a negative interaction effect of the proportion of market-
based channels with advertising stock (b = -0.073, p < 0.01), age (b = -0.091, p < 0.01), and
financial liquidity (b = -2.144, p < 0.05) on their intangible values. The negative effect of
advertising stock on intangible value, both independently and in conjunction with dual
distribution is intriguing. Indeed, after the large firms in segment 2, the firms in segment 4 have
the highest proportion of advertising stock to system size. I conjecture that the stock market may
consider that these firms have adequate advertising stock and need to achieve system growth. In
addition, for these firms, dual distribution has a negative effect on intangible value. Integrating
this pattern of findings suggest, that, perhaps, the stock market views these firms as good
custodians of intangible value, rewarding them for organic growth through company-based
channels (i.e. lower emphasis on dual distribution). I next report additional analyses that
examine the explanatory power and predictive validity of the proposed model.
Additional Analyses
Model comparisons. First, I compared the proposed model to a model with only the
accounting data of financial leverage, liquidity, and return on shareholders’ equity. The
hypothesized model (BIC = 778.354) outperformed this baseline model (BIC = 823.358).

25
Second, I compared the hypothesized model with a model that included the firm’s age, scope of
its vertical integration, advertising stock, and financial accounting data but excluded dual
distribution and the related interaction effects. The hypothesized model (BIC = 778.354) again
outperformed the model that excludes dual distribution (BIC = 798.567). Third, I compared the
proposed model with a model that included main effects of dual distribution and other
explanatory variables but excluded the interaction effects. The hypothesized model (BIC =
778.354) once again outperformed the model that excluded the interaction effects (BIC =
810.187). Thus, the proposed model with the inclusion of dual distribution and related
interactions explained firm value better than models with only accounting data or models that
excluded dual distribution, strongly supporting the value relevance of dual distribution strategy.
Predictive validity. I evaluated the model’s predictive ability using a jackknifing
technique, holding out a target firm, re-estimating the model on other firms, and then using the
estimated parameters to predict the target firm’s Tobin Q. I computed the mean absolute
deviation (MAD), defined as ( )∑∑= =
−=i
i
T
t
N
ipitoit QTobQTobNT
1 1
__/1 where oitQTob _ , pitQTob _ , N
and Ti denote observed and predicted Tobin’s Q for firm i in year t, N the number of firms and Ti
the number of years for each firm i respectively. The MAD using the proposed model was 0.473
compared to a MAD of 0.713 with the average value, representing an improvement of 34 %.
Thus, the proposed model predicts the firm’s intangible value well.
DISCUSSION
Despite the growing importance of dual distribution channels in practice, there are few
insights on their performance implications. In this paper, I explore the relationship between dual

26
distribution strategy and intangible value. I conclude with a discussion of the paper’s theoretical
contributions, managerial implications, and limitations and opportunities for future research.
Theoretical Contributions
This paper’s findings contribute to the marketing channels and marketing metrics
literatures.
Marketing Channels. By relating dual distribution strategy to intangible value, this paper
addresses the call for research on the performance implications of plural governance, general and
dual distribution, in particular (Heide 2003). The study’s findings indicate that a firm’s dual
distribution strategy is value relevant significantly affecting its intangible value. Further, the
differential main and interaction effects of dual distribution across the four latent segments
suggest firm heterogeneity in the value relevance of dual distribution.
For some firms (Segments 1 and 2), an emphasis on dual distribution contributes both
independently, and in conjunction, with other firm characteristics to their intangible values. For
others (Segment 3), their intangible values are impervious to their dual distribution, while yet
others (Segment 4) are punished by the stock market for emphasizing dual distribution, albeit in
conjunction with other firm characteristics. This evidence of firm heterogeneity in the value
relevance of dual distribution empirically validates past theoretical developments (e.g., Bergen,
Dutta, and Walker 1992; Heide 1994) that indicate both advantages and disadvantages of dual
distribution. The generalizability of the contingent nature of the performance effects of dual
distribution to other performance metrics (e.g. profit, market share) emerges as an area for future
research.
Importantly, from a shareholder value perspective, dual distribution does not offer
unilateral benefits to all firms as implied by some observers (e.g., Bradach 1998; Moriarty and

27
Moran 1990) but is instead contingent on their other characteristics including marketing and
financial strategies. This finding, which stresses synergies between aspects of firms’ distribution
and business strategies, represents a useful extension to marketing strategy research, in general
and marketing channels research, in particular, which has, for the most part, not examined such
synergies.
Marketing Metrics. This paper’s findings also contribute to the marketing metrics
literature in which there is a gap on the relationship between a firm’s distribution strategy (dual
distribution, in particular) and its performance. By providing strong evidence of the value
relevance of dual distribution strategy, this study takes a first step toward addressing this gap.
In a departure from past studies in both marketing and accounting literatures, which have
used a functional silo-based approach (i.e. using either marketing or accounting measures
respectively) to study the value relevance of strategy, this paper’s findings support interactions
between aspects of marketing and finance strategies. These interactions suggest a hitherto,
unexamined potential interchangeability between marketing and financial strategies in
maximizing intangible value. For example, a firm with high financial liquidity (firms in Segment
1 and Segment 4) can decrease its emphasis on dual distribution to increase its shareholder value.
Exploring the boundaries of such interchangeability across marketing and other aspects of
business strategies (e.g. finance, accounting, human resources etc.) is an interesting area for
future research, given the growing importance of the financial accountability of marketing (Rust
et al. 2004).
Further, the value relevance of dual distribution suggests that intangible, market-based
channels not accounted on firms’ balance sheets, but on their market agents’ balance sheets,
significantly affect their intangible values. This finding implies the existence of boundaries

28
beyond firms’ balance sheets critical for an accurate assessment of their intangible values. The
demarcation of such extended boundaries for inventorying value-relevant, intangible market-
based assets emerges as an important area for future research.
Finally, the un-hypothesized negative effect of advertising stock on intangible value
(Segment 2 and Segment 4) is counter-intuitive and merits discussion. For the large firms
(Segment 2), perhaps ceiling effects on their large advertising stocks produce this negative
effect. On the other hand, for the small firms (Segment 4), perhaps the stock market views
advertising as an exploratory, risky, value creation strategy and an emphasis on market-based
channels as an exploitative, value appropriation strategy (March 1991). These findings,
combined with those of Mizik and Jacobson (2003) who report a value creation role for research
and development and a value appropriation role for advertising, suggest that whether the stock
market views a given strategy as creating or appropriating value may be context-specific.
Managerial Implications
The study’s findings also generate useful implications for marketing practice. To start
with, the significant and different main and interaction effects of dual distribution on firms’
intangible value across the four latent segments indicate that the value relevance of dual
distribution is contingent on other firm characteristics clarifying the puzzling relationship
between chains’ dual distribution strategies and their intangible values reported in Figure 1.
For example, in 2002, the differences in intangible values between McDonald’s
Corporation (ticker: MCD: Tobin’s Q = 1.290) and Panera Bread Company (PNRA: Tobin’s Q =
5.300) both with similar dual distribution strategy having 0.72 of their system units franchised
may be arising, in part, because of differences in their characteristics including age (MCD = 47
years; PNRA = 15), system units (MCD = 31,108; PNRA = 478), advertising stock ($ million)

29
(MCD = 1088.112; PNRA = 13.445), financial leverage (MCD = 0.400; PNRA = 0.000) and
financial liquidity, (MCD = 0.489; PNRA = 1.348) which influence the relationship between
their dual distribution and their intangible values.
Given the increasing pressures on marketing executives to demonstrate the financial
accountability of marketing and the limited past research on the financial accountability of
distribution strategy, the value relevance of dual distribution is both a novel and useful insight.
Marketing managers can use the paper’s findings to convince various stakeholders (e.g., top
management, and finance executives some of whom may be skeptical of the financial
accountability of marketing) about the value relevance of marketing, in general, and dual
distribution strategy, in particular. Managers can use the study’s specific findings to develop
investor communications program to increase their firm’s intangible value. In addition, given the
model’s predictive ability, investment analysts can use it to assess a chain’s intangible value,
given a set of characteristics.
At an operational level, the study’s findings generate action points for managers of firms
(in the four segments) to maximize their firms’ intangible values:
• Segment 1: For the poorly performing, medium sized firms in Segment 1, a reduced emphasis on market-based channels, especially at moderate levels and when they have high financial liquidity and increased scope of vertical integration will reduce the negative effects of dual distribution on their intangible values. Firms in this segment, with high financial liquidity will be well-served from a shareholder value perspective, by investing their cash resources in vertically integrated channels. Alternatively, these firms can invest their cash resources in additional advertising because as their advertising stocks increases, an increased emphasis on market-based channels increases their intangible value.
• Segment 2: The large firms with large advertising stocks in Segment 2 can increase their intangible values by emphasizing market-based channels, as dual distribution has both positive main and interaction effects with the scope of their vertical integration and advertising stocks. The negative interaction effect of dual distribution with financial leverage suggests that these firms will be well-served from a shareholder value perspective, by reducing their financial leverage.
• Segment 3: The shareholder values of the smaller firms with a large portfolio of brands in Segment 3 appear, for the most part, to be generally impervious to their dual distribution strategies. One

30
exception is the negative interaction effect between their dual distribution and financial leverage on intangible values. These firms can increase their intangible values by decreasing their financial leverage.
• Segment 4: Surprisingly, for the small, well-performing firms, there are no positive effects of dual distribution, either independently or jointly with other characteristics. However, dual distribution has a negative interaction effect with age, advertising and financial liquidity suggesting that over time, and as their advertising stocks and liquidity increase, the stock market rewards them for investing in vertically integrated channels.
Finally, a study of performance in franchise firms is worthy of empirical investigation in
its own right as franchising is a vital force in the U.S. economy (Dant and Kaufmann 2003). In
2003, business format franchises accounted for over 600,000 establishments, 8 million jobs, and
$460 billion of economic output (http://www.franchise.org). Restaurant chains dominate the
industry with 15 of the 20 largest franchises being restaurants, whose sales represented 54% of
revenues of all U.S. franchises. Yet there are few insights on the performance of franchise firms.
As Bradach (1997; p. 301) noted, “..future work should investigate how the functioning and
performance of the plural forms compares in chains with different mixes of company and
franchised units.” The study’s findings on the factors affecting a chain’s performance will be
useful to managers of franchise firms, in general, and restaurant chains, in particular, to increase
their firm value.
Limitations and Opportunities for Future Research
In this first study on the performance implications of dual distribution, I focused on
franchising in general, and restaurant chains, in particular. The choice of one industry allows
control for cross-industry variation enabling a clean test of hypotheses. However, as a result, I do
not consider environmental characteristics (e.g., uncertainty, competitive conditions etc.) which
have been shown to be pertinent to channel decisions. Also, the use of secondary data precluded
consideration of organizational factors (e.g., culture, trust, organizational structure etc.) affecting
channel management. Future research on the performance implications of dual distribution using

31
other methods (e.g., in-depth interviews, surveys) across diverse industry contexts incorporating
other environmental and organizational characteristics will be useful.
This paper’s focus on dual distribution raises questions about the generalizability of the
study’s findings to other plural governance settings. The study’s sample (n=55), although
representative of the population of restaurant chains is small. Future research on performance in
other plural governance settings (e.g., foreign market entry, outsourcing etc.) with larger sample
sizes would represent useful extensions.
The dependent variable in this study is intangible firm value measured by Tobin’s Q.
While, Tobin’s Q is a reliable measure of firm value, it represents the stock market’s evaluation
of the level, speed and risk of the firm’s future cash flows. Research extensions using alternative
performance metrics including survival, risk and volatility in earnings would both complement
and extend the study’s findings.
In sum, this study represents a useful, first step in exploring the performance implications
of dual distribution strategies. Hopefully, this paper will stimulate further work relating plural
governance, in general, and dual distribution, in particular, to firm performance.

32
APPENDIX
Outline of Latent Class Regression Models
Let: Ff ...1= index the restaurant chains, fTt ...1= index the year of restaurant chain f, Ss ...1= index the number of latent segments, ftY be the Tobin’s Q of restaurant chain f in year
t; and ftpX be the value of the pth explanatory variable for restaurant chain f in year t. Assume that the vector of observations ftY be the Tobin’s Q of restaurant chain f in year t arises from a population that is a mixture of S segments in proportions π1, π2, π3, πs where a priori membership of the observations in the different segments is unknown. Then, each firm belongs to one and only one segment and that the point mass for each segment is denoted by sπ such that:
11
=∑=
S
ssπ and 10 ≤≤ sπ (A1)
sπ is the point probability of a firm belonging to segment s.
The objective is to predict the means of the dependent variable for each observation in each segment using a set of explanatory variables. To that end, I specify a linear predictor ftsη , which is a function of the P explanatory variables, X1, X2, .. Xp (Xp = Xftp; p=1…P) and parameter
vectors spββ = to be estimated in segment s: ∑==
P
pspftpfts X
1βη (A2)
The linear predictor is in turn related to the mean of the distribution, stµ through a link function g(.) such that in segment s: )( fstfst g µη = (A3)
In the present case, given the panel structure of the data, the ftY ’s are not independent across the t time periods. The distribution of ftY , given that it comes from segment s,
)|( sfts Yf θ is normal within each of the s segments, so that the identity link function is pertinent such that stfst µη = . Thus, by combining equations (A2) and (A3), I obtain the standard linear regression model within the segments, given the assumption that the firm can belong to only segment. I model sπ with a logit formulation. Specifically:
∑=
=
S
s
ss
s
e
e
1
δ
δ
π (A4)
where, sδ is the segment-specific vector of profiling coefficients. Then, Equation (A4)
is standardized as: ∑+
= −
=
1
11
S
s
ss
s
e
eδ
δ
π (A5)

33
and sδ is parameterized as: ∑=
+=P
ppsfpss z
10 ββδ (A6)
where, fpz is the matrix of profiling variables, s0β is segment specific constant term and psβ is a vector of coefficients for the profiling variables 1,...1 −=∀ Ss , and P is the number of profiling variables.
Estimation and Model Selection If the distributions conditional upon the segments are formulated, the unconditional
distribution of ftY is obtained as: ( ) ( )∑==
S
ssftssft YfYf
1|| θπφ , where ),( θπϕ = and
),( sf λβθ = .The purpose of the latent class regression estimation is to estimate the parameter vector ),( θπϕ = , using the maximum likelihood method, so that the likelihood for ϕ is:
∏∏== =
F
f
T
tftYfYL
1 1)|();( ϕϕ (A7)
For a pre-specified value of the number of segments s, an estimate of ϕ ( 0ϕ ) can be obtained by maximizing the likelihood equation (A7) with respect to ϕ subject to the restrictions in equation (A1) so that the parameter vector ϕ could have produced the observed vector Y. To obtain the parameter estimates, I use the expectation-maximization (E-M) algorithm to maximize the natural logarithm of the likelihood function specified in Equation (A7). 50 randomly selected starting values for each of the models are used to ensure convergence (Wedel and Kamakura 2000). To obtain the standard errors for the parameters the Hessian (or the information matrix) for the final parameter estimates is inverted. Once an estimate of ϕ has been obtained, estimates of the posterior probability fsp a probabilistic allocation of the firm to
the latent segments are obtained using Bayes’ theorem as follows: ( )( )∑
=
=
S
ssfss
sfssfs
yf
yfp
1|
|
θπ
θπ
(A8)
To determine the number of latent segments, the Bayesian Information Criterion (BIC) (Schwarz 1978) is used to compare the model with s segments with a model with s+1 segments ∀ s = 1, 2, … till the model fit stops improving. BIC is calculated as: )ln(**2 FPLLBIC +−= where LL, P, and F stand for log-likelihood value, number of parameters, and sample size respectively. I also report an entropy measure of separation (ES), the extent of separation of the
segments which is calculated as )ln(
)ln(1 1 1
SF
ppES
F
f
S
sfsfs∑∑
−= = = where fsp is the probability of firm
f belonging to segment s, which is calculated using the Bayes rule specified in equation (A8) above. ES is bounded in the range 0 to 1, such that a value closer to 1 indicates good separation of the latent segments.
34
Table 1
Descriptive Statistics and Correlations (N=394) Variable Mean
(Standard Deviation)
1
2
3
4
5
6
7
1. Tobin’s Q
1.548
(1.046)
1.000
2. Dual distribution
(proportion of market-based channels)
0.390
(0.326)
0.025
1.000
3. Firm age (years)
26.980
(18.000)
-0.052
0.229***
1.000
4. Scope of vertical
integration
0.654
(0.562)
-0.105**
-0.079
-0.116**
1.000
5. Advertising stock ($ millions)
58.132
(152.693)
0.120**
0.273***
0.347***
-0.222***
1.000
6. Financial leverage
0.259
(0.237)
-0.185***
0.123**
-0.438***
-0.199***
0.207***
1.000
7. Financial liquidity
0.741
(0.978)
0.185***
0.221***
-0.231***
0.013
-0.099**
-0.225***
1.000
*** denotes p < 0.01, and ** p < 0.05

35
Table 2 Results for Model Relating a Firm’s Dual Distribution to its Intangible Value (N=394)
Variable
Segment 1a
Segment 2
Segment 3
Segment 4
Intercept
0.853 (0.049)***
1.393 (0.071)***
1.891 (0.254)***
0.593 (0.592)
H1a /H1b: Dual distribution@ -0.321 (0.135)**
0.694 (0.149)***
0.564 (0.605)
-1.110 (1.009)
H2a /H2b: Dual distribution × firm age 0.022 (0.007)***
-0.034 (0.009)***
0.028 (0.028)
-0.091 (0.031)***
H3: Dual distribution × scope of vertical integration
-0.413 (0.160)***
0.634 (0.253)**
0.100 (0.781)
-0.140 (0.206)
H4a /H4b: Dual distribution × advertising stock
0.005 (0.002)**
0.005 (0.001)***
-0.003 (0.010)
-0.073 (0.025)***
H5: Dual distribution × financial leverage
-0.275 (0.471)
-1.634 (0.449)***
-7.207 (3.215)**
7.175 (5.218)
H6: Dual distribution × financial liquidity
-0.507 (0.072)*** -0.138 (0.153) -0.367 (0.474) -2.144 (1.043)**
Firm age -0.004 (0.002)** 0.006 (0.003)** 0.009 (0.004)** -0.038 (0.014)*** Scope of vertical integration 0.001 (0.000)*** -0.001 (0.000)* -0.001 (0.000)*** 0.001 (0.000)*** Advertising stock 0.001 (0.002) -0.001 (0.000)*** -0.002 (0.003) -0.031 (0.007)*** Financial leverage 0.947 (0.135)*** -0.661 (0.142)*** -3.150 (0.864)*** -3.019 (1.384)** Financial liquidity 0.323 (0.033)*** -0.192 (0.050)*** 0.199 (0.179) 0.585 (0.405) Dual distribution2 1.190 (0.358)*** -0.695 (0.498) -3.151 (2.657) 1.328 (1.486) Return on shareholders’ equity 0.035 (0.025) 0.013 (0.013) 0.884 (0.348)** -0.582 (0.235)** Lee’s lambda 0.011 (0.049) -0.379 (0.113)*** 0.111 (0.111) 1.405 (0.541)*** Segment size (number of firms) 36% (20) 29% (16) 20% (11) 15 % (8)
a Parameter estimates and standard errors; *** denotes p < 0.01, ** p < 0.05 and * p < 0.10. @ Dual distribution is measured by the proportion of market-based channels in the firm.

36
Table 3 Summary of Results across the Four Latent Segments
Variable
Segment 1
Segment 2
Segment 3
Segment 4
Intangible value (22.192***)@ 1.048 1.300 1.903 2.735 Return on assets ( 8.345***) 0.006 0.018 0.016 0.028 System size (units) (5.698***) 1671 2229 1064 643 Total assets ($ millions) (10.082***) 398.451 1450.611 443.613 343.658 Sales ($ millions) (9.178***) 653.684 1091.030 630.852 518.781 Number of brands (3.184**) 1.400 1.375 2.545 1.375 Advertising stock ($ mil) (9.231***) 42.363 83.832 32.557 23.388 Financial leverage (6.792***) 0.323 0.315 0.205 0.155 Exemplar members Backyard Burgers
Inc., Nathan’s Famous Inc., Carrols Corporation,
IHOP Corp., McDonald’s Corp, Wendy’s International Inc.
Brinker International Inc, CBRL Group Inc., AFC Enterprises Inc.
California Pizza Kitchen Inc. , Panera Bread Company, Diedrich Coffee Inc.
Dual distribution (H1a/H1b)(+/-) - /+(quadratic) + ns ns
Dual distribution and firm age (H2a /H2b) (+/-)
+ - ns -
Dual distribution and scope of vertical integration (H3) (+)
- + ns ns
Dual distribution and advertising (H4a /H4b) (+/-)
+ + ns -
Dual distribution and financial leverage (H5) (-)
ns - - ns
Dual distribution and financial liquidity(H6) (-)
- ns ns -
@Figures in parentheses are the overall test of means across the four segments (F(3, 51)).

37
Figure 1 Dual Distribution and Intangible Value in Restaurant Chains (2002)
0.00 0.20 0.40 0.60 0.80 1.00Dual Distribution (measured by proportion of system units franchised)
0.00
1.00
2.00
3.00
4.00
5.00
6.00
Inta
ngib
le V
alue
(Tob
in's
Q)
Piccadilly Cafeterias Inc.
Rare Hospitality Intl. Inc.CBRL Group Inc.
Ryan's Restaurant Group Inc.Benihana Inc.
California Pizza Kitchen Inc.
Outback Steakhouse Inc. Chammps Entertainment Inc.
Brinker International Inc.
Smith and Wollensky Restaurant Group
Starbucks Corporation
Red Robin Gourmet Burgers
CKE Restaurants Inc.
Backyard Burgers Inc.
Krispy Kreme Doughnut Inc.
McDonald's Corp.
Panera Bread Company
Diedrich Coffee Inc.
Applebee's International Inc.
Papa John's International Inc.
Sonic Corp.
Triarc Cos. Inc.

38
REFERENCES Aaker, David A., and Robert Jacobson (2001), “The Value Relevance of Brand Attitude in High-
Technology Markets,” Journal of Marketing Research (JMR), 38 (4-12), 485-493.
Alchian, A. A., and H. Demsetz (1972), “Production Information Costs and Economic Organization,” American Economic Review, 62 (December), 777-795.
Amir, Eli and Baruch Lev (1996), “Value Relevance of Non-financial Information: The Wireless Communications Industry,” Journal of Accounting and Economics, 22, 3-30.
Anderson, Erin (1988), “Transactions Costs as Determinants of Opportunism in Integrated and Independent Sales Forces,” Journal of Economic Behavior and Organization, 9, 247-64.
----, George S. Day, and V. K. Rangan (1997), “Strategic Channel Design,” Sloan Management Review, 38(4), 59-69.
----, and Barton A. Weitz (1986), “Make or Buy Decisions: Vertical Integration and Marketing Productivity,” Sloan Management Review, 27 (Spring), 3-20.
----, and David Schmittlein (1984), “Integration of the Sales Force: An Empirical Investigation,” RAND Journal of Economics, 15(3), 385-395.
Anderson, Eugene W., Claes Fornell, and Sanal K. Mazvancheryl (2004), “Customer Satisfaction and Shareholder Value,” Journal of Marketing, 68 (October), 172-185.
Arrow, Kenneth (1985), “The Economics of Agency” in Principals and Agents: The Structure of Business. J. Pratt and R. Zeckhauser, eds. Boston, MA: Harvard Business School Press.
Banerji, Shumeet, and Carol Simon (1991), “Franchising versus Ownership: A Contracting Explanation,” unpublished mimeo, Graduate School of Business, University of Chicago.
Barth, Mary E., Michael B. Clement, George Foster, and Ron Kasznik (1998), “Brand Values and Capital Market Evaluation,” Review of Accounting Studies, 3, 41-68.
Bayus, Barry L., Gary Erickson, and Robert Jacobson (2003), “The Financial Rewards of New Product Introductions in the Personal Computer Industry,” Management Science, 49 (2), 197-209.
Belsley D., E. Kuh, and R. Welsch (1980). Regression Diagnostics. New York, NY: Wiley Publishers.
Bergen, Mark, Shantanu Dutta, and Orville C. Walker Jr. (1992), “Agency Relationships in Marketing: A Review of the Implications and Applications of Agency and Related Theories,” Journal of Marketing, 56(July), 1-24.
Bharadwaj, Anandhi S., Sundar G. Bharadwaj, and Benn R. Konsynski (1999), “Information Technology Effects on Firm Performance as Measured by Tobin’s Q,” Management Science, 45 (June), 1008-1024.
Blair, R. D., and D. L. Kaserman (1994), “A Note on Incentive Compatibility under Franchising,” Review of Industrial Organization,” 9, 323-330.
Bolton, Ruth (2004), “Linking Marketing to Financial Performance and Firm Value,” Journal of Marketing, 68(October), 73-75.

39
Bond, Stephen, and Costas Meghir (1994), “Dynamic Investment Models and the Firm's Financial Policy,” Review of Economic Studies, 61, 197-222.
Bowman, E. H. and D. Hurry (1993), “Strategy through the Option Lens: An Integrated View of Resource Investments and the Incremental-choice Process,” Academy of Management Review, 18 (4), 760-782.
Bradach, Jeffrey F. (1997), “Using the Plural Form in the Management of Restaurant Chains,” Administrative Science Quarterly, 42, 276-303.
---- (1998). Franchise Organizations. Boston, MA: Harvard Business School Press.
Bradley, M. G. Jarrell, and E. Kim (1984), “On the Existence of an Optimal Capital Structure,” Journal of Finance, 39, 857-878.
Brickley J. A., and F. H. Dark (1987), “The Choice of Organizational Form: The Case of Franchising,” Journal of Financial Economics, 18, 401-420.
Brüderl, Josef, and Rudolf Schussler (1990), “Organizational mortality: The liabilities of newness and adolescence,” Administrative Science Quarterly, 35, 530-547.
Capon, Noel, John U. Farley., and S. Hoenig. (1990), “Determinants of Financial Performance: A Meta-analysis,” Management Science, 36 (October), 1143-1159.
Carney, M., and E. Gedajlovic (1991), “Vertical Integration in Franchise Systems: Agency Theory and Resource Explanations,” Strategic Management Journal, 12, 607-629.
Chung, Kee H., and Stephen W. Pruitt (1994), “A Simple Approximation of Tobin’s Q,” Financial Management, 23(Autumn), 70-74.
Comanor, W. S., and T.A. Wilson (1967), “Advertising, Market Structure and Performance,” Review of Economics and Statistics, 49, 423-440.
Dahlstrom, Robert, and Arne Nygaard (1994), “A Preliminary Investigation of Franchised Oil Distribution in Norway,” Journal of Retailing, 70(2), 179-191.
----, and ---- (1999), “An Empirical Investigation of Ex Post Transaction Costs in Franchised Distribution Channels,” Journal of Marketing Research, 36(May), 160-170.
Dant, Rajiv, and Patrick Kaufmann (2003), “Structural and Strategic Dynamics in Franchising,” Journal of Retailing, 79, 63-75.
Dutta, Shantanu, Mark Bergen, Jan B. Heide, and George John (1995), “Understanding Dual Distribution: The Case of Reps and House Accounts,” Journal of Law, Economics, and Organization, 11(1), 189-204.
Fama, Eugene F., and Michael C. Jensen (1983), “Agency Problems and Residual Claims,” Journal of Law and Economics, 26, 327-349.
Fazzari, S.M., R.G. Hubbard, and B. Petersen (1988), “Financing Constraints and Corporate Investment,” Brookings Papers on Economic Activity, (Spring), 141-206.
Gatignon, Hubert and Dominique M. Hanssens (1987), “Modeling Marketing Interactions with Application to Salesforce Effectiveness,” Journal of Marketing Research, 24(3), 247-57.
Geyskens, Inge, Katrijn Gielens, and Marnik G. Dekimpe (2002), “The Market Valuation of Internet Channel Additions,” Journal of Marketing, 66(April), 102-119.
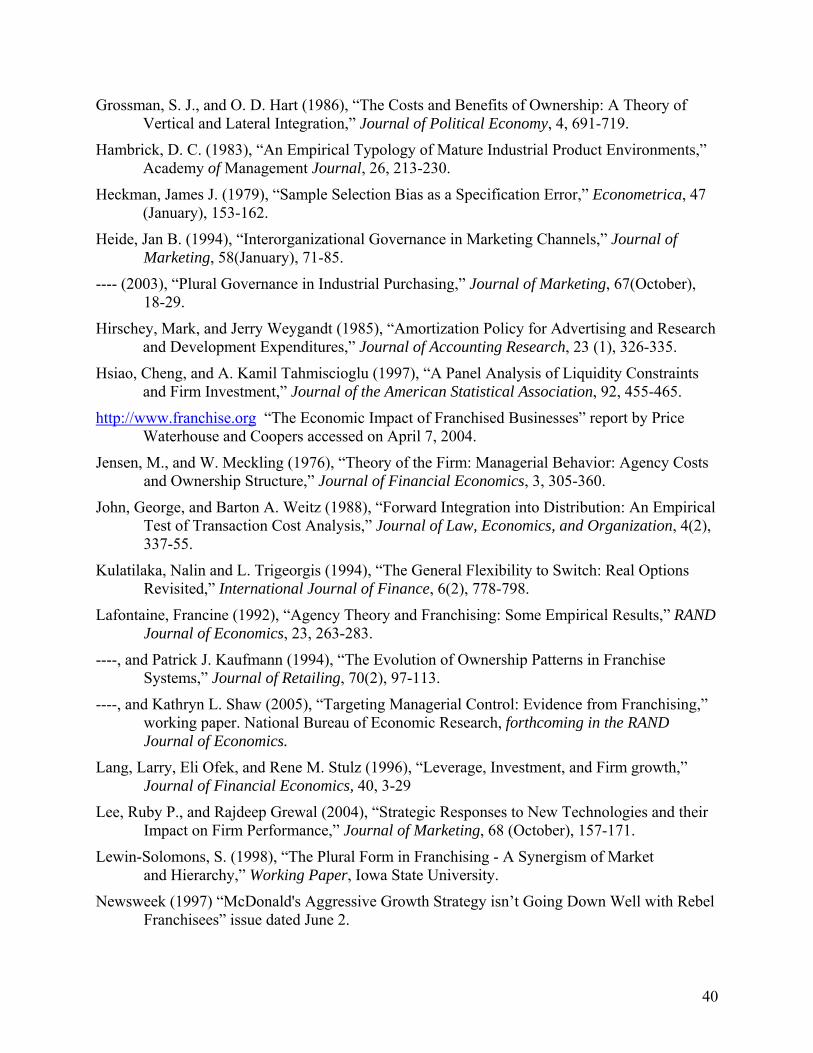
40
Grossman, S. J., and O. D. Hart (1986), “The Costs and Benefits of Ownership: A Theory of Vertical and Lateral Integration,” Journal of Political Economy, 4, 691-719.
Hambrick, D. C. (1983), “An Empirical Typology of Mature Industrial Product Environments,” Academy of Management Journal, 26, 213-230.
Heckman, James J. (1979), “Sample Selection Bias as a Specification Error,” Econometrica, 47 (January), 153-162.
Heide, Jan B. (1994), “Interorganizational Governance in Marketing Channels,” Journal of Marketing, 58(January), 71-85.
---- (2003), “Plural Governance in Industrial Purchasing,” Journal of Marketing, 67(October), 18-29.
Hirschey, Mark, and Jerry Weygandt (1985), “Amortization Policy for Advertising and Research and Development Expenditures,” Journal of Accounting Research, 23 (1), 326-335.
Hsiao, Cheng, and A. Kamil Tahmiscioglu (1997), “A Panel Analysis of Liquidity Constraints and Firm Investment,” Journal of the American Statistical Association, 92, 455-465.
http://www.franchise.org “The Economic Impact of Franchised Businesses” report by Price Waterhouse and Coopers accessed on April 7, 2004.
Jensen, M., and W. Meckling (1976), “Theory of the Firm: Managerial Behavior: Agency Costs and Ownership Structure,” Journal of Financial Economics, 3, 305-360.
John, George, and Barton A. Weitz (1988), “Forward Integration into Distribution: An Empirical Test of Transaction Cost Analysis,” Journal of Law, Economics, and Organization, 4(2), 337-55.
Kulatilaka, Nalin and L. Trigeorgis (1994), “The General Flexibility to Switch: Real Options Revisited,” International Journal of Finance, 6(2), 778-798.
Lafontaine, Francine (1992), “Agency Theory and Franchising: Some Empirical Results,” RAND Journal of Economics, 23, 263-283.
----, and Patrick J. Kaufmann (1994), “The Evolution of Ownership Patterns in Franchise Systems,” Journal of Retailing, 70(2), 97-113.
----, and Kathryn L. Shaw (2005), “Targeting Managerial Control: Evidence from Franchising,” working paper. National Bureau of Economic Research, forthcoming in the RAND Journal of Economics.
Lang, Larry, Eli Ofek, and Rene M. Stulz (1996), “Leverage, Investment, and Firm growth,” Journal of Financial Economics, 40, 3-29
Lee, Ruby P., and Rajdeep Grewal (2004), “Strategic Responses to New Technologies and their Impact on Firm Performance,” Journal of Marketing, 68 (October), 157-171.
Lewin-Solomons, S. (1998), “The Plural Form in Franchising - A Synergism of Market and Hierarchy,” Working Paper, Iowa State University.
Newsweek (1997) “McDonald's Aggressive Growth Strategy isn’t Going Down Well with Rebel Franchisees” issue dated June 2.

41
March, James G. (1991), “Exploration and Exploitation in Organizational Learning,” Organization Science, 2(1), 71-87.
Martin, R. E. (1988), “Franchising and Risk Management,” American Economic Review, 78(5), 954-68.
Mathewson, George, and Ralph Winter (1984), “An Economic Theory of Vertical Restraints,” RAND Journal of Economics, 15(Spring), 27-38.
McDonald’s 1995 Annual Report accessed from http://www.edgaronline.org accessed on June 22, 2005.
Mizik, Natalie, and Robert Jacobson (2003), “Trading Off between Value Creation and Value Appropriation: The Financial Implications of Shifts in Strategic Emphasis,” Journal of Marketing, 67(January), 63-76.
Moriarty, Rowland T., and Ursula Moran (1990), “Managing Hybrid Marketing Systems,” Harvard Business Review, 68(6), 146-155.
Myers, S. (1977), “Determinants of Corporate Borrowing,” Journal of Financial Economics, 9, 147-176.
----, and N. Majluf (1984), “Corporate Finance and Investment Decisions when Firms have Information Investors do not Have,” Journal of Financial Economics, 13, 187-221.
Myers, Stewart C., and Raghuram G. Rajan (1998), “The Paradox of Liquidity,” The Quarterly Journal of Economics, 113(3), 733-771.
Oxenfeldt, A., and A.O. Kelly (1969), “Will Successful Franchise Systems Ultimately Become Wholly-Owned Chains?” Journal of Retailing, 44, 69-83.
Papa John’s Annual Report (2004) accessed from http://www.papajohns.com on June 27, 2005.
Pauwels, Koen, Jorge Silva-Risso, Shuba Srinivasan, and Dominique M. Hanssens (2004), “New Products, Sales Promotions, and Firm Value: The Case of the Automobile Industry,” Journal of Marketing, 68 (4), 142-56.
Pedhazur, Elazar, J (1997). Multiple Regression in Behavioral Research. New York, NY: Harcourt Brace College Publishers.
Penrose, Edith T. (1959). The Theory of the Growth of the Firm. New York, NY: Wiley Publishers.
Rao, Vithala R., Manoj Agarwal, and Denise Dahloff (2004), “How is Manifested Branding Strategy Related to the Intangible Value of a Corporation?” Journal of Marketing, 68 (October), 126-141.
Ravenscraft D., and F. M. Scherer (1982), “The Lag Structure of Returns to Research and Development,” Applied Economics, 14(6), 603-620.
Rindfleisch, A., and Jan B. Heide (1997), “Transaction Cost Analysis: Past, Present, and Future Applications,” Journal of Marketing, 61(October), 30-54
Rust, Roland T., Tim Ambler, Gregory S. Carpenter, V. Kumar, and Rajendra K. Srivastava (2004), “Measuring Marketing Productivity: Current Knowledge and Future Directions,” Journal of Marketing, 68 (4), 76-89.

42
Schmidgall, Raymond S., David K. Hayes, and Jack D. Ninemeier (2002). Restaurant Financial Basics. Hoboken, N.J. John Wiley & Sons, Inc.
Schwarz, Gideon (1978), “Estimating the Dimensions of a Model,” Annals of Statistics, 6 (2), 461-464.
Simon, Carol J., and Mary W. Sullivan (1993), “The Measurement and Determinants of Brand Equity: A Financial Approach,” Marketing Science, 12(Winter), 28-52.
Srivastava, Rajendra K., Tassaduq A. Shervani, and Liam Fahey (1998), “Market-based Assets and Shareholder Value: A Framework for Analysis,” Journal of Marketing, 62(January), 2-18.
---, ----, and ---- (1999), “Marketing, Business Processes, and Shareholder Value: An Organizationally Embedded View of Marketing Activities and the Discipline of Marketing,” Journal of Marketing, 63(Special Issue), 168-179.
Stern, Louis W., and Barton A. Weitz (1997), “The Revolution in Distribution: Challenges and Opportunities,” Long Range Planning, 30(6), 823-829.
Wedel Michel, and Wagner A. Kamakura (2000). Market Segmentation: Conceptual and Methodological Foundations. Boston, MA: Kluwer Academic Publishers.
Weiss, Allen M., and Erin Anderson (1992), “Converting from Independent to Employee Sales Forces: The Role of Perceived Switching Costs,” Journal of Marketing Research, 22(1), 101-115.
Williamson, Oliver (1975). Markets and Hierarchies. New York, NY: The Free Press.
---- (1985). The Mechanisms of Market Governance. New York, NY: Oxford University Press.
---- (1991), “Comparative Economic Organization: The Analysis of Discrete Structural Alternatives,” Administrative Science Quarterly, 36(2), 269-296.
Yin, Xiaoli, and Edward J. Zajac (2004), “The Strategy/Governance Structure Fit Relationship: Theory and Evidence in Franchising Arrangements,” Strategic Management Journal, 25, 365-383.
Zeithaml, Valarie A., Rajan P. Varadarajan, and Carl P. Zeithaml, (1988), “The Contingency Approach: Its Foundations and Relevance to Theory Building and Research in Marketing,” European Journal of Marketing, 22(7), 37-64.

43
Endnotes
i I use the terms ‘firm,’ ‘restaurant chain,’ and ‘chain’ interchangeably to denote the restaurant chain and the terms ‘intangible value’ and ‘value,’ and ‘intangible firm value’ to denote the firm’s intangible value measured by its Tobin’s Q. ii The terms ‘multiple channels and ‘dual channels’ have also been used to denote the situation when a firm owns and operates more than one channel (e.g. JC Penney with catalog operations, online store and brick-and-mortar stores). I use the term ‘dual distribution’ in this paper to denote a situation where one channel is owned and operated by the firm and the other channel is market-contracted to external agents.
In addition, the term ‘hybrid’ has been used variously in the literature. Some authors (e.g., Moriarty and Moran 1990) have used it to describe a combination of institutional forms, as in this paper, but others (e.g., Williamson 1991) have used the term ‘hybrid’ to describe a governance form that is intermediate between market governance and hierarchical governance. iii I gratefully acknowledge the guidance of two anonymous reviewers in the development of this section. iv None of the firms in the study reported research and development expenditure. v I thank an anonymous reviewer for this suggestion. The BIC (Schwarz Bayesian Information Criterion) for the 4-segment model (reported subsequently) without profiling variables is 784.682 and 786.029 for models with advertising stock with a one-year and two-year lagged term for the advertising stock respectively compared to 778.354 for the model with a three-year lag for the advertising stock. Hence, the three-year lagged term for advertising stock is selected as the appropriate lag term.
Also, following the suggestions of this reviewer, I re-estimated the model with advertising stock adjusted for the firm’s sales. The results were generally consistent, but the model with the advertising adjusted for sales performed worse (BIC = 801.932) than the proposed model (BIC=778.354). I get similar results using the CAIC (Consistent Akaike’s Information Criterion). vi See Heckman (1979) for details on the statistics of sample selection correction. vii I included the quadratic term for dual distribution following the suggestion of an anonymous reviewer. viii For the model formulation with restaurant class and number of brands as profiling variables, the BIC is 1131.655 for the 1-segment model, 861.773 for the 2-segment model, 846.560 for the 3-segment model, 822.564 for the 4-segment model and 808.100 for 5-segment model, respectively. Similarly, for model formulation with only the constant term as the profiling variable, the BIC is 1131.655 for the 1-segment model, 843.380 for the 2-segment model, 828.113 for the 3-segment model, 778.354 for the 4-segment model, and 786.839 for the 5-segments model, respectively. I get similar results using CAIC. ix There are no significant differences across firms in the 4 segments on other variables.