Embed Size (px)
Citation preview
DUBAI DUTY FREE
SAFETY MEASURESCOVID-19 MitigationMEADFA 22nd Nov 2021
Ramesh CidambiChief Operating Officer
Dubai Duty Free
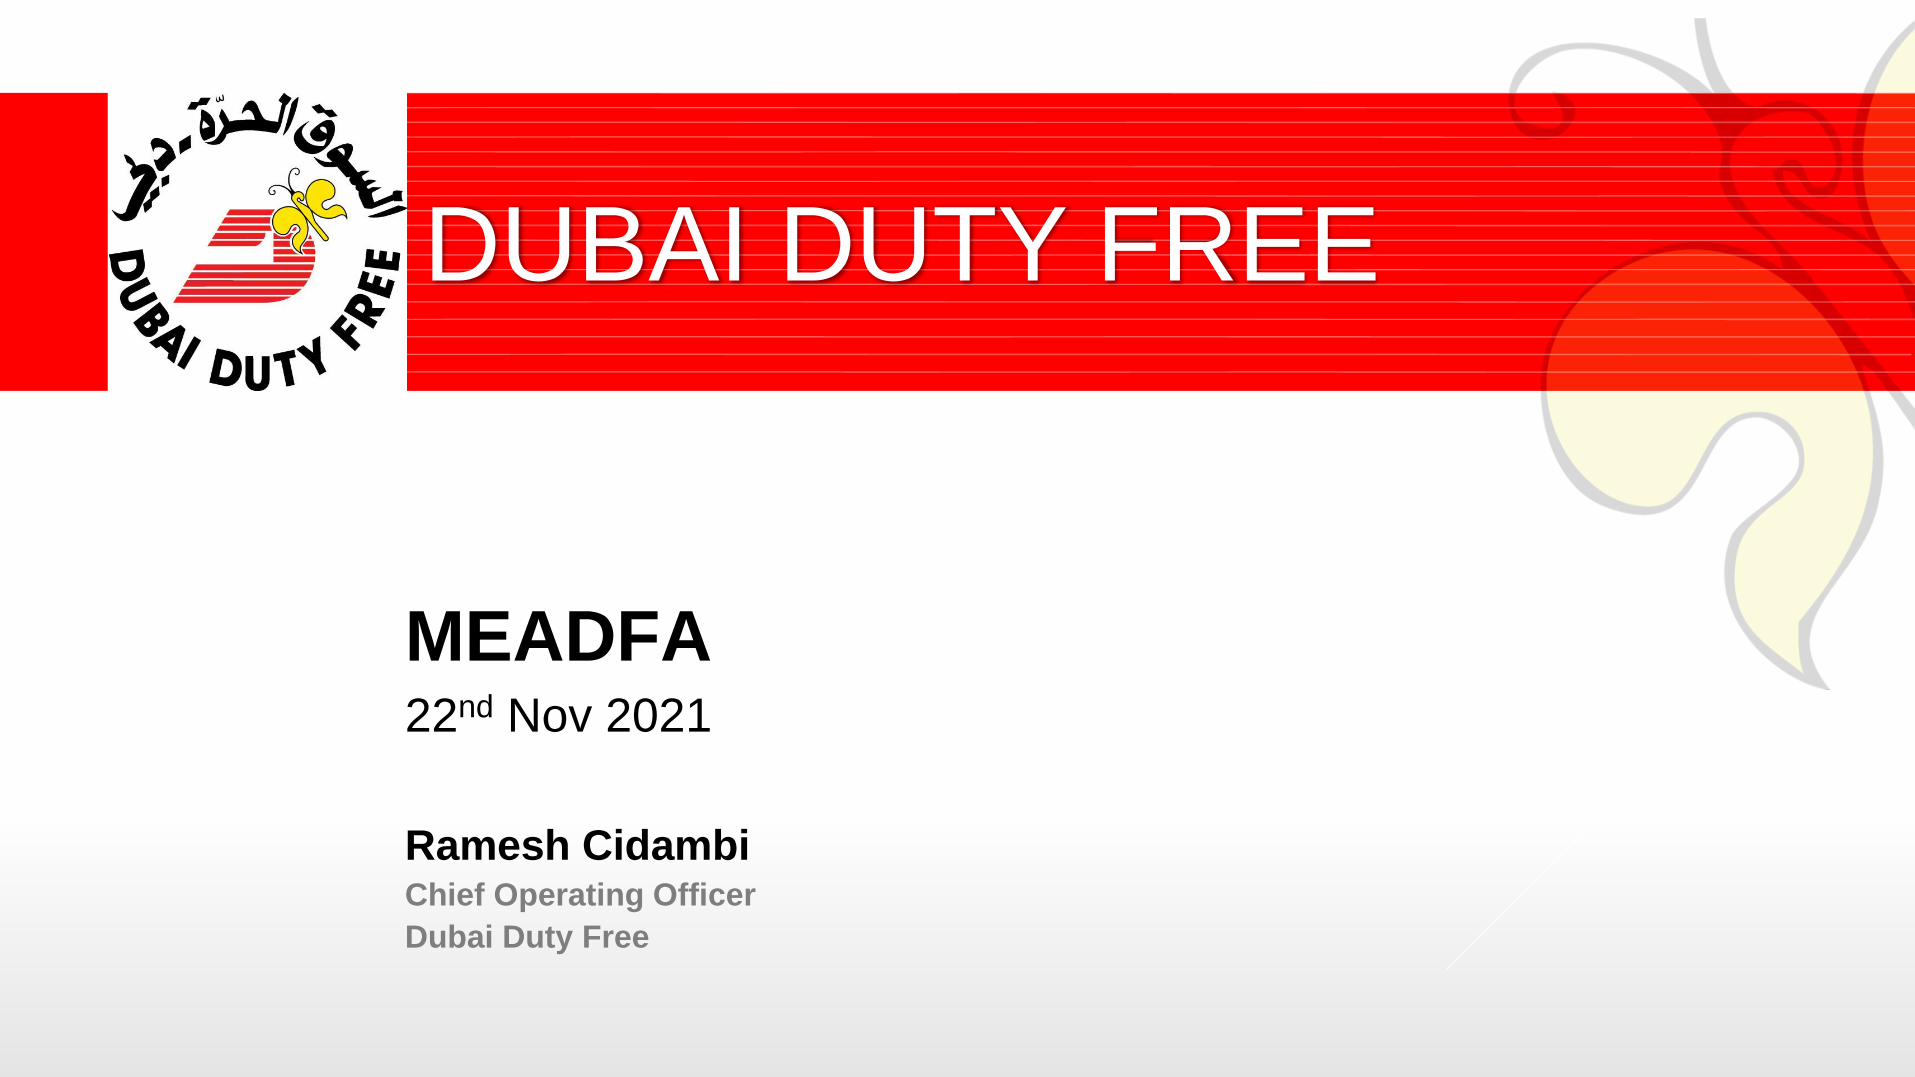
Sales vs Passengers (1983 – 2021)
▪ 10.3% average sales growth over 37 years.
19832000 2010 2018
247
1,9261,828
1,932 2,015
2,029
697
959
4 4 4 4 4 5 5 4 5 6 6 7 8 9 10 11 12 14 16 18
22 25
29 34
37 41
47 51
58
66
73 78
84 89 90 88
26
27
-
10
20
30
40
50
60
70
80
90
100
0
200
400
600
800
1,000
1,200
1,400
1,600
1,800
2,000
1 2 3 4 5 6 7 8 9 10 11 12 13 14 15 16 17 18 19 20 21 22 23 24 25 26 27 28 29 30 31 32 33 34 35 36 37 38
PAX IN MILLIONSSALES IN USD MILLIONS
2000
2019 Sales - AED 7.406 Billion (USD 2.029 B)
Annual Sales & Passenger Statistics
1983 2021
(AED 3.5b)
ES
T.
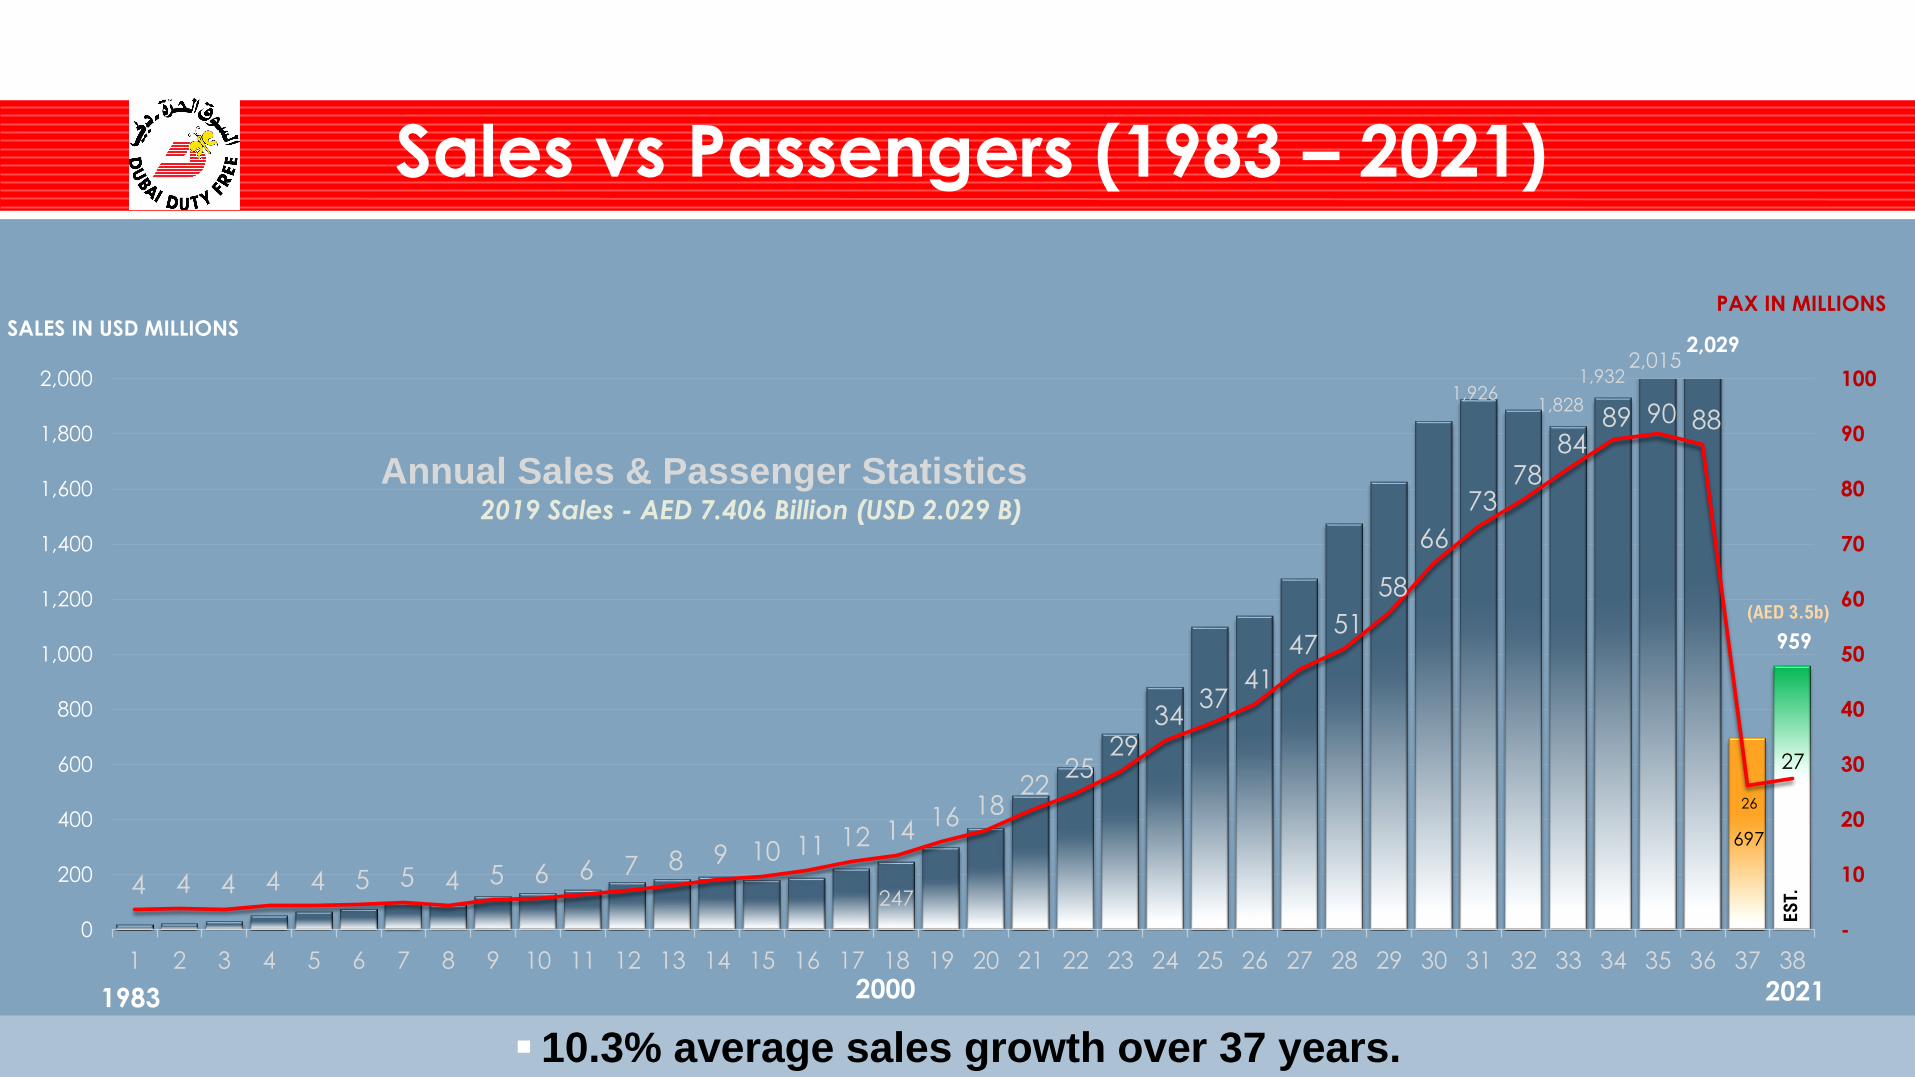
Retail Business | After Re-opening - PAX
103
529
930
1,136
1,466 1,585
2,186
2,046
1,670
2,028
1,872
1,473 1,555
1,916
2,303
2,452
3,422
4,008
JUN JUL AUG SEP OCT NOV DEC JAN FEB MAR APR MAY JUN JUL AUG SEP OCT NOV
Monthly Passenger Statistics (Deps + Arrvls)
After Re-Opening & Compared to Pre-Pandemic
PAX in Thousands
-98.5%
-93.6%
-88.9%
-84.3%
-79.2%
-77.3%
-72.1%
-74.3%
-75.9%
-73.5%
-73.4%
-74.2%
Jun '20 - Oct ‘21 Source: Dubai Airport
Nov ‘21 Source: DDF Operations Est
-65.0%
-78.1%
-76.1%
-71.2%
-52.4%
-44.3%
2020 2021
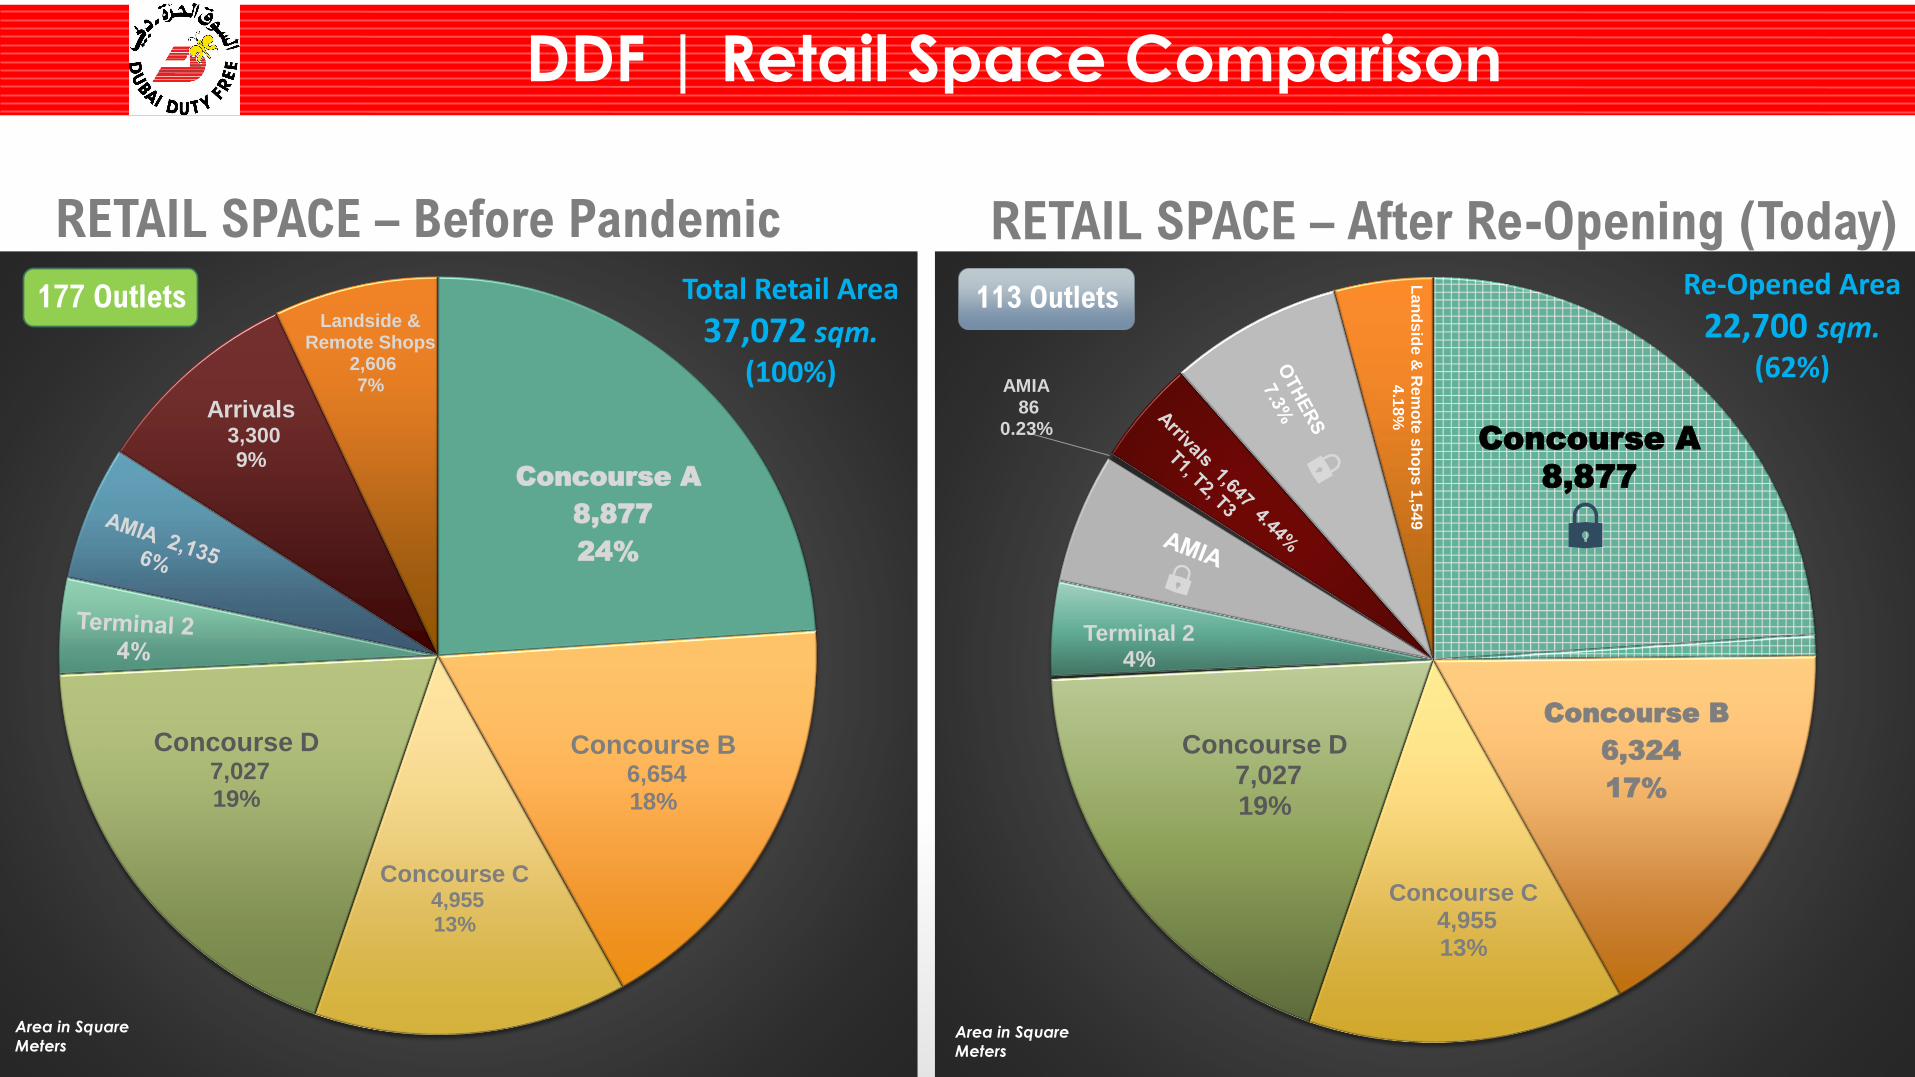
DDF | Retail Space Comparison
Concourse A
8,877
24%
Concourse B6,654 18%
Concourse C4,955 13%
Concourse D7,027 19%
Arrivals3,300 9%
Landside & Remote Shops
2,606 7%
Area in Square
Meters
Total Retail Area
37,072 sqm.(100%)
RETAIL SPACE – Before Pandemic RETAIL SPACE – After Re-Opening (Today)
177 Outlets
Concourse B
6,324
17%
Concourse C4,955 13%
Concourse D7,027 19%
Terminal 24%
AMIA86
0.23%
La
nd
sid
e &
Rem
ote
sh
op
s1
,54
9
4.1
8%
Concourse A
8,877
Area in Square
Meters
113 Outlets Re-Opened Area
22,700 sqm.(62%)
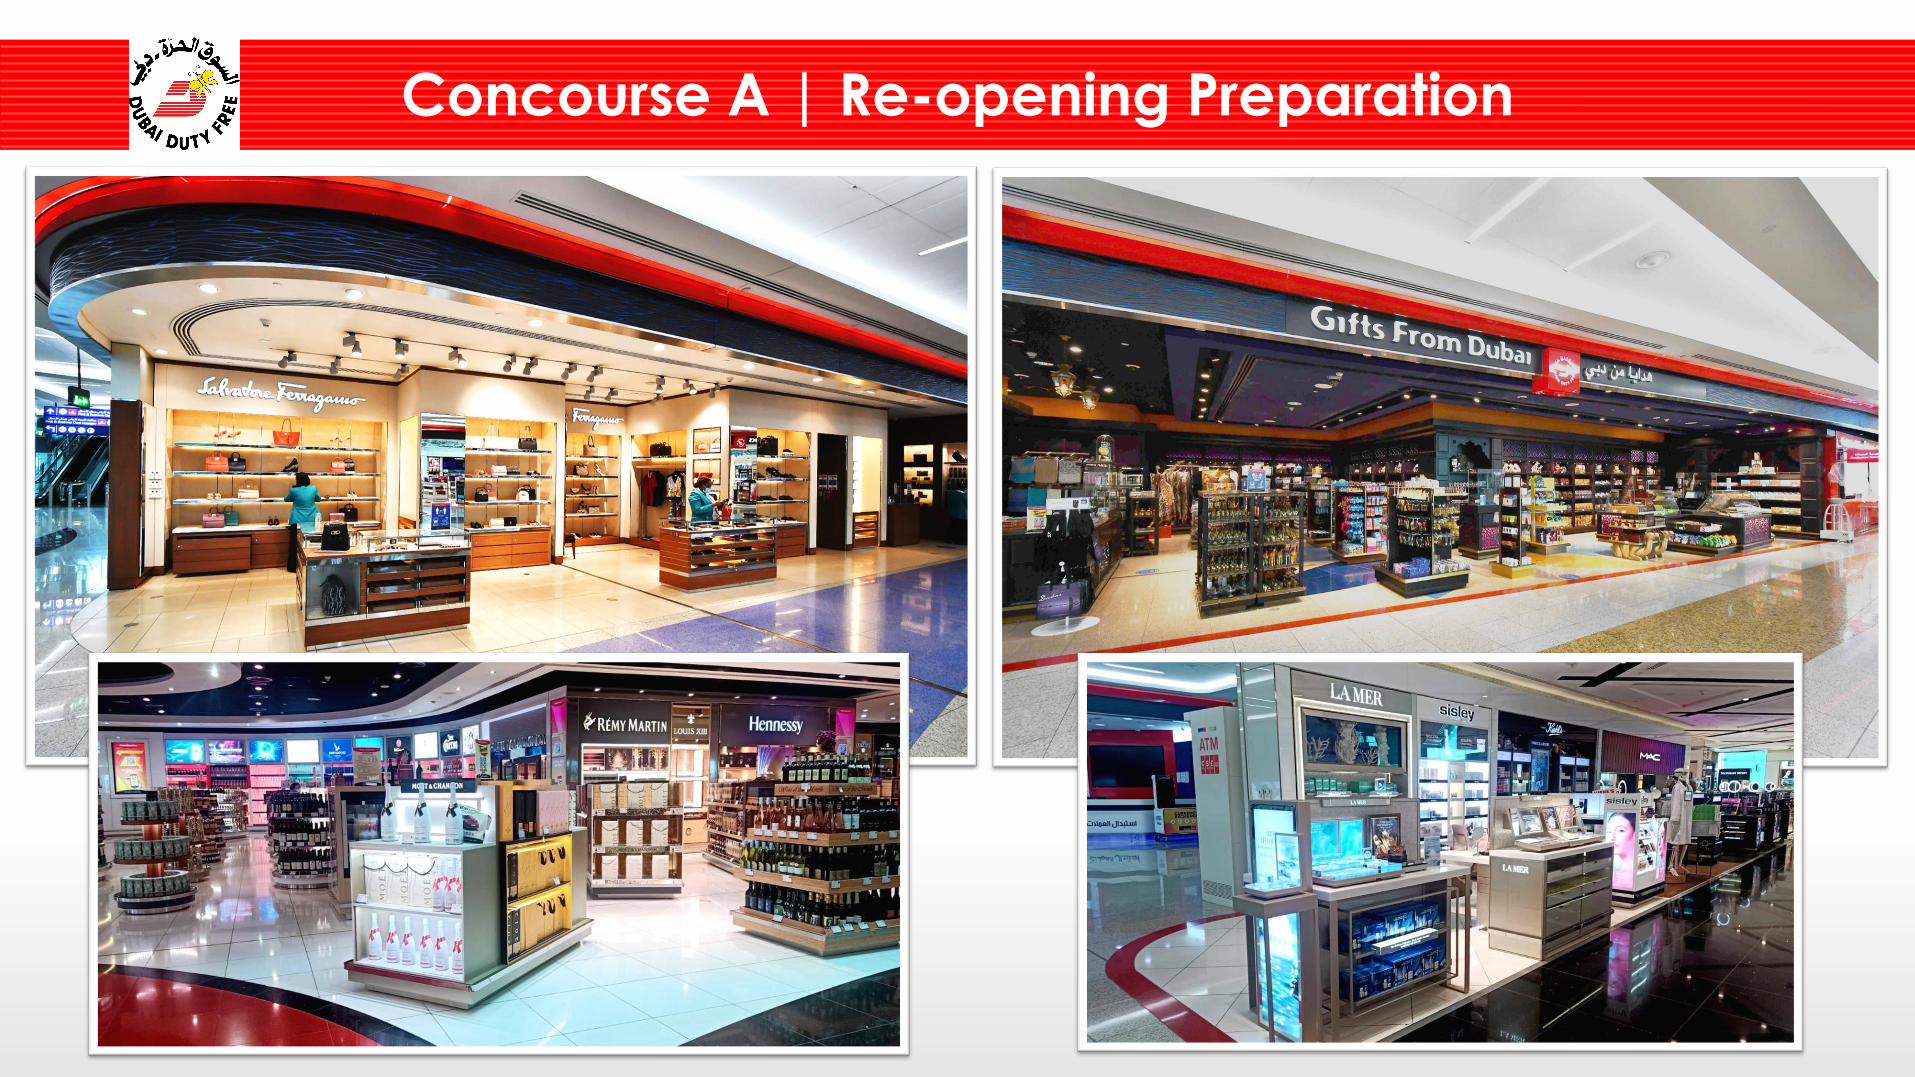
Concourse A | Re-opening Preparation
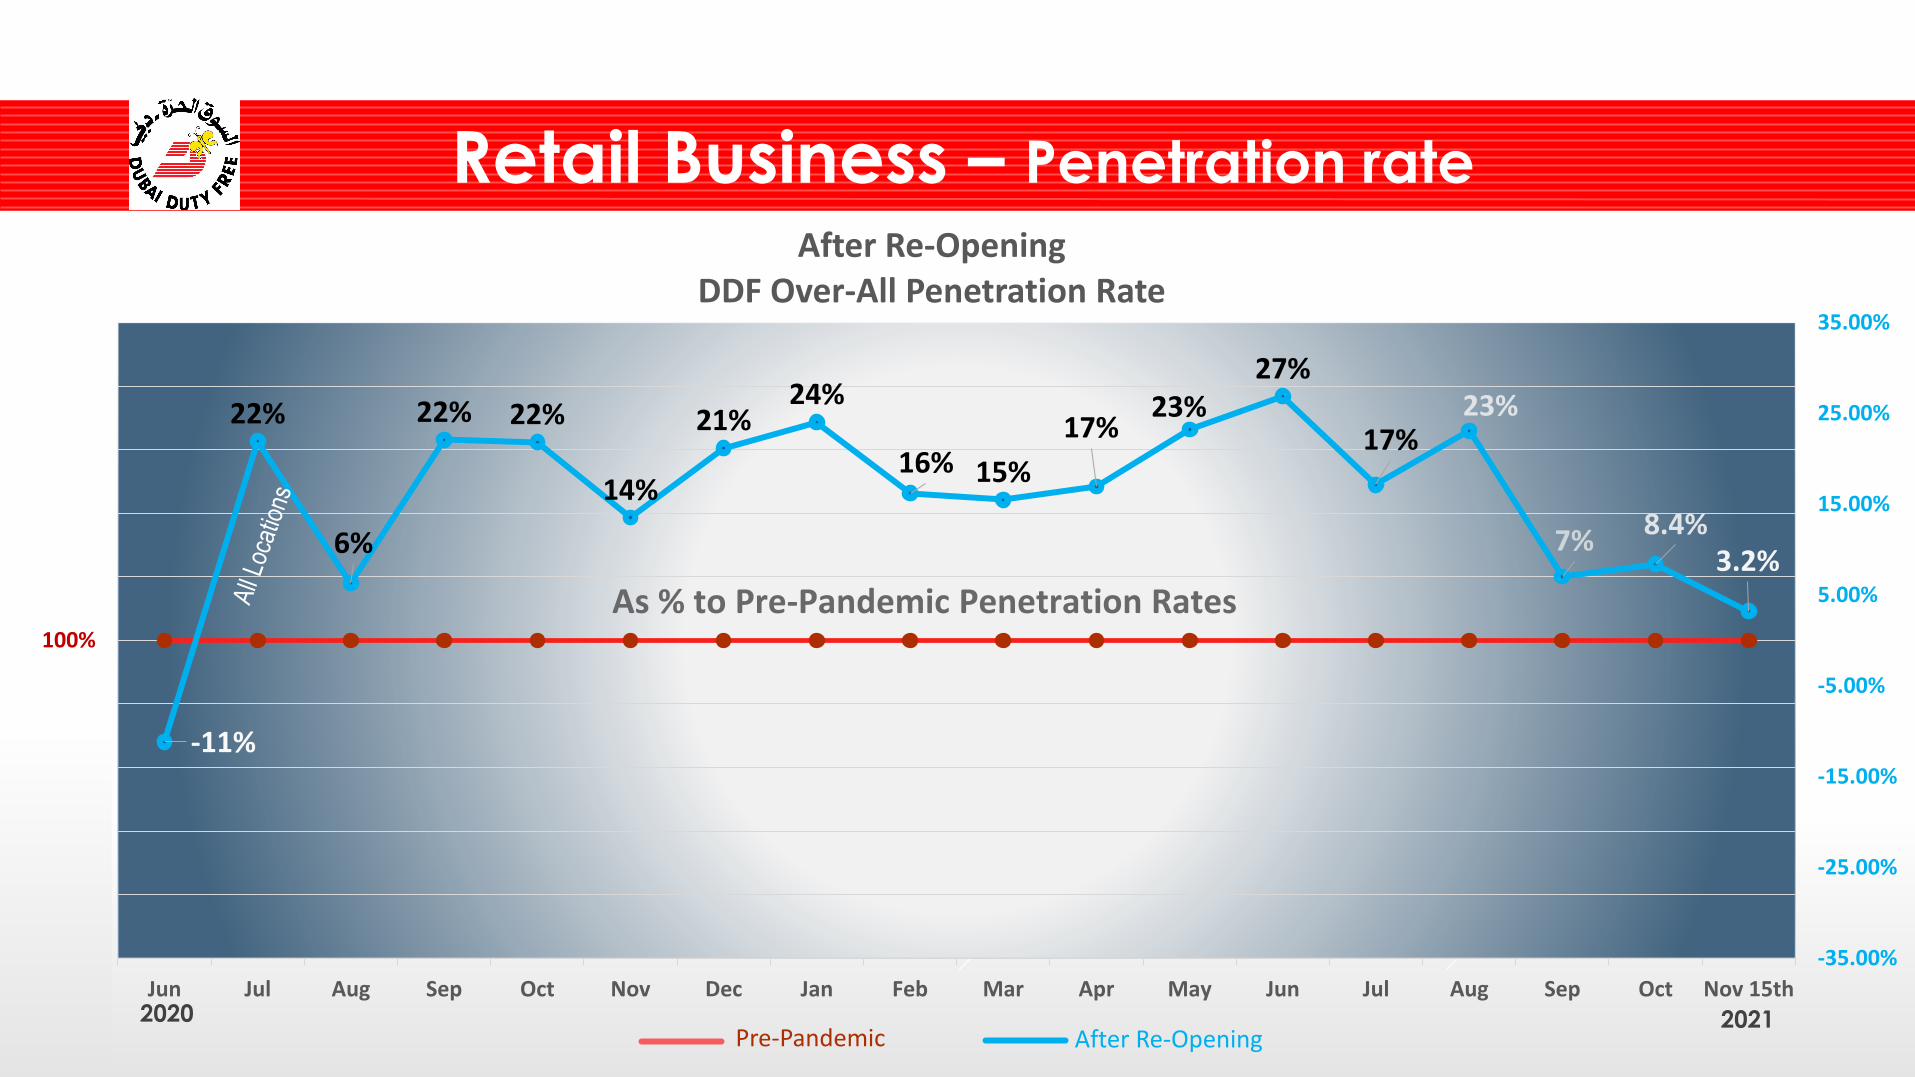
Retail Business – Penetration rate
-11%
22%
6%
22% 22%
14%
21%24%
16% 15%
17%23%
27%
17%23%
7%8.4%
3.2%
-35.00%
-25.00%
-15.00%
-5.00%
5.00%
15.00%
25.00%
35.00%
0%
20%
40%
60%
80%
100%
120%
140%
160%
180%
200%
Jun Jul Aug Sep Oct Nov Dec Jan Feb Mar Apr May Jun Jul Aug Sep Oct Nov 15th
After Re-Opening DDF Over-All Penetration Rate
As % to Pre-Pandemic Penetration Rates
Pre-Pandemic After Re-Opening2020 2021
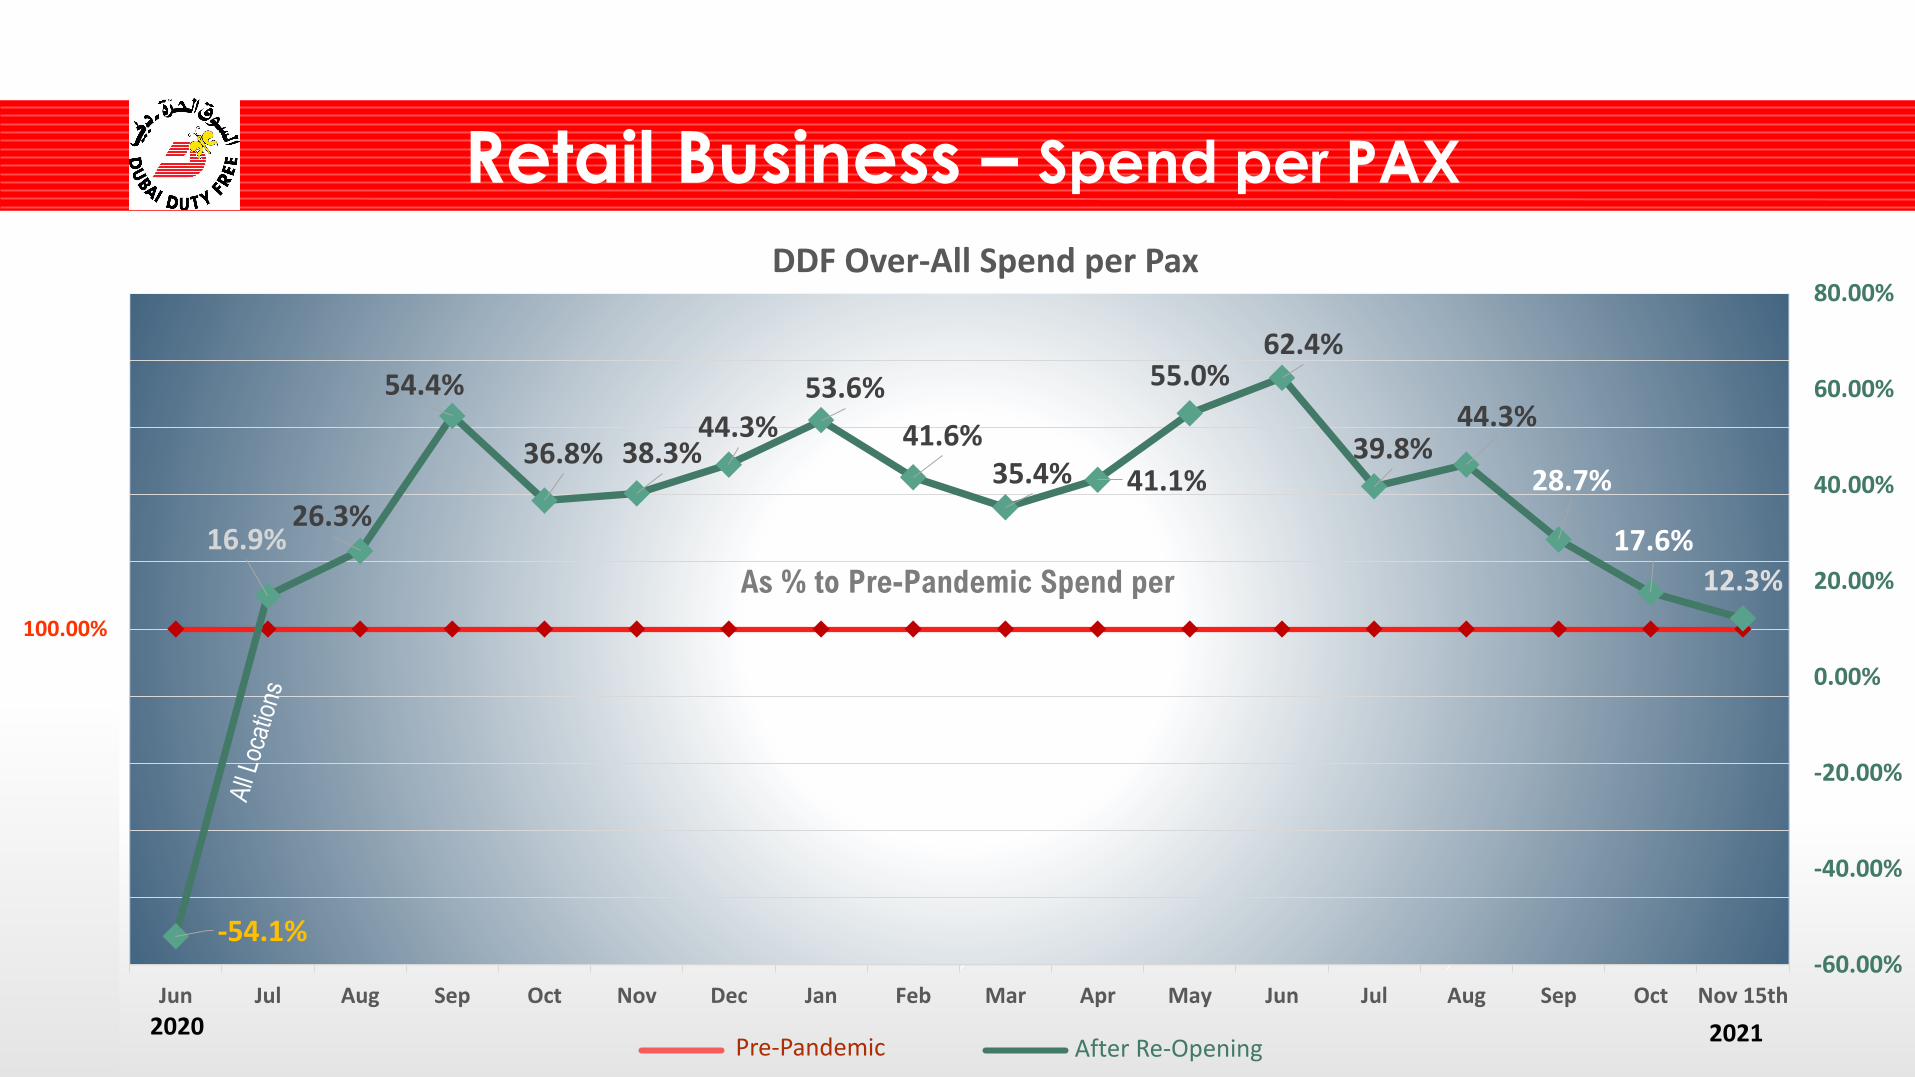
-54.1%
16.9%26.3%
54.4%
36.8% 38.3%44.3%
53.6%
41.6%35.4% 41.1%
55.0%62.4%
39.8%44.3%
28.7%
17.6%
12.3%
-60.00%
-40.00%
-20.00%
0.00%
20.00%
40.00%
60.00%
80.00%
0.00%
20.00%
40.00%
60.00%
80.00%
100.00%
120.00%
140.00%
160.00%
180.00%
200.00%
Jun Jul Aug Sep Oct Nov Dec Jan Feb Mar Apr May Jun Jul Aug Sep Oct Nov 15th
DDF Over-All Spend per Pax
As % to Pre-Pandemic Spend per
2020 2021
Retail Business – Spend per PAX
Pre-Pandemic After Re-Opening
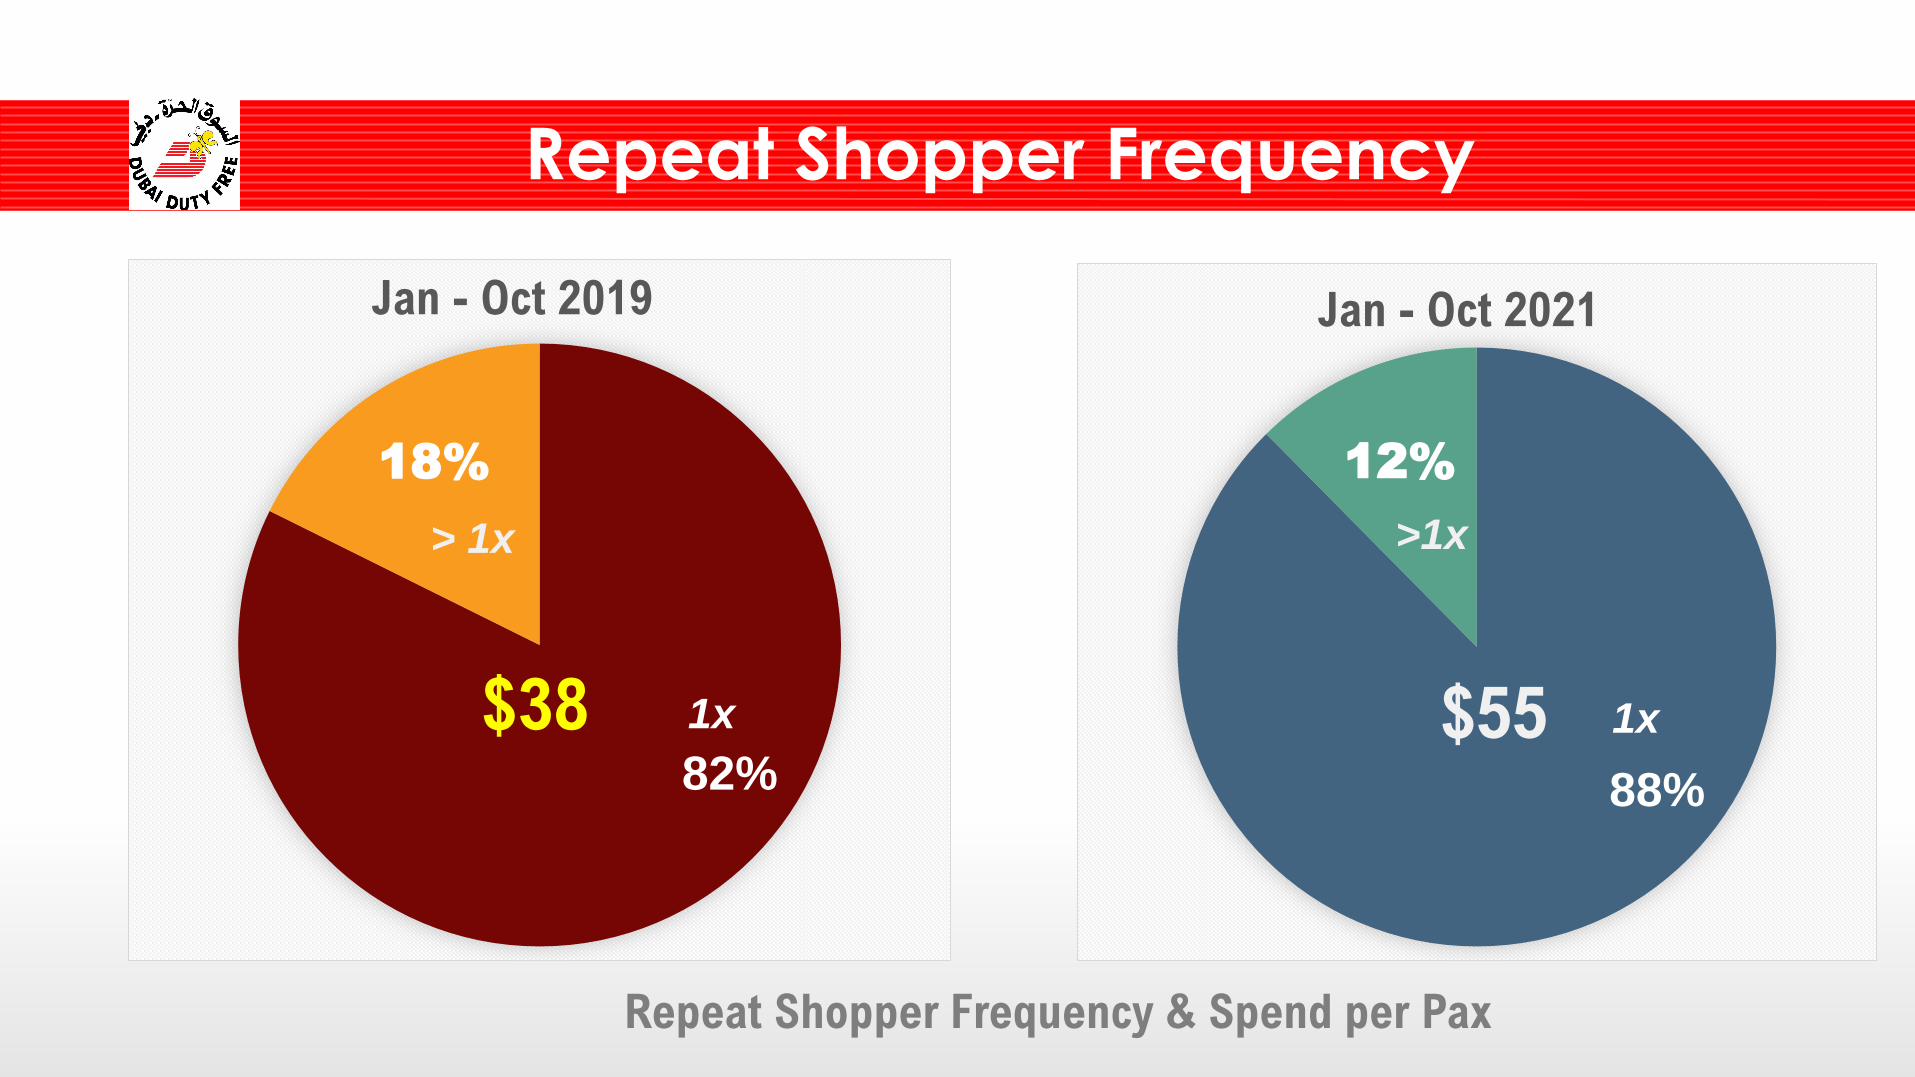
Repeat Shopper Frequency
88%
12%
Jan - Oct 2021
$55 1x
>1x
82%
18%
Jan - Oct 2019
$38
> 1x
1x
Repeat Shopper Frequency & Spend per Pax
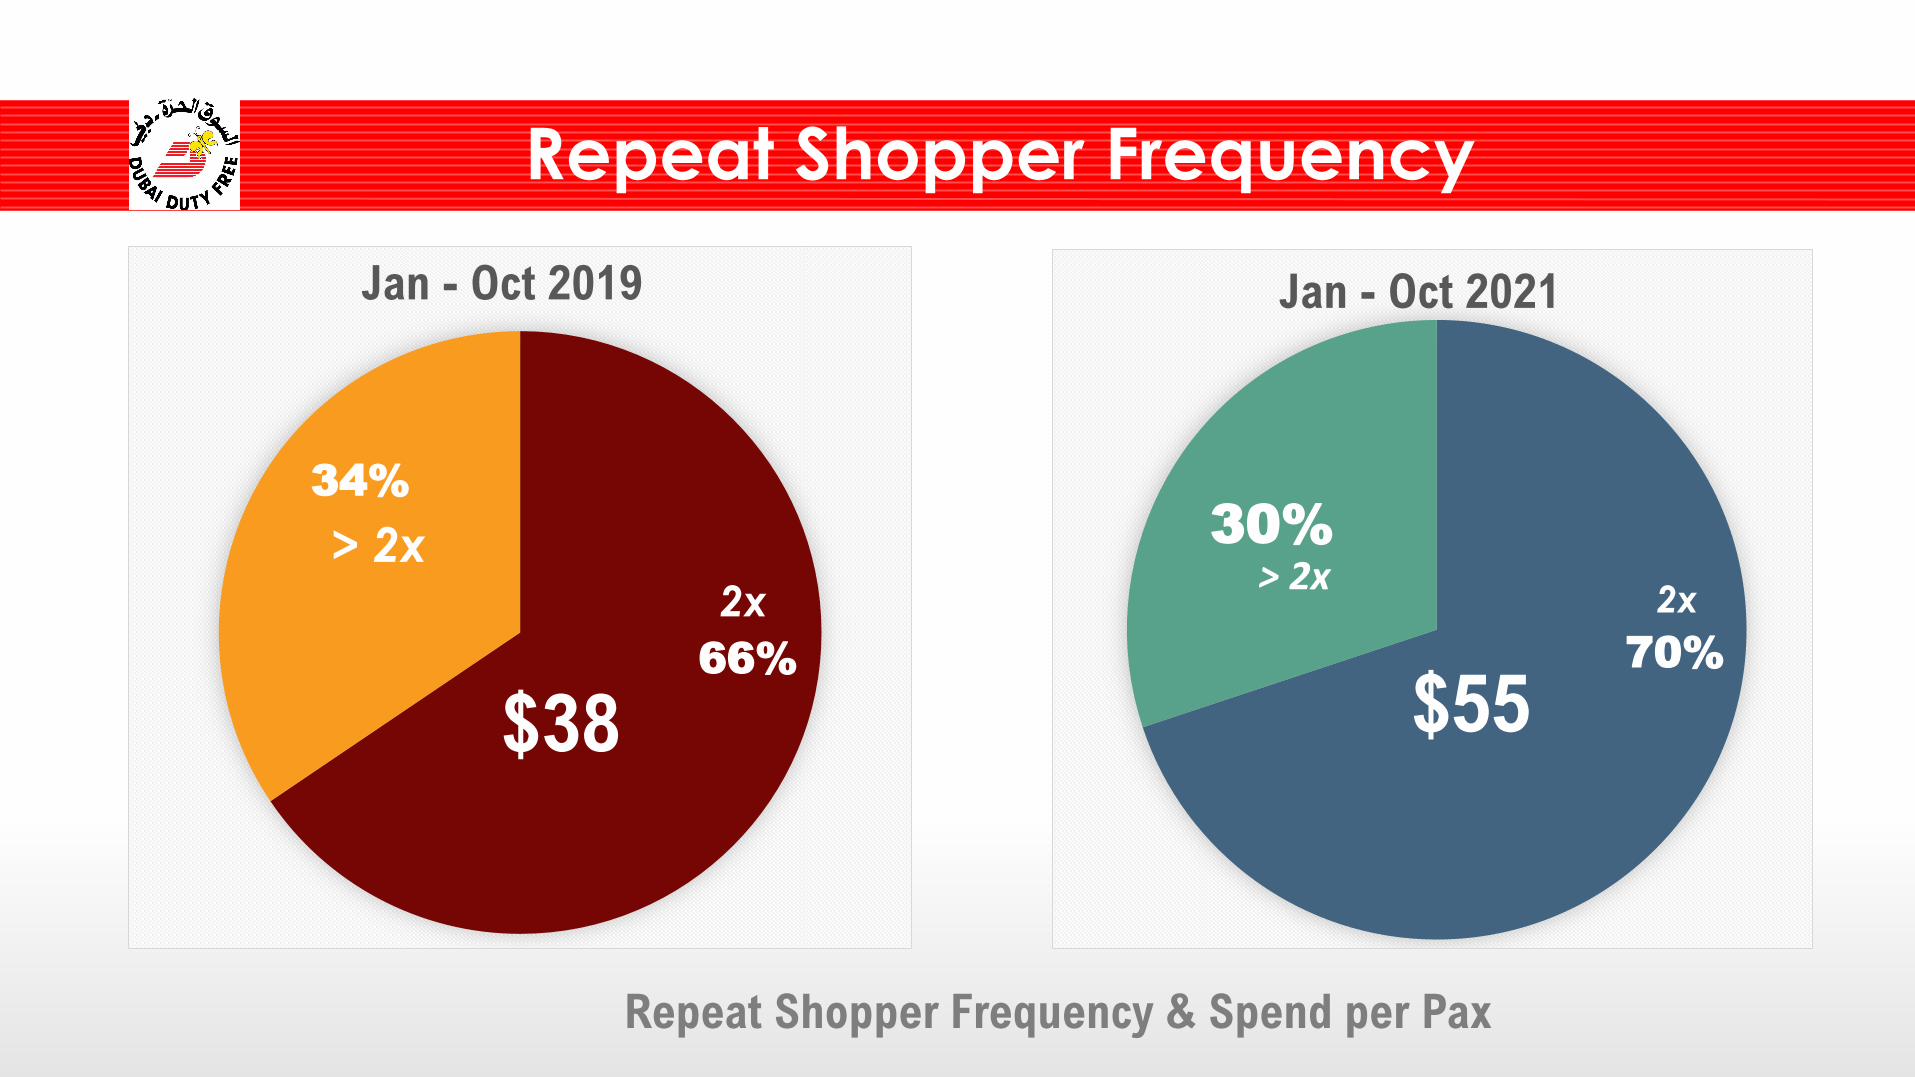
Repeat Shopper Frequency
Repeat Shopper Frequency & Spend per Pax
70%
30%
Jan - Oct 2021
> 2x2x
$5566%
34%
Jan - Oct 2019
> 2x2x
$38
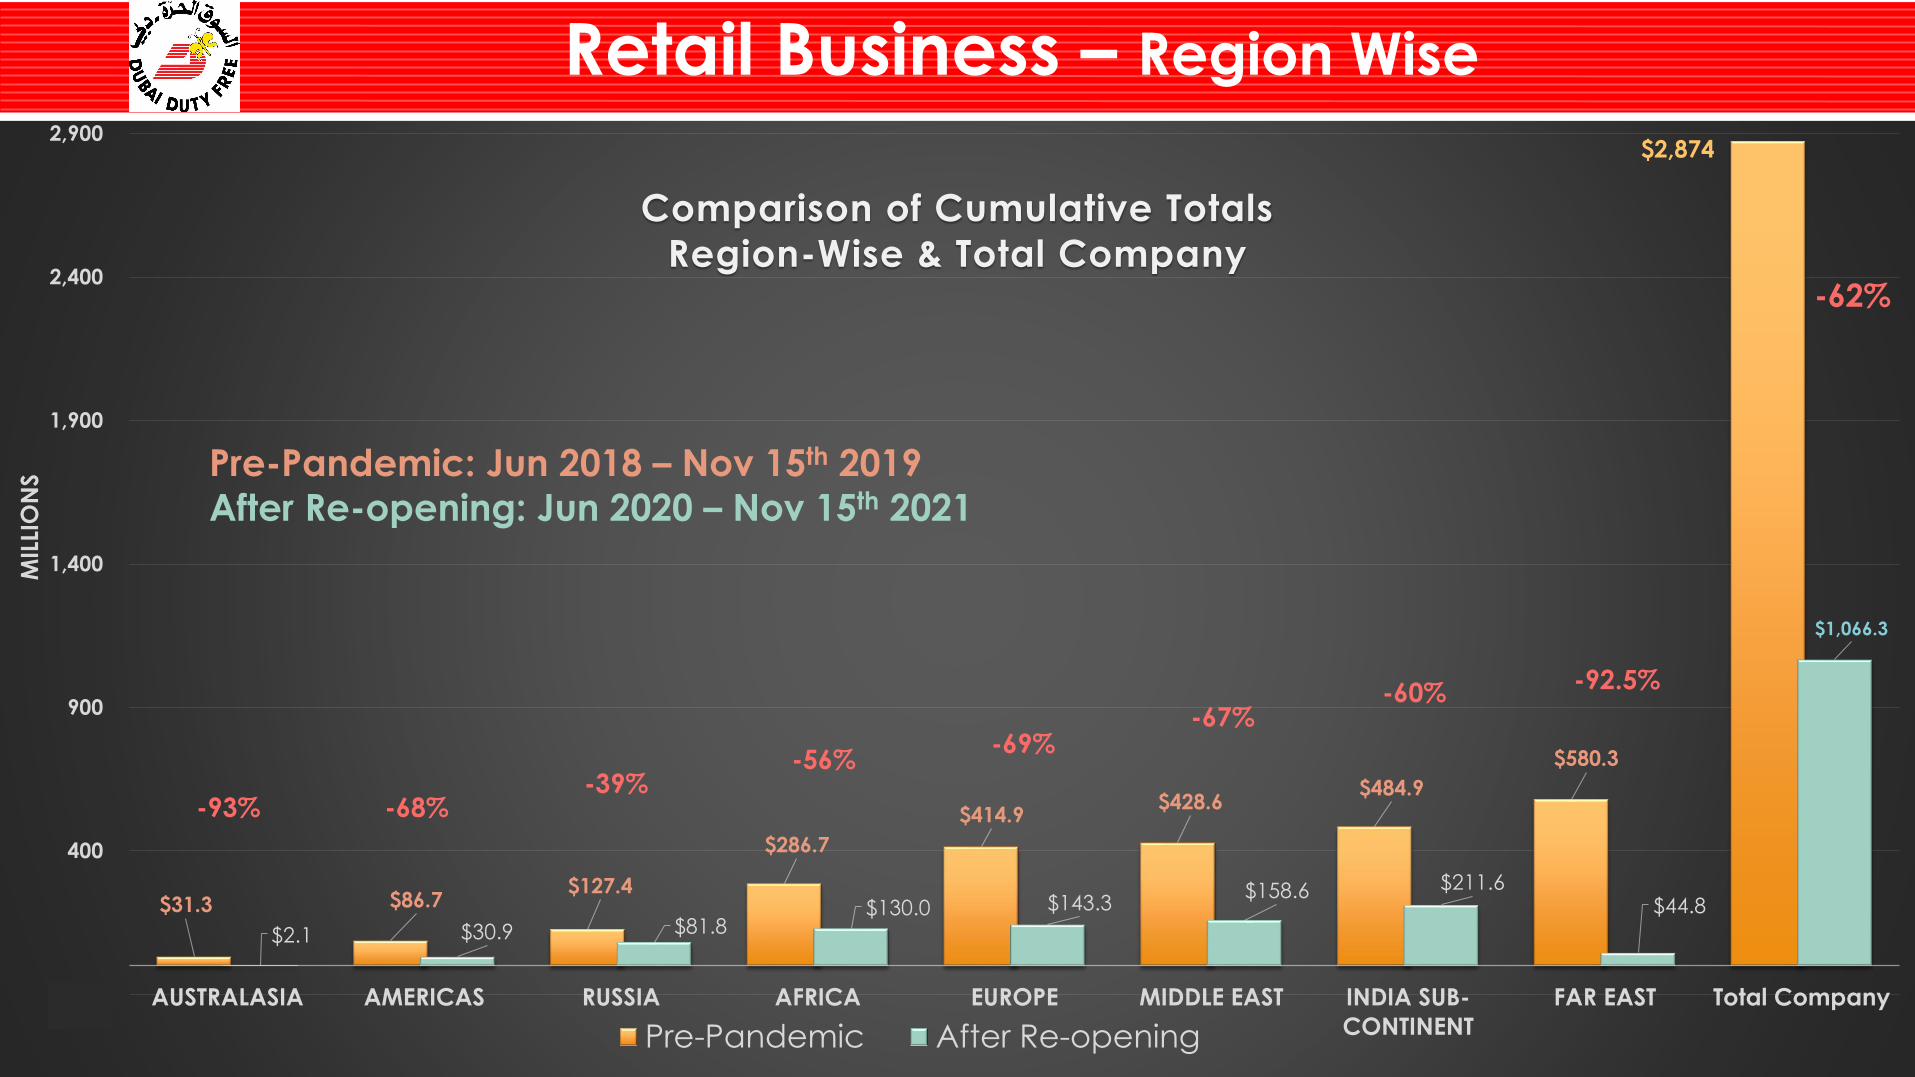
Travel Retailing by RegioRetail Business – Region Wise
$31.3 $86.7$127.4
$286.7
$414.9$428.6
$484.9
$580.3
$2.1 $30.9 $81.8$130.0 $143.3
$158.6 $211.6$44.8
$1,066.3
(100)
400
900
1,400
1,900
2,400
2,900
AUSTRALASIA AMERICAS RUSSIA AFRICA EUROPE MIDDLE EAST INDIA SUB-
CONTINENT
FAR EAST Total Company
MIL
LIO
NS
Comparison of Cumulative Totals
Region-Wise & Total Company
Pre-Pandemic After Re-opening
-93% -68%-39%
-56%-69%
-67%-60%
-92.5%
-62%
Pre-Pandemic: Jun 2018 – Nov 15th 2019
After Re-opening: Jun 2020 – Nov 15th 2021
$2,874
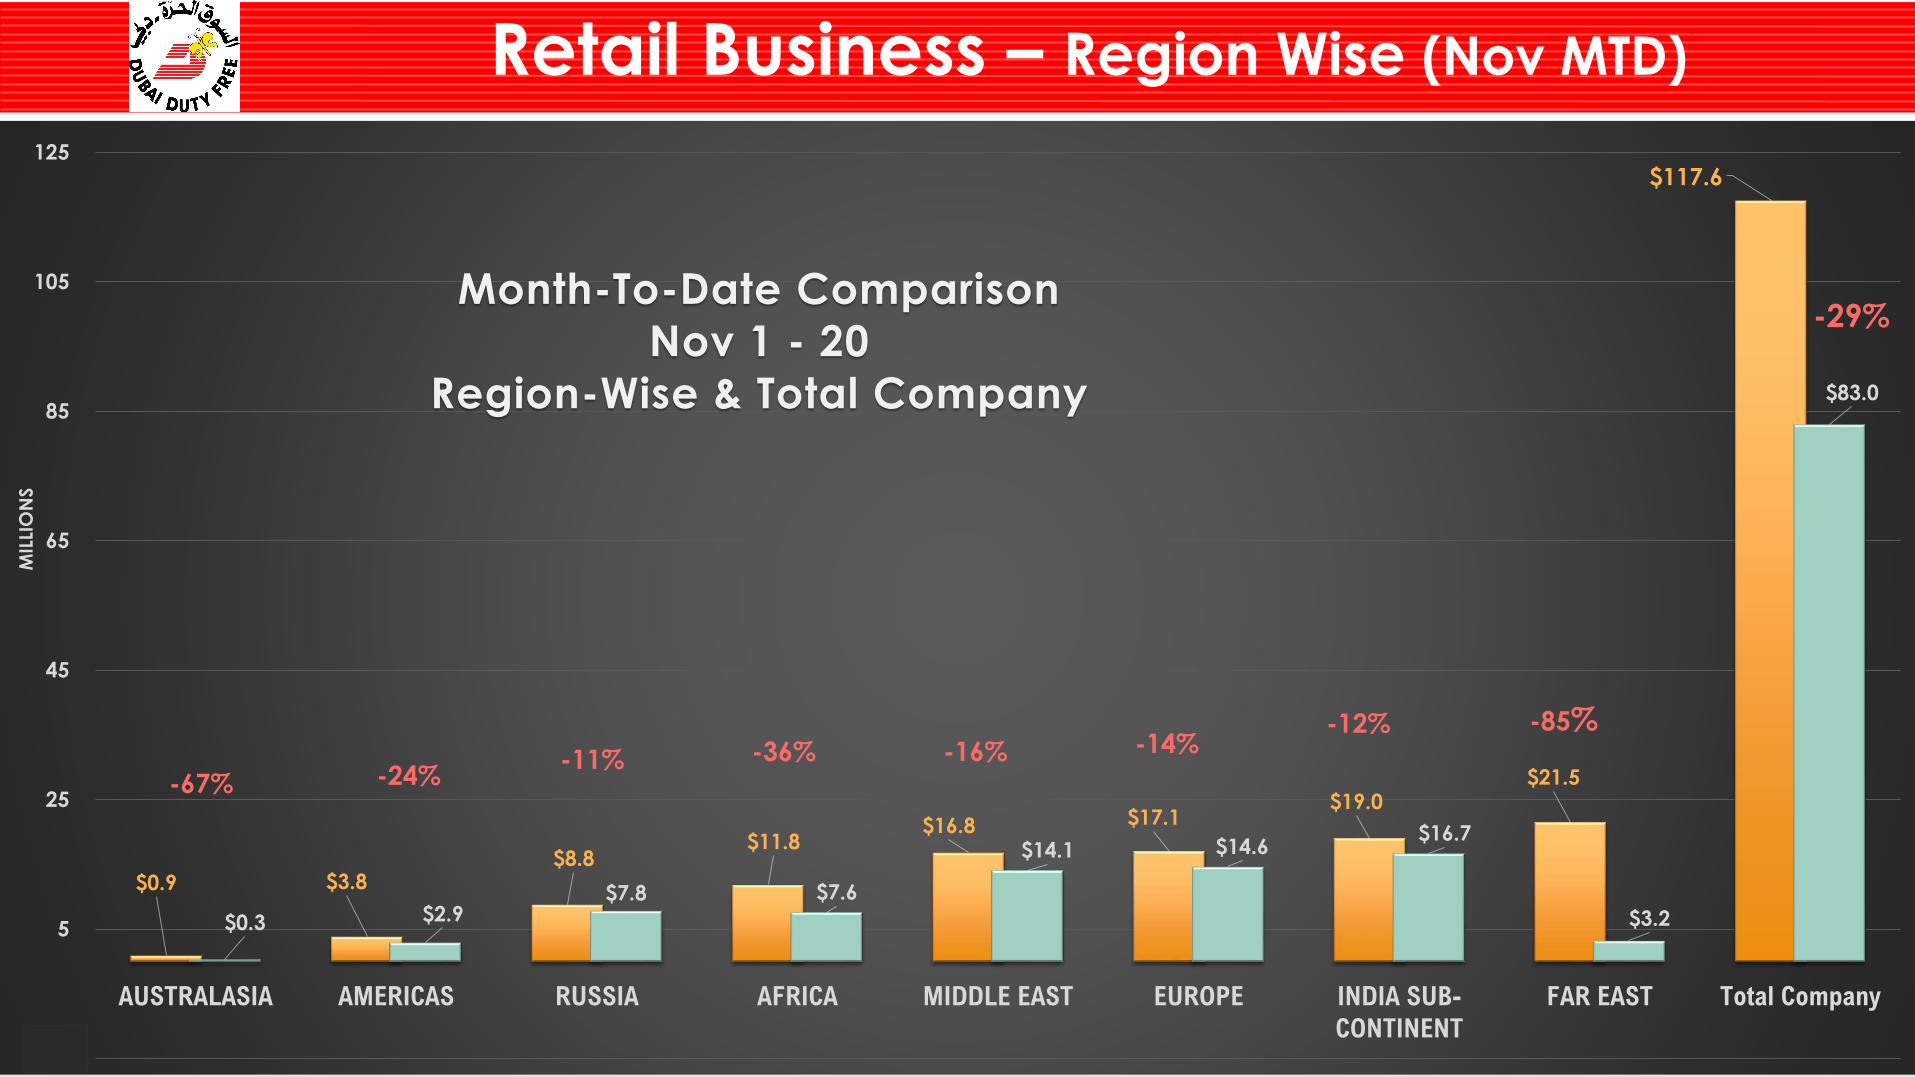
Travel Retailing by RegioRetail Business – Region Wise (Nov MTD)
$0.9 $3.8$8.8
$11.8$16.8 $17.1
$19.0$21.5
$117.6
$0.3 $2.9$7.8 $7.6
$14.1 $14.6$16.7
$3.2
$83.0
(15)
5
25
45
65
85
105
125
AUSTRALASIA AMERICAS RUSSIA AFRICA MIDDLE EAST EUROPE INDIA SUB-
CONTINENT
FAR EAST Total Company
MIL
LIO
NS
Month-To-Date Comparison
Nov 1 - 20
Region-Wise & Total Company
-24%-11% -36% -16% -14%
-12% -85%
-67%
-29%
Concourse B | DIOR
Concourse B | DIOR
Concourse B - Dior |Cartier
Concourse B |LOUIS VUITTON
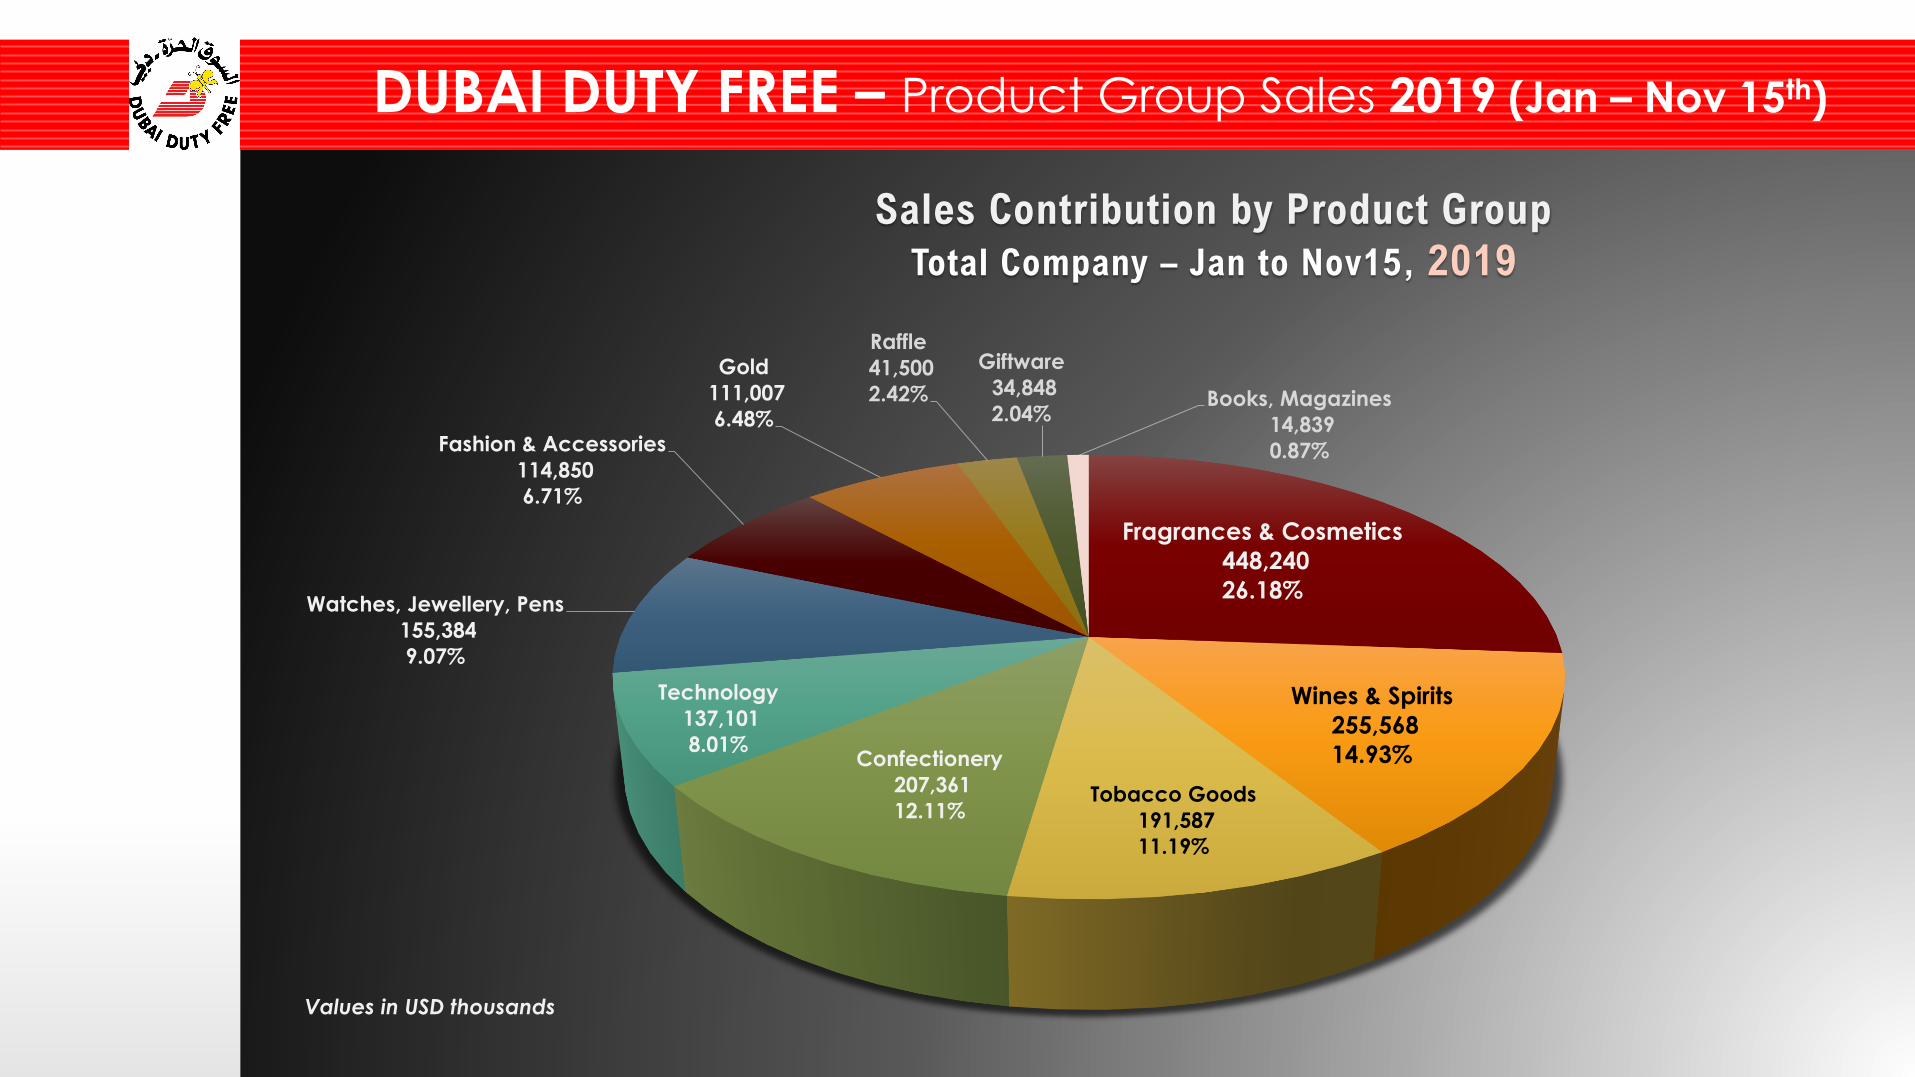
DUBAI DUTY FREE – Product Group Sales 2019 (Jan – Nov 15th)
Fragrances & Cosmetics
448,240
26.18%
Wines & Spirits
255,568
14.93%
Tobacco Goods
191,587
11.19%
Confectionery
207,361
12.11%
Technology
137,101
8.01%
Watches, Jewellery, Pens
155,384
9.07%
Fashion & Accessories
114,850
6.71%
Gold
111,007
6.48%
Raffle
41,500
2.42%
Giftware
34,848
2.04%Books, Magazines
14,839
0.87%
Sales Contribution by Product Group
Total Company – Jan to Nov15, 2019
Values in USD thousands
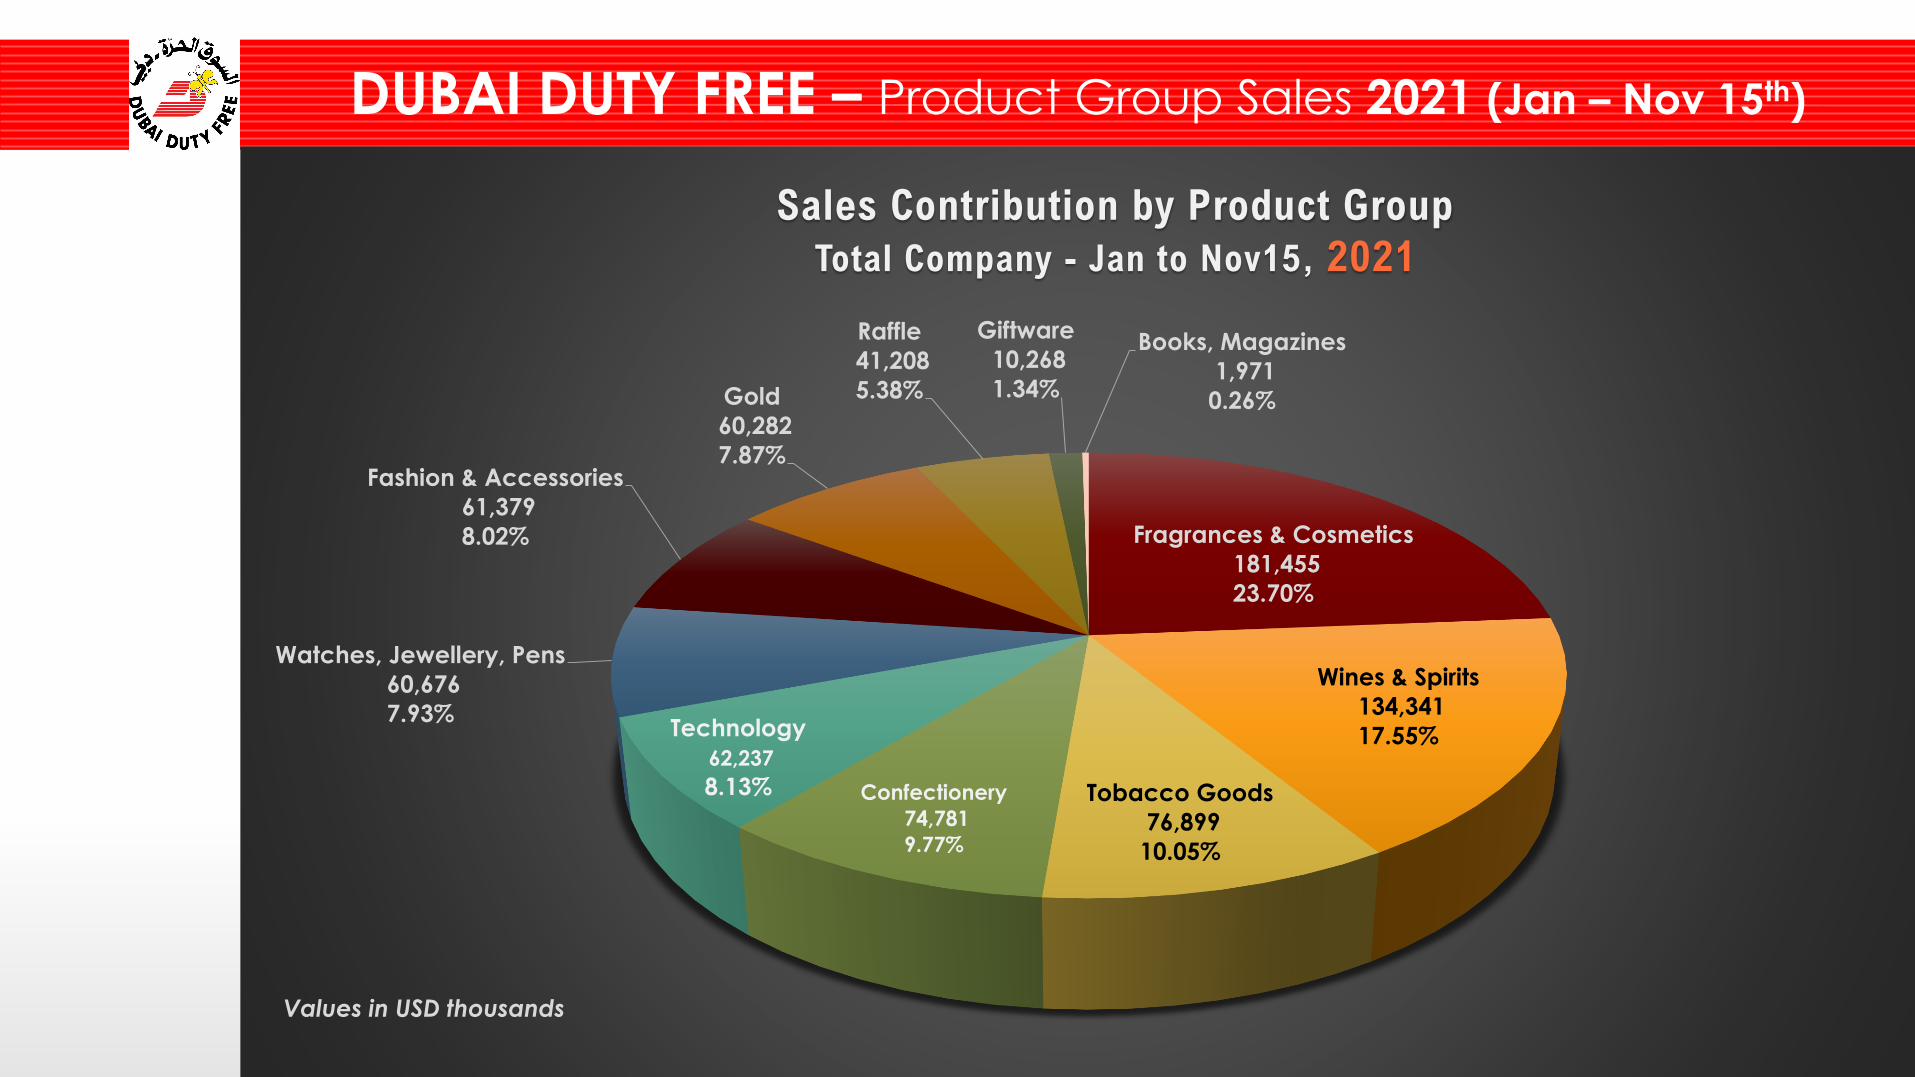
DUBAI DUTY FREE – Product Group Sales 2021 (Jan – Nov 15th)
Fragrances & Cosmetics
181,455
23.70%
Wines & Spirits
134,341
17.55%
Tobacco Goods
76,899
10.05%
Confectionery
74,781
9.77%
Technology
62,237
8.13%
Watches, Jewellery, Pens
60,676
7.93%
Fashion & Accessories
61,379
8.02%
Gold
60,282
7.87%
Raffle
41,208
5.38%
Giftware
10,268
1.34%
Books, Magazines
1,971
0.26%
Sales Contribution by Product Group
Total Company - Jan to Nov15, 2021
Values in USD thousands
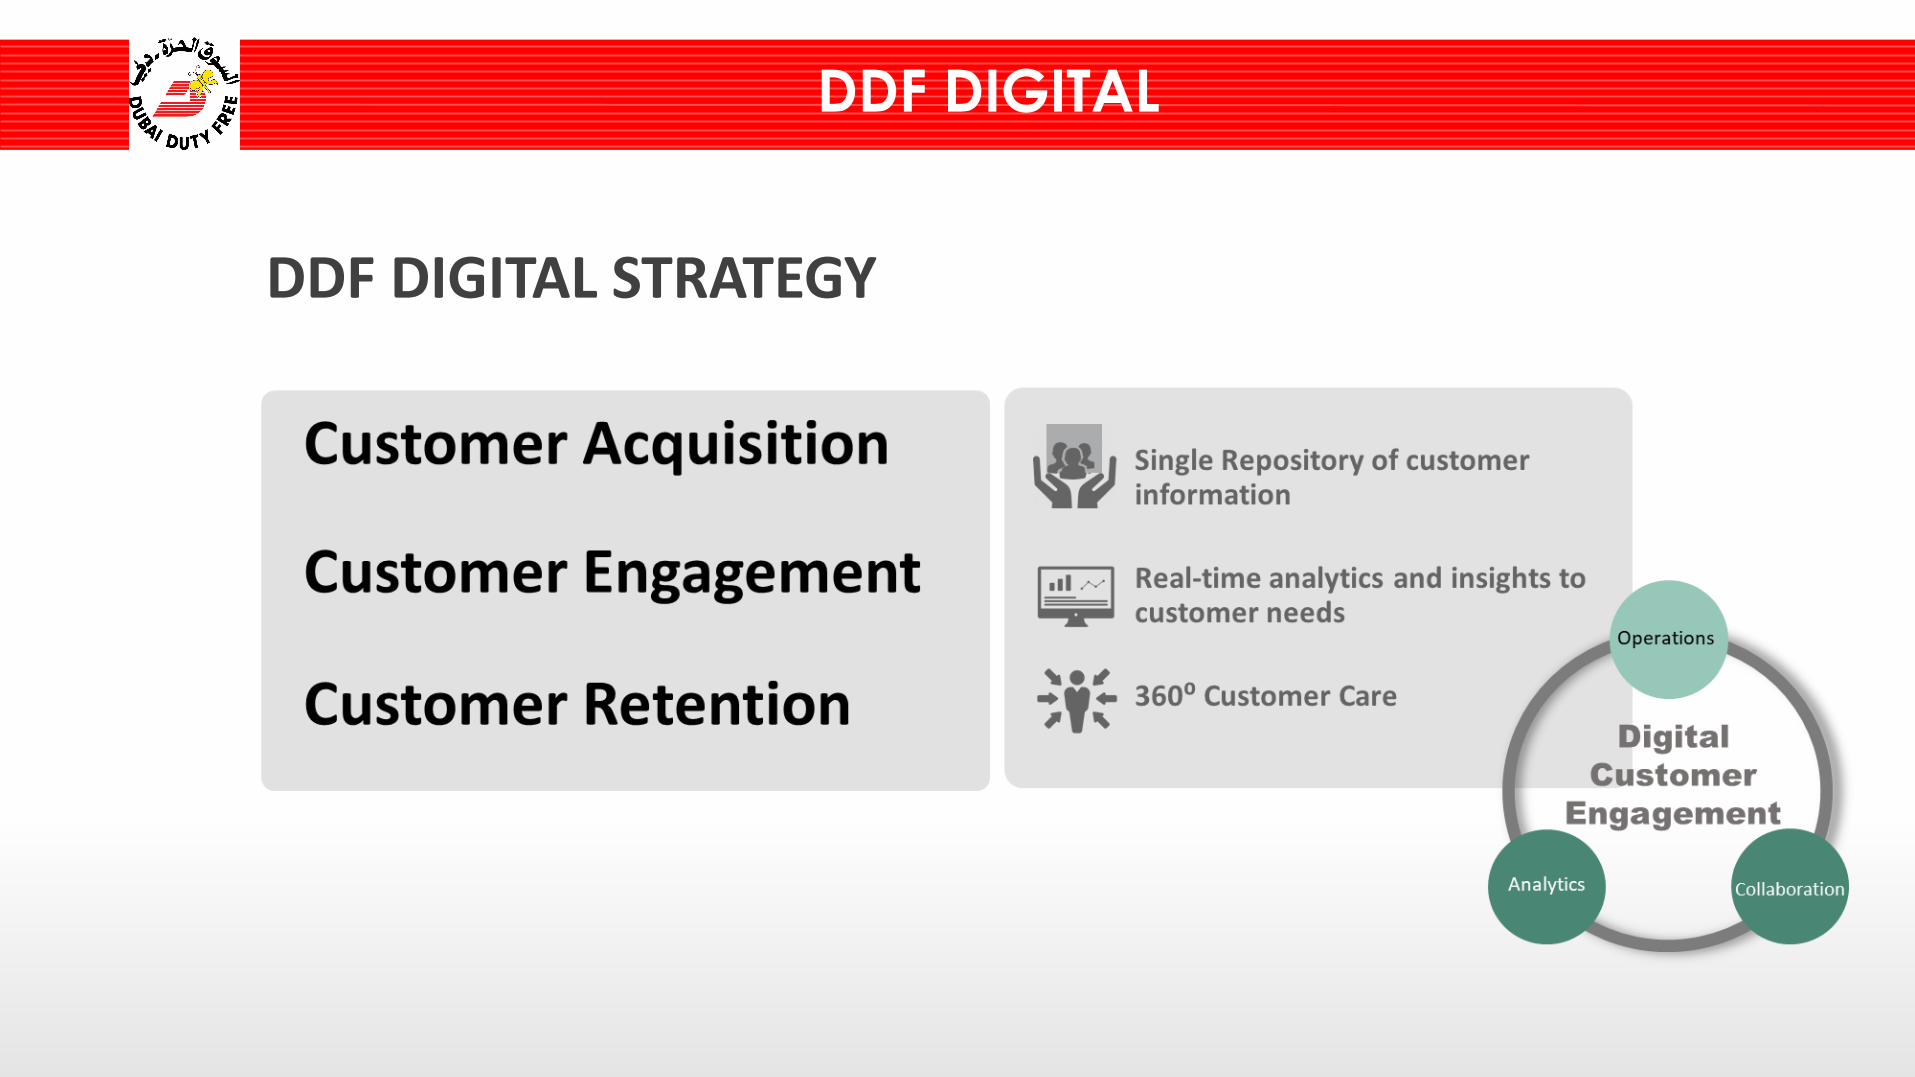
DDF DIGITAL
DDF DIGITAL STRATEGY
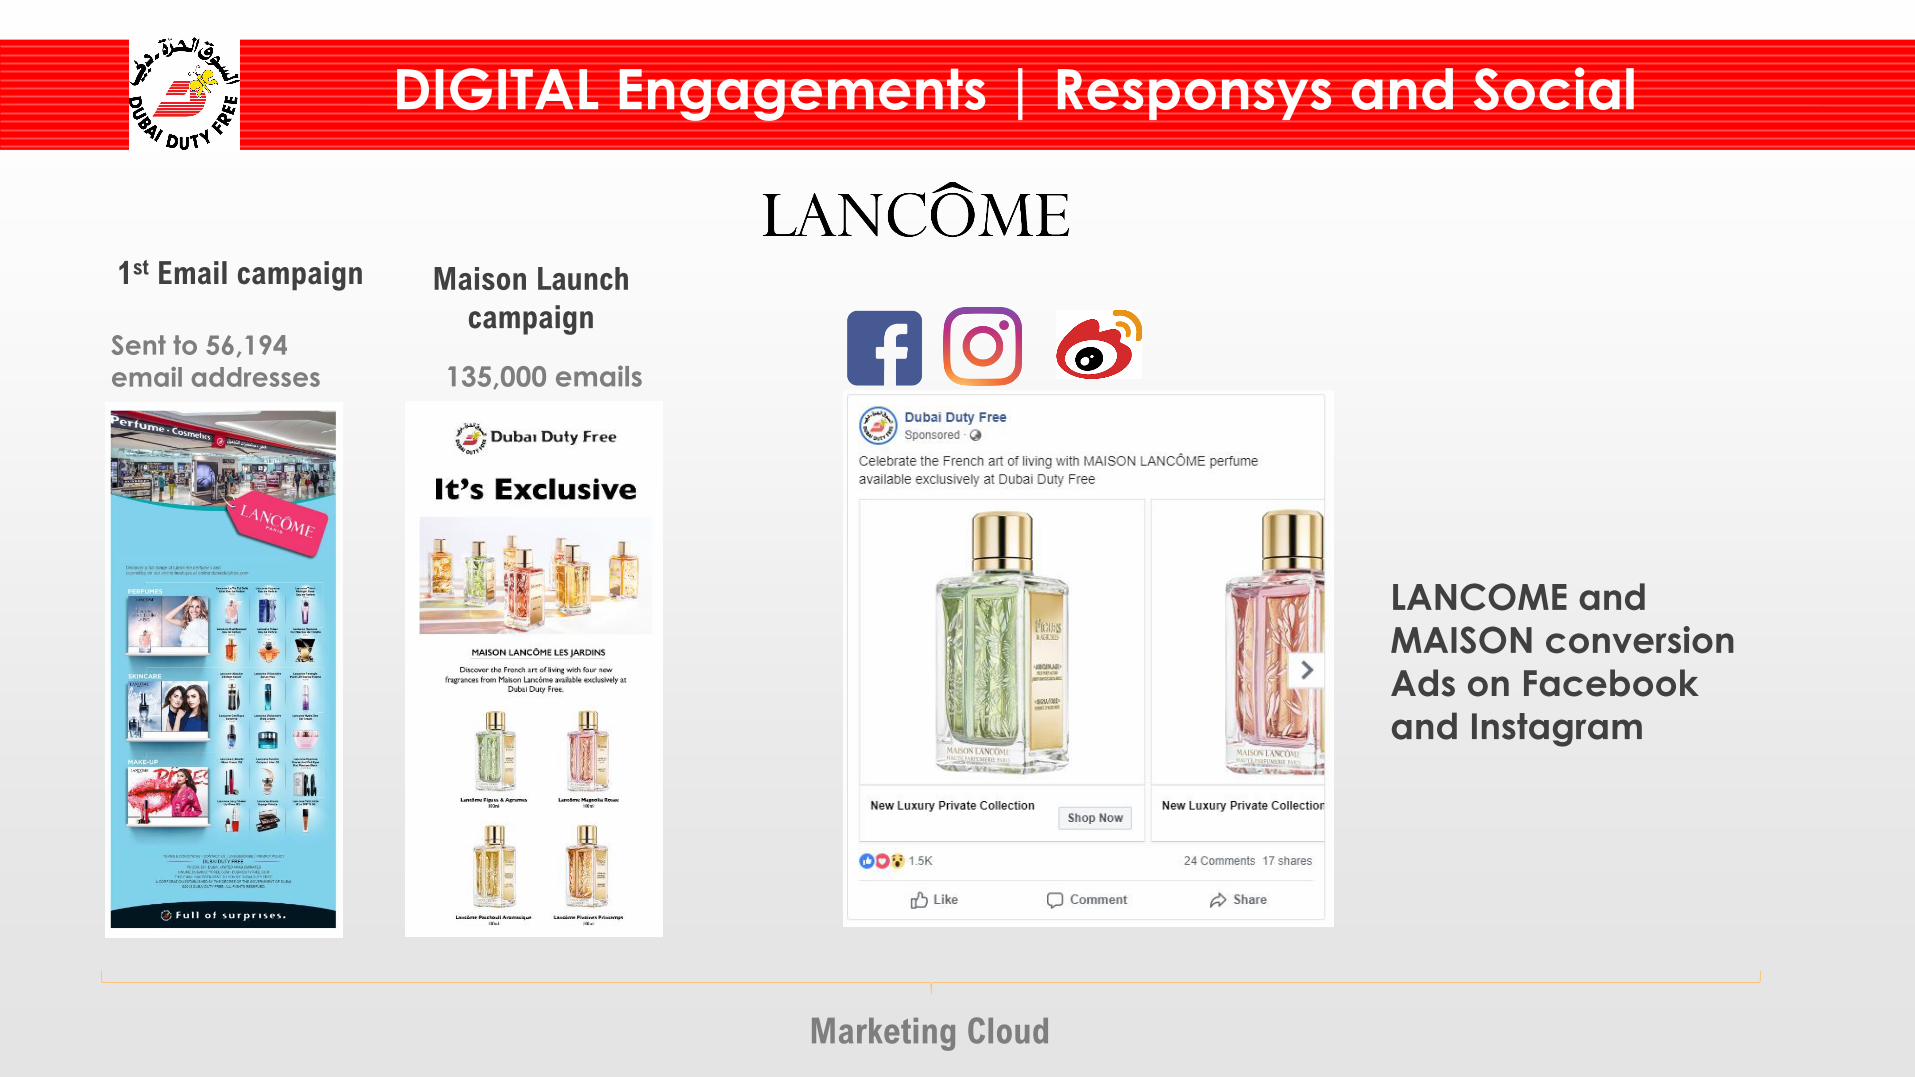
DIGITAL Engagements | Responsys and Social
1st Email campaign
Marketing Cloud
Sent to 56,194 email addresses
Maison Launch
campaign
135,000 emails
LANCOME and
MAISON conversion
Ads on Facebook
and Instagram
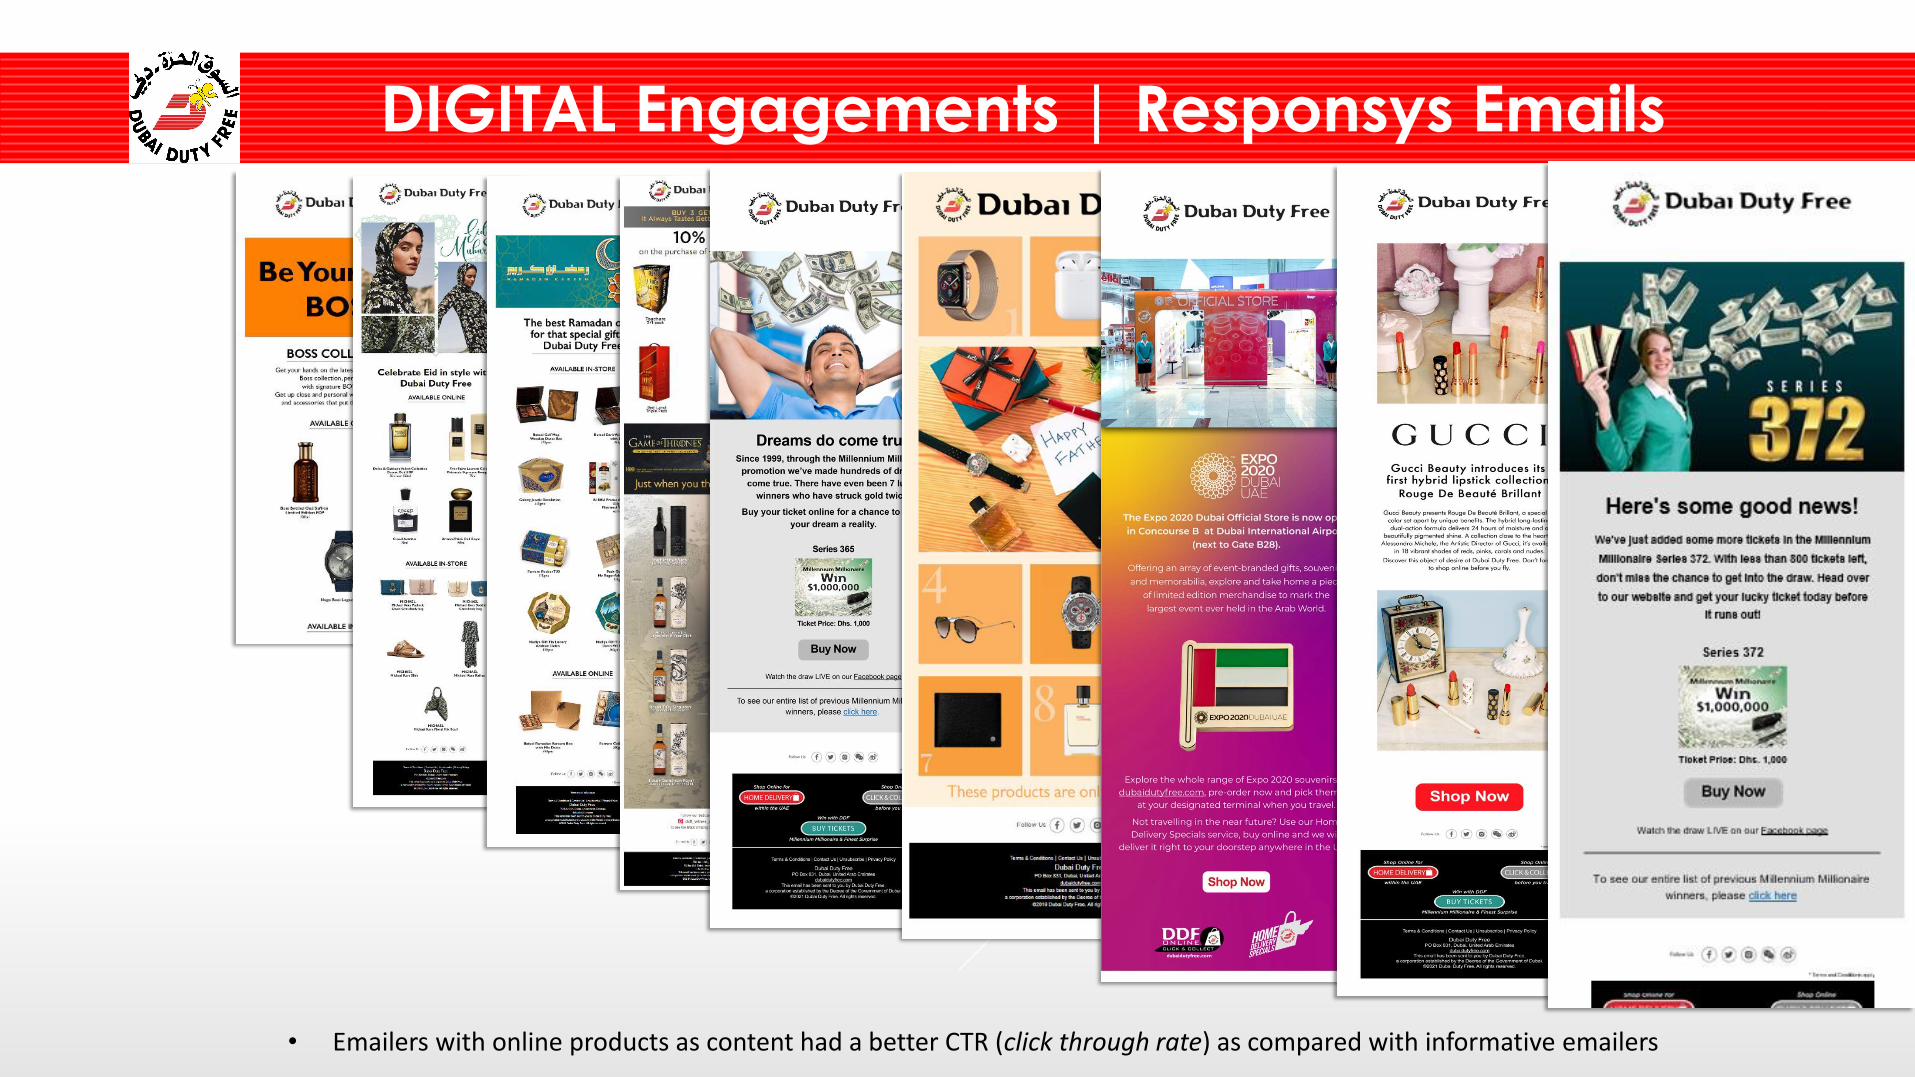
• Emailers with online products as content had a better CTR (click through rate) as compared with informative emailers
20
DIGITAL Engagements | Responsys Emails
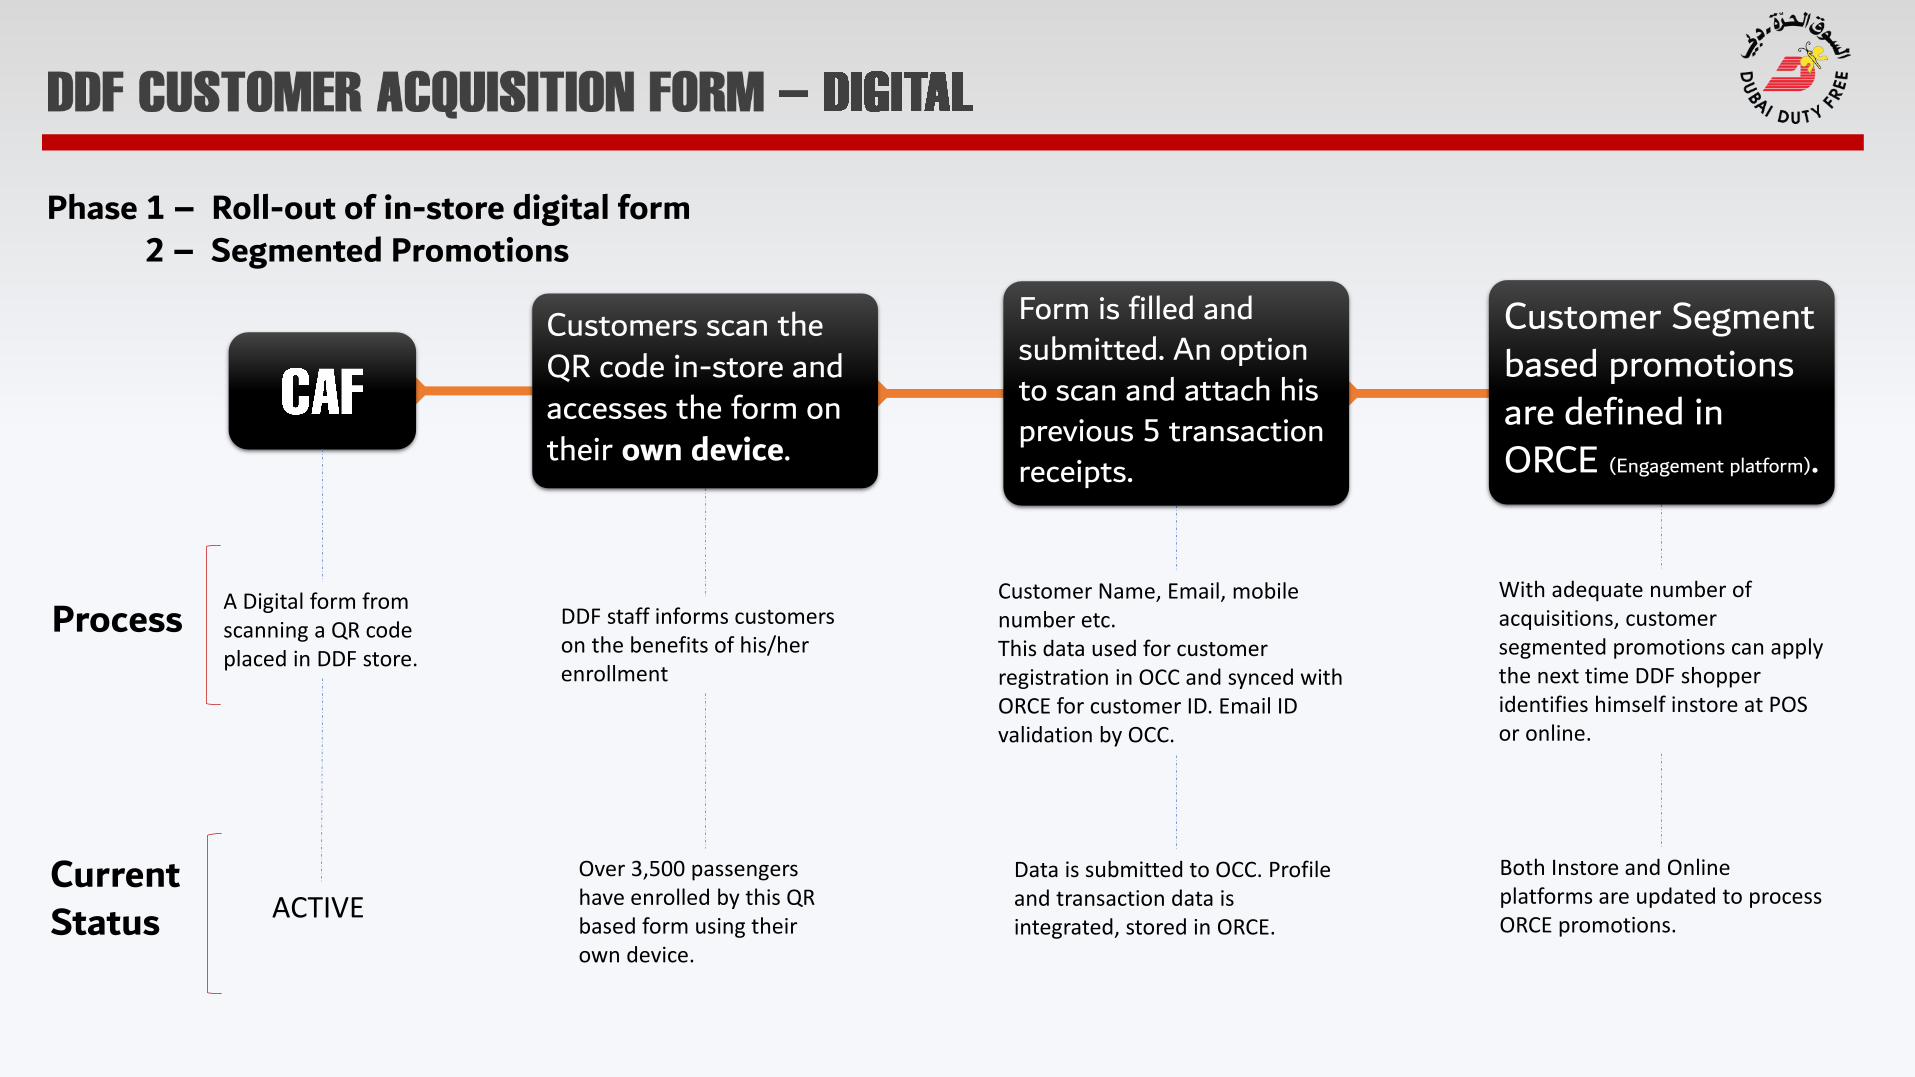
Customers scan the QR code in-store and accesses the form on their own device.
Form is filled and submitted. An option to scan and attach his previous 5 transaction receipts.
Current Status
A Digital form from scanning a QR code placed in DDF store.
DDF staff informs customers on the benefits of his/her enrollment
Customer Name, Email, mobile number etc. This data used for customer registration in OCC and synced with ORCE for customer ID. Email ID validation by OCC.
With adequate number of acquisitions, customer segmented promotions can apply the next time DDF shopper identifies himself instore at POS or online.
ACTIVE
Over 3,500 passengers have enrolled by this QR based form using their own device.
Data is submitted to OCC. Profile and transaction data is integrated, stored in ORCE.
Both Instore and Online platforms are updated to process ORCE promotions.
Process
Phase 1 – Roll-out of in-store digital form
Customer Segment based promotions are defined in ORCE (Engagement platform).
2 – Segmented Promotions
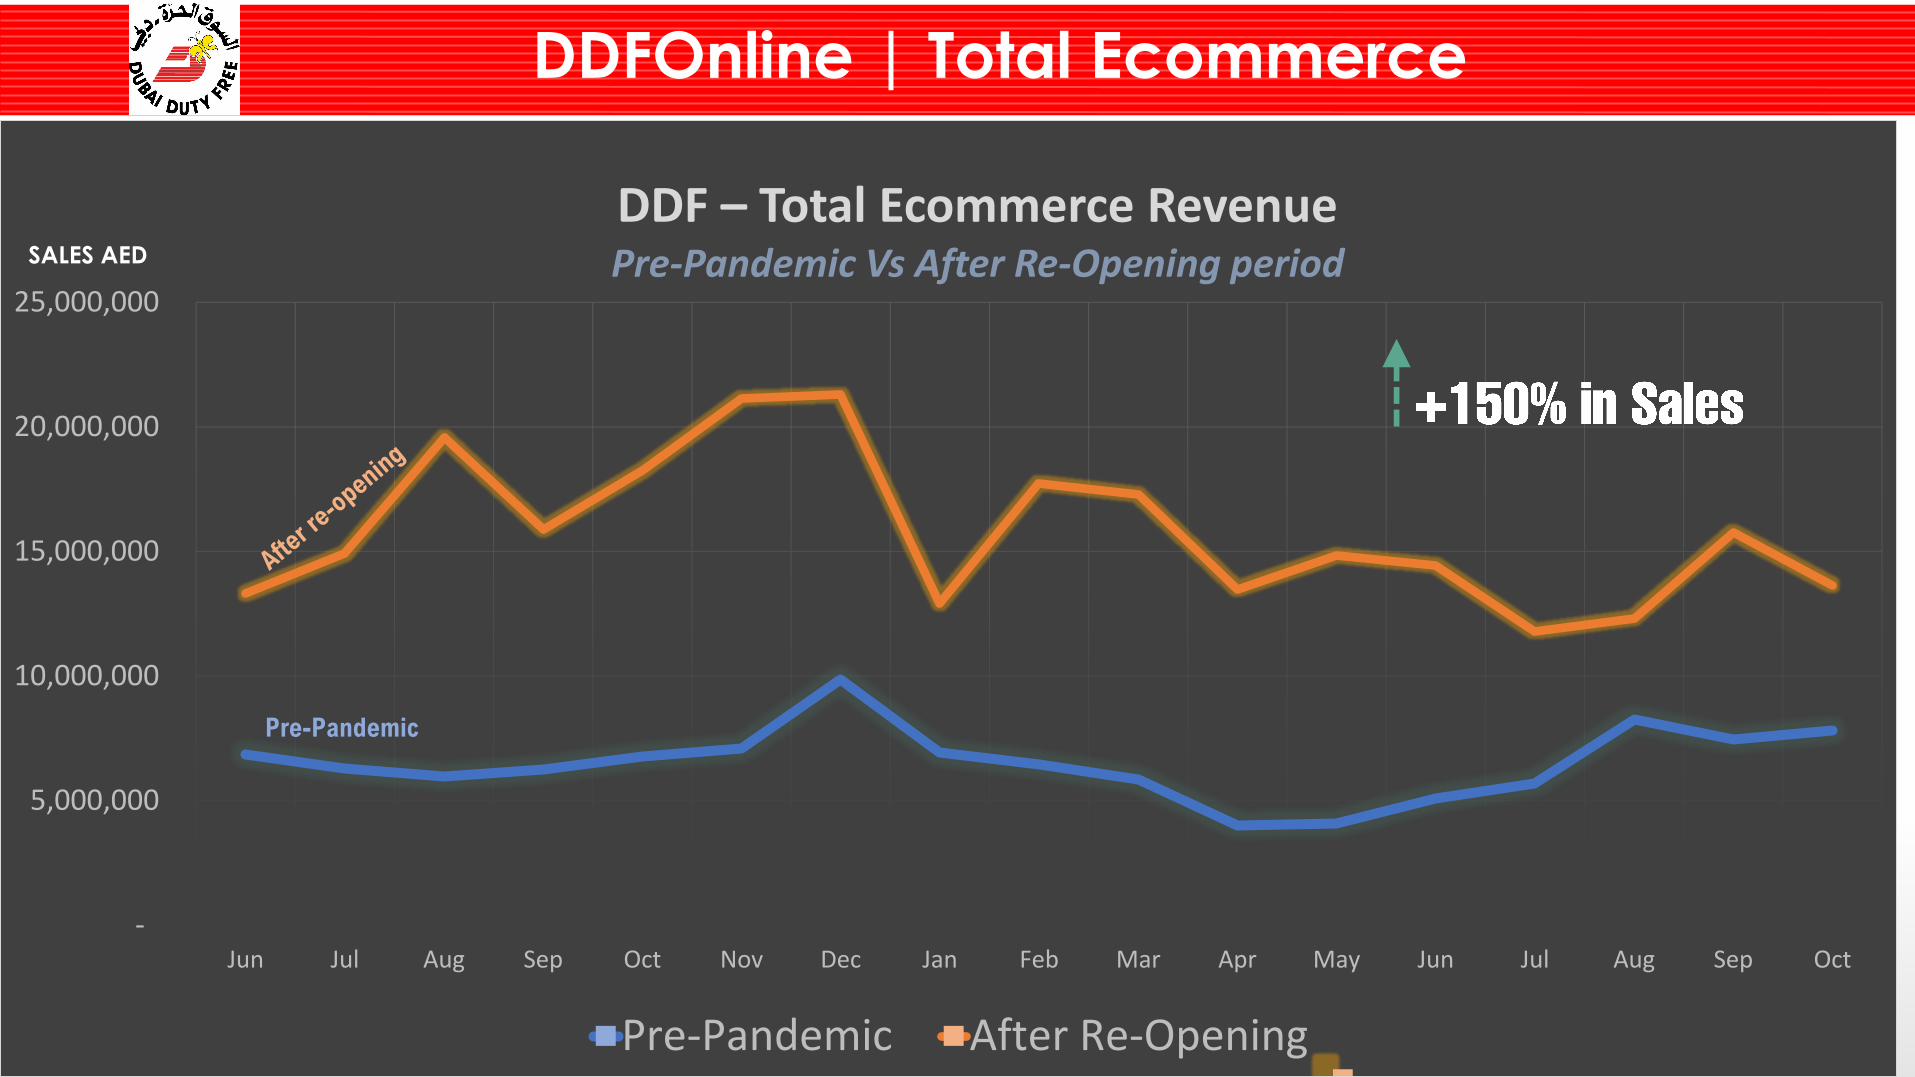
DDFOnline | Total Ecommerce
-
5,000,000
10,000,000
15,000,000
20,000,000
25,000,000
Jun Jul Aug Sep Oct Nov Dec Jan Feb Mar Apr May Jun Jul Aug Sep Oct
DDF – Total Ecommerce Revenue Pre-Pandemic Vs After Re-Opening period
Pre-Pandemic After Re-Opening
Pre-Pandemic
SALES AED
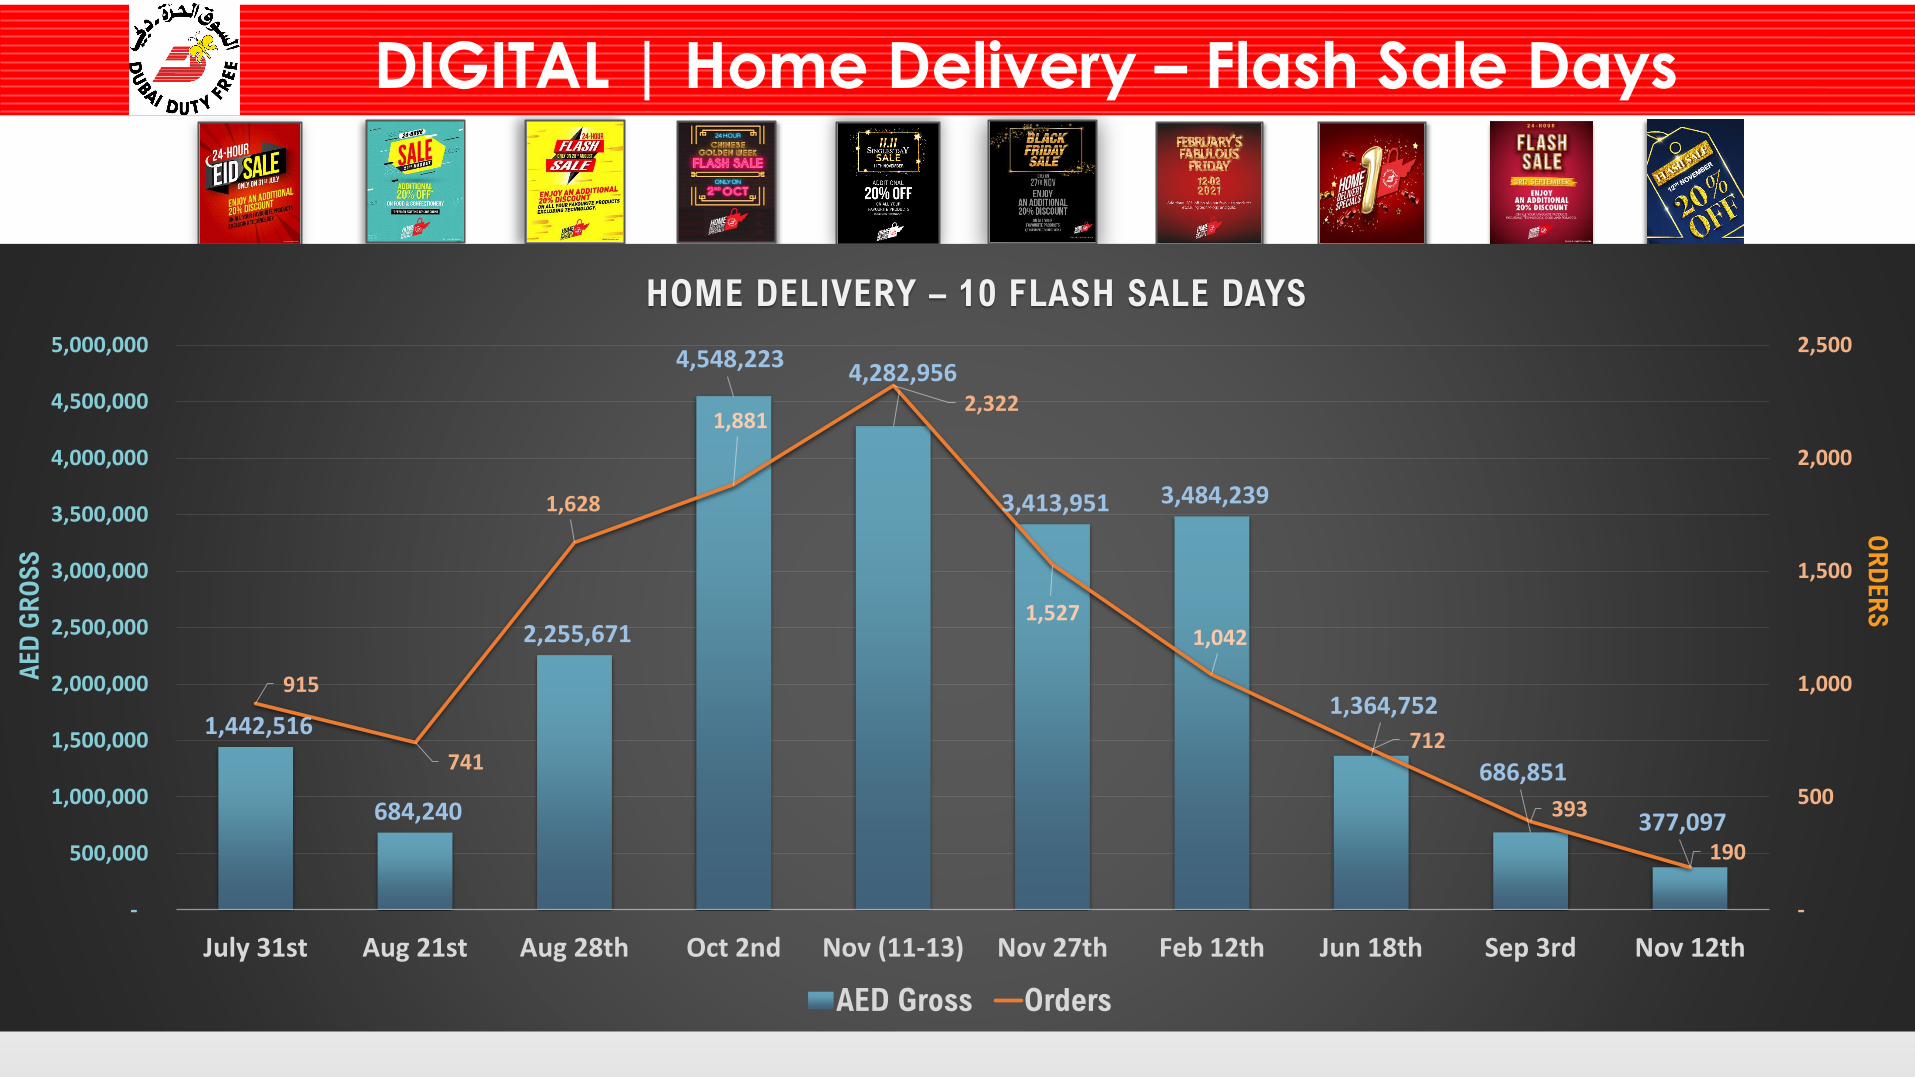
DIGITAL | Home Delivery – Flash Sale Days
1,442,516
684,240
2,255,671
4,548,223 4,282,956
3,413,951 3,484,239
1,364,752
686,851
377,097
915
741
1,628
1,881 2,322
1,527 1,042
712
393
190
-
500
1,000
1,500
2,000
2,500
-
500,000
1,000,000
1,500,000
2,000,000
2,500,000
3,000,000
3,500,000
4,000,000
4,500,000
5,000,000
July 31st Aug 21st Aug 28th Oct 2nd Nov (11-13) Nov 27th Feb 12th Jun 18th Sep 3rd Nov 12th
HOME DELIVERY – 10 FLASH SALE DAYS
AED Gross Orders
AE
D G
RO
SS
OR
DE
RS
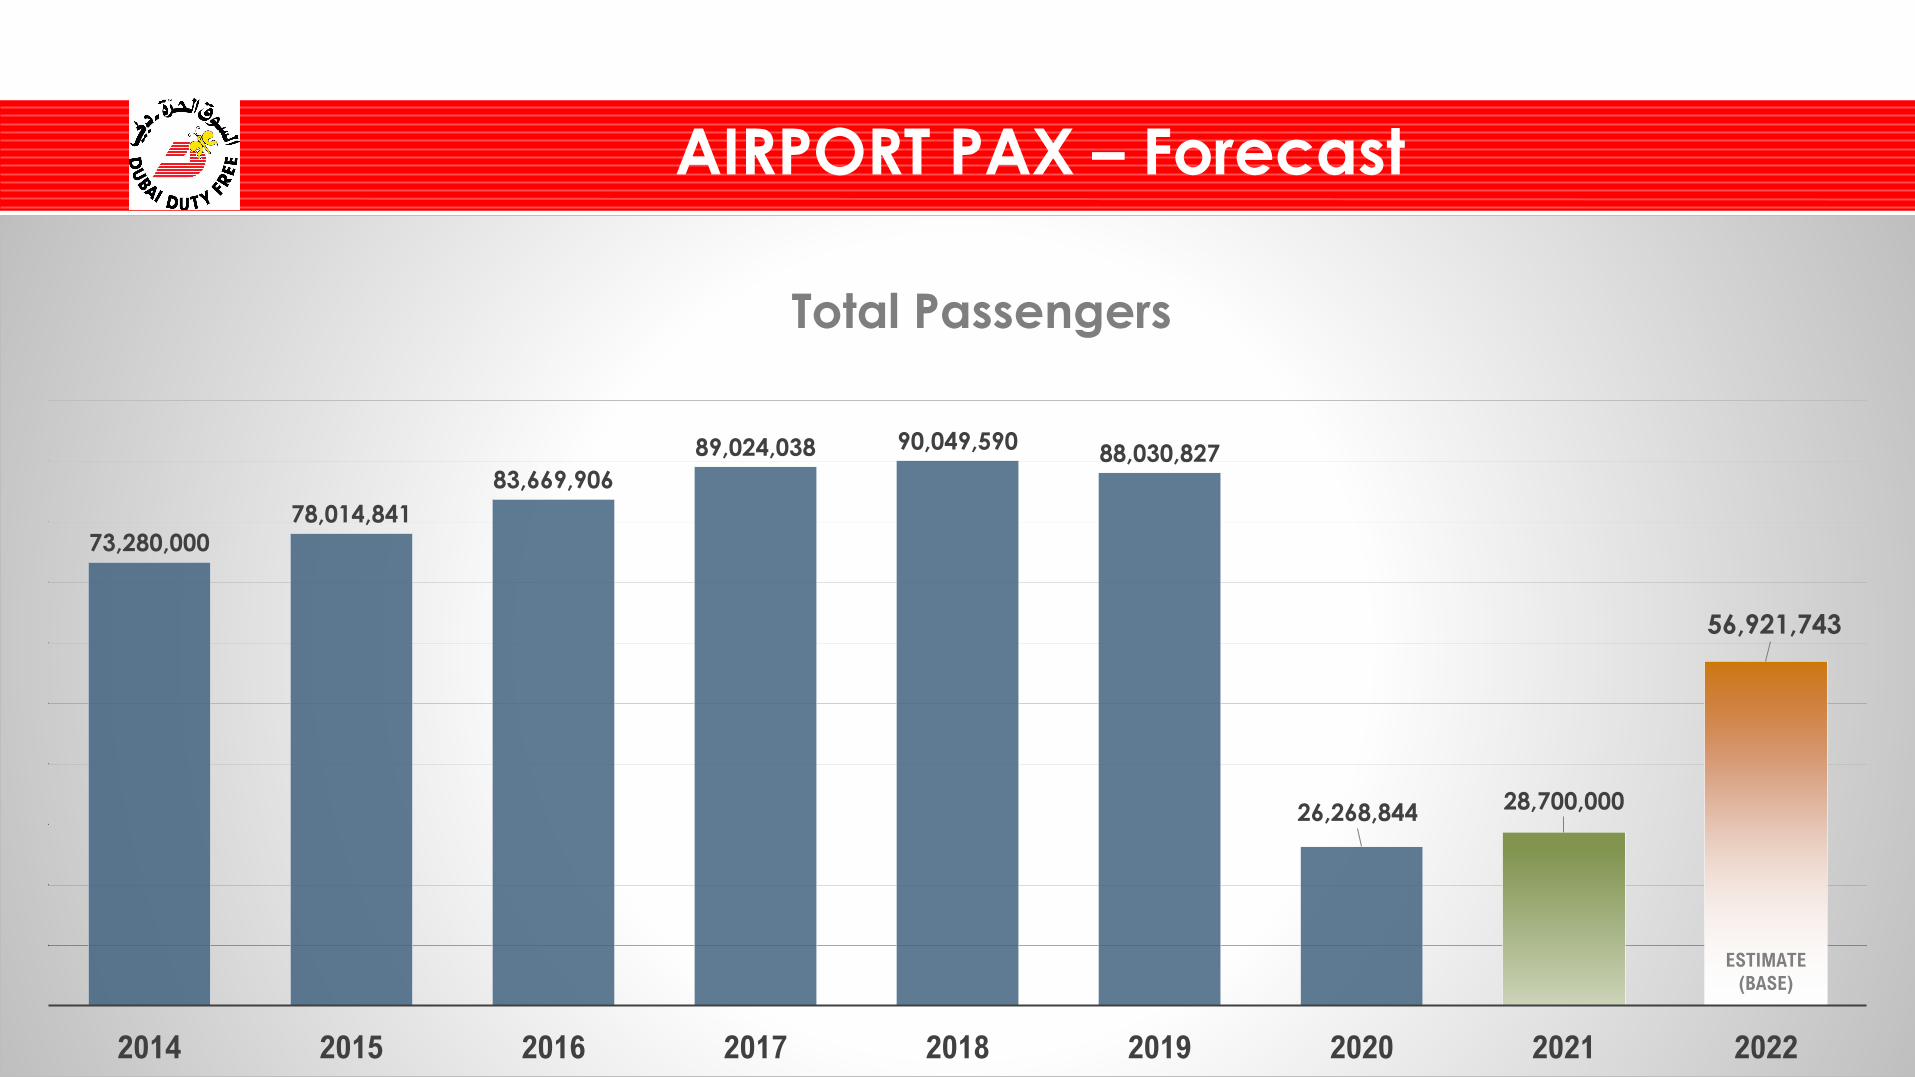
AIRPORT PAX – Forecast
73,280,000
78,014,841
83,669,906
89,024,038 90,049,59088,030,827
26,268,844 28,700,000
56,921,743
2014 2015 2016 2017 2018 2019 2020 2021 2022
Total Passengers
ESTIMATE
(BASE)
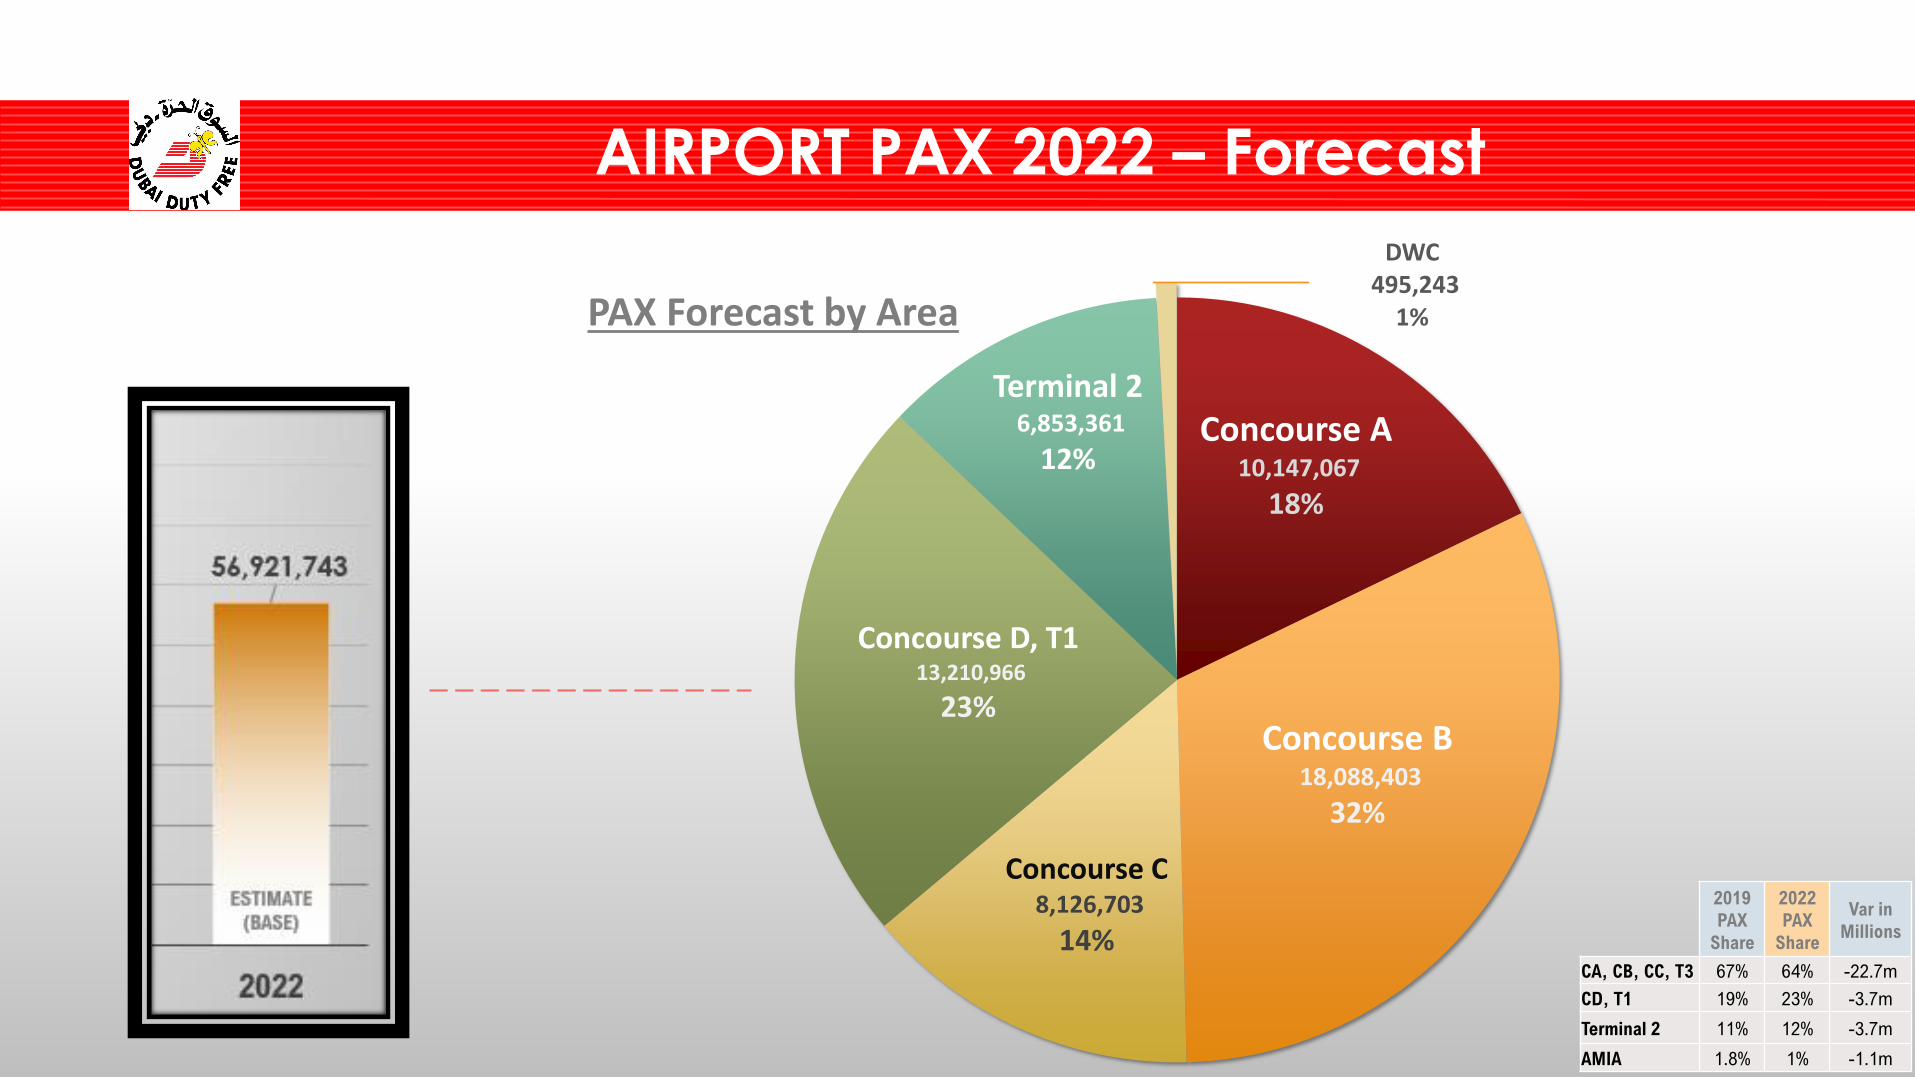
AIRPORT PAX 2022 – Forecast
Concourse A10,147,067
18%
Concourse B18,088,403
32%
Concourse C8,126,703
14%
Concourse D, T113,210,966
23%
Terminal 2 6,853,361
12%
DWC495,243
1%PAX Forecast by Area
2019
PAX
Share
2022
PAX
Share
Var in
Millions
CA, CB, CC, T3 67% 64% -22.7m
CD, T1 19% 23% -3.7m
Terminal 2 11% 12% -3.7m
AMIA 1.8% 1% -1.1m
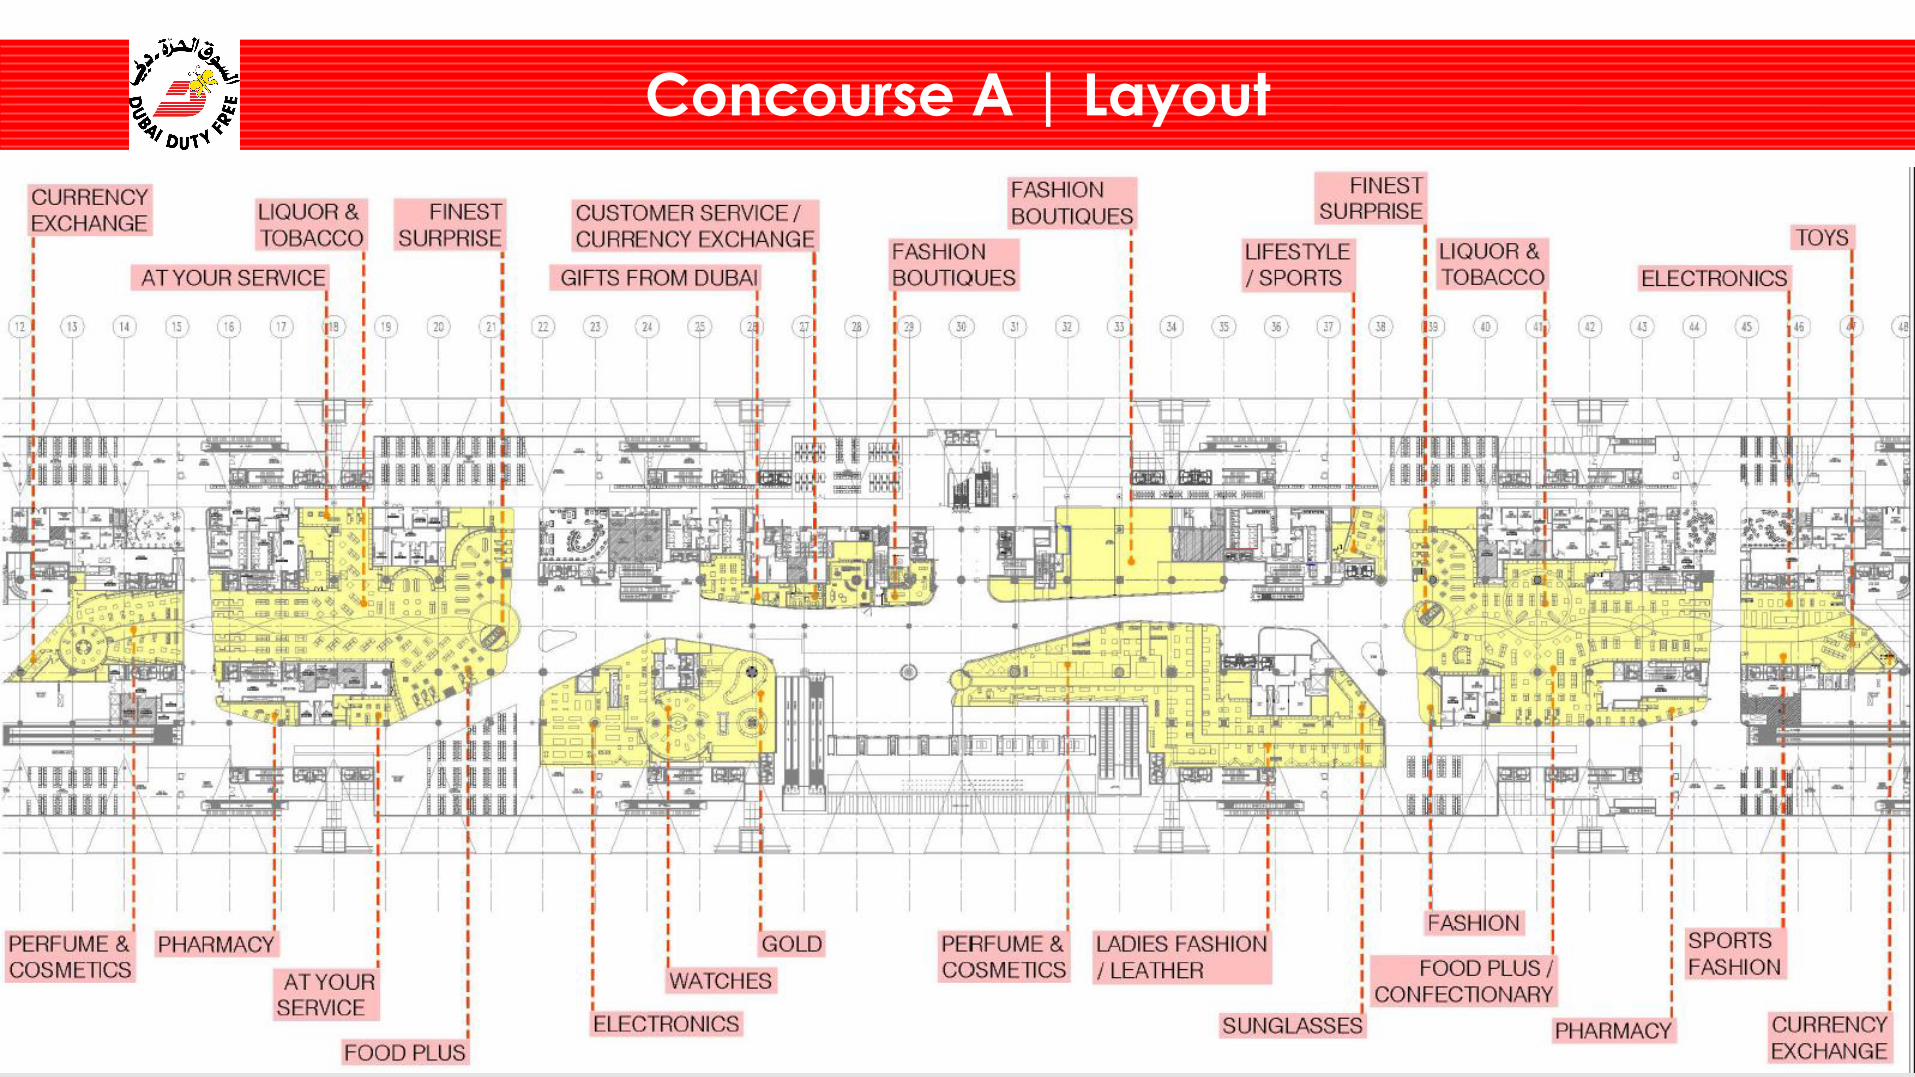
Concourse A | Layout
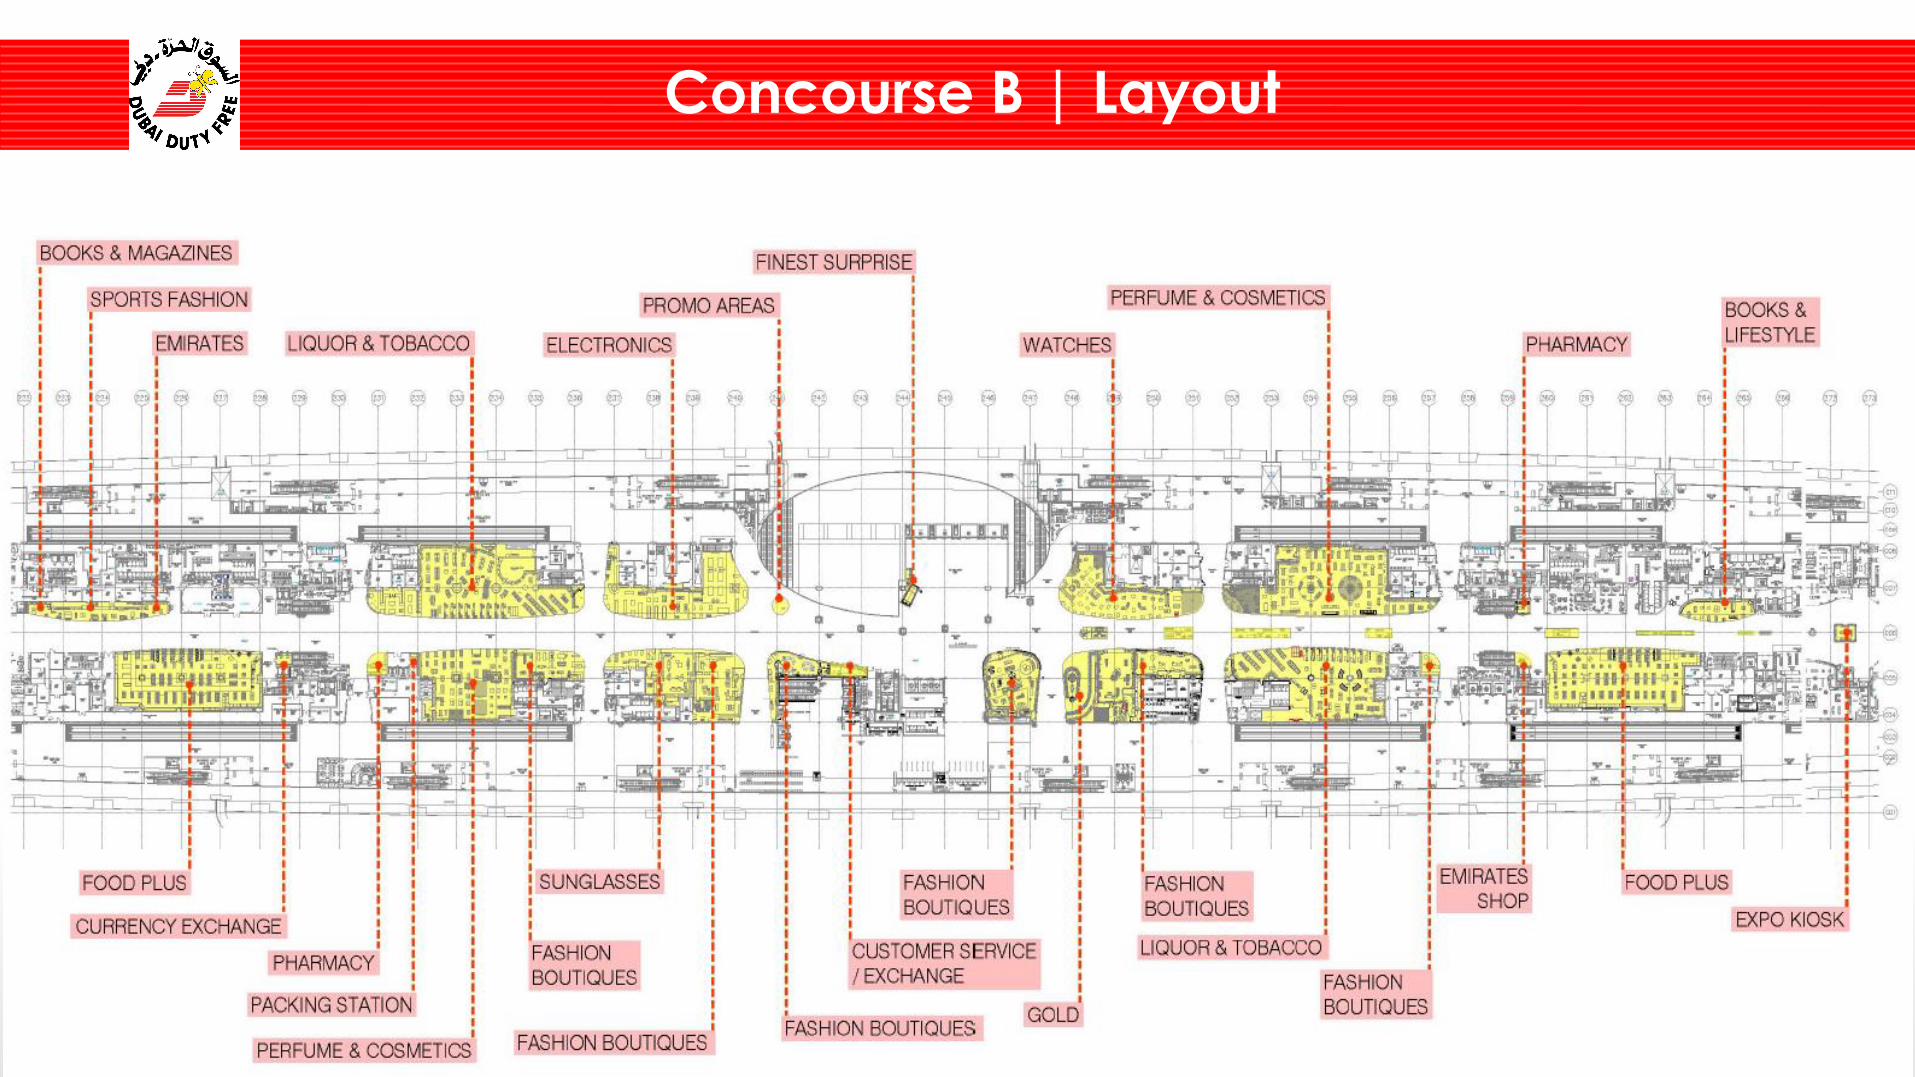
Concourse B | Layout
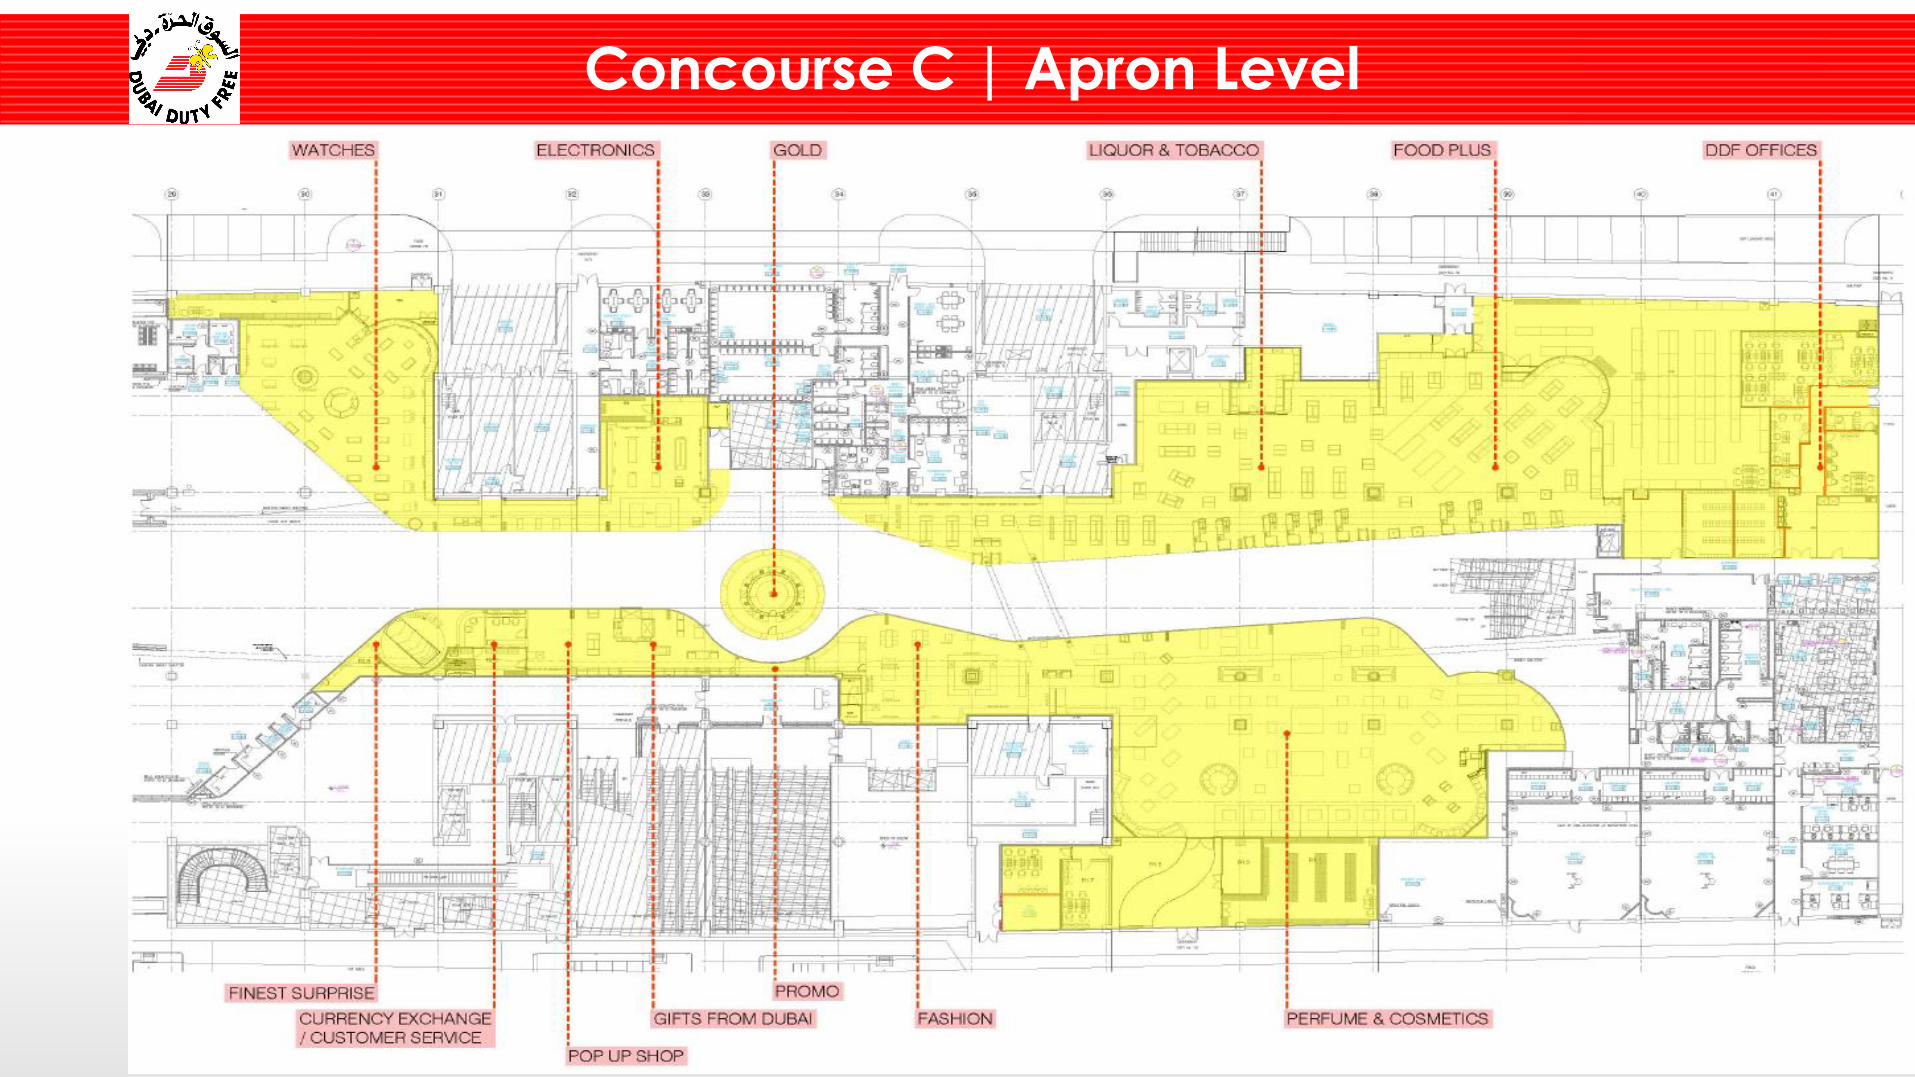
Concourse C | Apron Level
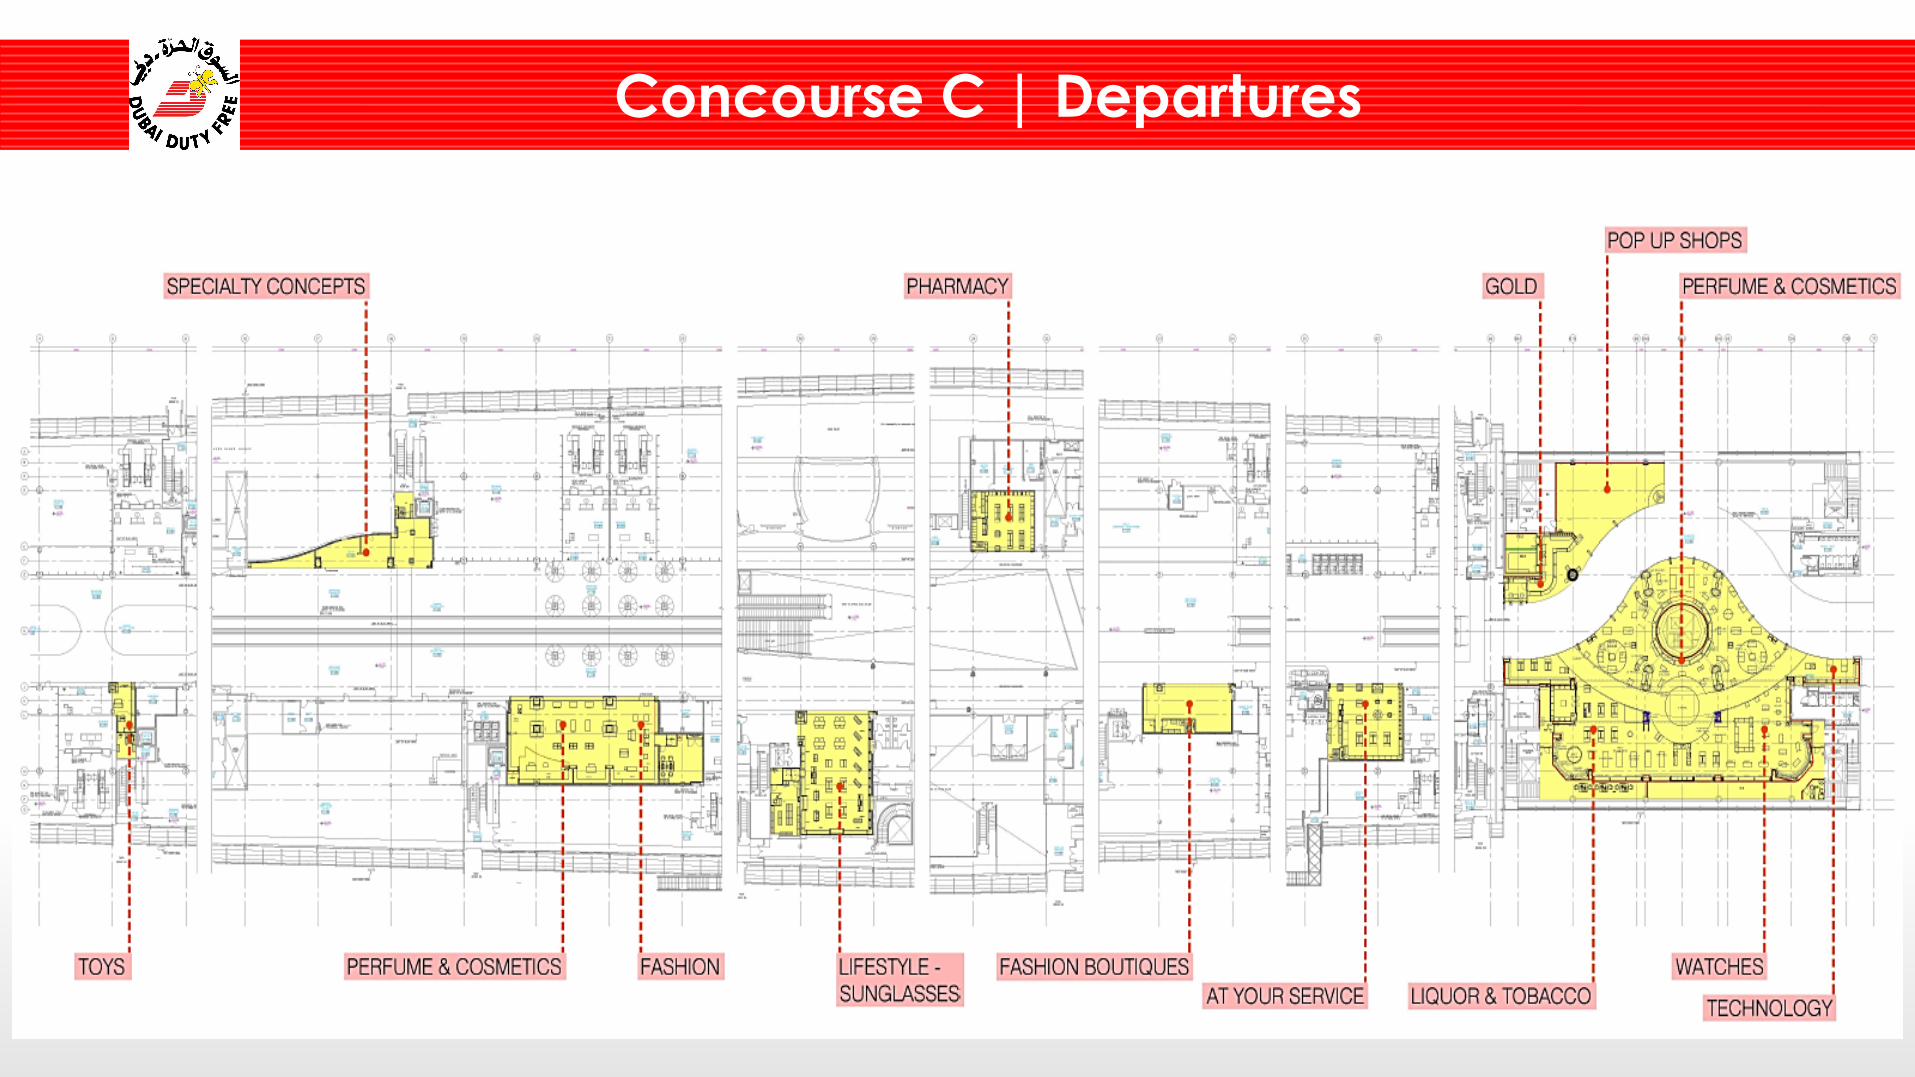
Concourse C | Departures
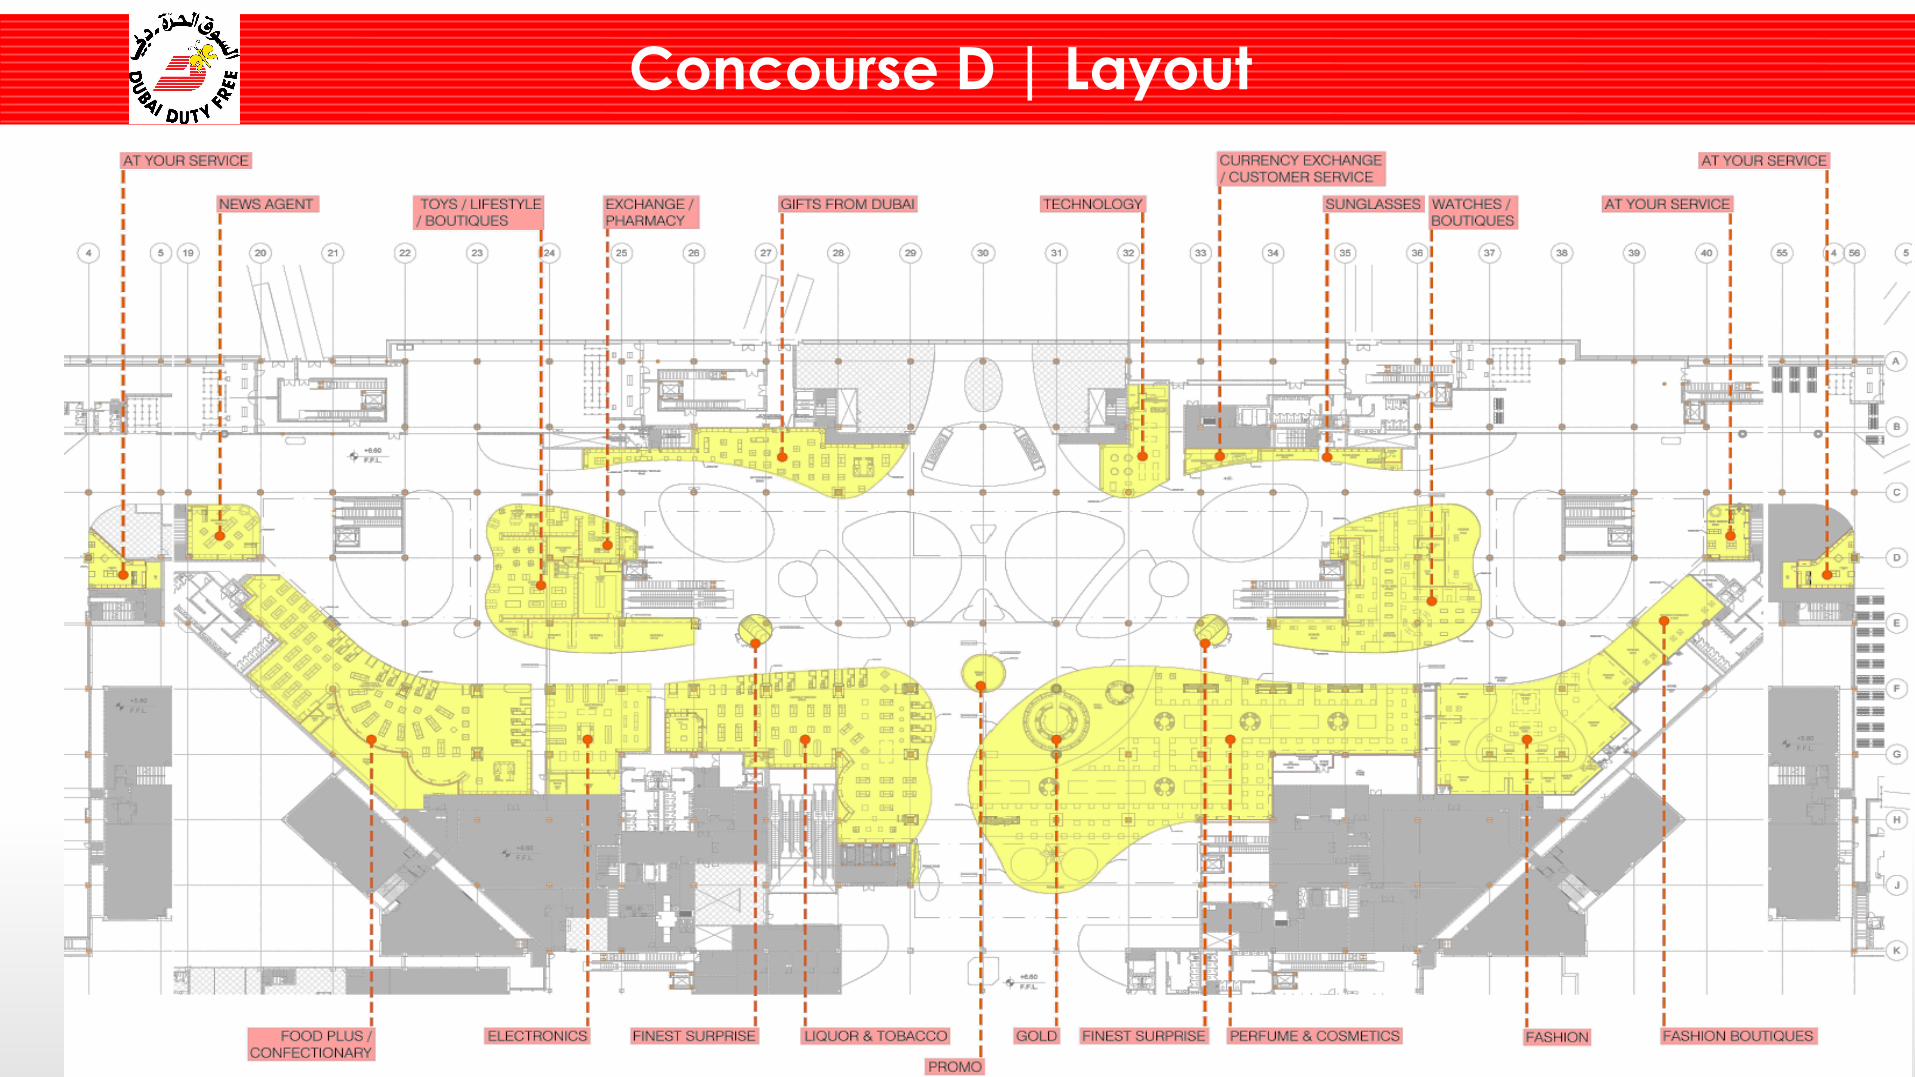
Concourse D | Layout