Embed Size (px)
Citation preview

Dungog Shire Council GENERAL PURPOSE FINANCIAL STATEMENTS for the year ended 30 June 2018
“A vibrant, united community, with a sustainable economy. An area where rural character, community safety,
and lifestyle are preserved.”

Financial Statements 2018
Dungog Shire Council
General Purpose Financial Statements for the year ended 30 June 2018
Contents
1. Understanding Council’s Financial Statements
2. Statement by Councillors and Management
3. Primary Financial Statements:
– Income Statement– Statement of Comprehensive Income– Statement of Financial Position– Statement of Changes in Equity– Statement of Cash Flows
4. Notes to the Financial Statements
5. Independent Auditor’s Reports:
– On the Financial Statements (Sect 417 [2]) – On the Conduct of the Audit (Sect 417 [3])
Overview
198 Dowling StreetDungog NSW 2420
Council’s guiding principles are detailed in Chapter 3 of the LGA and includes:
principles applying to the exercise of functions generally by council,principles to be applied when making decisions,principles of community participation,principles of sound financial management, andprinciples for strategic planning relating to the development of an integrated planning and reporting framework.
A description of the nature of Council’s operations and its principal activities are provided in Note 2(b).
Through the use of the internet, we have ensured that our reporting is timely, complete and available at minimumcost. All press releases, financial statements and other information are publicly available on our website:www.dungog.nsw.gov.au.
Page
4
67
5
2
3
Dungog Shire Council is constituted under the Local Government Act 1993 (NSW) and has its principal place of business at:
8
9
page 1

Financial Statements 2018_
Dungog Shire Council General Purpose Financial Statements for the year ended 30 June 2018 Understanding Council’s financial statements
page 2
Introduction Each year, individual local governments across New South Wales are required to present a set of audited financial statements to their council and community. What you will find in the statements The financial statements set out the financial performance, financial position and cash flows of Council for the financial year ended 30 June 2018. The format of the financial statements is standard across all NSW Councils and complies with both the accounting and reporting requirements of Australian Accounting Standards and requirements as set down by the Office of Local Government. About the Councillor/Management Statement The financial statements must be certified by senior staff as ‘presenting fairly’ the Council’s financial results for the year and are required to be adopted by Council – ensuring both responsibility for and ownership of the financial statements. About the primary financial statements The financial statements incorporate five ‘primary’ financial statements: 1. The Income Statement
Summarises Council's financial performance for the year, listing all income and expenses. This statement also displays Council's original adopted budget to provide a comparison between what was projected and what actually occurred. 2. The Statement of Comprehensive Income
Primarily records changes in the fair value of Council's Infrastructure, Property, Plant and Equipment. 3. The Statement of Financial Position
A 30 June snapshot of Council's financial position indicating its assets, liabilities and “net wealth”. 4. The Statement of Changes in Equity
The overall change for the year (in dollars) of Council’s “net wealth”.
5. The Statement of Cash Flows
Indicates where Council's cash came from and where it was spent. This statement also displays Council's original adopted budget to provide a comparison between what was projected and what actually occurred.
About the Notes to the Financial Statements The Notes to the Financial Statements provide greater detail and additional information on the five primary financial statements. About the Auditor’s Reports Council’s annual financial statements are required to be audited by the NSW Audit Office. In NSW the auditor provides 2 audit reports: 1. an opinion on whether the financial statements
present fairly the Council’s financial performance and position, and
2. their observations on the conduct of the audit, including commentary on the Council’s financial performance and financial position.
Who uses the financial statements? The financial statements are publicly available documents and must be presented at a Council meeting between seven days and five weeks after the date of the Audit Report. The public can make submissions to Council up to seven days subsequent to the public presentation of the financial statements. Council is required to forward an audited set of financial statements to the Office of Local Government.


Financial Statements 2018
Dungog Shire Council
Income Statement for the year ended 30 June 2018
$ ’000
Income from continuing operationsRevenue:Rates and annual chargesUser charges and feesInterest and investment revenueOther revenuesGrants and contributions provided for operating purposesGrants and contributions provided for capital purposesOther income:Net share of interests in joint ventures andassociates using the equity method
Total income from continuing operations
Expenses from continuing operationsEmployee benefits and on-costsBorrowing costsMaterials and contractsDepreciation and amortisationOther expensesNet losses from the disposal of assets
Total expenses from continuing operations
Operating result from continuing operations
Net operating result for the year
Net operating result attributable to Council
Net operating result for the year before grants andcontributions provided for capital purposes
3,602
21,851
(4,087)
22,552
2,132
unaudited
6,091 3,977
(365)
Original
3e,f
4d
4b
–
4c
1,058
849
3b
14
4a
3e,f
101 4,610
6,153 5,201
– 54e
1,099
18,249
2,101
6,941
Notes
3a
3d3c
2018
301
4,159 4,493
17,801
2018
1,082 253 889
7,271
4,426 108
4,743
2,231
3,602
1,150
155 6,578 6,164 1,947
(4,013)
2,132 3,602
2017
6,812
488 750
2,132
20,420
86 8
1,078
7,689 6,145 4,873
6,979
(365)
Actual Actual budget
(365)
(4,858)
18,166
X3A0T
This statement should be read in conjunction with the accompanying notes. page 4

Financial Statements 2018
Dungog Shire Council
Statement of Comprehensive Income for the year ended 30 June 2018
$ ’000
Net operating result for the year (as per Income Statement)
Other comprehensive income:
Amounts that will not be reclassified subsequently to the operating result
Gain (loss) on revaluation of IPP&ETotal items which will not be reclassified subsequentlyto the operating result
Total other comprehensive income for the year
Total comprehensive income for the year
Total comprehensive income attributable to Council
2017
2,132
2018
3,602
Notes
2,132
2,930 – 9a
– 2,930
6,532
2,930
2,132
–
6,532
X3A1T
This statement should be read in conjunction with the accompanying notes. page 5

Financial Statements 2018
Dungog Shire Council
Statement of Financial Position as at 30 June 2018
$ ’000
ASSETSCurrent assetsCash and cash equivalentsInvestmentsReceivablesInventoriesOtherTotal current assets
Non-current assetsInvestmentsReceivablesInventoriesInfrastructure, property, plant and equipmentInvestments accounted for using the equity methodTotal non-current assets
TOTAL ASSETS
LIABILITIESCurrent liabilitiesPayablesIncome received in advanceBorrowingsProvisionsTotal current liabilities
Non-current liabilitiesBorrowingsProvisionsTotal non-current liabilities
TOTAL LIABILITIES
Net assets
EQUITYAccumulated surplusRevaluation reserves
Total equity
6,854
318,110
55 16,567
1,812
2,084
26
4,750
881 24
144
305,407
1,102
180,880
7,268
4,135
Notes
6a6b7
302,126
8
183,810
– 56
302,279
2,845
53
157
26
6b
1110
1212
78
149
318,846
3,133
311,578
2017
536
9,414
797
1,168
557 38
11,560
9,000
7,761
71
2018
311,578
134,300
4,009
1,254
130,698
318,110
2,881 2,907
28
1,787 144
8
1010
10
313,404
886
324,964
11
X3A2T
This statement should be read in conjunction with the accompanying notes. page 6

Financial Statements 2018
Dungog Shire Council
Statement of Changes in Equity for the year ended 30 June 20182018
$ ’000
Opening balance
Net operating result for the year
Other comprehensive income – Gain (loss) on revaluation of IPP&EOther comprehensive income
Total comprehensive income (c&d)
Equity – balance at end of the reporting period
Net operating result for the year prior to correction of errors and changes in accounting policies
Accumulated Accumulated
2,930
3,602
2,930
6,532
311,578 180,880 130,698
–
2,132 –
– –
2,132
– –
2,132
–
2,132 – – 2,132
equity
309,446
surplus
128,566 180,880
reserverevaluation Total
IPP&E2017
134,300 183,810 318,110
– 2,930
3,602 2,930
9a – 2,930
2018
130,698 180,880 311,578
revaluation TotalNotes surplus reserve
IPP&E
equity
3,602 – 3,602 – 3,602 2,132
X4A0T
This statement should be read in conjunction with the accompanying notes. page 7

Financial Statements 2018
Dungog Shire Council
Statement of Cash Flows for the year ended 30 June 2018
$ ’000
Cash flows from operating activitiesReceipts:Rates and annual chargesUser charges and feesInvestment and interest revenue receivedGrants and contributionsBonds, deposits and retention amounts receivedOtherPayments:Employee benefits and on-costsMaterials and contractsBorrowing costsOtherNet cash provided (or used in) operating activities
Cash flows from investing activitiesReceipts:Sale of investment securitiesSale of real estate assetsSale of infrastructure, property, plant and equipmentDeferred debtors receiptsPayments:Purchase of investment securitiesPurchase of infrastructure, property, plant and equipmentPurchase of real estate assetsNet cash provided (or used in) investing activities
Cash flows from financing activitiesReceipts:NilPayments:Repayment of borrowings and advancesNet cash flow provided (used in) financing activities
Net increase/(decrease) in cash and cash equivalents
Plus: cash and cash equivalents – beginning of year
Cash and cash equivalents – end of the year
Additional Information:
plus: Investments on hand – end of year
Total cash, cash equivalents and investments
253
6,629 6,950 1,077
1,933
2018 2017Actual
(104)
749
2018
1,007
– 8,097
301
(2,101)
(4,610)
– (7,158)
–
(7,158)
(152)
(2,228)
(2,228)
(152)
–
(152)
13a
Notes
6,941
(101)
Original
budget unaudited
– – –
(5,201)
–
5,082
(4,562)
488
(84)
13,766
(8,412) –
(6,830)
33 865
12,562
Actual
1,084
(3,893) (5,040)
(7,884)
(108) (1,981)
–
(144)
250
(144)
(9,031)
7
17,929
(12,011)
9,414
4,750
8,569
845
9,414
(8,246)
(152)
(19,651)
14,164
1,168 13a
16,761
13b 11,557
– 94 268
–
9,401 (2,188)
343 5
4
6b
X3A3T
This statement should be read in conjunction with the accompanying notes. page 8
Financial Statements 2018
Dungog Shire Council
Notes to the Financial Statements for the year ended 30 June 2018
Contents of the notes accompanying the financial statements
Details
Basis of preparationCouncil functions/activities – financial informationCouncil functions/activities – component descriptionsIncome from continuing operationsExpenses from continuing operationsGains or losses from the disposal of assetsCash and cash equivalent assetsInvestmentsRestricted cash, cash equivalents and investments – detailsReceivablesInventories and other assetsInfrastructure, property, plant and equipmentExternally restricted infrastructure, property, plant and equipmentPayables and borrowingsProvisions
Statement of cash flows – additional informationInterests in other entitiesCommitments for expenditureContingencies and other liabilities/assets not recognisedFinancial risk managementMaterial budget variationsFair value measurementRelated party transactionsEvents occurring after the reporting dateStatement of developer contributionsStatement of performance measures – consolidated results
Additional council disclosures (unaudited)
Statement of performance measures – consolidated results (graphs)Council information and contact details
23(a)
2122
73
23(b) 75
6(a)
4
6(c)
13
20
31
1615
Note
10
Page
12(a)
32(b)
6(b)
5
28
34
Accumulated surplus, revaluation reserves, changes in accounting policies, changes in accounting estimates and errors
19
11
5118
4314
17
12
40
4447
25
2627
29
1013141521
25
78
9(a)9(b)
24 77
53
6869
39
36
40
67
33
X5A0T
page 9

Financial Statements 2018_
Dungog Shire Council Notes to the Financial Statements for the year ended 30 June 2018 Note 1. Basis of preparation
page 10
These financial statements were authorised for issue by Council on 17/10/2018. Council has the power to amend and reissue these financial statements. The principal accounting policies adopted in the preparation of these consolidated financial statements are set out below. These policies have been consistently applied to all the years presented, unless otherwise stated. Basis of preparation These general purpose financial statements have been prepared in accordance with Australian Accounting Standards and Australian Accounting Interpretations, the Local Government Act 1993 (NSW) and Regulations, and the Local Government Code of Accounting Practice and Financial Reporting. Council is a not for-profit entity for the purpose of preparing these financial statements. The financial statements are presented in Australian dollars and are rounded to the nearest thousand dollars. Full dollars have been used in Note 20 Related party disclosures in relation to the disclosure of specific related party transactions. Unless otherwise indicated, all amounts disclosed in the financial statements are actual amounts. Specific budgetary amounts have been included for comparative analysis (to actuals) in the following reports and notes: Income statement Statement of cash flows Note 18 – Material budget variations and are clearly marked. (a) New and amended standards adopted by Council There have been no new (or amended) accounting standards adopted by Council in this year’s financial statements which have had any material impact on reported financial position, performance or cash flows. (b) Historical cost convention These financial statements have been prepared under the historical cost convention, as modified by the revaluation of certain financial assets and liabilities and certain classes of infrastructure, property, plant and equipment and investment property. (c) Significant accounting estimates and judgements The preparation of financial statements requires the use of certain critical accounting estimates. It also requires management to exercise its judgement in the process of applying the Council's accounting policies. Estimates and judgements are continually evaluated and are based on historical experience and other factors, including expectations of future events that may have a financial impact on the Council and that are believed to be reasonable under the circumstances. Critical accounting estimates and assumptions Council makes estimates and assumptions concerning the future. The resulting accounting estimates will, by definition, seldom equal the related actual results. The estimates and assumptions that have a significant risk
Financial Statements 2018_
Dungog Shire Council Notes to the Financial Statements for the year ended 30 June 2018 Note 1. Basis of preparation (continued)
page 11
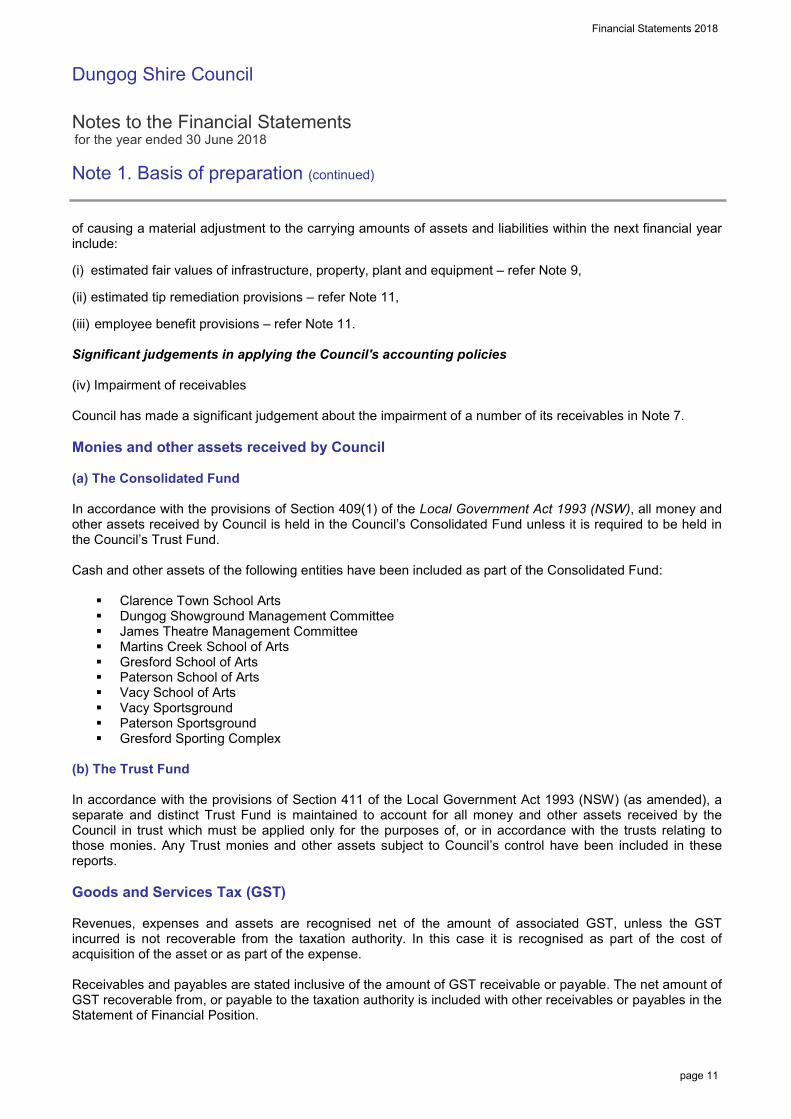
of causing a material adjustment to the carrying amounts of assets and liabilities within the next financial year include: (i) estimated fair values of infrastructure, property, plant and equipment – refer Note 9, (ii) estimated tip remediation provisions – refer Note 11, (iii) employee benefit provisions – refer Note 11. Significant judgements in applying the Council's accounting policies (iv) Impairment of receivables Council has made a significant judgement about the impairment of a number of its receivables in Note 7. Monies and other assets received by Council (a) The Consolidated Fund In accordance with the provisions of Section 409(1) of the Local Government Act 1993 (NSW), all money and other assets received by Council is held in the Council’s Consolidated Fund unless it is required to be held in the Council’s Trust Fund. Cash and other assets of the following entities have been included as part of the Consolidated Fund:
Clarence Town School Arts Dungog Showground Management Committee James Theatre Management Committee Martins Creek School of Arts Gresford School of Arts Paterson School of Arts Vacy School of Arts Vacy Sportsground Paterson Sportsground Gresford Sporting Complex
(b) The Trust Fund In accordance with the provisions of Section 411 of the Local Government Act 1993 (NSW) (as amended), a separate and distinct Trust Fund is maintained to account for all money and other assets received by the Council in trust which must be applied only for the purposes of, or in accordance with the trusts relating to those monies. Any Trust monies and other assets subject to Council’s control have been included in these reports. Goods and Services Tax (GST) Revenues, expenses and assets are recognised net of the amount of associated GST, unless the GST incurred is not recoverable from the taxation authority. In this case it is recognised as part of the cost of acquisition of the asset or as part of the expense. Receivables and payables are stated inclusive of the amount of GST receivable or payable. The net amount of GST recoverable from, or payable to the taxation authority is included with other receivables or payables in the Statement of Financial Position.

Financial Statements 2018_
Dungog Shire Council Notes to the Financial Statements for the year ended 30 June 2018 Note 1. Basis of preparation (continued)
page 12
Cash flows are presented on a gross basis. The GST components of cash flows arising from investing or financing activities which that are recoverable from, or payable to the taxation authority are presented as operating cash flows. New accounting standards and interpretations issued not yet effective Certain new accounting standards and interpretations have been published that are not mandatory for the current reporting period and which have not been applied. As at the date of authorisation of these financial statements, Council does not consider that any of those standards are likely to have a material impact on the Council's future financial statements, financial position, financial performance or cash flows. Council has not elected to apply any pronouncements before their operative date in these financial statements.
Financial Statements 2018
Dungog Shire Council
Notes to the Financial Statements for the year ended 30 June 2018
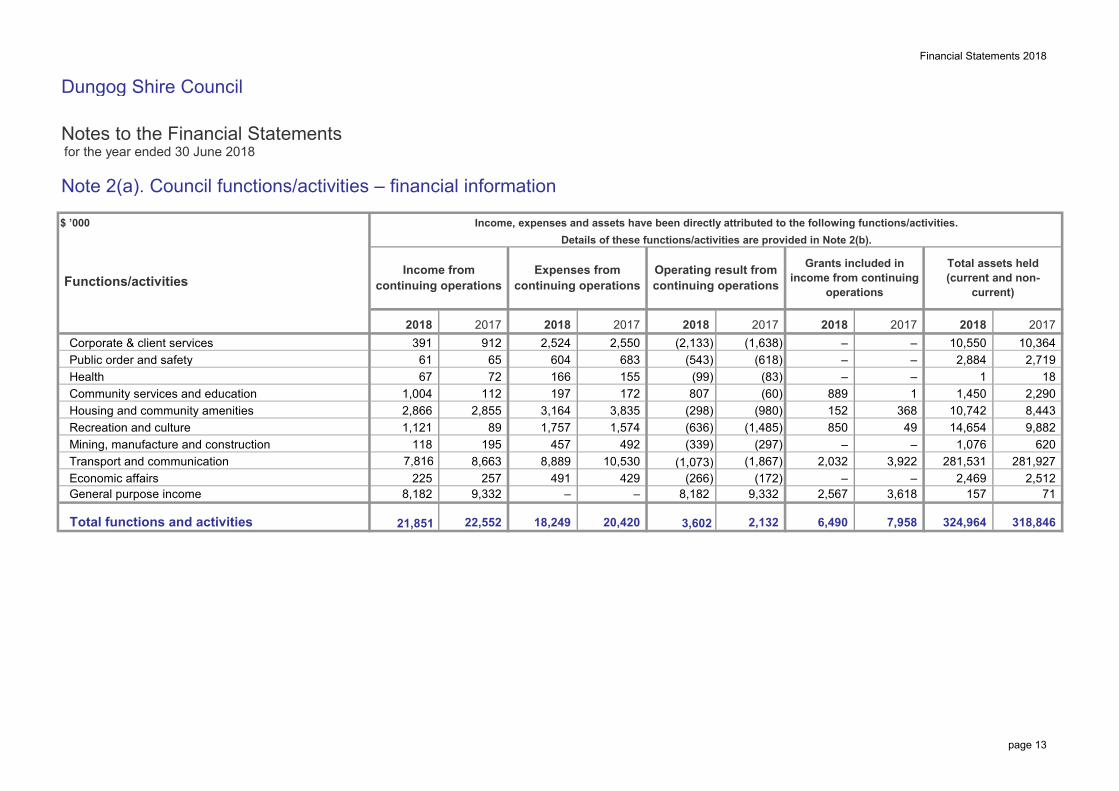
Note 2(a). Council functions/activities – financial information
Public order and safetyHealthCommunity services and educationHousing and community amenitiesRecreation and cultureMining, manufacture and constructionTransport and communicationEconomic affairs
Total functions and activities 22,552 18,249
21,851 318,846 324,964 3,60220,420 6,490 2,132 7,958
10,550 10,364
2,290 18
8,443 14,654 850 49
– 2,719
620 9,882
281,927 1,076
281,531 3,922 –
(1,867) (297)
2,469 – 2,567
– 3,618
2,512 71
(1,485)
889 1
1,450
157 (172)
9,332 (266)
–
807 (60)
(339) (636)
2,032 –
(1,073)
(99)
8,182
1,574 1,757
1 152 10,742
2,884 – – – (2,133) –
(298) (980)
(543) (83) –
368
(618) (1,638)
492 457 8,663
491 10,530 8,889
257 9,332
429 –
Corporate & client services
2,855 112 197
72 166
3,164 1,121 89
1,004
118
391 912
195
8,182
2,866
General purpose income
2,524 61
3,835 172 155
7,816
225
604 67
65 683 2,550
Income from continuing operations
Income, expenses and assets have been directly attributed to the following functions/activities.Details of these functions/activities are provided in Note 2(b).
Expenses from continuing operations
Operating result from continuing operations
$ ’000
Total assets held (current and non-
current) Functions/activities
2017
Grants included in income from continuing
operations
201720182018 2017 2018 2018 20172018 2017
X6A0T
page 13
Financial Statements 2018
Dungog Shire Council
Notes to the Financial Statements for the year ended 30 June 2018
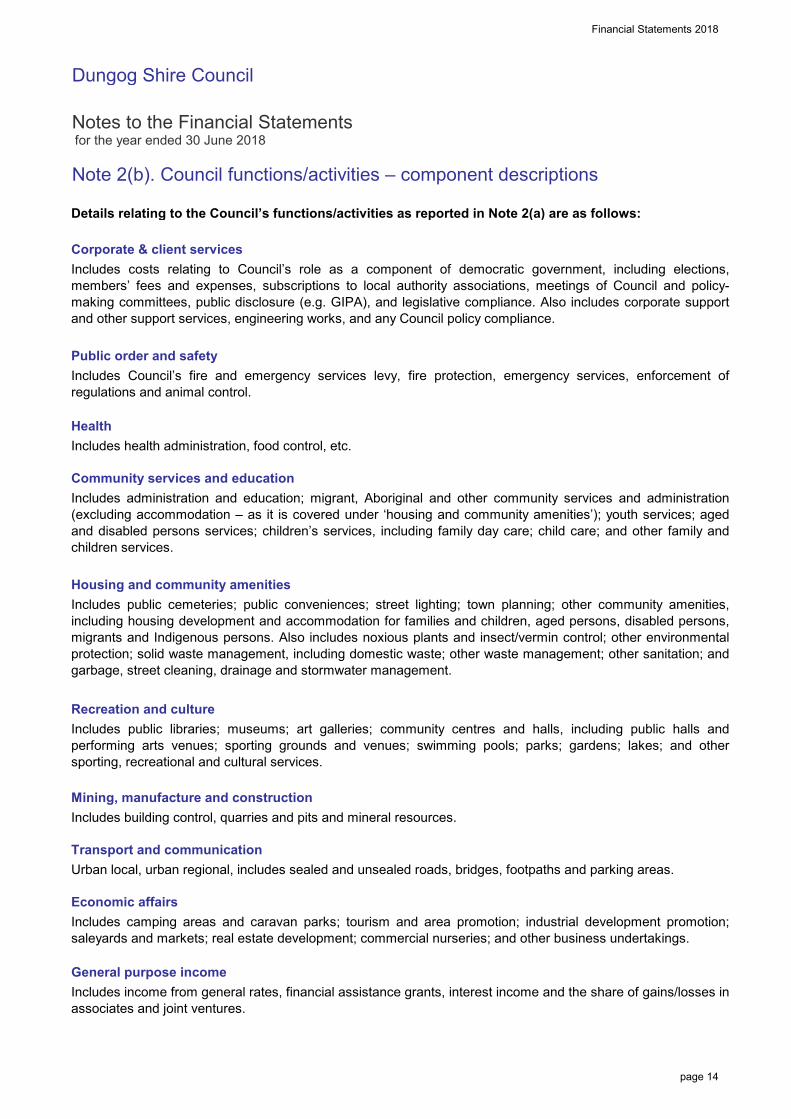
Note 2(b). Council functions/activities – component descriptions
Details relating to the Council’s functions/activities as reported in Note 2(a) are as follows:
Corporate & client services
Public order and safety
Health
Community services and education
Housing and community amenities
Recreation and culture
Mining, manufacture and construction
Transport and communication
Economic affairs
General purpose income
Includes public cemeteries; public conveniences; street lighting; town planning; other community amenities,including housing development and accommodation for families and children, aged persons, disabled persons,migrants and Indigenous persons. Also includes noxious plants and insect/vermin control; other environmentalprotection; solid waste management, including domestic waste; other waste management; other sanitation; andgarbage, street cleaning, drainage and stormwater management.
Includes costs relating to Council’s role as a component of democratic government, including elections,members’ fees and expenses, subscriptions to local authority associations, meetings of Council and policy-making committees, public disclosure (e.g. GIPA), and legislative compliance. Also includes corporate supportand other support services, engineering works, and any Council policy compliance.
Includes Council’s fire and emergency services levy, fire protection, emergency services, enforcement ofregulations and animal control.
Includes health administration, food control, etc.
Includes administration and education; migrant, Aboriginal and other community services and administration(excluding accommodation – as it is covered under ‘housing and community amenities’); youth services; agedand disabled persons services; children’s services, including family day care; child care; and other family andchildren services.
Includes public libraries; museums; art galleries; community centres and halls, including public halls andperforming arts venues; sporting grounds and venues; swimming pools; parks; gardens; lakes; and othersporting, recreational and cultural services.
Includes building control, quarries and pits and mineral resources.
Includes income from general rates, financial assistance grants, interest income and the share of gains/losses inassociates and joint ventures.
Urban local, urban regional, includes sealed and unsealed roads, bridges, footpaths and parking areas.
Includes camping areas and caravan parks; tourism and area promotion; industrial development promotion;saleyards and markets; real estate development; commercial nurseries; and other business undertakings.
X7A0T
page 14
Financial Statements 2018
Dungog Shire Council
Notes to the Financial Statements for the year ended 30 June 2018
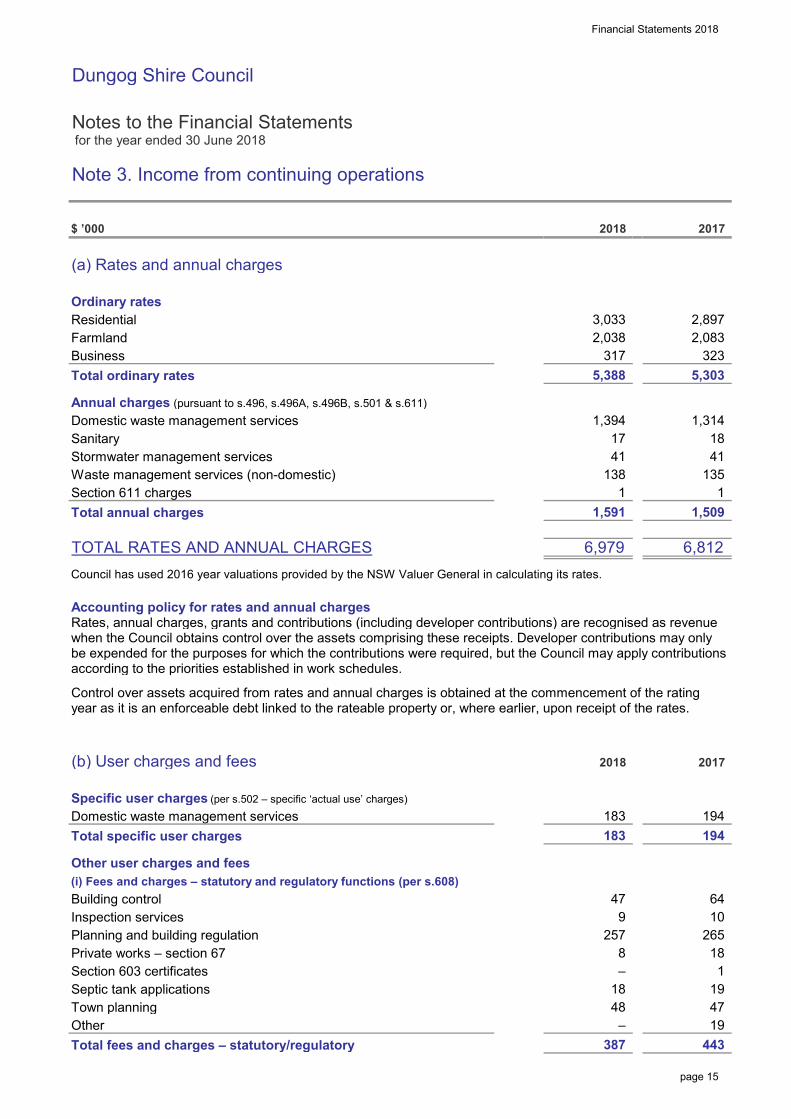
Note 3. Income from continuing operations
$ ’000
(a) Rates and annual charges
Ordinary ratesResidentialFarmlandBusinessTotal ordinary rates
Annual charges (pursuant to s.496, s.496A, s.496B, s.501 & s.611)Domestic waste management servicesSanitaryStormwater management servicesWaste management services (non-domestic)Section 611 chargesTotal annual charges
TOTAL RATES AND ANNUAL CHARGESCouncil has used 2016 year valuations provided by the NSW Valuer General in calculating its rates.
Accounting policy for rates and annual chargesRates, annual charges, grants and contributions (including developer contributions) are recognised as revenuewhen the Council obtains control over the assets comprising these receipts. Developer contributions may onlybe expended for the purposes for which the contributions were required, but the Council may apply contributionsaccording to the priorities established in work schedules.
Control over assets acquired from rates and annual charges is obtained at the commencement of the ratingyear as it is an enforceable debt linked to the rateable property or, where earlier, upon receipt of the rates.
(b) User charges and fees
Specific user charges (per s.502 – specific ‘actual use’ charges)Domestic waste management servicesTotal specific user charges
Other user charges and fees(i) Fees and charges – statutory and regulatory functions (per s.608)Building controlInspection servicesPlanning and building regulationPrivate works – section 67Section 603 certificatesSeptic tank applicationsTown planningOtherTotal fees and charges – statutory/regulatory 387
18
265 18
10
17
19 1
64
19 443
135
6,979 6,812
1
1,314
1,591
1,394
41
2,083
1,509
138
2017
5,303
2,897
323
2018
3,033
317 2,038
5,388
2018
18
1
41
194 194
183
2017
183
47 –
8
47 9
257
–
48
X8A5T
X8A6T
X8A18T
page 15

Financial Statements 2018
Dungog Shire Council
Notes to the Financial Statements for the year ended 30 June 2018
Note 3. Income from continuing operations (continued)
$ ’000
(b) User charges and fees (continued)
(ii) Fees and charges – other (incl. general user charges (per s.608))Caravan parkCemeteriesOnsite sewerage management servicesInspections and construction certificates – roadsTourismOtherTotal fees and charges – other
TOTAL USER CHARGES AND FEES
Accounting policy for user charges and feesUser charges and fees are recognised as revenue when the service has been provided.
(c) Interest and investment revenue (including losses)
Interest – Overdue rates and annual charges (incl. special purpose rates) – Cash and investmentsTOTAL INTEREST AND INVESTMENT REVENUE
Interest revenue is attributable to:Unrestricted investments/financial assets:Overdue rates and annual charges (general fund)General Council cash and investmentsRestricted investments/funds – external:Development contributions – Section 7.11Total interest and investment revenue recognised
Accounting policy for interest and investment revenueInterest income is recognised using the effective interest rate at the date that interest is earned.
26
441
37
488
36
112
2017
1,078
104
193
512
462
377 26
85
2
164
45
–
1,082
216
253 488
194
3
38 209 50
18
2018
253
37
X8A7T
page 16

Financial Statements 2018
Dungog Shire Council
Notes to the Financial Statements for the year ended 30 June 2018
Note 3. Income from continuing operations (continued)
$ ’000
(d) Other revenues
Rental income – other council propertiesFines – otherLegal fees recovery – otherCommissions and agency feesLandfill recycling stations salesSales – generalSection 88 fee collectedWorkers compensation and insurance rebatesOtherTOTAL OTHER REVENUE
Accounting policy for other revenueCouncil recognises revenue when the amount of revenue can be reliably measured, it is probable that futureeconomic benefits will flow to the Council and specific criteria have been met for each of the Council’s activitiesas described below. Council bases its estimates on historical results, taking into consideration the type ofcustomer, the type of transaction and the specifics of each arrangement.
Parking fees and fines are recognised as revenue when the service has been provided, or when the penalty hasbeen applied, whichever occurs first.
Rental income is accounted for on a straight-line basis over the lease term.
Miscellaneous sales are recognised when physical possession has transferred to the customer which isdeemed to be the point of transfer of risks and rewards.
Other income is recorded when the payment is due, the value of the payment is notified, or the payment isreceived, whichever occurs first.
2
750
1
889
Notes 2018 2017
1 18
132
151 156
82
105
17
– 277
14
163 78
82 36 324
X8A8T
page 17

Financial Statements 2018
Dungog Shire Council
Notes to the Financial Statements for the year ended 30 June 2018
Note 3. Income from continuing operations (continued)
$ ’000
(e) Grants
General purpose (untied)Current year allocationFinancial assistance – general componentFinancial assistance – local roads componentOtherPensioners’ rates subsidies – general componentTotal general purpose
Specific purposePensioners’ rates subsidies: – Domestic waste managementCommunity careEconomic developmentEnvironmental protectionFlood restorationHeritage and culturalLibraryLibrary – special projectsNoxious weedsPublic hallsRecreation and cultureStreet lightingTransport (roads to recovery)Transport (other roads and bridges funding)Bus sheltersTotal specific purposeTotal grants
Grant revenue is attributable to:– Commonwealth funding– State funding
50 –
11
–
31 5
2017
1,716
–
–
2,216
–
–
–
2018
1,716
12 –
–
2017
–
3,618
–
–
Capital
–
–
4
–
1,287 –
2,216
– – 2,200
–
2018
37
729
Operating
–
–
4,774
5,742
2,207
4,774
5,742
4,475
2,124
1,218
–
1,218
–
3,556
–
20
–
31
803
–
–
58
96 –
–
–
–
2,265
65
901
20
32
–
3
–
801
886 1
–
7
178
2,567
1,601
32
66 – –
58
1,267
–
–
11
–
6
–
Operating
2,216
923
–
Capital
1,716
1,716
–
2,216
X8A17T
page 18
Financial Statements 2018
Dungog Shire Council
Notes to the Financial Statements for the year ended 30 June 2018
Note 3. Income from continuing operations (continued)
$ ’000
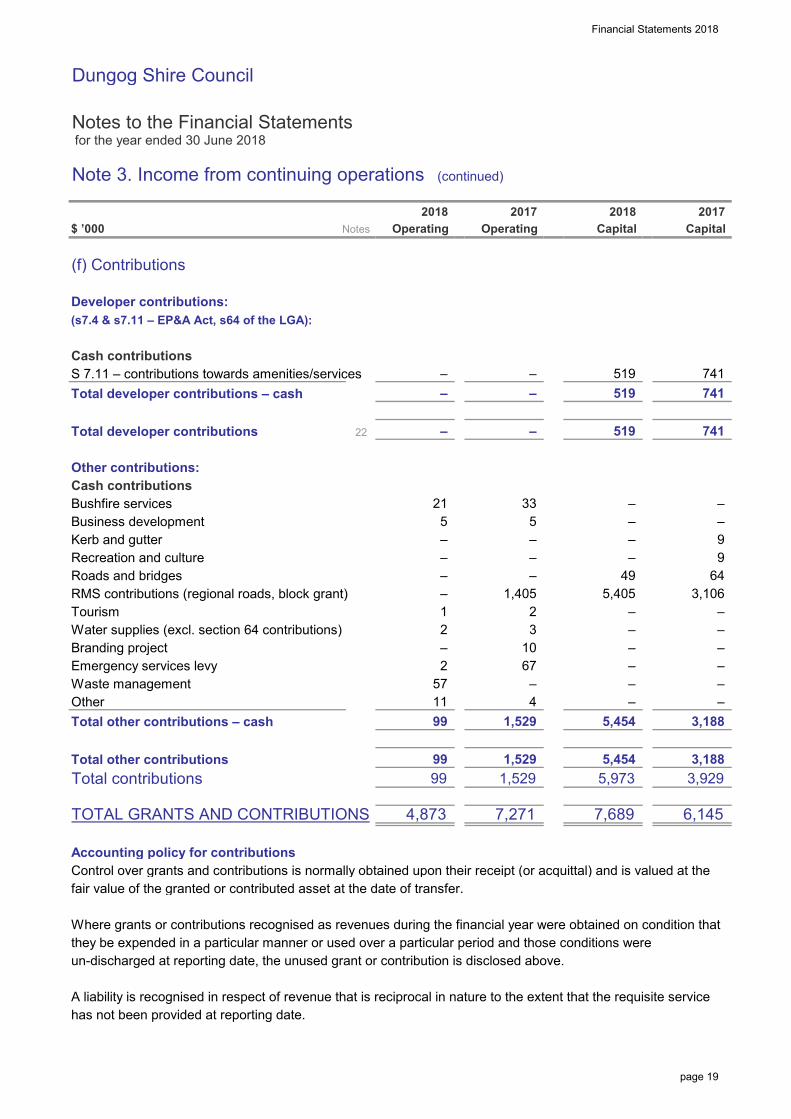
(f) Contributions
Developer contributions:(s7.4 & s7.11 – EP&A Act, s64 of the LGA):
Cash contributionsS 7.11 – contributions towards amenities/servicesTotal developer contributions – cash
Total developer contributions
Other contributions:Cash contributionsBushfire servicesBusiness developmentKerb and gutterRecreation and cultureRoads and bridgesRMS contributions (regional roads, block grant)TourismWater supplies (excl. section 64 contributions)Branding projectEmergency services levyWaste managementOtherTotal other contributions – cash
Total other contributionsTotal contributions
TOTAL GRANTS AND CONTRIBUTIONS
Accounting policy for contributionsControl over grants and contributions is normally obtained upon their receipt (or acquittal) and is valued at thefair value of the granted or contributed asset at the date of transfer.
Where grants or contributions recognised as revenues during the financial year were obtained on condition thatthey be expended in a particular manner or used over a particular period and those conditions wereun-discharged at reporting date, the unused grant or contribution is disclosed above.
A liability is recognised in respect of revenue that is reciprocal in nature to the extent that the requisite servicehas not been provided at reporting date.
99 1,529 5,454 3,188
– –
–
11 –
2 – –
5 21
–
– 9
–
741
– 1
57 2
9
–
1,529
7,271
99 5,973
741
–
49
3,929
–
519
– 5,405
–
7,689
–
10
– –
Operating 2018
4
– –
– 2
–
5
99
2018Operating
22 –
519
Notes
5,454
6,145 4,873
1,529
–
–
1,405 3,106
519
Capital
– –
3,188
67
33 – –
–
64
3
–
–
–
741
2017 2017Capital
X8A9T
page 19

Financial Statements 2018
Dungog Shire Council
Notes to the Financial Statements for the year ended 30 June 2018
Note 3. Income from continuing operations (continued)
$ ’000
(g) Unspent grants and contributions
Certain grants and contributions are obtained by Council on conditionthat they be spent in a specified manner:
Operating grantsUnexpended at the close of the previous reporting period
Add: operating grants recognised in the current period but not yet spent
Less: operating grants recognised in a previous reporting period now spent
Unexpended and held as restricted assets (operating grants)
ContributionsUnexpended at the close of the previous reporting period
Add: contributions recognised in the current period but not yet spent
Unexpended and held as restricted assets (contributions)
5,232
4,261
(3,570)
5,716
5,088
5,088
4,683
2,050
2,050 4,119
(5,232)
2017
827
2018
5,232
628
page 20

Financial Statements 2018
Dungog Shire Council
Notes to the Financial Statements for the year ended 30 June 2018
Note 4. Expenses from continuing operations
$ ’000
(a) Employee benefits and on-costs
Salaries and wagesEmployee leave entitlements (ELE)SuperannuationWorkers’ compensation insuranceFringe benefit tax (FBT)Training costs (other than salaries and wages)OtherTotal employee costsLess: capitalised costsTOTAL EMPLOYEE COSTS EXPENSEDNumber of ‘full-time equivalent’ employees (FTE) at year end
Accounting policy for employee benefits and on-costsEmployee benefit expenses are recorded when the service has been provided by the employee.
Retirement benefit obligationsAll employees of the Council are entitled to benefits on retirement, disability or death. Council contributes tovarious defined benefit plans and defined contribution plans on behalf of its employees.
Superannuation plansContributions to defined contribution plans are recognised as an expense as they become payable. Prepaidcontributions are recognised as an asset to the extent that a cash refund or a reduction in the future paymentsis available.
Council participates in a Defined Benefit Plan under the Local Government Superannuation Scheme, however,when sufficient information to account for the plan as a defined benefit is not available and therefore Councilaccounts for its obligations to defined benefit plans on the same basis as its obligations to defined contributionplans, i.e. as an expense when it becomes payable – refer to Note 16 for more information.
(b) Borrowing costs
(i) Interest bearing liability costsInterest on loansTotal interest bearing liability costs expensed
(ii) Other borrowing costsDiscount adjustments relating to movements in provisions (other than ELE) – Remediation liabilitiesTotal other borrowing costsTOTAL BORROWING COSTS EXPENSED
Accounting policy for borrowing costsBorrowing costs incurred for the construction of any qualifying asset are capitalised during the period of time thatis required to complete and prepare the asset for its intended use or sale. Other borrowing costs are expensed.
(929)
42 81
2017
(859)
105
375 4,205
5,355
66
339 549
61
81 42
155 108
4,743
2018
505
66
43
97
74
65
2017
59
66
11–
4,559
10
4,426
2018
5,602 13
33
–
74
X8A11T
X8A12T
X8A19T
page 21

Financial Statements 2018
Dungog Shire Council
Notes to the Financial Statements for the year ended 30 June 2018
Note 4. Expenses from continuing operations (continued)
$ ’000
(c) Materials and contracts
Raw materials and consumablesContractor and consultancy costsAuditors remuneration (2)
Legal expenses: – Legal expenses: planning and development – Legal expenses: otherOperating leases: – Operating lease rentals: minimum lease payments (1)
Total materials and contractsLess: capitalised costsTOTAL MATERIALS AND CONTRACTS
Operating leasesLeases in which a significant portion of the risks and rewards of ownership arenot transferred to Council as lessee are classified as operating leases. Paymentsmade under operating leases (net of any incentives received from the lessor) arecharged to the income statement on a straight-line basis over the period of the lease.
1. Operating lease payments are attributable to:Computers
2. Auditor remunerationDuring the year the following fees were paid or payable for services provided by theauditor of Council, related practices and non-related audit firms
Auditors of the Council – NSW Auditor-General:
(i) Audit and other assurance servicesAudit and review of financial statementsRemuneration for audit and other assurance servicesTotal Auditor-General remuneration
Total Auditor remuneration
38
39
7,137
38
38
68 79
2017
5 683 25
(559) (437)
6,293
3,977
103
12
4,414
4,171
35
35 39
38 68 68
38
39
6,578
68
68
35
2018
X8A13T
page 22
Financial Statements 2018
Dungog Shire Council
Notes to the Financial Statements for the year ended 30 June 2018
Note 4. Expenses from continuing operations (continued)
$ ’000
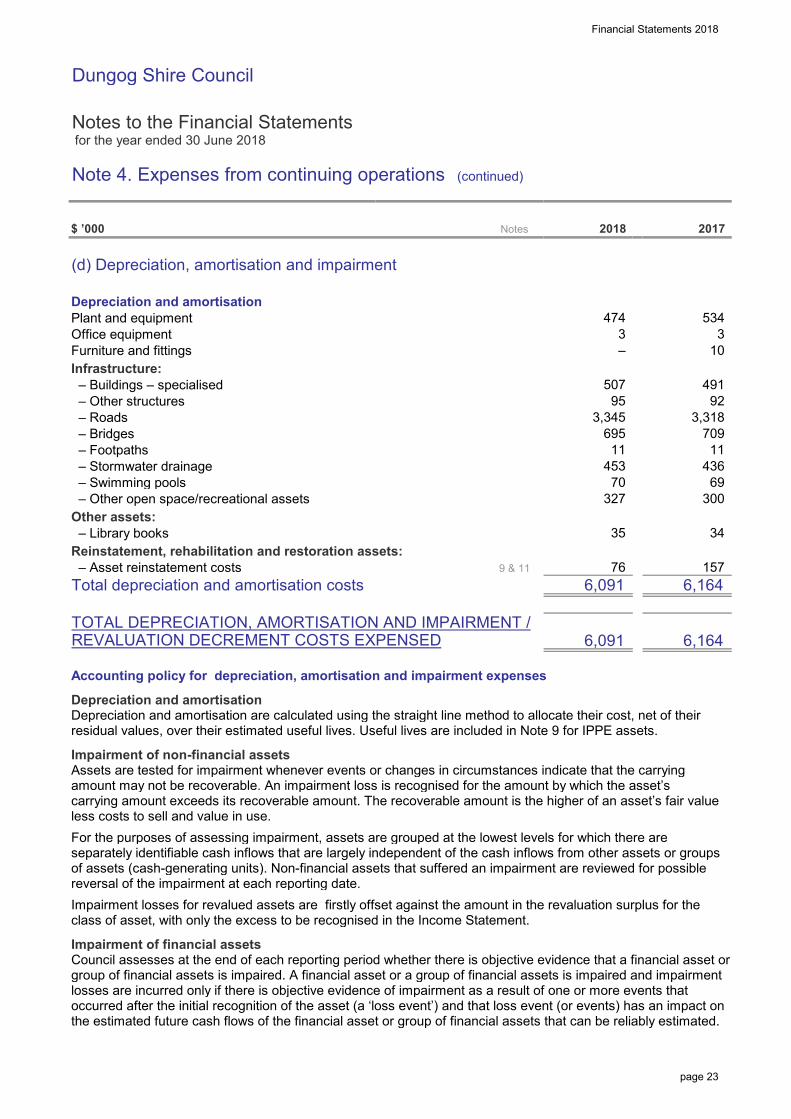
(d) Depreciation, amortisation and impairment
Depreciation and amortisationPlant and equipmentOffice equipmentFurniture and fittingsInfrastructure: – Buildings – specialised – Other structures – Roads – Bridges – Footpaths – Stormwater drainage – Swimming pools – Other open space/recreational assetsOther assets: – Library booksReinstatement, rehabilitation and restoration assets: – Asset reinstatement costsTotal depreciation and amortisation costs
TOTAL DEPRECIATION, AMORTISATION AND IMPAIRMENT /REVALUATION DECREMENT COSTS EXPENSED
Accounting policy for depreciation, amortisation and impairment expenses
Depreciation and amortisationDepreciation and amortisation are calculated using the straight line method to allocate their cost, net of theirresidual values, over their estimated useful lives. Useful lives are included in Note 9 for IPPE assets.
Impairment of non-financial assetsAssets are tested for impairment whenever events or changes in circumstances indicate that the carryingamount may not be recoverable. An impairment loss is recognised for the amount by which the asset’scarrying amount exceeds its recoverable amount. The recoverable amount is the higher of an asset’s fair valueless costs to sell and value in use.For the purposes of assessing impairment, assets are grouped at the lowest levels for which there areseparately identifiable cash inflows that are largely independent of the cash inflows from other assets or groupsof assets (cash-generating units). Non-financial assets that suffered an impairment are reviewed for possiblereversal of the impairment at each reporting date.Impairment losses for revalued assets are firstly offset against the amount in the revaluation surplus for theclass of asset, with only the excess to be recognised in the Income Statement.
Impairment of financial assetsCouncil assesses at the end of each reporting period whether there is objective evidence that a financial asset orgroup of financial assets is impaired. A financial asset or a group of financial assets is impaired and impairmentlosses are incurred only if there is objective evidence of impairment as a result of one or more events thatoccurred after the initial recognition of the asset (a ‘loss event’) and that loss event (or events) has an impact onthe estimated future cash flows of the financial asset or group of financial assets that can be reliably estimated.
709
–
6,164
491
2017
11
69
157
300
34
6,091
6,164
70
35
76
6,091
507
453
327
3,345
9 & 11
3
Notes
3,318
534
92
436
2018
474
95
695
3
11
10
X8A14T
X8A15T
page 23

Financial Statements 2018
Dungog Shire Council
Notes to the Financial Statements for the year ended 30 June 2018
Note 4. Expenses from continuing operations (continued)
$ ’000
(e) Other expenses
AdvertisingAgency collection costs – Australia PostCommissionsContributions/levies to other levels of government – NSW RB – NSW rural fire service levy – Waste levyCouncillor expenses – mayoral feeCouncillor expenses – councillors’ feesCouncillors’ expenses (incl. mayor) – other (excluding fees above)Donations, contributions and assistance to other organisations (Section 356)Electricity and heatingFees and chargesInsuranceNewcastle regional libraryPostagePrinting and stationeryStreet lightingSubscriptions and publicationsTelephone and communicationsValuation feesWeight of loads co-operativeOtherTOTAL OTHER EXPENSES
Accounting policy for other expensesOther expenses are recorded on an accruals basis as the Council receives the goods or services.
2
288
6
15
1,947
16
77
75
39
76
326 14 13
103
99 8 12
31
390
26 17 23
2,231 360
2018
–
289
45 13
1
106
20
Notes 2017
– 92
52
39
289 30 32
64
121
15
11
520
25
1
44
343
10
X8A16T
page 24

Financial Statements 2018
Dungog Shire Council
Notes to the Financial Statements for the year ended 30 June 2018
Note 5. Gains or losses from the disposal of assets
$ ’000
Plant and equipmentProceeds from disposal – plant and equipmentLess: carrying amount of plant and equipment assets sold/written offNet gain/(loss) on disposal
InfrastructureLess: carrying amount of infrastructure assets sold/written offNet gain/(loss) on disposal
Real estate assets held for saleProceeds from disposal – real estate assetsLess: carrying amount of real estate assets sold/written offNet gain/(loss) on disposal
NET GAIN/(LOSS) ON DISPOSAL OF ASSETS
Accounting policy for disposal of assetsThe gain or loss on sale of an asset is determined when control of the asset has irrevocably passed to thebuyer and the asset is derecognised.
Note 6(a). Cash and cash equivalent assets
Cash and cash equivalentsCash on hand and at bankCash-equivalent assets – Deposits at call – Short-term depositsTotal cash and cash equivalents
Accounting policy for cash and cash equivalentsFor Statement of Cash Flow presentation purposes, cash and cash equivalents includes cash on hand; depositsheld at call with financial institutions; other short-term, highly liquid investments with original maturities of threemonths or less that are readily convertible to known amounts of cash and which are subject to an insignificantrisk of changes in value; and bank overdrafts. Bank overdrafts are shown within borrowings in current liabilitieson the Statement of Financial Position.
8
2018
(4) (98)
(1,150)
(240)
(1,174) (1,174)
28
2017
268
(1,055)
9
Notes
–
(387) (44)
94
665 363
551 8,500
(1,099)
–
(1,055)
9
–
503
1,168 –
343
9,414
X8A0T
X8A10T
page 25

Financial Statements 2018
Dungog Shire Council
Notes to the Financial Statements for the year ended 30 June 2018
Note 6(b). Investments
$ ’000
Investmentsa. ‘At fair value through the profit and loss’– ‘Designated at fair value on initial recognition’b. ‘Held to maturity’Total investments
TOTAL CASH ASSETS, CASHEQUIVALENTS AND INVESTMENTS
NCD’s, FRN’s (with maturities > 3 months)Total
Held to maturity investmentsLong term depositsTotal
Accounting policy for investments
ClassificationCouncil classifies its financial assets in the following categories: financial assets at fair value through profit orloss; loans and receivables; held-to-maturity investments; and available-for-sale financial assets. Theclassification depends on the purpose for which the investments were acquired. Management determines theclassification of its investments at initial recognition and, in the case of assets classified as held-to-maturity,re-evaluates this designation at each reporting date.
(a) Financial assets at fair value through profit or lossFinancial assets at fair value through profit or loss are financial assets held for trading. A financial asset isclassified in this category if acquired principally for the purpose of selling in the short-term. Assets in thiscategory are held at fair value with changes in value taken through profit or loss at each reporting period.
(b) Held to maturity investmentsHeld-to-maturity investments are non-derivative financial assets with fixed or determinable payments and fixedmaturities that Council’s management has the positive intention and ability to hold to maturity. Assets in thiscategory are measured at amortised cost.
Recognition and de-recognition Regular purchases and sales of financial assets are recognised on trade-date: the date on which Councilcommits to purchase or sell the asset. Investments are initially recognised at fair value plus transaction costsfor all financial assets not carried at fair value through profit or loss. Financial assets carried at fair value throughprofit or loss are initially recognised at fair value and transaction costs are expensed in the income statement.Investments are derecognised when the rights to receive cash flows from the financial assets have expired orhave been transferred and Council has transferred substantially all the risks and rewards of ownership.
When securities classified as available-for-sale are sold, the accumulated fair value adjustments recognised inequity are included in the income statement as gains and losses from investment securities.
2017Current
10,168
2018
– – 7,761 –
– 14,164
–
–
8,500
500
Financial assets at fair value through the profit and loss
4,750
7,761
Non-current 2017
Current
4,750
–
7,761
–
7,761
8,500
7,761
500
500
2018
9,000
Non-current
– –
8,500 –
– 4,750 4,750
–
X8A1T
page 26

Financial Statements 2018
Dungog Shire Council
Notes to the Financial Statements for the year ended 30 June 2018
Note 6(c). Restricted cash, cash equivalents and investments – details
$ ’000
Total cash, cash equivalentsand investments
attributable to:External restrictions (refer below)Internal restrictions (refer below)Unrestricted
$ ’000
Details of restrictionsExternal restrictions – included in liabilitiesSpecific purpose unexpended loans – generalExternal restrictions – included in liabilities
External restrictions – otherDeveloper contributions – generalSpecific purpose unexpended grantsDomestic waste managementBike pathDeposits and retentionsKerb and gutterPavementRail services australiaRLCIP infrastructure fundingExternal restrictions – otherTotal external restrictions
Internal restrictionsPlant and vehicle replacementEmployees leave entitlementBuildings and groundsDiscountinued funds transferInsurance equalisationOther waste managementRB unexpendedSettlement for the agedShire propertiesSpecial projectsTown fundsTotal internal restrictionsTOTAL RESTRICTIONS
8 8
39 1 1
701
8,834 9,072
– –
10,168
Current 2018
Non-current Current
2,050
1,161
238
5,716
8,226
195
1,620
6,588
112
6,237
220
761
421 416
170 162
1,042
749 749
1,495
268 268 386 333
112 2,391
17,298
351
7,324
2018
144
–
7,761 –
252 14,164
631 8,226
7,761
Notes 2018
5,088
351
1,311
351
7,761
–
–
10,168
14,164
54 54
238
7,324 6,588
Non-current
2017
192
2017
–
10 10
13,912
39
597 868
1,659
2017
X8A20T
page 27

Financial Statements 2018
Dungog Shire Council
Notes to the Financial Statements for the year ended 30 June 2018
Note 7. Receivables
$ ’000
PurposeRates and annual chargesUser charges and feesPrivate worksAccrued revenues – Other income accrualsDeferred debtorsHunter Water Corp – water main relocatioNet GST receivableKerb and gutteringRates legal costs recoveryRMS (formerly RTA)ContributionsOther debtorsTotal
Less: provision for impairmentNil
TOTAL NET RECEIVABLES
There are no restrictions applicable to the above assets.
Accounting policy for receivables
Recognition and measurementLoans and receivables are non-derivative financial assets with fixed or determinable payments that are not quotedin an active market. They are included in current assets, except for those with maturities greater than 12 monthsafter the reporting date which are classified as non-current assets. Loans and receivables are included inreceivables (Note 7) in the Statement of Financial Position. Receivables arerecognised initially at fair value and subsequently measured at amortised cost using the effective interestmethod, less provision for impairment. Receivables are generally due for settlement within 30 days.
Cash flows relating to short-term receivables are not discounted if the effect of discounting is immaterial.
–
Notes
10
456
2017
– 427
2018
75
9 –
Current Non-current
11
–
–
11
103
–
797 1,812
44
1,812 797 53
– 78
12
– –
200
– 9
2
–
–
56 –
–
–
–
–
–
116
60
–
–
–
53
–
–
56
141
56
– 811 –
26
8
Non-current
53 –
Current
X8A2T
page 28

Financial Statements 2018
Dungog Shire Council
Notes to the Financial Statements for the year ended 30 June 2018
Note 7. Receivables (continued)
Accounting policy for receivables (continued)
ImpairmentFor loans and receivables the amount of the loss is measured as the difference between the asset’s carryingamount and the present value of estimated future cash flows (excluding future credit losses that have not beenincurred) discounted at the financial asset’s original effective interest rate. The carrying amount of the asset isreduced and the amount of the loss is recognised in profit or loss.
Collectability of receivables is reviewed on an on-going basis. Debts that are known to be uncollectible are writtenoff by reducing the carrying amount directly. An allowance account (provision for impairment of receivables) isused when there is objective evidence that Council will not be able to collect all amounts due according to theoriginal terms of the receivables.
Significant financial difficulties of the debtor, probability that the debtor will enter bankruptcy or financialreorganisation, and default or delinquency in payments (more than 30 days overdue) are considered indicatorsthat the receivable is impaired. When a receivable for which an impairment allowance had been recognisedbecomes uncollectable in a subsequent period it is written off against the allowance account. Subsequentrecoveries of amounts previously written off are credited against other expenses in the Income statement.
Note 8. Inventories and other assets
$ ’000
(a) Inventories
(i) Inventories at costReal estate for resale (refer below)Stores and materialsTotal inventories at cost
TOTAL INVENTORIES
(b) Other assets
PrepaymentsTOTAL OTHER ASSETS
Externally restricted assetsThere are no restrictions applicable to the above assets.
Notes
557
–
2018 2017
55 – –
–
26 26
38 55 –
Current
26
26 399
26
26
536
38
536
Current
557
Non-current
– 158 54
2017
482
2018Non-current
X8A3T
page 29

Financial Statements 2018
Dungog Shire Council
Notes to the Financial Statements for the year ended 30 June 2018
Note 8. Inventories and other assets (continued)
$ ’000
(i) Other disclosures
(a) Details for real estate developmentResidentialTotal real estate for resale(Valued at the lower of cost and net realisable value)
Represented by:Acquisition costsTotal costsTotal real estate for resale
Movements:Real estate assets at beginning of the year – Purchases and other costs – WDV of sales (expense)Total real estate for resale
Accounting policy
Raw materials and stores, work in progress and finished goodsRaw materials and stores, work in progress and finished goods are stated at the lower of cost and netrealisable value. Costs are assigned to individual items of inventory on basis of weighted average costs. Costsof purchased inventory are determined after deducting rebates and discounts. Net realisable value is theestimated selling price in the ordinary course of business less the estimated costs of completion and theestimated costs necessary to make the sale.
Land held for resale/capitalisation of borrowing costsLand held for resale is stated at the lower of cost and net realisable value. Cost is assigned by specificidentification and includes the cost of acquisition, and development and borrowing costs during development.When development is completed borrowing costs and other holding charges are expensed as incurred.
Borrowing costs included in the cost of land held for resale are those costs that would have been avoided if theexpenditure on the acquisition and development of the land had not been made. Borrowing costs incurred whileactive development is interrupted for extended periods are recognised as expenses.
54
26
(1) –
26
54
54 54
54
26 26
– 26
158
158
Current
26 54
Non-current
153 –
26
–
158
104
2018
158
54
(98) – 5
26
26
26
Notes2017
158
26
Current Non-current
158
26
26
26
X8A4T
page 30

Financial Statements 2018
Dungog Shire Council
Notes to the Financial Statements for the year ended 30 June 2018
Note 9(a). Infrastructure, property, plant and equipment
Asset class
$ ’000
Capital work in progress 2,237 – 2,237 965 – – – (2,237) – – 965 – 965 Plant and equipment 9,249 5,632 3,617 924 203 (387) (474) – – – 9,583 5,701 3,882 Office equipment 625 616 9 – – – (3) – – – 625 619 6 Furniture and fittings 252 252 – – 1 – – – – – 252 252 – Land: – Operational land 6,643 – 6,643 – – – – – – 333 6,976 – 6,976 – Community land 3,760 – 3,760 – – – – – – 1,711 5,471 – 5,471 Infrastructure: – Buildings – specialised 30,201 22,937 7,264 125 – – (507) – – 1,006 32,389 24,503 7,886 – Other structures 1,647 691 956 – – – (95) – (14) – 1,606 759 847 – Roads 213,379 77,661 135,718 4,226 – (1,055) (3,345) 664 – – 217,045 80,840 136,205 – Bridges 55,625 32,951 22,674 – – – (695) – – – 55,625 33,646 21,979 – Footpaths 1,242 230 1,012 – – – (11) – – – 1,242 241 1,001 – Bulk earthworks (non-depreciable) 90,356 – 90,356 841 – – – 749 – – 91,946 – 91,946 – Stormwater drainage 33,653 10,428 23,225 535 – – (453) 823 – – 35,010 10,881 24,129 – Swimming pools 1,719 1,283 436 – – – (70) – – 66 2,525 2,093 432 – Other open space/recreational assets 5,535 2,983 2,552 33 5 – (327) – (172) – 5,978 3,889 2,089 Other assets: – Library books 753 616 137 – 38 – (35) – – – 790 651 139 Reinstatement, rehabilitation and restoration assets (refer Note 11): – Tip & quarry assets 2,381 851 1,530 – – – (76) – – – 2,381 927 1,454 TOTAL INFRASTRUCTURE,PROPERTY, PLANT AND EQUIP.
Renewals are defined as the replacement of existing assets (as opposed to the acquisition of new assets).
(0) 7,649 (1,442) 247 (6,091) 459,257 157,131 302,126 305,407 (186) 3,116 470,409 165,002
as at 30/6/2018
Net carrying amount
Asset movements during the reporting period
Accumulated depreciation
and impairment
as at 30/6/2017
WIPtransfers
Additionsnew assets
Additionsrenewals
Carrying value
of disposals
Revaluation decrements
to equity (ARR)
Revaluation increments
to equity (ARR)
Net carrying amount
Accumulated depreciation
and impairment
Gross carrying amount
Gross carrying amount
Depreciation expense
X9A0T
X9A1T
page 31

Financial Statements 2018
Dungog Shire Council
Notes to the Financial Statements for the year ended 30 June 2018
Note 9(a). Infrastructure, property, plant and equipment (continued)
Accounting policy for infrastructure, property, plant and equipment
Infrastructure, property, plant and equipment are held at fair value. Independent valuations are performed atleast every five years, however the carrying amount of assets is assessed at each reporting date to confirm that it is not materially different from current fair value.
Increases in the carrying amounts arising on revaluation are credited to the asset revaluation reserve. To theextent that the increase reverses a decrease previously recognising profit or loss relating to that asset class, theincrease is first recognised as profit or loss. Decreases that reverse previous increases of assets in the sameclass are first charged against revaluation reserves directly in equity to the extent of the remaining reserveattributable to the class; all other decreases are charged to the Income Statement.
Subsequent costs are included in the asset’s carrying amount or recognised as a separate asset, as appropriate,only when it is probable that future economic benefits associated with the item will flow to Council and the costof the item can be measured reliably. All other repairs and maintenance are charged to the income statementduring the financial period in which they are incurred.
Land is not depreciated. Depreciation on other assets is calculated using the straight line method to allocatetheir cost, net of their residual values, over their estimated useful lives as follows:
Plant and equipment Years Other equipment YearsOffice equipment 5 to 10 Playground equipment 5 to 15 Office furniture 10 to 20 Benches, seats etc. 10 to 20 Computer equipment 4Vehicles & Road Making Equipment 5 to 8 BuildingsHeavy plant/road making equipment 5 to 8 Buildings: masonry 50 to 100 Other plant and equipment 5 to 15 Buildings: other 20 to 40
Stormwater assetsDrains 80 to 100 Culverts 50 to 80 Flood control structures 80 to 100
Transportation assets Other infrastructure assetsSealed roads: surface 20 Bulk earthworks InfiniteSealed roads: structure 50 Swimming pools 80Sealed roads: other 30 to 60 Other open space/recreational assets 50Unsealed roads 20 Other infrastructure 25Bridge: concrete 100 Flood control structures 80 to 100Bridge: timber 80Road pavements 60Kerb, gutter and footpaths 40
The assets’ residual values and useful lives are reviewed, and adjusted if appropriate, at each reporting date.Gains and losses on disposals are determined by comparing proceeds with carrying amount. These are includedin the Income statement.
page 32

Financial Statements 2018
Dungog Shire Council
Notes to the Financial Statements for the year ended 30 June 2018
Note 9(a). Infrastructure, property, plant and equipment (continued)
Accounting policy for infrastructure, property, plant and equipment (continued)
Land under roadsLand under roads is land under roadways and road reserves including land under footpaths, nature strips andmedian strips.
Land under roads acquired after 1 July 2008 is recognised in accordance with AASB 116 Property, Plantand Equipment.
Crown reservesCrown Reserves under Council’s care and control are recognised as assets of the Council. While ownership ofthe reserves remains with the Crown, Council retains operational control of the reserves and is responsible fortheir maintenance and use in accordance with the specific purposes to which the reserves are dedicated.Improvements on Crown Reserves are also recorded as assets, while maintenance costs incurred by Counciland revenues relating to the reserves are recognised within Council’s Income Statement.
Rural Fire Service assetsUnder section 119 of the Rural Fire Services Act 1997 (NSW) , “all fire fighting equipment purchased orconstructed wholly or from money to the credit of the Fund is to be vested in the council of the area for or onbehalf of which the fire fighting equipment has been purchased or constructed”.
Until such time as discussions on this matter have concluded and the legislation changed, Council willrecognise rural fire service assets including land, buildings, plant and vehicles.
Note 9(b). Externally restricted infrastructure, property, plant and equipment
24,434 35,497 11,063
2017Gross
carrying amount
Accumulated depn. and
impairment
Net carrying amount
451 153 298
52
10,428 24,166
$ ’000 Class of asset
2018
Plant and equipment 138
Other restricted assets
Domestic waste management
183 66
86
Total DWM128 451
35,046 10,880
Other assets
Buildings Other structures
Total other restrictions
62
183 26 –
Gross carrying amount
Accumulated depn. and
impairment
Net carrying amount
154 2
29
10,880
2
24,166 – Stormwater drainage
268
35,046
183 2
TOTAL RESTRICTED IPP&E
24,047
157
24,047 10,428
138 67 71
34,475
2 128
– 58
34,926 10,581 24,345
34,475
70
X10A10T
page 33

Financial Statements 2018
Dungog Shire Council
Notes to the Financial Statements for the year ended 30 June 2018
Note 10. Payables and borrowings
$ ’000
PayablesGoods and services – operating expenditureAccrued expenses: – Other expenditure accrualsSecurity bonds, deposits and retentionsTotal payables
Income received in advancePayments received in advanceTotal income received in advance
BorrowingsLoans – secured 1
Government advancesTotal borrowings
TOTAL PAYABLES AND BORROWINGS
(a) Payables and borrowings relating to restricted assetsThere are restricted assets, in relation to a $238k unexpended loan facility, applicable to the above payables and borrowings
1. Loans are secured over the general rating income of Council Disclosures on liability interest rate risk exposures, fair value disclosures and security can be found in Note 17.
(b) Changes in liabilities arising from financing activities
TOTAL 1,398 (152) Government advances 5 (2) – – – 3 Loans – secured
Class of borrowings
Openingbalance
as at 1/7/17Cash flows
2017
1,393
144
28 –
886 195
–
–
881 –
2018
688
– 3
–
Othernon-cash
movements
–
1,101 142
–
–
142 2
Closingbalance
as at 30/6/18
1,246
2018
(150)
Fair value changes
2017
–
Acquisition
1,243
1,058 1,102
1,251
24 –
687
191
1,049
3 1,254
–
24
–
Current Non-current Non-current Current
3
2
28
1 144
1,254
– –
–
Non-cash changes
1,102
–
–
X10A1T
X10A2T
page 34

Financial Statements 2018
Dungog Shire Council
Notes to the Financial Statements for the year ended 30 June 2018
Note 10. Payables and borrowings (continued)
$ ’000
(c) Financing arrangements
(i) Unrestricted access was available at balance date to the following lines of credit:
Bank overdraft facilities (1)
Credit cards/purchase cardsTotal financing arrangements
Drawn facilities as at balance date:– Credit cards/purchase cardsTotal drawn financing arrangements
Undrawn facilities as at balance date:– Bank overdraft facilities– Credit cards/purchase cardsTotal undrawn financing arrangements
1. The bank overdraft facility may be drawn at any time and may be terminated by the bank without notice.
Accounting policy for payables and borrowings
PayablesThese amounts represent liabilities for goods and services provided to the Council prior to the end of financialyear that are unpaid. The amounts are unsecured and are usually paid within 30 days of recognition.
BorrowingsBorrowings are initially recognised at fair value, net of transaction costs incurred. Borrowings are subsequentlymeasured at amortised cost. Any difference between the proceeds (net of transaction costs) and theredemption amount is recognised in the income statement over the period of the borrowings using the effectiveinterest method. Fees paid on the establishment of loan facilities are recognised as transaction costs of theloan to the extent that it is probable that some or all of the facility will be drawn down. In this case, the fee isdeferred until the draw down occurs. To the extent there is no evidence that it is probable that some or all of thefacility will be drawn down, the fee is capitalised as a prepayment for liquidity services and amortised over theperiod of the facility to which it relates.
Borrowings are removed from the Statement of Financial Position when the obligation specified in the contractis discharged, cancelled or expired. The difference between the carrying amount of a financial liability that hasbeen extinguished or transferred to another party and the consideration paid, including any non-cash assetstransferred or liabilities assumed, is recognised in other income or finance cost.
Borrowings are classified as current liabilities unless Council has an unconditional right to defer settlement ofthe liability for at least 12 months after the reporting date.
30
4 –
2018
300
4
300 300
330 326
–
30
30
330 330
300
2017
26
page 35
Financial Statements 2018
Dungog Shire Council
Notes to the Financial Statements for the year ended 30 June 2018
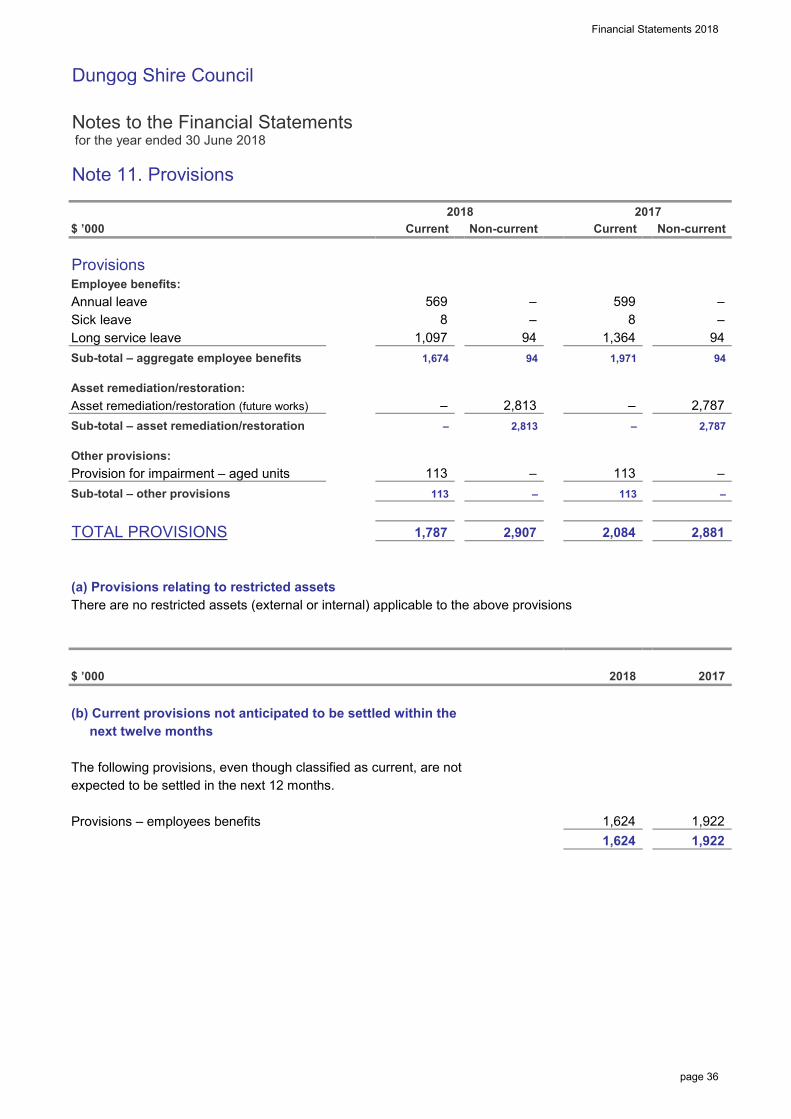
Note 11. Provisions
$ ’000
ProvisionsEmployee benefits:Annual leaveSick leaveLong service leaveSub-total – aggregate employee benefits
Asset remediation/restoration:Asset remediation/restoration (future works)
Sub-total – asset remediation/restoration
Other provisions:Provision for impairment – aged unitsSub-total – other provisions
TOTAL PROVISIONS
(a) Provisions relating to restricted assetsThere are no restricted assets (external or internal) applicable to the above provisions
$ ’000
(b) Current provisions not anticipated to be settled within the next twelve months
The following provisions, even though classified as current, are notexpected to be settled in the next 12 months.
Provisions – employees benefits
599 –
1,364
2,907
2,813
113
2,813
8 8
2,787 – 2,787
–
–
2017
1,674
2018Non-current Current
1,922
2,881
–
–
113 –
1,971
569
Non-current 2017
2,084 1,787
94
–
94 94
–
Current
1,624
–
–
1,097
1,624
113 113 –
1,922
94
2018
X10A3T
page 36

Financial Statements 2018
Dungog Shire Council
Notes to the Financial Statements for the year ended 30 June 2018
Note 11. Provisions (continued)
$ ’000
(c) Description of and movements in provisions
At beginning of yearOther
At beginning of yearOther
At beginning of yearChanges to provision:Additional provisions
At beginning of yearChanges to provision:Unwinding of discount
9 – (145) – – (136) Total ELE provisions at end of year 599
Total other provisions at end of year
Impairmentaged units
Other provisions
Asset remediation
2,829
Self-insurance
–
–
2,926
Self-insurance
Asset remediation Total
– 2,813
2017
– 1,458
Other (enter details here...)
26
8
(30) (267) – – – 1,458
Total ELE provisions at end of year 1,191 –
–
569
2,900
Long service leave
ELE on-costs
Other employee
benefits
ELE on-costs
8
Other employee
benefits
ELE provisions
–
2,065
– 2,201
Total
8
(297)
Other (enter details here...)
Other (enter details here...)
Other provisions
2017
1,768 –
113 –
Sick leave
Long service leave
Annual leave
26
–
590
2018 Total Sick leave
2018
2,065
1,603 –
ELE provisions
Other (enter details here...)
Impairmentaged units
599
Annual leave
– –
–
113
Total
8
2,787
–
2,716
71
–
113
71 Total other provisions at end of year – – 113 – 2,787 2,900
– –
page 37
Financial Statements 2018
Dungog Shire Council
Notes to the Financial Statements for the year ended 30 June 2018
Note 11. Provisions (continued)
Nature and purpose of non-employee benefit provisions
Asset remediationCouncil has a legal/public obligation to make, restore, rehabilitate and reinstate the council tip and quarry.
Accounting policy for provisionsProvisions are recognised when Council has a present legal or constructive obligation as a result of past events,it is probable that an outflow of resources will be required to settle the obligation, and the amount has beenreliably estimated.
Where there are a number of similar obligations, the likelihood that an outflow will be required in settlement isdetermined by considering the class of obligations as a whole. A provision is recognised even if the likelihoodof an outflow with respect to any one item included in the same class of obligations may be small.
Provisions are measured at the present value of management’s best estimate of the expenditure required tosettle the present obligation at the reporting date. The discount rate used to determine the present valuereflects current market assessments of the time value of money and the risks specific to the liability. Theincrease in the provision due to the passage of time is recognised as interest expense.
Employee benefits
Short-term obligationsLiabilities for wages and salaries, including non-monetary benefits, annual leave and accumulating sick leaveexpected to be wholly settled within 12 months after the end of the period in which the employees render therelated service are recognised in respect of employees' services up to the end of the reporting period and aremeasured at the amounts expected to be paid when the liabilities are settled. The liability for annual leaveand accumulating sick leave is recognised in the provision for employee benefits. All other short-termemployee benefit obligations are presented as payables.
Other long-term employee benefit obligationsThe liability for long service leave and annual leave that is not expected to be wholly settled within 12 monthsafter the end of the period in which the employees render the related service is recognised in the provision foremployee benefits and measured as the present value of expected future payments to be made in respect ofservices provided by employees up to the end of the reporting period using the projected unit credit method.
Consideration is given to expected future wage and salary levels, experience of employee departures, andperiods of service. Expected future payments are discounted using market yields at the end of the reportingperiod on national government bonds with terms to maturity and currency that match, as closely as possible,the estimated future cash outflows.
The obligations are presented as current liabilities in the Statement of Financial Position if the Council doesnot have an unconditional right to defer settlement for at least 12 months after the reporting date, regardless ofwhen the actual settlement is expected to occur.
Provisions for close-down and restoration, and environmental clean-up costs – tips and quarries
RestorationClose down and restoration costs include the dismantling and demolition of infrastructure and the removal ofresidual materials and remediation of disturbed areas. Estimated close down and restoration costs are providedfor in the accounting period when the obligation arising from the related disturbance occurs, whether this occursduring the development or during the operation phase, based on the net present value of estimated future costs.
Provisions for close down and restoration costs do not include any additional obligations which are expected toarise from future disturbance. The costs are estimated on the basis of a closure plan. The cost estimates are calculated annually during the life of the operation to reflect known developments, eg updated cost estimatesand revisions to the estimated lives of operations, and are subject to formal review at regular intervals
page 38

Financial Statements 2018
Dungog Shire Council
Notes to the Financial Statements for the year ended 30 June 2018
Note 11. Provisions (continued)
Provisions for close-down and restoration, and environmental clean-up costs – tips and quarries
RehabilitationWhere rehabilitation is conducted systematically over the life of the operation, rather than at the time of closure,provision is made for the estimated outstanding continuous rehabilitation work at each reporting date and thecost is charged to the Income Statement.
Provision is made for the estimated present value of the costs of environmental clean up obligations outstandingat the reporting date. These costs are charged to the Income Statement. Movements in the environmental cleanup provisions are presented as an operating cost, except for the unwinding of the discount which is shown as a borrowing cost.
Remediation procedures generally commence soon after the time the damage, remediation process and estimated remediation costs become known, but may continue for many years depending on the nature of the disturbance and the remediation techniques.
As noted above, the ultimate cost of environmental remediation is uncertain and cost estimates can vary inresponse to many factors including changes to the relevant legal requirements, the emergence of newrestoration techniques or experience at other locations. The expected timing of expenditure can also change, forexample in response to changes in quarry reserves or production rates. As a result there could be significantadjustments to the provision for close down and restoration and environmental clean up, which would affectfuture financial results.
Other movements in the provisions for close down and restoration costs, including those resulting from newdisturbance, updated cost estimates, changes to the estimated lives of operations and revisions to discountrates are capitalised within property, plant and equipment. These costs are then depreciated over the lives of theassets to which they relate.
Close down and restoration costs are a normal consequence of tip and quarry operations, and the majority ofclose down and restoration expenditure is incurred at the end of the life of the operations. Although the ultimatecost to be incurred is uncertain, Council estimates the respective costs based on feasibility and engineeringstudies using current restoration standards and techniques.
Note 12. Accumulated surplus, revaluation reserves, changes in accounting policies, changes in accounting estimates and errors
Nature and purpose of reserves
Infrastructure, property, plant and equipment revaluation reserveThe infrastructure, property, plant and equipment revaluation reserve is used to record increments /decrements of non-current asset values due to their revaluation.
X10A4T
X10A9T
page 39

Financial Statements 2018
Dungog Shire Council
Notes to the Financial Statements for the year ended 30 June 2018
Note 13. Statement of cash flows – additional information
$ ’000
(a) Reconciliation of cash assets
Total cash and cash equivalent assetsLess bank overdraftBalance as per the Statement of Cash Flows
(b) Reconciliation of net operating result to cash provided from operating activities
Net operating result from Income StatementAdjust for non-cash items:Depreciation and amortisationNet losses/(gains) on disposal of assetsUnwinding of discount rates on reinstatement provisionsShare of net (profits) or losses of associates/joint ventures
+/- Movement in operating assets and liabilities and other cash items:Decrease/(increase) in receivablesDecrease/(increase) in inventoriesDecrease/(increase) in other assetsIncrease/(decrease) in payablesIncrease/(decrease) in other accrued expenses payableIncrease/(decrease) in other liabilitiesIncrease/(decrease) in employee leave entitlementsIncrease/(decrease) in other provisionsNet cash provided from/(used in)operating activities from the Statement of Cash Flows
Note 14. Interests in other entities
$ ’000
Joint venturesTotal
9,414
2017
–
Notes
–
9,401 11,557
17 83
285
– 8
–
(1)
(136) (297) 29
(8) (86)
26
1,013
(596)
71
(33)
1,168
2018
9,414
344
1
6,164 1,150
–
6a
3,602
1,168
1,099
2,132
6,091
2018Council’s share of net assets
71 20172018
Council’s share of net income
71 86 86
13
157 8 8 157
2017
X10A0T
X10A5T
X10A6T
X10A11T
page 40

Financial Statements 2018
Dungog Shire Council
Notes to the Financial Statements for the year ended 30 June 2018
Note 14. Interests in other entities (continued)
$ ’000
Joint arrangements
(i) Joint ventures
Council has incorporated the following joint ventures into its consolidated financial statements.
(a) Net carrying amounts – Council’s share
Name of entityStrategic Services Australia LimitedTotal carrying amounts – material joint ventures
(b) Details
Name of entity Principal activity
(c) Relevant interests and fair values
Name of entityStrategic Services Australia Limited
(d) Summarised financial information for joint ventures
Statement of financial positionCurrent assetsCash and cash equivalentsOther current assetsNon-current assets
Current liabilities
Other current liabilitiesNon-current liabilities
Net assets
Reconciliation of the carrying amountOpening net assets (1 July)Profit/(loss) for the periodClosing net assetsCouncil’s share of net assets (%)Council’s share of net assets ($)
business
Quoted
5,469
Strategic Services Australia Limited
2,468
2018
2,447
n/a
Joint venture
2018
5,050 217
2,467
Interest in
Place of
1,393
308
1,068
1,738
2018
Strategic Services Australia Limited
4,128
20172.88%
voting power
7.69%
157
157
5,469
2017
71
method
7.69%2018 2017
n/a
Current financial liabilities (excluding trade and other payables and provisions)
Non-current financial liabilities (excluding trade and other payables and provisions)
2.88%
Proportion of
2.9% 2.9%71
20172.88%
477 682 2,575
3,001
471
219
ownership
71
outputsfair value2018
2017
2,139
157
2018
Interest in
2017
AccrualrelationshipNature of
To improve quality and efficiency oflocal government services in the Hunter region.
2.88%
Measurement
40
X10A8T
page 41

Financial Statements 2018
Dungog Shire Council
Notes to the Financial Statements for the year ended 30 June 2018
Note 14. Interests in other entities (continued)
$ ’000
Joint arrangements (cont'd)
(d) Summarised financial information for joint ventures (cont'd)
Statement of comprehensive incomeIncomeDepreciation and amortisationInterest expenseOther expensesProfit/(loss) from continuing operations
Profit/(loss) from discontinued operationsProfit/(loss) for period
Total comprehensive income
Share of income – Council (%)Profit/(loss) – Council ($)Total comprehensive income – Council ($)
Accounting policy for joint arrangementsThe Council has determined that it has only joint ventures
Joint venturesInterests in joint ventures are accounted for using the equity method in accordance with AASB128Investments in Associates and Joint Ventures . Under this method, the investment is initially recognised as acost and the carrying 'amount is increased or decreased to recognise the Council’s share of the profit or lossand other comprehensive income of the joint venture after the date of acquisition.
If the Council’s share of losses of a joint venture equals or exceeds its interest in the joint venture, the Councildiscontinues recognising its share of further losses.
The Council’s share in the joint venture’s gains or losses arising from transactions between itself and its jointventure are eliminated.
Adjustments are made to the joint venture’s accounting policies where they are different from those of theCouncil for the purpose of the consolidated financial statements.
(5,929)
2018
86 9
Strategic Services Australia Limited
(128)
3,001
(177) (221) (97)
7,454
–
9
308
3,001
2.9%
2017
308
526
6,555
86 2.9%
308
2,475
(6,623)
page 42

Financial Statements 2018
Dungog Shire Council
Notes to the Financial Statements for the year ended 30 June 2018
Note 15. Commitments for expenditure
$ ’000
(a) Capital commitments (exclusive of GST)
Capital expenditure committed for at the reporting date but notrecognised in the financial statements as liabilities:
Property, plant and equipmentPlant and equipmentTotal commitments
These expenditures are payable as follows:Within the next yearTotal payable
Sources for funding of capital commitments:Unrestricted general fundsTotal sources of funding
(b) Operating lease commitments (non-cancellable)
a. Commitments under non-cancellable operating leases at the reporting date, but not recognised as liabilities are payable:
Within the next yearLater than one year and not later than 5 yearsTotal non-cancellable operating lease commitments
b. Non-cancellable operating leases include the following assets:Computer and other plant/equipment.Contingent rentals may be payable depending on the condition of items or usage during the lease term.
Conditions relating to operating leases:– All operating lease agreements are secured only against the leased asset.– No lease agreements impose any financial restrictions on Council regarding future debt etc.
2018
– –
2017
51
–
51 – 51
13
3
51
–
2
17
–
4 1
51
51
X10A12T
page 43

Financial Statements 2018_
Dungog Shire Council Notes to the Financial Statements for the year ended 30 June 2018 Note 16. Contingencies and other assets/liabilities not recognised
page 44
LIABILITIES NOT RECOGNISED: 1. Guarantees (i) Defined benefit superannuation contribution plans Council participates in an employer-sponsored defined benefit superannuation scheme and makes contributions as determined by the superannuation scheme’s trustees. Member councils bear responsibility of ensuring there are sufficient funds available to pay out the required benefits as they fall due. While the scheme's most recent full actuarial review indicated that the net assets of the scheme were sufficient to meet the accrued benefits of the scheme's defined benefit member category, member councils are required to make contributions in future years where the scheme goes into deficit (as has occurred in previous years). The Local Government Superannuation Scheme however is unable to provide Council with an accurate estimate of any share of the net deficit and accordingly Council has not recorded any net liability from its defined benefit scheme obligations in accordance with AASB 119. Future planned contributions being made to the defined benefit scheme to rectify past (and projected) deficit positions will be recognised as an expense when they become payable – similar to the accounting for defined contributions plans. Member councils are treated as Pooled Employers for the purposes of AASB119. Pooled Employers are required to pay standard employer contributions and additional lump sum contributions to the Fund. The standard employer contributions were determined using the new entrant rate method under which a contribution rate sufficient to fund the total benefits over the working life-time of a typical new entrant is calculated. The current standard employer contribution rates are:
Division B 1.9 times employee contributions Division C 2.5% salaries Division D 1.64 times employee contributions
The additional lump sum contribution for each Pooled Employer is a share of the total additional contributions of $40.0 million per annum from 1 July 2017 for 4 years to 30 June 2021, apportioned according to each employer's share of the accrued liabilities as at 30 June 2017. These additional lump sum contributions are associated with current and former employees of other sponsoring employers and hence shares in the associated gains and losses (to the extent that they are not bourne by members). As such, there is not sufficient reliable information to allow each sponsoring employer to account for its proportionate share of the defined benefit obligation, sub-group assets and costs associated with the sub-group in the same way as it would for a single employer sponsored defined benefit plan. The amount of Council employer contributions to the defined benefit section of the Fund and recognised as an expense and disclosed as part of superannuation expenses at Note 4 (a) for the year ending 30 June 2018 was $171,356. The last valuation of the Fund was by the Actuary, Mr Richard Boyfield, FIAA on 12 December 2017, relating to the period ended 30 June 2017.

Financial Statements 2018_
Dungog Shire Council Notes to the Financial Statements for the year ended 30 June 2018 Note 16. Contingencies and other assets/liabilities not recognised (continued)
page 45
LIABILITIES NOT RECOGNISED (continued): 1. Guarantees (continued) (i) Defined benefit superannuation contribution plans (continued) Council's expected contributions to the Fund for the next annual reporting period is $126,670.
The estimated employer reserves financial position for the Pooled Employers at 30 June 2018 is:
Employer reserves only * $ millions Asset Coverage Assets 1,817.8 Past Service Liabilities 1,787.5 101.7% Vested Benefits 1,778.0 102.2%
* excluding member accounts and reserves in both assets and liabilities. The key economic long term assumptions used to calculate the present value of accrued benefits are:
Investment return 6.0% per annum Salary inflation * 3.5% per annum Increase in CPI 2.5% per annum * Plus promotional increases
The contribution requirements may vary from the current rates if the overall sub-group experience is not in line with the actuarial assumptions in determining the funding program, however any adjustment to the funding program would be the same for all sponsoring employers in the Pooled Employers group. Please note that the estimated employer reserves financial position above is a preliminary calculation and once all the relevant information has been received by the Funds Actuary, the 2018 triennial review will be completed around December 2018. Council's additional lump sum contribution is around 0.16% of the total additional lump sum contributions for all Pooled Employers (of $40m each year from 1 July 2017 to 30 June 2021) provides an indication of the level of participation of Council compared with other employers in the Pooled Employer sub-group.

Financial Statements 2018
Dungog Shire Council
Notes to the Financial Statements for the year ended 30 June 2018
Note 16. Contingencies and other liabilities/assets not recognised (continued)
LIABILITIES NOT RECOGNISED (continued):
1. Guarantees (continued)
(ii) Statewide Limited
Council is a member of Statewide Mutual, a mutual pool scheme providing liability insurance to local government.
Membership includes the potential to share in either the net assets or liabilities of the fund depending on its pastperformance. Council’s share of the net assets or liabilities reflects Council’s contributions to the pool and the resultof insurance claims within each of the fund years.
The future realisation and finalisation of claims incurred but not reported to 30/6 this year may result in futureliabilities or benefits as a result of past events that Council will be required to fund or share in respectively.
(iii) StateCover Limited
Council is a member of StateCover Mutual Limited and holds a partly paid share in the entity.
StateCover is a company providing workers compensation insurance cover to the NSW local government industryand specifically Council.
Council has a contingent liability to contribute further equity in the event of the erosion of the company’s capitalbase as a result of the company’s past performance and/or claims experience or as a result of any increasedprudential requirements from APRA.
These future equity contributions would be required to maintain the company’s minimum level of net assets inaccordance with its licence requirements.
(iv) Strategic Services Australia Limited (previously Hunter Councils Limited)
Council is joint guarantor for a loan of $2.86 million which was drawn down on the 1st July 2003 by Hunter CouncilsLimited. The total loan approved was for $3.4 million of which Council's exposure will be $97,795.
2. Other liabilities
(i) Third party claims
The Council is involved from time to time in various claims incidental to the ordinary course of business includingclaims for damages relating to its services.
Council believes that it is appropriately covered for all claims through its insurance coverage and does not expectany material liabilities to eventuate.
ASSETS NOT RECOGNISED:
(i) Infringement notices/fines
Fines and penalty income, the result of Council issuing infringement notices is followed up and collected bythe Infringement Processing Bureau.
Council’s revenue recognition policy for such income is to account for it as revenue on receipt.
Accordingly, at year end, there is a potential asset due to Council representing issued but unpaid infringementnotices.
Due to the limited information available on the status, value and duration of outstanding notices, Council isunable to determine the value of outstanding income.
page 46
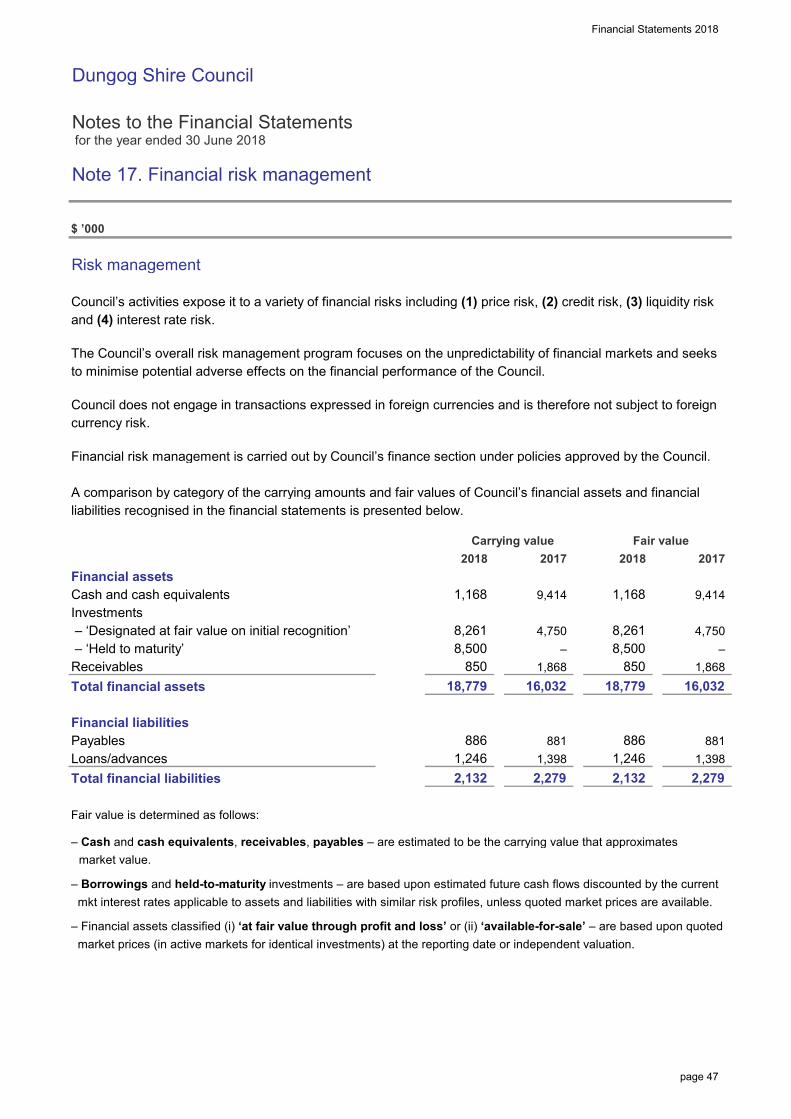
Financial Statements 2018
Dungog Shire Council
Notes to the Financial Statements for the year ended 30 June 2018
Note 17. Financial risk management
$ ’000
Risk management
Council’s activities expose it to a variety of financial risks including (1) price risk, (2) credit risk, (3) liquidity riskand (4) interest rate risk.
The Council’s overall risk management program focuses on the unpredictability of financial markets and seeksto minimise potential adverse effects on the financial performance of the Council.
Council does not engage in transactions expressed in foreign currencies and is therefore not subject to foreigncurrency risk.
Financial risk management is carried out by Council’s finance section under policies approved by the Council.
A comparison by category of the carrying amounts and fair values of Council’s financial assets and financialliabilities recognised in the financial statements is presented below.
Financial assetsCash and cash equivalentsInvestments – ‘Designated at fair value on initial recognition’ – ‘Held to maturity’ReceivablesTotal financial assets
Financial liabilitiesPayablesLoans/advancesTotal financial liabilities
Fair value is determined as follows:
– Cash and cash equivalents, receivables, payables – are estimated to be the carrying value that approximates market value.
– Borrowings and held-to-maturity investments – are based upon estimated future cash flows discounted by the current mkt interest rates applicable to assets and liabilities with similar risk profiles, unless quoted market prices are available.
– Financial assets classified (i) ‘at fair value through profit and loss’ or (ii) ‘available-for-sale’ – are based upon quoted market prices (in active markets for identical investments) at the reporting date or independent valuation.
18,779 1,868 850
2,279 1,246 1,398
16,032 1,868
4,750
18,779
881
4,750
2,132
Carrying value
9,414
8,261
2018
850
1,168
886
Fair value
1,168
20182017
9,414
8,261 8,500 –
1,246 2,279 2,132
1,398
16,032
881
–
886
2017
8,500
X10A13T
page 47

Financial Statements 2018
Dungog Shire Council
Notes to the Financial Statements for the year ended 30 June 2018
Note 17. Financial risk management (continued)
$ ’000
Council’s objective is to maximise its return on cash and investments whilst maintaining an adequate level ofliquidity and preserving capital.
Council’s finance area manages the cash and Investments portfolio with the assistance of independentadvisors.
Council has an investment policy which complies with the Local Government Act 1993 and MinisterialInvestment Order 625. This policy is regularly reviewed by Council and its staff and a monthly Investment reportis provided to Council setting out the make-up and performance of the portfolio as required by LocalGovernment regulations.
The risks associated with the investments held are:
– Price risk – the risk that the capital value of Investments may fluctuate due to changes in market prices, whether there changes are caused by factors specific to individual financial instruments or their issuers or are caused by factors affecting similar instruments traded in a market.
– Interest rate risk – the risk that movements in interest rates could affect returns and income.
– Credit risk – the risk that the investment counterparty will not complete their obligations particular to a financial instrument, resulting in a financial loss to Council – be it of a capital or income nature.
Council manages these risks (amongst other measures) by diversifying its portfolio and only purchasinginvestments with high credit ratings or capital guarantees.
Council also seeks advice from independent advisers before placing any funds in cash equivalents andinvestments.
(a) Market risk – price risk and interest rate risk
The following represents a summary of the sensitivity of Council’s Income Statement and accumulated surplus(for the reporting period) due to a change in either the price of a financial asset or the interest rates applicable.
It is assumed that the change in interest rates would have been constant throughout the reporting period.
2018Possible impact of a 1% movement in interest rates
2017Possible impact of a 1% movement in interest rates 140
(179)
Decrease of values/ratesProfit
179
(140)
Increase of values/ratesProfit Equity
140
(179) 179 Equity
(140)
page 48

Financial Statements 2018
Dungog Shire Council
Notes to the Financial Statements for the year ended 30 June 2018
Note 17. Financial risk management (continued)
$ ’000
(b) Credit risk
Council’s major receivables comprise (i) rates and annual charges and (ii) user charges and fees.
The major risk associated with these receivables is credit risk – the risk that debts due and payable to Councilmay not be repaid in full.
Council manages this risk by monitoring outstanding debt and employing stringent debt recovery procedures.It also encourages ratepayers to pay their rates by the due date through incentives.
Credit risk on rates and annual charges is minimised by the ability of Council to secure a charge over the landrelating to the debts – that is, the land can be sold to recover the debt. Council is also able to charge intereston overdue rates and annual charges at higher than market rates which further encourages the payment of debt.
There are no significant concentrations of credit risk, whether through exposure to individual customers,specific industry sectors and/or regions.
The level of outstanding receivables is reported to Council monthly and benchmarks are set and monitored foracceptable collection performance.
Council makes suitable provision for doubtful receivables as required and carries out credit checks on mostnon-rate debtors.
There are no material receivables that have been subjected to a re-negotiation of repayment terms.
A profile of Council’s receivables credit risk at balance date follows:
(i) Ageing of receivables – %Current (not yet overdue)Overdue
(ii) Ageing of receivables – valueRates and annual charges< 1 year overdue> 1 year overdue
Other receivablesCurrent> 30 days overdue
1,441
100%
358
179 193
394 1,248
427
2017
100% 45%
2018
100%
91 456
100%87%13%
2017
Other
98
100%
0%
215
100%
336
2018
charges
55%
Other
0%
2018Rates and
2017
receivables annual
receivables charges annual
Rates and
page 49

Financial Statements 2018
Dungog Shire Council
Notes to the Financial Statements for the year ended 30 June 2018
Note 17. Financial risk management (continued)
$ ’000
(c) Liquidity risk
Payables and borrowings are both subject to liquidity risk – the risk that insufficient funds may be on handto meet payment obligations as and when they fall due.
Council manages this risk by monitoring its cash flow requirements and liquidity levels and maintaining anadequate cash buffer.
Payment terms can (in extenuating circumstances) also be extended and overdraft facilities utilised as required.
Borrowings are also subject to interest rate risk – the risk that movements in interest rates could adverselyaffect funding costs and debt servicing requirements. Council manages this risk by borrowing long term andfixing the interest rate on a 4-year renewal basis. The Finance Section regularly reviews interest ratemovements to determine if it would be advantageous to refinance or renegotiate part or all of the loan portfolio.
The contractual undiscounted cash outflows (ie. principal and interest) of Council’s payables and borrowingsare set out in the maturity table below:
$ ’000
Trade/other payablesLoans and advancesTotal financial liabilities
Trade/other payablesLoans and advancesTotal financial liabilities
-
881 191 145
195 -
619
1,289 424
Actualcash
791
to noSubject
carrying
2017
2018
2,132
- 724
- 619 1,398
2,279
> 5 Years
2,131
- 721 721
706
851
averageWeighted
897 1,488 2,385
- 724
195
842
191
outflows
647 144
0.00%4.93%
0.00%4.86%
values
Total
maturity ≤ 1 Yearpayable in:1 – 5 Years
1,246 424
interest rate
886
page 50

Financial Statements 2018
Dungog Shire Council
Notes to the Financial Statements for the year ended 30 June 2018
Note 18. Material budget variations
$ ’000
While the Income Statement included in this General Purpose Financial Report must disclose the originalbudget adopted by Council, the Local Government Act 1993 requires Council to review its financial budgeton a quarterly basis, so that it is able to manage the various variations between actuals versus budget thatinvariably occur throughout the year.
This note sets out the details of material variations between Council’s original budget and its actualresults for the year as per the Income Statement – even though such variations may have been adjusted forduring each quarterly budget review.
Note that for variations* of budget to actual :Material variations represent those variances that amount to 10% or more of the original budgeted figure.F = Favourable budget variation, U = Unfavourable budget variation
$ ’000
REVENUESRates and annual charges
User charges and fees
Interest and investment revenueInterest rates on investments lower then projected.
Other revenues
Operating grants and contributionsEarly receipt of FAG contributions
Capital grants and contributionsHigher than budget due to significant level of reimbursable work undertaken on road network and boat ramp funding.
Joint ventures and associates - net profitsUnbudgeted joint venture item.
F
17%
6,979
2%24
6,941
5%
301
40
2018
– F86
F
714
Budget
7,689
4,873
1,082
71%
(48)
---------- Variance* ----------
U
F
253 (16%)
F
1,058
849
4,159
889
1%
Actual
4,493
F
2018
Council’s original financial budget for 17/18 was adopted by the Council on 20 June 2017 and is not required to be audited.
2018
38
0%86
3,196
X10A14T
page 51

Financial Statements 2018
Dungog Shire Council
Notes to the Financial Statements for the year ended 30 June 2018
Note 18. Material budget variations (continued)
$ ’000
EXPENSESEmployee benefits and on-costs
Borrowing costsLower than budgeted bank expenses.
Materials and contractsLower than budgeted due to heavily modified road network capital improvements programme.
Depreciation and amortisation
Other expenses
Net losses from disposal of assetsLoss due to write-off of road assets resulting from capital renewals undertaken during the year.
Budget variations relating to Council’s Cash Flow Statement include:
Cash flows from operating activitiesHigher than budgeted cash flow from charges revenue, grants and contributions.
Cash flows from investing activitiesHigher than budgeted cash flow from grants and contributions.
Cash flows from financing activities
(130)
101
5,201
(6%)
3,977
F
(1,099)
2,231
–
(152)
(19,651) U
– 0.0%
174.5%
(152)
6,475 5,082 127.4%
(7,158) (12,493)
1,099
6,153
F
U
1%
(3%)
(7)
2018
U4,610
2018 2018
24%
U0%
---------- Variance* ----------
F6,091
U108
11,557 F
Budget
2,101
1,224
(133) 4,743
Actual
62
(7%)
page 52

Financial Statements 2018
Dungog Shire Council
Notes to the Financial Statements for the year ended 30 June 2018
Note 19. Fair value measurement
$ ’000
The Council measures the following asset and liability classes at fair value on a recurring basis:
– Infrastructure, property, plant and equipment
The fair value of assets and liabilities must be estimated in accordance with various accounting standards foreither recognition and measurement requirements or for disclosure purposes.
AASB 13 Fair Value Measurement requires all assets and liabilities measured at fair value to be assigned to a‘level’ in the fair value hierarchy as follows:
Level 1: Unadjusted quoted prices in active markets for identical assets or liabilities that the entity can access at the measurement date.
Level 2: Inputs other than quoted prices included within level 1 that are observable for the asset or liability, either directly or indirectly.
Level 3: Inputs for the asset or liability that are not based on observable market data (unobservable inputs).
(1) The following table presents all assets and liabilities that have been measured and recognised at fair values:
2018
Recurring fair value measurements
Infrastructure, property, plant and equipmentOperational land Community land Buildings Other structuresRoads Bridges Footpaths Bulk earthworks Stormwater drainage Other assets Restoration assets Plant and EquipmentTotal infrastructure, property, plant and equipment
136,205
–
dd/mm/yy
– – –
3,888
– – 136,205
– 12,447
1,454
21,979 21,979
6,976
24,129
– 5,471 7,886 7,886
5,471
3,368
24,129
6,976
dd/mm/yy
139
–
– – 139
304,442
prices in observableof latestSignificant
inputs
Date
91,946
291,995 3,888
Level 3 Total
–
–
–
dd/mm/yy
Quoted Significant
Fair value measurement hierarchyLevel 1 Level 2
dd/mm/yy – 91,946
unobservable
– dd/mm/yydd/mm/yy – –
– 1,001 1,001
inputsactive mktsvaluation
– –
– – 3,368
dd/mm/yydd/mm/yy
–
dd/mm/yydd/mm/yy – 1,454
dd/mm/yy
X10A7T
X10A17T
page 53
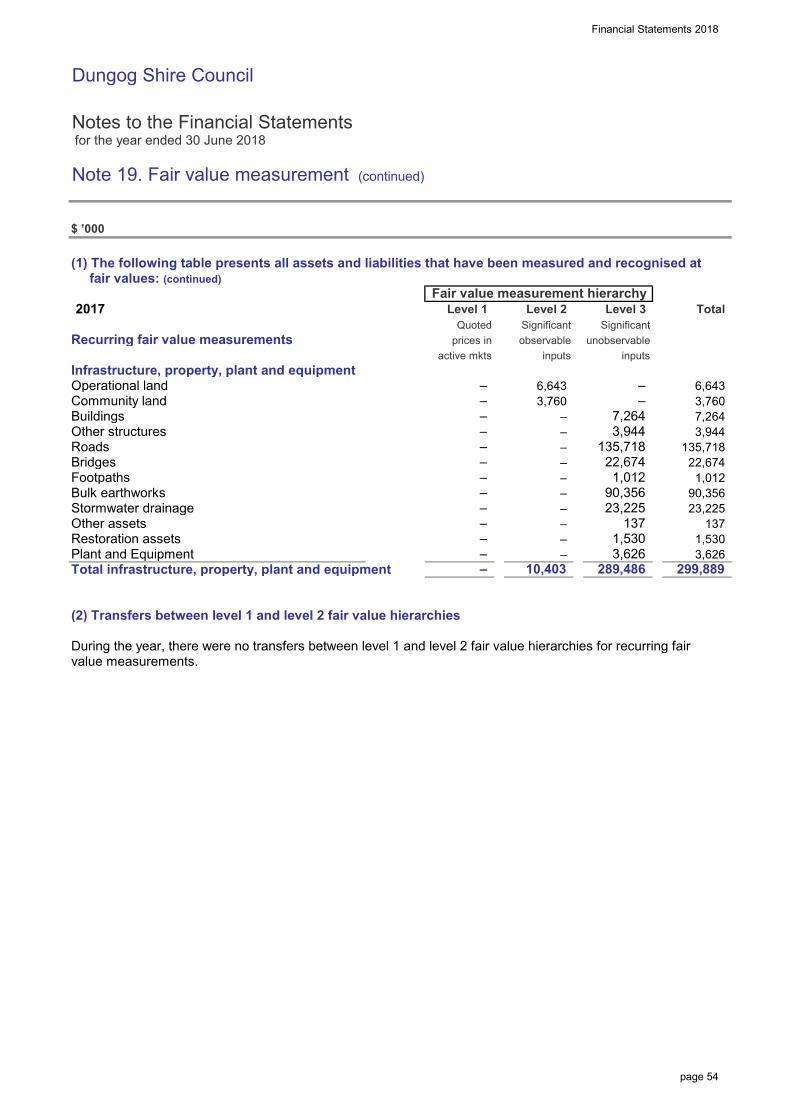
Financial Statements 2018
Dungog Shire Council
Notes to the Financial Statements for the year ended 30 June 2018
Note 19. Fair value measurement (continued)
$ ’000
(1) The following table presents all assets and liabilities that have been measured and recognised at fair values: (continued)
2017
Recurring fair value measurements
Infrastructure, property, plant and equipmentOperational land Community land Buildings Other structuresRoads Bridges Footpaths Bulk earthworks Stormwater drainage Other assets Restoration assets Plant and EquipmentTotal infrastructure, property, plant and equipment
(2) Transfers between level 1 and level 2 fair value hierarchies
During the year, there were no transfers between level 1 and level 2 fair value hierarchies for recurring fairvalue measurements.
– –
– –
90,356
– –
–
7,264
135,718
– 6,643 – 6,643
–
– –
23,225 23,225
–
–
Significant
Fair value measurement hierarchy
unobservableinputs
Level 1 Level 2Significant
Total
135,718 3,944
22,674 – 1,012 1,012
90,356
Level 3
– 137 –
7,264
3,626
valuation active mkts
– 299,889
3,760
1,530 1,530 137
–
inputs
22,674 –
3,760
Date Quotedprices in observableof latest
3,944
–
– –
– 10,403 289,486
–
3,626
page 54

Financial Statements 2018
Dungog Shire Council Notes to the Financial Statements for the year ended 30 June 2018 Note 19. Fair value measurement (continued)
page 55
(3) Valuation techniques used to derive level 2 and level 3 fair values Current Replacement Costs (CRC) Current Replacement Cost is the minimum that it would cost, in the normal course of business, to replace the existing asset with a technologically modern equivalent asset with the same economic benefits. Residual Value (RV) The Residual Value of an asset is the estimated amount that would be obtained today from disposal of the asset after deducting the estimated costs of disposal. Condition Assessment Condition assessment of the various assets has been undertaken IPWEA guidelines and Council requirements using the skills of consultants, experienced engineering and operational staff. All assets, with the exception of unsealed roads, have been rated using a 1 to 5 rating system where a rating of 1 represents “as new” condition and a rating of 5 represents “very poor” condition requiring renewal of the asset. Unsealed Roads have been rated utilising a 1 to 3 rating system where a rating of 1 represents “as new” condition and a rating of 3 represents “very poor” condition requiring renewal of the asset. Where Council is unable to derive fair valuations using quoted market prices of identical assets (i.e. level 1 inputs), Council instead utilises a spread of both observable inputs (level 2 inputs) and unobservable inputs (level 3 inputs). The fair valuation techniques Council has employed while utilising level 2 and level 3 inputs are as follows: Infrastructure, property, plant and equipment Plant & equipment, office equipment and furniture & fittings Plant & Equipment, Office Equipment and Furniture & Fittings are valued at cost but are disclosed at fair value in the notes. The purchase cost of these assets is taken as their fair value. There has been no change in the valuation process during the period. Operational land The valuation of Councils operational land was undertaken as at 30 June 2018 by Nicholas Brady Valuations (NICHOLAS BRADY AAPI (VAL,P&M) Certified Practising Valuer, Real Estate Valuers, Registration No. 3609). The land value has been assessed by direct comparison on a rate per square metre, and has been valued in accordance with the Dungog Shire Council Draft LEP 2013. The valuations were based on the Draft LEP 2013 as the “market place” would also have due regard to the proposed zoning. Sale prices of comparable land parcels were considered where appropriate. The most significant unobservable input into the valuation of operational land is the price per square metre. These assets have been classified as using Level 3 valuation inputs due to the professional judgement required and used by the Valuer to determine the price per square metre. There have been no changes in the valuation process during the period. Community Land Land values based on the 2015 valuation made by the Valuer-General were used to value Council’s Community Land, where the Valuer-General did not provide a land value, an average unit rate based on similar properties was used taking into regard the highest or best use for the land. As these rates are not

Financial Statements 2018_
Dungog Shire Council Notes to the Financial Statements for the year ended 30 June 2018 Note 19. Fair value measurement (continued)
page 56
considered to be observable market evidence they have been classified as Level 3 valuation inputs. There has been no change in the valuation process during the period. Buildings Council’s buildings were valued using the summation (cost) approach by Nicholas Brady Valuations (NICHOLAS BRADY AAPI (VAL, P&M) Certified Practising Valuer, Real Estate Valuers, Registration No. 3609) as at 30 June 2018. Having regard to the specialised nature of the majority of the improvements, Council’s buildings were valued by the Summation Approach, whereby the depreciated replacement cost of the improvements is added to the land value. The replacement cost of each building was estimated taking into account different components within the building, their use and useful lives. The unit rate could be supported by market evidence making it a Level 2 input, however, inputs such as estimates of residual use, and patterns of consumption required significant professional judgement and impact significantly on the final determination of fair value. As such, these assets have been valued using Level 3 unobservable inputs. There have been no changes in the valuation process during the period. Roads Roads have been classified into Regional, Rural Local Sealed, Rural Local Unsealed, Urban Local Sealed and Urban Local Unsealed Roads categories for condition rating and valuation purposes. Sealed Roads - All Data collection - data collection for sealed roads was undertaken by external consultants utilising video and in-vehicle roughness count technologies. Where an intersection occurs, the pavement values are attributed to the through road. Componentisation - road assets have been componentised in accordance with required guidelines. Sealed roads have been broken down into three (3) components being earthworks (non-depreciable), pavement and seal. The pavement and seal have been separated due to different life expectations for these two components. Costs are based upon existing road dimensions. Condition - condition assessment was undertaken by external consultants utilising video and in-vehicle roughness count technologies. The roads have been segmented and the pavement condition information detailed for each segment. Condition indicators were collected as follows:-
• Regional Roads:-
o Roughness - NAASRA standards used o Pavement defects - by area o Surface defects - by area o Cracking - all cracking types recorded by area
• Local Sealed Roads (Rural and Urban):-
o Pavement defects - by area o Surface defects - by area o Cracking - all cracking types recorded by area
From the above condition indicators, a 1 to 5 rating system was utilised to identify the condition of the asset.

Financial Statements 2018_
Dungog Shire Council Notes to the Financial Statements for the year ended 30 June 2018 Note 19. Fair value measurement (continued)
page 57
Percentage life remaining - the rating of the road was then used to calculate the percentage of life remaining based upon an exponential decay curve as shown below:
Rating Factor Applied Percentage Depreciated % Life Remaining
1 0 0% 100% 2 4 16% 84% 3 9 36% 64% 4 16 64% 36% 5 25 100% 0%
Useful life - traffic volumes and geographical location play little part in the life of a road asset as it is assumed that the asset was designed for the traffic loadings to be carried. Useful lives have therefore been determined based upon experience, observed lives of assets and industry standards as follows: • Earthworks - no useful life has been applied as earthworks do not depreciate over time. • Pavement - the useful life of a sealed pavement was adopted as 60 years based upon the following: 0 year - Year of construction 15 years - Reseal 30 years - Rehabilitation 45 years - Reseal 60 years - Full reconstruction • Seal - The useful life of the seal was based on 15 years as per industry standard; Current Replacement Cost (CRC) - the CRC has been determined as follows: • Earthworks - CRC is based on topography to determine the amount of earthworks required and current costings for the construction of the earthworks in today’s dollars; • Pavement - CRC has been based upon the cost to rehabilitate these roads utilising the average of three (3) recent projects undertaken by Council; • Seal - CRC has been based upon current contracted sealing costs through Dungog Shire Council’s involvement with the regional procurement tenders. Residual values - in practice, the residual value of many assets or components of such are often insignificant and therefore immaterial in the calculation of the depreciable amount. In the case of sealed roads, it was determined that the following residual values apply: • Earthworks - have an indefinite life/residual value and will therefore not be depreciated; • Pavements - whilst pavements may have some residual value in terms of the possibility of the in-situ material being re-used in the rehabilitation of the pavement. It has, however, been determined that existing pavements would need to be treated (stabilised) or replaced at the end of their useful lives and the cost of such would more or less negate the value of that pavement component. Therefore, the residual value has been determined to have no material value in the calculation of depreciation; • Seals - These have no financial implications on the application of the next seal. Therefore there is no residual value. Depreciation - all sealed road assets have been assessed as to their condition. The remaining life of the asset has then been determined based on the condition assessment, the percentage life remaining and the overall useful life of the asset. The residual depreciable value of the asset was then divided by the remaining useful life to determine the annual depreciation rate. Data Limitations – inputs such as estimated patterns of consumption, residual values, asset condition and useful life required extensive professional judgement which impacted significantly on the final determination of

Financial Statements 2018_
Dungog Shire Council Notes to the Financial Statements for the year ended 30 June 2018 Note 19. Fair value measurement (continued)
page 58
fair value. Additionally, due to limitations in the historical records of very long lived assets, there may be some uncertainty regarding the actual design, specifications and dimensions of some assets. Unsealed Roads - All Data collection - data collection for unsealed roads was undertaken via physical measurement by Council staff to determine dimensions. Where an intersection occurs, the pavement values are attributed to the through road. Componentisation - the road asset has been componentised in accordance with required guidelines. As there is no “surface” on unsealed roads, the unsealed road asset has been broken down into two (2) components being earthworks (non-depreciable) and pavement. Costs are based upon existing road dimensions. Condition - The roads have been segmented and assessment undertaken by experienced Council engineering and operational staff. As the surface condition of unsealed roads is highly changeable due to weather and climatic conditions, the condition was then based upon the depth of gravel on individual sections. From these indicators, a 1 to 3 rating system was utilised to identify the condition of the asset. Percentage life remaining - as the rating of the road was based upon depth of gravel and it is expected that this depth will deteriorate consistently over time, the percentage of life remaining was based upon a straight line depreciation model. This process may be reviewed for future revaluations. Useful life - Useful lives have been determined based upon experience, observed lives of assets and industry standards as follows: • Earthworks - no useful life has been applied as earthworks do not depreciate over time. • Pavement - the useful life of the unsealed pavement was adopted as 20 years based upon experience and observed lives of assets. Current Replacement Cost (CRC) - the CRC has been determined as follows: • Earthworks - CRC has been based on topography to determine the amount of earthworks required and current costings for the construction of the earthworks in today’s dollars; • Pavement - CRC has been based upon the minimum gravel depths as determined by Council standards as set out in Council’s “Road Strategy”, normal Council practice and current costings for the construction of the pavement in today’s dollars. Residual values - In practice, the residual value of many assets or components of such are often insignificant and therefore immaterial in the calculation of the depreciable amount. In the case of unsealed roads, it was determined that the following residual values apply: • Earthworks - have an indefinite life/residual value and will therefore not be depreciated; • Pavements - in the case of unsealed road pavements, full depreciation or end of useful life is determined when there is no residual gravel on the pavement. By definition, there is no material available to be re-used therefore there is no residual value for the determination of depreciation. Depreciation - all unsealed road assets have been assessed as to their condition. The remaining life of the asset has then been determined based on the condition assessment, the percentage life remaining and the overall useful life of the asset. The residual depreciable value of the asset was then divided by the remaining useful life to determine the annual depreciation rate. Data limitations – inputs such as estimated patterns of consumption, residual values, asset condition and useful life required extensive professional judgement which impacted significantly on the final determination of

Financial Statements 2018_
Dungog Shire Council Notes to the Financial Statements for the year ended 30 June 2018 Note 19. Fair value measurement (continued)
page 59
fair value. Additionally, due to limitations in the historical records of very long lived assets, there may be some uncertainty regarding the actual design, specifications and dimensions of some assets. Bridges In accordance with the definitions used by the Grants Commission, a structure with an opening of greater than 6m in deck length is assessed as a bridge. Bridges have been broken down into timber structures (full or part timber construction) and non-timber structures (primarily concrete or concrete/steel structures) for condition rating and valuation purposes. Timber Bridges Data collection - data collection for timber bridges was undertaken via physical measurement by Council staff to determine dimensions. Componentisation - timber bridge assets have been componentised into two (2) components being substructure and superstructure. The substructure and superstructure have been separated to allow for differential condition rating of these two components. Condition - condition assessment was undertaken by experienced Council engineering and operational staff. Condition information was detailed for each bridge. A 1 to 5 rating system was then utilised to identify the condition of each component of the asset and an average condition of these two components adopted as the overall bridge condition. Percentage life remaining - the rating of the timber bridge was then used to calculate the percentage of life remaining based upon an exponential decay curve as shown below:
Rating Percentage Depreciated % Life Remaining
1 0% 100% 2 36% 64% 3 64% 36% 4 84% 16% 5 100% 0%
Useful life - useful lives have therefore been determined based upon experience, observed lives of assets and industry standards. The useful life of a timber bridge has been adopted as 50 years. Current Replacement Cost (CRC) - the CRC has been determined has been determined based upon experience, observed lives of assets and industry standards. Residual values - in practice, the residual value of many assets or components of such are often insignificant and therefore immaterial in the calculation of the depreciable amount. In the case of timber bridges, there would be no residual components that would have any value in the replacement of the asset with a concrete structure. Therefore there is no residual value applied. Depreciation - all timber bridges have been assessed as to their condition. The remaining life of the asset has then been determined based on the condition assessment, the percentage life remaining and the overall useful life of the asset. The residual depreciable value of the asset was then divided by the remaining useful life to determine the annual depreciation rate. Data Limitations – inputs such as estimated patterns of consumption, residual values, asset condition and useful life required extensive professional judgement which impacted significantly on the final determination of

Financial Statements 2018_
Dungog Shire Council Notes to the Financial Statements for the year ended 30 June 2018 Note 19. Fair value measurement (continued)
page 60
fair value. Additionally, due to limitations in the historical records of very long lived assets, there may be some uncertainty regarding the actual design, specifications and dimensions of some assets. Non-Timber Bridges Data collection - data collection for non-timber bridges was undertaken via physical measurement by Council staff to determine dimensions. Componentisation - non-timber bridge assets have not been componentised any further than it being a single asset. Condition - condition assessment was undertaken by experienced Council engineering and operational staff. Condition information was detailed for each bridge. A 1 to 5 rating system was then utilised to identify the condition of the asset. Percentage life remaining - as non-timber bridges deteriorate at a different rate to timber bridges, the following exponential decay curve was utilised to calculate the percentage of life remaining:
Rating Percentage Depreciated % Life Remaining
1 0% 100% 2 16% 84% 3 36% 64% 4 64% 36% 5 100% 0%
Useful life - useful lives have therefore been determined based upon experience, observed lives of assets and industry standards. The useful life of a non-timber bridge has been adopted as 80 years. Current Replacement Cost (CRC) - the CRC has been determined based upon the Rawlinson’s Australian Construction Handbook, recent bridge tenders received by Council and industry standards. Residual values - in practice, the residual value of many assets or components of such are often insignificant and therefore immaterial in the calculation of the depreciable amount. In the case of non-timber bridges, there would be no residual components that would be expected to last double the 80 year useful life and therefore would not have any value in the replacement of the asset. Therefore there is no residual value applied. Depreciation - all non-timber bridges have been assessed as to their condition. The remaining life of the asset has then been determined based on the condition assessment, the percentage life remaining and the overall useful life of the asset. The residual depreciable value of the asset was then divided by the remaining useful life to determine the annual depreciation rate. Data limitations – inputs such as estimated patterns of consumption, residual values, asset condition and useful life required extensive professional judgement which impacted significantly on the final determination of fair value. Additionally, due to limitations in the historical records of very long lived assets, there may be some uncertainty regarding the actual design, specifications and dimensions of some assets. Rural stormwater drainage & causeways Drainage structures on the rural road network have been broken down into culvert structures and causeways.

Financial Statements 2018_
Dungog Shire Council Notes to the Financial Statements for the year ended 30 June 2018 Note 19. Fair value measurement (continued)
page 61
Culvert Structures Data collection - data collection was undertaken via physical measurement by Council staff to determine dimensions. There is a limitation in the data due to only 23% of unsealed rural roads, 48% of sealed rural roads and 96% of regional roads stormwater network being inspected and the data from this applied across the entire rural stormwater network. Componentisation - the culvert asset has been componentised into two (2) components being the culvert pipe or box section and the headwall component. These have been separated to allow for differential condition rating of these two components. Condition - condition assessment was undertaken by experienced Council engineering and operational staff. Condition information was detailed for each structure. A 1 to 5 rating system was then utilised to identify the condition of each component of the asset and an average condition of these two components adopted as the overall culvert structure condition. Percentage life remaining - the rating of the structure was then used to calculate the percentage of life remaining based upon an exponential decay curve as shown below: Rating Percentage Depreciated % Life Remaining 1 0% 100% 2 16% 84% 3 36% 64% 4 64% 36% 5 100% 0% Useful life - useful lives have been determined based upon experience, observed lives of assets and industry standards. Current Replacement Cost (CRC) - the CRC has been determined has been determined based upon experience, observed lives of assets, industry standards and Rawlinson’s Australian Construction Handbook. Residual values - in practice, the residual value of many assets or components of such are often insignificant and therefore immaterial in the calculation of the depreciable amount. In the case of concrete culvert structures, there would be no residual components that would be expected to last double the initial useful life and therefore would not have any value in the replacement of the asset. Therefore there is no residual value applied. Depreciation - all concrete culvert structures have been assessed as to their condition. The remaining life of the asset has then been determined based on the condition assessment, the percentage life remaining and the overall useful life of the asset. The residual depreciable value of the asset was then divided by the remaining useful life to determine the annual depreciation rate. Causeways Data collection - data collection for causeways was undertaken via physical measurement by Council staff to determine dimensions. Componentisation - the causeway asset has been componentised into two (2) components being the culvert pipe or box section (if existing) and the causeway component. These have been separated to allow for differential condition rating of these two components.

Financial Statements 2018_
Dungog Shire Council Notes to the Financial Statements for the year ended 30 June 2018 Note 19. Fair value measurement (continued)
page 62
Condition - condition assessment was undertaken by experienced Council engineering and operational staff. Condition information was detailed for each bridge. A 1 to 5 rating system was then utilised to identify the condition of the asset. Percentage life remaining - the rating of the structure was then used to calculate the percentage of life remaining based upon an exponential decay curve as shown below: Rating Percentage Depreciated % Life Remaining 1 0% 100% 2 16% 84% 3 36% 64% 4 64% 36% 5 100% 0% Useful life - useful lives have been determined based upon experience, observed lives of assets and industry standards. Current Replacement Cost (CRC) - the CRC has been determined has been determined based upon experience, observed lives of assets, industry standards and Rawlinson’s Australian Construction Handbook. Residual values - n practice, the residual value of many assets or components of such are often insignificant and therefore immaterial in the calculation of the depreciable amount. In the case of concrete causeway structures, there would be no residual components that would be expected to last double the 80 year useful life and therefore would not have any value in the replacement of the asset. Therefore there is no residual value applied. Depreciation - all causeway structures have been assessed as to their condition. The remaining life of the asset has then been determined based on the condition assessment, the percentage life remaining and the overall useful life of the asset. The residual depreciable value of the asset was then divided by the remaining useful life to determine the annual depreciation rate. Urban stormwater drainage Data collection - data collection was undertaken via physical measurement by Council staff and Council records to determine dimensions. Componentisation - the asset has been componentised into individual components within the asset class. Condition - condition assessment was undertaken by experienced Council engineering and operational staff. Condition information was detailed for each structure. A 1 to 5 rating system was then utilised to identify the condition of each component of the asset and an average condition of these two components adopted as the overall culvert structure condition. Percentage life remaining - the rating of the asset was then utilised to determine the percentage of life remaining. Useful life - useful lives have been determined based upon experience, observed lives of assets and industry standards. Current Replacement Cost (CRC) - the CRC has been determined has been determined based upon experience, observed lives of assets, industry standards and Rawlinson’s Australian Construction Handbook.

Financial Statements 2018_
Dungog Shire Council Notes to the Financial Statements for the year ended 30 June 2018 Note 19. Fair value measurement (continued)
page 63
Residual values - in practice, the residual value of many assets or components of such are often insignificant and therefore immaterial in the calculation of the depreciable amount. In the case of concrete culvert structures, there would be no residual components that would be expected to last double the initial useful life and therefore would not have any value in the replacement of the asset. Therefore there is no residual value applied. Depreciation - all concrete culvert structures have been assessed as to their condition. The remaining life of the asset has then been determined based on the condition assessment, the percentage life remaining and the overall useful life of the asset. The residual depreciable value of the asset was then divided by the remaining useful life to determine the annual depreciation rate. Footpath, kerb & gutter and guardrail Ancillary items on the road network have been broken down into footpaths, kerb & gutter and guardrail assets. Footpaths and Kerb & Gutter Data collection - data collection was undertaken via physical measurement by Council staff to determine dimensions and use of aerial photography for confirmation. Componentisation - footpaths, bike paths and kerb & gutter have been segmented to different locations and identified as individual assets. Condition - condition assessment was undertaken by experienced Council engineering and operational staff. Condition information was detailed for each asset. A 1 to 5 rating system was then utilised to identify the condition of each asset. Percentage life remaining - the rating of the asset was then used to calculate the percentage of life remaining. Useful life - useful lives have been determined based upon experience, observed lives of assets and industry standards. Current Replacement Cost (CRC) - the CRC has been determined has been determined based upon experience, observed lives of assets, industry standards and Rawlinson’s Australian Construction Handbook. Residual values - in practice, the residual value of many assets or components of such are often insignificant and therefore immaterial in the calculation of the depreciable amount. In the case of these assets, there would be no residual components that would be expected to last double the initial useful life. Whilst there may be a residual earthworks value, this would be negated by the cost to remove the existing fully depreciated asset. Therefore there is no residual value applied. Depreciation - all of these assets have been assessed as to their condition. The remaining life of the asset has then been determined based on the condition assessment, the percentage life remaining and the overall useful life of the asset. The residual depreciable value of the asset was then divided by the remaining useful life to determine the annual depreciation rate. Guardrail Data Collection - data collection was undertaken via physical measurement by Council staff to determine dimensions and use of aerial photography for confirmation. Componentisation - guardrail sections have been identified as individual assets.

Financial Statements 2018_
Dungog Shire Council Notes to the Financial Statements for the year ended 30 June 2018 Note 19. Fair value measurement (continued)
page 64
Condition - condition assessment was undertaken by experienced Council engineering and operational staff. Condition information was detailed for each section. A 1 to 5 rating system was then utilised to identify the condition of each asset. Percentage life remaining - the rating of the guardrail was then used to calculate the percentage of life remaining. Useful life - useful lives have been determined based upon experience, observed lives of assets and industry standards. Current Replacement Cost (CRC) - the CRC has been determined has been determined based upon experience, observed lives of assets, industry standards and Rawlinson’s Australian Construction Handbook. Residual values - in practice, the residual value of many assets or components of such are often insignificant and therefore immaterial in the calculation of the depreciable amount. In the case of guardrail, there would be no residual components that would be expected to last double the initial useful life. Therefore there is no residual value applied. Depreciation - all guardrail assets have been assessed as to their condition. The remaining life of the asset has then been determined based on the condition assessment, the percentage life remaining and the overall useful life of the asset. The residual depreciable value of the asset was then divided by the remaining useful life to determine the annual depreciation rate. Park assets (non-building) & other structures Data collection - data collection was undertaken via physical measurement by Council staff to determine dimensions and use of aerial photography for confirmation. Componentisation - asset have been identified as individual assets. Condition - condition assessment was undertaken by experienced Council engineering and operational staff. Condition information was detailed for each section. A 1 to 5 rating system was then utilised to identify the condition of each asset. Percentage life remaining - the rating of the asset was then used to calculate the percentage of life remaining. Useful life - useful lives have been determined based upon experience, observed lives of assets and industry standards. Current Replacement Cost (CRC) - the CRC has been determined has been determined based upon experience, observed lives of assets, industry standards and Rawlinson’s Australian Construction Handbook. Residual values - in practice, the residual value of many assets or components of such are often insignificant and therefore immaterial in the calculation of the depreciable amount. In the case of these assets, there would be no residual components that would be expected to last double the initial useful life. Therefore there is no residual value applied. Depreciation - all of these assets have been assessed as to their condition. The remaining life of the asset has then been determined based on the condition assessment, the percentage life remaining and the overall useful life of the asset. The residual depreciable value of the asset was then divided by the remaining useful life to determine the annual depreciation rate.
Financial Statements 2018_
Dungog Shire Council Notes to the Financial Statements for the year ended 30 June 2018 Note 19. Fair value measurement (continued)
page 65
Landfill and quarry assets See note 11 for background and breakdown of these assets. Values are estimates of rehabilitation costs, and these included capping of landfill, revegetation of roadside quarries, battering of high walls, safety fencing and other associated restoration works. There is extensive professional judgement which impacts significantly on the final determination of fair value. Additionally, due to limitations in the historical records of very long lived assets, there is uncertainty regarding the design, specification and dimensions of these assets. Inputs include discount rates, cost escalation, cost timing and regulation changes.

Financial Statements 2018
Dungog Shire Council
Notes to the Financial Statements for the year ended 30 June 2018
Note 19. Fair value measurement (continued)
$ ’000
(4). Fair value measurements using significant unobservable inputs (level 3)
a. The following tables present the changes in level 3 fair value asset classes.
Opening balance – 1/7/16
Purchases (Cost)Disposals (WDV)Depreciation and impairment
Closing balance – 30/6/17
Purchases (GBV)Disposals (WDV)Depreciation and impairmentRevaluation increment/(decrement)Transfer from WIP
Closing balance – 30/6/18
Opening balance – 1/7/16
Closing balance – 30/6/17
Purchases (Cost)Depreciation and impairmentTransfer from WIP
Closing balance – 30/6/18
Opening balance – 1/7/16
Closing balance – 30/6/17
Purchases (GBV)Disposals (WDV)Depreciation and impairment
Closing balance – 30/6/18
(5). Highest and best useAll of Council’s non-financial assets are considered as being utilised for their highest and best use.
– –
(1,055)
664
(695)
–
–
1,530
– – –
3,625
–
38 125
3,944
– (477)
– 3,625
7,264
–
22,674
– – 3,888 1,454
– (387) – –
(76)
1,127 –
–
91,946 24,129
(453)
– –
(11) – 749 –
1,687
Restoration
–
139
(32)
138 23,225
34
Stormwaterdrainage
136,205
assets
535
1,012
equipment
1,001
89,762 1,012
–
841
Other
822
Plant &
138 23,225
Footpaths
3,368
earthworks
Buildings
(3,318)
1,172
1,004
(461)
87
(491)
90,356
Bulk
–
–
(122)
4,226
21,979
(507) (492) (3,348)
assets
7,886
3,357
–
135,718
136,852 3,528
(709)
Roads
– (1,173) (1)
22,212
–
Other
7,668
specialised structuresBridges
836
page 66

Financial Statements 2018
Dungog Shire Council
Notes to the Financial Statements for the year ended 30 June 2018
Note 20. Related party transactions
$ ’000
a. Key management personnel
Key management personnel (KMP) of the Council are those persons having the authority and responsibility for planning, directing and controlling the activities of thecouncil, directly or indirectly.
The aggregate amount of KMP compensation included in the Income Statement is:
Compensation:Short-term benefitsPost-employment benefitsTotal 1,020
2018938 82
2017807 93
900
X11A0T
page 67

Financial Statements 2018
Dungog Shire Council
Notes to the Financial Statements for the year ended 30 June 2018
Note 21. Events occurring after the reporting date
Council is aware of the following ‘non-adjusting events’ that merit disclosure:
Council is aware that on Friday 12th October 2018, a favourable ruling was made in the Land and Environment Court of New South Wales, in relation to matters concerning Martins Creek Quarry. This matter is still subject to appeal and is not final. While Council may receive compensation in due course, there is insufficient information presently available to make an estimate of the value, if any.
X10A16T
page 68
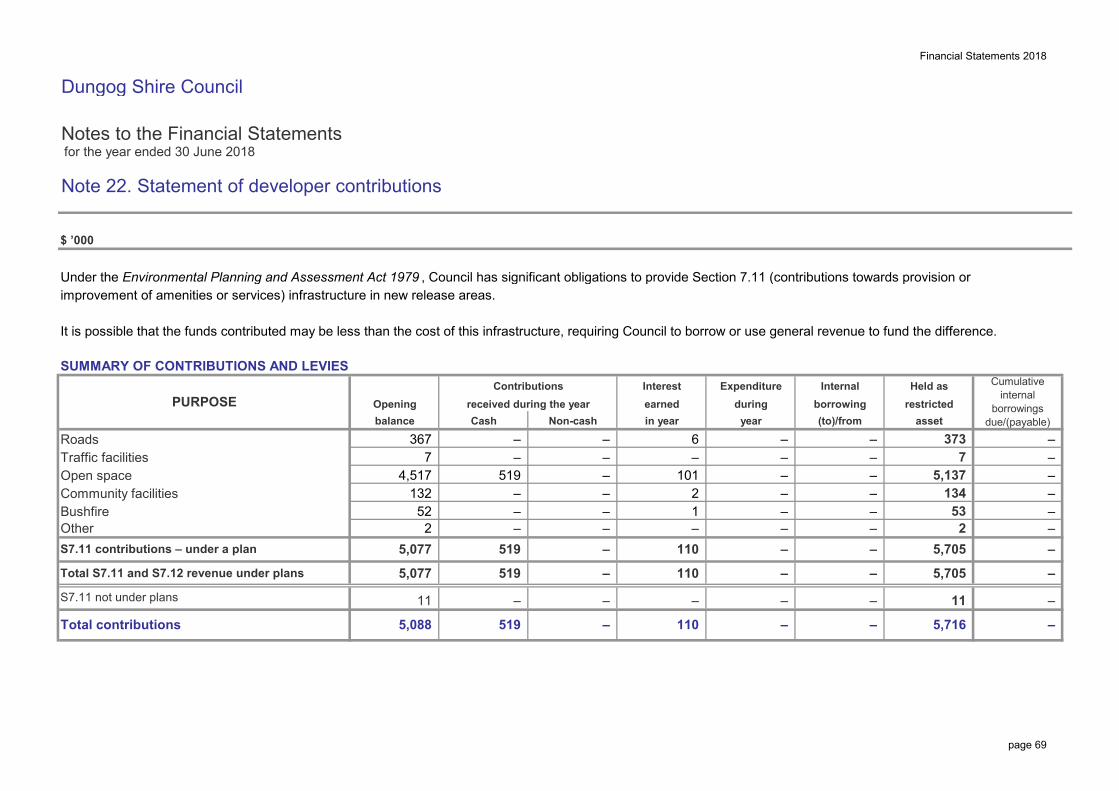
Financial Statements 2018
Dungog Shire Council
Notes to the Financial Statements for the year ended 30 June 2018
Note 22. Statement of developer contributions
$ ’000
Under the Environmental Planning and Assessment Act 1979 , Council has significant obligations to provide Section 7.11 (contributions towards provision orimprovement of amenities or services) infrastructure in new release areas.
It is possible that the funds contributed may be less than the cost of this infrastructure, requiring Council to borrow or use general revenue to fund the difference.
SUMMARY OF CONTRIBUTIONS AND LEVIES
RoadsTraffic facilitiesOpen spaceCommunity facilitiesBushfireOther
Cumulative internal
borrowings due/(payable)
– – – – – – –
–
–
–
52
–
519
–
7 – 6
–
– –
–
–
Non-cash
– – 110 5,077
1
Total contributions
S7.11 contributions – under a plan
PURPOSE Openingbalance
– –
4,517 519
earnedContributions
received during the yearInterest
year
132
Cash
5,088
11
– – 2
–
5,077
–
–
367
– –
2
asset
–
in year
5,137
–
–
– 110
–
110
5,705
5,705
11
–
5,716
–
–
–
– –
Held as
7
– 134
Internal
– 101
Expenditureborrowing
–
restricted(to)/from
53
during
– 373
S7.11 not under plans
Total S7.11 and S7.12 revenue under plans
519
– 519
–
– 2 –
–
X12A0T
page 69

Financial Statements 2018
Dungog Shire Council
Notes to the Financial Statements for the year ended 30 June 2018
Note 22. Statement of developer contributions (continued)
$ ’000
S7.11 CONTRIBUTIONS – UNDER A PLAN
CONTRIBUTION PLAN NUMBER 2
RoadsTraffic facilitiesOpen spaceCommunity facilitiesBushfire
CONTRIBUTION PLAN NUMBER 3
RoadsOpen spaceCommunity facilitiesBushfireOther
Cumulative internal
borrowings due/(payable)
Cumulative internal
borrowings due/(payable)
–
–
–
Contributions
balance
7
PURPOSE
Non-cash
526
–
earned
–
(to)/from
– –
–
Opening
–
received during the year
–
–
–
Expenditure
1
borrowing
–
18 –
Interest
in year
–
–
11
– 32 23
yearduring
– 22 90
Opening
–
2
Total
PURPOSE
–
– 2
–
–
–
Non-cash
–
11
18
Cash
Expenditure
–
Total
–
Cash
Contributionsreceived during the year
– –
–
29 –
517
100
–
–
Interest
32
356
–
– –
–
restrictedInternal
(to)/from
6 balance
– 30
102
assetearned
– –
1
–
in year
–
borrowing
– 362
– 2
30
Held as
30
– –
– 1
– 9 –
91
–
–
assetrestricted
–
Internal
7
Held as
–
–
–
–
duringyear
page 70

Financial Statements 2018
Dungog Shire Council
Notes to the Financial Statements for the year ended 30 June 2018
Note 22. Statement of developer contributions (continued)
$ ’000
S7.11 CONTRIBUTIONS – UNDER A PLAN
CONTRIBUTION PLAN NUMBER 4
O Sports fieldsO ParklandsO Swimming poolsO Indoor sportsO Local community centreO District community centreO Youth venueO Arts and crafts centreO Aged facilitiesO LibraryO Pre schoolO Rural sub-arterial roadsO Rural local roadsO Traffic managementO Bikeways facilitiesO Fire serviceO Section 94 administrationO Unsealed roads and bridgesO Other
Cumulative internal
borrowings due/(payable)
–
Internalborrowing
5,089
(to)/from
194 – – Total 4,470 100
–
Non-cash in year
– –
519 194
– –
Interestreceived during the yearPURPOSECash
Expenditure
balance yearOpening earned
Contributionsrestricted
asset
Held asduring
3 6 – – – – 9 154 47 – 7 – – 208 399 38 – 9 – – 446
78 9 – 1 – – 88 32 – – 1 – – 33
298 60 – 7 – – 365 239 15 – 6 – – 260 252 27 – 6 – – 285 207 20 – 5 – – 232
67 7 – 1 – – 75 21 2 – – – – 23 72 8 – 1 – – 81 94 9 – 2 – – 105
136 14 – 4 – – 154 388 37 – 9 – – 434 374 36 – 8 – – 418
1,391 178 – 32 – – 1,602 70 6 – 1 – – 77
page 71
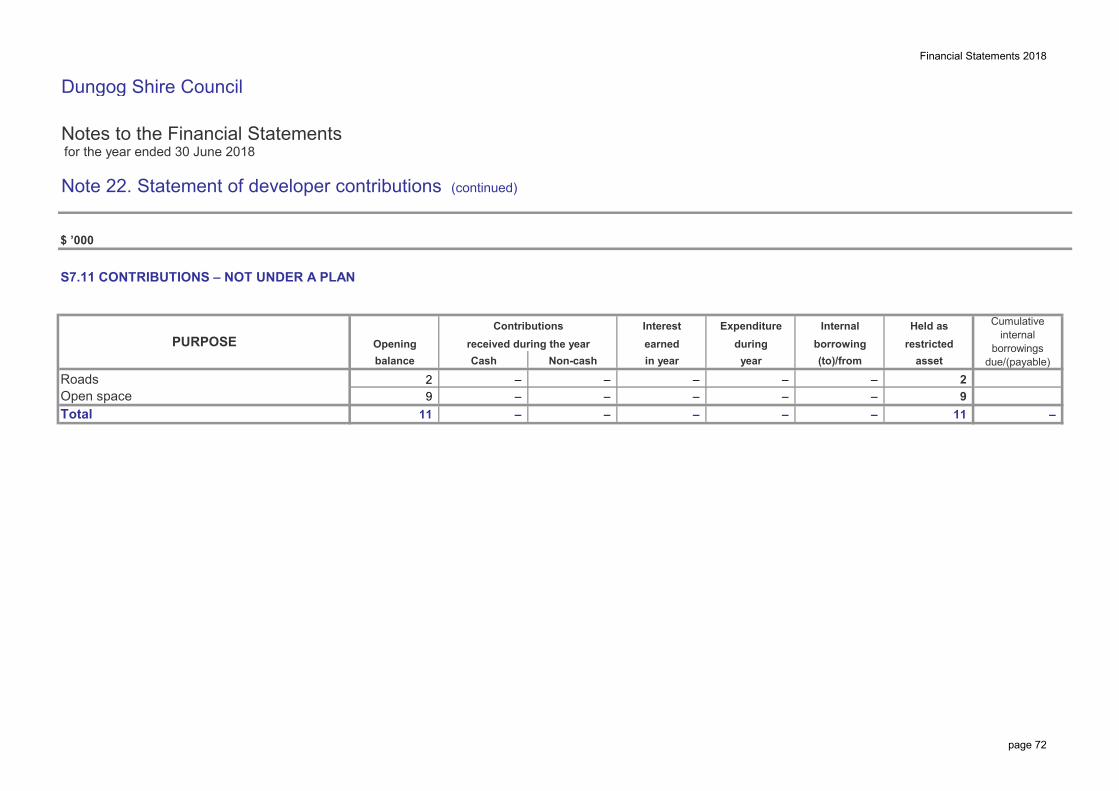
Financial Statements 2018
Dungog Shire Council
Notes to the Financial Statements for the year ended 30 June 2018
Note 22. Statement of developer contributions (continued)
$ ’000
S7.11 CONTRIBUTIONS – NOT UNDER A PLAN
RoadsOpen space
–
Cumulative internal
borrowings due/(payable)in year
– 2 9 –
– Cash Non-cash
received during the yearbalance
– –
Contributions Held asrestricted
Internalborrowingduring
yearOpening
–
earned
11
– 9
asset(to)/from
2 – –
–
–
–
Interest Expenditure
– Total 11 – –
PURPOSE
page 72
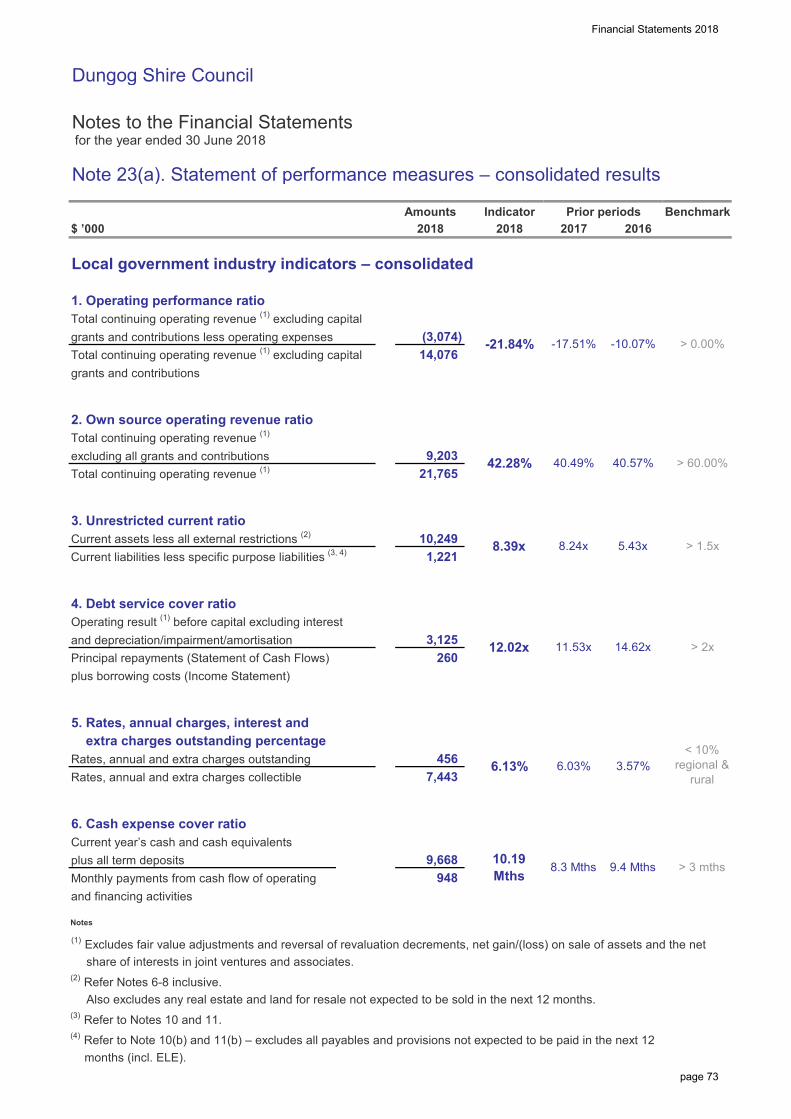
Financial Statements 2018
Dungog Shire Council
Notes to the Financial Statements for the year ended 30 June 2018
Note 23(a). Statement of performance measures – consolidated results
$ ’000
Local government industry indicators – consolidated
1. Operating performance ratioTotal continuing operating revenue (1) excluding capitalgrants and contributions less operating expensesTotal continuing operating revenue (1) excluding capitalgrants and contributions
2. Own source operating revenue ratioTotal continuing operating revenue (1)
excluding all grants and contributionsTotal continuing operating revenue (1)
3. Unrestricted current ratioCurrent assets less all external restrictions (2)
Current liabilities less specific purpose liabilities (3, 4)
4. Debt service cover ratioOperating result (1) before capital excluding interestand depreciation/impairment/amortisationPrincipal repayments (Statement of Cash Flows)plus borrowing costs (Income Statement)
5. Rates, annual charges, interest and extra charges outstanding percentageRates, annual and extra charges outstandingRates, annual and extra charges collectible
6. Cash expense cover ratioCurrent year’s cash and cash equivalentsplus all term depositsMonthly payments from cash flow of operating and financing activities
Notes
(1) Excludes fair value adjustments and reversal of revaluation decrements, net gain/(loss) on sale of assets and the net share of interests in joint ventures and associates.(2) Refer Notes 6-8 inclusive. Also excludes any real estate and land for resale not expected to be sold in the next 12 months.(3) Refer to Notes 10 and 11.(4) Refer to Note 10(b) and 11(b) – excludes all payables and provisions not expected to be paid in the next 12 months (incl. ELE).
6.03%
x12
12.02x
948 9,668
7,443
10.19 Mths
456
260
8.3 Mths > 3 mths
40.49%
5.43x > 1.5x
11.53x > 2x
< 10% regional &
rural
14.62x
9.4 Mths
3.57%
21,765
Indicator
(3,074)
9,203
Amounts
14,076
2018 20162018Benchmark
> 0.00%
6.13%
42.28%
Prior periods
1,221 10,249
3,125
2017
8.24x
40.57%
8.39x
-10.07%-17.51%-21.84%
> 60.00%
X13A0T
X13A1T
page 73

Financial Statements 2018
END OF AUDITED FINANCIAL STATEMENTS
page 74

Financial Statements 2018
Dungog Shire Council
Notes to the Financial Statements for the year ended 30 June 2018
Note 23(b). Statement of performance measures – consolidated results (graphs)
Benchmark: ――― Minimum >=0.00% Ratio achieves benchmarkSource for benchmark: Code of Accounting Practice and Financial Reporting #26 Ratio is outside benchmark
Benchmark: ――― Minimum >=60.00% Ratio achieves benchmarkSource for benchmark: Code of Accounting Practice and Financial Reporting #26 Ratio is outside benchmark
Benchmark: ――― Minimum >=1.50 Ratio achieves benchmarkSource for benchmark: Code of Accounting Practice and Financial Reporting #26 Ratio is outside benchmark
To assess the adequacy of working capital and its ability to satisfy obligations in the short term for
the unrestricted activities of Council.
A reduction in goods and services payables has improved Council’s ability to meet short
term obligations.
Purpose of own source operating
revenue ratio
Commentary on 2017/18 result
2017/18 ratio 42.28%
This ratio measures fiscal flexibility. It is
the degree of reliance on external funding
sources such as operating grants and
contributions.
Own source operating revenue has remained relatively consistent to prior year levels, being significantly below benchmark
requirements of 60%.
Purpose of unrestricted current
ratio
Commentary on 2017/18 result
2017/18 ratio 8.39x
Purpose of operating
performance ratio
Commentary on 2017/18 result
2017/18 ratio -21.84%
This ratio measures Council’s
achievement of containing operating expenditure within operating revenue.
Council's operating performance ratio decreased due to higher operating expenditure associated with road
maintenance
-29%
-10%
-18%-22%
-35%
-30%
-25%
-20%
-15%
-10%
-5%
0%2015 2016 2017 2018
Rat
io %
1. Operating performance ratio
36% 41% 40% 42%
0%
10%
20%
30%
40%
50%
60%
70%
2015 2016 2017 2018
Rat
io %
2. Own source operating revenue ratio
4.8 5.4
8.2 8.4
0.01.02.03.04.05.06.07.08.09.0
2015 2016 2017 2018
Rat
io (x
)
3. Unrestricted current ratio
X14A0T
page 75

Financial Statements 2018
Dungog Shire Council
Notes to the Financial Statements for the year ended 30 June 2018
Note 23(b). Statement of performance measures – consolidated results (graphs)
Benchmark: ――― Minimum >=2.00 Ratio achieves benchmarkSource for benchmark: Code of Accounting Practice and Financial Reporting #26 Ratio is outside benchmark
Benchmark: ――― Maximum <10.00% Ratio is within BenchmarkSource for Benchmark: Code of Accounting Practice and Financial Reporting #26 Ratio is outside Benchmark
Benchmark: ――― Minimum >=3.00 Ratio achieves benchmarkSource for benchmark: Code of Accounting Practice and Financial Reporting #26 Ratio is outside benchmark
Purpose of cash expense cover ratio
Commentary on 2017/18 result
2017/18 ratio 10.19 Mths
This liquidity ratio indicates the number of months a Council can continue paying
for its immediate expenses without
additional cash inflow.
Council remains able to pay its immediate expenses without additional cashflow, for a
period in excess of 10 months
To assess the impact of uncollected rates and annual charges on Council’s liquidity and the adequacy of
recovery efforts.
The level of outstanding property debts remains relatively low to benchmark.
Purpose of debt service cover ratio
Commentary on 2017/18 result
2017/18 ratio 12.02x
This ratio measures the availability of operating cash to
service debt including interest, principal and
lease payments
Council continues to maintain its capacity to service debt obligations.
Purpose of rates and annual charges
outstanding ratio
Commentary on 2017/18 result
2017/18 ratio 6.13%
9.2
14.611.5 12.0
0.0
2.0
4.0
6.0
8.0
10.0
12.0
14.0
16.0
2015 2016 2017 2018
Rat
io (x
)
4. Debt service cover ratio
4.2% 3.6%6.0% 6.1%
0%
2%
4%
6%
8%
10%
12%
2015 2016 2017 2018
Rat
io %
5. Rates, annual charges, interest and extra charges outstanding percentage
9.9
0.0 0.0
10.2
0.0 0.00.0
2.0
4.0
6.0
8.0
10.0
12.0
2015 2016 2017 2018
Rat
io (m
ths)
6. Cash expense cover ratio
page 76
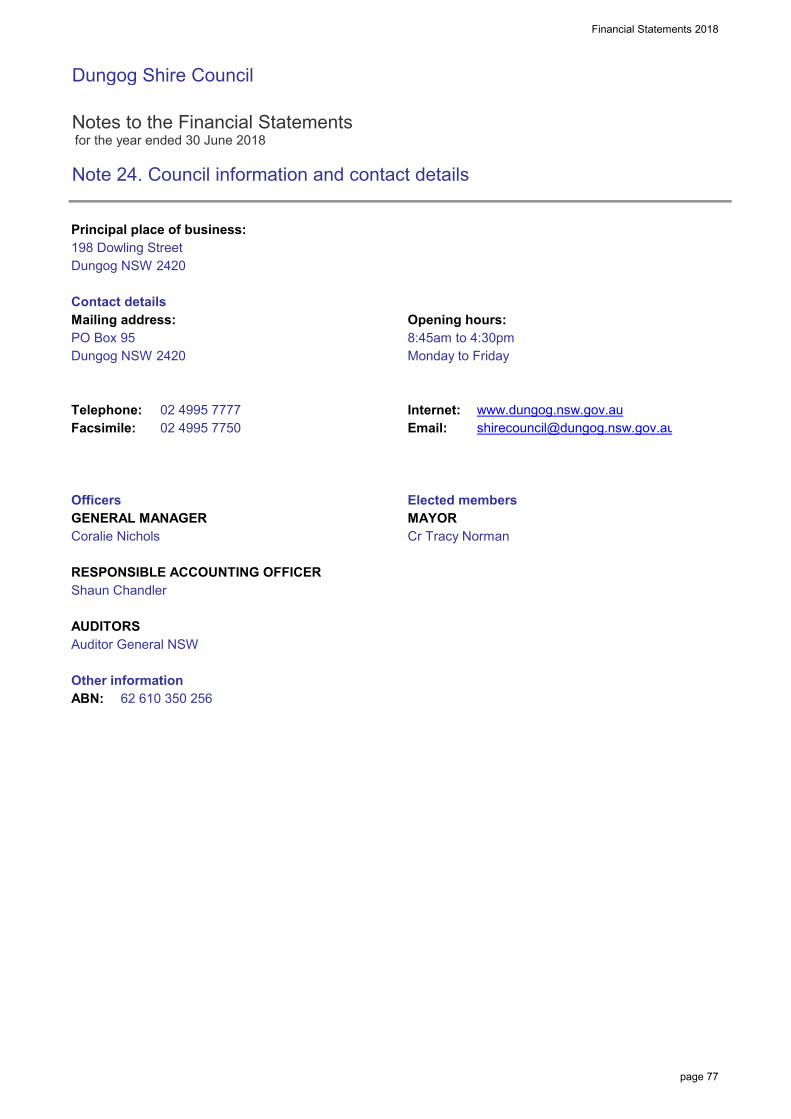
Financial Statements 2018
Dungog Shire Council
Notes to the Financial Statements for the year ended 30 June 2018
Note 24. Council information and contact details
Principal place of business:198 Dowling StreetDungog NSW 2420
Contact detailsMailing address: Opening hours:PO Box 95 8:45am to 4:30pmDungog NSW 2420 Monday to Friday
Telephone: 02 4995 7777 Internet:Facsimile: 02 4995 7750 Email:
Officers Elected membersGENERAL MANAGER MAYORCoralie Nichols Cr Tracy Norman
RESPONSIBLE ACCOUNTING OFFICER COUNCILLORSShaun Chandler
AUDITORS Auditor General NSW
Other informationABN: 62 610 350 256
X15A0T
page 77

INDEPENDENT AUDITOR’S REPORT
Report on the general purpose financial report
Dungog Shire Council
To the Councillors of the Dungog Shire Council
Opinion
I have audited the accompanying financial report of Dungog Shire Council (the Council), which
comprise the Income Statement and Statement of Comprehensive Income for the year ended
30 June 2018, the Statement of Financial Position as at 30 June 2018, the Statement of Changes in
Equity and Statement of Cash Flows for the year then ended, notes comprising a summary of
significant accounting policies and other explanatory information, and the Statement by Councillors
and Management.
In my opinion,
• the Council’s accounting records have been kept in accordance with the requirements of the
Local Government Act 1993, Chapter 13, Part 3, Division 2 (the Division)
• the financial report:
- has been presented, in all material respects, in accordance with the requirements of this
Division
- is consistent with the Council’s accounting records
- presents fairly, in all material respects, the financial position of the Council as at
30 June 2018, and of its financial performance and its cash flows for the year then ended
in accordance with Australian Accounting Standards
• all information relevant to the conduct of the audit has been obtained
• no material deficiencies in the accounting records or financial report have come to light during
the audit.
My opinion should be read in conjunction with the rest of this report.
Basis for Opinion
I conducted my audit in accordance with Australian Auditing Standards. My responsibilities under the
standards are described in the ‘Auditor’s Responsibilities for the Audit of the Financial Report’ section
of my report.
I am independent of the Council in accordance with the requirements of the:
• Australian Auditing Standards
• Accounting Professional and Ethical Standards Board’s APES 110 ‘Code of Ethics for
Professional Accountants’ (APES 110).
I have fulfilled my other ethical responsibilities in accordance with APES 110.

Parliament promotes independence by ensuring the Auditor-General and the Audit Office of
New South Wales are not compromised in their roles by:
• providing that only Parliament, and not the executive government, can remove an
Auditor-General
• mandating the Auditor-General as auditor of councils
• precluding the Auditor-General from providing non-audit services.
I believe the audit evidence I have obtained is sufficient and appropriate to provide a basis for my
audit opinion.
Other Information
Other information comprises the information included in the Council’s annual report for the year ended
30 June 2018, other than the financial report and my Independent Auditor’s Report thereon. The
Councillors are responsible for the other information. At the date of this Independent Auditor’s Report,
the other information I have received comprise the special purpose financial statements and Special
Schedules (the Schedules).
My opinion on the financial report does not cover the other information. Accordingly, I do not express
any form of assurance conclusion on the other information. However, as required by the Local
Government Act 1993, I have separately expressed an opinion on the special purpose financial
statements and Special Schedule 2 - Permissible income for general rates.
In connection with my audit of the financial report, my responsibility is to read the other information
and, in doing so, consider whether the other information is materially inconsistent with the financial
report or my knowledge obtained in the audit, or otherwise appears to be materially misstated.
If, based on the work I have performed, I conclude there is a material misstatement of the other
information, I must report that fact.
I have nothing to report in this regard.
The Councillors’ Responsibilities for the Financial Report
The Councillors are responsible for the preparation and fair presentation of the financial report in
accordance with Australian Accounting Standards and the Local Government Act 1993, and for such
internal control as the Councillors determine is necessary to enable the preparation and fair
presentation of the financial report that is free from material misstatement, whether due to fraud or
error.
In preparing the financial report, the Councillors are responsible for assessing the Council’s ability to
continue as a going concern, disclosing, as applicable, matters related to going concern and using the
going concern basis of accounting except where the Council will be dissolved or amalgamated by an
Act of Parliament, or otherwise cease operations.
Auditor’s Responsibilities for the Audit of the Financial Report
My objectives are to:
• obtain reasonable assurance about whether the financial report as a whole is free from material
misstatement, whether due to fraud or error
• issue an Independent Auditor’s Report including my opinion.
Reasonable assurance is a high level of assurance, but does not guarantee an audit conducted in
accordance with Australian Auditing Standards will always detect material misstatements.
Misstatements can arise from fraud or error. Misstatements are considered material if, individually or
in aggregate, they could reasonably be expected to influence the economic decisions users take
based on the financial report.
A description of my responsibilities for the audit of the financial report is located at the Auditing and
Assurance Standards Board website at: www.auasb.gov.au/auditors_responsibilities/ar4.pdf. The
description forms part of my auditor’s report.

My opinion does not provide assurance:
• that the Council carried out its activities effectively, efficiently and economically
• on the Original Budget information included in the Income Statement, Statement of Cash Flows,
and Note 18 Material budget variations
• on the Special Schedules. A separate opinion has been provided on Special Schedule 2 -
Permissible income for general rates
• about the security and controls over the electronic publication of the audited financial report on
any website where it may be presented
• about any other information which may have been hyperlinked to/from the financial report.
James Sugumar
Director
30 October 2018
SYDNEY

Dungog Shire Council SPECIAL PURPOSE FINANCIAL STATEMENTS for the year ended 30 June 2018
“A vibrant, united community, with a sustainable economy. An area where rural character, community safety,
and lifestyle are preserved.”
SPFS 2017
page 1
Dungog Shire Council
Special Purpose Financial Statements for the year ended 30 June 2018
Council has no material Business Activities
Dungog Shire Council SPECIAL SCHEDULES for the year ended 30 June 2018
“A vibrant, united community, with a sustainable economy. An area where rural character, community safety,
and lifestyle are preserved.”

Special Schedules 2018
Dungog Shire Council
Special Schedules for the year ended 30 June 2018
Contents
Special Schedules 1
Net Cost of Services
Permissible income for general ratesIndependent Auditors Report
Water Supply Operations – incl. Income StatementWater Supply – Statement of Financial Position
Sewerage Service Operations – incl. Income StatementSewerage Service – Statement of Financial Position
Notes to Special Schedules 3 and 5
Report on Infrastructure Assets
1 Special Schedules are not audited (with the exception of Special Schedule 2).
Background
These Special Schedules have been designed to meet the requirements of special purpose users such as;
the NSW Grants Commissionthe Australian Bureau of Statistics (ABS),the NSW Office of Water (NOW), andthe Office of Local Government (OLG).
The financial data is collected for various uses including;
the allocation of Financial Assistance Grants,the incorporation of Local Government financial figures in national statistics,the monitoring of loan approvals,the allocation of borrowing rights, andthe monitoring of the financial activities of specific services.
6Special Schedule 7
(ii)
(i)
n/a
n/a
Page
2
n/an/a
Special Schedule 6Special Schedule 5 n/a
Special Schedule 1
Special Schedule 3
Special Schedule 2 4Special Schedule 2 5
Special Schedule 4
page 1

Special Schedules 2018
Dungog Shire Council
Special Schedule 1 – Net Cost of Services for the year ended 30 June 2018
$’000
Governance
Administration
Public order and safety
Beach controlEnforcement of local government regulationsAnimal controlOtherTotal public order and safety
Health
EnvironmentNoxious plants and insect/vermin controlOther environmental protectionSolid waste managementStreet cleaningDrainageStormwater managementTotal environment
Community services and educationAdministration and educationSocial protection (welfare)Aged persons and disabledChildren’s servicesTotal community services and education
Housing and community amenitiesPublic cemeteriesPublic conveniencesStreet lightingTown planningOther community amenitiesTotal housing and community amenities
Water supplies
Sewerage services
–
– –
Expenses from. continuing. operations. Non-capital.
33
–
42 –
Capital.
Income fromcontinuing operations
11
8
57 59
2,047
61
2,205
110
–
–
–
431 123
–
231
119 3
–
20
– – –
885
308
2 (129)
(596) (96)
3 885
–
–
38
720
–
1,502
538
347
– – (543)
– (19)
–
27
33 –
604 –
44
25
Function or activity
–
Fire service levy, fire protection, emergency services
–
–
116 827
Net cost.of services.
(22) –
(513)
–
133 (44)
1,022 – – (1,022)
(8) – –
(1,111)
–
25
139
136
197
129
112 –
–
– –
1,231
36
40 –
1,697
2,072 86
–
– –
861
4
–
(511)
807
– 61
–
–
(57)
(80)
350 –
–
– (53)
(40)
–
X2A0T
page 2

Special Schedules 2018
Dungog Shire Council
Special Schedule 1 – Net Cost of Services (continued) for the year ended 30 June 2018
$’000
Recreation and culturePublic librariesMuseumsArt galleriesCommunity centres and hallsPerforming arts venuesOther performing artsOther cultural servicesSporting grounds and venuesSwimming poolsParks and gardens (lakes)Other sport and recreationTotal recreation and culture
Fuel and energy
Agriculture
Mining, manufacturing and constructionBuilding controlOther mining, manufacturing and constructionTotal mining, manufacturing and const.
Transport and communicationUrban roads (UR) – localUrban roads – regionalSealed rural roads (SRR) – localSealed rural roads (SRR) – regionalUnsealed rural roads (URR) – localUnsealed rural roads (URR) – regionalBridges on UR – localBridges on SRR – localBridges on URR – localBridges on regional roadsParking areasFootpathsAerodromesOther transport and communicationTotal transport and communication
Economic affairsCamping areas and caravan parksOther economic affairsTotal economic affairs
Totals – functionsGeneral purpose revenues (1)
NET OPERATING RESULT (2)
(1) Includes: rates and annual charges (including ex gratia, excluding water and sewer), non-capital general purpose (2) As reported in the Income Statement
grants, interest on investments (excluding externally restricted assets) and interest on overdue rates and annual charges
Income fromcontinuing operations
– – –
–
40
–
18,249
–
8,889 1,516
491 304
13,568
225
194 187
8,096 18,249
31
86
5,386
– –
8,283
–
–
–
– –
120
– –
–
11 –
52 –
143
1
– –
6,300
Function or activity
118
–
–
–
–
– –
–
–
235
–
–
932
–
–
–
–
145
53 –
– 1,054 1,757
1 – 67
– –
–
457
312
54 – 3,061 2,109
–
–
Non-capital.
–
Expenses from. continuing. operations.
435
365 365
–
10
– –
– 986
– –
778 1
2,751
118
16
5,562
(52)
(365)
– –
–
(636)
801 1
–
Capital.
7
11
–
–
685 – –
8,283
(2,066) (986)
– (1)
3,602
86
(4,580)
(266)
7
(1,073(11)
(273)
(120)
–
–
–
–
8,096
224 94
–
(177) (94)
273
(143)
–
(339)
(114)
(252)
–
Net cost.of services.
(879)
(194)
(54)
(145)
(777)
4,610
–
(1) 367
Share of interests – joint ventures and associates using the equity method
page 3

Special Schedules 2018
Dungog Shire Council
Special Schedule 2 – Permissible income for general rates for the year ended 30 June 2019
$’000
Notional general income calculation (1)
Last year notional general income yieldPlus or minus adjustments (2)
Notional general income
Permissible income calculation
Special variation percentage (3)
Or rate peg percentageOr crown land adjustment (incl. rate peg percentage)
Less expiring special variation amountPlus special variation amount
Or plus rate peg amountOr plus Crown land adjustment and rate peg amount
Sub-total
Plus (or minus) last year’s carry forward totalLess valuation objections claimed in the previous yearSub-total
Total permissible income
Less notional general income yieldCatch-up or (excess) result
Plus income lost due to valuation objections claimed (4)
Less unused catch-up (5)
Carry forward to next year
Notes
(1) The notional general income will not reconcile with rate income in the financial statements in the correspondingyear. The statements are reported on an accrual accounting basis which include amounts that relate to prior years’rates income.
(2) Adjustments account for changes in the number of assessments and any increase or decrease in land value occurringduring the year. The adjustments are called ‘supplementary valuations’ as defined in the Valuation of Land Act 1916 .
(3) The ‘special variation percentage’ is inclusive of the rate peg percentage and where applicable Crown land adjustment.
(4) Valuation objections are unexpected changes in land values as a result of land owners successfully objecting to theland value issued by the Valuer-General. Councils can claim the value of the income lost due to valuation objections inany single year.
(5) Unused catch-up amounts will be deducted if they are not caught up within 2 years. Usually councils will have anominal carry forward figure. These amounts can be adjusted for in setting the rates in a future year.
(6) Carry forward amounts which are in excess (an amount that exceeds the permissible income) require ministerial approval by order published in the NSW Government Gazette in accordance with section 512 of the Local Government Act 1993 . The OLG will extract these amounts from Council’s Special Schedule 2 in the financial data return (FDR) to administer this process.
pq = o – p
rs
t = q + r – s
b
def
j = c x fi = c x e
h = d x (c – g)
c = (a + b)
lm
n = (l + m)
o = k + n
g
k = (c + g + h + i + j)
a
16 (0)
Calculation Calculation2017/182018/19
– –
(1) (0)
17 –
5,524 5,671
5,525 5,671
– (17) – (1)
– –
– 16
82 128 – –
5,524 5,672
0.00%0.00%
– –
0.00%0.00%1.50%2.30%
5,430 5,525 13 19
5,443 5,544
X3A0T
page 4

INDEPENDENT AUDITOR’S REPORT
Special Schedule 2 - Permissible Income for general rates
Dungog Shire Council
To the Councillors of Dungog Shire Council
Opinion
I have audited the accompanying Special Schedule 2 – Permissible Income for general rates (the
Schedule) of Dungog Shire Council (the Council) for the year ending 30 June 2019.
In my opinion, the Schedule of the Council for the year ending 30 June 2019 is prepared, in all
material respects in accordance with the requirements of the Local Government Code of Accounting
Practice and Financial Reporting (LG Code) issued by the Office of Local Government (OLG), and is
in accordance with the books and records of the Council.
My opinion should be read in conjunction with the rest of this report.
Basis for Opinion
I conducted my audit in accordance with Australian Auditing Standards. My responsibilities under the
standards are described in the ‘Auditor’s Responsibilities for the Audit of the Schedule’ section of my
report.
I am independent of the Council in accordance with the requirements of the:
• Australian Auditing Standards
• Accounting Professional and Ethical Standards Board’s APES 110 ‘Code of Ethics for
Professional Accountants’ (APES 110).
I have fulfilled my other ethical responsibilities in accordance with APES 110.
Parliament promotes independence by ensuring the Auditor-General and the Audit Office of
New South Wales are not compromised in their roles by:
• providing that only Parliament, and not the executive government, can remove an
Auditor-General
• mandating the Auditor-General as auditor of councils
• precluding the Auditor-General from providing non-audit services.
I believe that the audit evidence I have obtained is sufficient and appropriate to provide a basis for my
audit opinion.
Emphasis of Matter – Basis of Accounting
Without modifying my opinion, I draw attention to the special purpose framework used to prepare the
Schedule. The Schedule had been prepared for the purpose of fulfilling the Council’s reporting
obligations under the LG Code. As a result, the Schedule may not be suitable for another purpose.
Other Information
Other information comprises the information included in the Council’s annual report for the year ended
30 June 2018, other than the Schedule and my Independent Auditor’s Report thereon. The Councillors
are responsible for the other information. At the date of this Independent Auditor’s Report, the other
information I have received comprise the general purpose financial statements, special purpose
financial statements and the Special Schedules excluding Special Schedule 2 (the other Schedules).
My opinion on the Schedule does not cover the other information. Accordingly, I do not express any
form of assurance conclusion on the other information. However, as required by the Local
Government Act 1993, I have separately expressed an opinion on the general purpose financial
statements and the special purpose financial statements.
In connection with my audit of the Schedule, my responsibility is to read the other information and, in
doing so, consider whether the other information is materially inconsistent with the Schedule or my
knowledge obtained in the audit, or otherwise appears to be materially misstated.
If, based on the work I have performed, I conclude there is a material misstatement of the other
information, I must report that fact.
I have nothing to report in this regard.
The Councillors’ Responsibilities for the Schedule
The Councillors are responsible for the preparation of the Schedule in accordance with the LG Code.
The Councillors’ responsibility also includes such internal control as the Councillors determine is
necessary to enable the preparation of the Schedule that is free from material misstatement, whether
due to fraud or error.
In preparing the Schedule, the Councillors are responsible for assessing the Council’s ability to
continue as a going concern, disclosing, as applicable, matters related to going concern and using the
going concern basis of accounting, unless it is not appropriate to do so.
Auditor’s Responsibilities for the Audit of the Schedule
My objectives are to:
• obtain reasonable assurance whether the Schedule as a whole is free from material
misstatement, whether due to fraud or error
• issue an Independent Auditor’s Report including my opinion.
Reasonable assurance is a high level of assurance, but does not guarantee an audit conducted in
accordance with Australian Auditing Standards will always detect material misstatements.
Misstatements can arise from fraud or error. Misstatements are considered material if, individually or
in aggregate, they could reasonably be expected to influence the economic decisions users take
based on the Schedule.
A description of my responsibilities for the audit of the Schedule is located at the Auditing and
Assurance Standards Board website at: www.auasb.gov.au/auditors_responsibilities/ar8.pdf. The
description forms part of my auditor’s report.

My opinion does not provide assurance:
• that the Council carried out its activities effectively, efficiently and economically
• about the security and controls over the electronic publication of the audited Schedule on any
website where it may be presented
• about any other information which may have been hyperlinked to/from the Schedule.
James Sugumar
Director
30 October 2018
SYDNEY

Special Schedules 2018
Dungog Shire Council
Special Schedule 7 – Report on Infrastructure Assets as at 30 June 2018
$’000
–
2,690 240
4.6%365,863 14,295 3,054
21%14.0%
8,746
20
562 5%
35.3%
1,606 21.0%
3,300 Sub-total
32,391 74.0%
29%16%
22.0%133
490
40
350 469
Other road assets41 144
46,248
Footpaths
6,662
133 –
28
7%
3,010 2,511
199,204 17,845
1,982 80% 0%
6%
53
1.0%6,662 13%263 490 1%
4
74%12%32,391 13.0%
43%
8%
Roads
Other
Sub-total
Asset categoryRequired Actual replacement
cost (GRC)maintenanceato satisfactory
Estimated cost
agreed level ofservice set by
Council
28,201
21
67%
8.0%
11%91,947
Sealed roads
Other structuresSub-total
Asset class
Buildings
to bring assetsEstimated cost
2017/18to bring to the 2017/18 Gross
standard maintenance
Buildings
14% 22% 35%1,606
12.0%
10%21%
9%
100%
7,886
847
Unsealed roads
466
24,579 14,348 7,177 Bridges
466 847
125,010 11,199 21,979 1,001
91,947
structures
37%
27.0% 8.5%25.1%251,131
9%
40
28,201 263 0.0%
30% 1%1,242 0%
55,625
35.0%
Assets in condition as a percentage of gross replacement cost
Net carryingamount
7,888
19%0% 1%
X5A0T
page 6
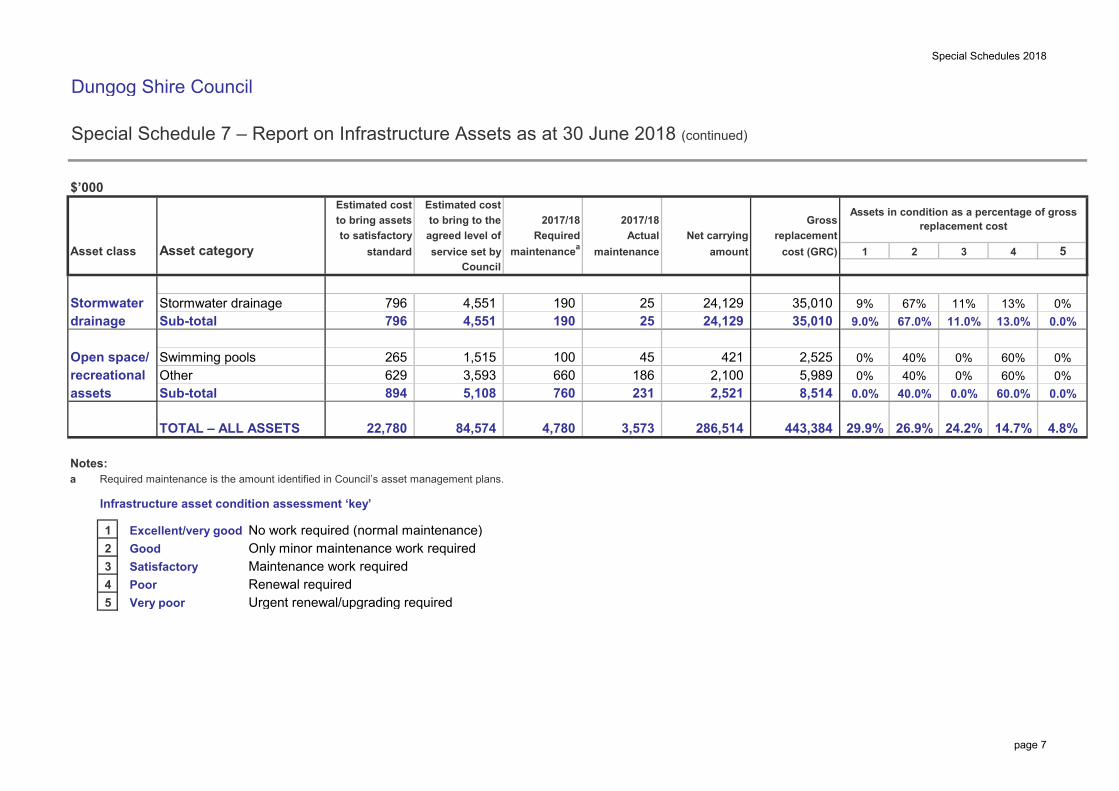
Special Schedules 2018
Dungog Shire Council
Special Schedule 7 – Report on Infrastructure Assets as at 30 June 2018 (continued)
$’000
Notes:a Required maintenance is the amount identified in Council’s asset management plans.
Infrastructure asset condition assessment ‘key’
Excellent/very good No work required (normal maintenance) Condition Description here…Good Only minor maintenance work required Condition Description here…Satisfactory Maintenance work required Condition Description here…Poor Renewal required Condition Description here…Very poor Urgent renewal/upgrading required Condition Description here…
5replacement
67%
5
796
recreational 629 660
Stormwater
Gross
4,551 796 35,010
maintenanceActualRequiredto satisfactory
standard
drainage 35,010 Sub-total 9.0%
Open space/
24,129
421 2,100
4,551
Other
Asset categoryNet carrying
amountmaintenancea
to bring to the
Council
Estimated cost
agreed level ofservice set by 3cost (GRC)
13%24,129 11%190 25
2017/18
0%
Swimming pools 265
5,108
2017/18
9%
21
0%0% 60%
40.0% 0.0% 60.0% 0.0%2,521 3,593 1,515
67.0% 13.0%11.0%
0%
25 0.0%190
100 45
4
assets Sub-total
2,525 0% 40%
to bring assets
Asset class
60%
Stormwater drainage
894 760 231 8,514 0.0%186 5,989 0% 40% 0%
Estimated cost
3,573 443,384 29.9% 26.9% 24.2% 14.7% 4.8%84,574
Assets in condition as a percentage of gross replacement cost
4321 6
10987
286,514 TOTAL – ALL ASSETS 22,780 4,780
page 7

Special Schedules 2018
Dungog Shire Council
Special Schedule 7 – Report on Infrastructure Assets (continued) for the year ended 30 June 2018
$ ’000
Infrastructure asset performance indicators * consolidated
1. Buildings and infrastructure renewals ratio (1)
Asset renewals (2)
Depreciation, amortisation and impairment
2. Infrastructure backlog ratio (1)
Estimated cost to bring assets to a satisfactory standardNet carrying amount of infrastructure assets
3. Asset maintenance ratioActual asset maintenanceRequired asset maintenance
4. Cost to bring assets to agreed service level
Gross replacement cost
Notes
* All asset performance indicators are calculated using the asset classes identified in the previous table.
(1) Excludes Work In Progress (WIP)
(2) Asset renewals represent the replacement and/or refurbishment of existing assets to an equivalent capacity/performance as opposed to the acquisition of new assets (or the refurbishment of old assets) that increases capacity/performance.
2017 2016
5,760
22,780 7.95% 7.01% 11.91%286,514
5,503
Amounts Prior periods
74.75% 72.33% 59.92%
2018
>= 100%
< 2.00%
> 100%
BenchmarkIndicator
104.67% 92.37% 216.31%
2018
3,573
443,384
Estimated cost to bring assets toan agreed service level set by Council
4,780
19.07% 10.10% 0.00%84,574
page 8

Special Schedules 2018
Dungog Shire Council
Special Schedule 7 – Report on Infrastructure Assets (continued) for the year ended 30 June 2018
Benchmark: ――― Minimum >=100.00% Ratio achieves benchmarkSource for benchmark: Code of Accounting Practice and Financial Reporting #26 Ratio is outside benchmark
Benchmark: ――― Maximum <2.00% Ratio achieves benchmarkSource for benchmark: Code of Accounting Practice and Financial Reporting #26 Ratio is outside benchmark
Benchmark: ――― Minimum >100.00% Ratio achieves benchmarkSource for benchmark: Code of Accounting Practice and Financial Reporting #26 Ratio is outside benchmark
Purpose of agreed service level ratio
Commentary on 2017/18 result
2017/18 Ratio 19.07%
Improvement from prior year
Commentary on 2017/18 result
2017/18 Ratio 7.95%
2017/18 Ratio 74.75%
Reflects a deterioration from prior period.
Commentary on 2017/18 result
Purpose of asset renewals ratio
Compares actual vs. required annual asset maintenance. A ratio
above 100% indicates Council is investing
enough funds to stop the infrastructure backlog growing.
Reflects an improvement from prior period, however still below benchmark
requirements.
To assess the rate at which these assets are being renewed
relative to the rate at which they are depreciating.
Purpose of infrastructure backlog ratio
This ratio provides a snapshot of the
proportion of outstanding renewal works compared to the total value of
assets under Council's care and
stewardship.
Whilst Council has invested in asset renwals, further investment is required to
bring assets to agreed service levels.
Commentary on 2017/18 result
Purpose of asset maintenance ratio
This ratio showswhat proportion the backlog is against
the total valueof a Council’s infrastructure.
2017/18 Ratio 104.67%
176%216%
105%92%
0%
50%
100%
150%
200%
250%
2015 2016 2017 2018
Rat
io %
1. Buildings and infrastructure renewals ratio
12.5% 11.9%
7.0% 8.0%
0.0%2.0%4.0%6.0%8.0%
10.0%12.0%14.0%16.0%
2015 2016 2017 2018
Rat
io %
2. Infrastructure backlog ratio
50% 60%72% 75%
0%10%20%30%40%50%60%70%80%90%
100%
2015 2016 2017 2018
Rat
io %
3. Asset maintenance ratio
0%
10%
19%
0%2%4%6%8%
10%12%14%16%18%20%
2016 2017 2018
Rat
io %
4. Cost to bring assets to agreed service level
page 9