Embed Size (px)
Citation preview

DUNN MILL - A MINERAL PROCESSING FACILITY
316.41 ACRES Dunn Siding, California
For Advanced Bio-Mineral Technologies, LLC
& American Resource Holdings, LLC
Marshall W. Pettit, President
10120 S. Eastern Avenue, Suite 207 Henderson, Nevada 89052
Lender/Client: Morris Financial Group, LLC
BY:
Paul T. Jacobs, SCGA California State Certified General Appraiser AG005064 Exp. 8/2/14

JACOBS APPRAISAL & CONSULTING 22911 PAPAGO ROAD, TOWN OF APPLE VALLEY, CA 92307
760-240-9978 OFFICE * 760-240-9627 FAX [email protected]
April 10, 2013 Marshall W. Pettit Advanced Bio-Mineral Technologies, LLC American Resource Holdings, LLC 10120 S. Eastern Avenue, Suite 207 Henderson, Nevada 89052 Appraisal File No.: 11754 RE: Estimate of Fee Simple Value as is of 316.41 Gross Acres Dunn Siding, California Dear Mr. Pettit: Pursuant to your requested assignment for valuation on the aforementioned property, I have prepared a summary narrative appraisal report. I have conducted the investigation and analysis necessary to form an opinion of market value of the subject property and improvements thereon. In evaluating the 316.41 gross acres, copies of the grant deeds for the subject property and the comparables are located in the Addenda section of the report. The Subject has good physical access to the land via the frontage Road as well as good freeway visibility and exposure. As of the date of the appraisal, the highest and best use of the subject is as land suitable for industrial development with multiple Rail Spurs and Permits from San Bernardino County. The appraisal and final value estimate are based on an inspection of the subject property in the company of its operators and the analysis of the factors that influence real estate values in the area. The report is prepared according to the guidelines of the California Association of Real Estate Appraisers, of which I am a life member and is subject to its Code of Professional Ethics and Uniform Standards of Professional Practice (USPAP) of the Appraisal Foundation. Due to the unique and complicated nature of this particular assignment, I have chosen to separate the valuation of the land and improvements. This is conforming with the Uniform Standards and conforming with sound and reasoned appraisal practice when valuing a unique property such as the Dunn processing mill.

Based on the investigation and analysis undertaken, and subject to the Assumptions and Limiting Conditions set forth in this report, the appraisers are of the opinion that the value as of December 31, 2012 is:
$23,060,000.00
TWENTY THREE MILLION SIXTY THOUSAND DOLLARS Upon review of comparable market area transactions and discussions with local area brokers, appraisers, and researching similar mills found on the internet, I estimate the exposure time for the subject “As Is,” based on the appraised value, is 12 to 18 months if properly exposed to the niche market to which it belongs and aggressively marketed by knowledgeable sales staff. The above indicated value includes in-place and un-mined sand and gravel aggregates estimates of current value based on the California Non-Fuels Mineral Reports issued by the State of California. Also included are valuations of the un-adjudicated abilities to pump water from the Mojave River basin. Respectfully Submitted,
Paul T. Jacobs California Certified General Appraiser State Certification # AG005064 Expires 8/2/2014
MEMBER VICTOR VALLEY APPRAISERS ASSOCIATION
REAL ESTATE APPRAISERS ASSOCIATION INTERNATIONAL RIGHT OF WAY ASSOCIATION

I
TABLE OF CONTENTS EXECUTIVE SUMMARY 01 INTRODUCTION 02 MARKET VALUE DEFINITION 04 HIGHEST & BEST USE 05 COMPETENCY 05 INTENDEDED USE & USERS 06 LEGAL DESCRIPTION 06 VESTING 07 DEMOGRAPHIC ANALYSIS SAN BERNARDINO COUNTY & BARSTOW AREA 09-39 AERIAL PHOTOS OF SUBJECT 40 RAIL 41 UTILITIES 52 PLAT MAP 54 PROPERTY DIMENSIONS 55 SOLAR POTENTIAL ON EXCESS LAND 56 ZONING 58 METHODOLOGY 59 LAND SALES APPROACH – MARKET COMPARISON 60 LAND CONCLUSION 64

II
TABLE OF CONTENTS – con’t LAND SUMMARY SPREADSHEET 65 COMPARABLES 1 – 7 DETAIL 67-81 WATER & MINERALS VALUATION 82 IMPROVEMENTS VALUATION 84-87 RECONCILIATION 88 ASSUMPTIONS & LIMITING CONDITIONS 89-90 CERTIFICATION 91-92 GRANT DEED 95 CALIFORNIA NON-FUELS MINERAL REPORT 96-99 MOJAVE WATER AGENCY ADJUDICATION MAP 100 GEOLOGY AND SOILS MAP 101 EQUIPMENT LISTING BYDAVID NADWODNY, PROJECT MANAGER 102-103

1
EXECUTIVE SUMMARY
Prepared For: Advanced Bio-Minerals Technology, LLC, American Resource Holdings, LLC, & Morris Financial Group, LLC. Identification of Properties: 316.41 Gross Acres situated adjacent to the 15 Freeway, in the unincorporated area of San Bernardino County, 30 Miles NE of the City of Barstow, California. Assessor Parcel Number: 0542-141-19-0-000. Thomas Map No: 350-A5. Date of Value: December 31, 2012, the last date of physical inspection. Property Rights Appraised: Fee Simple Value As Is. Land Area: 316.41Gross Acres gross. Improvements: Mill and support structures, Rail Spur, Scale & Siding (Union Pacific Property), Single Family residence and water well system. Zoning: Industrial* use within RC Resource Conservation District Zone. Flood Zone: Not in a known Flood Zone, except that portion in the Mojave River AO zone. Earthquake: None located on the Maps of the subject. However, further study may be needed. Utilities: Telephone / Electric / Wells / High Pressure Natural Gas property/Petroleum line Highest & Best Use of Subject Properties: Development of Industrial complex associated with the Rail Spur As Vacant: Speculative land suitable for Industrial Development. Lender/client: Morris Financial Group.

2
INTRODUCTION Scope of the Appraisal Depending upon circumstances, various valuation techniques are utilized in appraising industrial properties. Sometimes it is a good idea to utilize more than one and compare them if other methods are available for use. If there is little or no business on the rail line or plant, then Net Liquidation Value (NLV) is the amount that could be realized were operations to cease and the railroad dismantled and liquidated or the industrial development was dismantled and liquidated. In the NLV approach, the gross value of equipment, track components, plant and land is estimated and from that are deducted the costs to dismantle, salvage, hold, administer and reclaim the assets. The remainder is the NLV, or the proceeds that could be realized by the owner from scrapping the assets of the railroad access and plant. Commercial lenders often want to determine the NLV of a plant on Rail Spurs that could be scrapped were it a financial failure because in those circumstances NLV represents a form of collateral. Comparable Sales is another valuation method commonly used in valuing real estate or real property, but is used with respect to railroads only with extreme caution, given the unique characteristics of each and the limited amount of market sales in a given region. For this Appraisal, the Appraisers assigned the most weight for the “Rail Spur” to the “Cost Approach” of developing the spur and siding and assigned the most weight to the “Comparable Sales Approach” for the value of industrial land in the subjects region. The “Income Approach” was utilized to factor the demand and market value of the Sand and Gravel needed to be removed as a part of the development of an industrial site. The income approach was also applied to the intended continuing use of the plant for the production of Alunite (K AL3 [SO4] 2 [OH] 6) mined from Blawn Mountain, Beaver County, Utah. See attached geologic report issued by Frederic C. Johnson and Dr, Filberto Gomez, PhD at Industrial Mineral Developments, Inc., estimated $107.6 Million over 10 years’ time. As a part of this appraisal, the appraiser made a number of independent investigations and analyses, including but not limited to the number of privately owned parcels on or adjacent to a rail spur in the subjects region and the effect of the location of each of these spurs on their value. The investigations undertaken and the major data sources used are summarized below. Regional Analysis - The appraisers City Analysis relied on observations while physically inspecting the properties within the subjects region and utilized in this report. This section discusses the history of this area of San Bernardino County and the City of Barstow due to its sphere of influence. The appraiser discussed current, recent, and proposed activities.

3
Neighborhood Analysis - The appraiser Neighborhood Analysis relied on the observations while physically inspecting the subject neighborhood and the comparable sale properties utilized in this report. This section discusses predominant development types and those land uses surrounding the subject property. The appraiser discussed current, recent, and proposed land development activity with brokers, developers, and Planners on the staffs of County of San Bernardino Planning and Engineering Departments. Site Description - The appraiser describes the subject site. My descriptions relied on Assessor’s plat maps, Aerial photography, review of public records, physical inspections, and discussions with the property owners. Land Data Program - The appraiser has collected, analyzed, and, when possible, verified sales of relevant land parcels, industrial parcels on or adjacent to an existing Union Pacific Rail Spur. The appraiser has physically inspected each of the land sale data utilized in this report. Market Analysis - The appraisers Market Analysis relied on the observations while researching and physically inspecting the subject property and any comparable sales utilized in this report. This section discusses the demand for this type of property and analyses the individual comparables to evaluate the similarity to the subject property. The appraiser has discussed current, recent, and proposed land development activity for each of the sales with brokers, developers, and Planners on the staffs of County of San Bernardino Planning and Engineering Departments. The appraiser also researched factors impacting demand for and viability of a development of the parcel and the product Alunite. The analysis further investigated the impact of location and current trends that would add to or take from the future appeal of development. This factor could lead to an added incentive for an informed speculative investor and would add to demand as well as raise the anticipated future value. After conducting a thorough investigation of the market and adjustments for the characteristics of each sale, the appraisers provided an opinion of value for the underlying land. No recent sales of similar processing plants were found reasonably nearby to allow a market comparison of similar mills. See cost approach. Cost Analysis - The appraisers’ Cost Analysis relied on their observations while physically inspecting the subject property. The appraiser has evaluated the market cost to develop the Rail Spur on or directly adjacent to the subject parcel. This analysis relied only on the actual cost and did not estimate the time or additional fees incurred in the establishment of a relationship with the Railroad. After conducting a thorough investigation and consulting with Marshall & Swift and David Nadwodny, Project Manager, of the costs I have provided an opinion of value as new and as depreciated based on my observations.
4
Income Analysis - The appraiser Income Analysis relied on the observations while physically inspecting the subject property as well as information obtained through industry sources as to the value of commodities and the information provided by the property owner as to the estimated amount of gravel at the subject location and the amount of production of Alunite available at Blawn Mountain mine, Beaver County, Utah. The appraiser has reviewed the market cost to remove and classify the material and the income that it would generate as reported by Geologists Johnson and Gomez. Additional data relied upon was the California Non-Fuel Minerals Reports.
DEFINITIONS
Market Value “...the most probable price which a property should bring in a competitive open market under all conditions requisite to a ‘fair sale’, the buyer and seller each acting prudently, knowledgeably, and assuming the price is not affected by undue stimulus. Implicit in this definition are the consummation of a sale as of a specified date and the passing of title from seller to buyer under conditions whereby: (a) buyer and seller are typically motivated; (b) both parties are well informed or well advised, and each acting in what they
consider their own best interests; (c) a reasonable time is allowed for exposure in the open market; (d) payment is made in terms of cash in U.S. Dollars or in terms of financial
arrangements comparable thereto; and, (e) the price represents the normal consideration for the property sold unaffected by
special or creative financing or sales concessions granted by anyone associated with the sale.”
In addition, the following is part of the market value consideration as of the appraisal date. “Market Value as is on appraisal date - Market Value of a property in the condition observed upon inspection and as it physically and legally exists without hypothetical conditions, assumptions or qualifications as of the date the appraisal is prepared.”
5
Fee Simple Estate The real estate interest appraised is the fee simple estate as of the effective date of the appraisal. The Dictionary of Real Estate Appraisal, 3rd Edition, 1993, defines fee simple estate as follows:
Absolute ownership unencumbered by any other interest or estate, subject only to the limitations imposed by the governmental powers of taxation, eminent domain, police power, and escheat.
Highest and Best Use Highest and best use is defined by The Dictionary of Real Estate Appraisal, 3rd Edition, 1993, as follows:
The reasonably probable and legal use of vacant land or an improved property, which is physically possible, appropriately supported, financially feasible and that results in the highest value. The four criteria the highest and best use must meet are legal permissibility, physical possibility, financial feasibility, and maximum return to the land.
Exposure Time The Uniform Standards of Professional Appraisal Practice (1998) defines exposure time as follows:
The estimated length of time the property interest being appraised would have been offered on the market prior to the hypothetical consummation of a sale at market value on the effective date of appraisal; a retrospective estimate based upon an analysis of past events assuming a competitive and open market.
Competency Provision In 1990, most federally regulated institutions adopted the Uniform Standards of Professional Appraisal Practice, which mandated that appraisers become either certified or licensed under state regulations. This competency provision was subject to the implementation of state licensing and certification. The State of California has fulfilled this requirement and requires appraisals for federally regulated institutions to be performed by either licensed or certified appraisers. The appraiser is currently licensed and certified with the State of California as a General Appraiser, the highest ranking type certification, has previously appraised this and this property type, and has attained a level of competency necessary to complete the assignment in a diligent manner. Refer to the Professional Qualifications addendum for details of the appraiser technical training and experience. I have previously appraised this property, the Protech crusher mill in Victorville, the Old Dunn mill, and property adjacent to the subject on the Southwest. I have personally inspected the Mitsubishi Cement plant in Lucerne Valley, the Omya plant in Lucerne Valley, a crusher plant, and the Southwest Portland Cement plant in Victorville,
6
California. I have also inspected and appraised mineral deposits in the High Desert and Cajon Pass for aggregates and sand employing geological reports issued by geologists. I recently completed course work in Geology offered by West Virginia University. I currently teach at Victor Valley College (VVC) courses in Basic Appraisal of Real Estate, Advanced Income Appraisal, Advanced Land Appraisal, and Advanced Appraisal Review and Compliance. I have been teaching at VVC since 2000. My classes are accepted at par by The California State University and College systems. Intended Use and User of the Report The intended use of this summary narrative appraisal is for valuation of the subject land for loan purpose. The intended users are Marshall W. Pettit, Advanced Bio-Mineral Technologies, LLC, American Resource Holdings, LLC, and their lender, Morris Financial Group, LLC, for use in obtaining financing and potentially issuing public stock. No other use or user is intended. Legal Description
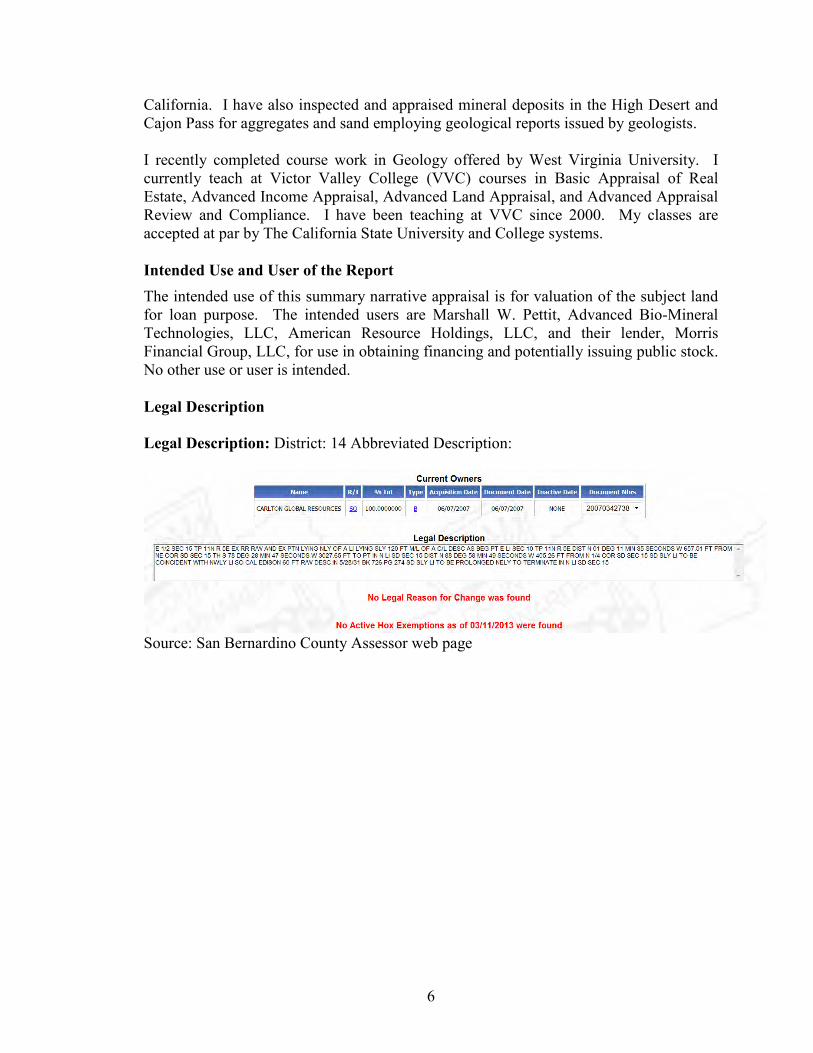
Legal Description: District: 14 Abbreviated Description:
Source: San Bernardino County Assessor web page

7
OWNERSHIP AND PROPERTY HISTORY
Mortgage Record
Recording Date 02/14/2008 Document # 2008-0069183 BK-PG Loan Amount: $24,000,000 Loan Type Unknown TD Due Date Type of Financing Lender Name Main Street Capital II LP Buyer Vesting N/A Lender Type Other Vesting Borrowers Name Carlton Global Resources, LLC
Prior Transfer
Recording Date 06/07/2007 Document # 2007-0342738 Price $3,000,000 Document Type Corporation Grant Deed
First TD $2,400,000 Type of Sale Full-Computed from Transfer Tax
Mortgage Doc # 2007-0342739 Interest Rate Lender Name Galtar, LLC Buyer Vesting N/A
Buyer Name Carlton Global Resources LLC, Seller Name Galtar, LLC,
Legal Description : City/Muni/Twp: Unincorporated
Prior Transfer
Recording Date 03/01/1993 Document # Price N/A Document Type N/A First TD N/A Type of Sale Mortgage Doc # Interest Rate Lender Name N/A Buyer Vesting CO
Buyer Name American Borate Corp Seller Name N/A

8
Source: San Bernardino County Assessor web page.
Source: San Bernardino County Assessor’s web page.
In August 1976, Johns-Manville offered all its properties in the northeastern Mojave Desert for sale, plus its grinding plant in Dunn, California. Johns-Manville considered donating its talc claims to the National Park Service in the summer of 1976, but in September 1977, Desert Minerals, Inc., a Kentucky-based company, purchased them. Before operations began, in May 1978, the claims and the company plants in Dunn and Los Angeles were acquired by Continental Minerals Corporation of Las Vegas, Nevada, by lease and option sales agreements.
The new owners expressed their intention to resume production at the Big Talc, and hoped to supply talc competitively by late 1978. Mining beyond the near future depends on implementing major exploration and development. In addition, to supplying the developing Japanese market for Second Layer talc, which is used as paper filler to provide the grit that holds the ink in place. Talc is also used in a number of other products such as body powers, paint, cosmetics, fillers, and glues.

9
Aerial Map of Subject Area
San Bernardino County Description Location The subject is located in San Bernardino County. San Bernardino County is one of the six counties in the Southern California Metropolitan Area. The other counties that comprise this area are; Los Angeles, Orange, Riverside, San Diego and Ventura. A Regional Location Map is included on the following page for reference.
Subject
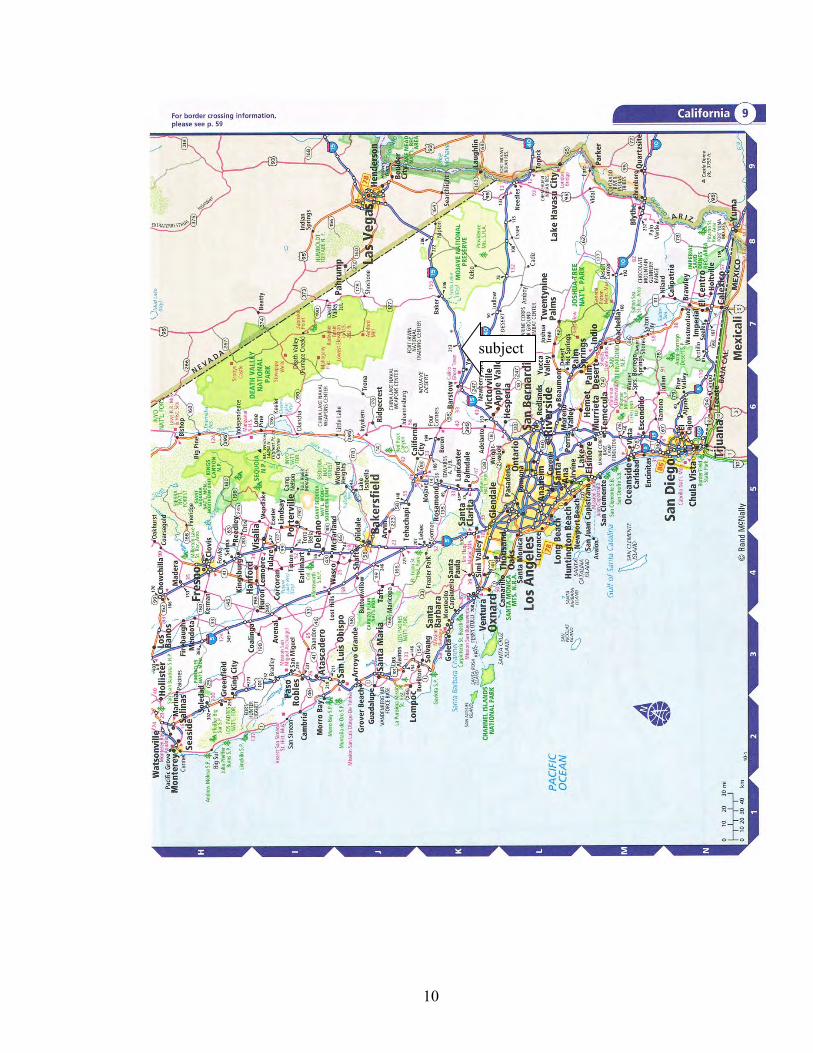
10
subject

11
Physical Environment The Southern California Metropolitan Area gains a distinctive character due to its interdependent relationship for the supply and demand for many goods and services. Los Angeles and Orange Counties have led this area in most economic and demographic growth categories, particularly after the Second World War. This growth was in part attributable to migration from other states resulting from California’s exposure to World War II military personnel. Los Angeles became the commercial and industrial base for the region, while the surrounding counties remained rural and were utilized extensively as citrus groves and truck farms. As Los Angeles County matured, the increasing housing demand forced spillover into the surrounding counties. San Bernardino County is the largest of the six counties in terms of land size and runs parallel and north of Riverside County, both of which stretch all the way to the Arizona State border. San Diego and Imperial Counties are to the south of San Bernardino County. Orange County (which is significantly smaller) does not adjoin San Bernardino County; it partially adjoins Riverside County to the west. The heavily populated Los Angeles County does not adjoin San Bernardino or Riverside County, however, it is located a relatively short distance to the northwest. As property values increased sharply in Los Angeles and Orange Counties, many residents and migrants sought more affordable housing in nearby communities. The neighboring counties of San Bernardino and Riverside (part of the Inland Empire) provided lower cost housing and reasonable commuting times to major employment centers. (November 2010 US Census) Current Population: 2,060,095 m/l Geography Area: 20,160 square miles Major Employers: National Training Center (Fort Irwin) 13,805 Hesperia Unified School District 1,946 Marine Corps Logistics Base 1,868 Apple Valley Unified School District 1,390 Victor Valley Community Hospital 495 Barstow Community Hospital 296 Barstow College 190 Victor Valley College 386 SO Cal Logistics Airport 9800 Fort Irwin National Training Center 12,000 Goldstone Tracking 200

12
Regional Area Map
Subject

13
History of San Bernardino County San Bernardino County is the largest county in the State of California. Its easterly boundary is the State of Nevada. The geography Area is 20,106 square miles. About 90% of county is desert; the remainder consists of the San Bernardino Valley and the San Bernardino Mountains. San Bernardino County also shares borders with Imperial County, and Riverside County. Los Angeles County is just northwest sharing borders with Orange and Riverside Counties.
In 1850 California, was admitted into the United States. On April 26, 1853, San Bernardino County was created from parts of Los Angeles, San Diego, and Mariposa Counties. In 1854, the City of San Bernardino was incorporated as the County Seat. In 1893, Riverside County was created out of parts of San Bernardino and San Diego Counties. Although the county marks its political beginnings in 1853, the land was occupied long before Europeans and their descendants entered the area. Paleo-Indian sites dating from 10,000 BC show that the San Bernardino county area has been inhabited for at least 12,000 years. In the past three thousand years various Indian tribes flourished in the area; the Gabrielenos occupied the West Valley, the Serranos lived in the foothills of the San Bernardino Mountains; the Vanyumes lived along the Mojave River, the Mohave lived along the Colorado River, and in the 1500’s the Chemehuevi moved into the Mojave Desert. The first explorers to enter the area were Pedro Fages, Military Commander of California in 1771, and Fr. Francisco Graces, a missionary priest, in 1774. The Needles Harvey House is named El Garces after the good padre. On May 20, 1810, Franciscan missionary Francisco Dumatz, of the San Gabriel Mission, led his company into a valley. In observance of the feast day of St. Bernardine of Siena, Dumatz named the valley San Bernardino. This name was later given to the nearby mountain range and later the city and county. In 1848, with the signing of the Treaty of Guadalupe Hidalgo, California became a territory of the United States, and in 1850 California became a State. This event generated a steady flow of settlers into the area, including gold miners, entrepreneurs, health-seekers, speculators, politicians, adventurers, seekers of religious freedom, and individuals desiring to create utopian colonies.
14
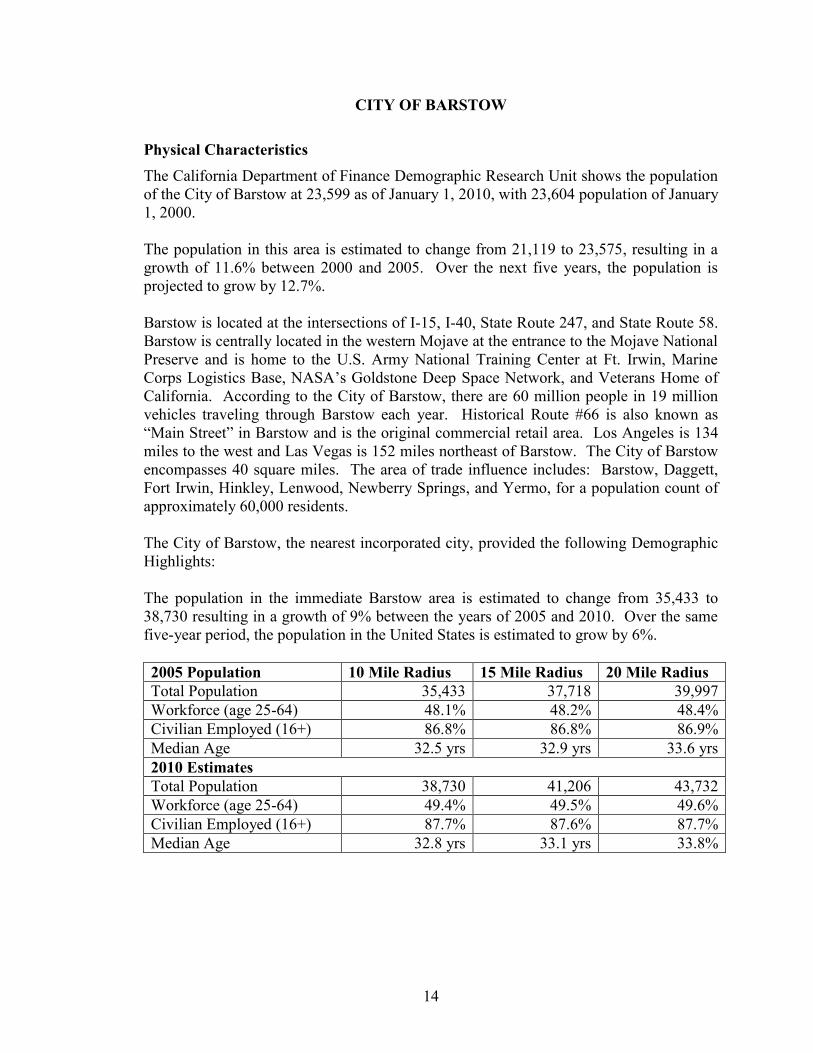
CITY OF BARSTOW
Physical Characteristics The California Department of Finance Demographic Research Unit shows the population of the City of Barstow at 23,599 as of January 1, 2010, with 23,604 population of January 1, 2000. The population in this area is estimated to change from 21,119 to 23,575, resulting in a growth of 11.6% between 2000 and 2005. Over the next five years, the population is projected to grow by 12.7%. Barstow is located at the intersections of I-15, I-40, State Route 247, and State Route 58. Barstow is centrally located in the western Mojave at the entrance to the Mojave National Preserve and is home to the U.S. Army National Training Center at Ft. Irwin, Marine Corps Logistics Base, NASA’s Goldstone Deep Space Network, and Veterans Home of California. According to the City of Barstow, there are 60 million people in 19 million vehicles traveling through Barstow each year. Historical Route #66 is also known as “Main Street” in Barstow and is the original commercial retail area. Los Angeles is 134 miles to the west and Las Vegas is 152 miles northeast of Barstow. The City of Barstow encompasses 40 square miles. The area of trade influence includes: Barstow, Daggett, Fort Irwin, Hinkley, Lenwood, Newberry Springs, and Yermo, for a population count of approximately 60,000 residents. The City of Barstow, the nearest incorporated city, provided the following Demographic Highlights: The population in the immediate Barstow area is estimated to change from 35,433 to 38,730 resulting in a growth of 9% between the years of 2005 and 2010. Over the same five-year period, the population in the United States is estimated to grow by 6%. 2005 Population 10 Mile Radius 15 Mile Radius 20 Mile Radius Total Population 35,433 37,718 39,997 Workforce (age 25-64) 48.1% 48.2% 48.4% Civilian Employed (16+) 86.8% 86.8% 86.9% Median Age 32.5 yrs 32.9 yrs 33.6 yrs 2010 Estimates Total Population 38,730 41,206 43,732 Workforce (age 25-64) 49.4% 49.5% 49.6% Civilian Employed (16+) 87.7% 87.6% 87.7% Median Age 32.8 yrs 33.1 yrs 33.8%

15
Households The number of households in this area is estimated to change from 12,429 to 13,469 with an annual growth rate of 1.6%. The National growth rate for households is 1.22%. 2005 Households (HH) 10 Mile Radius 15 Mile Radius 20 Mile Radius Number of HH 12,429 13,275 14,098 Average HH Size 2.81 2.8 2.8 Housing Units 14,759 15,889 16,960 Owner-occupied 49.9% 50.1% 50.6% Median Value $167,881 $165,382 #167,236 2010 Estimate Number of HH 13,469 14,378 15,283 Average HH Size 2.84 2.83 2.83 Housing Units 15,934 17,143 18,314 Owner-occupied 51.0% 51.2% 51.7% Median Value $231,002 $227,723 $230,547

16
Income The median household income in this area is projected to increase 13% over the next five years, from $41,925 to $47,375. The United States is projected to have a 16% increase in median household income. The average household income in 2005 is estimated to be $51,905 while the average household in the United States is estimated to be $63,301 for the same time frame. 2005 Income 10 Mile Radius 15 Mile Radius 20 Mile Radius Median HH Income $41,928 $41,569 $41,653 Average HH Income $51,905 $51,216 $51,402 Per Capita Income $18,486 $18,279 $18,407 2010 Estimates Median HH Income $47,828 $47,374 $47,512 Average HH Income $59,833 $58,996 $59,244 Per Capita Income $21,085 $20,838 $21,003
By Industry 10 Mile Radius 15 Mile Radius 20 Mile Radius Total Employed 13,648 14,529 15,481 Agriculture/Mining 1.3% 1.5% 1.5% Construction 5.4% 5.6% 5.1% Manufacturing 5.2% 5.2% 5.1% Wholesale/Retail 16.7% 16.6% 16.6% Transportation/Utility 10.3% 10.3% 10.2% Info/Fire/Services 50.2% 46.7% 46.5% Government 13.9% 14.1% 14.3% By Occupation 10 Mile Radius 15 Mile Radius 20 Mile Radius Management 7.9% 7.9% 7.9% Professional 15.1% 14.8% 15.0% Sales 14.0% 13.9% 15.0% Admin Support 15.1% 14.9% 14.9% Services 18.9% 18.7% 18.5% Ag/Construction 5.5% 6.0% 6.0% Production/Maint. 12.4% 12.8% 12.9% Transportation 11.1% 11.2% 11.0%

17

18
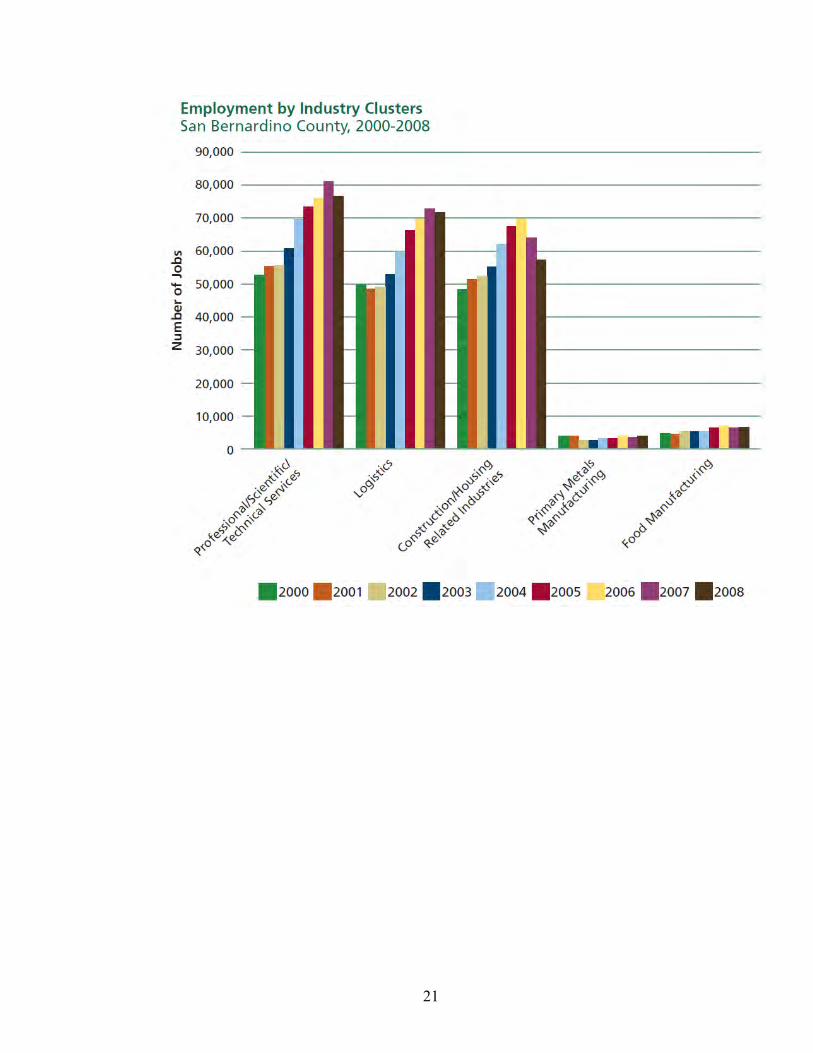
Economic Environment The County of San Bernardino Department of Economic and Community Development show the following employment data as of January 2007:
Years: 2003 2004 2005 2006 2007 Civilian Labor
Force
State of California
17,478,700
17,480,400
17,703,400
17,029,900
18,188,100
San Bernardino 870,600 889,900 874,000 885,000 Riverside 808,300 833,700 895,600 909,800 Los Angeles 4,688,200 4,754,300 4,816,000 4,850,700 4,921,200 Employment
State of California
16,229,200
16,298,400
16,742,300
17,907,200
17,208,900 San Bernardino 820,400 840,100 831,800 835,100 Riverside 760,200 786,500 850,300 853,800 Los Angeles 4,369,400 4,439,700 4,559,500 4,620,800 4,675,300 Unemployment
State of California
1,249,600
1,182,000
961,100
877,300
979,200 San Bernardino 50,200 49,800 42,200 49,900 Riverside 48,100 47,300 45,300 56,000 Los Angeles 318,700 314,600 256,500 229,900 245,900 Unemployment
Rate
State of California
7.1%
6.8%
5.4%
4.9%
5.4%
San Bernardino 5.8% 5.6% 5.2% 4.8% 5.6% Riverside 5.9% 5.7% 5.4% 5.1% 6.2% Los Angeles 6.8% 6.6% 5.4% 4.7% 5.0%
Median Family Income
Area 2000 2001 2002 2003 2004 2003-04 % Chg.
2000-04 % Chg.
USA $50,200 $52,500 $54,400 $56,500 $57,500 1.77% 14.54% Calif. $55,400 $58,400 $60,800 $60,300 $62,500 3.65% 12.82%
Riverside & San Bernardino
$47,200
$49,900
$50,300
$51,000
$54,300
6.47%
15.04% Los Angeles & Long Beach
$51,300
$54,500
$55,100
$50,300
$53,500
6.36%
8.64%

19

20
21

22
Law Enforcement The San Bernardino County Sheriff’s Dept. and the California Highway Patrol are responsible for patrolling the area and enforcing the law. Blm also has Federal Law Enforcement officers as does the Burlington Northern Santa Fe and Union Pacific Rail Road. There are FBI offices in Barstow and Victorville.
Fire Protection District There are 26 full-time personnel and 55 paid-call personnel serving the Barstow Fire Protection District that serves this area. California Fire also covers the area as does BLM Fire Protection with jet ranger helicopters stationed at North Apple Valley.

23
MARKET ANALYSIS

24
Labor Market Statistics (San Bernardino, Riverside Counties)
INDUSTRY NUMBER EMPLOYED Agriculture 17,500 Building & Housing 125,500 Manufacturing 108,600 Export Services 298,800 Locally Based Sectors 436,300 TOTAL EMPLOYMENT 986,700 Source: California Employment Development Department Inland Empire construction and housing related sectors remain strong, up 9.5% or 10,900 jobs. Growth was due to increases in residential, commercial and industrial construction in 2000. With new and existing home sales beginning to recover, employment in retail building material outlets was up 9,400 jobs or 13.3%; real estate and insurance grew 700 jobs or 4.0%. Manufacturing sectors have grown about 4,400 jobs or 4.2%. The strongest sector was non-durable manufacturing up 6.1%. Moderate increases in furniture & fixtures up 4.0%, fabricated metal & industrial manufacturing up 4.1%. Export Service sectors primarily performing services for other regions grew 4.3%. Locally based services are up 2.4% and agriculture is down -4.4%. The Riverside/San Bernardino area has experienced rapid change over the last decade. Historically, this was a relatively unpopulated area, with roots in agriculture, tourism, and transportation. The Atchison, Topeka, and Santa Fe Railroads cut through this area, and the city of Colton is home to one of the largest railroad junction yards in the United States. In addition, the resort communities of Lake Arrowhead, Big Bear, and Palm Springs are located in the Riverside/San Bernardino Area. In the 1980’s, with the cost of housing in the Los Angeles/Orange County areas increasing, developers of single-family homes began constructing projects in the Inland Empire. The availability of land and the relatively unrestrictive development attitudes of local governments combined to create a housing and population boom that resulted in dramatic growth in the Inland Empire over the last decade. The dramatic growth in housing and population resulted in a great deal of employment in the construction field. In fact, approximately 9.5% of the workers in the Inland Empire are in the construction field. The region’s unemployment rate of 4.4% is below the National unemployment rate of 4.5% for August 2000; however increased during the recent 2008 to 2010 recession to 12% or more in some isolated areas.

25
Wages in the Inland Empire are lower than in Los Angeles and Orange Counties to the West and Southwest, offering an inducement for employers to relocate to this area. Local governments have a less restrictive attitude toward development. This is in sharp contrast to the general pattern of increasingly stringent development regulations in Los Angeles and Orange Counties. Moreover, the average home price in the Inland Empire region is typically below the average home price in Los Angeles and Orange Counties. High Desert Market Trends The High Desert Region has been hit hard by housing sales slowdown. During the first quarter of 2008 the High Desert housing market began to show signs of improvement, Foreclosures are still increasing and make up the majority of the sales. Mr. Husing reported that the local economy is strong, interest rates are good and the housing market is being corrected because of some internal factors. Mr. Husing also said that we have a housing shortage in Southern California, because we still are not building enough houses. Warehousing and Logistics has become the major users of large warehouse facilities being built in San Bernardino and Riverside Counties where there is less chance of rain and the ability to store items outside while breaking bulk for deliveries in Southern California, Nevada, Utah, and Arizona via truck, train, and plane.

26
Warehousing and Industrial Trends A substantial portion of the absorption of industrial space in the Inland Empire during the last decade has been the result of firms migrating from Los Angeles and Orange County, where land is expensive and scarce, to the Inland Empire where there are sites large enough to accommodate the high ceiling warehousing and manufacturing facilities. A critical question is whether or not the space vacated by firms migrating to the Inland Empire had been leased to other firms; if not, the vacancy levels for industrial space in the coastal counties would continue to increase, portending an eventual slowdown in the demand for industrial space in the Inland Empire. Conversely, if other firms were leasing the industrial space vacated along the coast, it would suggest the demand for industrial space in Inland Empire would continue to expand, possibly at an accelerating rate.
CoStar classifies industrial space into two categories: Industrial Warehousing Space and Flex Space. As of the end of the 1st Quarter 2012, there were 203 million SF of Industrial Flex space in Southern California and 1,811 million SF of Industrial Warehousing space. By the end of 2011, 89.9% of the total stock of industrial space was classified as Industrial Warehouse space.
The above graph depicts the stock of Industrial Warehouse space in Southern California by county from the end of 2000 through the 1st Quarter 2012. The inventory in Southern California increased from 1,542 million SF to 1,811 million SF. A total of 269 million SF of Rentable Building Area (RBA) were delivered in six county regions to accommodate the needs of warehousing and distribution firms as well as manufacturing companies. On average 23.9 million SF of space were delivered each year.
The inventory of Warehousing Industrial space in the Inland Empire increased from 298 to 482 million SF over the same 11.25 year period. As of the end of the 1st Quarter 2012, the Inland Empire accounted for 26.6% of the total inventory of Warehousing Industrial space in Southern California. Approximately 184 million SF were added to the stock, which represents an average increase of 16.4 million SF per year. It also represents

27
69.7% of the total industrial warehouse construction in Southern California. San Diego County had 145 million SF as of the end of the study period, up from 130 million SF as of the end of 2000. This represented an increase of 15 million SF or approximately 1.3 million SF in deliveries per year, which was 5.7% of the total deliveries. San Diego accounted for 8.0% of the Warehousing Industrial RBA in Southern California as of the end of the 1st Quarter 2012.
The inventory of industrial space in Orange County increased from 229 to 237 million SF over the 11.25 year period. Orange County housed 13.1% of the RBA of Southern California by the end of the March 2012. The addition of 8 million SF represented an increase of 700,000 per year. Orange County only accounted for 3.0% of the net additions to the stock of Warehousing Industrial space in Southern California, which was the lowest of all the counties. Los Angeles and Ventura Counties are reported together by CoStar. There was 947 million SF of space in both counties as of March 31, 2012. This represented 52.3% of the Total RBA in the Southern California Region. In December 2000, there was 890 million SF of Industrial Warehouse space. The inventory increased by 57 million SF or 5.1 million SF per year. Los Angeles and Ventura Counties accounted for 21.6% of the increase in building inventory over the study period.
The table below depicts the annual Net Absorption of Industrial Warehouse Space in Southern California by county for the period beginning in 2000 through the 1st quarter 2012. During the first 8 years of this millennium, 248 million SF of Industrial Warehouse Space was as absorbed in Southern California. This represents an annual net absorption of 31 million SF. The region experienced a Negative Net Absorption of (4.9) million SF in 2008 and (15.9) million SF in 2009 due to the Great Recession. In 2010, the absorption turned positive by 10.0 million SF; and in 2011 Southern California absorbed 21.0 million SF. Approximately 3.2 million square feet of the net absorption occurred in Los Angeles, Ventura, San Diego and Orange Counties. In the 1st quarter of 2012, demand increase by 4.0 million SF, which on an annual basis is equivalent to a Net Absorption of 16 million SF. This suggests the industrial absorption in the Inland Empire is likely to remain high and possibly even accelerate.
From 2000 and the first quarter of 2012, the Inland Empire accounted for almost 77% of the net absorption of Warehousing and Industrial space in Southern California. For the 8-year period ending in 2008, Riverside and San Bernardino Counties absorbed 153 million SF, or approximately 19.1 million SF per year. In 2008, the Inland Empire absorbed 4.5 million SF, before losing 200,000 SF of industrial demand in 2009. Thereafter, the demand for industrial space rebounded with 11.6 million SF being absorbed in 2010 and an additional 17.8 million SF being occupied in 2011. Los Angeles and Ventura Counties experienced the second largest increase in demand in Southern California. During the first 8 years of this millennium, they absorbed 70 million SF of Industrial Warehouse space. The two counties suffered an 18 million SF decline in occupancy during the three years ending in 2010, before gaining 900,000 Sf in 2011 and 1.6 million SF in the first quarter of 2012.

28
Orange County absorbed 9.9 million SF during the period 2000 through 2007; but suffered a negative net absorption of (5.3) million SF for the three years ending in 2010. The momentum shifted to a positive net absorption of 1.6 million SF in 2011 followed by 500,000 SF in the first quarter of 2012. Beginning in 2011, the Southern California industrial market has experienced a substantial increase in net absorption.
The vacancy rates are summarized by the county for the years 2000 through the first quarter 2012 in the table below. The vacancy rates were extremely low at the start of the millennium. The vacancy rate for all of Southern California for the year 2000 was 4.0%. With the exception of San Diego County, the vacancy rates for the other submarkets increased slightly in 2001 and 2002 before declining during from 2003 through 2005. With the exception of the Inland Empire the vacancy rates remained low until the effects of the recession began to be manifested in 2008. In 2009 vacancy rates for Southern California peaked at 7.3% and at 12.1% for the Inland Empire.

29
Vacancy rates eased somewhat in 2010; but they dropped significantly beginning in 2011. By the end of the first quarter of 2012, the vacancy rates for Southern California declined to 5.7%. At that point in time the vacancy rates for the Inland Empire had reached 6.8%. Equilibrium vacancy rate for all of Southern California appears to be about 4.5%; for the Inland Empire it is approximately 5.5%. Rents for the large box industrial space appears to have stabilized in the beginning of 2011 before increasing in latter part of that year and into 2012.
Because there has been little new construction along the coast coupled with the substantial increase in the demand for industrial space, the vacancy level has significantly decreased in those three counties.
The high level of leasing activity suggests the larger industrial users and tenants have run their logistic cost minimization models and concluded that Southern California will continue to be the primary location in the U.S. to have facilities. In a recent real estate conference in the City of Long Beach California, the panelist were claiming that medium and smaller size manufacturing firms are continuing to expand in Southern California because that is where the owners and decision makers want to live. The substantial level of industrial absorption in 2010 and 2011 supports the conclusion that manufacturing, warehousing, and distribution will continue to expand in Southern California, especially in the Inland Empire.
The absorption of industrial space in the Inland Empire at such a high level will continue to create employment opportunities for workers that live in the High Desert; and eventually it will significantly increase the absorption of Industrial Warehouse space in the High Desert.

30
Conclusion While interest rate hikes caused some slowing in demand, returning Southland job growth should keep sales at higher levels. The Inland Empire (Riverside/San Bernardino Region) has grown at an impressive rate in the previous 15 to 20 years. It enjoys lower housing and labor costs than Los Angeles and Orange Counties. In addition, the development climate in the Inland Empire is generally less restrictive than in the rest of Southern California. The congestion of freeways and the increasing commuting times to employment centers in Los Angeles and Orange Counties will serve as an inducement to employers to relocate to the Inland Empire and that has been happening in the Victor Valley portion of the High Desert due to reuse of George Air Force Base by the Southern California Logistics Airport. Renewable energy has also play a significant role in providing an ever increasing work force to build and run solar, wind and geothermal plants. Demographer, Mr. John Husing, PhD, cites job growth predicted between 2000 and 2020 as an example of how the Inland Empire (Riverside & San Bernardino Counties) is outpacing other parts of Southern California. Riverside and San Bernardino Counties together will add 895,000 jobs. Los Angeles County is expected to add about 943,000 jobs during that period, and Orange and San Diego counties just under 750,000 jobs. These conclusions are supported by Dr. Ronald J. Barbieri, PhD, CPA, with his report in The High Desert Bradco Report November, 2012 edition. Particular attention is paid to warehousing as the site has rail siding, spurs and flat land and enjoys 350 day of sunshine annually. This secondary use of the unused land could be put into warehousing with rail and truck intermodal access.

31
LOGISTICS
Ports of Los Angeles and Long Beach The San Bernardino region is also advantaged by a close spatial relationship to the Ports of Los Angeles and Long Beach. A close location to the San Pedro Bay ports provides many advantages for the San Bernardino region, including a large capacity, access to Asian markets, and the dominance of the Southern California port network. In a 2005 report for the Southern California Associations of Governments (SCAG), Leachman estimated the amount of import and export activity for the Ports of Los Angeles and Long Beach, while also evaluating the competition from other ports in the U.S. This report found that the San Pedro Bay Ports possess economic, logistical, and location advantages over all other ports on the West Coast. An additional advantage of the Ports of Los Angeles and Long Beach is the increased capacity for transloading international merchandise. When merchandise is transloaded, goods are transferred from one size of container to another, often involving the transition from ship to truck, and then taken to warehouses to be redistributed. For many of the transloaded goods that leave the Ports of Los Angeles and Long Beach, the destination is the San Bernardino region where the merchandise is transferred from short-haul to long-haul rail lines, or from rail to truck, or from truck to rail (Leachman 2005). The opportunity for the San Bernardino region to benefit from transloading is further advantaged by the fact that the Long Beach and Los Angeles Ports are the transloading destination for much of the U.S. import traffic. The West Coast ports have a much lower per cubic foot cost for transloading than the East Coast ports, and the San Pedro Bay Ports are the principle West Coast destination. The difference in cost is substantial, as imports are largely elastic, and a single cent savings may provide a company with the incentive to change routes. Fortunately for the San Bernardino region, the primary route seems to be the Ports of Los Angeles and Long Beach. The California Division of Geology reports that sand and gravel aggregate material is being shipped from British Columbia via barge to the ports of Long Beach and San Francisco for hull ballast.
Multimodal Logistics Parks Alliance, Texas Port of Huntsville, Alabama Rickenbacker/Columbus Inland Ports Logport, Duisburg Germany Long Beach/Los Angeles, CA Seattle, Washington Sacramento, CA Victorville, CA These developments have used multi-modal infrastructure (air-rail-truck, or sea-rail-truck) as the core of business/industrial parks. Whereas conventional business or industrial parks seek office buildings or manufacturers as “anchor tenants”, these “logistics parks” use the transportation infrastructure as a selling point. These
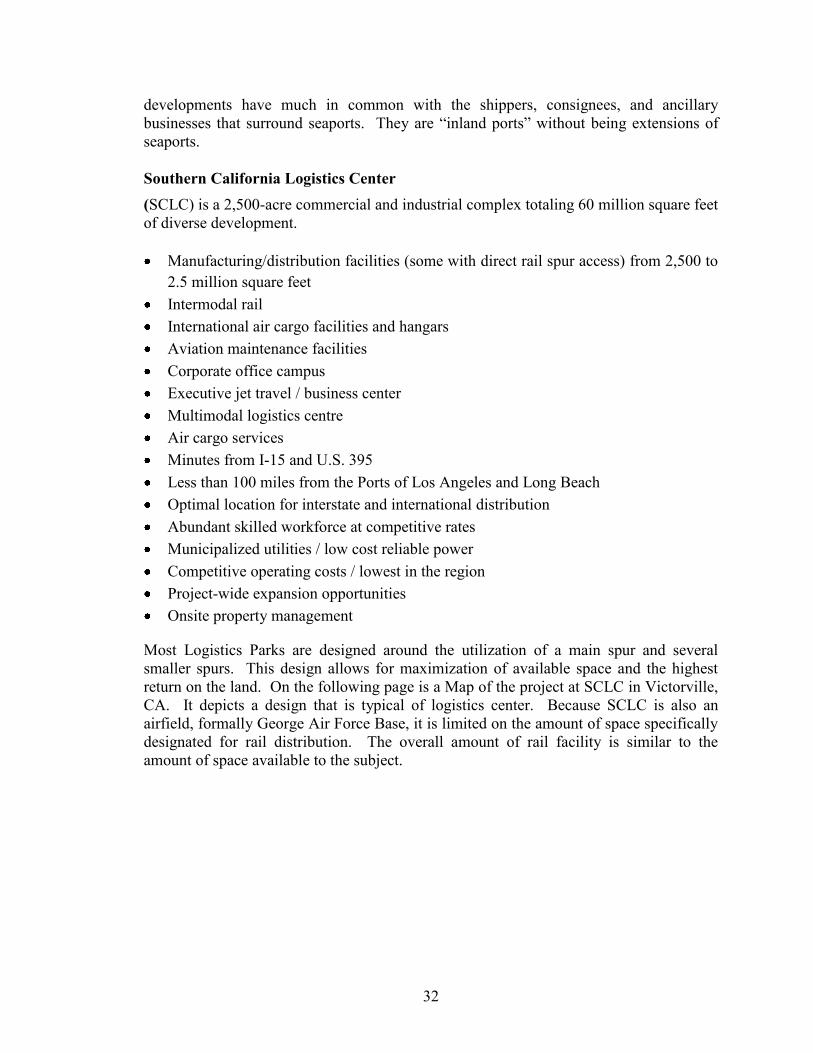
32
developments have much in common with the shippers, consignees, and ancillary businesses that surround seaports. They are “inland ports” without being extensions of seaports. Southern California Logistics Center (SCLC) is a 2,500-acre commercial and industrial complex totaling 60 million square feet of diverse development. Manufacturing/distribution facilities (some with direct rail spur access) from 2,500 to
2.5 million square feet Intermodal rail International air cargo facilities and hangars Aviation maintenance facilities Corporate office campus Executive jet travel / business center Multimodal logistics centre Air cargo services Minutes from I-15 and U.S. 395 Less than 100 miles from the Ports of Los Angeles and Long Beach Optimal location for interstate and international distribution Abundant skilled workforce at competitive rates Municipalized utilities / low cost reliable power Competitive operating costs / lowest in the region Project-wide expansion opportunities Onsite property management
Most Logistics Parks are designed around the utilization of a main spur and several smaller spurs. This design allows for maximization of available space and the highest return on the land. On the following page is a Map of the project at SCLC in Victorville, CA. It depicts a design that is typical of logistics center. Because SCLC is also an airfield, formally George Air Force Base, it is limited on the amount of space specifically designated for rail distribution. The overall amount of rail facility is similar to the amount of space available to the subject.

33
Map of the project at SCLC in Victorville

34
Location Southern California is a global crossroad between America, Asia, and Europe. A great deal of the economic success of the region is attributable to capitalizing on this.
Transportation Networks
Given the San Bernardino region’s relative proximity to the San Pedro Bay Port Complex, as well as major airports including LA/Ontario International Airport (ONT), the area is an advantageous location for companies active in international trade. Key findings with respect to infrastructure include: • Interstate 10 and State Highways 60, 91, and 210 provide the necessary linkages between the San Bernardino region and major Southern California ports. • After goods reach the San Bernardino region, access to Interstates 10, 15 and 40 allow movement of international trade into the majority of major markets in the U.S. For instance, Phoenix, Las Vegas, San Antonio, Memphis, and Raleigh-Durham are within two exchanges on interstate freeways from the San Bernardino region. • The San Bernardino region is located at a rail nexus, with lines moving goods East, West, North, and South. Southern California is connected to vast markets by two principle long-haul railroads: The Burlington Northern Santa Fe Railway and Union Pacific Railroad. Combined, these two companies move more intermodal cargo than any other rail system in the world (Jones and Stokes 2004).
International Trade Statistics and Trends
• Total international merchandise trade in San Bernardino and Riverside counties amounted to $17.5 billion in 2005 or close to 18.5% of aggregate income. San Bernardino County was responsible for the vast majority of regional international trade, with $14.9 billion in imports and $917 million in exports. • Recent figures show a marked reduction in regional trade activity between 2002 and 2004, followed by a drastic increase in trade activity in 2005—total trade nearly tripled between 2004 and 2005. Total trade values are at record levels and are determined almost entirely by year-to year changes in imports. • Total import activity more than doubled from 2002 to 2005, while exports maintained a growth rate 10.4% over the period. Healthy import and export growth over the four year period is encouraging and may suggest that Inland companies are taking advantage of international economic opportunities. • Inland import commodities consist primarily of intermediate and consumer goods. Machinery parts topped the list in 2005, with an estimated value of $1.5 billion or 11.4% of overall imports. Merchandise in this category primarily consisted of items such as computer parts and cables, as well as various other office-related components. Other significant import commodities included iron and steel ($1.6 billion), electronics ($1.1 billion), medical or surgical instruments ($1.1 billion), and furniture ($1.1 billion). • The region’s top export commodities are dominated by raw materials, including scrap metal ($196 million) and raw fabrics ($171 million). These two raw materials alone represented close to 48.5% of the value of all commodities exported in 2005. Other

35
significant export commodities included vehicle parts ($66 million), articles of plastic ($45 million), and medical or surgical instruments ($40 million). • Seven out of the region’s top 10 trading partners are located in Asia or the South Pacific, representing 84.1% of all vessel trade or $12 billion. China alone represents just over 50% of total trade activity in the region or $7.1 billion, making it the region’s most important trading partner in terms of both imports and exports in 2005. • Taiwan and Japan also recorded impressive trade numbers, with both countries providing over a billion dollars of international trade.
International Trade and Southern California Ports
Given the San Bernardino region’s geographic location, it is not surprising that the Ports of Los Angeles and Long Beach are the most important trade hubs for inland vessel trade. Moreover, Inland airports contribute to regional trade movements, providing companies located in the San Bernardino region with opportunities to move high value products. CPIC’s key findings with respect to trade and regional ports include: • Over 2.4 million tons of trade merchandise flowed through the Port of Los Angeles with the San Bernardino region as its destination, while over 1.7 million flowed through the Port of Long Beach. These figures show that the two Southern California ports are far and away the most important trading hub for vessel trade in the region—the closest port competitor (the Port of San Diego) only provided 617,000 tons. • From 2004 to 2005, import growth at the San Pedro Ports more than doubled, while exports grew at a rate of 2.5%. The primary factor leading to double digit import growth was a considerable reduction in the port congestion that impacted the San Pedro Ports over the past two years (Kyser and Huang 2005). • Total international air cargo trade at the LA/Ontario International Airport (ONT) increased by 75.6% from 2004 to 2005, with imports increasing by 29.5% and exports increasing by 109.3%. It is important to keep in mind that air cargo tends to consist of high value/low weight high tech goods and thus contributes more to the regional economy than suggested by its modal share of weight. • According to recent Southern California Association of Governments (SCAG) forecasts, ONT is expected to reach close to 2.25 million tons of total trade by 2030, which is just below estimates for Los Angeles International Airport (LAX) (SCAG 2004). • Several other Inland airports are expected to record significant growth over the next several decades. These airports include San Bernardino International Airport, March Air Reserve Base, and the Southern California Logistics Airport. Both San Bernardino International and March Air Reserve are projected to have upward of a million tons of air cargo movement by 2030(SCAG 2004).
International Trade and Employment
International trade contributes to regional employment and facilitates economic development. Before presenting CPIC’s findings, it is important to note an important

36
limitation of the employment estimates provided in this report. These estimates do not include multiplier effects—i.e., the coefficients used to produce the estimates show the impacts of all the purchases of inputs for production, but fail to include the impact of spending for consumer goods by those individuals earning income from producing goods. With this limitation in mind, findings with respect to trade and employment include: • Two-county employment related to the production of international merchandise in 2005 was just over 50,000. Of the total jobs generated, 46,000 (or 90%) are located in San Bernardino County. Close to 24,000 trade-related jobs have an average annual salary of $35,000 or more. • Trade-related employment generated close to $1.6 billion in aggregate income for San Bernardino County (which represents approximately 4% the County’s overall aggregate income) and $166 million in income for Riverside County in 2005. • International trade is critical to the economic viability of certain local industries. International trade was responsible for approximately 38% of all employment in the wholesale trade industry and 25% of all employment in the retail trade industry in San Bernardino County. • The majority of employment generated by international trade is due to import activity. Because a majority of international merchandise transitions through the San Bernardino region, employment is generated regardless of whether local firms are importing or exporting.
International Trade and Economic Development
The employment figures in this report provide a good picture of regional development and growth. Findings with respect to trade’s impact on economic development include: • Based on the employment calculations in this report, it is clear that international trade is impacting regional economic development. The employment associated with international merchandise production alone accounted for approximately 7.2% of San Bernardino County’s overall employment in 2005. • Many of the jobs associated with international trade pay high average wages and have few formal education requirements. The culmination of this information suggests that international trade could offer economic opportunities to a large portion of San Bernardino residents (for a similar argument, see Husing 2005 and 2010). • These data suggests that international trade has the potential to have long-term and beneficial effects on the economic development of the San Bernardino region. Literature on economic development, job creation, and business attraction suggests that a cluster of businesses engaged in international trade, along with the relatively unique advantages of the area, will provide leverage for the area when bargaining with businesses (Held 2005; Porter 2000; Steinacker 2002).
The Future of International Trade Activity in the Region
International trade presents a valuable opportunity for the San Bernardino region. Relative closeness to the Ports of Los Angeles and Long Beach, access to a logistics and

37
infrastructure nexus, a growing population, and a strong base of industries that support international trade combine to provide the region with a competitive advantage few other regions in the world possess. Projects to improve goods movement in the San Bernardino region are recognized as critical to the region’s economic development goals and are currently funded appropriately. If appropriate funding is maintained, the San Bernardino region has the potential to become one of the U.S.’ major trade gateways, linking the nation to the rest of the world. Exports to China from the San Bernardino region consist primarily of raw materials and intermediate goods used in the manufacturing process. The top export commodity sector in 2005 consisted of cements and base metals, with an estimated value of $186 million. Cotton and woven fabrics followed closely behind in the number two spot, with $167 million. Alunite production has been on the increase and anticipated to expand with development of the Blawn Mountain mine and the shipping of the product to international locations with milling at Dunn Siding in Northeast Newberry Springs along Hwy 15 and the Union Pacific rail lines with a siding and static scale for shipping and receiving hundreds of tons the product.
Local Commodities and Trends
The location has appeal as a regional distribution facility as it would allow for the more cost effective exportation of local commodities i.e. Mineral products from the North East Mojave Desert. The Las Vegas Airport Authority has secured 4500 acres at the North end of Ivanpah Valley at Leach Dry Lake to build a companion international airport to its sister facility McCarran Airport. That new facility is scheduled to open 2017 with construction to begin in 2013. The subject is the nearest rail hub to that facility in California and with its estimated 6,390,000 tons of aggregate sand and gravel material on the North 180 acres to be removed it can be a nearby source of material and/or cement with delivery by train to the construction site. Mineral Products This region has vast mineral wealth as well as appeal to large scale mining operations. Materials commonly recovered by mining include bauxite, copper, iron, gold, lead, nickel, phosphate, platinum, rock salt, silver, tin, titanium, uranium, and zinc. North Americas largest supplier of rare earth metals is located at Mountain Pass, California, just 40 minutes Northeast of Dunn Siding. Other highly useful materials that are mined include clay, sand, cinder, gravel, granite, and limestone. The export of clay products and other mineral products is expected to increase as the world economy grows. Once poor countries with limited recourses are now prospering and beginning to emerge and develop more sophisticated infrastructures, increasing demand for products mined in the subjects region will increase. The subject soils are comprised of aggregate material that can be mined, washed and filtered by size for use in cement and road construction. Granite Rock Corporation has obtained a contract with CalTrans to widen and improve Interstate 15 from Barstow to the California/Nevada state line. Granite has agreed to pay seventy-one cents per ton of

38
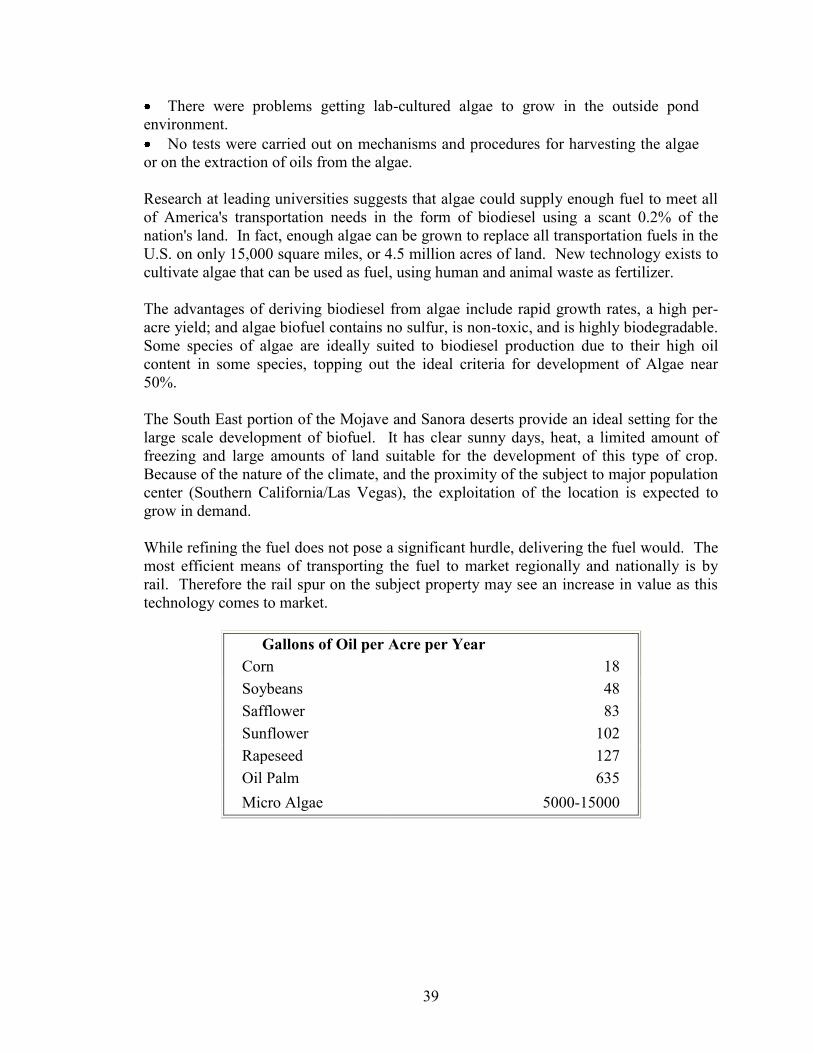
raw aggregate on an adjacent plot of land to the Northeast. Appraisers estimate that the removal of twenty two feet of over burden aggregate soils comprised of 6,390,000 tons would be worth $4,540,000.00. Source: Prior appraisal and contract. Bio–Fuel (Algae), an Alternative Use Algae range from small, single-celled organisms to multi-cellular organisms, some with fairly complex differentiated form. Algae are usually found in damp places or bodies of water and thus are common in terrestrial as well as aquatic environments. Like plants, algae require primarily three components to grow: sunlight, carbon dioxide, and water. Photosynthesis is an important biochemical process in which plants, algae, and some bacteria convert the energy of sunlight to chemical energy. The existing large-scale natural sources are of algae are: Bogs, marshes and swamps - salt marshes and salt lakes. Microalgae contain lipids and fatty acids as membrane components, storage products, metabolites and sources of energy. Algae contain anywhere between 2% and 40% of lipids/oils by weight. There are three well-known methods to extract the oil from oilseeds, and these methods should apply equally well for algae too: (i) Expeller/Press; (ii) Hexane solvent oil extraction; and, (iii) Supercritical Fluid extraction.
During the oil crisis of the 1970s, Congress funded the National Renewable Energy Laboratory (NREL) within the Department of Energy to investigate alternative fuels and energy sources. Between 1978 and 1996, the Aquatic Species Program (ASP) focused on the production of biodiesel from high lipid-content algae growing in outdoor ponds and using CO2 from coal-fired power plants to increase the rate of algae growth and reduce carbon emissions. Prior to this program, very little work had been done to understand the growth process and metabolic composition of algae. As a result of the ASP, there are now some 300 species, mostly diatoms and green algae, in a collection stored at the Marine Bioproducts Engineering Center that is available to researchers interested in developing algae as an energy source.
Some results listed in the Close Out Report of the ASP are: Under optimum growing conditions micro-algae will produce up to 4 lbs/sq. ft/year or 15,000
gallons of oil/acre/year. Micro-algae are the fastest growing photosynthesizing organisms. They can complete an entire growing cycle every few days.
One quad (1015 BTU or 7.5 billion gal.) of biodiesel could be produced on 200,000 ha of desert land (equivalent to 772 sq. mi., roughly 500,000 acres). (To produce one quad from a rapeseed crop would require 58 million acres or 90,000 sq. mi.).
The outdoor race-track pond production system is the only economically feasible approach given the cost of petroleum in 1996. (One of the problems with growing algae in any kind of pond is that only in the top ¼” or so of the water does the algae receive enough solar radiation. So the ability of a pond to grow algae is limited by its surface area, not by its volume.) Algae contains fat, carbohydrates, and protein. Some of the micro-algae contain up to
60% fat. Once the fat is “harvested” — some 70% can be harvested by pressing — what remains becomes a good animal feed or can be processed to produce ethanol. The desert test location in New Mexico had sufficient sunlight, but low night time
temperatures limited the ability to achieve consistently high productivity.
39
There were problems getting lab-cultured algae to grow in the outside pond environment. No tests were carried out on mechanisms and procedures for harvesting the algae
or on the extraction of oils from the algae. Research at leading universities suggests that algae could supply enough fuel to meet all of America's transportation needs in the form of biodiesel using a scant 0.2% of the nation's land. In fact, enough algae can be grown to replace all transportation fuels in the U.S. on only 15,000 square miles, or 4.5 million acres of land. New technology exists to cultivate algae that can be used as fuel, using human and animal waste as fertilizer. The advantages of deriving biodiesel from algae include rapid growth rates, a high per-acre yield; and algae biofuel contains no sulfur, is non-toxic, and is highly biodegradable. Some species of algae are ideally suited to biodiesel production due to their high oil content in some species, topping out the ideal criteria for development of Algae near 50%. The South East portion of the Mojave and Sanora deserts provide an ideal setting for the large scale development of biofuel. It has clear sunny days, heat, a limited amount of freezing and large amounts of land suitable for the development of this type of crop. Because of the nature of the climate, and the proximity of the subject to major population center (Southern California/Las Vegas), the exploitation of the location is expected to grow in demand. While refining the fuel does not pose a significant hurdle, delivering the fuel would. The most efficient means of transporting the fuel to market regionally and nationally is by rail. Therefore the rail spur on the subject property may see an increase in value as this technology comes to market.
Gallons of Oil per Acre per Year Corn 18 Soybeans 48 Safflower 83 Sunflower 102 Rapeseed 127 Oil Palm 635 Micro Algae 5000-15000

40
Site Comments
Site Description:
DIMENSIONS: Irregular (See Plat Map). The subject is approximately 316.41 Acres.
Improvements
Google Aerial Of The Subject Mill And
Union Pacific Rail Siding

41
Subject From South Side Of Rail Road Tracks Looking North
Union Pacific Rail Lines Looking East

42
Union Pacific Rail Lines Looking West Towards Old Dunn
Transformer Station, Storage Silos & Warehouse

43
Silos For Various Products To Be Mixed, With Computer Controls To Be Added
Conveyor System To/From Jaw Crusher

44
Superstructure And Access Stairs
54” Raymond Vertical Mill

45
Switch Room
West Main Silo Detail
At Any Given Time There Is 200 Tons Of Refined Mineral On-Site

46
Additional West Silo Detail
Silo Distribution System At Base

47
Southern Portion Of Property South Of The Union Pacific Rail Lines Mitigation Land.
Rail/Truck Load Out System

48
Plant Uses Commercial talc falls into four categories: • Steatite: Compact, massive and fine-grained: can be sawed, drilled or machined to required shapes. Usually it is heat treated to convert the talc to clinoenstatite which is used as insulation. • Soft platy talc: An alteration product of dolomite with chlorite as a common accessory. This is the most important type of talc and is used in wide variety of ceramic, paper, roofing and plastic products. • Tremolite talc: Massive or laminated rock with varying percentages of tremolite, anthophyllite, calcite and dolomite. It is characterized by a high CaO content, and is often in demand for products which require a greater cohesive strength. • Mixed talc: Various types of talc; usually any type which is not characterized as one of the above. Used for applications that is less selective in terms of oxide mineral content. Most commercial talc products are a blend of two or more types specifically designed to meet the specifications of the buyer. For example, the ceramic industry prefers hard massive, white talc while the paint and plastics industries prefer soft, foliated talc. Death Valley talc, because of its purity, commanded a premium price and was much in demand for specialized applications requiring higher purity, such as cosmetics.

49
Subject Photos:
Rail Siding and Switch
Photos Taken From the Center of the Western Boundary Shows Manual Switch
Looking West Towards Old Dunn Mill in Distance. Photos Shows Both Sidings

50
Rail Siding And Spur Description
The subject has approximately 9,529 lineal feet of Rail Spur siding. Currently, 2,910 lineal feet is suitable for use on the subject property. There is a second set of siding rails somewhat covered by sand in unknown condition and apparently not in use and thus not valued herein in an abundance of caution. The spur is a valuable aspect of the land and adds significantly to the value. No other large land pieces were found to have transferred in the subject’s area that had a rail spur on it. The only other transactions that were found in the subjects region were found in the city of Palmdale, and both were significantly smaller. The rail spurs location proximate to the 15 Freeway make it ideally suited for a distribution facility. Development of a large inland facility at this location would be possible only in conjunction with and not separate from the rail spur and Hwy 15. Rail lines are the property of Union Pacific Railway Company referred to on the title report as the old San Pedro, Los Angeles and Salt Lake Railroad Company, and as the Los Angeles and Salt Lake Railroad Company. The line is spurred for turning cars, which includes a static scale to weigh rail cars and content and turnout switches. The usable siding replacement, according to the technical help line at Marshall & Swift, for a 130# per lineal yard 6” x 6 3/4” rail at mid-dollars per lineal foot of approximately $138.00 per lineal foot plus switch and turnout costs at mid-dollars of approximately $44,400.00 each with two switches and turnouts based on replacement of the usable 9,529 feet would be $1,390,000.00. The data came from M&S, section 66 page 3, and confirmed verbally on 4/17/2013 via telecom (213) 683-9000 with Kristy @ Tech Support. The switches appear to be manual rather than the powered type currently being installed. See photo attached. When then applying a western multiplier found in M&S section 99 page 3 of 1.06 and to bring the previous data to current April, 2013, $1,390,000.00 x 1.06, a value of $1,473,400.00 is calculated and rounded down to $1,473,000.00. As an alternative, we looked to the 2012 building of a turnout lead line at Hesperia, CA of just under one mile in length off of the SFRR/UPRR rail lines into the industrial district. Rail weight is 130# rail size is 6” x 6 ¾” and the lines are parallel with three switches, two of which are for the turnaround parallel siding. The cost, according to Community Development, was $8,100,000.00, which included design, plans, grading, ballast bed, installation, labor, supervision and contractor overhead and profit. The length was reported to be 5,280 linear feet, thus the total current regional cost per foot was $8,100,000.00 / 5280 = $1,534.09 per foot. Applying this to the subject line of 9,529 lineal feet, the resulting cost today would be a probable $14,618,343.61. That portion lying on the subject is reported to be 2,910 lineal feet, equating to a current cost of $4,464,201.90, rounded up to $4,500,000.00.
51
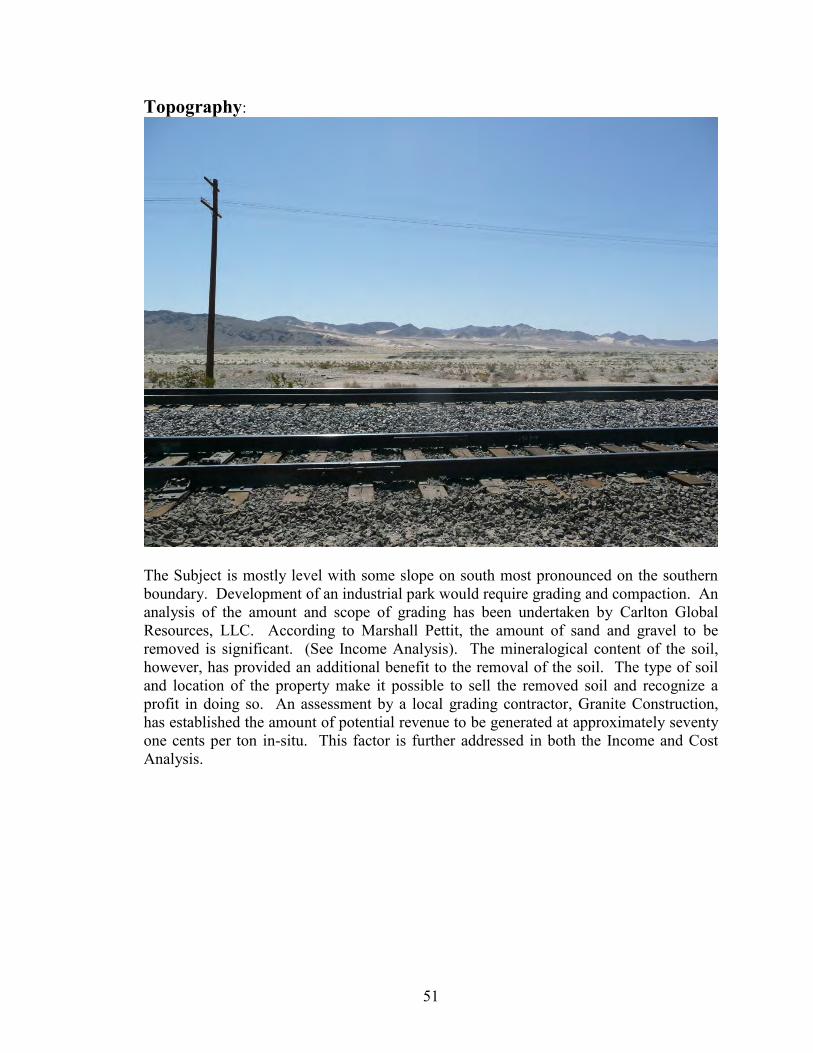
Topography:
The Subject is mostly level with some slope on south most pronounced on the southern boundary. Development of an industrial park would require grading and compaction. An analysis of the amount and scope of grading has been undertaken by Carlton Global Resources, LLC. According to Marshall Pettit, the amount of sand and gravel to be removed is significant. (See Income Analysis). The mineralogical content of the soil, however, has provided an additional benefit to the removal of the soil. The type of soil and location of the property make it possible to sell the removed soil and recognize a profit in doing so. An assessment by a local grading contractor, Granite Construction, has established the amount of potential revenue to be generated at approximately seventy one cents per ton in-situ. This factor is further addressed in both the Income and Cost Analysis.

52
UTILITIES:
View Northeast County Rd 20866
Access to utilities is good. The nearest location for power and telephone is located at the site. Water is accessed by way of a well - information on the depth was not provided. A review of the Grant Deed did not reveal the presence of any water shares/rights. The value of the water rights would need to be studied further. It is outside the adjudicated area based on Mojave Water Agency per David Seielstad at the Watermaster’s office via e-mail dated March 4, 2013. No valuation of the water rights was provided. Water extraction reports should be filed with California Department of Water Resources to perfect a water right in the event of expansion of the adjudicated area. Natural gas is available. Sewer is not available and onsite treatment would need to be conforming for large scale development. The subject’s location adjacent to the main electric grid affords it the possibility of solar and/or wind generated electrical project. While the National Renewable Energy Laboratory identifies the subject as prime solar collection area, the subject is rated as only fair for wind power generation. The high voltage electrical line passing through the subject property is being upgraded to 500 KW.

53
ACCESS There is good physical access to the subject at this time. The closest access point to the subject would be County Rd #20866, adjacent to the subject property on the north side. County Rd #20866 is an asphalt paved road in fair condition, crossed with desert washes at several points. It provides direct access to the I-15. The existing two lane road is narrow (average pavement width 22’ with soft dirt shoulders ranging from two to eight feet) with significant constraints at vertical alignments for access.
VIEW
View South From The Industrial Facility Of The South 1/2 Of The Subject.
The subject has a view of Afton Canyon and the surrounding desert. This is not a factor affecting the value of the land. Elevation and Climate The elevation of New Dunn is approximately 2,000 feet above sea level M/L, with a dry and smog-free environment. The weather temperatures range from highs of approximately 120 to a low of 25 throughout the year. Average rainfall is about 4 inches.

54
PLAT MAP

55
PROPERTY DIMENSIONS

56
Solar Energy Map
Solar energy development on the parcel would be profitable and interconnection to the grid feasible at the subject location. Potential energy development would greatly reduce, if not completely eliminate, the cost of energy for an Industrial Complex. It is also one of the Highest and Best Uses of the South ½ of the subject.

57
National Renewable Energy Laboratory Energy Map
subject

58
Zoning According to the County of San Bernardino Land Use Services Dept. (760) 843-4343, the subject is zoned (RC). The historic use of the land, however, has been Mining / Industrial M1 and M2. According to the San Bernardino Land Use Services Dept., the County would most likely favor a General Plan Amendment to change the zoning to Industrial due to the existence of a rail spur as it would be the highest and best use. At one time, the subject was zoned heavy manufacturing and was modified to RC. The reason for the change is unknown; but probably an oversight done when the desert portion was generally reserved for conservation. The current use is “Industrial” by permits issued by the County years ago.
84.0305 Resource Conservation (RC) District The Resource Conservation (RC) District shall be located as specified by the San Bernardino County General Plan.
HIGHEST AND BEST USE
The Highest and Best Use is that use which is most likely to produce the greatest net return over a given period of time to the land. Net return refers to the residual left over from gross yield after all costs have been deducted. Only those uses which are physically possible, legally permissible, financially feasible, and maximally productive may be considered tenable. Highest and best use maybe defined as the available use and program of future utilization that produces the highest present land value. The appraisers have investigated and analyzed the highest and best use of the 316.41 gross acre parcel in regard to those uses which are physically possible, legally permissible, economically feasible, and maximally productive. That use which passes the three initial criteria and maximizes net return is the highest and best use. We have considered the highest and best use assuming that the subject property is vacant as of the appraisal date. Physically Possible The size and shape and topography of the 316.41acre parcel do not restrict development options. The site is considered to have good potential for Industrial development. Other physical characteristics of the site, such as accessibility and availability of utilities, are adequate for Industrial use. Our physical inspection of the subject property resulted in our finding that the physical condition of the land would not prohibit additional development. The appraisers were not furnished with a detailed site specific soils report. Soils are alluvial fill from observation of sand and gravel. Therefore, the appraisers are unable to definitively comment on the adequacy of the subject soils load bearing capacity. However, a field inspection of the subject neighborhood indicated that the soils appear to be capable of supporting industrial use since they have been so for decades.

59
Legally Permissible Based on the historic use of the subject parcel, the subject property is not affected by any atypical easements or restrictions that would materially impact either the market value or use of the subject. Continued use of the subject is legal according to the county of San Bernardino. Industrial / Mining Development is possible. Four permits have been taken out in 2007 for grading and erosion control. Economically Feasible / Most Profitable Tests of economically feasible and the most profitable use are relevant since development of the land appears to be financially feasible. No assay has been provided to the appraisers to establish the amount of mineral deposit on the subject property. In conclusion, the most probable highest and best use of the land as vacant is development conforming to industrial use supporting the existing rail siding and spurs.
VALUATION METHODOLOGY
Valuation is based upon general and specific background experience, opinions of qualified, informed persons, consideration of all data gathered during the investigative phase of the appraisal, and analysis of all market data available to the appraiser. Three basic approaches to value are available: Cost, Sales Comparison, and Income Approaches. Market Analysis - The appraisers’ Market Analysis relied on their observations while physically inspecting the subject property and any comparable sale properties utilized in this report. This section discusses the demand for this type of property and analyses the individual comparables to evaluate the similarity to the subject property. No recent comparable sales were found for use in this report. Cost Analysis - The appraisers’ Cost Analysis relied on their observations while physically inspecting the subject property. The appraisers have evaluated the market cost to develop the Rail Siding and Spurs on the subject parcel. This analysis relied only on the actual cost and did not estimate the time or additional fees incurred in the establishment of a relationship with the Railroad. After conducting a thorough investigation of the cost the appraisers provided an opinion of value. Income Analysis - The appraisers’ Income Analysis relied on their observations while physically inspecting the subject property as well as information obtained through industry sources as to the value of commodities and the information provided by the property owner as to the estimated amount of sand and aggregates at the subject location. The appraisers have evaluated the market cost to remove and classify the material and the income that it would generate. Geologist report attached supports this approach to value and reports on available raw materials at the Utah mine in Beaver County, Utah.
60
SALES COMPARISON APPROACH
The appraisers conducted searches for relevant sales of (RC) Resource Conservation and also as zoned (IN) Industrial and Special Purpose Land Use zoned sites in the subject neighborhood and adjacent areas in order to estimate the value of the parcel. Sales were selected that exhibited comparability to the subject property relative to highest and best use, location, size, market conditions, conditions of sale, use/entitlements, and topography. The appraisers have included individual Aerial Maps, Fault Maps, Photographs and Zoning Maps for each land sales as determined to be appropriate. A Location Map and Plat Maps are included in the Addenda section of this report. The price per acre was considered by market participants to be the most relevant unit of comparison; for purposes of this appraisal analysis, the appraisers utilized the price per gross acre to establish values in their analyses. No similarly improved recent market sales were found to support the use of this method to determine the improvement’s component values. Analysis of Land Sales The subject site contains approximately 316.41 and is irregular. All selected sales are relatively similar to the subject relative to highest and best use, location, zoning, utility availability, topography, and property rights conveyed. We have applied adjustments to the below-listed elements of comparison in supporting our estimate of land value. In order to derive a point estimate of value of the subject, we have used percentage adjustments. These percentage adjustments are generally based on the relationship between the subject and the comparable properties as perceived by market participants and appraisers. Non-Physical Adjustments: Property rights conveyed Financing terms Conditions of sale Market conditions Physical Adjustments: Location Size and shape Topography Zoning/Entitlements Utility Availability Condition of site Non-realty components of value

61
Property Rights Conveyed
A transaction price is predicated on the real property interests conveyed. The land value estimate assumes that the subject site is appraised in fee in accordance with its highest and best use. If a different form of ownership is transferred, an adjustment to the sale price may prove necessary. All of the land data used in this report was fee simple transfers. As a result, no adjustments are appropriate for conveyed property rights.
Financing
Our market value estimate assumes an all-cash transaction or a down payment and financing at prevailing market terms. Adjustments for financing terms are warranted when a property is purchased subject to non-market financing arrangements. Non-market financing arrangements can include seller-carried notes or assumable loans with interest rates, loan-to-value ratios, and/or amortization schedules more favorable than the terms commonly available in the market. As discussed in the sale data sheets, the financing terms of all sales reflect the market, and are considered cash equivalent. No adjustments are warranted. Conditions of Sale
Our market value estimate assumes: 1) the buyer and seller are typically motivated, 2) both parties are well informed or well advised, and each is acting in what they consider to be their own best interest, 3) a reasonable time is allowed for exposure in the open market, and 4) neither the buyer nor the seller are under undue duress. If a property is sold and either the buyer or seller was under duress, an adjustment should be applied to the sale price to reflect the property’s sale price assuming an arm’s-length transaction. During the verification process, the appraiser attempted to determine whether atypical motivations were involved in any of the transactions. Based on our research, all sales represented arm’s-length transactions, involved no duress, and did involve land assemblage in which buyers paid above market prices because of anticipated plottage value resulting from the greater utility of a larger site. No adjustments are warranted for atypical conditions of sale. Market Conditions
Changes in market conditions subsequent to a comparable sale transaction may require adjustment. The market data in this report sold from June 2010 to March 2013. The effective appraisal date is December 31, 2012. Location/Traffic Exposure
Location adjustments were applied to the comparable sales where appropriate. The sale data did permit derivation of location adjustments through matched-pair analysis. A number of other variables contained in the data set prohibit reasonable grouping of the sales. The market data was also considered on a broader basis to identify general patterns

62
which would support location adjustments. Specifically, consideration was given to differences in utility and demand/availability. The subject property is located along a secondary service access street; a portion of the site lacks good access and exposure south of the rail tracks. Active listing 1 is considered similar to the subject relative to its traffic exposure and demand northeast of Baker along the 15 Freeway. It is only accessible via a poor dirt trail. Minor adjustment is warranted and it has renewable energy possibilities like the subject. Sale 2 is located in Harper Lake area North of Hinkley and is similar to the subject relative to Industrial demand and renewables possibilities, but not very good on exposure or visibility. A minor adjustment was warranted. Sale 3 is located Southeast of Cima near the New York Mountains. Access and location is inferior to the subject although the roads are dirt they are well maintained with little traffic. Adjustment was made for dirt road, distance, and lack of exposure and visibility; although the views from this property are spectacular. Buyer was the U.S. Government. Sale 4 is located adjacent to the same rail line Southwest of Barstow near Hodge and has renewables potential like the subject. Its location is similar; this site is considered by market participants to exhibit inferior traffic exposure and visibility due to very low traffic. It is not adjacent to a commercial or industrial zoned parcel and would be less feasible to develop as a commercial / industrial facility warranting an upward adjustment. Listing 5 is located in Lucerne Valley just off Hwy 247 and near transmission lines that are being upgraded suggesting renewables potential. It was considered to be similar in location based on traffic count and appeal to the market. Sale 6 is the closest to the subject at Mannix Road and Freeway 15 at two off ramps southwest and its location was considered very similar. An adjustment was made; although it is substantially smaller than the subject or other comparables. There is a well on this property that is capped and condition is unknown. Buyer was the U.S. Government Department of the Army for Fort Irwin expansion, and considered a very knowledgeable buyer. Seller did not consider the well to have any value and is a known player in local real estate and considered knowledgeable. Active Listing 7 is also located in Lucerne Valley with similar access, exposure, and visibility. It also enjoys renewable energy potential. No adjustment was made. Topography
Typically, level sites are considered superior to sloping sites since level sites require less grading and offer a higher development potential. In the evaluation of the comparables and subject for this report, the appraiser found that there is an exception.
63
Based on our physical inspection of the subject and conversations with Marshall Pettit, as well as investigation and evaluation of the market for sand and gravel as published in the annual California Non-Fuel Mineral Reports, coupled with the subjects location having a rail spur allowing access to the global market: We have reached the opinion that the subjects topography, (a slight sloped south conducive with development), in this particular case is a benefit to the land and adds to the value. All of the selected comparables were essentially flat or had slight slopes similar to much of the subject. Use/Zoning/Entitlements
Any difference in the highest and best use of a comparable and the subject property must be addressed, if necessary. When current zoning reflects the highest and best use, adjustments for different zoning classifications are necessary when the land uses allowed under the subject’s classification are substantially different than those allowed by the zoning designation governing any of the comparable land sales comments would be made. In this case, most of the selected comps were conservation properties and all could reasonably be adapted to renewable energy production allowed on a variety of zoning designations. The subject has a mining designation with appropriate permits from San Bernardino County including a recent grading permit. Permits of this type are difficult to obtain and can be stalled under the California Environment Quality Act (CEQA), making these a valuable asset. Mr. Bill Jensen, former mayor of Hesperia, CA, a broker and a specialist in real estate mining funding, indicated such permits would costs around $1,300,000.00 and can take two or more years to obtain. Condition of Site
This adjustment relates to the site condition at the time of sale, and assumes that the subject site is vacant and available for development to its highest and best use. Rail Access
Sale 4 deemed inferior to the subject relative to rail access. While it fronts on the rail line, it has no direct access such as a siding or scale. Non-realty components of value
The inclusion of non-realty components of value in the purchase price of a property would require adjustment to derive the sale price attributable to the real property only. Non-realty components include going concern value, personality, and other items. No known non-realty components were included in the purchase prices of the sales. No adjustments are appropriate. Mojave River Influence
The subject is in part located within the floodway of the Mojave River and thus that portion is probably not ever going to be developed due to objections from the Army Corps of Engineers, California Fish and Game, and potentially, National Fish & Wildlife

64
Service, and it is anticipated that all will file a California Environment Quality Act (CEQA) challenge to any river development. Therefore, in calculating the usable land area, that portion located in the river was deducted from valuation calculations in an abundance of caution. I spoke with broker, Larry Cullinane, Ph. (760) 265-4224, who has, for years, specialized in mitigation land transfers regarding the use and/or disposal of those lands located in the Mojave River at the extreme Southeast corner of the property and a few small seasonal blue line washes (streams). His feeling was that this portion is marketable at $1,500.00 to $2,250.00 per acre to entities needing mitigation land. He also cautioned that California Fish & Game would need to research the property for acceptability by the department. That process could easily take in excess of one year. Market Comments The comparable vacant land sales utilized in this report all represent the best comparables available at the time of the appraisal. All six comparables bracket the subject with respect to Size, Access, Topography, Utility, Access to Utilities, Zoning, and Appeal. Comparable 3 has a small cabin on site that will be demolished and a large deep buried cistern that will be filled with dirt to prevent injuries. This property was bought by the U.S. Government for conservation purposes and is located inside the National Mojave Desert Preserve. Summary of Vacant Land Sales and Listings The following spreadsheet of the six comparables adjusted to the subject is designed to give the reader a quick study on the results of the selection process. Based on these seven selected comparables, a value was reached of between $5,900.00 and $6,300.00 per acre. Because the subject has some distinct advantages being so near the freeway, on a paved frontage road, near an interchange with additional amenities, I believe that the emphasis should be at the upper end of the grid values. Then looking to the aerial photographs of the subject in consideration of the Mojave River portion exclusion of say 10 – 12 % of the extreme Southeast corner the remaining parcels for development would be say 282 acres m/l with a range of value of say:
$1,663,800.00 to $1,776,600.00
Rounded to say:
$1,800,000.00

65

66
The Mojave River water course can be seen at the extreme Southeastern corner of the subject impacting 10 to 12 percent of the parcel. This is potential mitigation land subject to CAL F&G acceptance.
Aerial of the Carlton Global Processing Mill at New Dunn Siding, California

67
Comparable Sale No. 1
This property is an active listing with the Victor Valley Association of Realtors (VVAR) Multiple Listing Service (MLS) #426479 listed at $882,500.00. The property is comprised of 353 acres or 15,376,680 square feet located just Northeast of Baker, California. This property is known as Assessor’s parcel (APN) 0544-351-12-0-000, 13, 20, 24, 27, 33, 35 & 36, a multi-parcel property. Days on market are 14 as of March 4, 2013. The property is marketed as a potential renewable energy property or in the alternative mitigation land. It has Freeway 15 exposure, high voltage electrical lines passing through it and a high pressure natural gas line. SCE has a transformer station in Baker. Seller is Waas Family Trust dated 8/9/2000. Last prior interfamily event was dated 2/26/2010 #77167. No transfer amount reported. No priors were reported through NDC data. Thomas Brothers map reported to be 2971-J1, Delorme map 121-D7. Access by way of Baker Blvd extension along Northwest side of the freeway by 4WD.

68
Northeast of Baker, California Adjustments This comparable was adjusted 5% for perceived access being 4wd and 5% additional for exposure. While it has freeway exposure it is mostly set back away from the freeway and is somewhat obscured by native brush.
Comparable Sale No.2
This property is a sold property at $600,100.00. The property is comprised of 320 acres or 13,939,200 square feet located at Harper Lake, California, northwest of Hinkley, California. This property is known as Assessor’s parcel (APN) 0490-091-09-0-000. Days on market were not provided; however this was a tax auction and it was advertised nationally. Posted properties are usually reported for at least ninety days on-line. The property is marketed as a potential renewable energy property or in the alternative mitigation land. It has no Freeway 15 exposure, high voltage electrical lines passing near it and a high pressure natural gas line nearby. SCE has a transformer station in Harper Lake. Seller is the San Bernardino County Tax Collector document 2010-253130. Last prior transfer was 12/21/1995 for a reported $348,784.00 or $1,875.00 per acre. Confirmed by County records.

69
Thomas Brothers map reported to be 212-C3, Delorme map 119-G7. Access by way of Harper Lake Road North from Hwy 58. Harper Lake Road is the West boundary of the subject. The road is rough but passable with a standard auto. This property is located in an area designated as a Financial Renewables Area by San Bernardino County for electric generation and financing.

70
Harper Lake, California, East of Luz Solar SEGS. Adjustments This comparable was also adjusted for lack of locational and exposure/visibility a total of 10% due to lack of traffic counts.
Comparable Sale No. 3
This property is a sold property at $690,000.00 according to broker Mehdi Mostaedi of Coldwell Banker Commercial Real Estate Solutions, Ph. (760) 684-8044. The property is comprised of 320 acres or 13,939,200 square feet located in the Mojave National Preserve, California, Southwest of the New York Mountains. This property is known as Assessor’s parcel (APN) 0567-262-08-0-000. Days on market were reported as one (1) day in VVMLS listing #422881. The buyer was the U.S. Government Department of the Interior for conservation purposes. The property has a small cabin of nominal value and two large deep cisterns. All will probably be razed in the interest of safety and thus are considered to have no monetary value.

71
Seller is Ross Ranch, LLC on document 2012-487554 on 11/15/2012. Last prior transfer was 12/30/2008 for a reported $288,000.00 or $900.00 per acre. Verified by Mr. Mehdi Mosteadi, owner/seller and principle in Coldwell Banker Real Estate Solutions brokerage. Thomas Brothers map reported to be E, Delorme map 122-E4. Access by way of New York Mountain Road North from Hwy 40 from Essex, California. The road is rough but passable with a standard auto.

72
Southeast of New York Mountains in the Mojave National Preserve – Ross Ranch Adjustments The subject was considered inferior to the subject and was adjusted up by 10% for dirt access, 5% for inferior exposure and an additional 5% for visibility.
Comparable Sale No. 4
This property is a sold property at $690,000.00 according to broker Mehdi Mostaedi of Coldwell Banker Commercial Real Estate Solutions 760-684-8044. The property is comprised of 320 acres or 13,939,200 square feet located in the Mojave National Preserve, California, Southwest of the New York Mountains. This property is known as Assessor’s parcel (APN) 0567-262-08-0-000. Days on market were reported as one (1) day in VVMLS listing #422881. The buyer was the U.S. Government Department of the Interior for conservation purposes. The property is vacant virgin desert land located in Hodge, California, Southwest of Hinkley, California, and is adjacent to the rail lines. Old Hwy 66 National Trails Highway is nearby to the East. This property is comprised of 13 parcels totaling 464.95 acres m/l in Section 13, Township 9 North, Range 3 West, SBB&M. It is located on Cannae Road that parallels the rail tracks and has electric and telephone nearby. Seller is Compass Bank on document 2011-462807 on 11/8/2011for $2,300,000.00 or $4,946.77 per acre. Last prior transfer was 12/13/2010 for a reported $3,450,000.00 or

73
$41,471.33 per acre as a trustee’s deed on foreclosure. There was a prior note in the amount of $22,500,000.00 to Guaranty Bank Federal Savings Bank dated 12/18/2006 that defaulted in the amount of $19,337,683.00 that was noticed for trustee’s sale on 10/14/2010. Thomas Brothers map reported to be 3678-C7, Delorme map 130-B3. Access Cannae Road southwest from Lenwood Road at the rail crossing at Lenwood, California. The road is rough but passable with a standard auto but 4WD is advised. Verified with San Bernardino County assessment records.
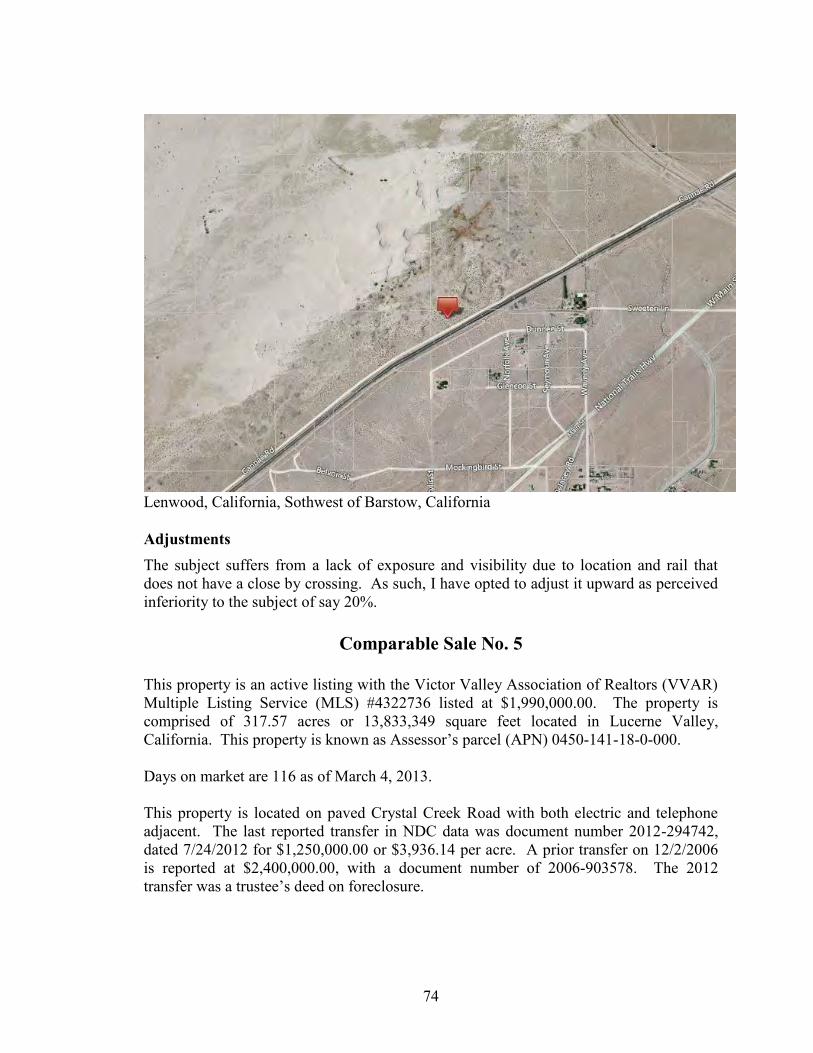
74
Lenwood, California, Sothwest of Barstow, California Adjustments The subject suffers from a lack of exposure and visibility due to location and rail that does not have a close by crossing. As such, I have opted to adjust it upward as perceived inferiority to the subject of say 20%.
Comparable Sale No. 5
This property is an active listing with the Victor Valley Association of Realtors (VVAR) Multiple Listing Service (MLS) #4322736 listed at $1,990,000.00. The property is comprised of 317.57 acres or 13,833,349 square feet located in Lucerne Valley, California. This property is known as Assessor’s parcel (APN) 0450-141-18-0-000. Days on market are 116 as of March 4, 2013. This property is located on paved Crystal Creek Road with both electric and telephone adjacent. The last reported transfer in NDC data was document number 2012-294742, dated 7/24/2012 for $1,250,000.00 or $3,936.14 per acre. A prior transfer on 12/2/2006 is reported at $2,400,000.00, with a document number of 2006-903578. The 2012 transfer was a trustee’s deed on foreclosure.

75
The property is marketed as a potential renewable energy property or in the alternative mitigation land. It has no freeway exposure or rail siding, yet is near the Mitsubishi Cement private rail line, but has no access rights to it.

76
Eastern Lucerne Valley, California, Southwest of State Hwy 18 Adjustments This property has good exposure, access and visibility, but is still a bit remote with little traffic warranting a slight upward adjustment of say 2%. Verified through MLS published reports.
Comparable Sale No. 6
This property is a sold property at $281,250.00 according to Gary Hug of Hug Construction in discussions with Mark Walker, my assistant appraiser. The property is comprised of 42.85 acres or 1,285,020 square feet located at Mannix Road and Freeway 15 in Northeast Newberry Springs, and is the closest to the subject. This property is known as Assessor’s parcel (APN) 0541-111-08-0-000. Days on market were not reported as the buyer approached the seller after the seller refused further crossings of the property without compensation. The buyer was the U.S. Government Department of the Army Corps of Engineers, considered knowledgeable. The property has a water well that is sealed off and the condition is unknown. Seller reports they considered it worthless, thus no adjustments made. There is electric, telephone, high pressure gas and fiber optics at or very close by this property. The property is level with paved road access, frontage road, and Freeway 15 visibility, exposure and access at Mannix Road interchange similar to that of the subject.

77
Thomas Brothers map reported to be 3684-D2, Delorme map 120-G3. Adjustment: None required. Purchase price was $6,364.00 per acre cash.

78
Mannix, California, Southwest of the Subject along Hwy 15
Comparable Listing No. 7
This property is an active listing with the Victor Valley Association of Realtors (VVAR) Multiple Listing Service (MLS) #422188 listed at $2,800,000.00. The property is comprised of 400 acres or 17,424,000 square feet located in Lucerne Valley, California. This property is known as Assessor’s parcels (APN) 0452-031-04-0-000 and 0452-041-18-0-000, a multi-parcel listing. Days on market are 130 as of March 4, 2013. This property is located on paved Cambria Road with both electric and telephone and High Voltage adjacent, which is scheduled to be upgraded by SCE to a 500KV line as part of the Hector/Lugo line improvement and there is a substation 2.75 miles South at Old Woman Springs Road. The last reported transfer in NDC data was document number 2006-165785 dated 3/10/2006 for $165,000.00 or $412.50 per acre. A prior transfer on 2/3/2006 is reported at $68,000.00 with a document number of 2006-82679. The property is marketed as a potential renewable energy property or in the alternative mitigation land.

79

80
Lucerne Valley West of Hwy 247/Barstow Road in Lake Bed
After evaluating the subject and the seven comparables, considering all factors that can affect the value of land and making adjustments to the comparable sales as needed, the appraisers came to this final value conclusion. For the purpose of (NLV) Net Liquidation Value, the appraisers put the most weight on sale No. 2, 3, 4 and No.6. The appraisers valued the subject at a range of between $5,900.00 per acre to $6,400.00 per acre. Then reducing the valued acreage by 11% to account for the proposed mitigation river lands (316.41 Acres total minus 34.8 acres = valued lands less river area = 281.6 acres m/l) a range of $1,661,440.00 to $1,802,240.00 is achieved. However, because the subject has several superior amenities such as the rail siding, switches, scale, transformer stations(2), high voltage power lines, high pressure natural gas line and mitigation lands it is my opinion that the value should be set at the high end of the range at $6,400.00 per acre. As of December 31, 2012, the (Rounded) Value of the subject land for the purpose of (NLV) Net Liquidation Value is:
ONE MILLION EIGHT HUNDRED THOUSAND DOLLARS $1,800,000.00

81
MARKET VALUE
Based on the recent land sales with the most emphasis on the sale of the property at Mannix junction to the U. S. Army at over $6,400.00 per acre it is my opinion that the market value of the subject land with adequate marketing and exposure with a reasonable marketing time suggested at one year or more by knowledgeable industrial brokers is:
ONE MILLION EIGHT HUNDRED THOUSAND DOLLARS
$1,800,000.00
To this value is added the value of the rail siding and spur estimated from Marshall & Swift Commercial Estimator (M&S), Section 66 page 3 as of December, 2011 publication for 130# $252,240.00 plus switches $160,000.00 and scale at $125,000.00 as report by David Nadwodny, Project Manager, from his sources essentially confirmed by M&S. See “Major Process Equipment Replacement Cost (Estimate)” attached. Please note that these rail improvements belong to the Union Pacific Railway; however they serve the subject property only. Some minor repairs to the siding are necessary. Additionally, the value of the aggregate overburden of an average of 22 feet on the north 180 acres was valued by comparison to that certain contract agreement in which Granite Rock Corporation agreed to pay seventy one cents per ton at dig site in-situ for road fill and asphalt base. Based on size and average aggregate weight at one ton per cubic yard, the sites 6,390,000 cubic yards would add $4,539,900.00, rounded to say $4,500,000.00. While some courts have ruled that in-situ minerals are of nominal value until mined, they are mentioned here and not computed in the total value of NPV or market value of the land. Granite Construction has mined a small amount of sand and gravel from the site recently.
Income Analysis
Statewide aggregate 2007 prices were $1,372,000,000.00 compared to gold mined totaling $13,000,000.00. Industrial sands brought $54,000,000.00 and masonry cement brought $66,000,000.00 as reported in the California Non-Fuel Minerals Report by the States Conservation Department. Granite Construction had agreed to pay 71 cents per ton. Without specific plans detailing the scope of development and estimated amount of material to be removed, the appraisers are basing their opinion on an estimate as to the exact amount of material to be removed. We have approximately 35,500 cubic yards per acre equal to about 35,500 in tonnage, so we must have 6,390,000 tons or $4,536,900.00 worth of material in-situ.

82
Aggregate Value $4,536,900.00
Rounded to say
$4,500,000.00
If this material would be mined, washed and sieved and sold off for construction materials, they have the potential in Today’s market of generating of $809 million for 82 million tons produced in California in 2010, according to California Non-Fuel Mineral report for 2010, the last issued. Industrial aggregates and sand brought $1,190 million on 127.5 million tons sold in 2010. The ports of Los Angles and Long Beach, California are currently mining aggregates in British Columbia and barging it to the ports for ballast. Water Value: The subject is just outside the Mojave Water Agency adjudicated area ending at Field Road on the West just past the Twin North/South I-15 rest stations. The subject extends down into and somewhat across the Mojave River. The USGS reports good quality water at the location and that opinion is shared by the Lahontan Water Quality Board and actual appraiser’s experience having worked on the adjudication back in the 1960s and 70s mapping wells, calculating water usage and dipping them for water samples. As such, there is no charge for pumping excess water for pay for Feather River Aqueduct water now pegged at $395.00 per acre foot per year. The plant uses well water for domestic, cooling, landscaping and dust control. I estimate that at 24/7 scheduling the mill will require about 150 acre feet per year or $59,250.00 at replacement costs. So, if we were to look to the 30 year mill life m/l at say 10 percent rate this would represent a Net present value of $558,544.68 savings. Additionally, the long range plan is to set several manufactured houses on site for staff and families and provide some additional security this will increase water use.
Value of water $558,544.68
Rounded to say
$560,000.00
Recently upper basin water rights sold to the City of Hesperia at $5,024.28 per acre foot or $29,999,975.88 for 5,971 acre feet per the Mojave Water Agency Watermaster’s office. This suggests the un-adjudicated water “right” may be worth $753,642.00 as a reversion at say thirty years in the future assuming no inflation. Demand will continue to increase; however, the supply remains short and there are areas up river that are not
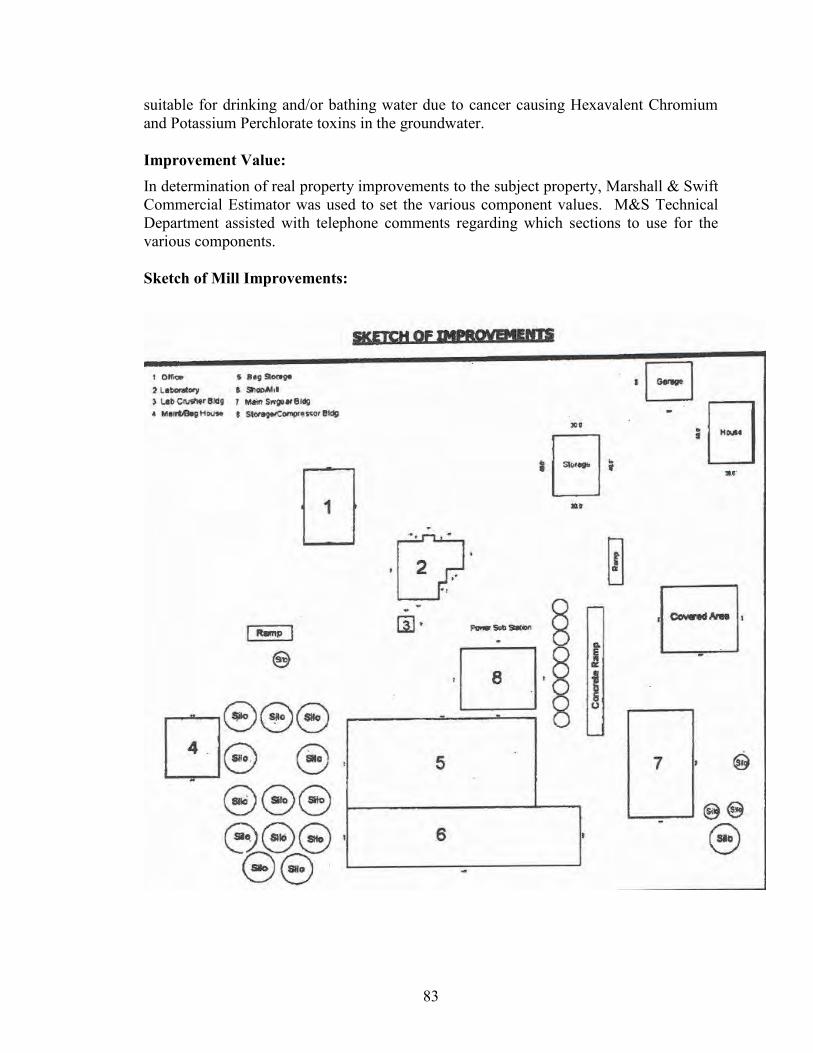
83
suitable for drinking and/or bathing water due to cancer causing Hexavalent Chromium and Potassium Perchlorate toxins in the groundwater. Improvement Value: In determination of real property improvements to the subject property, Marshall & Swift Commercial Estimator was used to set the various component values. M&S Technical Department assisted with telephone comments regarding which sections to use for the various components. Sketch of Mill Improvements:

84
The Mill: The County contends that there are real property improvements on site consisting of 23,803 square feet under roof; of those there are ten structures as follows: Office 1 comprised of 1,596 square feet class D – Frame and stucco construction, one story divided into six offices, 2 restrooms, 2 small closets, one reception room and a central hallway. The base rate calculator method reports such average to average plus structures currently costs $92.50 per square foot, new, plus furnishings. Section 15 page 17 edition of November, 2011 was used then adjusted with area and regional multipliers times 1.19 resulting in a local costs new of $110.07. Thus the structure alone is worth new by the cost approach of $175,679.70. After an inspection, I concluded the structure that was built in 1964, and well maintained, had accrued observed depreciation of say, 40% m/l or -$70,271.88, leaving a current value of say $105,407.82, rounded to say $105,000.00. Office 2 comprised of 6 offices and a restroom comprised of 1,508 square feet of class D – Frame and stucco construction, one story using the same data, had a new value after adjustment of $110.70, or $166,935.60 and had a similar accrued depreciation -$66,774.24 or a current value by cost approach of $100,161.36, rounded to say $100,000.00. Building 3, the well house, 144 square feet at 12 foot by 12 foot. Structure has nominal value. The well is of unknown design as no drillers log was found at the Mojave Water Agency or Department of Water Resources in Sacramento, California. Typical water well for small users cost around $30,000.00 to drill and equip. Building 4 is a 1,360 frame storage room and shop located West of the main silo farm, is 34 by 40 feet or 1360 square feet, and again using the M&S commercial manual section 17 page 11 edition of May, 2011 of $10.11 to $14.11, $15.14 adjusted by current multiples to yield a value of $20,590.40. Estimated depreciation at 40% or -$8,236.16 for a final current value after accrued depreciation of $12,354.24, rounded to $12,000.00. Building 5 is 60 foot by 120 feet long or 7200 square feet using data from section14 page 15 edition of February 2012 and updated with posted multipliers to $155.84 results in a new value of this heavy steel structure of $1,122,066.72, then adjusting it for accrued depreciation of 40% -$448,826.69 for a current final value of $673,240.03, rounded to say $673,000.00. Building 6, a class S heavy steel structure like 5, is 40 foot by 148 feet long of 5,920 square feet. Rated at $155.84 results in a new value of $922,572.80, then adjusting for accrued observed depreciation of say 30% or -$276,771.84 for a current final value of $645,800.96, rounded to say $645,800.00.
85
Building 7, a class S heavy steel multi-level structure with steel side panels, home to the Raymond mills, is 3024 square feet being 42 by 72 feet designed by Cantrall Steel Corporation of El Monte, CA., rated also at $155.84 results in a current new value of $471,260.16 times height multipliers from section 14 page 39 edition of February, 2012 by 1.35 times resulting in a value of $636,201.22, plus additional pads for the Raymond mills estimated from M&S Section 51at $4.72 per square foot reinforced for mill support adding say $16,888.14, rounded to say $16,900.00. This results in a grand total of $653,101.22 current new value of the structure and foundation system as adjusted for locational and time multipliers as suggested by M&S, resulting in a value before depreciation of $772,749.36. Then looking at the structure the frame appears in good condition. The siding shows sign of depreciation at say 50%, but the frame appears to be impacted nominally. Siding costs estimated at $33,036.84 based on section 55 page 5 edition of August, 2011 and adjusted with multipliers to current. The accrued depreciation on this structure limited to the siding only is -$16,518.42. The result is a structure valued after accrued siding depreciation of $756,230.94, rounded to say $756,000.00. A utility structure, building 8, with transformer pad and fencing adjacent class D-Frame metal clad exterior of average quality industrial construction. Using Section 14, page 35, edition of February, 2012 of $23.46 as adjusted to $28.85, excluding equipment reported by Nadwodny herein for a new value of $10,820.93. Depreciation was assigned at 45% or $4,869.42 resulting in a value by the cost approach of $5,951.51, rounded to say $6,000.00. Building 9 is a single family residential structure occupied by the watchman and family approximately 1500 square feet with an adjacent three car stand-alone garage of about 600 square feet. Condition is fair as to both structures, yet serviceable. A search for comparable structures suggests the value to be in the $15,000.00 to $25,000.00 range; however none were found with similar acreage or building combinations on site for comparison. The cost approach is questionable as date of construction is unknown. Design suggests late fifties to mid-1960s. As such the structures would be approaching the maximum depreciation and according to M&S, would be at or near 80% depreciated, thus given nominal value at this time. The County does not recognize these two structures in their property information management service, suggesting they consider them fully depreciated. However, it remains serviceable and thus is assigned a market value of say, $25,000.00. Building 10 is a large canopy adjacent to the jaw crushed between the crusher and building 7 estimated at 40 feet by 60 feet of class S pre-engineered steel construction used to keep raw product from being rained on. M&S section 14 page 37 edition of February 2012 at $45.00 per square foot adjusted with multipliers to $53.24 per sq ft., setting its value at $127,776.00 and assigning minor depreciation at say 10% the final value after accounting for depreciation would suggest $114,998.40, rounded to say $115,000.00.

86
Building or structure 11 is the 4 foot high buildup 420 feet long poured concrete bulkhead along the siding to facilitate down loading into rail cars on the tracks below at the South side of the mill. M&S section 51 page 3 edition of March 2013 and engineered drawing by W. B. Hicks and Associated Bulk Engineers of Pasadena, CA suggests an 8” thick wall and associated footings with reinforced steel rebar at $14.60 per square foot or $24,528.00. No depreciation was assigned. Additional Misc Improvements: A. There are assumed to be three private septic systems, one at the residence and one
each at the office and lab. Value is considered nominal without specifications or system inspection by licensed septic inspectors. At $4,000.00 to $5,000.00 apiece this could add $15,000.00 given the location.
B. Telephone and electric runs to the subject from utilities estimated at $20,000.00. C. Interior and exterior metal open grid stairways estimated per M&S Section47 page 8
edition of June 2011 at $250.00 per riser estimated 2000 risers as modified by multipliers at $295.80 per riser for a total of say $591,600.00.
D. Railings at silo and ladders and cages estimated at $45,000.00. E. Three concrete truck ramps estimated at $30,000.00. F. 1500 square foot concrete slab $63,750.00 G. Concrete slabs on grade at canopy near jaw crushed and under silos estimated at over
15,000 square feet by 6”, assumed to be reinforced with rebar per M&S Section 51 page 3 edition of March 2013 at say $4.50 per square foot resulting in a value of $67,500.00.
H. Misc water pipes and valves estimated at say $10,000.00 I. Radio tower and gear $12,000.00 J. Parking pads and drives $250,000.00 K. Interior cat walks $92,000.00 Grand Total Misc components: $1,196,250.00 I. Engineering, permits, inspections and soils preparation.
Permits for mining, grading construction valued at $135,000.00 Grading cut and fill with compaction $209,000.00 Architecture & Engineering $364,000.00 Contractor overhead & Profit $593,000.00
Subtotal I $1,301,000.00
II. Finished product on average 200 tons, mega bags or palletized bags in silos ready for delivery of Alunite, Althiomite, silica, talc, Bentonite, Calcium Carbonate, etc., at say $1200.00 per ton or $240,000.00 m/l. A roughly equal portion of unfinished material set in the yard to the North of the plant ready to crush and grind.
Subtotal II $240,000.00

87
Grand total improvements rounded: $2,500,000.00 Siding at recent similar siding construction Hesperia, CA: $4,500,000.00 Grand total equipment from David Nadwodny using R.S. Means: $9,127,836.00 Grand total vacant land: $1,800,000.00 Grand total components excluding water “right”, sand and aggregates on site $17,927,836.00: Rounded to say: $18,000,000.00
Grand total all components including water value and aggregates in-situ:
$23,060,000.
TWENTY THREE MILLON SIXTY THOUSAND DOLLARS

88
Reconciliation
In appraising vacant industrial land, the parcel is usually in an area of similar properties and conforming sales. The utility of the land is better able to be compared and the market is better defined. Unlike other types of Industrial land which are tied to certain local areas, parcels with access to a rail spur are by themselves extensions of the Ports and Logistics Centers and their value is directly related to the productivity of the Ports. In arriving at a value conclusion as to the Net Liquidation Value, the appraisers put most weight on sale to the Army as it best represents land portion of the Net Liquidation Value of the parcel. After evaluating comparable land sales one thru seven, the most weight was assigned to the U.S. Army Comparable at Mannix, as it is the most accurate indicator of Market Value of industrial property with a Rail Spur nearby.
Aggregate Value =$4,536,900.00
Rounded to say $4,500,000.00
As of December 31, 2012, the (Rounded) Value of the subject for the purpose of Market Value including potential in situe aggregates and sand is:
$23,060,000.00
TWENTY THREE MILLION SIXTY THOUSAND DOLLARS

89
ASSUMPTIONS AND LIMITING CONDITIONS FOR THIS ASSIGNMENT, THE APPRAISER WAS ASKED TO DETERMINE THE MARKET VALUE & NET PRESENT VALUE FOR THE SUBJECT PROPERTY. DATA SOURCES USED WERE NDC, VVMLS, BARSTOW MLS, CRMLS, LOOP.NET, TITLE PRELIMINARY FROM FIDELITY TITLE INSURANCE, USGS, CALIFORNIA NON-FUEL MINERALS REPORTS 2007 - 2010, BLM, TOPOZONE. COM, THOMAS GUIDE, COUNTY PLANNING DEPT., GOOGLE MAPS NAVIGATOR, AS WELL AS INSPECTION OF THE SUBJECT AND COMPARABLE SALES. THE APPRAISER(S) HAS/HAVE TAKEN THE FOLLOWING STEPS TO DETERMINE MARKET VALUE. 1. DENTIFIED AND EVALUATED THE SUBJECT PROPERTY AND PROVIDED A COPY OF THE INFORMATION IN THE VACANT LAND SECTION OF THE REPORT. 2. UTILIZED THE SAME DATA SOURCES TO LOCATE AND EVALUATE COMPARABLE PROPERTIES, IF ANY. 3. PERSONALY AND/OR WITH THE HELP OF TRAINED ASSISTANCE, INSPECTED THE SUBJECT PROPERTY AND THE COMPARABLE PROPERTIES. 4. PROVIDED PHOTOGRAPHS OF THE SUBJECT AND COMPARABLE PROPERTIES. 5. EMPLOYED REPORTS FROM THE PLANT MANAGER AND MADE EFFORTS TO VERIFY THE REASONABLE ASSERTIONS MADE BY MR. NADWODNY USING R.S. MEANS ESTIMATOR FROM INTERNET SEARCHES AND MARSHALL & SWIFT. 6. EVALUATED ALL OF THE INFORMATION COMPILED DURING THE COURSE THE APPRAISAL, INCLUDING BUT NOT LIMITED TO, SIZE, SHAPE, ZONING, VIEW (WHERE APPLICABLE), ACCESS, UTILITIES, HIGHEST AND BEST USE, FLOOD ZONE, DEMOGRAPHICS, ACCESS TO PUBLIC TRANSPORTATION, SOILS TYPE AND UTILITY, AS WELL AS ENVIRONMENTAL IMPACT/MITIGATION VALUE (WHERE INFORMATION WAS AVAILABLE/APPLICABLE), FOR THE SUBJECT AND COMPARABLE PROPERTIES. 7. AFTER CAREFULLY CONSIDERING ALL OF THE AFOREMENTIONED DATA, MADE A DETERMINATION OF VALUE BASED ON THE SUBJECTS CURRENT APPEAL TO THE MARKET.

90
THIS APPRAISAL IS DONE IN COMPLIANCE WITH USPAP AND THE REQUIREMENTS OF TITLE XI (FIRREA). THIS IS A SUMMARY NARRATIVE APPRAISAL REPORT. THE COST APPROACH IS USUALLY HEAVILY RELIED UPON WHEN THE IMPROVEMENTS ARE NEW OR IS RELATIVELY NEW OR WHEN THE PROPERTY INVOLVES A GOVERNMENT BUILDING OR A SPECIAL PURPOSE STRUCTURE SUCH AS THE SUBJECT. THE INCOME APPROACH WAS NOT USED AS THE INCOME FROM THE MINERAL AT BLAWN MOUNTAIN, BEAVER COUNTY, UTAH WAS PREPARED BY JOHNSOM AND GOMEZ VALUED AT $107.6 MILLION OVER A TEN YEAR PERIOD. HOWEVER, IN THIS MARKETPLACE THE PREDOMINANT BUYER IS OWNER/USER. THUS, THERE WAS NOT ENOUGH RELEVANT DATA TO CONSIDER THE MARKET COMPARISON APPROACH. THE MARKET APPROACH IS ALWAYS THE BEST APPROACH WHEN THERE IS AMPLE AND SIMILAR DATA ON SIMILAR MILLS AVAILABLE REASONABLY CLOSE BY. IT IS BASED UPON THE PRINCIPLE OF SUBSTITUTION, WHICH STATES THAT “A BUYER WILL NOT PAY MORE FOR A PROPERTY THAN THE COST OF ACQUIRING AND EQUALLY DESIRABLE PROPERTY”. FOR THIS ASSIGNMENT, THE MOST WEIGHT WAS GIVEN TO THE MARKET COST APPROACH BASED ON MARSHALL & SWIFT DERIVED FROM MARKET PARTICIPANT INPUT. THE COST APPROACH IS BY ITS NATURE A RETROSPECTIVE ASSESSMENT OF REASONABLE COSTS DERIVED FROM MARKET PARTICIPANTS REPORTING THEIR RECENT COSTS TO COMPANIES SUCH AS R.S. MEANS AND MARSHALL & SWIFT WHO IN TURN REPORT IT TO SUBSCRIBERS OF THEIR DATA REPORTS.

91
CERTIFICATION
The Appraiser(s) certify and agree that: 1. I/We have, at a minimum, developed and reported this appraisal in accordance with the scope of work requirements stated in this appraisal report. 3. I/We performed this appraisal in accordance with the requirements of the Uniform Standards of Professional Appraisal Practice that were adopted and promulgated by the Appraisal Standards Board of The Appraisal Foundation and that were in place at the time this appraisal report was prepared. 4. I/We developed an opinion of the market value of the real property that is the subject of this summary report based on the sales comparison approach to value. I/We have adequate comparable market data to develop a reliable sales comparison approach for the land component of this summary appraisal assignment. 5. I/We researched, verified, analyzed, and reported on any current agreement for sale for the subject property, any offering for sale of the subject property in the twelve months prior to the effective date of this appraisal, and the prior sales of the subject property for a minimum of three years prior to the effective date of this appraisal, unless otherwise indicated in this report. I/We understand that there is no current sale planned; but a transfer of ownership shares to Advanced Bio-Mineral Technologies, LLC by current stakes holders. 6. I/We researched, verified, analyzed, and reported on the prior sales of the comparable sales, if any, for a minimum of three years prior to the date of sale of the comparable sale, unless otherwise indicated in this report. 7. I/We selected and used comparable sales that are proximately, physically, and functionally the most similar to the subject property. 8. I/We have reported adjustments to the comparable sales that reflect the market’s reaction to the differences between the subject property and the comparable sales. 9. I/We verified, from disinterested sources, all information in this report that was provided by parties who have a financial interest in the sale or financing of the subject property. 10. I/We have knowledge and experience in appraising this type of property in this market area. 11. I/We are aware of, and have access to, the necessary and appropriate public and private data sources, such as multiple listing services, tax assessment records, public land records, and other such data sources for the area in which the property is located. 12. I/We obtained the information, estimates, and opinions furnished by other parties and expressed in this appraisal report from reliable sources that we believe to be true and correct. 13. I/We have taken into consideration the factors that have an impact on value with respect to the subject neighborhood, subject property, and the proximity of the subject property to adverse influences in the development of our opinion of market value. I/We have noted in this appraisal report any adverse conditions (such as, but not limited to, the presence of hazardous wastes, toxic substances, adverse environmental conditions, etc.) observed during the inspection of the subject property or that we became aware of during the research involved in performing this appraisal. I/We have considered these adverse
92
conditions in our analysis of the property value, if any, and have reported on the effect of the conditions on the value and marketability of the subject property. 14. I/We have not knowingly withheld any significant information from this appraisal report and, to the best of our knowledge, all statements, estimates and information in this appraisal report are true and correct. 15. I/We stated in this appraisal report our own personal, unbiased, and professional analysis, opinions, and conclusions, which are subject only to the assumptions and limiting conditions in this appraisal report. 16. I/We have no present or prospective interest in the property that is the subject of this report, and we have no present or prospective personal interest or bias with respect to the participants in the transaction. I/We did not base, either partially or completely, our analysis and/or opinion of market value in this appraisal report on the race, color, religion, sex, age, marital status, handicap, familial status, or national origin of either the prospective owners or occupants of the subject property or of the present owners or occupants of the properties in the vicinity of the subject property or on any other basis prohibited by law. 17. I/Our employment and/or compensation for performing this appraisal or any future or anticipated appraisals was not conditioned on any agreement or understanding, written or otherwise, that we would report (or present analysis supporting) a predetermined specific value, a predetermined minimum value, a range or direction in value, a value that favors the cause of any party, or the attainment of a specific result or occurrence of a specific subsequent event (such as approval of a pending mortgage loan application). 18. I/We personally prepared all conclusions and opinions about the real estate that were set forth in this appraisal report. If I/We relied on significant real property appraisal assistance from any individual or individuals in the performance of this appraisal or the preparation of this appraisal report, I/We have named such individual(s) and disclosed the specific tasks performed in this appraisal report. I/We certify that any individual so named is qualified to perform the tasks to the best of their ability to the best of our belief. I/We have not authorized anyone to make a change to any item in this appraisal report; therefore, any change made to this appraisal is unauthorized and we will take no responsibility for it. The reported analyses, opinions, and conclusions were developed and this report has been prepared, in conformity with the requirements of the Uniform Standards of Professional Practice. 19. I/We identified the lender/client in this appraisal report who is the individual, organization, or agent for the organization that ordered and will receive this appraisal report. No other user was intended or implied the right of use. 20. I/We performed a complete visual inspection of the subject property to the extent possible without destructive testing, disassembly or modifications. I/We reported the site characteristics in factual, specific terms. 21. Appraiser and supervisor’s consent must be obtained before this appraisal report may be disclosed or distributed to any other party (including, but not limited to, the public through advertising, public relations, news, sales, or other media). 22. I/We are aware that any disclosure or distribution of this appraisal report by us or the client may be subject to certain laws and regulations. Further, we are also subject to the provisions of the Uniform Standards of Professional Appraisal Practice that pertain to disclosure or distribution by us.

93
23. If this appraisal report was transmitted as an “electronic record” containing our “electronic signature,” as those terms are defined in applicable federal and/or state laws (excluding audio and video recordings), or a facsimile transmission of this appraisal report containing a copy or representation of our signature, the appraisal report shall be as effective, enforceable and valid as if a paper version of this appraisal report were delivered containing our original hand written signature. 24. I/We have not provided professional appraisal services or any other services within the prior 36 months on this property.
Paul T. Jacobs Certified General Appraiser AG005064 Expires August 2, 2014 I wish to thank the following individuals for their assistance in the preparation of this report: Mr. Mark Walker, SCRA AR034675 for assistance in land and mill inspection, photography, and investigations of comparable land values. Mr. David Nadwodny, Project Manager, for assistance in equipment and machinery estimations of value using data from InfoMine USA, Continental Conveyor & Equipment Co, Ace Machine Works, RS Means Costworks, Western Mine Engineering, Baghouse Industrial & Sheetmetal Services, Inc., as well as suppliers and fabricators used in the recent refurbishment of the New Dunn Mill. The technical support staff at Marshall & Swift.
94
ADDENDA

95
Subject Grant Deed
EXHIBIT 1

96

97
EXHIBIT

98

99
EXHIBIT 1 & 2 LEGEND

100
Mojave Water agency Adjudication Area Based on MWA on-line maps the subject is outside the adjudication area identified as red dashed line.

101
Geologic and water basin map of Mojave Basin

102

103


![Edu 5701 7 Dunn & Dunn Learning Styles Model[1]](https://img.pdfslide.net/doc/110x75/545d137caf7959af098b4af9/edu-5701-7-dunn-dunn-learning-styles-model1.jpg)