Embed Size (px)
Citation preview
.
Durack Institute of Technology
Final Report 1 January 2016 to 10 April 2016
2016 Final Report 2
Statement of Compliance 1 Executive Summary 2 Appointment of the Reporting Officer 3 Compliance with Written Law 4 Organisational Structure 7 Corporate Governance 8 Compliance 10 Functions 17 Report on Operations 19 Financial Statements 20 Notes
Postal Address: Locked Bag 103 Geraldton Western Australia 6160
T: 08 9956 2834 E: [email protected] W: www.durack.edu.au

2016 Final Report 3
Hon Liza Harvey MLA Minister for Police; Road Safety; Training and Workforce Development; Women's Interests In accordance with Section 63 of the Financial Management Act 2006, I hereby submit for your information and presentation to Parliament, the Annual Report of Durack Institute of Technology for the period January 1 2016 to April 10 2016. The Report has been prepared in accordance with the terms of the appointment of the Reporting Officer, as outlined by the Treasurer and the provisions of the Financial Management Act 2006.
Satvinder Sekhon Reporting Officer 21 June 2016
2016 Final Report 4
In October 2015, The Minister for Training and Workforce Development launched the Training Sector Reform Project (Reform Project) to examine the function and structure of Western Australia’s public training sector. The purpose of the Reform Project is to ensure a robust and sustainable public vocational education and training (VET) sector with high quality training that is accessible and equitable to the community and that supports improved outcomes for students. As a result of the State Government’s Training Sector Reform Project from 11 April 2016, the 11 former Institutes and their 70 campus locations will be managed by a network of five TAFE colleges. The five new TAFE colleges will be named North Metropolitan TAFE, South Metropolitan TAFE, North Regional TAFE, Central Regional TAFE and South Regional TAFE. New arrangements will also be introduced that will see greater collaboration among the network of colleges, allowing resources and expertise to be shared across WA. This will give students, particularly those in regional areas, access to more diverse training programs. The reforms will also see the reinstatement of the TAFE brand, in recognition of the strong historical association and awareness by local communities. As a result of the reform operations, students and staff at Durack Institute of Technology will transition to Central Regional TAFE from April 11, 2016. Therefore outcomes relating to Durack Institute of Technology will be reported on in the amalgamated TAFE’s end of financial year reporting.
2016 Final Report 5
Under Section 68(1) of the Finance Management Act 2006 (FMA) it is necessary to appoint a Reporting Officer, to perform the duties in relation to the final reports for the abolished Institute. Approval was sought for the Treasurer to appoint a reporting officer who is responsible for the preparation of the final reports for any Institute closed by the reform. The report will be for the period 1 January 2016 to 10 April 2016 inclusive and include a set of financial statements and notes (including 2015 comparatives), an abridged report on operations and not include key performance indicators.
The final report is to be submitted to the Minister for The Department of Training and Workforce Development within 90 days from the closure date of Durack Institute of Technology, to be tabled in Parliament 14 days after that.
2016 Final Report 6
Enabling Legislation Durack Institute of Technology was established as a Statutory Authority in 1996 under section 35 of the Vocational Education and Training Act 1996. Legislation Administered The Minister for Training and Workforce Development administers the Vocational Education and Training Act 1996. Legislation Impacting on the Institutes Activities Key legislation impacting on Durack Institute of Technology’s activities and with which the institute complies:
State Legislation Auditor General Act 2006 Building Act 2011 Corruption and Crime Commission Act 2003; Disability Services Act 1993; Education Act 2004; Electoral Act 1907; Equal Opportunity Act 1984; Financial Management Act 2006; Freedom of Information Act 1992; Government Employees Superannuation Act
1987 Industrial Relations Act 1979; Industrial Training Act 1975; Legal Deposit Act 2012 Minimum Conditions of Employment Act
1993; Occupational Safety and Health Act 1984; Public and Bank Holidays Act 1972; Public Interest Disclosure Act 2013
Public Sector Management Act 1994 State Records Act 2000; State Supply Commission Act 1991; Vocational Education and Training Act 1996; Workers Compensation and Injury Management Act 1981; Working with Children (Criminal Record Checking)
Act 2004
Commonwealth Legislation Copyright Act 1968; A New Tax System (Goods and Services Tax) Act
1999 Constitution Act 1889 Fringe Benefits Tax Act 1896, Commonwealth Fair Work Act 2009 Privacy Act 1988 Racial Discrimination Act 1975; Sex Discrimination Act 1984; Skilling Australia’s Workforce Act 2005

2016 Final Report 7
Durack Institute of Technology is a statutory authority delivering vocational education and training. The responsible Minister is the Hon Liza Harvey MLA, Minister for Training and Workforce Development. The Governing Council is the Accountable Authority and the Managing Director is the Chief Executive Officer who is supported by a Corporate Executive.
2016 Final Report 8
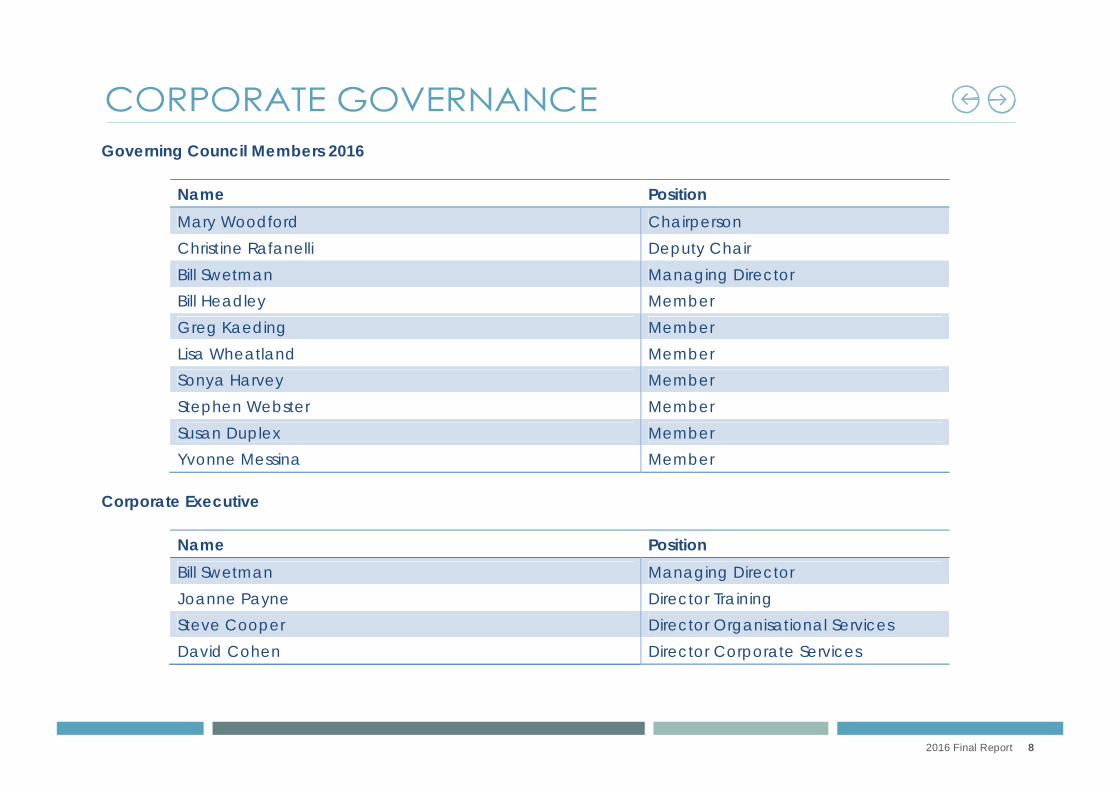
Governing Council Members 2016
Name Position Mary Woodford Chairperson Christine Rafanelli Deputy Chair Bill Swetman Managing Director Bill Headley Member Greg Kaeding Member Lisa Wheatland Member Sonya Harvey Member Stephen Webster Member Susan Duplex Member Yvonne Messina Member
Corporate Executive
Name Position Bill Swetman Managing Director Joanne Payne Director Training Steve Cooper Director Organisational Services David Cohen Director Corporate Services
2016 Final Report 9
Public Sector Standards and Ethical Codes (Breaches) In accordance with S31(1) of the Public Sector Management Act 1994, Durack Institute of Technology implemented the following measures to ensure compliance with public sector standards, the WA Code of Ethics and our own agency code of conduct.
Durack Code of Conduct aligned with the WA Public Sector Code of Ethics and Conduct Guide and made available on the intranet.
100 per cent of Managers/Supervisors have completed accountable and ethical decision making training. To provide managers with effective strategies to identify and manage workplace issues and to minimise the risk
of future liability, 16 Managers attended Managing Workplace Issues, a 1 day workshop facilitated by EEO Specialists.
100% compliance with Crime and Corruption Commission requirements for investigations.
There were nil requests for a review against the Standards for Human Resource Management during the reporting period.
Public Interest Disclosures The Office of the Auditor General is one of a number of accountability agencies to which people can make public interest disclosures (PID) under the Public Interest Disclosures Act 2003. This Act establishes us as the appropriate authority to receive PIDs that relate to substantial unauthorised or irregular use of, or substantial mismanagement of, public resources. In the period from 1st January to 10th April 2016, we received no complaints that met the criteria of a PID. The Auditor General appoints key employees, including some executive members of the Office, as PID officers. We deliver appropriate training for these employees so they can receive and manage PIDs effectively. Record Keeping Plan Durack Institute of Technology is a signatory to the sector wide Recordkeeping Plan (RKP) which was approved by the State Records Commission (SRC) in December 2012 as prescribed by the State Records Act 2000.
2016 Final Report 10
All aspects of the recordkeeping system at Durack Institute of Technology are regularly reviewed and evaluated to ensure continual improvement and compliance.
Durack, as part of the State Training Providers Records Management Network, continues to monitor and maintain recordkeeping key performance indicators and best practice.
A records business plan is monitored and reviewed on a regular basis to ensure effectiveness and efficiency whilst providing a quality recordkeeping system.
Durack has records management policies and procedures in place, and these are communicated to staff through provision of regular training and induction sessions for all staff. Durack staff have access to recordkeeping information via our Records section.
Recordkeeping training program A records awareness training program was carried out throughout 2015. A high number of staff attended the records awareness and induction training session including some records refresher training. Feedback from all sessions was utilised to evaluate the effectiveness of the training and to identify opportunities for continuous improvement.
To align with Durack’s paper saving strategy, Records staff will continue to place all recordkeeping training information and instructions on Durack’s intranet pages.
Training was delivered to all levels of staff and included staff at Geraldton, Carnarvon and Exmouth campuses. This resulted in a continued overall improvement in the uptake and correct usage of the records system.
The efficiency and effectiveness of the recordkeeping training program Recordkeeping training is reviewed regularly by the Records team, particularly after each training session and an overall review is made on an annual basis. Amendments are made to the training when and where required.
The organisation’s induction program The records management induction for new staff is fully integrated into Durack’s formalised induction program. This session addresses employees’ roles and responsibilities with regards to compliance, mail management, file management, archival management and overall records management.
All information relevant to record keeping at Durack Institute of Technology is available to staff via the Institute’s intranet or through the Records staff.
2016 Final Report 11
Freedom of Information Applications - There were no applications during the period from 1 January to 10 April 2016. Information Statement - A current formal information policy statement is available on the Durack Institute of Technology Internet website. Complaints Durack Institute of Technology values client feedback and recognises that opportunities to improve products and services arise from effective handling of client feedback and complaints.
The Institute’s feedback and complaints policy and procedures overarching aim is to ensure all feedback and complaints are processed in a way that reconciles the interests of clients and the Institute, whilst ensuring expectations of fairness are met. All Durack staff are responsible for reviewing the feedback provided to assist with informing and implementing continuous improvement activities.
The opportunity for clients to provide the Institute with feedback and complaints, is made widely available through printed material and publication on the Institute’s website. Where clients have special needs, every reasonable effort is made to provide assistance if requested, and to make the complaint lodgement procedure as flexible as possible.
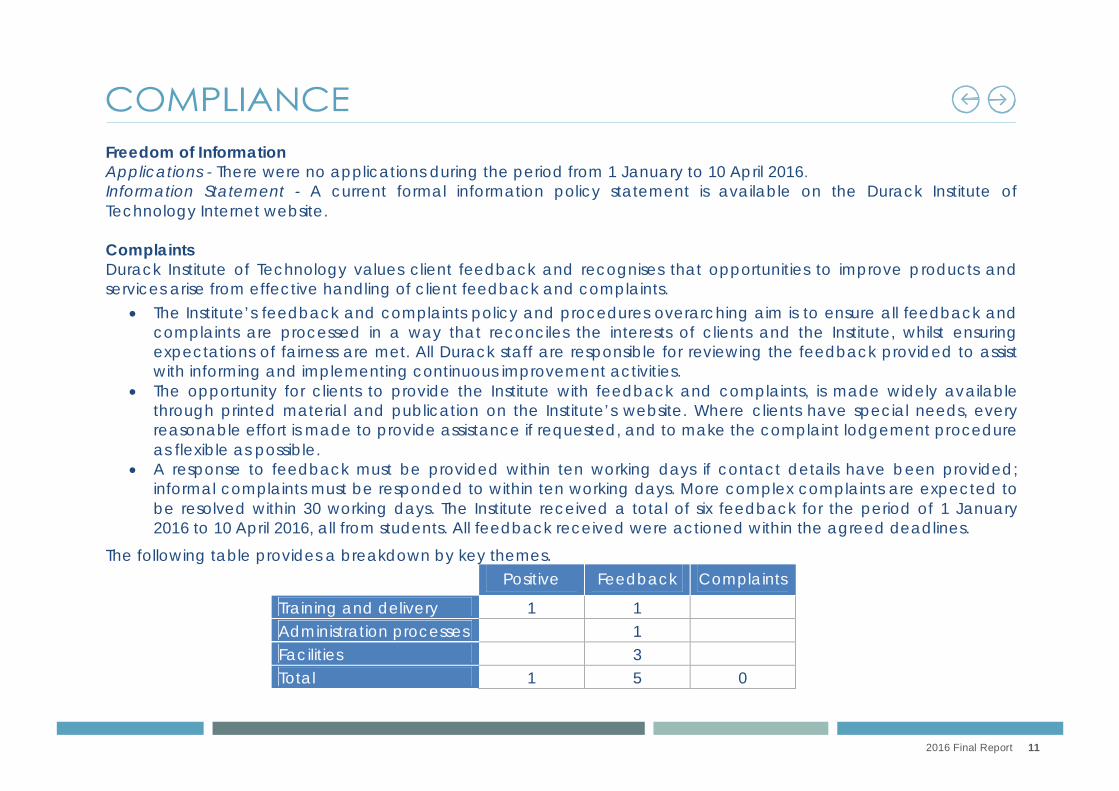
A response to feedback must be provided within ten working days if contact details have been provided; informal complaints must be responded to within ten working days. More complex complaints are expected to be resolved within 30 working days. The Institute received a total of six feedback for the period of 1 January 2016 to 10 April 2016, all from students. All feedback received were actioned within the agreed deadlines.
The following table provides a breakdown by key themes.
Positive Feedback Complaints
Training and delivery 1 1 Administration processes 1 Facilities 3 Total 1 5 0

2016 Final Report 12
Advertising In accordance with s175ZE of the Electoral Act 1907, the Institute incurred the following expenditure in advertising, market research, polling, direct mail and media advertising:
1. Total expenditure for the period 1 January 2015 to 10April 2016 was $77842.39 2. Expenditure was incurred in the following areas:
Area of Expenditure Total Organisation Amount
Advertising Agencies Nil Nil
Market Research $31,750 National Centre of Vocational Education Research (NCVER) 31,750
Polling Nil Nil
Direct Mail
Media Advertising $46,092 Carat Australia 24,599 Rev Design Pty 770 Sensis Pty Ltd 527 Midwest Chamber of Commerce 163 Adcorp Australia Ltd 700 Joblink Midwest 71 Vision 6 304 Challenger Institute of Technology 18,958
TOTAL $77,842

2016 Final Report 13
Occupational Safety and Health Durack Institute of Technology recognises and accepts its statutory obligations under the Western Australian Occupational Safety and Health Act 1984. The Institute is committed to providing a safe and healthy environment for all employees, students, volunteers, visitors and contractors ensuring they are not exposed to hazards which may result in injury or harm to their health. The Institute is committed to maximising opportunities for continuous improvement and reviewing its safety performance.
Durack managers are responsible for the implementation of the Occupational Safety and Health (OSH) Policy within their workplace and organisational area. This responsibility includes: Integrating OSH into all aspects of work practices. Planning, developing, implementing and monitoring safe systems of work to maximise opportunities for continuous
improvement in safety performance. Managing risks as far as practicable within the working environment. Providing adequate information, training and supervision for all staff, contractors and visitors to ensure they are
able to work in a safe and healthy environment.
Occupational Safety and Health - for Managers Training sessions in Occupational Safety and Health for managers and supervisors were provided to update legislative knowledge, provide examples of best practice and outline the responsibilities for ensuring and promoting a safe workplace. Formal mechanism for consultation with employees on occupational safety and health matters. The Institute actively seeks consultation with employees on occupational safety and health matters through the following systems: OSH Policy Statement – Outlining management and staff commitment to consult and cooperate on OSH matters
and support and promote OSH in the workplace. The review of the OSH Policy Statement extended this to include first aid support for all staff, students, visitors and contractors; and injury management support with return to work programs. This policy is reviewed annually.
2016 Final Report 14
OSH Committee – Membership representation consists of management and OSH Representatives from a large
cross section of the Institute and includes participation by Corporate Executive. The Committee takes a consultative and collaborative approach to meet its outcomes and objectives by making recommendations to the Managing Director. Ten meetings are held each year.
Elected OSH Representatives – provide advice and support for workplace safety concerns. Representation covers every work area, including the regional campuses.
Regular Workplace Inspections – Conducted in conjunction with the elected OSH Representative and nominated Supervisor to identify hazards and ensure compliance.
Accident/Incident/Near Miss/Hazard Reporting – available to all staff, students, visitors and contractors. Each report is investigated by a management and OSH Representative; then tabled at the OSH Committee meetings where outcomes are ratified and communicated.
OSH Working Groups – formed when necessary to research, examine and recommend new systems and procedures.
OSH Training – a range of training opportunities are provided for staff throughout the year.
Statement of compliance with injury management requirements of the Workers’ Compensation and Injury Management Act 1981 The Institute is committed to injury management support to all workers who sustain a work related injury or illness, including a safe return to meaningful work.
The Policy for Injury Management and Workers Compensation is supported by an injury management system that provides guidelines and aims to assist the injured worker to: return to the same position, or modified position/role, deploy to another position within the organisation where unable to return to the same position, re-train for a position within another organisation.
Injury management continues until a full return to work has been achieved or is no longer a realistic goal, guided by a return to work plan developed in consultation with the injured employee, the treating medical practitioner, the Institute, the insurer and a vocational rehabilitation service provider.
2016 Final Report 15
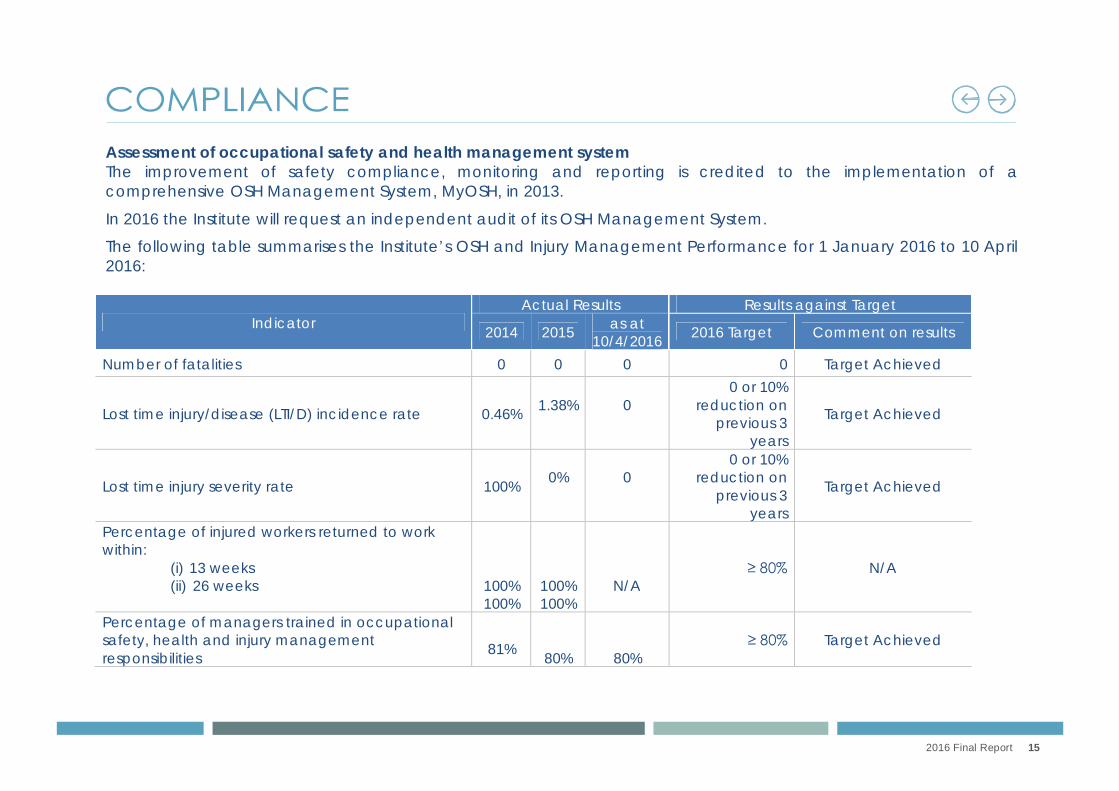
Assessment of occupational safety and health management system The improvement of safety compliance, monitoring and reporting is credited to the implementation of a comprehensive OSH Management System, MyOSH, in 2013.
In 2016 the Institute will request an independent audit of its OSH Management System.
The following table summarises the Institute’s OSH and Injury Management Performance for 1 January 2016 to 10 April 2016:
Indicator Actual Results Results against Target
2014 2015 as at 10/4/2016 2016 Target Comment on results
Number of fatalities 0 0 0 0 Target Achieved
Lost time injury/disease (LTI/D) incidence rate 0.46%
1.38%
0
0 or 10% reduction on
previous 3 years
Target Achieved
Lost time injury severity rate 100%
0%
0
0 or 10% reduction on
previous 3 years
Target Achieved
Percentage of injured workers returned to work within:
(i) 13 weeks (ii) 26 weeks 100%
100%
100% 100%
N/A ≥ 80% N/A
Percentage of managers trained in occupational safety, health and injury management responsibilities
81%
80%
80% ≥ 80% Target Achieved
2016 Final Report 16
Durack Institute of Technology is is established under section 35 of the Vocational Education and Training Act 1996. Section 37 of the Vocational Education and Training Act 1996 outlines the functions of a college. (1) The functions of a college are as follows —
(a) to provide vocational education and training; (ba) to tender for and enter into contracts for the provision by it of vocational education and training; (bb) to provide vocational education and training on a fee for service basis; (b) to confer awards and, if it is a registered training provider and, under the terms of its registration as such,
authorised to do so — (i) approved VET qualifications; and (ii) prescribed VET qualifications; (ca) to provide, for a fee or otherwise, or enter into contracts to provide, products, consultancy or other services
in the course of, or incidental to, the provision by the college of vocational education and training; (c) to undertake research and development related to vocational education and training which has a direct
practical application to industry, commerce and the community; (da) to turn to account the vocational education and training expertise of the college by means of the sale of
services and the commercial exploitation of intellectual property, including the assignment and licensing of such property;
(d) to promote equality of opportunity in the undertaking of vocational education and training; (ea) to provide adult and community education; (e) to provide or arrange for the provision of services to its students; (fa) to provide housing for its staff, and residential accommodation for its students; (fb) with the approval of the Minister, to establish and maintain branches of the college at such places in the
State as its governing council thinks fit; (f) with the approval of the Minister, on terms and conditions approved by the Treasurer, to participate in
business arrangements relating to the provision of vocational education and training;

2016 Final Report 17
(g) to contribute to the general development of the community in the region of the college through such
activities as may be authorised by the Minister; (h) to provide education on behalf of another educational institution; (i) to perform any function prescribed.
(2) A college must perform its functions in accordance with its strategic plan last approved under section 43 and its business plan last approved under section 44A. (3) A college is not to hold land or any estate or interest in land, but this subsection does not apply to the holding of land or an estate or interest in land that is part of a business arrangement in which the college participates under subsection (1)(f). (4) The power conferred by subsection (1)(f) is not subject to, and may be exercised despite, the State Supply Commission Act 1991.
2016 Final Report 18
On the 11th April 2016, operations, staff and students of Durack Institute of Technology will transition to Central Regional TAFE, as part of the Western Australian Training Sector Reform Project. For 2016, prior to the transition, Durack Institute of Technology had 214 staff across 6 campuses. As this data represents only part of the year, it is not comparable to previous years. As at 10 April 2016 there were 167 of courses offered across the campuses. As this report is not for a full calendar year, it is not practical or meaningful to provide student and enrolment data for this period and full year student enrolment data will be reported on the in the Annual Report for Central Regional TAFE.


DURACK INSTITUTE OF TECHNOLOGY
FINANCIAL STATEMENTS
FOR THE
PERIOD 1 JANUARY TO 10 APRIL 2016

STATEMENT OF COMPREHENSIVE INCOME 1 January - 10 Year ended 31
FOR THE PERIOD 1 JANUARY TO 10 APRIL 2016 April 2016 December 2015
Notes $ $
COST OF SERVICES
Expenses
Employee benefits expense 6 5,439,561 20,926,015
Supplies and services 7 1,868,259 11,934,699
Depreciation and amortisation expense 8 593,170 1,655,138
Grants and subsidies 9 12,379 52,850
Cost of sales 14 77,528 276,729
Loss on disposal of non-current assets 18 3,421 13,240
Other expenses 10 581,842 2,678,616
Total cost of services 8,576,160 37,537,287
Income
Revenue
Fee for service 11 45,724 1,507,216
Student fees and charges 12 906,514 4,270,850
Ancillary trading 13 42,803 239,783
Sales 14 110,290 410,786
Commonwealth grants and contributions 15 15,962 101,889
Interest revenue 16 37,874 255,016
Other revenue 17 147,847 435,577
Total revenue 1,307,014 7,221,117
Total income other than income from State Government 1,307,014 7,221,117
NET COST OF SERVICES 7,269,146 30,316,170
INCOME FROM STATE GOVERNMENT 19Service appropriation 6,427,696 25,273,553
Services received free of charge 181,538 829,993
Total income from State Government 6,609,234 26,103,546
(659,912) (4,212,624)
OTHER COMPREHENSIVE INCOME
Changes in asset revaluation surplus 30 540,642 (2,950,770)
Total other comprehensive income 540,642 (2,950,770)
TOTAL COMPREHENSIVE INCOME/(DEFICIT) FOR THE PERIOD (119,270) (7,163,394)
The Statement of Comprehensive Income should be read in conjunction with the accompanying notes.
Durack Institute of Technology
SURPLUS/(DEFICIT) FOR THE PERIOD
Durack Institute of Technology
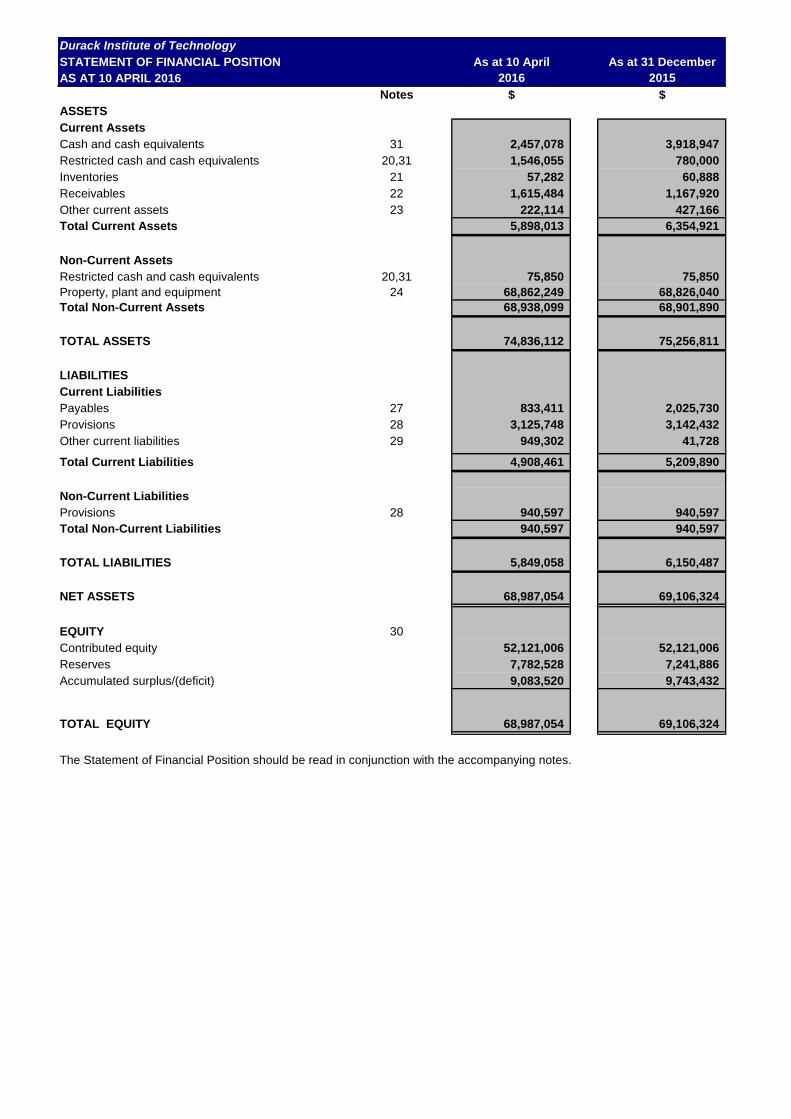
STATEMENT OF FINANCIAL POSITION As at 10 April As at 31 December
AS AT 10 APRIL 2016 2016 2015
Notes $ $
ASSETS
Current Assets
Cash and cash equivalents 31 2,457,078 3,918,947
Restricted cash and cash equivalents 20,31 1,546,055 780,000
Inventories 21 57,282 60,888
Receivables 22 1,615,484 1,167,920
Other current assets 23 222,114 427,166
Total Current Assets 5,898,013 6,354,921
Non-Current Assets
Restricted cash and cash equivalents 20,31 75,850 75,850
Property, plant and equipment 24 68,862,249 68,826,040
Total Non-Current Assets 68,938,099 68,901,890
TOTAL ASSETS 74,836,112 75,256,811
LIABILITIES
Current Liabilities
Payables 27 833,411 2,025,730
Provisions 28 3,125,748 3,142,432
Other current liabilities 29 949,302 41,728
Total Current Liabilities 4,908,461 5,209,890
Non-Current Liabilities
Provisions 28 940,597 940,597
Total Non-Current Liabilities 940,597 940,597
TOTAL LIABILITIES 5,849,058 6,150,487
NET ASSETS 68,987,054 69,106,324
EQUITY 30Contributed equity 52,121,006 52,121,006
Reserves 7,782,528 7,241,886
Accumulated surplus/(deficit) 9,083,520 9,743,432
TOTAL EQUITY 68,987,054 69,106,324
The Statement of Financial Position should be read in conjunction with the accompanying notes.

Durack Institute of Technology
STATEMENT OF CASH FLOWS 1 January - 10 Year ended 31
FOR THE PERIOD 1 JANUARY TO 10 APRIL 2016 April 2016 December 2015
Notes $ $
CASH FLOWS FROM STATE GOVERNMENT
6,427,696 25,223,553
Net cash provided by State Government 6,427,696 25,223,553
Utilised as follows:
CASH FLOWS FROM OPERATING ACTIVITIES
Payments
Employee benefits (5,367,385) (21,171,882)
Supplies and services (2,650,917) (10,108,161)
Grants and subsidies (12,379) (52,850)
GST payments on purchases (214,265) (1,419,925)
Other payments (752,475) (2,944,935)
Receipts
Fee for service 308,236 2,031,510
Student fees and charges 920,522 4,101,812
Ancillary trading 42,803 239,783
Commonwealth grants and contributions 56,213 79,001
Interest received 37,874 232,643
GST receipts on sales 33,822 260,446
GST receipts from taxation authority 328,550 1,027,252
Other receipts 238,049 825,248
Net cash provided by/(used in) operating activities31 (7,031,352) (26,900,058)
CASH FLOWS FROM INVESTING ACTIVITIES
Payments
Purchase of non-current physical assets (92,158) (1,916,828)
Net cash provided by/(used in) investing activities (92,158) (1,916,828)
Net increase/(decrease) in cash and cash equivalents (695,814) (3,593,333)
Cash and cash equivalents at the begining of period 4,774,797 8,368,130
CASH AND CASH EQUIVALENTS AT THE END OF
PERIOD 31 4,078,983 4,774,797
The Statement of Cash Flows should be read in conjunction with the accompanying notes.
Service appropriation - Department of Training and Workforce Development
Durack Institute Of Technology
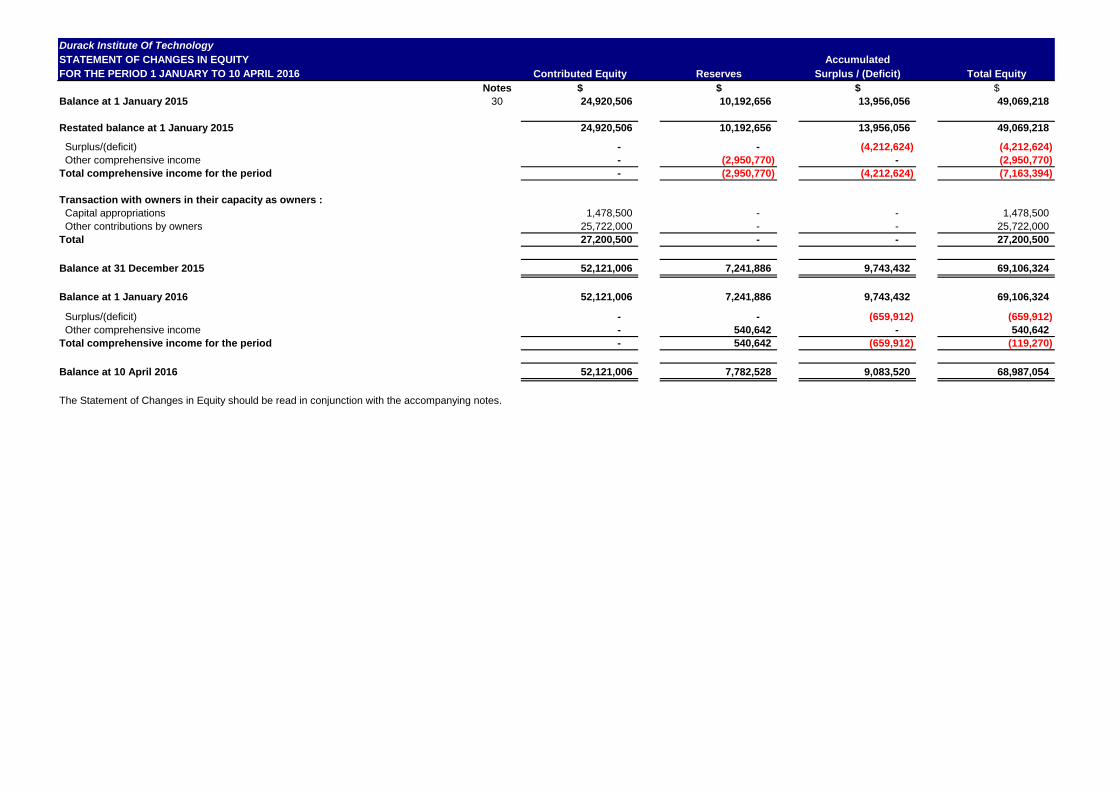
STATEMENT OF CHANGES IN EQUITY Accumulated
FOR THE PERIOD 1 JANUARY TO 10 APRIL 2016 Contributed Equity Reserves Surplus / (Deficit) Total Equity
Notes $ $ $ $Balance at 1 January 2015 30 24,920,506 10,192,656 13,956,056 49,069,218
Restated balance at 1 January 2015 24,920,506 10,192,656 13,956,056 49,069,218
Surplus/(deficit) - - (4,212,624) (4,212,624)
Other comprehensive income - (2,950,770) - (2,950,770)
Total comprehensive income for the period - (2,950,770) (4,212,624) (7,163,394)
Transaction with owners in their capacity as owners :
Capital appropriations 1,478,500 - - 1,478,500 Other contributions by owners 25,722,000 - - 25,722,000 Total 27,200,500 - - 27,200,500
Balance at 31 December 2015 52,121,006 7,241,886 9,743,432 69,106,324
Balance at 1 January 2016 52,121,006 7,241,886 9,743,432 69,106,324
Surplus/(deficit) - - (659,912) (659,912)
Other comprehensive income - 540,642 - 540,642
Total comprehensive income for the period - 540,642 (659,912) (119,270)
Balance at 10 April 2016 52,121,006 7,782,528 9,083,520 68,987,054
The Statement of Changes in Equity should be read in conjunction with the accompanying notes.
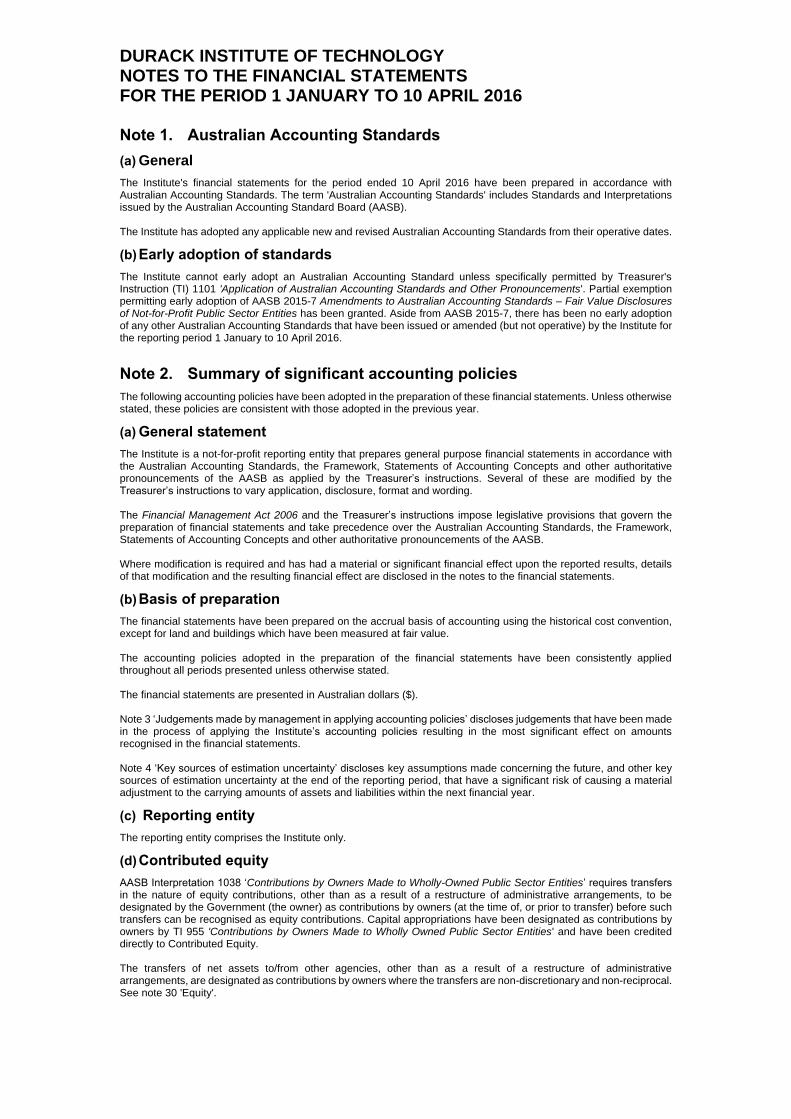
DURACK INSTITUTE OF TECHNOLOGY NOTES TO THE FINANCIAL STATEMENTS FOR THE PERIOD 1 JANUARY TO 10 APRIL 2016
Note 1. Australian Accounting Standards
(a) General
The Institute's financial statements for the period ended 10 April 2016 have been prepared in accordance with Australian Accounting Standards. The term 'Australian Accounting Standards' includes Standards and Interpretations issued by the Australian Accounting Standard Board (AASB). The Institute has adopted any applicable new and revised Australian Accounting Standards from their operative dates.
(b) Early adoption of standards
The Institute cannot early adopt an Australian Accounting Standard unless specifically permitted by Treasurer's Instruction (TI) 1101 'Application of Australian Accounting Standards and Other Pronouncements'. Partial exemption permitting early adoption of AASB 2015-7 Amendments to Australian Accounting Standards – Fair Value Disclosures of Not-for-Profit Public Sector Entities has been granted. Aside from AASB 2015-7, there has been no early adoption of any other Australian Accounting Standards that have been issued or amended (but not operative) by the Institute for the reporting period 1 January to 10 April 2016.
Note 2. Summary of significant accounting policies
The following accounting policies have been adopted in the preparation of these financial statements. Unless otherwise stated, these policies are consistent with those adopted in the previous year.
(a) General statement
The Institute is a not-for-profit reporting entity that prepares general purpose financial statements in accordance with the Australian Accounting Standards, the Framework, Statements of Accounting Concepts and other authoritative pronouncements of the AASB as applied by the Treasurer’s instructions. Several of these are modified by the Treasurer’s instructions to vary application, disclosure, format and wording. The Financial Management Act 2006 and the Treasurer’s instructions impose legislative provisions that govern the preparation of financial statements and take precedence over the Australian Accounting Standards, the Framework, Statements of Accounting Concepts and other authoritative pronouncements of the AASB. Where modification is required and has had a material or significant financial effect upon the reported results, details of that modification and the resulting financial effect are disclosed in the notes to the financial statements.
(b) Basis of preparation
The financial statements have been prepared on the accrual basis of accounting using the historical cost convention, except for land and buildings which have been measured at fair value. The accounting policies adopted in the preparation of the financial statements have been consistently applied throughout all periods presented unless otherwise stated. The financial statements are presented in Australian dollars ($). Note 3 ‘Judgements made by management in applying accounting policies’ discloses judgements that have been made in the process of applying the Institute’s accounting policies resulting in the most significant effect on amounts recognised in the financial statements. Note 4 ‘Key sources of estimation uncertainty’ discloses key assumptions made concerning the future, and other key sources of estimation uncertainty at the end of the reporting period, that have a significant risk of causing a material adjustment to the carrying amounts of assets and liabilities within the next financial year.
(c) Reporting entity
The reporting entity comprises the Institute only.
(d) Contributed equity
AASB Interpretation 1038 ‘Contributions by Owners Made to Wholly-Owned Public Sector Entities’ requires transfers in the nature of equity contributions, other than as a result of a restructure of administrative arrangements, to be designated by the Government (the owner) as contributions by owners (at the time of, or prior to transfer) before such transfers can be recognised as equity contributions. Capital appropriations have been designated as contributions by owners by TI 955 'Contributions by Owners Made to Wholly Owned Public Sector Entities' and have been credited directly to Contributed Equity. The transfers of net assets to/from other agencies, other than as a result of a restructure of administrative arrangements, are designated as contributions by owners where the transfers are non-discretionary and non-reciprocal. See note 30 'Equity'.
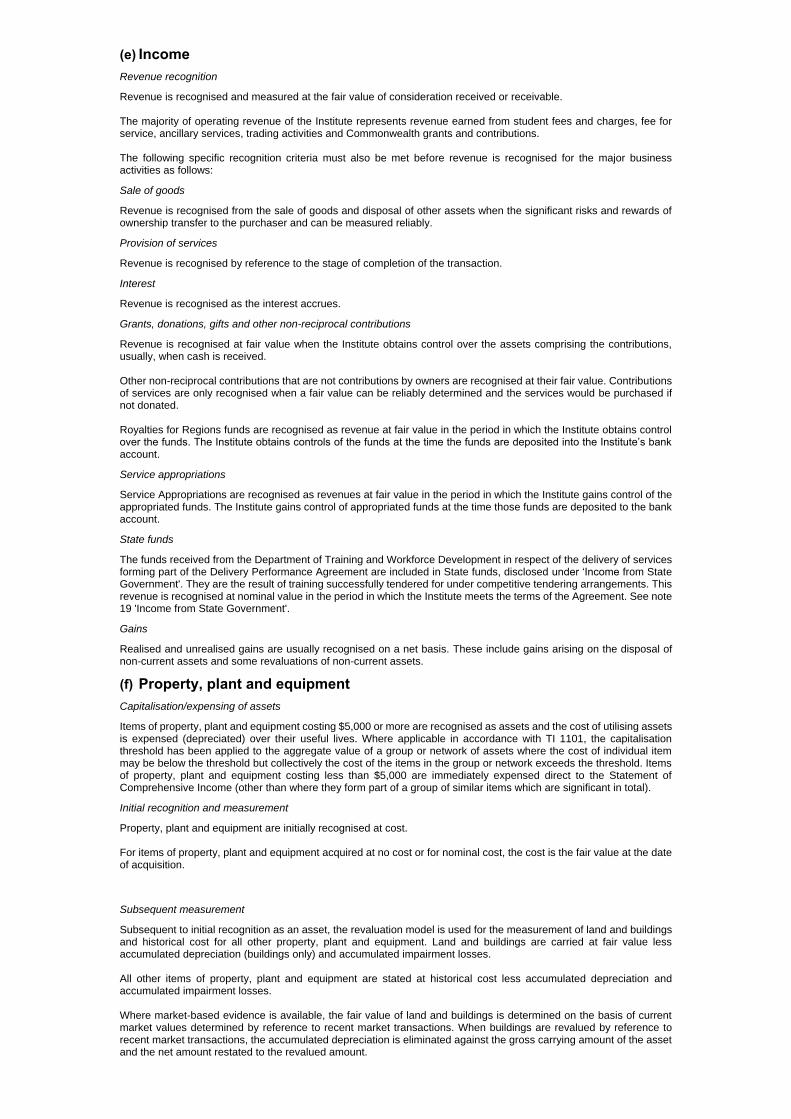
(e) Income
Revenue recognition
Revenue is recognised and measured at the fair value of consideration received or receivable. The majority of operating revenue of the Institute represents revenue earned from student fees and charges, fee for service, ancillary services, trading activities and Commonwealth grants and contributions. The following specific recognition criteria must also be met before revenue is recognised for the major business activities as follows:
Sale of goods
Revenue is recognised from the sale of goods and disposal of other assets when the significant risks and rewards of ownership transfer to the purchaser and can be measured reliably.
Provision of services
Revenue is recognised by reference to the stage of completion of the transaction.
Interest
Revenue is recognised as the interest accrues.
Grants, donations, gifts and other non-reciprocal contributions
Revenue is recognised at fair value when the Institute obtains control over the assets comprising the contributions, usually, when cash is received. Other non-reciprocal contributions that are not contributions by owners are recognised at their fair value. Contributions of services are only recognised when a fair value can be reliably determined and the services would be purchased if not donated. Royalties for Regions funds are recognised as revenue at fair value in the period in which the Institute obtains control over the funds. The Institute obtains controls of the funds at the time the funds are deposited into the Institute’s bank account.
Service appropriations
Service Appropriations are recognised as revenues at fair value in the period in which the Institute gains control of the appropriated funds. The Institute gains control of appropriated funds at the time those funds are deposited to the bank account.
State funds
The funds received from the Department of Training and Workforce Development in respect of the delivery of services forming part of the Delivery Performance Agreement are included in State funds, disclosed under ‘Income from State Government'. They are the result of training successfully tendered for under competitive tendering arrangements. This revenue is recognised at nominal value in the period in which the Institute meets the terms of the Agreement. See note 19 'Income from State Government'.
Gains
Realised and unrealised gains are usually recognised on a net basis. These include gains arising on the disposal of non-current assets and some revaluations of non-current assets.
(f) Property, plant and equipment
Capitalisation/expensing of assets
Items of property, plant and equipment costing $5,000 or more are recognised as assets and the cost of utilising assets is expensed (depreciated) over their useful lives. Where applicable in accordance with TI 1101, the capitalisation threshold has been applied to the aggregate value of a group or network of assets where the cost of individual item may be below the threshold but collectively the cost of the items in the group or network exceeds the threshold. Items of property, plant and equipment costing less than $5,000 are immediately expensed direct to the Statement of Comprehensive Income (other than where they form part of a group of similar items which are significant in total).
Initial recognition and measurement
Property, plant and equipment are initially recognised at cost. For items of property, plant and equipment acquired at no cost or for nominal cost, the cost is the fair value at the date of acquisition.
Subsequent measurement
Subsequent to initial recognition as an asset, the revaluation model is used for the measurement of land and buildings and historical cost for all other property, plant and equipment. Land and buildings are carried at fair value less accumulated depreciation (buildings only) and accumulated impairment losses. All other items of property, plant and equipment are stated at historical cost less accumulated depreciation and accumulated impairment losses. Where market-based evidence is available, the fair value of land and buildings is determined on the basis of current market values determined by reference to recent market transactions. When buildings are revalued by reference to recent market transactions, the accumulated depreciation is eliminated against the gross carrying amount of the asset and the net amount restated to the revalued amount.
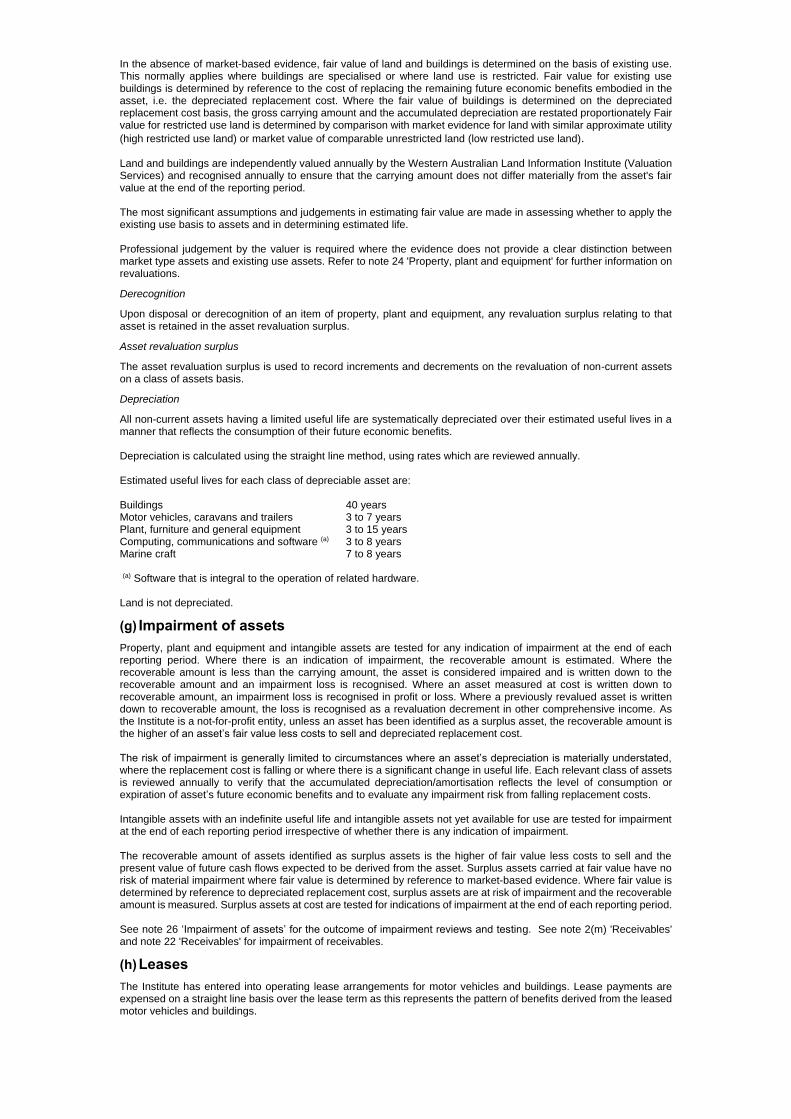
In the absence of market-based evidence, fair value of land and buildings is determined on the basis of existing use. This normally applies where buildings are specialised or where land use is restricted. Fair value for existing use buildings is determined by reference to the cost of replacing the remaining future economic benefits embodied in the asset, i.e. the depreciated replacement cost. Where the fair value of buildings is determined on the depreciated replacement cost basis, the gross carrying amount and the accumulated depreciation are restated proportionately Fair value for restricted use land is determined by comparison with market evidence for land with similar approximate utility (high restricted use land) or market value of comparable unrestricted land (low restricted use land). Land and buildings are independently valued annually by the Western Australian Land Information Institute (Valuation Services) and recognised annually to ensure that the carrying amount does not differ materially from the asset's fair value at the end of the reporting period. The most significant assumptions and judgements in estimating fair value are made in assessing whether to apply the existing use basis to assets and in determining estimated life. Professional judgement by the valuer is required where the evidence does not provide a clear distinction between market type assets and existing use assets. Refer to note 24 'Property, plant and equipment' for further information on revaluations.
Derecognition
Upon disposal or derecognition of an item of property, plant and equipment, any revaluation surplus relating to that asset is retained in the asset revaluation surplus.
Asset revaluation surplus
The asset revaluation surplus is used to record increments and decrements on the revaluation of non-current assets on a class of assets basis.
Depreciation
All non-current assets having a limited useful life are systematically depreciated over their estimated useful lives in a manner that reflects the consumption of their future economic benefits. Depreciation is calculated using the straight line method, using rates which are reviewed annually. Estimated useful lives for each class of depreciable asset are: Buildings 40 years Motor vehicles, caravans and trailers 3 to 7 years Plant, furniture and general equipment 3 to 15 years Computing, communications and software (a) 3 to 8 years Marine craft 7 to 8 years (a) Software that is integral to the operation of related hardware. Land is not depreciated.
(g) Impairment of assets
Property, plant and equipment and intangible assets are tested for any indication of impairment at the end of each reporting period. Where there is an indication of impairment, the recoverable amount is estimated. Where the recoverable amount is less than the carrying amount, the asset is considered impaired and is written down to the recoverable amount and an impairment loss is recognised. Where an asset measured at cost is written down to recoverable amount, an impairment loss is recognised in profit or loss. Where a previously revalued asset is written down to recoverable amount, the loss is recognised as a revaluation decrement in other comprehensive income. As the Institute is a not-for-profit entity, unless an asset has been identified as a surplus asset, the recoverable amount is the higher of an asset’s fair value less costs to sell and depreciated replacement cost. The risk of impairment is generally limited to circumstances where an asset’s depreciation is materially understated, where the replacement cost is falling or where there is a significant change in useful life. Each relevant class of assets is reviewed annually to verify that the accumulated depreciation/amortisation reflects the level of consumption or expiration of asset’s future economic benefits and to evaluate any impairment risk from falling replacement costs. Intangible assets with an indefinite useful life and intangible assets not yet available for use are tested for impairment at the end of each reporting period irrespective of whether there is any indication of impairment. The recoverable amount of assets identified as surplus assets is the higher of fair value less costs to sell and the present value of future cash flows expected to be derived from the asset. Surplus assets carried at fair value have no risk of material impairment where fair value is determined by reference to market-based evidence. Where fair value is determined by reference to depreciated replacement cost, surplus assets are at risk of impairment and the recoverable amount is measured. Surplus assets at cost are tested for indications of impairment at the end of each reporting period. See note 26 ‘Impairment of assets’ for the outcome of impairment reviews and testing. See note 2(m) 'Receivables' and note 22 'Receivables' for impairment of receivables.
(h) Leases
The Institute has entered into operating lease arrangements for motor vehicles and buildings. Lease payments are expensed on a straight line basis over the lease term as this represents the pattern of benefits derived from the leased motor vehicles and buildings.
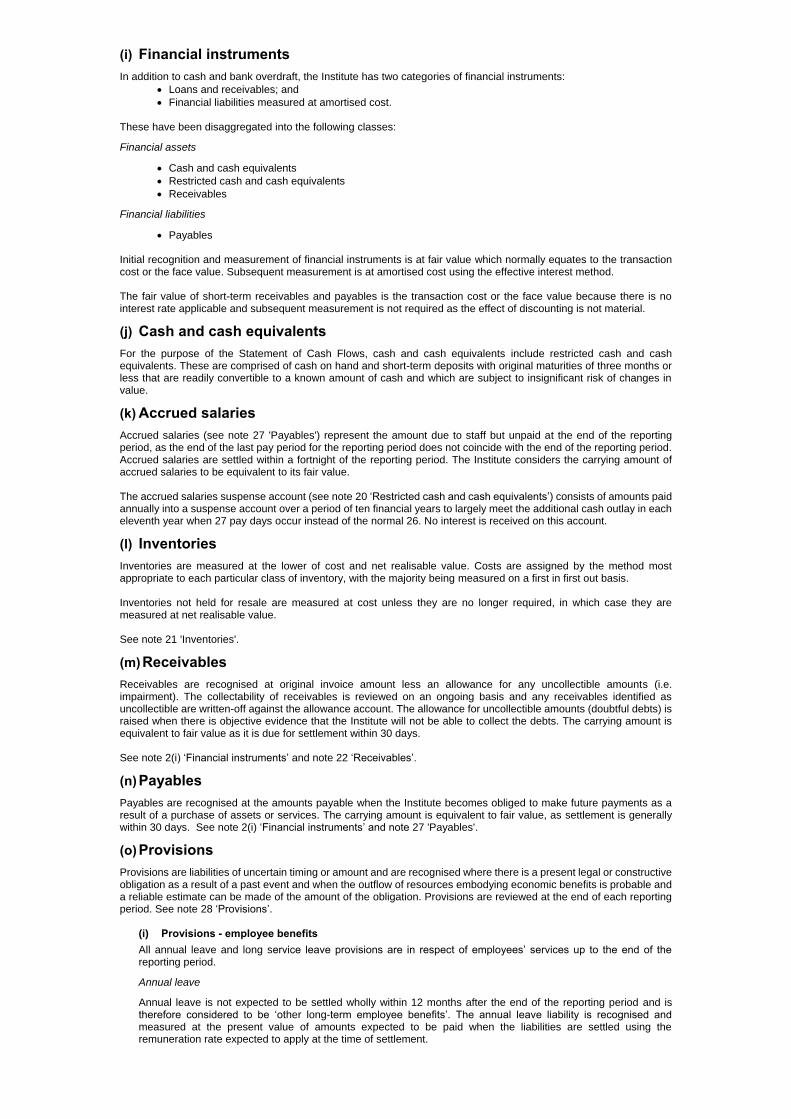
(i) Financial instruments
In addition to cash and bank overdraft, the Institute has two categories of financial instruments: Loans and receivables; and Financial liabilities measured at amortised cost.
These have been disaggregated into the following classes:
Financial assets
Cash and cash equivalents Restricted cash and cash equivalents Receivables
Financial liabilities
Payables Initial recognition and measurement of financial instruments is at fair value which normally equates to the transaction cost or the face value. Subsequent measurement is at amortised cost using the effective interest method. The fair value of short-term receivables and payables is the transaction cost or the face value because there is no interest rate applicable and subsequent measurement is not required as the effect of discounting is not material.
(j) Cash and cash equivalents
For the purpose of the Statement of Cash Flows, cash and cash equivalents include restricted cash and cash equivalents. These are comprised of cash on hand and short-term deposits with original maturities of three months or less that are readily convertible to a known amount of cash and which are subject to insignificant risk of changes in value.
(k) Accrued salaries
Accrued salaries (see note 27 'Payables') represent the amount due to staff but unpaid at the end of the reporting period, as the end of the last pay period for the reporting period does not coincide with the end of the reporting period. Accrued salaries are settled within a fortnight of the reporting period. The Institute considers the carrying amount of accrued salaries to be equivalent to its fair value. The accrued salaries suspense account (see note 20 ‘Restricted cash and cash equivalents’) consists of amounts paid annually into a suspense account over a period of ten financial years to largely meet the additional cash outlay in each eleventh year when 27 pay days occur instead of the normal 26. No interest is received on this account.
(l) Inventories
Inventories are measured at the lower of cost and net realisable value. Costs are assigned by the method most appropriate to each particular class of inventory, with the majority being measured on a first in first out basis. Inventories not held for resale are measured at cost unless they are no longer required, in which case they are measured at net realisable value. See note 21 'Inventories'.
(m) Receivables
Receivables are recognised at original invoice amount less an allowance for any uncollectible amounts (i.e. impairment). The collectability of receivables is reviewed on an ongoing basis and any receivables identified as uncollectible are written-off against the allowance account. The allowance for uncollectible amounts (doubtful debts) is raised when there is objective evidence that the Institute will not be able to collect the debts. The carrying amount is equivalent to fair value as it is due for settlement within 30 days. See note 2(i) ‘Financial instruments’ and note 22 ‘Receivables’.
(n) Payables
Payables are recognised at the amounts payable when the Institute becomes obliged to make future payments as a result of a purchase of assets or services. The carrying amount is equivalent to fair value, as settlement is generally within 30 days. See note 2(i) ‘Financial instruments’ and note 27 'Payables'.
(o) Provisions
Provisions are liabilities of uncertain timing or amount and are recognised where there is a present legal or constructive obligation as a result of a past event and when the outflow of resources embodying economic benefits is probable and a reliable estimate can be made of the amount of the obligation. Provisions are reviewed at the end of each reporting period. See note 28 ‘Provisions’.
(i) Provisions - employee benefits
All annual leave and long service leave provisions are in respect of employees’ services up to the end of the reporting period.
Annual leave
Annual leave is not expected to be settled wholly within 12 months after the end of the reporting period and is therefore considered to be ‘other long-term employee benefits’. The annual leave liability is recognised and measured at the present value of amounts expected to be paid when the liabilities are settled using the remuneration rate expected to apply at the time of settlement.
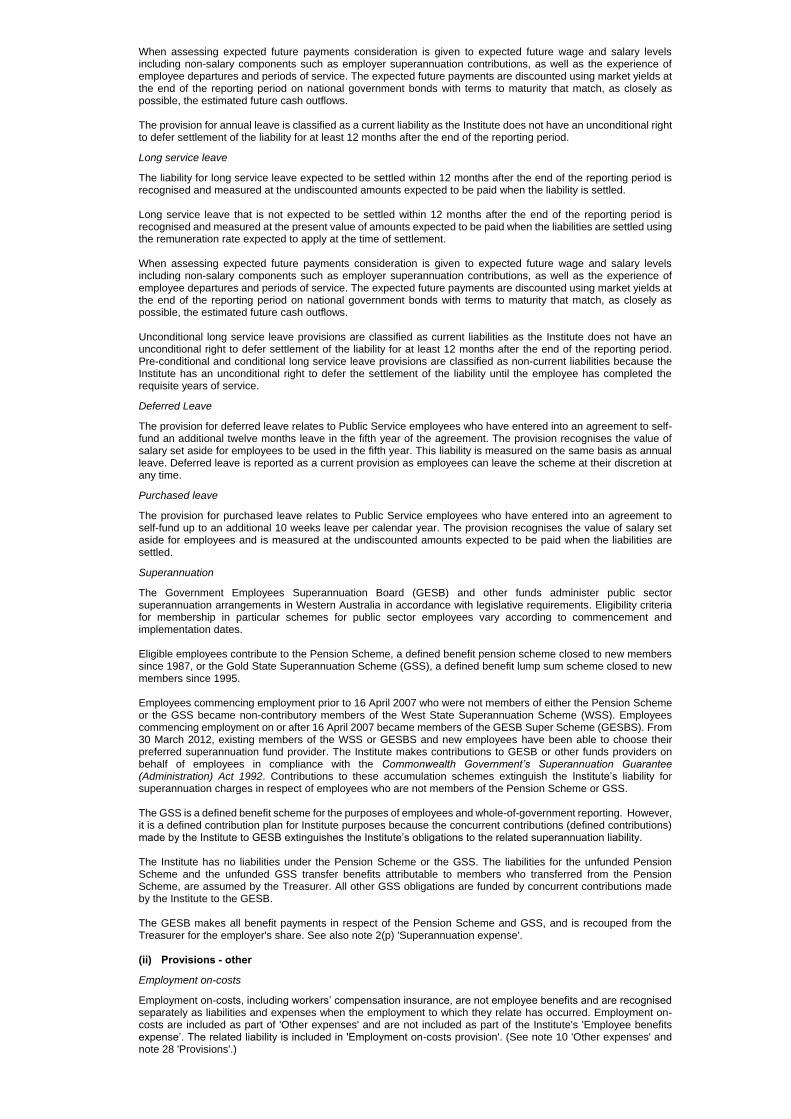
When assessing expected future payments consideration is given to expected future wage and salary levels including non-salary components such as employer superannuation contributions, as well as the experience of employee departures and periods of service. The expected future payments are discounted using market yields at the end of the reporting period on national government bonds with terms to maturity that match, as closely as possible, the estimated future cash outflows. The provision for annual leave is classified as a current liability as the Institute does not have an unconditional right to defer settlement of the liability for at least 12 months after the end of the reporting period.
Long service leave
The liability for long service leave expected to be settled within 12 months after the end of the reporting period is recognised and measured at the undiscounted amounts expected to be paid when the liability is settled. Long service leave that is not expected to be settled within 12 months after the end of the reporting period is recognised and measured at the present value of amounts expected to be paid when the liabilities are settled using the remuneration rate expected to apply at the time of settlement. When assessing expected future payments consideration is given to expected future wage and salary levels including non-salary components such as employer superannuation contributions, as well as the experience of employee departures and periods of service. The expected future payments are discounted using market yields at the end of the reporting period on national government bonds with terms to maturity that match, as closely as possible, the estimated future cash outflows. Unconditional long service leave provisions are classified as current liabilities as the Institute does not have an unconditional right to defer settlement of the liability for at least 12 months after the end of the reporting period. Pre-conditional and conditional long service leave provisions are classified as non-current liabilities because the Institute has an unconditional right to defer the settlement of the liability until the employee has completed the requisite years of service.
Deferred Leave
The provision for deferred leave relates to Public Service employees who have entered into an agreement to self-fund an additional twelve months leave in the fifth year of the agreement. The provision recognises the value of salary set aside for employees to be used in the fifth year. This liability is measured on the same basis as annual leave. Deferred leave is reported as a current provision as employees can leave the scheme at their discretion at any time.
Purchased leave
The provision for purchased leave relates to Public Service employees who have entered into an agreement to self-fund up to an additional 10 weeks leave per calendar year. The provision recognises the value of salary set aside for employees and is measured at the undiscounted amounts expected to be paid when the liabilities are settled.
Superannuation
The Government Employees Superannuation Board (GESB) and other funds administer public sector superannuation arrangements in Western Australia in accordance with legislative requirements. Eligibility criteria for membership in particular schemes for public sector employees vary according to commencement and implementation dates. Eligible employees contribute to the Pension Scheme, a defined benefit pension scheme closed to new members since 1987, or the Gold State Superannuation Scheme (GSS), a defined benefit lump sum scheme closed to new members since 1995. Employees commencing employment prior to 16 April 2007 who were not members of either the Pension Scheme or the GSS became non-contributory members of the West State Superannuation Scheme (WSS). Employees commencing employment on or after 16 April 2007 became members of the GESB Super Scheme (GESBS). From 30 March 2012, existing members of the WSS or GESBS and new employees have been able to choose their preferred superannuation fund provider. The Institute makes contributions to GESB or other funds providers on behalf of employees in compliance with the Commonwealth Government’s Superannuation Guarantee (Administration) Act 1992. Contributions to these accumulation schemes extinguish the Institute’s liability for superannuation charges in respect of employees who are not members of the Pension Scheme or GSS. The GSS is a defined benefit scheme for the purposes of employees and whole-of-government reporting. However, it is a defined contribution plan for Institute purposes because the concurrent contributions (defined contributions) made by the Institute to GESB extinguishes the Institute’s obligations to the related superannuation liability. The Institute has no liabilities under the Pension Scheme or the GSS. The liabilities for the unfunded Pension Scheme and the unfunded GSS transfer benefits attributable to members who transferred from the Pension Scheme, are assumed by the Treasurer. All other GSS obligations are funded by concurrent contributions made by the Institute to the GESB. The GESB makes all benefit payments in respect of the Pension Scheme and GSS, and is recouped from the Treasurer for the employer's share. See also note 2(p) 'Superannuation expense'.
(ii) Provisions - other
Employment on-costs
Employment on-costs, including workers’ compensation insurance, are not employee benefits and are recognised separately as liabilities and expenses when the employment to which they relate has occurred. Employment on-costs are included as part of 'Other expenses' and are not included as part of the Institute's 'Employee benefits expense’. The related liability is included in 'Employment on-costs provision'. (See note 10 'Other expenses' and note 28 'Provisions'.)
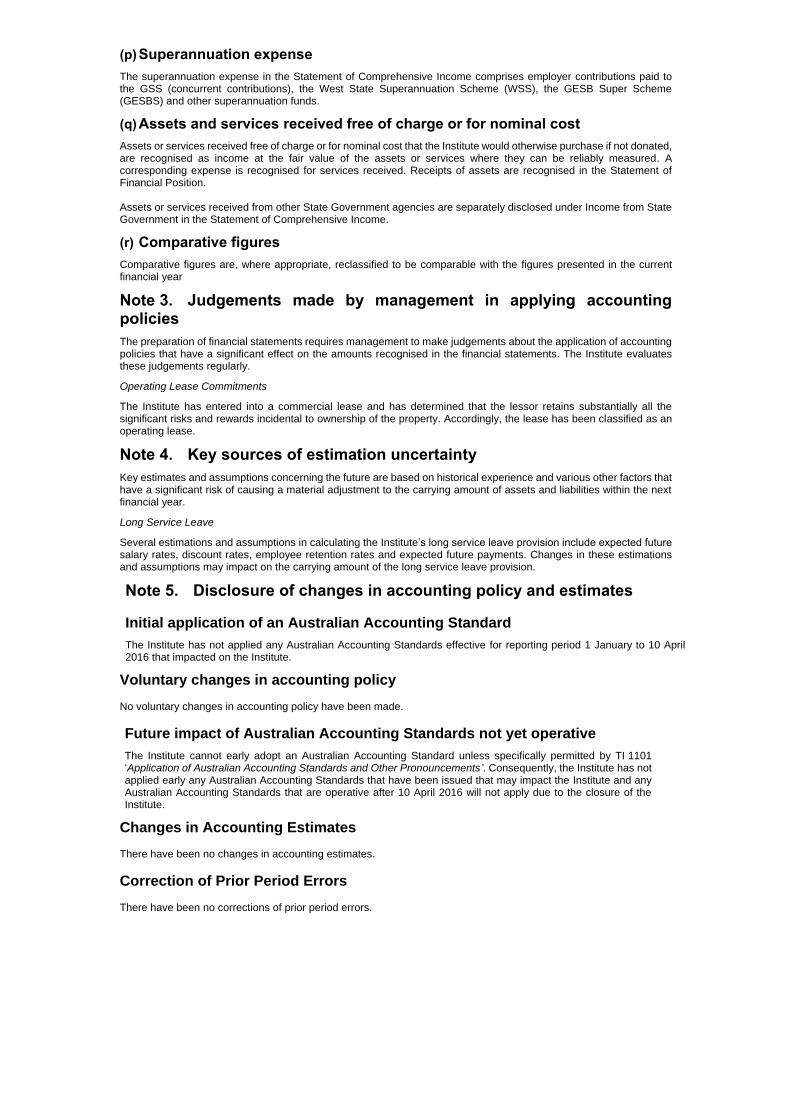
(p) Superannuation expense
The superannuation expense in the Statement of Comprehensive Income comprises employer contributions paid to the GSS (concurrent contributions), the West State Superannuation Scheme (WSS), the GESB Super Scheme (GESBS) and other superannuation funds.
(q) Assets and services received free of charge or for nominal cost
Assets or services received free of charge or for nominal cost that the Institute would otherwise purchase if not donated, are recognised as income at the fair value of the assets or services where they can be reliably measured. A corresponding expense is recognised for services received. Receipts of assets are recognised in the Statement of Financial Position. Assets or services received from other State Government agencies are separately disclosed under Income from State Government in the Statement of Comprehensive Income.
(r) Comparative figures
Comparative figures are, where appropriate, reclassified to be comparable with the figures presented in the current financial year
Note 3. Judgements made by management in applying accounting policies
The preparation of financial statements requires management to make judgements about the application of accounting policies that have a significant effect on the amounts recognised in the financial statements. The Institute evaluates these judgements regularly.
Operating Lease Commitments
The Institute has entered into a commercial lease and has determined that the lessor retains substantially all the significant risks and rewards incidental to ownership of the property. Accordingly, the lease has been classified as an operating lease.
Note 4. Key sources of estimation uncertainty
Key estimates and assumptions concerning the future are based on historical experience and various other factors that have a significant risk of causing a material adjustment to the carrying amount of assets and liabilities within the next financial year.
Long Service Leave
Several estimations and assumptions in calculating the Institute’s long service leave provision include expected future salary rates, discount rates, employee retention rates and expected future payments. Changes in these estimations and assumptions may impact on the carrying amount of the long service leave provision.
Note 5. Disclosure of changes in accounting policy and estimates
Initial application of an Australian Accounting Standard
The Institute has not applied any Australian Accounting Standards effective for reporting period 1 January to 10 April 2016 that impacted on the Institute.
Voluntary changes in accounting policy No voluntary changes in accounting policy have been made.
Future impact of Australian Accounting Standards not yet operative
The Institute cannot early adopt an Australian Accounting Standard unless specifically permitted by TI 1101 ‘Application of Australian Accounting Standards and Other Pronouncements’. Consequently, the Institute has not applied early any Australian Accounting Standards that have been issued that may impact the Institute and any Australian Accounting Standards that are operative after 10 April 2016 will not apply due to the closure of the Institute.
Changes in Accounting Estimates There have been no changes in accounting estimates. Correction of Prior Period Errors There have been no corrections of prior period errors.
Durack Institute of Technology
NOTES TO THE FINANCIAL STATEMENTS 16GLACT &PREV_LDGFOR THE PERIOD 1 JANUARY TO 10 APRIL 2016
2016 2015
$ $
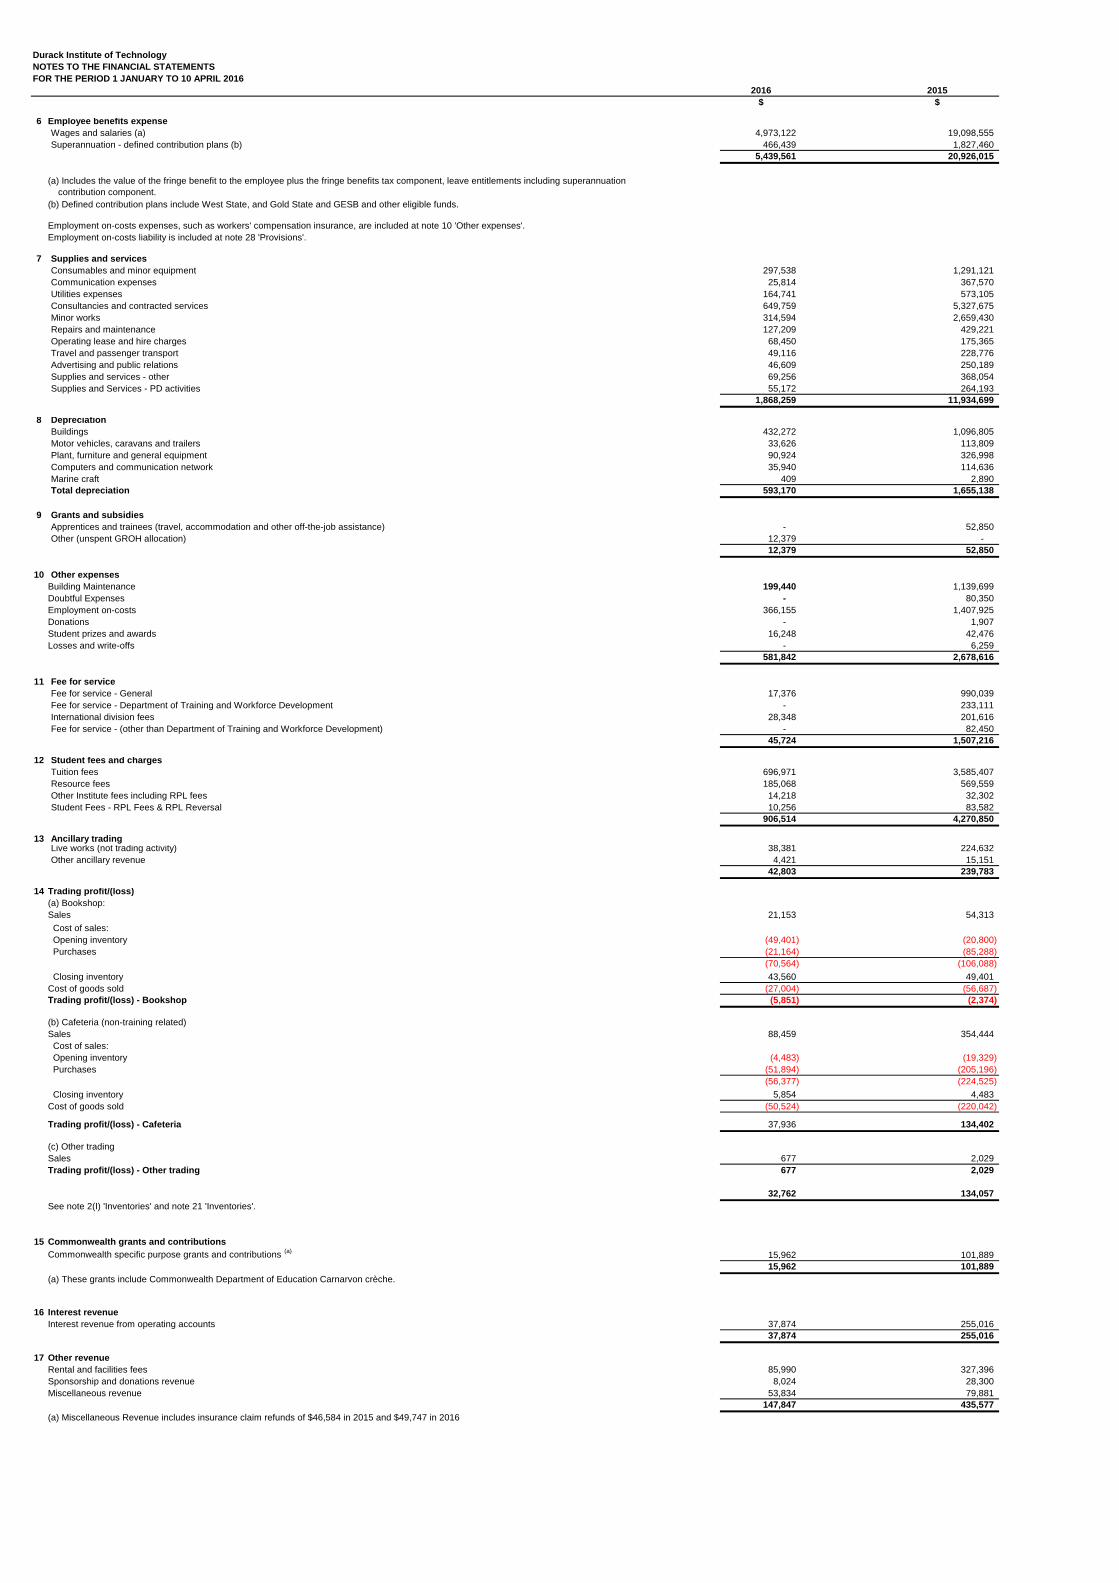
6 Employee benefits expense
Wages and salaries (a) 4,973,122 19,098,555 Superannuation - defined contribution plans (b) 466,439 1,827,460
5,439,561 20,926,015
(a) Includes the value of the fringe benefit to the employee plus the fringe benefits tax component, leave entitlements including superannuation contribution component.(b) Defined contribution plans include West State, and Gold State and GESB and other eligible funds.
Employment on-costs expenses, such as workers' compensation insurance, are included at note 10 'Other expenses'. Employment on-costs liability is included at note 28 'Provisions'.
7 Supplies and services
Consumables and minor equipment 297,538 1,291,121 Communication expenses 25,814 367,570 Utilities expenses 164,741 573,105 Consultancies and contracted services 649,759 5,327,675 Minor works 314,594 2,659,430 Repairs and maintenance 127,209 429,221 Operating lease and hire charges 68,450 175,365 Travel and passenger transport 49,116 228,776 Advertising and public relations 46,609 250,189 Supplies and services - other 69,256 368,054 Supplies and Services - PD activities 55,172 264,193
1,868,259 11,934,699
8 Depreciation
Buildings 432,272 1,096,805 Motor vehicles, caravans and trailers 33,626 113,809 Plant, furniture and general equipment 90,924 326,998 Computers and communication network 35,940 114,636 Marine craft 409 2,890 Total depreciation 593,170 1,655,138
9 Grants and subsidies
Apprentices and trainees (travel, accommodation and other off-the-job assistance) - 52,850 Other (unspent GROH allocation) 12,379 -
12,379 52,850
10 Other expenses
Building Maintenance 199,440 1,139,699 Doubtful Expenses - 80,350 Employment on-costs 366,155 1,407,925 Donations - 1,907 Student prizes and awards 16,248 42,476 Losses and write-offs - 6,259
581,842 2,678,616
11 Fee for service
Fee for service - General 17,376 990,039 Fee for service - Department of Training and Workforce Development - 233,111 International division fees 28,348 201,616 Fee for service - (other than Department of Training and Workforce Development) - 82,450
45,724 1,507,216
12 Student fees and charges
Tuition fees 696,971 3,585,407 Resource fees 185,068 569,559 Other Institute fees including RPL fees 14,218 32,302 Student Fees - RPL Fees & RPL Reversal 10,256 83,582
906,514 4,270,850
13 Ancillary tradingLive works (not trading activity) 38,381 224,632 Other ancillary revenue 4,421 15,151
42,803 239,783
14 Trading profit/(loss)
(a) Bookshop: Sales 21,153 54,313 Cost of sales: Opening inventory (49,401) (20,800) Purchases (21,164) (85,288)
(70,564) (106,088) Closing inventory 43,560 49,401 Cost of goods sold (27,004) (56,687) Trading profit/(loss) - Bookshop (5,851) (2,374)
(b) Cafeteria (non-training related)Sales 88,459 354,444 Cost of sales: Opening inventory (4,483) (19,329) Purchases (51,894) (205,196)
(56,377) (224,525) Closing inventory 5,854 4,483 Cost of goods sold (50,524) (220,042)
Trading profit/(loss) - Cafeteria 37,936 134,402
(c) Other tradingSales 677 2,029 Trading profit/(loss) - Other trading 677 2,029
32,762 134,057
See note 2(I) 'Inventories' and note 21 'Inventories'.
15 Commonwealth grants and contributions
Commonwealth specific purpose grants and contributions (a) 15,962 101,889 15,962 101,889
16 Interest revenue
Interest revenue from operating accounts 37,874 255,016 37,874 255,016
17 Other revenue
Rental and facilities fees 85,990 327,396 Sponsorship and donations revenue 8,024 28,300 Miscellaneous revenue 53,834 79,881
147,847 435,577
(a) Miscellaneous Revenue includes insurance claim refunds of $46,584 in 2015 and $49,747 in 2016
(a) These grants include Commonwealth Department of Education Carnarvon crèche.

Durack Institute of Technology
NOTES TO THE FINANCIAL STATEMENTS 16GLACT &PREV_LDGFOR THE PERIOD 1 JANUARY TO 10 APRIL 2016
2016 2015
$ $18 Net gain/(loss) on disposal of non-current assets
Net proceeds from disposal of non-current assetsMotor vehicles, caravans and trailers - - Total proceeds from disposal of non-current assets - -
Carrying amount of non-current assets disposedPlant, furniture and general equipment (3,421) (13,240) Total cost of disposal of non-current assets (3,421) (13,240)
Net gain/(loss) (3,421) (13,240)
See note 24 ‘Property, plant and equipment’.
19 Income from State Government
Appropriation received during the year:
Delivery and Performance Agreement (DPA) 6,425,953 25,213,673 Other recurrent funds 1,743 59,880 Total State funds 6,427,696 25,273,553
Services received free of charge from other State government agencies duringthe financial period :
Department of Training and Workforce Development- Corporate systems support 150,872 721,901 - Marketing and publications 4,794 11,924 - Human resources, and industrial relations support 2,220 24,584 - Other 23,652 71,584
181,538 829,993
Total income from State Government 6,609,234 26,103,546
(a) Service appropriations fund the net cost of services delivered.
20 Restricted cash and cash equivalents
CurrentDepartment of Training and Workforce Development - student interactive hub capital works project 780,000 780,000 Scholarships (a) 75,680 - Existing worker trainees (a) 31,163 - Abrolhos Islands Revegetation Project (a) 432,847 - Tilapia Control Project (a) 185,589 - Carnarvon Crèche (a) 40,776 -
1,546,055 780,000 Non-currentAccrued salaries suspense account (27th Pay provision) 75,850 75,850
75,850 75,850
(a) These funds have been restricted in 2016 as a result of unspent external funds earnt and recognisedin the prior year. There is an expectation that these funds would be spent by the end of 2016; howeverdue to the closure of Durack Institute of Technology, have been included as restricted cash as at 10 April 2016.
21 Inventories
CurrentInventories not held for resale:
Other (at cost) 7,869 7,004 7,869 7,004
Inventories held for resale:Bookshop (at cost) 43,560 49,401 Cafeteria (at cost) 5,854 4,483
49,414 53,884
Total 57,282 60,888
See also note 2(o) 'Inventories' and note 14 'Trading profit/(loss)'.
22 Receivables
CurrentReceivables - trade 335,203 535,559 Receivables - students 929,533 340,850 Accrued revenue 424,828 200,439 Allowance for impairment of receivables (137,656) (137,656) GST receivable 63,576 228,728
1,615,484 1,167,920 Total current 1,615,484 1,167,920
Reconciliation of changes in the allowance for impairment of receivables:Balance at start of period (137,656) (97,074) Doubtful debts expense - (80,350) Amount written off during the period - 39,768 Balance at end of period (137,656) (137,656)
The Institute does not hold any collateral or other credit enhancements as security for receivables.
See also note 2(m) 'Receivables' and note 36 'Financial instruments'.
23 Other assets
CurrentPrepayments 221,864 419,572 Other current assets (a) 250 7,594 Total current 222,114 427,166
(a) other current asset - purchasing card disputed transactions $50 and payment of bonds $200.
24 Property, plant and equipment
LandAt fair value (a) 5,550,000 5,550,000
5,550,000 5,550,000 BuildingsAt fair value (a) 61,979,642 61,439,000 Accumulated depreciation (432,272) -
61,547,370 61,439,000 Motor vehicles, caravans and trailers At cost 1,139,652 1,139,653 Accumulated depreciation (754,014) (720,388)
385,638 419,265 Plant, furniture and general equipmentAt cost 3,748,290 3,678,332 Accumulated depreciation (2,635,251) (2,563,106)
1,113,040 1,115,226 Computer equipment, communication networkAt cost 855,538 865,967 Accumulated depreciation (597,100) (571,590)
258,438 294,377 Marine craftAt cost 1,689,916 1,689,916 Accumulated depreciation (1,682,153) (1,681,744)
7,763 8,172
68,862,249 68,826,040
(a) Land and buildings were revalued as at 1 July 2015 by the Western Australian Land Information Authority (Valuation Services). The valuations were performed during the year ended 31 December 2015 and recognised at 31 December 2015. In undertaking the revaluation, fair value of buildings was determined on the basis of depreciated replacement cost and fair value of land was determined on the basis of comparison with market evidence for land with low level utility (high restricted use land). See note 2(f) 'Property, plant and equipment'.
Service appropriation (a) (State funds received from Department of Training and Workforce Development):

Durack Institute of Technology
NOTES TO THE FINANCIAL STATEMENTS 16GLACT &PREV_LDGFOR THE PERIOD 1 JANUARY TO 10 APRIL 2016
2016 2015
$ $
Information on fair value measurements is provided in Note 25.
Reconciliations of the carrying amounts of property, plant and equipment at the beginning and end of the reporting period are set out in the table below.
Land Buildings
Motor vehicles, caravans and
trailers Plant, furniture and
general equipment
Computer equipment,
communication network Marine craft Total
2016 $ $ $ $ $ $ $
Carrying amount at start of year 5,550,000 61,439,000 419,265 1,115,226 294,377 8,172 68,826,040 Additions - - - 92,158 - - 92,158 Transfers - - - - - - - Other Disposals - - - (3,421) - - (3,421) Revaluation increments/(decrements) ( c) - 540,642 - - - - 540,642
Depreciation - (432,272) (33,626) (90,924) (35,940) (409) (593,170) Carrying amount at end of
period 5,550,000 61,547,370 385,639.00 1,113,040.00 258,438.00 7,763 68,862,249
Land Buildings
Motor vehicles, caravans and
trailers Plant, furniture and
general equipment
Computer equipment,
communication network Marine craft Total
2015 $ $ $ $ $ $ $
Carrying amount at start of year 5,550,000 37,083,000 295,777 1,188,074 273,211 11,062 44,401,124 Additions (a) - 1,203,075 237,297 267,390 135,802 - 1,843,564 Transfers (b) - 27,200,500 - - - - 27,200,500 Other Disposals - - - (13,240) - - (13,240) Revaluation increments/(decrements) - (2,950,770) - - - - (2,950,770) Depreciation - (1,096,805) (113,809) (326,998) (114,636) (2,890) (1,655,138) Carrying amount at end of
period 5,550,000 61,439,000 419,265 1,115,226 294,377 8,172 68,826,040
(a) Institute funds $1,203,075 for the Centre for Health Industries and Training and Workforce Development, Centre for Resource Sector Workforce Training and Batavia Coast Maritime Institute remediation works.
(b) Department of Training and Workforce Development capital transferred buildings for capital works and building remediation work; 2015 Centre for Health Industries and Training and Workforce Development, Centre for Resource Sector Workforce Training, Batavia Coast Maritime Institute remediation works $27,200,500. See contributed equity note 30.
(c) Accounting entry to recognise prior period building improvement in current year valuation.
Information on fair value measurements is provided in Note 25.
25 Fair value measurements
Assets measured at fair value : Level 1 Level 2 Level 3 Fair Value
At end of period
2016 $ $ $ $
Land (Note 24) - - 5,550,000 5,550,000 Buildings (Note 24) - - 61,547,370 61,547,370
- - 67,097,370 67,097,370
Assets measured at fair value : Level 1 Level 2 Level 3 Fair Value
At end of period
2015 $ $ $ $
Land (Note 24) - - 5,550,000 5,550,000 Buildings (Note 24) - - 61,439,000 61,439,000
- - 66,989,000 66,989,000
There were no transfers between Levels 1, 2 or 3 during the period.
Fair value measurements using significant unobservable inputs (Level 3)
2016 Land Buildings
$ $
Fair Value at start of period 5,550,000 61,439,000 Additions - - Revaluation increments/(decrements) recognised in Profit or Loss - 540,642 Depreciation Expense - (432,272) Fair Value at end of period 5,550,000 61,547,370
2015 Land Buildings
$ $
Fair Value at start of period 5,550,000 37,083,000 Additions - 28,403,575 Revaluation increments/(decrements) recognised in Other Comprehensive Income - (2,950,770) Depreciation Expense - (1,096,805)
Fair Value at end of period 5,550,000 61,439,000
Valuation processes
There were no changes in valuation techniques during the period.
Transfers in and out of a fair value level are recognised on the date of the event or change in circumstances that caused the transfer. Transfers aregenerally limited to assets newly classified as non-current assets held for sale as Treasurer's instructions require valuations of land and buildingsto be categorised within Level 3 where the valuations utilise significant Level 3 inputs on a recurring basis.
Fair value for existing use specialised building is determined by reference to the cost of replacing the remaining future economic benefits embodiedin the asset, i.e. the depreciated replacement cost. Depreciated replacement cost is the current replacement cost of an asset less accumulateddepreciation calculated on the basis of such cost to reflect the already consumed economic benefit, expired economic benefit or obsolescence, and optimisation (where applicable) of the asset. Determination of the current replacement cost of such assets held by the Institute is calculated by reference to gross project size specifications.
Fair value for restricted use land is based on comparison with market evidence for land with low level utility (high restricted use land). Fair value for restricted use land is based on market value, by either using market evidence of sales of comparable land that is unrestricted less restoration costs to return the site to a vacant and marketable condition (low restricted use land), or, comparison with market evidence for land with low level utility (highrestricted use land).
Information about significant unobservable inputs (Level 3) in fair value measurements
Description Fair Value
2016
$000
Fair Value
2015
$000
Valuation
Technique(s)
Unobservable inputs
Land 5,550 5,550 Market approach Market approach
Buildings 61,547 61,439 Depreciated Replacement
Depreciated replacement cost
Reconciliations of the opening and closing balances are provided in Notes 24.
Basis of Valuation
In the absence of market-based evidence due to the specialised nature of the assets, non-financial assets are valued at Level 3 of the fair value hierarchy on an existinguse basis. The existing use basis recognises that restrictions or limitations have been placed on their use and disposal when they are not determined to be surplus to requirements. These restrictions are imposed by virtue of the assets being held to deliver a specific community service and the Institute's enabling legislation.
Durack Institute of Technology
NOTES TO THE FINANCIAL STATEMENTS 16GLACT &PREV_LDGFOR THE PERIOD 1 JANUARY TO 10 APRIL 2016
2016 2015
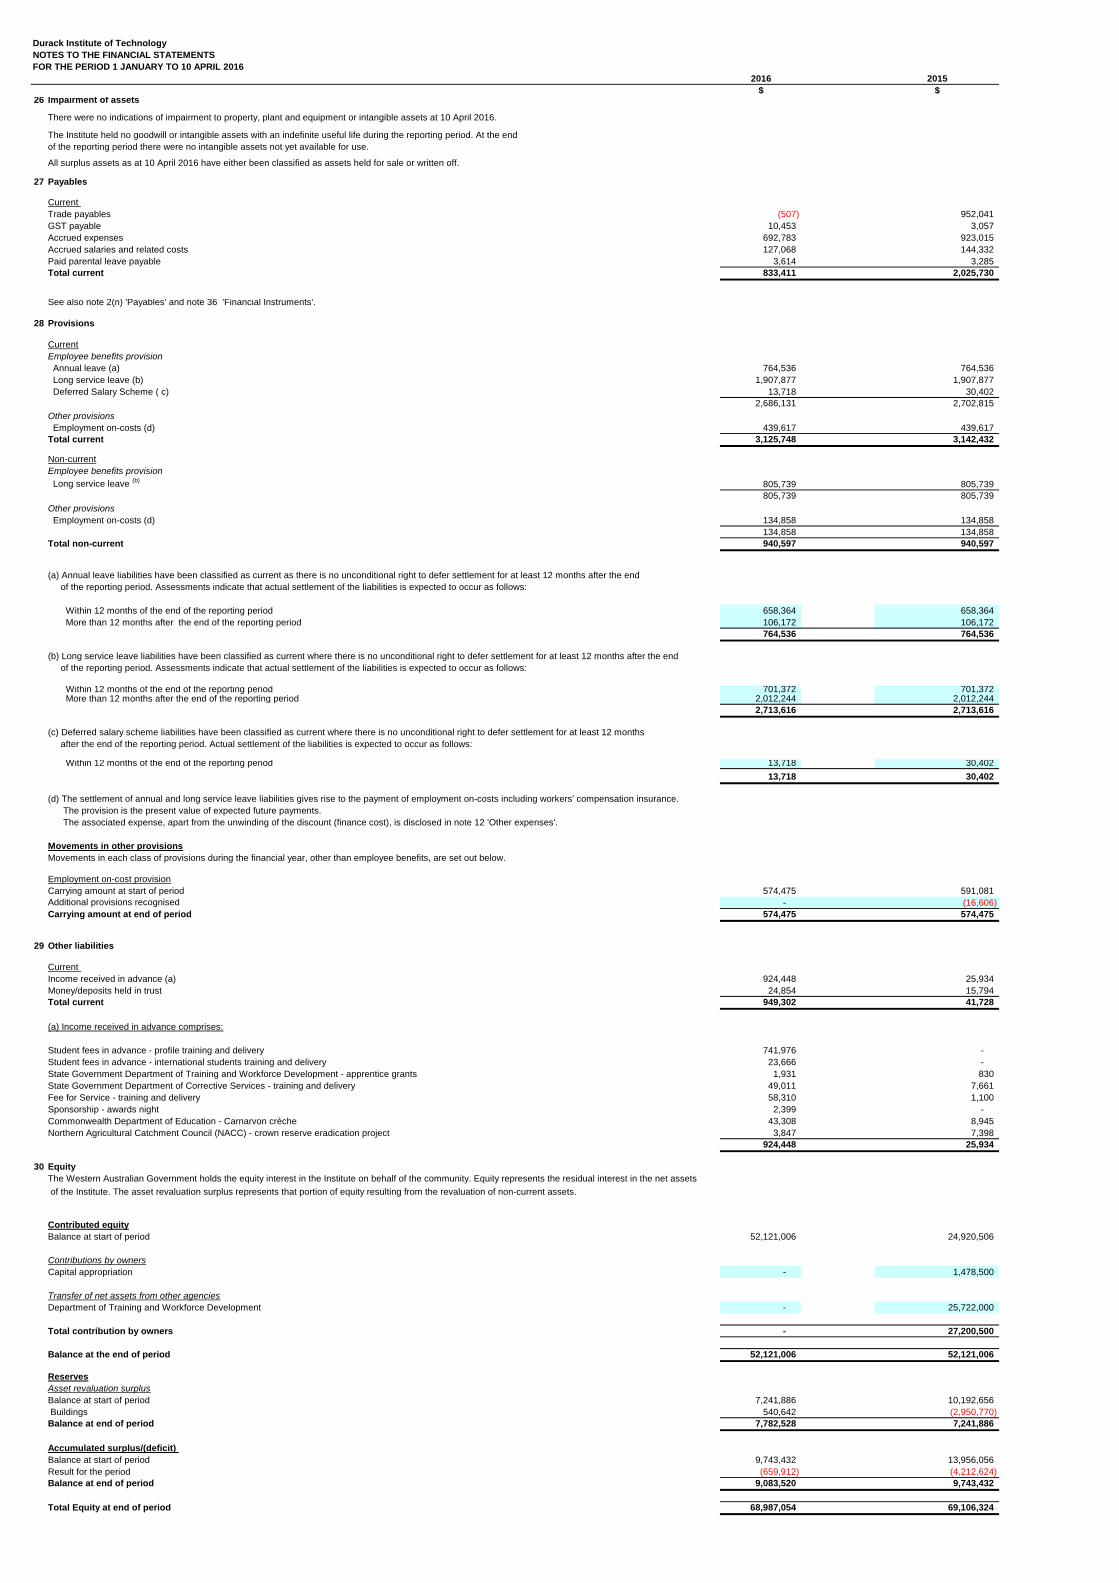
$ $26 Impairment of assets
There were no indications of impairment to property, plant and equipment or intangible assets at 10 April 2016.
The Institute held no goodwill or intangible assets with an indefinite useful life during the reporting period. At the end of the reporting period there were no intangible assets not yet available for use.
All surplus assets as at 10 April 2016 have either been classified as assets held for sale or written off.
27 Payables
Current Trade payables (507) 952,041 GST payable 10,453 3,057 Accrued expenses 692,783 923,015 Accrued salaries and related costs 127,068 144,332 Paid parental leave payable 3,614 3,285 Total current 833,411 2,025,730
See also note 2(n) 'Payables' and note 36 'Financial Instruments'.
28 Provisions
CurrentEmployee benefits provision
Annual leave (a) 764,536 764,536 Long service leave (b) 1,907,877 1,907,877 Deferred Salary Scheme ( c) 13,718 30,402
2,686,131 2,702,815 Other provisions
Employment on-costs (d) 439,617 439,617 Total current 3,125,748 3,142,432
Non-currentEmployee benefits provision
Long service leave (b) 805,739 805,739 805,739 805,739
Other provisions
Employment on-costs (d) 134,858 134,858 134,858 134,858
Total non-current 940,597 940,597
(a) Annual leave liabilities have been classified as current as there is no unconditional right to defer settlement for at least 12 months after the end of the reporting period. Assessments indicate that actual settlement of the liabilities is expected to occur as follows:
Within 12 months of the end of the reporting period 658,364 658,364 More than 12 months after the end of the reporting period 106,172 106,172
764,536 764,536
(b) Long service leave liabilities have been classified as current where there is no unconditional right to defer settlement for at least 12 months after the end of the reporting period. Assessments indicate that actual settlement of the liabilities is expected to occur as follows:
Within 12 months of the end of the reporting period 701,372 701,372 More than 12 months after the end of the reporting period 2,012,244 2,012,244
2,713,616 2,713,616
(c) Deferred salary scheme liabilities have been classified as current where there is no unconditional right to defer settlement for at least 12 months after the end of the reporting period. Actual settlement of the liabilities is expected to occur as follows:
Within 12 months of the end of the reporting period 13,718 30,402 13,718 30,402
(d) The settlement of annual and long service leave liabilities gives rise to the payment of employment on-costs including workers' compensation insurance. The provision is the present value of expected future payments. The associated expense, apart from the unwinding of the discount (finance cost), is disclosed in note 12 'Other expenses'.
Movements in other provisions
Movements in each class of provisions during the financial year, other than employee benefits, are set out below.
Employment on-cost provisionCarrying amount at start of period 574,475 591,081 Additional provisions recognised - (16,606) Carrying amount at end of period 574,475 574,475
29 Other liabilities
Current Income received in advance (a) 924,448 25,934 Money/deposits held in trust 24,854 15,794 Total current 949,302 41,728
(a) Income received in advance comprises:
Student fees in advance - profile training and delivery 741,976 - Student fees in advance - international students training and delivery 23,666 - State Government Department of Training and Workforce Development - apprentice grants 1,931 830 State Government Department of Corrective Services - training and delivery 49,011 7,661 Fee for Service - training and delivery 58,310 1,100 Sponsorship - awards night 2,399 - Commonwealth Department of Education - Carnarvon crèche 43,308 8,945 Northern Agricultural Catchment Council (NACC) - crown reserve eradication project 3,847 7,398
924,448 25,934
30 Equity
The Western Australian Government holds the equity interest in the Institute on behalf of the community. Equity represents the residual interest in the net assets of the Institute. The asset revaluation surplus represents that portion of equity resulting from the revaluation of non-current assets.
Contributed equity
Balance at start of period 52,121,006 24,920,506
Contributions by owners
Capital appropriation - 1,478,500
Transfer of net assets from other agencies
Department of Training and Workforce Development - 25,722,000
Total contribution by owners - 27,200,500
Balance at the end of period 52,121,006 52,121,006
Reserves
Asset revaluation surplus
Balance at start of period 7,241,886 10,192,656 Buildings 540,642 (2,950,770) Balance at end of period 7,782,528 7,241,886
Accumulated surplus/(deficit)
Balance at start of period 9,743,432 13,956,056 Result for the period (659,912) (4,212,624) Balance at end of period 9,083,520 9,743,432
Total Equity at end of period 68,987,054 69,106,324
Durack Institute of Technology
NOTES TO THE FINANCIAL STATEMENTS 16GLACT &PREV_LDGFOR THE PERIOD 1 JANUARY TO 10 APRIL 2016
2016 2015
$ $
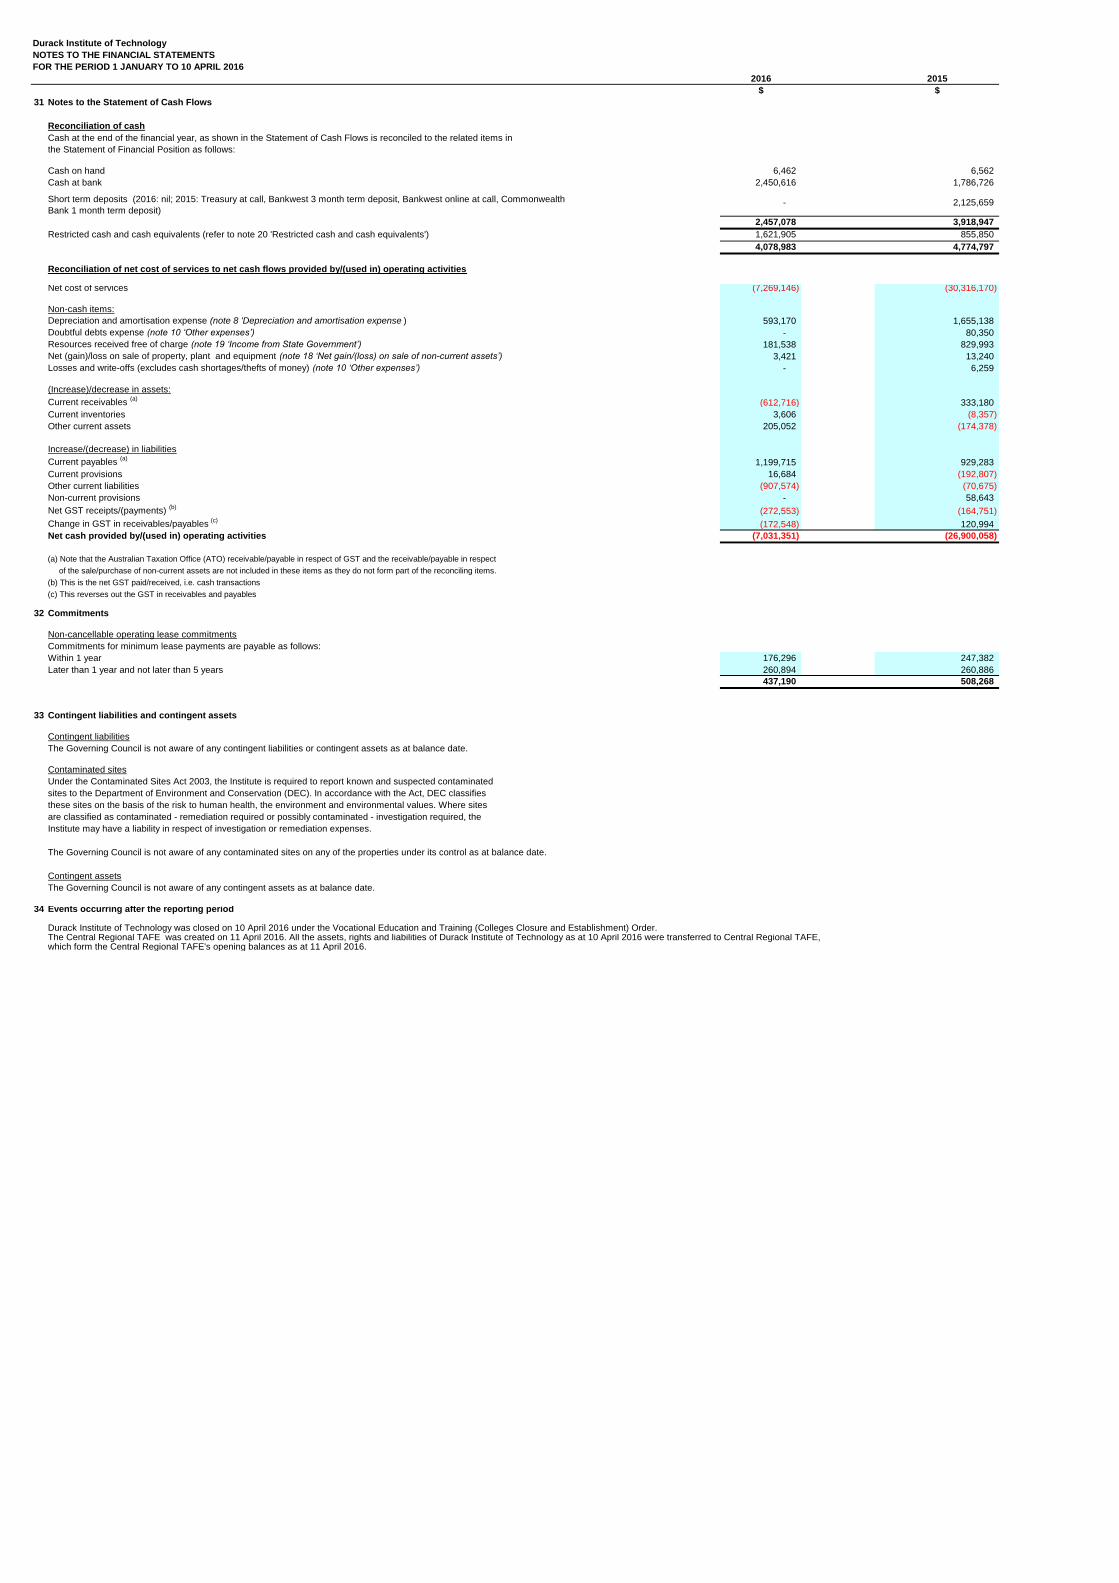
31 Notes to the Statement of Cash Flows
Reconciliation of cash
Cash on hand 6,462 6,562 Cash at bank 2,450,616 1,786,726
- 2,125,659
2,457,078 3,918,947
Restricted cash and cash equivalents (refer to note 20 'Restricted cash and cash equivalents') 1,621,905 855,850 4,078,983 4,774,797
Reconciliation of net cost of services to net cash flows provided by/(used in) operating activities
Net cost of services (7,269,146) (30,316,170)
Non-cash items:Depreciation and amortisation expense (note 8 'Depreciation and amortisation expense ) 593,170 1,655,138 Doubtful debts expense (note 10 ‘Other expenses’) - 80,350 Resources received free of charge (note 19 ‘Income from State Government’) 181,538 829,993 Net (gain)/loss on sale of property, plant and equipment (note 18 ‘Net gain/(loss) on sale of non-current assets’) 3,421 13,240 Losses and write-offs (excludes cash shortages/thefts of money) (note 10 ‘Other expenses’) - 6,259
(Increase)/decrease in assets:Current receivables (a) (612,716) 333,180 Current inventories 3,606 (8,357) Other current assets 205,052 (174,378)
Increase/(decrease) in liabilitiesCurrent payables (a) 1,199,715 929,283 Current provisions 16,684 (192,807) Other current liabilities (907,574) (70,675) Non-current provisions - 58,643 Net GST receipts/(payments) (b) (272,553) (164,751) Change in GST in receivables/payables (c) (172,548) 120,994 Net cash provided by/(used in) operating activities (7,031,351) (26,900,058)
(a) Note that the Australian Taxation Office (ATO) receivable/payable in respect of GST and the receivable/payable in respect of the sale/purchase of non-current assets are not included in these items as they do not form part of the reconciling items.(b) This is the net GST paid/received, i.e. cash transactions(c) This reverses out the GST in receivables and payables
32 Commitments
Non-cancellable operating lease commitments
Within 1 year 176,296 247,382 Later than 1 year and not later than 5 years 260,894 260,886
437,190 508,268
33 Contingent liabilities and contingent assets
Contingent liabilitiesThe Governing Council is not aware of any contingent liabilities or contingent assets as at balance date.
Contaminated sitesUnder the Contaminated Sites Act 2003, the Institute is required to report known and suspected contaminatedsites to the Department of Environment and Conservation (DEC). In accordance with the Act, DEC classifiesthese sites on the basis of the risk to human health, the environment and environmental values. Where sitesare classified as contaminated - remediation required or possibly contaminated - investigation required, theInstitute may have a liability in respect of investigation or remediation expenses.
The Governing Council is not aware of any contaminated sites on any of the properties under its control as at balance date.
Contingent assetsThe Governing Council is not aware of any contingent assets as at balance date.
34 Events occurring after the reporting period
Durack Institute of Technology was closed on 10 April 2016 under the Vocational Education and Training (Colleges Closure and Establishment) Order.The Central Regional TAFE was created on 11 April 2016. All the assets, rights and liabilities of Durack Institute of Technology as at 10 April 2016 were transferred to Central Regional TAFE,which form the Central Regional TAFE's opening balances as at 11 April 2016.
Cash at the end of the financial year, as shown in the Statement of Cash Flows is reconciled to the related items in the Statement of Financial Position as follows:
Short term deposits (2016: nil; 2015: Treasury at call, Bankwest 3 month term deposit, Bankwest online at call, Commonwealth Bank 1 month term deposit)
Commitments for minimum lease payments are payable as follows:
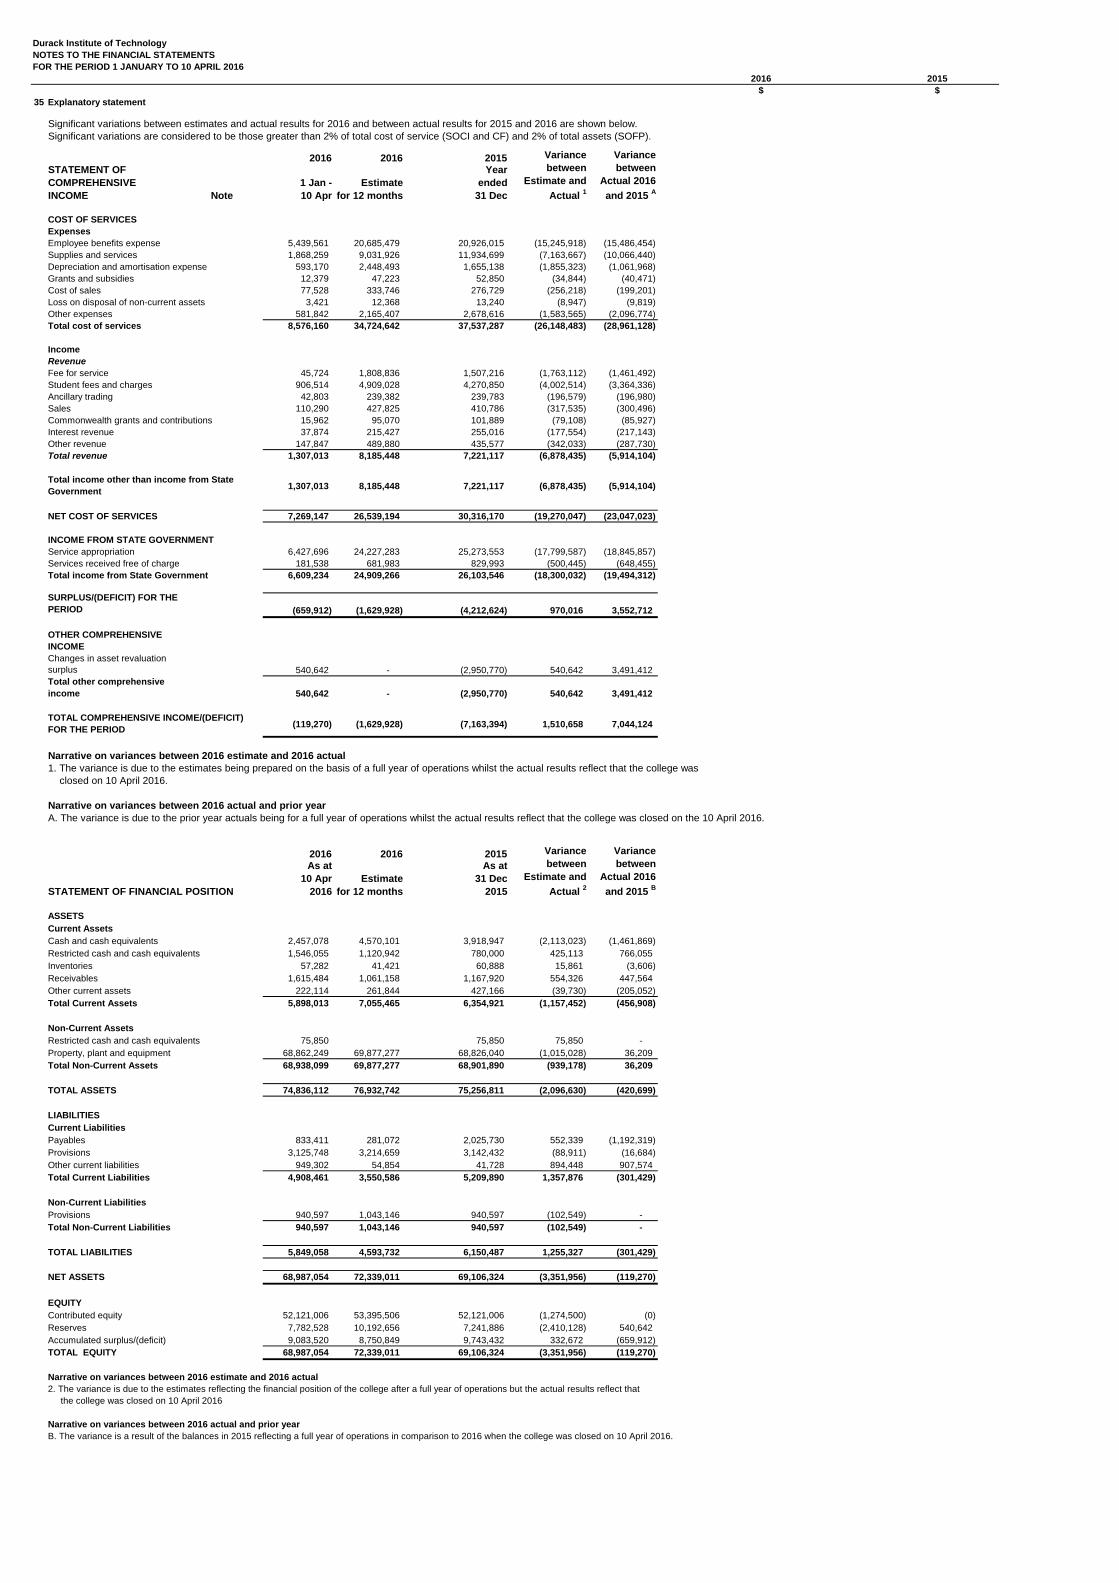
Durack Institute of Technology
NOTES TO THE FINANCIAL STATEMENTS 16GLACT &PREV_LDGFOR THE PERIOD 1 JANUARY TO 10 APRIL 2016
2016 2015
$ $
35 Explanatory statement
Significant variations between estimates and actual results for 2016 and between actual results for 2015 and 2016 are shown below.Significant variations are considered to be those greater than 2% of total cost of service (SOCI and CF) and 2% of total assets (SOFP).
2016 2016 2015STATEMENT OF
COMPREHENSIVE
INCOME Note
1 Jan -
10 Apr
Estimate
for 12 months
Year
ended
31 Dec
COST OF SERVICES
Expenses
Employee benefits expense 5,439,561 20,685,479 20,926,015 (15,245,918) (15,486,454) Supplies and services 1,868,259 9,031,926 11,934,699 (7,163,667) (10,066,440) Depreciation and amortisation expense 593,170 2,448,493 1,655,138 (1,855,323) (1,061,968) Grants and subsidies 12,379 47,223 52,850 (34,844) (40,471) Cost of sales 77,528 333,746 276,729 (256,218) (199,201) Loss on disposal of non-current assets 3,421 12,368 13,240 (8,947) (9,819) Other expenses 581,842 2,165,407 2,678,616 (1,583,565) (2,096,774) Total cost of services 8,576,160 34,724,642 37,537,287 (26,148,483) (28,961,128)
Income
Revenue
Fee for service 45,724 1,808,836 1,507,216 (1,763,112) (1,461,492) Student fees and charges 906,514 4,909,028 4,270,850 (4,002,514) (3,364,336) Ancillary trading 42,803 239,382 239,783 (196,579) (196,980) Sales 110,290 427,825 410,786 (317,535) (300,496) Commonwealth grants and contributions 15,962 95,070 101,889 (79,108) (85,927) Interest revenue 37,874 215,427 255,016 (177,554) (217,143) Other revenue 147,847 489,880 435,577 (342,033) (287,730) Total revenue 1,307,013 8,185,448 7,221,117 (6,878,435) (5,914,104)
1,307,013 8,185,448 7,221,117 (6,878,435) (5,914,104)
NET COST OF SERVICES 7,269,147 26,539,194 30,316,170 (19,270,047) (23,047,023)
INCOME FROM STATE GOVERNMENT
Service appropriation 6,427,696 24,227,283 25,273,553 (17,799,587) (18,845,857) Services received free of charge 181,538 681,983 829,993 (500,445) (648,455) Total income from State Government 6,609,234 24,909,266 26,103,546 (18,300,032) (19,494,312)
SURPLUS/(DEFICIT) FOR THE
PERIOD (659,912) (1,629,928) (4,212,624) 970,016 3,552,712
OTHER COMPREHENSIVE
INCOME
Changes in asset revaluation surplus 540,642 - (2,950,770) 540,642 3,491,412 Total other comprehensive
income 540,642 - (2,950,770) 540,642 3,491,412
(119,270) (1,629,928) (7,163,394) 1,510,658 7,044,124
Narrative on variances between 2016 estimate and 2016 actual
1. The variance is due to the estimates being prepared on the basis of a full year of operations whilst the actual results reflect that the college was closed on 10 April 2016.
Narrative on variances between 2016 actual and prior year
A. The variance is due to the prior year actuals being for a full year of operations whilst the actual results reflect that the college was closed on the 10 April 2016.
2016 2016 2015
STATEMENT OF FINANCIAL POSITION
As at
10 Apr
2016
Estimate
for 12 months
As at
31 Dec
2015
ASSETS
Current Assets
Cash and cash equivalents 2,457,078 4,570,101 3,918,947 (2,113,023) (1,461,869) Restricted cash and cash equivalents 1,546,055 1,120,942 780,000 425,113 766,055 Inventories 57,282 41,421 60,888 15,861 (3,606) Receivables 1,615,484 1,061,158 1,167,920 554,326 447,564 Other current assets 222,114 261,844 427,166 (39,730) (205,052) Total Current Assets 5,898,013 7,055,465 6,354,921 (1,157,452) (456,908)
Non-Current Assets
Restricted cash and cash equivalents 75,850 75,850 75,850 - Property, plant and equipment 68,862,249 69,877,277 68,826,040 (1,015,028) 36,209 Total Non-Current Assets 68,938,099 69,877,277 68,901,890 (939,178) 36,209
TOTAL ASSETS 74,836,112 76,932,742 75,256,811 (2,096,630) (420,699)
LIABILITIES
Current Liabilities
Payables 833,411 281,072 2,025,730 552,339 (1,192,319) Provisions 3,125,748 3,214,659 3,142,432 (88,911) (16,684) Other current liabilities 949,302 54,854 41,728 894,448 907,574 Total Current Liabilities 4,908,461 3,550,586 5,209,890 1,357,876 (301,429)
Non-Current Liabilities
Provisions 940,597 1,043,146 940,597 (102,549) - Total Non-Current Liabilities 940,597 1,043,146 940,597 (102,549) -
TOTAL LIABILITIES 5,849,058 4,593,732 6,150,487 1,255,327 (301,429)
NET ASSETS 68,987,054 72,339,011 69,106,324 (3,351,956) (119,270)
EQUITY
Contributed equity 52,121,006 53,395,506 52,121,006 (1,274,500) (0) Reserves 7,782,528 10,192,656 7,241,886 (2,410,128) 540,642 Accumulated surplus/(deficit) 9,083,520 8,750,849 9,743,432 332,672 (659,912) TOTAL EQUITY 68,987,054 72,339,011 69,106,324 (3,351,956) (119,270)
Narrative on variances between 2016 estimate and 2016 actual
2. The variance is due to the estimates reflecting the financial position of the college after a full year of operations but the actual results reflect that the college was closed on 10 April 2016
Narrative on variances between 2016 actual and prior year
B. The variance is a result of the balances in 2015 reflecting a full year of operations in comparison to 2016 when the college was closed on 10 April 2016.
Variance
between
Estimate and
Actual 1
Variance
between
Actual 2016
and 2015 A
Variance
between
Estimate and
Actual 2
Variance
between
Actual 2016
and 2015 B
Total income other than income from State
Government
TOTAL COMPREHENSIVE INCOME/(DEFICIT)
FOR THE PERIOD
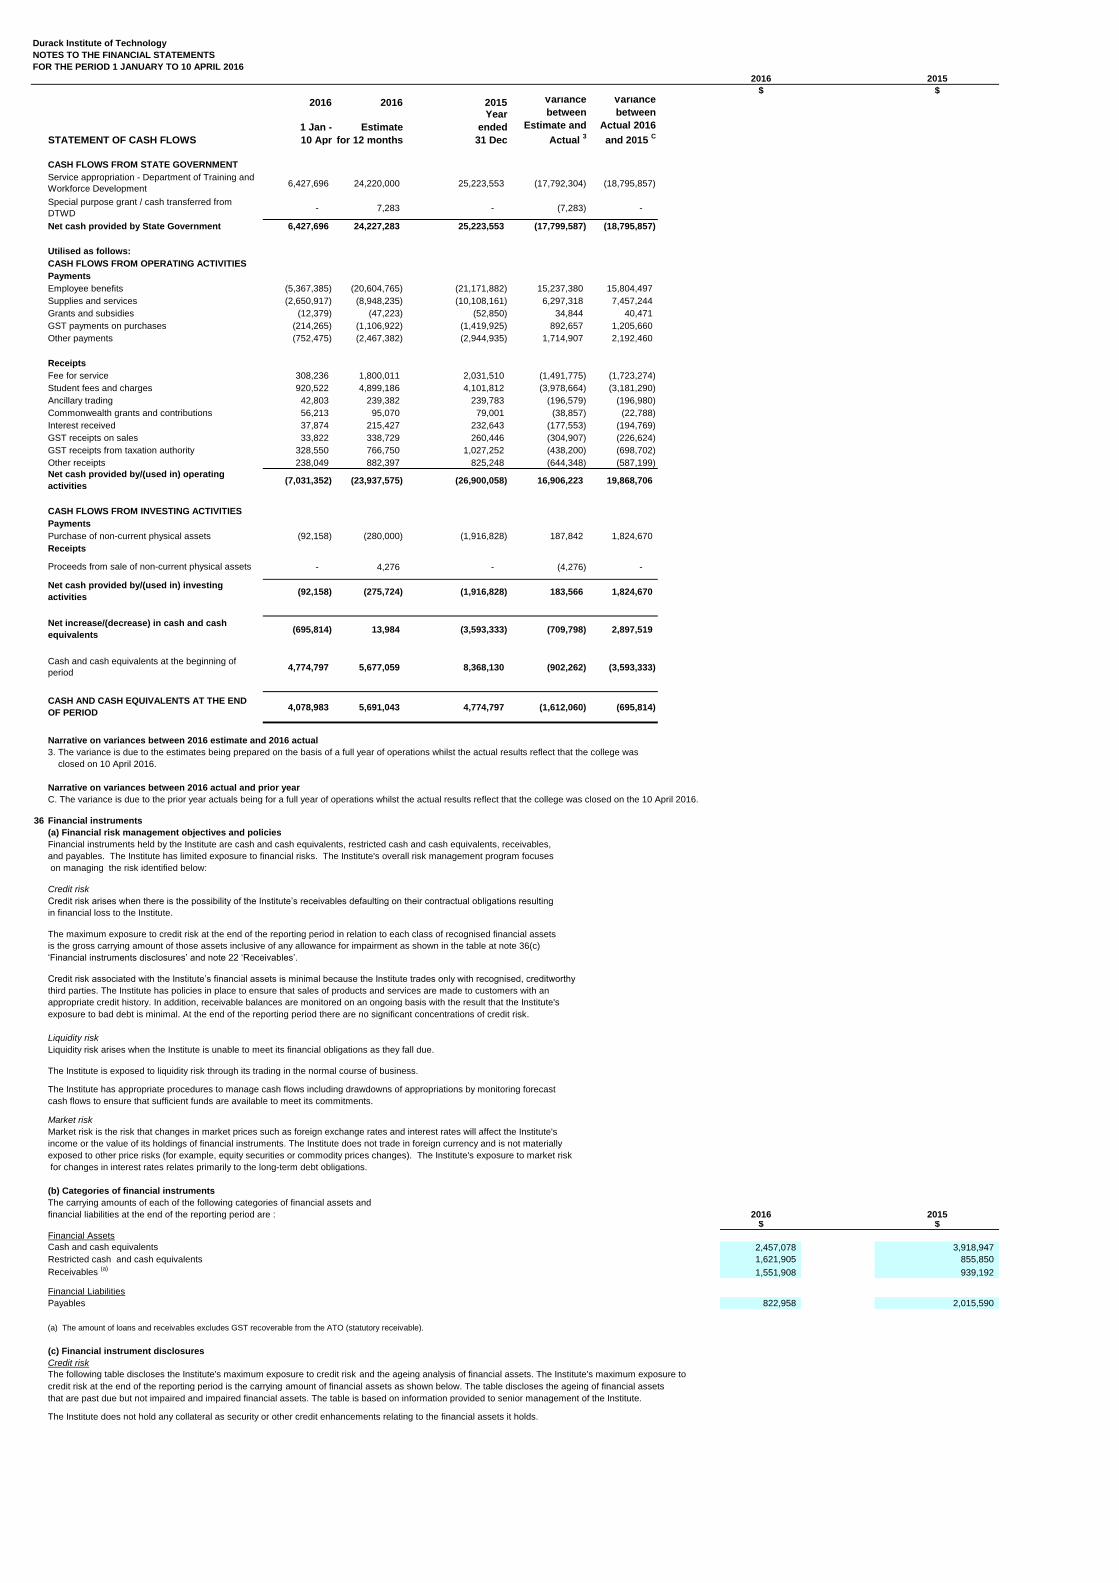
Durack Institute of Technology
NOTES TO THE FINANCIAL STATEMENTS 16GLACT &PREV_LDGFOR THE PERIOD 1 JANUARY TO 10 APRIL 2016
2016 2015
$ $
2016 2016 2015
STATEMENT OF CASH FLOWS
1 Jan -
10 Apr
Estimate
for 12 months
Year
ended
31 Dec
CASH FLOWS FROM STATE GOVERNMENT
6,427,696 24,220,000 25,223,553 (17,792,304) (18,795,857)
- 7,283 - (7,283) -
Net cash provided by State Government 6,427,696 24,227,283 25,223,553 (17,799,587) (18,795,857)
Utilised as follows:
CASH FLOWS FROM OPERATING ACTIVITIES
Payments
Employee benefits (5,367,385) (20,604,765) (21,171,882) 15,237,380 15,804,497 Supplies and services (2,650,917) (8,948,235) (10,108,161) 6,297,318 7,457,244 Grants and subsidies (12,379) (47,223) (52,850) 34,844 40,471 GST payments on purchases (214,265) (1,106,922) (1,419,925) 892,657 1,205,660 Other payments (752,475) (2,467,382) (2,944,935) 1,714,907 2,192,460
Receipts
Fee for service 308,236 1,800,011 2,031,510 (1,491,775) (1,723,274) Student fees and charges 920,522 4,899,186 4,101,812 (3,978,664) (3,181,290) Ancillary trading 42,803 239,382 239,783 (196,579) (196,980) Commonwealth grants and contributions 56,213 95,070 79,001 (38,857) (22,788) Interest received 37,874 215,427 232,643 (177,553) (194,769) GST receipts on sales 33,822 338,729 260,446 (304,907) (226,624) GST receipts from taxation authority 328,550 766,750 1,027,252 (438,200) (698,702) Other receipts 238,049 882,397 825,248 (644,348) (587,199)
(7,031,352) (23,937,575) (26,900,058) 16,906,223 19,868,706
CASH FLOWS FROM INVESTING ACTIVITIES
Payments
Purchase of non-current physical assets (92,158) (280,000) (1,916,828) 187,842 1,824,670 Receipts
- 4,276 - (4,276) -
(92,158) (275,724) (1,916,828) 183,566 1,824,670
(695,814) 13,984 (3,593,333) (709,798) 2,897,519
4,774,797 5,677,059 8,368,130 (902,262) (3,593,333)
4,078,983 5,691,043 4,774,797 (1,612,060) (695,814)
Narrative on variances between 2016 estimate and 2016 actual
3. The variance is due to the estimates being prepared on the basis of a full year of operations whilst the actual results reflect that the college was closed on 10 April 2016.
Narrative on variances between 2016 actual and prior year
C. The variance is due to the prior year actuals being for a full year of operations whilst the actual results reflect that the college was closed on the 10 April 2016.
36 Financial instruments
(a) Financial risk management objectives and policies
Financial instruments held by the Institute are cash and cash equivalents, restricted cash and cash equivalents, receivables,and payables. The Institute has limited exposure to financial risks. The Institute's overall risk management program focuses on managing the risk identified below:
Credit risk
Credit risk arises when there is the possibility of the Institute’s receivables defaulting on their contractual obligations resulting
in financial loss to the Institute.
The maximum exposure to credit risk at the end of the reporting period in relation to each class of recognised financial assetsis the gross carrying amount of those assets inclusive of any allowance for impairment as shown in the table at note 36(c) ‘Financial instruments disclosures’ and note 22 ‘Receivables’.
Credit risk associated with the Institute’s financial assets is minimal because the Institute trades only with recognised, creditworthy
third parties. The Institute has policies in place to ensure that sales of products and services are made to customers with an appropriate credit history. In addition, receivable balances are monitored on an ongoing basis with the result that the Institute's exposure to bad debt is minimal. At the end of the reporting period there are no significant concentrations of credit risk.
Liquidity risk arises when the Institute is unable to meet its financial obligations as they fall due.
The Institute is exposed to liquidity risk through its trading in the normal course of business.
Market risk is the risk that changes in market prices such as foreign exchange rates and interest rates will affect the Institute's income or the value of its holdings of financial instruments. The Institute does not trade in foreign currency and is not materially
(b) Categories of financial instruments
The carrying amounts of each of the following categories of financial assets and financial liabilities at the end of the reporting period are : 2016 2015
$ $
Financial AssetsCash and cash equivalents 2,457,078 3,918,947 Restricted cash and cash equivalents 1,621,905 855,850 Receivables (a) 1,551,908 939,192
Financial LiabilitiesPayables 822,958 2,015,590
(a) The amount of loans and receivables excludes GST recoverable from the ATO (statutory receivable).
(c) Financial instrument disclosures
Credit risk
The following table discloses the Institute's maximum exposure to credit risk and the ageing analysis of financial assets. The Institute's maximum exposure tocredit risk at the end of the reporting period is the carrying amount of financial assets as shown below. The table discloses the ageing of financial assetsthat are past due but not impaired and impaired financial assets. The table is based on information provided to senior management of the Institute.
The Institute does not hold any collateral as security or other credit enhancements relating to the financial assets it holds.
Variance
between
Estimate and
Actual 3
Variance
between
Actual 2016
and 2015 C
Special purpose grant / cash transferred from DTWD
Service appropriation - Department of Training and Workforce Development
Proceeds from sale of non-current physical assets
Net cash provided by/(used in) operating
activities
Net cash provided by/(used in) investing
activities
Net increase/(decrease) in cash and cash
equivalents
Cash and cash equivalents at the beginning of period
CASH AND CASH EQUIVALENTS AT THE END
OF PERIOD
The Institute has appropriate procedures to manage cash flows including drawdowns of appropriations by monitoring forecastcash flows to ensure that sufficient funds are available to meet its commitments.
Market risk
exposed to other price risks (for example, equity securities or commodity prices changes). The Institute's exposure to market risk
Liquidity risk
for changes in interest rates relates primarily to the long-term debt obligations.
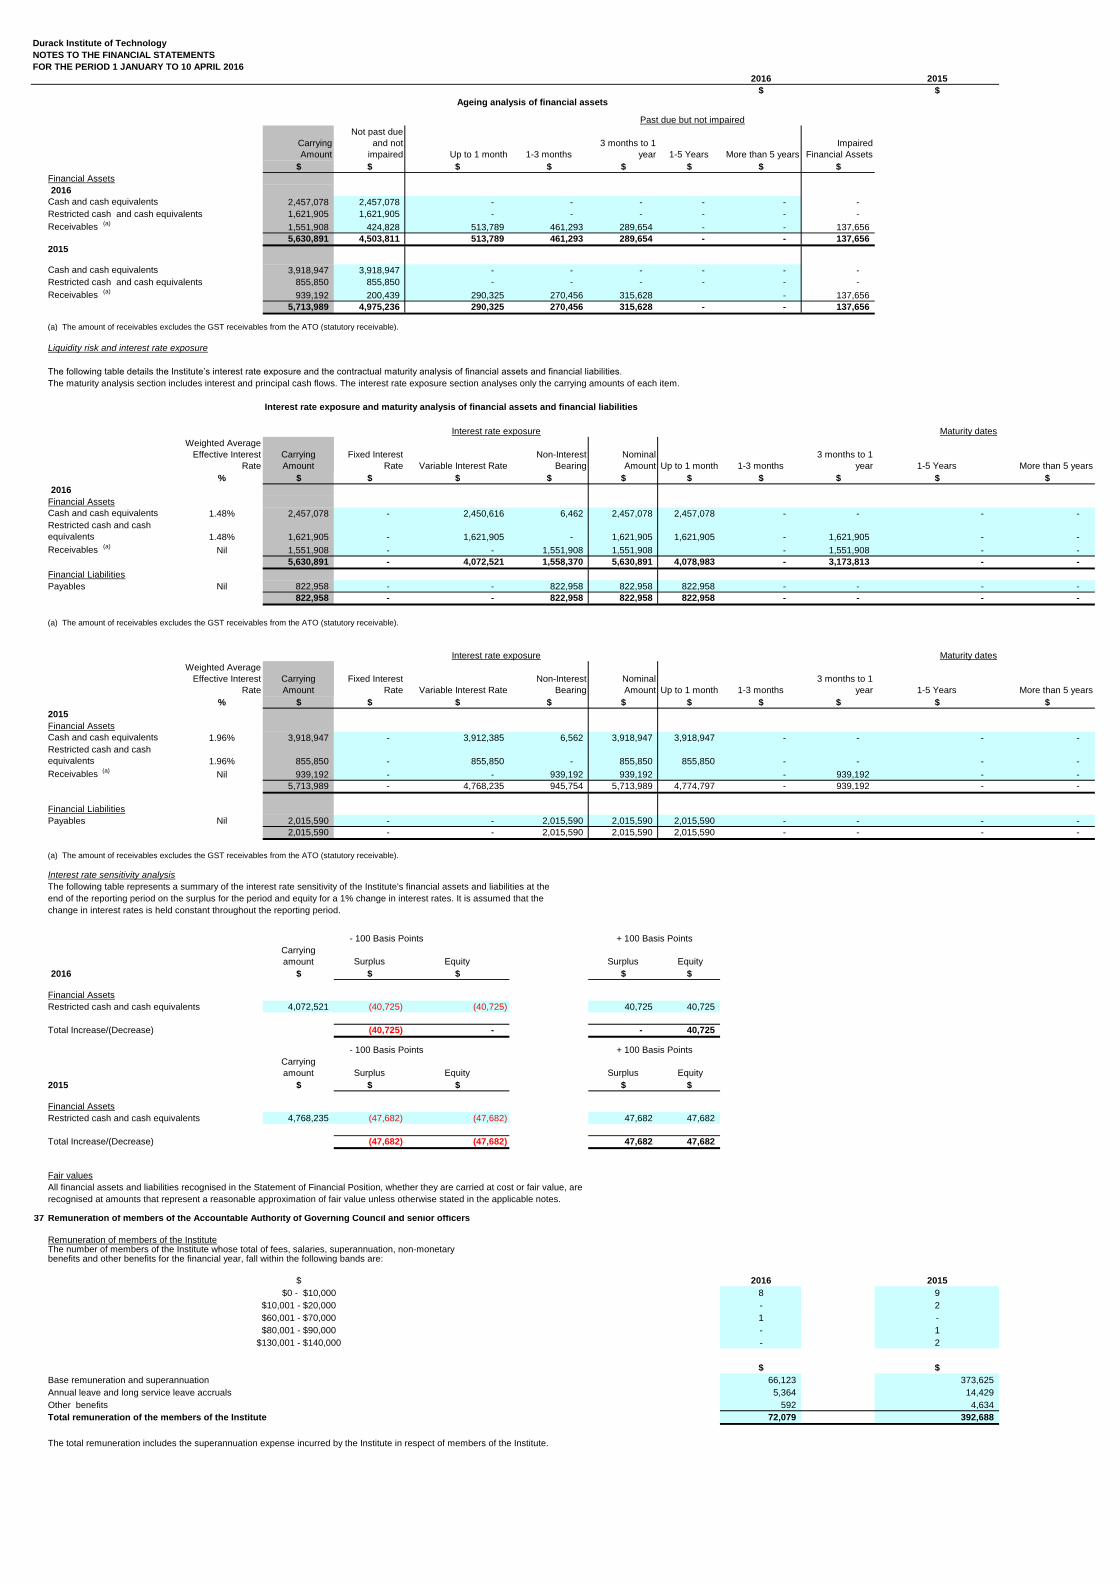
Durack Institute of Technology
NOTES TO THE FINANCIAL STATEMENTS 16GLACT &PREV_LDGFOR THE PERIOD 1 JANUARY TO 10 APRIL 2016
2016 2015
$ $
Carrying Amount
Not past due and not
impaired Up to 1 month 1-3 months 3 months to 1
year 1-5 Years More than 5 years Impaired
Financial Assets $ $ $ $ $ $ $ $
Financial Assets2016
Cash and cash equivalents 2,457,078 2,457,078 - - - - - - Restricted cash and cash equivalents 1,621,905 1,621,905 - - - - - - Receivables (a) 1,551,908 424,828 513,789 461,293 289,654 - - 137,656
5,630,891 4,503,811 513,789 461,293 289,654 - - 137,656 2015
Cash and cash equivalents 3,918,947 3,918,947 - - - - - - Restricted cash and cash equivalents 855,850 855,850 - - - - - - Receivables (a) 939,192 200,439 290,325 270,456 315,628 - 137,656
5,713,989 4,975,236 290,325 270,456 315,628 - - 137,656
(a) The amount of receivables excludes the GST receivables from the ATO (statutory receivable).
Liquidity risk and interest rate exposure
The following table details the Institute’s interest rate exposure and the contractual maturity analysis of financial assets and financial liabilities.
The maturity analysis section includes interest and principal cash flows. The interest rate exposure section analyses only the carrying amounts of each item.
Interest rate exposure and maturity analysis of financial assets and financial liabilities
Weighted Average Effective Interest
RateCarrying Amount
Fixed Interest Rate Variable Interest Rate
Non-Interest Bearing
Nominal Amount Up to 1 month 1-3 months
3 months to 1 year 1-5 Years More than 5 years
% $ $ $ $ $ $ $ $ $ $
2016
Financial AssetsCash and cash equivalents 1.48% 2,457,078 - 2,450,616 6,462 2,457,078 2,457,078 - - - - Restricted cash and cash equivalents 1.48% 1,621,905 - 1,621,905 - 1,621,905 1,621,905 - 1,621,905 - - Receivables (a) Nil 1,551,908 - - 1,551,908 1,551,908 - 1,551,908 - -
5,630,891 - 4,072,521 1,558,370 5,630,891 4,078,983 - 3,173,813 - -
Financial LiabilitiesPayables Nil 822,958 - - 822,958 822,958 822,958 - - - -
822,958 - - 822,958 822,958 822,958 - - - -
(a) The amount of receivables excludes the GST receivables from the ATO (statutory receivable).
Weighted Average Effective Interest
RateCarrying Amount
Fixed Interest Rate Variable Interest Rate
Non-Interest Bearing
Nominal Amount Up to 1 month 1-3 months
3 months to 1 year 1-5 Years More than 5 years
% $ $ $ $ $ $ $ $ $ $
2015
Financial AssetsCash and cash equivalents 1.96% 3,918,947 - 3,912,385 6,562 3,918,947 3,918,947 - - - - Restricted cash and cash equivalents 1.96% 855,850 - 855,850 - 855,850 855,850 - - - - Receivables (a) Nil 939,192 - - 939,192 939,192 - 939,192 - -
5,713,989 - 4,768,235 945,754 5,713,989 4,774,797 - 939,192 - -
Financial LiabilitiesPayables Nil 2,015,590 - - 2,015,590 2,015,590 2,015,590 - - - -
2,015,590 - - 2,015,590 2,015,590 2,015,590 - - - -
(a) The amount of receivables excludes the GST receivables from the ATO (statutory receivable).
Interest rate sensitivity analysis
change in interest rates is held constant throughout the reporting period.
Carrying amount Surplus Equity Surplus Equity
2016 $ $ $ $ $
Financial AssetsRestricted cash and cash equivalents 4,072,521 (40,725) (40,725) 40,725 40,725
Total Increase/(Decrease) (40,725) - - 40,725
Carrying amount Surplus Equity Surplus Equity
2015 $ $ $ $ $
Financial AssetsRestricted cash and cash equivalents 4,768,235 (47,682) (47,682) 47,682 47,682
Total Increase/(Decrease) (47,682) (47,682) 47,682 47,682
Fair valuesAll financial assets and liabilities recognised in the Statement of Financial Position, whether they are carried at cost or fair value, are recognised at amounts that represent a reasonable approximation of fair value unless otherwise stated in the applicable notes.
37 Remuneration of members of the Accountable Authority of Governing Council and senior officers
$ 2016 2015
$0 - $10,000 8 9$10,001 - $20,000 - 2$60,001 - $70,000 1 -$80,001 - $90,000 - 1
$130,001 - $140,000 - 2
$ $
Base remuneration and superannuation 66,123 373,625 Annual leave and long service leave accruals 5,364 14,429 Other benefits 592 4,634 Total remuneration of the members of the Institute 72,079 392,688
The total remuneration includes the superannuation expense incurred by the Institute in respect of members of the Institute.
Ageing analysis of financial assets
The following table represents a summary of the interest rate sensitivity of the Institute's financial assets and liabilities at the end of the reporting period on the surplus for the period and equity for a 1% change in interest rates. It is assumed that the
- 100 Basis Points + 100 Basis Points
- 100 Basis Points
Past due but not impaired
Interest rate exposure Maturity dates
Interest rate exposure Maturity dates
Remuneration of members of the InstituteThe number of members of the Institute whose total of fees, salaries, superannuation, non-monetary benefits and other benefits for the financial year, fall within the following bands are:
+ 100 Basis Points
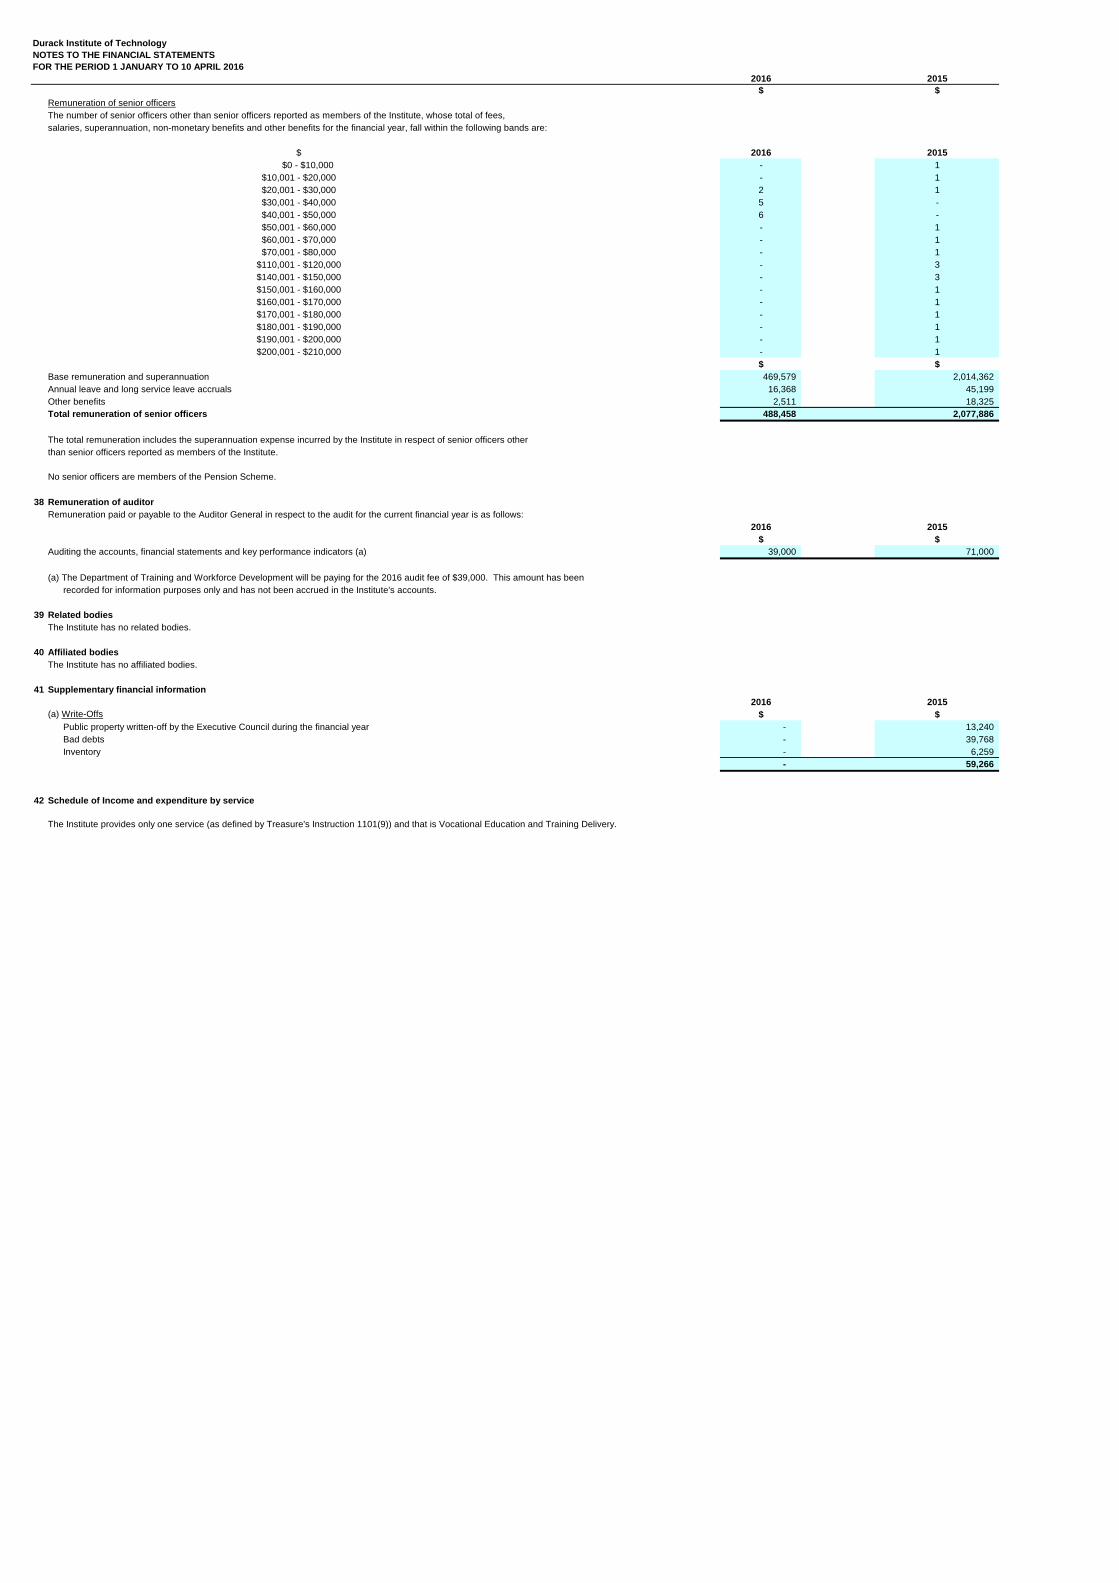
Durack Institute of Technology
NOTES TO THE FINANCIAL STATEMENTS 16GLACT &PREV_LDGFOR THE PERIOD 1 JANUARY TO 10 APRIL 2016
2016 2015
$ $
Remuneration of senior officers
$ 2016 2015
$0 - $10,000 - 1$10,001 - $20,000 - 1$20,001 - $30,000 2 1$30,001 - $40,000 5 -$40,001 - $50,000 6 -$50,001 - $60,000 - 1$60,001 - $70,000 - 1$70,001 - $80,000 - 1
$110,001 - $120,000 - 3$140,001 - $150,000 - 3$150,001 - $160,000 - 1$160,001 - $170,000 - 1$170,001 - $180,000 - 1$180,001 - $190,000 - 1$190,001 - $200,000 - 1$200,001 - $210,000 - 1
$ $
Base remuneration and superannuation 469,579 2,014,362 Annual leave and long service leave accruals 16,368 45,199 Other benefits 2,511 18,325 Total remuneration of senior officers 488,458 2,077,886
The total remuneration includes the superannuation expense incurred by the Institute in respect of senior officers otherthan senior officers reported as members of the Institute.
No senior officers are members of the Pension Scheme.
38 Remuneration of auditor
Remuneration paid or payable to the Auditor General in respect to the audit for the current financial year is as follows:2016 2015
$ $
Auditing the accounts, financial statements and key performance indicators (a) 39,000 71,000
(a) The Department of Training and Workforce Development will be paying for the 2016 audit fee of $39,000. This amount has been recorded for information purposes only and has not been accrued in the Institute's accounts.
39 Related bodies
The Institute has no related bodies.
40 Affiliated bodies
The Institute has no affiliated bodies.
41 Supplementary financial information
2016 2015
(a) Write-Offs $ $
Public property written-off by the Executive Council during the financial year - 13,240 Bad debts - 39,768 Inventory - 6,259
- 59,266
42 Schedule of Income and expenditure by service
The Institute provides only one service (as defined by Treasure's Instruction 1101(9)) and that is Vocational Education and Training Delivery.
The number of senior officers other than senior officers reported as members of the Institute, whose total of fees,salaries, superannuation, non-monetary benefits and other benefits for the financial year, fall within the following bands are: