Embed Size (px)
Citation preview
Dynamic Analysis of Cracked Rotor in
Viscous Medium and its Crack Diagnosis
using Intelligent Techniques
Adik Ramdayal Yadao
Department of Mechanical Engineering
National Institute of Technology Rourkela
Dynamic Analysis of Cracked Rotor in
Viscous Medium and its Crack Diagnosis
using Intelligent Techniques
Dissertation submitted to the
National Institute of Technology Rourkela
in partial fulfillment of the requirements
of the degree of
Doctor of Philosophy
in
Mechanical Engineering
by
Adik Ramdayal Yadao
(Roll Number: 512ME117)
under the supervision of
Prof. Dayal R. Parhi
Novemenber, 2016
Department of Mechanical Engineering
National Institute of Technology Rourkela
i
Department of Mechanical Engineering
National Institute of Technology Rourkela
November 20, 2016
Certificate of Examination
Roll Number: 512ME117
Name: Adik Ramdayal Yadao
Title of Dissertation: Dynamic Analysis of Cracked Rotor in Viscous Medium and its
Crack Diagnosis using Intelligent Techniques
We the below signed, after checking the dissertation mentioned above and the official
record book (s) of the student, hereby state our approval of the dissertation submitted in
partial fulfillment of the requirement of the degree of Doctor of Philosophy in Mechanical
Engineering at National Institute of Technology, Rourkela. We are satisfied with the
volume, quality, correctness, and originality of the work.
Dayal R. Parhi
Principal Supervisor
Saurav Dutta
Member (DSC)
Pabitra Mohan Khilar
Member (DSC)
Shishir Kumar Sahu
Member (DSC)
Vinay Sharma
External Examiner
Kalipada Maity
Chairperson (DSC)
S S Mahapatra
Head of the Department
ii
Department of Mechanical Engineering
National Institute of Technology Rourkela
Dr. Dayal R. Parhi
Professor
November 20, 2016
Supervisor Certificate
This is to certify that the work presented in this dissertation entitled “Dynamic analysis of
Cracked Rotor in Viscous Medium and its Crack Diagnosis using Intelligent Techniques”
by “Adik Ramdayal Yadao”, Roll Number: 512ME117, is a record of original research
carried out by him under my supervision and guidance in partial fulfillment of the
requirements of the degree of Doctor of philosophy in Mechanical Engineering. Neither
this dissertation nor any part of it has been submitted for any degree or diploma to any
institute or university in India or abroad.
Dayal R. Parhi
Professor

iii
To my Parents,
with all my love
iv
Declaration of Originality
I, Adik Yadao, Roll Number: 512ME117 hereby declare that this dissertation entitled
“Dynamic Analysis of Cracked Rotor in Viscous Medium and its Crack Diagnosis using
Intelligent Techniques” represents my original work carried out as a doctoral student of
NIT Rourkela and, to the best of my knowledge, it contains no material previously
published or written by another person, nor any material presented for the award of any
degree or diploma of NIT Rourkela or any other institution. Any contribution made to this
research by others, with whom I have worked at NIT Rourkela or elsewhere, is explicitly
acknowledged in the dissertation. Works of other authors cited in this dissertation have
been duly acknowledged under the section “Bibliography”. I have also submitted my
original research records to the scrutiny committee for evaluation of my dissertation.
I am fully aware that in case of my non-compliance detected in the future, the Senate
of NIT Rourkela may withdraw the degree awarded to me on the basis of the present
dissertation.
November 20, 2016 Adik Ramdayal Yadao
NIT Rourkela
v
Acknowledgment
My first thank is to the Almighty God, without whose blessings, I wouldn't have been
writing this “acknowledgments".
I would like to extend my heartfelt indebtedness and gratitude to Prof. Dayal R. Parhi for
his kindness in providing me an opportunity to work under his supervision and guidance.
During this period, without his endless efforts, immense knowledge, deep patience,
invaluable guidance and answers to my numerous questions, this research would have
never been possible. I am especially obliged to him for teaching me both research and
writing skills, which have been proven beneficial for my current research and future
career. He showed me different ways to approach a research problem and the need to be
persistent to accomplish any goal. It has been a great honor and pleasure for me to do
research under the supervision of Dr. Dayal R. Parhi. I am thankful to Prof. Animesh
Biswas, Director of National Institute of Technology, for giving me an opportunity to be a
part of this institute of national importance and to work under the supervision of Prof.
Dayal R. Parhi. I am sincerely obliged to Prof. S. S. Mahapatra, Head of the Department,
Department of Mechanical Engineering, for providing me all official and laboratory
facilities during the research period. His incessant encouragement towards research work
has inspired me a lot.
I express my gratitude to Prof. K. P. Maity, Chairman DSC and DSC members for their
indebted help and valuable suggestions for the accomplishment of the dissertation. I thank
all the members of the Department of Mechanical Engineering, and the Institute, who
helped me in various ways towards the completion of my work.
I would like to thank all my friends and lab-mates for their encouragement and
understanding. Their support and lots of lovely memories with them can never be captured
in words. Finally, I thank my parents, beloved wife and the entire family members for
their unlimited support and strength.
November 20, 2016 Adik Ramdayal Yadao
NIT Rourkela Roll Number: 512ME117
vi
Abstract
Fatigue cracks have high potential to cause catastrophic failures in the rotor which can
lead to catastrophic failure if undetected properly and in time. This fault may interrupt
smooth, effective and efficient operation and performance of the machines. Thereby the
importance of identification of crack in the rotor is not only for leading safe operation but
also to prevent the loss of economy and lives.The condition monitoring of the engineering
systems is attracted by the researchers and scientists very much to invent the automated
fault diagnosis mechanism using the change in dynamic response before and after damage.
When the rotor with transverse crack immersed in the viscous fluid, analysis of cracked
rotor is difficult and complex. The analysis of cracked rotor partially submerged in the
viscous fluid is widely used in various engineering systems such as long spinning shaft
used drilling the seabed for the extracting the oil, high-speed turbine rotors, and analysis
of centrifuges in a fluid medium. Therefore, dynamic analysis of cracked rotor partially
submerged in the viscous medium have been presented in the current study. The
theoretical analysis has been performed to measure the vibration signatures (Natural
Frequencies and Amplitude) of multiple cracked mild steel rotor partially submerged in
the viscous medium. The presence of the crack in rotor generates an additional flexibility.
That is evaluated by strain energy release rate given by linear fracture mechanics. The
additional flexibility alters the dynamic characteristics of cracked rotor in a viscous fluid.
The local stiffness matrix has been calculated by the inverse of local dimensionless
compliance matrix. The finite element analysis has been carried out to measure the
vibration characteristics of cracked rotor partially submerged in the viscous medium using
commercially available finite element software package ANSYS. It is observed from the
current analysis, the various factors such as the viscosity of fluid, depth and position of the
cracks affect the performance of the rotor and effectiveness of crack detection techniques.
Various Artificial Intelligent (AI) techniques such as fuzzy logic, hybrid BPNN-RBFNN
neural network, MANFIS and hybrid fuzzy-rule base controller based multiple faults
diagnosis systems are developed using the dynamic response of rotating cracked rotor in a
viscous medium to monitor the presence of crack. Experiments have been conducted to
authenticate the performance and accuracy of proposed methods. Good agreement is
observed between the results.
Keywords: Rotor; Dynamic response; Viscous fluid; Dynamic response; Navier-Stokes
equation; Fuzzy; Neural network.
vii
Contents
Certificate of Examination ................................................................................................. i
Supervisor Certificate ....................................................................................................... ii
Dedication .......................................................................................................................... iii
Declaration of Originality ................................................................................................ iv
Acknowledgement .............................................................................................................. v
Abstract ............................................................................................................................. vi
Contents ............................................................................................................................ vii
List of Figures .................................................................................................................. xii
List of Tables .................................................................................................................. xvii
Nomenclatures ................................................................................................................. xx
1 Introduction ................................................................................................................. 1
1.1 Motivation of Research work .................................................................................. 1
1.2 Aims and Objectives of the Research Work ............................................................ 2
1.3 Methodologies Applied for Proposed Research Work ............................................ 3
1.4 Novelty of Proposed Research Work ...................................................................... 4
1.5 Outline of the Proposed Research work ................................................................. 5
2 Literature Review ........................................................................................................ 7
2.1 Introduction ............................................................................................................. 7
2.2 Analysis of Differerent Methodologies for Crack Identification in Rotor ............. 8
2.2.1 Classical Methods for Identification of Crack ................................................ 8
2.2.2 Finite Element Method used for Identification of Crack .............................. 16
2.2.3 Wavelet Transform and Wavelet Finite Element Method used for
Identification of Crack.................................................................................. 18
2.2.4 Other Approaches are used for Identification of Crack ................................ 19
2.2.5 Artificial Intelligence Techniques used for Identification of Crack ............ 21
2.2.5.1 Fuzzy Logic Technique .................................................................... 21
2.2.5.2 Artificial Neural Network Technique............................................... 23
2.2.5.3 Adaptive Neuro-Fuzzy Inference System (ANFIS) ........................ 26
2.2.5.4 Rule-Base Technique ....................................................................... 29
2.3 Summary ................................................................................................................ 30
3 Theoretical Analysis of Dynamic Response of Rotor with Multiple
Transverse Crack Partially Submerged in Viscous Medium ............................... 31
viii
3.1 Introduction ........................................................................................................... 31
3.2 Theoretical Analysis of Spinning Rotor with Transverse Crack in Viscous
Medium .................................................................................................................. 32
3.2.1 Dynamic Analysis of Rotating Non-cracked Cantilever Rotor with
Additional Mass Partially Submerged in Viscous Medium ......................... 32
3.2.1.1 Equation of Fluid Velocities............................................................. 33
3.2.1.2 Analysis of Fluid Forces .................................................................. 36
3.2.1.3 Dynamic Response of the Spinning Rotor System .......................... 37
3.2.2 Dynamic Analysis of Rotating Multiple Cracked Cantilever Rotor Partially
Submerged in the Viscous Medium ............................................................. 45
3.2.2.1 Determination of the Local Flexibility and Local Stiffness Matrix
of a Cracked Rotor under Axial and Bending Loading .................... 45
3.2.3 Dynamic Response of Rotating Fixed-Fixed Rotor with Additional Mass
at Mid Span Submerged in the Viscous Medium ......................................... 57
3.2.3.1 Analysis of Rotating Non-Cracked Fixed-Fixed Rotor ................... 57
3.2.3.2 Analysis of Rotating Multiple Crack Fixed-Fixed Rotor ................. 63
3.3 Evaluation and Comparison of Experimental and Theoretical Analysis Result
for the Cantilever Rotor System .......................................................................... 69
3.4 Comparison and Authentication of Theoretical and Experimental Analysis
Results .................................................................................................................... 76
3.5 Discussion .............................................................................................................. 78
3.6 Summary ................................................................................................................ 79
4 Finite Element Analysis of Multiple Cracked Cantilever Rotor Partially
Submerged in Fluid Medium For Measurement of Dynamic Response .............. 80
4.1 Introduction ........................................................................................................... 80
4.2 Analysis of Finite Element Method using ANSYS ............................................... 81
4.3 Finite Element Analysis of Rotor with Transverse Cracks Partially Submerged
in the Viscous Fluid ............................................................................................... 82
4.3.1 Description of SOLID187 Element used for Solid Rotor ............................. 83
4.3.2 Description of FLUID30 Element used for Fluid Medium ......................... 84
4.3.3 Material Properties and Boundary Condition of Rotor and Viscous Fluid
medium ......................................................................................................... 85
4.4 Discussion .............................................................................................................. 95
4.5 Summary ................................................................................................................ 96
ix
5 Analysis of Fuzzy System for Detecting the Multiple Crack in Cantilever
Rotor .......................................................................................................................... 97
5.1 Introduction ........................................................................................................... 97
5.2 Fuzzy Logic System .............................................................................................. 98
5.2.1 Concept of Fuzzy Membership Function .................................................... 100
5.2.2 Designing the Fuzzy Logic Model using Fuzzy Rule ................................. 102
5.2.3 Modeling of Defuzzification Mechanism ................................................... 103
5.3 Analysis of Mamdani Fuzzy Logic Mechanism for Identification of Multiple
Crack in Rotor ...................................................................................................... 103
5.3.1 Designing the Mamdani Fuzzy Logic Mechanism for Identification of
Crack in Rotor ............................................................................................ 105
5.4 Analysis of Takagi-Sugeno Fuzzy Logic Mechanism for Identification of
Crack in Rotor ...................................................................................................... 115
5.5 Analysis of Hybrid Fuzzy Logic Mechanism for Identification of Multiple
Crack in Rotor ...................................................................................................... 117
5.6 Results and Discussion ........................................................................................ 118
5.7 Summary .............................................................................................................. 125
6 Analysis of Hybrid BPNN-RBFNN Neural Network for Identification of
Multiple Crack in Rotor Partially Submerged in the Viscous Medium ............. 126
6.1 Introduction ......................................................................................................... 126
6.2 Artificial Neural Network Technique .................................................................. 129
6.2.1 Learning Paradigms of Artificial Neural Network .......................................... 130
6.3 Analysis of Feed Forward Back Propagation Neural Network Controller
used for Multiple Crack Identification in Rotor .................................................. 131
6.3.1 Learning Back Propagation Technique ............................................................ 131
6.3.2 Neural Controller Mechanism .......................................................................... 132
6.4 Analysis of Radial Basis Function Neural Network used for Multiple Crack
Identification in Rotor .......................................................................................... 135
6.4.1 Radial Basis Function Neural Network Mechanism ................................... 135
6.4.1.1 Finding the Centers of RBF unit .................................................... 137
6.4.1.2 Finding the width of RBF unit ....................................................... 138
6.4.1.3 Finding the Weights ....................................................................... 138
6.4.1.4 Selection of H and q ....................................................................... 138
6.4.2 Radial Basis Function Neural Network for Finding the Crack Locations
x
and Depths in Rotor .................................................................................... 139
6.5 Hybrid BPNN-RBFNN Neural Network Mechanism for Finding the Multiple
Crack in Rotor ...................................................................................................... 140
6.6 Results and Discussion ........................................................................................ 141
6.7 Summary .............................................................................................................. 147
7 Analysis of Multiple Adaptive Neuro-Fuzzy Inference System for
Identification of Multiple Crack in Rotor ............................................................. 148
7.1 Introduction ......................................................................................................... 149
7.2 Analysis of Multiple Adaptive Neuro-Fuzzy Inference System for
Identification of Crack ......................................................................................... 150
7.3 Results and Discussion ........................................................................................ 155
7.4 Summary .............................................................................................................. 159
8 Analysis of Hybrid Fuzzy-Rule Base Technique for Multiple Crack
Identification in Rotor ............................................................................................. 160
8.1 Introduction ........................................................................................................ 160
8.2 Analysis of Rule-Base Technique for Identification of Multiple Crack in
Rotor .................................................................................................................... 161
8.2.1 Designing of Rule-Base Technique for Identification of Multiple Crack .. 161
8.3 Analysis of Hybrid Fuzzy-Rule Base Tecnique for Finding the Multiple Crack
in Rotor ................................................................................................................ 164
8.4 Results and Discussion ........................................................................................ 165
8.5 Summary .............................................................................................................. 169
9 Analysis & Description of Experimental Investigation ........................................ 170
9.1 Detail Specification of Apparatus used in the Experimental Analysis ............... 170
9.2 Experimental Procedure for the Analysis of Rotor System ................................. 175
9.3 Results and Discussion ........................................................................................ 176
10 Results and Discussion ............................................................................................ 178
10.1 Introduction ...................................................................................................... 178
10.2 Analysis of Results ............................................................................................ 178
10.3 Summary ............................................................................................................ 184
11 Conclusions and Scope for Future Research ........................................................ 185
11.1 Introduction ...................................................................................................... 185
11.2 Conclusions ....................................................................................................... 185
11.3 Scope for Future Research ................................................................................. 188

xi
Appendix-A .................................................................................................................... 189
Bibliography ................................................................................................................... 191
Dissemination ................................................................................................................. 202
Vitae ............................................................................................................................. 204
xii
List of Figures
3.1 Representation of whirling position of cantilever rotor ............................................. 33
3.2 Frequency Ratio (ω/ω0) Vs Non-dimensional Amplitude Ratio (δ*/ɛ*), Mild
Steel Rotor R1=0.01m, L=1.0m, q=12, RD= 0.055m,TD= 0.020m, MD = 1.0kg
for finite region ...................................................................................................... 39
3.3 Frequency Ratio (ω/ω0) Vs Non-dimensional Amplitude Ratio (δ*/ɛ*), Mild
Steel Rotor R1=0.01m, L=0.8m, q =12, RD = 0.055m,TD= 0.020m, MD = 1.0kg
for finite region ...................................................................................................... 40
3.4 Frequency Ratio (ω/ω0) Vs Non-dimensional Amplitude Ratio (δ*/ɛ*), Mild
Steel Rotor R1=0.01m, L=0.8m, RD = 0.055m,TD= 0.020m, MD = 1.0kg
for finite region ...................................................................................................... 40
3.5 Frequency Ratio (ω/ω0) Vs Non-dimensional Amplitude Ratio (δ*/ɛ*), Mild
Steel Rotor R1=0.01m, L=0.8m,q=12, ν=0.541stokes & M*=0.136, MD1 = 1.0kg,
MD2=0.75kg , MD3=0.50kg for finite region ............................................................. 41
3.6 Frequency Ratio (ω/ω0) Vs Non-dimensional Amplitude Ratio (δ*/ɛ*), Mild
Steel Rotor R1=0.01m, L=0.8m, q =12, ν =0.0633,0.541,2.9 stokes &
M*=0.127, 0.136,0.146, RD=0.055m, TD= 0.020m, MD=1.0kg for finite region ......... 42
3.7 Frequency Ratio (ω/ω0) Vs Non-dimensional Amplitude Ratio (δ*/ɛ*), Mild
Steel Rotor R1=0.01m, L=1.0m, q=12, RD= 0.055m,TD= 0.020m, MD = 1.0kg
for infinite region ................................................................................................... 43
3.8 Frequency Ratio (ω/ ω0) Vs Non-dimensional Amplitude Ratio (δ*/ɛ*), Mild
Steel Rotor R1=0.01m, L=0.8m, q=12, RD = 0.055m,TD= 0.020m, MD = 1.0kg,
for infinite region ................................................................................................... 43
3.9 Frequency Ratio (ω/ω0) Vs Non-dimensional Amplitude Ratio (δ*/ɛ*), Mild
Steel Rotor R1=0.01m, L=0.8m, q =12, ν=0.541stokes & M*=0.136,MD1=1.0kg,
MD2=0.75kg, MD3=0.50kg for infinite region ............................................................ 44
3.10 Frequency Ratio (ω/ω0) Vs Non-dimensional Amplitude Ratio (δ*/ɛ*), Mild
Steel Rotor R1=0.01m, L=0.8m, q=12, RD = 0.055m,TD= 0.020m, MD = 1.0kg, for
infinite region ...................................................................................................... 44
3.11(a) Geometry of a cantilever rotor with crack element .............................................. 46
3.11(b) Cross section of crack element .......................................................................... 46
3.11(c) Coupling force on the crack element .................................................................. 46
xiii
3.12 Frequency Ratio (ω/ω0) Vs Non-dimensional Amplitude Ratio (δ*/ɛ*), Mild
Steel Rotor R1=0.01m, L=0.8m, q=12, L1/L= 0.313, L2/L=0.563, RD = 0.055m,
TD = 0.020m, MD = 1.0kg for 44-Direction ............................................................ 52
3.13 Frequency Ratio (ω/ω0) Vs Non-dimensional Amplitude Ratio (δ*/ɛ*), Mild
Steel Rotor R1=0.01m, L=0.8m, q=12, L1/L= 0.313, L2/L=0.563, RD=0.055m,
TD=0.020m, MD = 1.0kg for 55-Direction .............................................................. 52
3.14 Frequency Ratio (ω/ω0) Vs Non-dimensional Amplitude Ratio (δ*/ɛ*), Mild
Steel Rotor R1=0.01m, L=0.8m, q=12, L1/L= 0.313, L2/L=0.563, RD = 0.055m,
TD= 0.020m, MD = 1.0kg ...................................................................................... 53
3.15 Frequency Ratio (ω/ω0) Vs Non-dimensional Amplitude Ratio (δ*/ɛ*), Mild
Steel Rotor R1=0.01m, L=0.8m, a1/D= 0.125, a2/D=0.150, L1/L= 0.313, L2/L=0.563,
RD = 0.055m,TD= 0.020m, MD = 1.0kg for 44-Direction ......................................... 54
3.16 Frequency Ratio (ω/ω0) Vs Non-dimensional Amplitude Ratio (δ*/ɛ*), Mild
Steel Rotor R1=0.01m, L=0.8m, q=12, a1/D= 0.125, a2/D=0.150, L1/L= 0.313,
L2/L=0.563, ν=0.541 & M*=0.136, RD = 0.055m, TD= 0.020m, MD = 1.0kg ............ 55
3.17 Relative Crack Position Vs Natural Frequency Mild Steel Rotor R1=0.01m,
L=0.8m, Relative crack depth a1/D=0.225, a2/D= 0.250, RD = 0.055m,
TD= 0.020m, MD = 1.0kg ...................................................................................... 56
3.18 Relative Crack Depth Vs Natural Frequency Mild Steel Rotor R1=0.01m,
L=0.8m, Relative crack depth L1/L=0.313,L2/L=0.563, RD=0.055m,
TD= 0.020m, MD=1.0kg ........................................................................................ 56
3.19 Full view of fixed-fixed rotor ................................................................................ 57
3.20 Frequency Ratio (ω/ω0) Vs Non-dimensional Amplitude Ratio (δ*/ɛ*), Mild
Steel Rotor R1=0.01m, L=1.0m, q=12, RD = 0.055m,TD= 0.020m, MD = 1.0kg ........ 60
3.21 Frequency Ratio (ω/ω0) Vs Non-dimensional Amplitude Ratio (δ*/ɛ*), Mild
Steel Rotor R1=0.01m, L=0.8m, q=12, RD = 0.055m,TD= 0.020m, MD = 1.0kg ........ 60
3.22 Frequency Ratio (ω/ω0) Vs Non-dimensional Amplitude Ratio (δ*/ɛ*), Mild
Steel Rotor R1=0.01m, L=0.8m, RD = 0.055m,TD= 0.020m, MD = 1.0kg .................. 61
3.23 Frequency Ratio (ω/ω0) Vs Non-dimensional Amplitude Ratio (δ*/ɛ*), Mild
Steel Rotor R1=0.01m, L=0.8m, q=12, ν=0.541stokes & M*=0.136,MD1=1.0kg,
MD2=0.75kg, MD3=0.60kg MD4=0.50kg ................................................................. 62
3.24 Frequency Ratio (ω/ω0) Vs Non-dimensional Amplitude Ratio (δ*/ɛ*), Mild
Steel Rotor R1=0.01m, L=0.8m, q=12, ν=0.0633,0.541, 2.9 stokes&M*=0.127,
0.136,0.146, RD=0.055m, TD= 0.020m, MD=1.0kg …….. .................................... 62
xiv
3.25 Schematic representation of multiple cracked fixed-fixed rotor submerged
in the viscous fluid ............................................................................................. 63
3.26 Frequency Ratio (ω/ω0) Vs Non-dimensional Amplitude Ratio (δ*/ɛ*), Mild
Steel Rotor R1=0.01m, L=0.8m, q=12, L1/L= 0.313, L2/L=0.563, RD = 0.055m,
TD= 0.020m, MD = 1.0kg for 44-Direction ...................................................... … 66
3.27 Frequency Ratio (ω/ω0) Vs Non-dimensional Amplitude Ratio (δ*/ɛ*), Mild
Steel Rotor R1=0.01m, L=0.8m, q=12, L1/L= 0.313, L2/L=0.563, RD = 0.055m,
TD= 0.020m, MD = 1.0kg for 55-Direction ......................................... ……………67
3.28 Frequency Ratio (ω/ω0) Vs Non-dimensional Amplitude Ratio (δ*/ɛ*), Mild
Steel Rotor R1=0.01m, L=0.8m, q=12, L1/L= 0.313, L2/L=0.563, RD = 0.055m,
TD= 0.020m, MD = 1.0kg ...................................................................................... 68
3.29 Frequency Ratio (ω/ω0) Vs Non-dimensional Amplitude Ratio (δ*/ɛ*),
Mild Steel Rotor R1=0.01m, L=0.8m, q=12, a1/D=0.125,
a2/D=0.150, L1/L=0.313,L2/L=0.563,ν=0.541Stokes, M*=0.136,
RD=0.055m, TD= 0.020m, MD=1.0kg.................................................................. 68
3.30 Schematic block diagram representation of experimental set up ........................... …69
3.31 Frequency Ratio (ω/ω0) Vs Non-dimensional Amplitude Ratio (δ*/ɛ*), Mild
Steel Rotor R1=0.01m, L=0.8m, q=12, RD= 0.055m, TD= 0.020m, MD = 1.0kg
for non-cracked rotor ........................................................................................... 70
3.32 Frequency Ratio (ω/ω0) Vs Non-dimensional Amplitude Ratio(δ*/ɛ*), Mild
Steel Rotor R1=0.01m, L=0.8m, q=12, RD= 0.0.55m, TD= 0.020m, MD = 1.0kg,
for non-crack rotor ...................................................................................... …….71
3.33 Frequency Ratio (ω/ ω0) Vs Non-dimensional Amplitude Ratio (δ*/ɛ*), Mild
Steel Rotor R1=0.01m, L=0.8m, q=12, RD = 0.55m,TD= 0.020m, MD = 1.0kg for
non-cracked rotor............................................................................................... 71
3.34 Frequency Ratio (ω/ ω0) Vs Non-dimensional Amplitude Ratio (δ*/ɛ*), Mild
Steel Rotor R1=0.01m, L=0.8m, q=12, a1/D= 0.125, a2/D=0.150, L1/L= 0.313,
L2/L=0.563 RD = 0.055m,TD= 0.020m, MD = 1.0kg for 44-Direction .............. …….72
3.35 Frequency Ratio (ω/ ω0) Vs Non-dimensional Amplitude Ratio (δ*/ɛ*), Mild
Steel Rotor R1=0.01m, L=0.8m, q=12, a1/D= 0.125, a2/D=0.150, L1/L= 0.313,
L2/L=0.563, RD = 0.055m, TD= 0.020m, MD = 1.0kg ............................................ 72
3.36 Frequency Ratio (ω/ω0) Vs Non-dimensional Amplitude Ratio (δ*/ɛ*), Mild
Steel Rotor R1=0.01m, L=0.8m, q =12,a1/D=0.250, a2/D=0.225, L1/L = 0.313,
L2/L=0.563, RD = 0.055m, TD= 0.020m, MD = 1.0kg for 44- Direction .................. 73
3.37 Frequency Ratio (ω/ω0) Vs Non-dimensional Amplitude Ratio (δ*/ɛ*), Mild
xv
Steel Rotor R1=0.01m, L=0.8m, q =12,a1/D=0.225,a2/D=0.150, L1/L = 0.313,
L2/L=0.563, RD = 0.055m, TD= 0.020m, MD = 1.0kg for 44- Direction .................. 73
3.38 Frequency Ratio (ω/ω0) Vs Non-dimensional Amplitude Ratio (δ*/ɛ*), Mild
Steel Rotor R1=0.01m, L=0.8m, q =12,a1/D=0.150,a2/D=0.125, L1/L = 0.313,
L2/L=0.563, RD = 0.055m, TD= 0.020m, MD = 1.0kg for 44- Direction ................... 74
3.39 Frequency Ratio (ω/ω0) Vs Non-dimensional Amplitude Ratio (δ*/ɛ*),Mild
SteelRotorR1=0.01m,L=0.8m,q=12,a1/D=0.250,a2/D=0.225, L1/L = 0.313,
L2/L=0.563, RD = 0.055m, TD= 0.020m, MD = 1.0kg for 55- Direction .................. 74
3.40 Frequency Ratio (ω/ω0) Vs Non-dimensional Amplitude Ratio (δ*/ɛ*), Mild
Steel Rotor R1=0.01m, L=0.8m, q =12, a1/D=0.225, a2/D=0.150, L1/L = 0.313,
L2/L=0.563, RD = 0.055m, TD= 0.020m, MD = 1.0kg for 55- Direction .................. 75
3.41 Frequency Ratio (ω/ω0) Vs Non-dimensional Amplitude Ratio (δ*/ɛ*), Mild
Steel rotor R1=0.01m, L=0.8m, q =12, a1/D=0.150, a2/D=0.125, L1/L = 0.313,
L2/L=0.563, RD = 0.055m, TD= 0.020m, MD = 1.0kg for 55- Direction .................... 75
4.1 Geometry of SOLID187 element ....................................................................... …83
4.2 Geometry of FLUID30 (3-D acoustic fluid) element ...................................... …….84
4.3 Frequency Ratio (ω/ω0) Vs Non-dimensional Amplitude Ratio (δ*/ɛ*), Mild
Steel Rotor R1=0.01m, L=0.8m, q =12, RD = 0.055m, TD= 0.020m, MD = 1.0kg
for No crack ............................................................................................... …….86
4.4 Frequency Ratio (ω/ω0) Vs Non-dimensional Amplitude Ratio (δ*/ɛ*), Mild
Steel Rotor R1=0.01m, L=0.8m, q=12, RD=0.055m,TD=0.020m, MD = 1.0kg
for virtual mass effect ................................................................................. …….87
4.5 Frequency Ratio (ω/ω0) Vs Non-dimensional Amplitude Ratio (δ*/ɛ*), Mild
Steel Rotor R1=0.01m, L=0.8m, q=12, a1/D= 0.125, a2/D=0.150, L1/L= 0.313,
L2/L=0.563, RD = 0.055m, TD= 0.020m, MD = 1.0kg for virtual mass effect ........... 87
4.6 Frequency Ratio (ω/ ω0) Vs Non-dimensional Amplitude Ratio (δ*/ɛ*), Mild
Steel Rotor R1=0.01m, L=0.8m, q=12, RD = 0.055m,TD= 0.020m, MD = 1.0kg
for Gap ratio effect ............................................................................................ 88
4.7 Frequency Ratio (ω/ ω0) Vs Non-dimensional Amplitude Ratio (δ*/ɛ*), Mild
Steel Rotor R1=0.01m, L=0.8m, q=12, a1/D= 0.125, a2/D=0.150, L1/L= 0.313,
L2/L=0.563, RD=0.055m,TD= 0.020m, MD = 1.0kg for 44-Direction ...................... 88
4.8 Frequency Ratio (ω/ω0) Vs Non-dimensional Amplitude Ratio (δ*/ɛ*), Mild
Steel Rotor R1=0.01m, L=0.8m, q =12,a1/D=0.250,a1/D=0.225, L1/L=0.313,
L2/L=0.563, RD=0.055m, TD=0.020m, MD=1.0kg for 44- Direction ......................... 89
4.9 Frequency Ratio (ω/ω0) Vs Non-dimensional Amplitude Ratio (δ*/ɛ*), Mild
xvi
Steel Rotor R1=0.01m, L=0.8m, q =12,a1/D=0.225,a1/D=0.150, L1/L = 0.313,
L2/L=0.563, RD =0.055m, TD=0.020m, MD=1.0kg for 44- Direction ........................ 89
4.10 Frequency Ratio (ω/ω0) Vs Non-dimensional Amplitude Ratio (δ*/ɛ*), Mild
Steel Rotor R1=0.01m, L=0.8m, q=12,a1/D=0.150,a1/D=0.125, L1/L=0.313,
L2/L=0.563, RD = 0.055m, TD= 0.020m, MD = 1.0kg for 44- Direction .................... 90
4.11 Frequency Ratio (ω/ω0) Vs Non-dimensional Amplitude Ratio (δ*/ɛ*), Mild
Steel Shaft R1=0.01m, L=0.8m, q=12,a1/D=0.250,a1/D=0.225, L1/L = 0.313,
L2/L=0.563, RD = 0.055m, TD= 0.020m, MD = 1.0kg for 55- Direction ................ …90
4.12 Frequency Ratio (ω/ω0) Vs Non-dimensional Amplitude Ratio (δ*/ɛ*), Mild
Steel Shaft R1=0.01m, L=0.8m, q =12, a1/D=0.225, a1/D=0.150, L1/L = 0.313,
L2/L=0.563, RD = 0.055m, TD= 0.020m, MD =1.0kg for 55- Direction ............ …….91
4.13 Frequency Ratio (ω/ω0) Vs Non-dimensional Amplitude Ratio (δ*/ɛ*), Mild
Steel Rotor R1=0.01m, L=0.8m, q =12, a1/D=0.150, a1/D=0.125, L1/L = 0.313,
L2/L=0.563, RD = 0.055m, TD= 0.020m, MD = 1.0kg for 55- Direction ........... …….91
5.1(a) Triangular membership function ............................................................... …….100
5.1(b) Gaussian membership function ........................................................................ 100
5.1(c) Trapezoidal membership function .................................................................... 100
5.2 General structure of fuzzy logic system ............................................................ 102
5.3(a) Triangular fuzzy controller model .................................................................... 104
5.3(b) Gaussian fuzzy controller model ...................................................................... 104
5.3(c) Trapezoidal fuzzy controller model .................................................................... 105
5.4 Membership function for traingular fuzzy controller model ............................. …109
5.5 Membership function for gaussian fuzzy controller model ................................... 110
5.6 Membership function for trapzoidal fuzzy controller model ............................... 111
5.7 Resultant values of first and second relative crack depth and crack locations
from triangular membership function while activated the fuzzy rules no 5
and 18 of Table 5.2 for the rotor ....................................................................... 112
5.8 Resultant values of first and second relative crack depth and crack locations
from Gaussian membership function while activated the fuzzy rules no 5
and 18 of Table 5.2 for the rotor....................................................................... 113
5.9 Resultant values of first and second relative crack depth and crack locations
from Trapezoidal membership function while activated the fuzzy rules no 5
and 18 of Table 5.2 for the rotor ......................................................................... 114
5.10 Zero-order T-S fuzzy Logic system with two inputs and two rules [208] ........... …116
xvii
5.11 Hybrid fuzzy architecture for crack identification ........................................ …….117
6.1 Model of neuron of artificial neural network ............................................... …….129
6.2 Back propagation Technique ...................................................................... …….132
6.3 Multi-layer feed forward back propagation neural network model for crack
identification ................................................................................................... 133
6.4 RBFNN model for identification of crack .......................................................... 139
6.5 Hybrid BPNN-RBFNN neural network architecture for multiple crack
identification ................................................................................................... 141
7.1 Bell-shaped membership function ..................................................................... 152
7.2(a) Representation of multiple ANFIS controller for crack identification ................ 154
7.2(b) Adaptive Neuro-fuzzy inference system (ANFIS) for crack identification ............ 155
8.1 Rule base controller for identification of multiple crack .................................... …163
8.2 Hybrid fuzzy-rule base technique for identification of multiple cracks .......... …….164
9.1 View of experimental setup ....................................................................... …….172
9.1(a) Ultrasonic sensor ..................................................................................... …….172
9.1(b) Aurdino micro-controller ................................................................................ 173
9.1(c) Bread board .................................................................................................... 173
9.1(d) Variac ............................................................................................................ 173
9.1(e) Power motor ................................................................................................... 174
9.1(f) Tachometer ..................................................................................................... 174
9.1(g) Display device .................................................................................................. 174
A1 FEA model of crack rotor .......................................................................... …189
A2 FEA model of rotor with fluid medium ................................................ …….189
A3 FEA solution of Rotor with fluid medium in axisymmetric position .. …….190
A4 FEA solution of Rotor with fluid medium ........................................... …….190
xviii
List of Tables
3.1 Physical properties of cantilever rotor ............................................................... 45
3.2 Properties of three different type of viscous fluid ............................................... 45
3.3 Comparison between numerical and experimental results for effect of
different viscous medium .................................................................................... 76
3.4 Comparison between theoretical and experimental results for ν=0.541
stokes & M*=0.136 for virtual mass effect (non-cracked rotor) ......................... 77
3.5 Comparison between theoretical and experimental results for ν=0.541
stokes, M*=0.0.136, L1/L=0.313,L2/L=0.563, a1/D=0.125, a2/D=0.150
for virtual mass effect .......................................................................................... 77
3.6 Comparison between theoretical and experimental results for v=0.541stokes,
M*=0.136 ............................................................................................................ 77
3.7 Comparison between theoretical and experimental results for crack
positionL1/L=0.313,L2/L=0.563,a1/D=0.125,a2/D=0.150,v=0.541
stokes, M*=0.136 for 44- Direction .................................................................... 77
3.8 Comparison between Theoretical and experimental results for crack position
L1/L=0.313, L2/L=0.563 ..................................................................................... 78
4.1 Material properties of mild steel rotor ................................................................. 85
4.2 Physical properties of viscous fluid medium (for water) .................................... 86
4.3 Comparison between theoretical, experimental and FEA results for effect of
different viscous medium .................................................................................... 92
4.4 Comparison between theoretical, experimental and FEA results for
ν=0.541stokes, M*=0.136 ................................................................................... 92
4.5 Comparison between theoretical, experimental and FEA results for
a1/D= 0.125, a2/D=0.150, L1/L = 0.313, L2/L=0.563, ν=0.541stokes,
M*=0.0.136 (virtual mass effect) ........................................................................ 92
4.6 Comparison between theoretical, experimental and FEA results for ν =0.541
stokes, M*=0.136 (Non-cracked rotor) ............................................................... 93
4.7 Comparison between theoretical and experimental results for a1/D= 0.125,
a2/D=0.150, L1/L = 0.313, L2/L=0.563, ν=0.541stokes, M*=0.136
(44-Direction of crack) ........................................................................................ 93
4.8 Comparison between theoretical, experimental and FEA results for
xix
L1/L = 0.313, L2/L=0.563 .................................................................................... 94
5.1 Description of fuzzy linguistic variable ............................................................ 106
5.2 Example of some fuzzy rules out of several fuzzy rules for the rotor ............... 108
5.3 Comparison of the results obtained from Mamdani fuzzy gaussian, Mamdani
fuzzy trapezoidal, Mamdani fuzzy triangular model and experimental analysis for
the rotor ............................................................................................................. 120
5.4 Comparison of the results obtained from fuzzy gaussian, FEA, theoretical
and experimental analysis for the rotor ............................................................. 121
5.5 Comparison of the results obtained from Sugeno fuzzy gaussian, Sugeno fuzzy
trapezoidal, Sugeno fuzzy traingular model and experimental analysis for the
rotor ................................................................................................................... 122
5.6 Comparison of the results obtained from Sugeno fuzzy, FEA, theoretical and
experimental analysis for the rotor ................................................................... 123
5.7 Comparison of the results obtained from Mamdani fuzzy, Sugeno fuzzy,
Hybrid fuzzy model and experimental analysis for the rotor ............................ 124
6.1 Comparison of the results obtained from BPNN, FEA and experiment
analysis for the rotor .......................................................................................... 143
6.2 Comparison of the results obtained from RBFNN, FEA and experimental
analysis for the rotor ......................................................................................... 144
6.3 Comparison of the results obtained from BPNN, RBFNN, Mamdani fuzzy
gausian model and experimental analysis for the rotor. .................................... 145
6.4 Comparision of the results obtained from BPNN, RBFNN, Hybrid
BPNN-RBFNN model and experimental analysis for the rotor ........................ 146
7.1 Comparison of the results obtained from MANFIS, RBFNN, Sugeno gaussain
fuzzy model and experimental analysis for the rotor ........................................ 157
7.2 Comparison of the results obtained from MANFIS, FEA, theoretical and
experimental analysis for the rotor .................................................................... 158
8.1 Comparison of the results obtained from rule-base technique, Hybrid
fuzzy-rule base, MANFIS and experimental analysis for the rotor .................. 167
8.2 Comparison of the results obtained from Hybrid fuzzy-rule base model, FEA,
theoretical, MANFIS and experimental analysis for the rotor .......................... 168
9.1 Detail Description and Specifications of the apparatus used in the
experiments ....................................................................................................... 171
xx
Nomenclatures
a1 a2 Depth of crack
A1 Cross-sectional area
B Width of Beam
b Half width of crack in case of rotor
D Diameter of rotor
E Young’s modulus of rotor
EI Bending stiffness of rotor
Fx, Fy Fluid forces on rotor in x and y-axis direction respectively
G Shear modulus
I Moment of inertia
J Strain energy release rate
Ks Stiffness of rotor
K44 Stiffness of cracked rotor in 44-direction
K55 Stiffness of cracked rotor in 55-direction
K1,i Stress intensity factor for Pi loads
Kij Load flexibility matrix elements
L Length of rotor
L1 L2 Location of crack in rotor
m Fluid mass displaced by the rotor par unit length
ms Mass of the rotor per unit length
M Equivalent mass of fluid displaced by a rotor
Ms Equivalent mass of rotor
Ms1=MD Mass of disc
Ms2 Mass of rotor
M1M Equivalent mass of fluid displaced by a cracked rotor in 44-direction
M2M Equivalent mass of fluid displaced by a cracked rotor in 55-direction
M1MS Equivalent mass of a cracked rotor in 44-direction
M2MS Equivalent mass of a cracked rotor in 55-direction
xxi
Mi Compliance constant
P Fluid Pressure
Pi Load
q Gap ratio ((R2-R1)/R1)
R1 Radius of rotor
R2 Radius of fluid filled container
RD Radius of disc
ua Radial flow velocity at point ‘A’
va Tangential flow velocity at point ‘A’
β Relative crack depth (a1/D)
α Relative crack location (L1/L)
Whirling radius
* Dimensionless amplitude * * * *
1 21,2 ,n
Eccentricity
1 Eccentricity along 44-direction
2 Eccentricity along 55-direction
Coefficient of kinematics viscosity
1 Poisson’s ratio
Density of fluid
1 Mass density of material
Rotating speed
0 Fundamental natural frequency of the rotor without disc
n Natural frequency
0r Critical speed (1st ) of the rotor
xx Fundamental natural frequency of a cracked shaft in x-direction
yy Fundamental natural frequency of cracked shaft in y-direction
44 Fundamental natural frequency of a cracked shaft in 44- direction
xxii
55 Fundamental natural frequency a cracked shaft in 55- direction
crack Natural frequency of cracked rotor
Angular velocity of whirling
44-
direction
Direction perpendicular to the crack
55
direction
Direction along the crack
ANN Artificial Neural Network
BPNN Back propagation neural network
RBFNN Radial basis function neural network
MANFIS Multiple Adaptive Neuro-Fuzzy Inference System
Note: - The symbols and abbreviations other than above have been explained in the text.
1
Chapter 1
Introduction
The rotating device plays a significant role in many industries and several engineering
fields. Not only it’s used in large machines such as pumps or turbines in power generation
plants and large vehicles such as ships or airplanes, but it is also used in small machines in
factories, automobiles, and computer hard drives. One of the dangerous components in the
rotating machinery is the rotor since it is an important part that conveys power to the other
device to do work on the machines. Cracks can arise on the rotor from a variety of causes,
such as bending and torsion stresses. Accordingly machine failure due to cracked rotor can
compromise the safety of human beings and also due to crack occurrence more
maintenance and operating costs are required. The current chapter highlights the
methodology that is being used for analysis of cracked rotor. The first section introduces
the motivation in the area of analysis of dynamic behavior of faulty rotor. The final
segment of the present chapter provides an outline of each chapter of the dissertation.
1.1 Motivation of the Research Work
The vibration analysis of the rotor has been given great significance in the area of
vibration due to the frequent catastrophe of such rotor in engineering applications. The
development of health monitoring techniques is most significant to avoid sudden and
unexpected failure of the rotor systems. The rotor is one of the most important elements of
the machines. Any distraction present in this rotor may lead to the loss of assets and also
the loss of life. It is, therefore, most important to ensure the safe and sound performance of
the rotor by periodic monitoring. In the literature survey, many methods are available for
assessment of crack present in the rotor. But not reported in detailed for the analysis of
rotating cracked rotor in the fluid medium. Furthermore, when a rotor rotates with
transverse crack submerged in a viscous fluid medium, then it is very difficult and
complicated to analyses the rotor. In the present analysis, an effort has been taken to
develop a tool using the vibration response of non-cracked and cracked rotor with the help
of theoretical analysis, experimental analysis, FE analysis and artificial intelligence
Chapter 1 Introduction
2
technique.The AI techniques are modeled with an objective of fast and accurate
measurement of cracks present in the rotor. Fuzzy logic system (FLC), neural network
model and multiple ANFIS models have been designed and analyzed in current research
for prediction of multiple cracks present in the rotor partially submerged in the viscous
medium to ensure the smooth and safe operation by arresting the vibration response. To
develop experimental setup to perform the experimental exercises for validating the results
obtained from the above mentioned soft computing techniques.
1.2 Aims and Objectives of the Proposed Research Work
It is essential that rotor must be safe and function properly throughout service life but
cracks commence a breakdown in the rotor. The presence of crack is a crucial threat in the
rotor. It is a well-known circumstance that vibration characteristics of the rotor change
because of an existence of crack and viscous fluid. It has been noticed that the existence of
the cracks in rotor leads to catastrophic failure, operative failure as well as early failure.
The numbers of researches are reported on the dynamic analysis of rotor and mostly on the
vibration analysis of cracked rotor. The vibration behaviour (i.e. Natural frequency and
amplitude) of the rotor varies due to the occurrence of crack and viscosity of the fluid
medium. The change in vibration response has been used by the investigator as one of the
principles of the fault diagnosis for the rotor. In general, this technique can be very helpful
for crack identification in the rotor partially submerged in the fluid medium. In the present
examination, many literatures available so far have been studied and investigated.The
aims and objectives for the research towards analysis of dynamic behaviour of rotor with
multiple transverse cracks partially submerged in the viscous fluid are summarized below:
Theoretical investigations of the cantilever and fixed-fixed rotor with multiple
transverse cracks partially submerged in the viscous fluid medium have been
accomplished to evaluate the dynamic responses.
To measure the vibration signature of non-cracked and cracked cantilever rotor,
influence coefficient strain energy method has been used.
To analyse the influence of fluid forces on the rotor, Navier-Stokes equation has
been used.
Development of the experimental test rig to perform experimental exercises to
obtain the vibration behaviour (i.e. Natural frequency and amplitude) of the
Chapter 1 Introduction
3
cantilever rotor with multiple transverse cracks immersed in the different fluid
medium.
Finite element analysis using ANSYS 14.0 tool to determine the dynamic responses
of the non-cracked and cracked cantilever rotor partially submerged in the viscous
fluid medium are to be applied.
Design and development of the fault diagnosis tool for multiple crack identification
in rotor using the intelligent expert systems such as fuzzy logic system, adaptive
neural network, MANFIS and rule-base technique are to be carried out.
1.3 Methodologies Applied for Proposed Research Work
The methodologies with the particular steps applied for proposed research work is
summarized as follows:
Study of the various techniques applied to vibration analysis of rotor with transverse
cracks in the literature survey is carried out.
Theoretical investigation of the cantilever and fixed-fixed rotor with multiple
transverse cracks partially submerged in the viscous fluid medium has been
accomplished to evaluate the dynamic responses in both transverse directions (i.e. 44
and 55-direction) of crack in rotor.
Measuring the vibration signature of non-cracked and cracked cantilever rotor using
Influence coefficient strain energy method.
Consideration at the variation of the crack orientation of the rotor to find out their
effect on the dynamic characteristics of rotor immersed in the viscous fluid medium.
Analyse the influence of fluid forces on the rotor using Navier-Stokes equation.
Determination of the local flexibility at the vicinity of crack positions in rotor using
the stiffness matrix.
Application of Finite element analysis using ANSYS 14.0 tool to determine the
dynamic responses of the non-cracked and cracked cantilever rotor partially
submerged in the viscous fluid medium.
Development of the Mamdani fuzzy and Takagi-Sugeno fuzzy architecture for finding
the multiple cracks in the rotor.
Hybridization of the Mamdani fuzzy and Takagi-Sugeno fuzzy to adjust and tune the
input/output membership function parameters of the fuzzy controller. This developed
Chapter 1 Introduction
4
hybrid fuzzy system improves the performance of fault diagnosis tool for finding the
multiple cracks in rotor in viscous fluid.
Design of an adaptive neural network (i.e. BPNN and RBFNN) architecture for
identify the multiple crack in rotor.
Development of the MANFIS controller for detecting the cracks in rotor.
Integration of the fuzzy controller model with the rule-base technique called as hybrid
fuzzy-rule base technique for detecting the multiple crack locations and depths in
cantilever rotor.
Building an experimental setup for performing the experiments to evaluate the
vibration behaviour of cracked cantilever rotor submerged in the viscous medium.
The obtained results from the proposed techniques which cited above are to be
authenticated with the developed experimental setup.
1.4 Novelty of Proposed Research Work
In literature survey, it is found that the most of the researchers have applied the various
methods for vibration analysis of the static or dynamic behaviour of the rotor with
transverse crack in air medium. However, few researchers have reported the vibration
analysis of damaged structures in viscous fluid medium in dynamic condition and have not
considered the artificial intelligence system for fault diagnosis of rotating structures.
The novelty of this dissertation is dynamic analysis of rotor with multiple transverse
cracks partially submerged in the viscous medium.The artificial intelligence technique
such as fuzzy logic system (FLC), adaptive neural networks, multiple adaptive neuro
fuzzy inference system (MANFIS) and rule-base technique have been design and
developed for the identification of multiple cracks using the dynamic response of rotating
multiple cracked rotor system in the viscous fluid medium.
In this research work, the application of hybrid fuzzy technique and rule-base technique
for the diagnosis of multiple cracks in rotor has been carried out. Beside, this rule-base
controller is integrated with the fuzzy controller to adjust and optimize the antecedent and
consequent parameters of the fuzzy membership function and it is not found during the
literature survey.
Chapter 1 Introduction
5
1.5 Outline of the Research Work
In this thesis outline of the research work is distributed into eleven chapters. The analysis
carried out in the current research for investigation of the effect of multiple crack locations
and depths on the mechanical impedance of the rotor partially submerged in the viscous
fluid medium are depicted chapter wise as follows.
Chapter 1 presents the influence of transverse crack on the rotor in different
engineering or industrial applications. It also discusses the methods actually
implemented by the engineering and scientists to examine the faults or damages in
various engineering or industrial applications. This chapter also describes the
motivations and objectives of the investigation along with the prominence of the
proposed research.
Chapter 2 introduces the literature review of the vibration analysis of rotor with
transverse cracks, partially submerged in the viscous fluid medium using different
methodology, FEM, and Artificial intelligent techniques. This chapter also carries the
classification of methodologies in the area of vibration analysis of rotor with different
type of crack (i.e. transverse and breathing crack)
Chapter 3 investigates the vibration behaviours of cantilever and fixed-fixed rotor
with multiple transverse cracks, partially submerged in the viscous fluid medium
using the influence coefficient method and the strain energy release rate. The Navier-
Stokes equation is used to analyse the external fluid forces. The presence of crack
generates local flexibility at the vicinity of crack.Vibration analysis has been
accomplished to evaluate the dynamic behaviour of the non-cracked and cracked rotor
submerged in the different viscous medium. The results and discussion have been also
presented in this segment. Finally, the theoretical and experimental analysis results
have been compared with the results from theoretical investigation for authentication.
Chapter 4 introduces the FE analysis of the cantilever rotor carrying multiple
transverse cracks partially submerged in the viscous fluid medium using ANSYS 14.0
tool to measure the dynamic response. The results of FE analysis are compared with
the obtained results of theoretical and experimental analysis for authentication.
Chapter 5 discuses the theory of the fuzzy logic system using the Mamdani, Takagi-
Sugeno fuzzy and hybrid fuzzy controller system for prediction the relative crack
depth and locations. Triangular, Trapezoidal and Gaussian membership functions
Chapter 1 Introduction
6
based intelligent system with detail design are briefly discussed. The obtained results
of fuzzy controller are compared with the results from the experimental investigation.
Chapter 6 introduces the hybrid BPNN-RBFNN neural network methodologies for
multiple crack identification in rotor. The results of the BPNN, RBFNN and hybrid
BPNN-RBFNN neural network are discussed in detail.
Chapter 7 introduces the ANFIS method for forecasting of relative crack locations
and depths by means of dynamic response of multiple cracked rotor.The obtained
results from the fuzzy logic system, neural network, MANFIS, theoretical and
experimental investigation have been reported.
Chapter 8 discusses the hybrid fuzzy-rule base technique for the detection of crack
locations and crack depths in rotor.
Chapter 9 presents the details of the experimental procedure along with the
developed experimental setup for the vibration analysis. Finally, the experimental
analysis results have been obtained and discussed in detail.
Chapter 10 presents a comprehensive review and analysis of outcomes obtained from
various proposed methods cited in the proposed investigation.
Chapter 11 depicts the conclusions obtained from the investigation carried out in the
present research and recommendations for the future scope of research work in the
similar field.
7
Chapter 2
Literature Review
This chapter presents the review of research work associated with the analysis of dynamic
behavior of the cracked structure (i.e. rotor, beam, plate) and the progress of crack
identification tool in damaged structures. In the last few decades, improvement has been
made in the field of crack diagnosis of rotor partially submerged in a viscous medium has
been described. Finally, the applications of artificial intelligence techniques for crack
identification and prediction are discussed from the past and recent developments.
2.1 Introduction
The literature review section introduces the investigation of the available research work
constrained to the field of damage detection and characterization approach and model
testing for engineering structure. The review commences with the depiction of altered
dynamic analysis technique employed for identification of crack. Subsequently, vibration
analysis of rotating cracked rotor, damage detection approaches to develop fault diagnosis
tool utilizing the classical method, finite element method, Hilbert-Huang transform
method and wavelet techniques are discussed. The artificial intelligence techniques (i.e.
Fuzzy logic system, neural network, MANFIS, rule base technique and hybrid technique)
can be designed and developed for the crack identification of the vibrating structure(i.e.
rotor, plate, and beam).
The main goal of the current research is to propose an artificial intelligence
methodologies, which is able to predict the existence of multi-crack in the rotor with
considerably high precision and less computational time.The potential directions for
investigation can be acquired from the exploration of the literatures mentioned in current
chapter. From the available research works, it is perceived that the knowledge related to
crack identification in various systems differs extensively.In spite of all, there is an
extensive discrepancy in the enhancement of crack detection technique.
Chapter 2 Literature Review
8
2.2 Analysis of Differnent Methodologies for Crack
Identification in Rotor
2.2.1 Classical Methods for Identification of Crack
The enhancement of methodology for crack identification in real world establishes the
most significant inclination in the present research work on crack identification.
Investigators have concentrated on many methods based on the vibration analysis for
detection of damage in several sectors of engineering structure which is efficiently used
for health monitoring in a faulty system.The recent methods adapted for fault diagnosis
are outlined below.Dimarogonas [1] has presented a review article on several fault
detection techniques reported by the researcher (1971-1993).Doebling et al. [2] have
presented the detailed review of vibration based damage identification and structural
health diagnosis methods up to 1996. Kastsikadelis and Tsiatas [3] have done the
nonlinear dynamic analysis of the bernouli-eular beam with variable stiffness undergoing
large deflections and nonlinear boundary conditions.They have derived the governing
equations in both deformed, and undeformed configuration and error of the two
approaches are studied.Gams et al.[4] have presented the vibration analysis of highly
flexible elastic planar beams using finite element analysis. They have developed the
equation of motion from the Hamilton principle including only strain variable, and
Galerkin type finite element discretization is applied.
Chung and Yoo [5] have discussed the vibration based analysis of a cantilever beam using
the finite element formulation. They have applied the stretched deformation instead of the
conventional axial deformation based upon the dynamic modelling and obtained the three
differential equation using the Hamilton’s principle.Cai et al. [6] have applied the
Hamilton theory and Finite element method for the vibration based analysis of a flexible
hub beam system carrying a mass at the tip of free end..Chang and Liu [7] have employed
the finite element analysis with consideration of effect of longitudinal deflection and
inertia for analysis of vibration characteristics of non-linear beam subjected to moving
load.Coupled equation of longitudinal and transverse deflection calculated based on the
Bernoulli-Euler hypothesis. Galerkin method with the finite element method is used to
calculate the statical dynamic response of beam. They have used implicit direct integration
method for calculating the non-linear system differential equation.Li et al. [8] have
developed a finite element formulation with generalized degree of freedom for the
Chapter 2 Literature Review
9
dynamic analysis of plates and beam with varying cross-section in a continuous or
discontinuous manner. They have simplified the derivations of finite element or finite strip
formulation applying the second order polynomial. The local displacement and global
displacement field of an element are modeled using interpolating polynomials and
quadratic B-spline respectively.Fedeliński [9] has reported the analysis of cracked
structure using boundary element method. However, the crack growth of structure with
variable and constant velocity, which is depends upon the fracture condition of model.
Orhan [10] has developed the free and forced vibration based analysis method to finding
the crack position and crack depth in the cracked beam. Natural frequencies are obtained
from the free vibration analysis.Harmonic response has been obtained on the force
appliance point.The changes in the natural frequency and harmonic responses
corresponding to changes in crack depth and location. Ghoneam [11] has reported the
numerical and experimental methodologies for the analysis of dynamic behavior of the
cracked laminated composite beam.They have considered crack location, crack depth,
various number laminates and boundary conditions as main variable parameters.
Lin [12] has reported the vibration based analysis of multiple span beam carrying a
different concentrated element using the numerical assembly method. He has derived the
coefficient matrices for the pinned support, intermediate concentrated elements, applied
force, right-end and left-end support of a beam. Lin and Wu [13] have discussed an Eigen
analysis problem regarding planar closed frame structure which is dynamically analyzed
by applying the hybrid numerical method.This is useful for numerical execution of a
transfer matrix solution to the analytical equation of motion. Eigen value can be calculated
by the continuation of the non-trivial solution and considered for the correlation between
the first section and the last section of the closed structure. Fotouhi [14] has studied the
vibration analysis of uniform cantilever beam with large deflection using the Finite
Element approach. He has set the three objectives for this investigation. The first objective
was to detail the behavior of the problem as it converts the linear to a nonlinear problem
and the Second objective was to implement the finite element code for the particular
problem. The third objective was to investigate the stability of particular evenness position
with the help of a nonlinear dynamic analysis.They have evaluated the stresses, strains,
forces and time varying displacements in the flexible beam due to transient, harmonic and
static load. Banerjee [15] has presented the proposed the dynamic stiffness method, for
vibration based analysis of beam moving mass system and combined the stiffness dynamic
matrix and spring mass element of the beam, which is used to prepare the eigen value
Chapter 2 Literature Review
10
problem for free vibration analysis. He has determined the vibration response (i.e.natural
frequencies and mode shape) of a cantilever beam attached with spring-mass at the tip of
free end using the wittrick-Williams algorithm for.Xiang et al.[16] have proposed the
combination of wavelet based element and genetic algorithm(GA) method to identified the
crack in the shaft. The cracked shaft is modeled using the wavelet based element to
acquire a definite frequencies. They have used the three definite measured frequencies to
identify the crack location and crack depth with the help of a genetic algorithm. For the
inverse problem analysis, GA is used to rectify the error in frequencies which is obtained
by the numerical and experimental analysis. El-saeidy [17] has employed the finite
element formulation for vibration based analysis of a spinning shaft with or without non-
linear boundary condition subjected to a moving mass load. The equation of motion is
derived by utilizing the Lagrange's equations, which is sequentially decoupled using
modal analysis articulate in the normal co-ordinate representation.
Fu et al. [18] have investigated the non-linear dynamic stability of a spinning cracked
shaft carrying a disk in mid span. The standard unstable region is established by Floquet
theory and Runge-Kutta method.They found that by increasing the thickness of the disc,
the critical speed of shaft and area of an unsteady region are slightly decreased. Sekhar
and Prasad [19] have studied the vibration behavior of the rotor-bearing system with slant
crack using the finite element analysis. They have developed the stiffness matrix of a slant
cracked element. It is successfully utilized in the Finite Element Method analysis of the
rotor bearing system. Jun [20] has reported the vibration based analysis of rotor with
transverse crack subjected to bending moment at crack location. Complex transfer matrix
is used to expresses the equation of motion. The additional slope is considered as an
excitation source. The dynamic and gravity–induced static bending moment are
systematically articulated as the function of the additional slope at the crack. Han and Chu
[21] have employed the Bolotin’s and Harmonic balance method to investigate the steady-
state response and instability of a rotating shaft including an elliptical front crack. In this
article the breathing effect on the crack shaft studied. They have developed the local
flexibility matrix on the crack of the shaft and the equation of motion of cracked shaft
system formulated using the assumed mode method.Rajab and Al-Sabeeh [22] have
investigated the vibration behavior of the crack Timoshenko shaft. They have developed
the analytical expressions by crack modelling as shear load and bending moment
agreements of incremental strain energy using J-integral concept from fracture mechanics.
They have computed the vibration response of the shaft having transverse crack using
Chapter 2 Literature Review
11
characteristics equation of the cracked shaft. Tsai and wang [23] have proposed a novel
methodology to detect the position and size of the stationary cracked shaft. They have
employed the transfer matrix method which is solved based on the Timoshenko beam
theory to determine the dynamic response of the shaft and predicted the crack from the
difference of the fundamental modes between the uncracked and cracked shaft.
Additionally, the size of crack is recognisesd from the deviations of the crossponding
natural frequency. Singh and Tiwari [24] have discussed the transverse frequency
response function for investigating a multi-cracked shaft system.They have developed
two-stage identification method which recognizes a number of cracks, sizes of crack and
their location in the shaft. The finite element methods based on the Timoshenko beam
theory are utilized to analyze the transverse forced vibrations of a non-rotating cracked
shaft in two orthogonal planes.
Papadopoulos and Dimarogonas [25] have studied a coupling of longitudinal and bending
vibration of a rotating shaft carrying a transverse surface crack. Nerantzaki and
katsikadelis [26] have discussed the nonlinear vibration based analysis of round plates
with changeable thickness with large deflection using boundary element technique.This
technique is based upon the theory of analog equation which changes the principal
coupled non-linear equation with flexible constant. Hashemi et al. [27] have presented a
vibration based dynamic analysis of spinning thick plate using the FEM formulation and
also used the Mindlin plate theory and second order strain displacement combined for
modeling the plate.They have derived the non-linear governing equation of motion by the
Kane dynamic method which includes Coriolis effect and coupling between in plane and
out of plane deformation.
Si et al. [28] have suggested the Rayleigh-Ritz technique for analysis of dynamic behavior
of baffled rectangular cracked plate subjected to an infinite water region. Displacement
trail function is expressed by adding mass density which is found by using the Green
function approach. Hsu [29] has proposed the differential quadrature method to developed
the equation of motion for a Bernoulli's Euler beam with a single transverse crack under
condition of axial loading. Jun et al.[30] have reported the dynamic analysis of rotor with
breathing crack. The equation of motion is developed for breathing cracked rotor based
upon the fracture mechanics. The circumstances for crack opening and closing are derived
with the help of switching crack model. They have estimated the cross-coupled stiffness’s
and direct stiffness using the concept of fracture mechanics by considering the partial
opening and closing behavior of a breathing crack. Darpe et al.[31] have presented an
Chapter 2 Literature Review
12
analysis of the Jeffcott rotor carrying two transverse cracks. Based on the concepts of
fracture mechanics stiffness of the rotor is determined. They have studied the influence of
the interface of the two transverse cracks on the and on the unbalance response and
breathing behavior of the rotor.Takahasi [32] has applied the transfer matrix approach for
the vibration and instability analysis of a cracked non-uniform Timosinko shaft subjected
tangential force which is concentrated over the center line with an axial force. They have
determined the natural frequency, critical flutter load considers the effect of varying cross-
section, crack depth, crack position and stiffness of the cantilever cracked beam.
Buśkiewicz [33] has presented the dynamic analysis of the beam with moving boundary
conditions using the Finite Difference Method. Also, they have studied the transfer of
energy between the vibrating beam and moving support under assumption zero slopes of
the elastic beam line at the moving support. Hamilton’s principle are used to express the
equation of motion to depict the interaction between elements the system. Nahvi and
Jabbari [34] have developed a method to identify the crack position in the beams based on
experimental modal analysis results.The finite element model of the beam was updated
using the obtained result of experimental analysis.They have formulated the stiffness
matrix of a cracked beam element consideration of bending and shearing forces.
Hwang and Kim [35] have proposed the frequency response method to detect the locations
and intensity of crack.This method detects the position and severities of crack by reducing
the difference between the test and analytical FRFs. Binici [36] has proposed the novel
method for determining the Eigen frequency and mode shapes of multiple cracked beams,
which subjected to axial force.Çam et al.[37] have reported the vibration based analysis of
the cracked beam structure. They have determined the position and depth of cracks with
the help of analyzing the vibration signal.Also, they have used the ANSYS software to
simulate the problem. Jun and Gadala [38] have examined the dynamic characteristics of
the rotor carrying breathing crack. The additional slop is used to consider the breathing
crack and equation of motion as one of the input to create the bending moment at the crack
position. They have evaluated the additional slope by integration on the crack position
based on the concept of fracture mechanics and transfer matrix method is employed to
obtain the response of the crack rotor.
Prokić and Lukić [39] have proposed the Benscoter’s theory for analyzing the dynamic
response of thin-walled beam of the closed cross-section. They have derived the
differential equation of motion considering the virtual work due to variation in
displacement. Saavedra and Cuitino [40] have established an innovative element stiffness
Chapter 2 Literature Review
13
matrix on the crack element using the theory of linear fracture mechanics for the analysis
of the cracked multi-beam system. The function of Strain energy density is employed to
determine the flexibility that the crack generates in its area.They have used the Hilbert,-
Hughes -Taylors (HHT)integration technique for deriving the equation of motion. Chen
and Chen [41] have investigated the instability of cracked rotor subjected to an axial
compressive force the and also, considered the influence of the crack on the whirling
speeds of the shaft. They have employed Finite element method (FEM) to achieve the
numerical results.Qian et al. [42] have suggested the finite element formulation for
analysis the dynamic behavior of the cracked beam. They have used stress intensity factor
to developed the element stiffness matrix of a cracked beam.
Sinou et al.[43] have discussed the effect of transverse breathing crack on the nonlineaner
behavior of rotating shaft using the alternate frequency /time domain technique. They have
determined the non-linear behavior of cracked rotor by modelling the crack with truncated
Fourier series. Song et al.[44] have applied the scaled boundary finite element method to
determine the transient response of finite biomaterial plates with interface crack.They have
determined the complex dynamic stress intensity factor from the crack opening
displacements of the singular stress term. Arruda and Castro[45] have proposed a hybrid–
mixed stress finite element model for the linear dynamic analysis of structure. HMS model
has considered two independent approximations for the stress and the displacement in the
region of each element. Time integration techniques are used to perform the linear
dynamic analysis.Eshmatow et al. [46] have presented the effect of properties of structure
material (i.e. viscoelastic and in homogenous) on the stability of the plate.They have
determined the results by applying the bubnow-galerkin procedure combined with a
numerical method based on the quadrature formulas.
Cheng and Hatam [47] have presented the vibration analysis of the point coupled structure
using the finite element method. Also, they have studied the effect of biased compliance
measurement on the accuracy of the prediction. Patil and Maiti [48] have suggested a
technique for fault recognition in a slender Euler-Bernoulli beam using frequency
measurement and the transfer matrix method. They have considered cracks as rotating
springs in the analytical method for identification of cracks.Ebersbach and Peng [49] have
proposed an enhance technique for the condition monitoring of fixed plant machinery,
using proven industry method. They have observed that developed system can be used to
detect failure with high precision using the dynamic response of the system.Finite element
methods and wavelets transform method are used to find the size and severity of
Chapter 2 Literature Review
14
cracks.Cerri et al. [50] have presented theoretical analysis for the vibration based analysis
of a circular arc in both faulty and non-faulty models to design a damage detection
method. They have compered the obtained results of theoretical analysis with the results
of experimental analysis for validation. They have used the mode shapes and natural
frequencies to develop the damage detection model with the assumption, the arch act as a
torsion spring on the cracked section. Humar et al. [51] have presented a survey on some
of the common vibration base crack detection techniques and discovered the drawbacks in
them. The presence of cracks in the structure has badly affected the modal response,
stiffness, and damping.They have found that the vibration-based damage detection
techniques, fail to perform when applied to real structures due to the inherent
complications.
He et al. [52] have presented a method to determine the local flexibility matrix and stress
intensity factor of cracked beam to formulate a technique for crack dection. Zou et al. [53]
have reported a developed method of the local flexibility of a cracked rotor system. They
have examined the vibration characteristics of the rotor with transverse crack to design for
forward application as a crack diagnostic model. Patel and Drape [54] have dicussed the
analysis of nonlinear dynamic behaviour of the shaft containing breathing crack. They
have proposed the response–dependent breathing crack model and switching crack model
to investigated the nonlinear dynamic analysis of cracked rotor. Bachschmid et al. [55]
have invstigated accuratly the breathing crack mechanism in rotating shaft with the help
of the 3D non-linear models. Also invatigated the effect of crack on the cross section of
the rotor due to mutual action of the torsion and bending.They have developed the
model, which consider the linear stress and strain allocations for established the breathing
mechanism.
Sawicki et al. [56] have presented the analysis of dynamic behavior of rotor of machines
with transverse breathing crack that is open and closed due to self-weight. They have
applied auxiliary magnetic bearing (AMB) for detection of crack in the rotor. Xiao-feng et
al. [57] have presented the nonlinear vibration analysis of the cracked rotor with or
without whirling.Authors have found distinct differences in bifurcation, orbit and
amplitude while carrying on this comparision.Zhu [58] has analyzed theoretically the
vibration based analysis of a cracked rotor with an active magnatic bearing. He has
discussed the influence of crack on the stability of the active control system.
Bovsunovskii [59] has analyzed the influence of crack depth and location on the vibration
behavior of the cantilever beam by considering the changes in the cross-section. Rayleigh
Chapter 2 Literature Review
15
method is used to obtained the frequency of the first mode of cantilever beam with
breathing crack(i.e. open and close crack) due to vibration of longitudinal and bending
loading.Müller et al.[60] have discussed the vibartion based nonlinear dynamic analysis of
the rotating cracked shaft. Theory of lyapunov exponents is developed for the nonlinear
dynamical systems, chaotic motions and strange attractors in the case of a faulty
rotor.They have used Model-based technique to crack dection in shaft. Zhou et al. [61]
have investigated the vibration based nonlinear dynamic behaviour of the cracked rotor
by numerical and experimental analysis. The eccentricity, depth of crack and angle of
crack are taken as an influence parameters for the analysis of cracked rotor.
Ishida et al.[62] have proposed the method to identify the crack in the rotor based on the
nonlinear vibration diagnosis by means of harmonic excitation force. They have employed
piecewise linear function for modeling the open and close crack mechanism.Qin et al.
[63] have proposed a Piecewise linear function employed to model the cracked rotor for
vibration based nonlinear dynamic analysis of a cracked rotor. They have developed the
differential equations of motion for the non-smooth system.Sinha [64] has investigated the
nonlinear dynamic behavior of the mechanical system for detecting the presence of higher
harmonics spectra in a signals obtained from the system applying higher order spectra
tools. He has found the misaligned axis of rotation of the shaft and crack exhibits a
nonlinear behavior because of the existence of greater harmonics spectra in the indicator.
According to author, the higher order spectra tool in indicator can be actually utilized for
monitoring condition of rotatory mechanical arrangements.
Babu et al. [65] have discussed the transient analysis of a cracked rotor system with
transverse breathing crack for the flexural vibrations using Hilbert hung transform
method. Guo and Peng [66] have suggested the Hilbert hung transform (HHT) method for
analysis the non-linear response of the cracked rotor. They have applied the FEM and
dimarogonas methods to develop the model of rotor with a growth crack. Han et al. [67]
have discussed the dynamic behaviour of a geared rotor- bearing system carrying a
breathing crack. They have developed the slant crack geared-rotor model using the FEM
and also used the stress intensity factor based on fracture mechanics for calculating the
flexibility matrix for the slant crack. Khanlo et al. [68] have investigated the effect of
lateral torsional coupling on the dynamic characteristics of the a spinning shaft-disk
system. They have used Rayleigh beam theory to develop the equation of motion. Guo et
al. [69] have reported the analysis of dynamic behaviour of the Jeffcot rotor carrying
transverse breathing crack.They have employed the Floquet theory for evaluating the
Chapter 2 Literature Review
16
stability of the rotor system considering the spinning speed and crack depth. Auciello and
Nole [70] have presented the vibration analysis of the cantilever beams containing a mass
at the free end. In this study authors have assumed two different calculation methods.
First is an exact method which has solved the problem using the Bessel function, and
another one is Rayleigh-Ritz method using orthogonal polynomials as test functions.
Caddemi et al. [71] have investigated the non-linear dynamic behavior of the beam with
multiple concentrated switching cracks (i.e. cracks are either fully open or fully closed).
They have developed crack model employing Dirac’c deltas which permit the closed-form
estimation of the mode shape of the beam for general crack configuration. Presas et al.
[72] have analyzed the effect of the rotation on the vibration response (i.e.natural
frequencies and amplitude) of the imeresed-confined disc in the fluid filled container by
analytically, experimentally and numerically.Thin plate theory are used for modelling the
disc, and Laplace equation are used for the fluid flow velocities on the lower and upper
parts of the disc.Computation fluid dynamic (CFD) simulation has been done for the fluid
flow inside the container in order to evaluate the average speed of water on the lower and
upper area of the disc for changed velocities.
2.2.2 Finite Element Method used for Identification of Crack
Darpe et al. [73] have proposed the transient anlaysis of the dynamics of bowed rotor
carrying a transverse crack. They have analysed the transient response of the transversed
cracked rotor considered with and without gravity. Also investigated the effect of bow on
the open and closed crack mechanism of the rotor for the different intensity value of bow.
Georgantzinos and Anifantis [74] have proposed a nonlinear finite element method for
simulation of quasi-static crack breathing mechanism in rotating shaft. This process can
predict successfully the contact between the crack surfaces by means of the anagle of
crack rotation. Bachschmid and Tanzi [75] have presented the analysis of circular cross
section cracked beam with different crack depths subjected to shear, axial and torsion
loads. Sekhar [76] has investigated the dynamic behavior of the rotor carrying double
transverse crack using developed finite element modeling of a rotor-bearing system. He
has determined the changes in stability and eigen frequencies with parameters of crack
for shaft parameters such as slenderness ratio.
Chasalevris and Papadopoulos [77] have presented the vibration based analysis of a beam
with doubled transverse crack. They have considered the crack location, crack depth, and
relative crack angle as a variable parameter for this analysis. The compliance matrix is
Chapter 2 Literature Review
17
calculated using the integration method of strain energy density function on the open crack
area. Nandi [78] has proposed an effective analysis of rotor instability. They have used
the standaraed method of assumed solution for solving the above rotor stability analysis.
Mohamed et al. [79] have reported the analysis of vibration characteristics of rotor with
two different types of crack, a notch cut to changeable depths and actual crack growth
from a pre-crack. The vibration based condition health monitoring technique is employed
to evaluate and monitored the begning of fatigue crack and propagation in a pre-cracked
of high carbon steel rotor. Baviskar and Tungikar [80] have proposed the inverse
technique for fault detection in moving parts. The model of beam is developed with the
help of finite element method.
Hossain et al. [81] have developed the experimental test rig for the vibration analysis of a
cantilever beam partially immersed in air and fluid medium and vibration response is
measured with the help of Polytech scanning vibrometer. Also, they have used the finite
element analysis (FEA) method to forecast the dynamic response of the same beam.The
alteration in the vibration response of the beam such as frequency, amplitude and resonant
frequency are compared as functions of the rheological properties of viscous fluid.
Georgantzinos and Anifantis [82] have examined the effect of the breathing crack
mechanism on the rotating crack shaft assuming the quasi-static approximation. The
nonlinear contact–FEM method are used for the analysis of circular cross-sectional
cracked cantilever beam subjected to torsion load. Kerboua et al.[83] have reported the
analysis of the vibration characteristic of the rectangular plates coupled with the
fluid.They have developed the mathematical model of the plate using the Sander’s shell
theory and finite element method. The fluid pressure is analyzed with the help of velocity
potential and Bernoulli's equation. Darpe [84,85,86] has proposed innovative technique to
identify the crack size and location in the rotating shaft carrying the breathing crack
subjected the transient torsional excitation. Author has determined the instability
behavior of the rotor with slant crack using the nonlinear breathing crack model. He has
considered the finite element model of the disc rotor containing the six degrees of freedom
per node for the cracked area and formulated the stiffness matrix turns into account all the
coupling phenomenon (i.e.Longitudinal-torsion,bending-torsion,bending-longitudinal) that
occurs in the area of crack on the rotor.
Silania et al. [87] have reported the vibration based analysis of dynamic behavior of
rotating shaft system with breathing crack. Modified integration method is used to
compute the stiffness matrix of cracked element. They have employed the Finite element
Chapter 2 Literature Review
18
formulation for breathing crack modelling and frequency/time domain methods are used to
calculate the vibration characteristic of the rotor with breathing crack. Kulesza [88] have
suggested a technique for identification of crack in the rotor using a multisine technique.
Authors have employed the finite element analysis for the flexible spinning shaft
modelling. Sekhar and Prasad [89] have reported the flexural vibration based analysis of
the rotor-bearing system with a cracked shaft using Finite element method. They have
developed the flexibility matrix and stiffness matrix of a crack element to be employed in
the FEM investigation of the rotor bearing system.
2.2.3 Wavelet Transform and Wavelet Finite Element Method used for
Identification of Crack
Nguyen and Tran [90] have repoerted a novel technique for crack identification of the
structure based on the wavelet transform of the vibration response obtained from a moving
vehicle.Ren et al. [91] have investigated the vibration behaviour of the rotor with
transverse crack using wavelate scalogram method based on the 3-D water fall
spectrum.Yang et al.[92] have examined the non-linear dynamic behaviour of model-
based rotor with transverse crack using wavelet based algorithm that is efficiently
identifying the mechanical chaotic response.Xiang et al. [93] have proposed a novel
methodology for recognizing the crack size and crack location in the rotor using finite
element method of B-spline wavelet on the interval (FEM BSWI). They have developed
the disc and slender shaft model using BSWI Rayleigh-Timosinko beam element and
BSWI Rayleigh–Euler beam element respectively.
Jibing et al. [94] have suggested the harmonic wavelet transform (HWT) and Poincare
map technique for identifying the various types of motion of the existing system due to
change in parameters of nonlinear vibration system. The HWT is useful to recognize the
quasiperiod from chaos and Poincare map method is used to recognize the periodic motion
of the system. Ma et al. [95] have proposed the new wavelet based beam element method
for analyzing the complicated beam such as those with uneven cross section, local load.
They have developed Wavelet based beam element method using the daubechies scaling
element functions.Li et al. [96] have proposed a wavelet Finite element method (FEM) to
recognized crack size and crack location in beam. They have discretized the beam into the
a set of wavelet finite element to correctly determined the vibration response (i.e. natural
frequency) of the beam with different crack size and crack location. Gómez et al. [97]
Chapter 2 Literature Review
19
have reported the wavelet transform theory (WTT) for crack identification in jeffcot rotor
of the rotating machinery.
2.2.4 Other Approaches are used for Identification of Crack
Gasch [98] has investigated the dynamic behaviour of a cracked rotor carrying a disc in
the mid span. He has formulated the non-linear equation of motion for the crack rotor
model and only concentrated on the lateral vibration. Floquets method are used for the
stability analysis of the rotor. Sino et al. [99] have presented the vibration based anlaysis
of dynamic behaviour of rotating composite shaft with internal damping. They have
estimated the natural frequency and instability thresholds using the Homogenized finite
element beam model with considering the internal damping and also compared the
urbanized simplified homogenized beam theory with the equivalent beam modulus theory
(EMBT).Wang et al. [100] have presented the vibration analysis of the horizontal axis
wind turbine using the thin walled structure theory. Stress-displacement field, dynamic
displacement and stress distribution of the wind tower blade rotor are estimated from the
forced response analysis.
Szolc et al.[101] have suggested the stochastic method for crack identifying cracks in the
rotating shaft of the machines.This method is based on the Monte Carlo simulation of the
rotor torsional-lateral-longitudinal vibration with open crack at arbitrarily selected
locations and depths on the shaft. Gomez-Mancilla et al. [102] have invetigated the effect
of transverse crack in a orbital position of cracked rotating shaft. Shulzhenko and
Ovcharova [103] have presented the numerical analysis for the influence of the break of
the elastic axis of rotor with transverse crack on its vibrational. Dong et al. [104] have
proposed a wavelet finite element model and high precision model parameter
identification method for identifying the crack location and crack depth in rotor carrying
transverse crack. Simultaneously a new method Laplace wavelet based and empirical
mode decomposition is developed to obtain the high precision model parameters, which is
employed to progress the accuracy of crack recognition.Stoisser and Audebert [105] have
discussed theoretically the three-dimensional beam model with transverse crack and also
presented the numerical and experimental approach for crack identification in rotating
machinery of power plant.
Mueller et al.[106] have studied the different methods for estimating the initiation of creep
crack.They have compared the two Criteria Diagram (2CD), Nikbin-Smith-Webster
(NSW) model and Time Dependent Failure Assessment Diagram (TDFAD) method for
Chapter 2 Literature Review
20
predicting the creep crack commencement.Chen et al. [107] have reported a novel
approach for investigating the nonlinear behavior of a cracked rotor system including an
effect of crack size. Mass of the rotating shaft carrying a disc in mid-span, the
nonlinearity of the rotor and additional displacement of the rotor due to the presence of
transverse crack are considered for establishing the method.Also, they have investigated
the dynamic stability of rotor system. Pennacchi and Vania [108] have discussed the
model based analysis of the gasturbine shaft (100MW) because of the propagation of
transverse crack with coupling load. Shahgholi et al. [109] have discussed the analysis of
the dynamic behaviour of a nonlinear spinning simply supported shaft.They have
considered the rotary inertia and gyroscopic effect for the modelling of the system.
Extended Hamilton principle is used to formulate the equation of motion of the system.
Phan et al. [110] have discussed the vibration analysis of rectangular cross sectional
cantilever beam partially submerged in a viscous fluid medium under harmonic base
excitation.The interaction between fluid and structure (i.e.cantilever beam) are developed
using a complex hydrodynamic function.
Curadelli et al.[111] have presented the experimental and numerical investigation of the
vibration behavior of spherical tanks under horizontal motion.The main aim is to find the
natural frequencies of the modes which contribute to the dynamic behavior of this certain
structure.Chouksey et. Al [112] have discussed the model analysis of rotor with
consideration the effect of internal damping of rotor material and the fluid-film
forces.They have formulated the equation of motion using the 2-noded finite Rayleigh
beam elements. Liang et al.[113] have proposed a methodology to define the vibration
mode shapes and frequencies of cantilever plates which are submerged in the fluid
medium on the basis of empirical added mass formulation. Uscilowska and Kołodziej
[114] have reported the vibration based analysis of an offshore structure.The structure is
modelled as a uniform Bernoulli- Euler cantilever beam fixed at the bottom end with an
intense mass at the top. Arruda and Castro [115] have proposed an FE model of hybrid-
mixed stress for the vibration based analysis of the dynamic behavior of the structure
assuming a geometrically and physically linear manner. They have used time integration
technique to accomplish the linear dynamic analysis.
Singh and Tiwari [116] have presented experimental analysis to validated the multi-crack
detection and localization (MCDLA) algorithm for the multi-crack identification and
localization of the simply supported shaft. The performance of the algorithm is totally
based on the identification of slope discountinuity. Rubio et al.[117] have discussed the
Chapter 2 Literature Review
21
static analysis of the vibration response of the shaft in bending with elliptical shape of
crack at a different position of the shaft by using the polynomial expressions of the
flexibility. Vaziri and Nayeb-Hashemi [118] have determined the effective third mode
stress intensity factor for multi-cracked circular shaft subjected to torsional load using
the asperity-interlocking mechanism.Gubran and Sinha [119] have investigated
experimentally the dynamic behaviour of the bladed disc due to instantaneous angular
speed which is transmitted to the shaft as a torsional vibration. Eftekharnejad et al. [120]
have employed the many techniques such as motor current signature analysis, acoustic
emission and vibration analysis for the identification of existing crack in the pinion shaft
of a gear box.
Liong and Proppe [121] have developed the cohesive zone model (CZM) for calculating
the the stiffness losses in a rotor carrying transverse breathing crack.The breathing crack
is modelled by a parabolic shape. Also they have analyzed the effect of breathing
transverse crack mechanism on the rotor system which is performed because of self-
weight and inertia forces. Abuzeid and Dado [122] have presented the analysis of the shaft
with the transverse crack under pure bending considering the irregular surface at the crack
position. Cheng et al. [123] have studied the effect of breathing crack and imbalance
orientation angle on the dynamic behavior of the critical speed of the jeffcot rotor.
Yadykin et al. [124] have presented the numerical study of cantilever plate with additional
mass submerged in the fluid region. They have used the Airfoil Theory for analysis of an
incompressible fluid flow forces. Fu and Price [125] have reported the vibration analysis
of the cantilever plate which is partially or fully immersed inside the fluid. They have used
the hydro-elastic theory for performing the interaction analysis between the vibrating the
cantilever plate and fluid.
2.2.5 Artificial Intelligence Technique used for Identification of Crack
In this current section introduces the various types of Artificial intelligence techniques
(ANN) used in the field of identification of fault in present in faulty structure (i.e. rotor,
beam, plate) have been described.
2.2.5.1 Fuzzy Logic Technique
Wada and oka [126] have presented a fuzzy logic technique with the triangular
membership functions for the image processing the governor level of granular inside the
hopper. Ganguli [127] has developed a fuzzy logic system for ground-based structural
Chapter 2 Literature Review
22
health monitoring system to detect the fault in helicopter for measuring rotating and non-
rotating frequency in the vacuum. De Miguel and Blázquez [128] have proposed a fuzzy
system based on prediction module for damage detection application. Chen [129] have
presented Takagi-Sugeno (T-S) Fuzzy Models for the stability condition and controller
design of the structural and mechanical system.They have designed the fuzzy logic
controller by using the design procedure of the controller and parallel-distributed
compensation. Boutros and Liang [130] have developed the fault identification technique
using efficient fuzzy fusion method based on the Sugeno inference engine.They have
validated the fuzzy-based method in two different approaches (i.e. Bearing condition
valuation and milling tool conditioning monitoring of milling operation).
Zhang et al. [131] have proposed mechanical fault diagnosis technology based on the
fuzzy grey optimizing prediction method with multi-dimensional fault characteristics
parameter model for the rotating parts of the machines.Kim et al. [132] have proposed a
fault identification system for reinforced concrete structures using the fuzzy system. The
environmental condition, numeric data of concrete and symptoms of crack are considered
as an input parameter in the fuzzy inference system. Angelov et al. [133] have suggested
two novel methodologies (i.e. eClass and FLEXFIS) for progress the performance of on
line fuzzy classifier. The eClass methods have a multi-input and multi-output with
multiple hyper planes to build the fuzzy rule. Chandrashekhar et al. [134] have studied the
measurement uncertainty and geometric for damage identification.They have studied the
variation in the fault indication because of the ambiguity in the geometric properties of the
structure using Monte Carlo simulation technique, and these simulation results are used
for developing the fuzzy inference system.
Saravanan et al. [135] have reported a vibration signal based methodology for condition
monitoring of remote moving parts in the machines. The decision tree and fuzzy classifier
to form the rules automatically are used to design the suggested method.Wu and Law
[136] have discussed wavelet function based fuzzy robust wavelet support vector classifier
(FRWSVC) and established an adaptive gaussian particle swarm optimization algorithm to
pursue the peak unidentified parameter for the FRWSVC. Experimental results are
validated with the obtained results of hybrid model. Parhi and Choudhury [137] have
investigated a transverse crack of beam using the fuzzy logic system and finite element
method. They have used hybrid membership function (i.e. combination of the trapezoidal,
triangular and gaussain) as an input parameter and trapezoidal membership functions as an
output parameter in the fuzzy controller system.Choi and Jung [138] have proposed the
Chapter 2 Literature Review
23
Takagi-Sugeno fuzzy method based on fuzzy speed controller for an analyzing permanent
magnet synchronous motor. They have formulated existence conditions in term of Linear
Matrix inequalities (LMI) for designing the T-S Fuzzy speed controller. Hasanzadeh et al.
[139] have proposed a non-phenomenological technique to resolve the inverse problems,
particularly for the electromagnetic alternative current field measurement method to
recognize the metal surface crack.They have shown that the combination of technique of
adaption and fuzzy inference method for altered crack natures delivers adequate means as
a previous observed information for the training system. Sugumaran and Ramachandran
[140] have used the decision tree for picking the bin ranges which will distinguish the
faulty circumstance of the bearing system from a definite train models and rules forms
from the decision tree. The vibration signal receives from the piezoelectric transducer for
various kinds of earing fault conditioning is used to form the fuzzy rules. Mohanta et al.
[141] have established a model of fuzzy Markov for the captive power plant maintenance
planning taking into account the several parameters that develops the disaster repair cycle.
Parhi [142] has described a mobile robot path planning control system based on fuzzy
inference system.
2.2.5.2 Artificial Neural Network Technique
In curent segment altered types of Artificial Neural Network (ANN) based techniques
used for crack detection are described. ANN is used as a capable technique for fault
identification. This segment describes the different types of Neural Network technique
used for the identification of crack. The ANN has been used as an auspicious
methodology in the field of an inverse problem for crack dectection. Liu et al. [143] have
proposed an inverse analysis to simulate scan ultrasonic nondestructive testing using the
back propagation neural network (BPNN) and computational mechanics combining the
finite element method with boundary integration equation.The trained neural networks are
utilized for the classification and identification of the crack in the medium to evaluate the
type, position, and length of the crack.
Fang et al. [144] have presented structural fault diagnosis method by using FRFs as an
input data to train the BPNN.They have studied the effect of three various algorithms;
FSD, TSD and DSD in neural network training. Mehrjoo et al. [145] have established an
inverse algorithm for crack identification to evaluate the severity and location of the
damages in combined truss and bridge structure using the BPNN approach. Mode shapes
and natural frequencies are used as a input parameters.Wu et al. [146] have presented the
Chapter 2 Literature Review
24
fault identification method for IC engine using the artificial neural network and discrete
wavelet transform. Just-Agosto et al. [147] have proposed neural network method with a
permutation of thermal and vibration damage identification signature to established a fault
detection device.Authors have developed the method for the crack detection on the
sandwich composite.
Wu et al. [148] have discussed a fault dectction technique for gears of rotating machinery
applying the neural network and wavelet transform technique. Gears sound emissions are
used along with the continuous wavelet transform method and the assortment of the
feature of energy spectrum to develop the fault identification tool based on neural network
method. Ghate et al.[149] have proposed a multi-layer neural network technique for
identification of damages in induction motor. They have utilized numerical parameters as
an input to trained the neural network controller. Fan et al. [150] have discussed a fault
diagnosis and detection approach for air handling division. Their methods comprise two
phases which are the related to fault detection stages. In first stage, they have used the
neural network fault detection model for producing the sensors values, and it is compared
to actual value to generate remaining values. The mentioned fault detection neural
network controller has been trained using the historical data of the HAVC system. Wang
et al. [151] have presented a novel fault identification method based on BPNN. The results
obtained by them are compared by the three different methods, which contain the variation
of the autoregressive coefficient with BPNN and the distance of autoregressive coefficient
technique for several samples. They have obtained that the variation of autoregressive
coefficients with the BPNN was greater then the autoregressive coefficient with BPNN
and distance of autoregressive coefficient method.
Saravanan et al. [152] have discussed a wavelet-based technique for fault diagnosis of
gearbox using proximal support vector machine and ANN. The J48 algorithms are used to
classified the statistical feature vectors from the Morlet wavelet coefficients.The main
features are used as an input for the proximal support vector signature and
ANN.Paviglianiti et al. [153] have developed an arrangement for identifying and isolating
sensor faults in manipulators of an industrial robot. They have implemented a Radial basis
function method to improve the dynamics of the proposed arrangement. Schlechtingen
and Santos [154] have studied a comparison of results between the two artificial neural
network based methodologies and the regression-based model. For conditioning
monitoring of bearing in a wind turbine used an auto-aggressive normal behavior model.
Eski et al. [155] have reported the experimental analysis of the robot manipulator using
Chapter 2 Literature Review
25
the artificial neural network for investigating the joints vibration.They have established an
experimental test rig to accumulate the associated values which have six degrees of
freedom.The obtained results indication that the suggested Radial Basis Neural Network is
used to analyzed the acceleration of joints of manipulators because of a given trajectory.
Thatoi and Jena [156] have discussed the analysis of dynamic response of a cracked shaft
with the help of experimental analysis and ANN system.The obtained experimental
analysis data are used as an input parameter to feed in BPNN system. Oberholster and
Heyns [157] have proposed a method for online structure health monitoring of axial flow
for blades using ANN system. Extracted vibration characteristic from the experimental
test of the structure is used as an input parameter for train the ANN. Rakideh et al. [158]
have developed and design the BPNN technique for condition monitoring of cracked
beam.They have extracted the natural frequencies of the beam using the analytical method
and fed these natural frequencies to BPNN model to forecast the size and location of the
crack. According to them, the neural network is a powerful way to determine the crack
size and depth. Also, the capability of prediction has increased with increasing the
numbers of the natural frequencies.
Kao and Hung [159] have presented structural condition monitoring using a supervised
learning type of Neural System Identification Networks (NSINs).They first identified the
uncracked and cracked conditions of a structural system using NSINs then trained NSINs
has been used to develop free vibration responses with the same condition of
structures.Quteishat and Lim [160] have proposed a Fuzzy Min-Max (FMM) network
structure, which is a trained Neural network controller that construct hyper-boxes for
prediction the problems. This method is applied to the removal of rule set from the Fuzzy
Min-Max to permit the predicted results. The outputs of FMM are compared with results
measured from a plant of power generation for fault recognition with the help of sensors.
Hajnayeb et al. [161] have designed and developed a feature selection based network
system to diagnose the various types of faults in the gearbox. The authenticity of the
proposed method is verified by experimental analysis. The results of feature selection
method are compared with genetic algorithm results. They have found a close proximity to
the results.Samanta [162] has presented a study on gear fault identification using ANNs
and Support Vector Machines (SMVs). The vibration parameters of a rotating machine
with damage and non-damage gears are sort out for extraction of features. He has used
extracted features from damage and non-damage gears as an inputs to both classifiers (i.e.
ANNs and SVMs) for the state recognition of gear box. Haykin [163] has defined that the
Chapter 2 Literature Review
26
neural network has associated processing units called neurons, which can adopt the
knowledge from available information and to make it available for use.Samanta et al.
[164] have presented a comparative study of the performance of the bearing fault
recognition techniques using two classifiers namely ANNs and SVMs. The vibration
analysis performed to get the vibration signal of a spinning machine with defective and
non-defective bearing processes for extraction of features. The extracted features from
original and processed signals are used as an inputs to the classifier for two senses ( i.e.
normal and fault) detection. The nodes of in hidden layers of ANN and width of radial
basis function (RBFN) along with selected input features are optimized using a genetic
algorithm.
2.2.5.3 Adaptive Neuro-Fuzzy Interference System (ANFIS)
In curent section different types of Adaptive neuro fuzzy interference system (ANFIS)
based techniques used for fault identification are described. ANFIS is used as a capable
technique for damage detaction.Wang et al. [165] have reported the assessment of the
execution of the two different damage identification method that is neuro-fuzzy and
recurrent neural network systems using the two standard time series data sets. According
to them, it is observed that the neural network fault identification system is less authentic
for health condition monitoring of machine then the neuro-fuzzy predictive system.
Kuo and Chang [166] have suggested damage dignosis method based on fuzzy neural
diagnosis approach for identification of damages in propeller shaft of marine propulsion.
They have conducted experiment an analysis the fault behavior of the propeller shaft
system. The results obtained from the experimentation have been used as training data and
input/output rule generation of fuzzy neural network.Ye et al. [167] have described a
novel online diagnosis process to evaluate the mechanical problem of the electrical
mechanism using Adaptive Neuro-Fuzzy Inference System (ANFIS) and wavelet packet
decomposition. Zio and Gola [168] have proposed a fault identification technique using
fuzzy neuro approach. Authors have applied this technique for the determination of a great
rate of exact categorisation and to find the explainable classified model.
Yang et al. [169] have proposed ANFIS based fault identification technique incorporated
with the decision tree for the induction motor. They have used the hybrid of square
algorithm and back propagation to train the membership function. The data set found
from the current signals and vibration signals of the induction motors.Eslamaloueyan
[170] has proposed hierarchical neural network method for separating the damages of the
Chapter 2 Literature Review
27
Tennessee Eastman Process being accomplished through the Eastman chemical company
to offer an industrialized development for achieve monitoring and process planning
control technique.They have used Fuzzy clustering algorithm to split the fault patterns
space into a sub spaces. Salahshoor et al. [171] have proposed an advanced damage
detection method based on the distributed arrangement of three ANFIS classifier for the
steam turbine power plant (i.e. 440MW power generation capacity). A suitable choice of
four calculated variable has been organized to provide in each ANFIS classifier with the
greatest significant diagnostic data. Sadeghian and Fatehi [172] have proposed a fault
dignosis method for forecasting the faulty progression of cement rotary kiln in the White
Saveh cement factory. The authors have employed the Linear neuro-fuzzy (LNF) based
model trained by the LOLIMOT algorithm for identifying the several operation points in
the kiln.
Beena and Ganguli [173] have proposed an innovative algorithm based on the fuzzy logic
and artificial neural network approach for fault detection in structure. Authors have used
the finite element analysis to calculate the natural frequencies due to fault in structure. The
deviations are measured because of the damage are fuzzified and designed to a set of the
fault using fuzzy cognitive map. The frequency deviation is used as an input parameter
and damage locations of the beam are used as output parameters for the fuzzy cognitive
map. Zhu et al. [174] have discussed a fault identification method based on the combine
ANFIS, interval modelling method and wavelet real time filtering algorithm to process
signals of structural behavior and excitation data. Here ANFIS was used to model
structural response, wavelet transform algorithm to strain the arbitrary noise and interval
modelling method to quantify damage index precisely.
Chen et al. [175] have proposed ANFIS based on the prior knowledge for the wind turbine
fault diagnosis.They have used the data of the 6 known WT pitch faults to train the model
with prior information integrated.Bachi et al. [176] have reported an ANFIS technique
for predicting the vibration behaviour of beam due to the effect of large displacements
and axial forces. They have used the finite element method and experimental analysis for
calculating nonlinear vibration responses of the single and multiple- stepped beam. Al-
Shammari et al. [177] have investigated the efficient approach to obtain the wake wind
speed at any location of the wing farm using ANFIS.They have developed the Simulink
model using the MATLAB with the ANFIS network to the estimation of wake wind
speed.Petkovic et al. [178] have investigated new methodology based on the ANFIS for
achieving the contact position of the proposed tactile sensing structure.They have used the
Chapter 2 Literature Review
28
experimentally obtained results as a testing and trained data for the ANFIS network.
Zhang et al. [179] have been proposed a bearing fault identification technique based on the
ANFIS and multi-scale entropy to evaluate the nonlinearity existing in bearing
system.They have used the experimental data to arrange and train the ANFIS structure for
fault diagnosis.
Boyacioglu and Avci [180] have presented an ANFIS based mechanism for predicting
the stock price index return of the Istanbul Stock Exchange (ISE). They have concluded
that the economists can be apply ANFIS successfully for forecasting the return of stock
price index. Zhang et al. [181] have investigated a forecasting the continuation of chaotic
signals in time-based on the delay co-ordinate embedding technique by using the multi-
input and multi-output ANFIS controller.Gradient descent algorithms have been used to
trained the MANFIS method. They have used back-propagation algorithm to generate the
set of the membership functions with the embedded phase space vector. Hinojosa and
Doménech-Asensi [182] have presented modeling method of microwave devices based on
the space mapping (SM) methodology by using the multiple neuro-fuzzy inference system
(MANFIS). Authors have used the micro-genetic algorithm to find the nonlinear multi-
dimensional mapping functions.
Lei et al. [183] have proposed a novel methodology based on the static analysis, improved
distance evaluation technique, empirical mode decomposition (EMD) and MANFIS for
intelligent fault identification of rotating machinery.Doménech-Asensi et al. [184] have
developed an accurate analog circuit macro model sizing using a fuzzy logic system.
According to them, the suggested technique forecast the performance characteristics (i.e.
bandwidth and gain) of a differential telescopic trans-conductance amplifier (OTA) based
on the MANFIS. Güneri et al. [185] have presented a novel approach based on ANFIS for
overcoming the problem of supplier selection. They have minimized the problem using the
ANFIS input selection technique. Dash and Parhi [186] have developed a novel tool to
identifying the multi-crack in the dynamic structures using MANFIS. They have
considered the difference of the first three average relative mode shapes, first three natural
frequencies as input parameters and crack depths and crack locations are used as output
parameters for the fuzzy and neural controllers of the MANFIS model.
Ghaffari et al. [187] have proposed the new prediction models based on the multiple
adaptive neuro-fuzzy systems (MANFIS) for an overtaking behavior of human.They have
used kinematic features of driver vehicle units (DVUs) such as acceleration, velocity, and
distance. Field data are used as inputs and outputs of MANFIS to be models. The result
Chapter 2 Literature Review
29
obtained are compared and validated with the actual traffic data sets and found that very
closer. Saeed et al. [188] have proposed the fault identification method in Francis turbine
using different Artificial intelligence technique, MANFIS and multiple ANNs.They have
used the changes in vibration characteristics as inputs and position, the size of fault in the
runner as output parameters to train the proposed artificial intelligence technique for
evaluating the turbine operating conditions.
Linh and Long [189] have proposed a hybrid approach using the MANFIS and Fuzzy
clustering method (FCM) to recover the compression ratio of the state of the art
compression algorithm-DCRA. They have found the coefficient of nonlinear transform for
sliding window using the MANFIS. Subhi Al-batah et al. [190] have proposed an
intelligent computer system for the classification of cervical cancer. The proposed
Intelligent system consists of two main stages. The first stage is based on the automatic
features extraction (AEF) algorithm and in the second stage, MANFIS is used for the
identification process.
2.2.5.4 Rule Base Technique
This section discusses the literatures related to rule base technique used for various
problems. Takagi et el. [191] have reported the rule base technique to design and develop
mobile robot to carry a rectangle from one place to another place. Authors have addressed
a classified architecture in rules. These rules are used to achieve the angle among the box
and robot. They used total 120 rules in their experiment. Gaeta et al. [192] have presented
the rule base technique for finding the age groups. They have proposed that there is an age
related decline in the effectiveness of incorporating several sources in a single auditory
sense. De Souze et al. [193] have discussed the reusable structure for rule base technique
pronounced using design patterns. The design patterns are used to organize a catalog of
design that can be used by designers to recognize and generate novel rule base methods,
thus endorsing reuse in this systems. Dietrich et al. [194] have reported a typical
structure for rule based agents and clarified the technique to understand the navigation
mechanism using semantic web languages.
Tunstel et al. [195] have described the functional safety and health condition monitoring
of complex matters of self- governing mobile robots. Mc Intosh et al.[196] have proposed
a simple theory of rule base method. Authors have implemented a method to provide
systematic management-oriented modelling of vegetated landscapes. Pfeiffer et al.
[197,198,199] have used a rule base visual language to control a small LEGO mobile
Chapter 2 Literature Review
30
robot. Fei et al.[200] have introduces the rule base method for adapting an environmental
condition. Gilmore et al. [201] have reported a rule base method to forecast the dynamic
characteristics of operations of feeders and manipulator. Bonner et al. [202,203,204] have
applied rules which are based on the free space cell, to determine the sustaining accident
free paths in an organized environment for mobile robot navigation.
2.3 Summary
From the above-described literature survey, it is found that the dynamic response of the
cracked rotor partially immersed in the viscous medium is determined by the strain energy
release rate. Different Artificial intelligence technique may be employed for fault
diagnosis of many engineering structure applications. It is observed from the literature
survey that the artificial intelligence technique is not applied potentially for fault diagnosis
of the rotating cracked rotor. So, in the present research, an organized effort has been
made to develop artificial intelligent based system for health condition monitoring of
spinning rotor with multiple transeverse crack partially submerged in the viscous medium
using fuzzy system, neural network, MANFIS and rule base method. The parameters are
necessary to design and train the artificial intelligence model using the data from
theoretical, finite element and experimental analysis of the multiple cracked rotor.
31
Chapter 3
Theoretical Analysis of DynamicResponse
of Rotor with Multiple Transverse Crack
Partially Submerged in Viscous Medium
The presence of the crack in structures or machine component is a serious threat to the
integrity of structures as well the safety of human life. Throughout the world, many
researchers are working on structural dynamics and particularly on dynamic characteristics
of structure with multiple transverse cracks. Numerous techniques are available in
literature to detect the crack at the primary stage of final failure of structures. The
vibration-based methods are effectively applied for crack identification in structures (i.e.
rotor, beam and plate). It is observed that dynamic response, e.g. natural frequencies and
amplitude of vibration changes due to presence of crack in structure.
3.1 Introduction
Vibration analysis of spinning rotor is playing a vital role in the area of vibration due to
the frequent catastrophe of such rotors in engineering applications.The vibration analysis
of the spinning rotor with transverse crack has been investigated successfully by several
researchers with the help different methodologies. The vibration response is very sensitive
to crack location and its intensity. The researchers and scientists have analyzed that effect
of cracks on vibration responses of the cracked rotor.These changes in vibration responses
can be efficiently utilized for developing the crack detection technique. When a rotor
rotates in a viscous medium with crack on it, the dynamic analysis of such system
becomes more complex and difficult. The investigations done so far on the vibration
behavior of rotor with transverse crack are presented in the literature survey in detail. Still
there is no detailed research has been described the performance of the spinning rotor
with transverse crack partially submerged in the viscous fluid medium.In this chapter a
systematic theoretical approach is used to investigate the influence of multiple cracks on
Chapter 3 Theoretical Analysis of DynamicResponse of Rotor with Multiple
Transverse Crack Partially Submerged in Viscous Medium
32
vibration responses of rotor partially submerged in the viscous medium. This analysis has
been divided into two parts first part contains the analysis for solid rotor without any crack
rotating in viscous medium. Whereas second part deals with the rotor with crack rotating
in viscous fluid. The dynamic response of multiple cracked rotor partially submerged in
the viscous medium with attached extra mass (i.e. Disc) has been calculated by using
influence coefficient method. The external fluid forces on the rotor are calculated by the
Navier-Stokes equation. The strain energy release rate at the crack section of the rotor has
been used for evaluating the local stiffness and is dependent on the crack depth. The
Simpson’s 1/3 rule is used in the theoretical analysis. Finally, the proposed theoretical
model results have been compared with results of the experimental analysis for the
authentication.
The present investigation for rotating rotor partially submerged in viscous medium with
multiple transverse crack can have extensive applications in industries such as, condition
monitoring of rotating shafts in various machineries with detection of crack, design of
high speed rotors used in centrifuges, boring machines as well as rotors used for
extracting oil from sea bed etc.
3.2 Theoretical Analysis of Spinning Rotor with
Transverse Crack Submerged in Viscous Medium
This segment introduces the methodology employed to devlop the proposed theoretical
model for calculating the vibration response (i.e. natural frequency and amplitude) of non-
cracked rotor and multiple transverse cracked rotor partially submerged in viscous
medium for different relative crack positions and depths. From the analysis of theoretical
results, it is found that a visible change in the natural frequency and amplitude have been
marked due to an existence of crack and viscosity of the viscous fluid.
3.2.1 Dynamic Analysis of Rotating Non-cracked Cantilever Rotor with
Additional Mass Partially Submerged in the Viscous Medium
For theoretical analysis a cantilever rotor with a disc at its free end rotating in viscous
medium is considered.
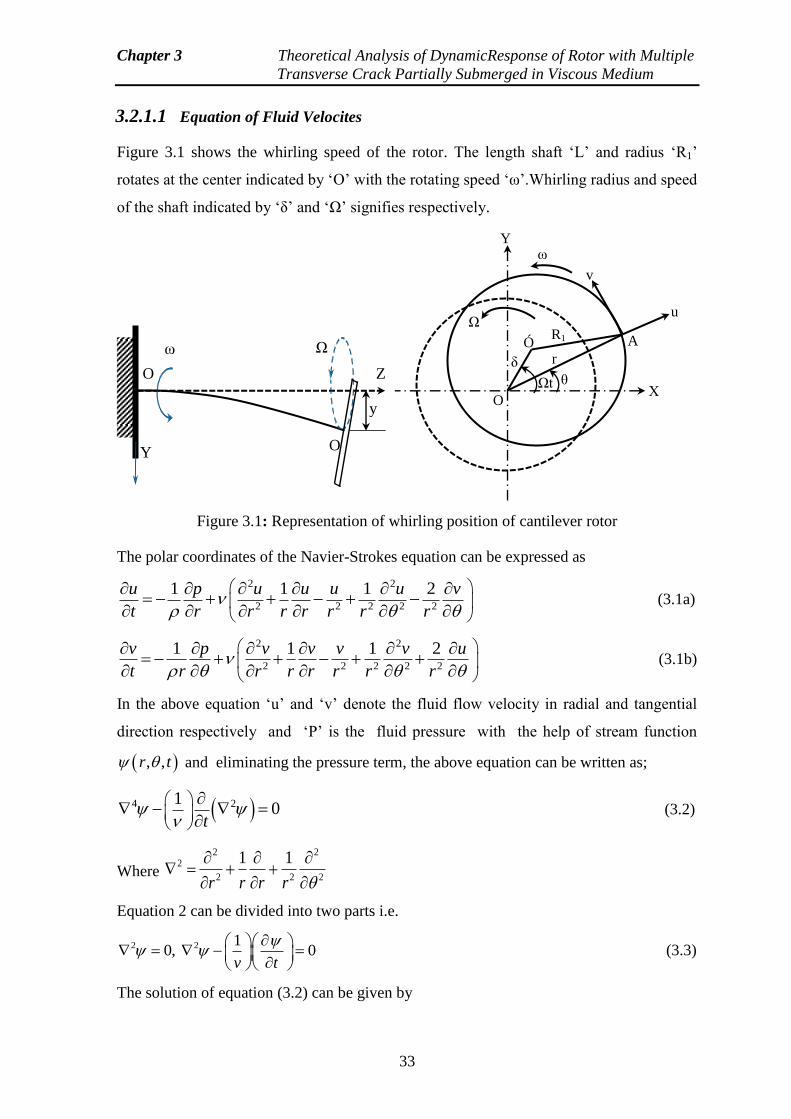
Chapter 3 Theoretical Analysis of DynamicResponse of Rotor with Multiple
Transverse Crack Partially Submerged in Viscous Medium
33
3.2.1.1 Equation of Fluid Velocites
Figure 3.1 shows the whirling speed of the rotor. The length shaft ‘L’ and radius ‘R1’
rotates at the center indicated by ‘O’ with the rotating speed ‘ω’.Whirling radius and speed
of the shaft indicated by ‘δ’ and ‘Ω’ signifies respectively.
Figure 3.1: Representation of whirling position of cantilever rotor
The polar coordinates of the Navier-Strokes equation can be expressed as
2 2
2 2 2 2 2
1 1 1 2u p u u u u v
t r r r r r r r
(3.1a)
2 2
2 2 2 2 2
1 1 1 2v p v v v v u
t r r r r r r r
(3.1b)
In the above equation ‘u’ and ‘v’ denote the fluid flow velocity in radial and tangential
direction respectively and ‘P’ is the fluid pressure with the help of stream function
, ,r t and eliminating the pressure term, the above equation can be written as;
4 210
t
(3.2)
Where
2 22
2 2 2
1 1
r r r r
Equation 2 can be divided into two parts i.e.
2 2 10, 0
v t
(3.3)
The solution of equation (3.2) can be given by
Y
A
Χ
v
ω
O
θ Ωt
Ó R1
δ r
Ω
Y
u
Ω ω
O
O
'
Z
y
Chapter 3 Theoretical Analysis of DynamicResponse of Rotor with Multiple
Transverse Crack Partially Submerged in Viscous Medium
34
1 2
Where 1 and 2 are solution of equation (3.3)
The radial and tangential component of flow velocity at point ‘A’ in Figure 3.1 are;
1 sin sin( )Au R a t (3.4a)
1 cos cos( )A R a t (3.4b)
Where ‘A’ is the angle between O’A and OA
1sin / sina R t and cos 1a for 1R
For 1r R the equation (3.4) can be rewritten as;
1sin Re
j t
r Ru t j e
(3.5a)
1 1 1cos Rej t
r Rv t R e R
(3.5b)
Where j = 1 and Re . denotes a real part of . .
For a special (i.e. For synchronous whirl, which is used in practice) case equation
(3.5) is reduced to
1
0r Ru
1 1Rej t
r Rv e R
(3.6)
When the rotor is immersed in an infinitely extending fluid region, the boundary condition
for r are;
0r ru v (3.7)
When the rotor is immersed in a finite extending fluid region the boundary conditions
for r = 2R (i.e. the container radius is taken as R2 ) are taken as;
2 20r R r Ru v (3.8)
Under these conditions, non-stationary components of the solution 1 and 2 can be
expressed as;
1 1, ,
j tr t F r e
(3.9a)
2 2, ,
j tr t F r e
(3.9b)
From equation (3.9a and 3.9b) and equation (3.3) we obtain;
2
2 ( )
1 12 2
1 1 i ti tF r e F r er r r r
Chapter 3 Theoretical Analysis of DynamicResponse of Rotor with Multiple
Transverse Crack Partially Submerged in Viscous Medium
35
2 2
1 1
12 2 2
1 10
i t i t i tF r F re e F r e
r r r r
2
1 1
12 2
1 10
d F r dF rF r
dr r dr r
(3.10a)
and
2
2
2 22 2
1 1 1 1i t i tF r e F r e
v t r r r r v t
2
2 2 2
2 22 2
1 10
i t i t i t i tF r F re e F r e K F r e
r r r r
2
2 2 2
22 2
1 10
d F r dF rK F r
dr r dr r
(3.10b)
Where j
kv
Since equation (3.10a) is a Euler’s equation and equation.(3.10b) is Bessel’s equation, the
general solution of these equations are easily derived as;
2
11
ARF r Br
r
, (3.11a)
2 1F r R CI Kr DK Kr (3.11b)
Where A, B, C and D are arbitrary constants, and 1I Kr and 1K Kr modified Bessel
functions of the 1st and 2
nd kinds, respectively. Thus the non-stationary components of
flow velocities induced by the whirling motion of a rotor are given as follows:
2
1 1 1 1
1 1 i t
r q q q qu R r B r R C I Kr D K Kr er r
2
1 1 11 1
i t
q q q q
R R Ri A B C I Kr D K Kr e
r r r
(3.12a)
2
1 1 1 1
i t
r q q q qV R r B r R C I Kr D K Kr er
2
1 11 1 0
11 1 0
q q q
q
R RA B C I Kr KR I Kr
r r
RD K Kr KR K Kr
r
(3.12b)
Chapter 3 Theoretical Analysis of DynamicResponse of Rotor with Multiple
Transverse Crack Partially Submerged in Viscous Medium
36
3.2.1.2 Analysis of Fluid Forces
Substituting the flow velocities given by equation (3.12) into the equation (3.1), the non-
stationary component of pressure p can be written as;
2 2 ( )
1
i tp Ap R Br e
r
(3.13)
Normal stress rr
and tangential stress r due to flow can be obtained as,
2rr
iup
r
and
1i ir
ur
r r r
(3.14)
Fluid forces acting on the surfaces (i.e. r R ) per unit length of the rotor in the x and y-
axis direction are obtained.
2
2
1 1 1
0
cos sin i t
x rr rF R d m A B CI DK e
(3.15a)
2
2
1 1 1
0
sin cos i t
y rr rF R d im A B CI DK e
(3.15b)
Where 2
1 1kR m R
Only the real part of equation (3.15) is meaning full, so Fx and Fy after simplification can
be expressed as;
2 Re cos Im sinxF m H t H t (3.16a)
2 Re sin Im cosyF m H t H t (3.16b)
Where 1 1H A B CI DK and Re H , Im H denotes the real and imaginary
part of H . The coordinates of the center of the rotor (as shown in the Figure 3.1) is
x cos t and sin t .
2
2Re Imx
d x dxF m H m H
dt dt (3.17a)
2
2Re Imy
d y dxF m H m H
dt dt (3.17b)
In equation mRe H denotes the virtual or added mass to the inertia force of the rotor
and m Im H symbolizes the viscous damping coefficient. In equation (3.17)
mRe H denotes the virtual or added mass of the fluid relating to the inertia force of the
rotor and m Im H .
Chapter 3 Theoretical Analysis of DynamicResponse of Rotor with Multiple
Transverse Crack Partially Submerged in Viscous Medium
37
3.2.1.3 Dynamic Response of the Spinning Rotor System
In order to avoid mathematical complicacy , the spinning cantilever rotor attached disc
at the tip of free end has been considered as a lumped system with mass of the disc as
well as equivalent mass of the rotor lumped at its free end. For the analysis of
dynamic response of the above system, mass of the disc is considered as 1Ms which is
attached at the free end of the rotor.
The mass of rotor is considered as 2Ms . Equivalent mass at the free end of the above
rotor system which will produce same natural frequency as that of the original system
may be considered as,
1 2eqMs Ms Ms
Where 2
2
eq
Ks
Ms
Ks and are stiffness and natural frequency of the rotor (without disc) respectively.
The equation of the motion of the equivalent lumped system rotating in fluid medium is
given by;
2
2
coss s x
d x tM K x F
t
(3.18a)
2
2
sins s y
d y tM K y F
t
(3.18b)
The fluid forces from equation (3.17) can be written as;
2
2Rex
d x dxF m H m lm H
dt dt (3.19a)
2
2Rey
d y dyF m H m lm H
dt dt (3.19b)
Where;
1 2 2
1 1 2 2
1 2
Re Re Re
Re
eq
eq
eq
M H M H M H
M H M lm H M lm H
M M M
(3.20)
Where 1M and 2M mass of the fluid displaced by the rotor and disc respectively.
From equation (3.18) and (3.19) we have;
2
2
2Re coss s s
d x dxM M H M lm H K x M t
dt dt
(3.21a)
Chapter 3 Theoretical Analysis of DynamicResponse of Rotor with Multiple
Transverse Crack Partially Submerged in Viscous Medium
38
2
2
2Re sins s s
d y dyM M H M lm H K y M t
dt dt
(3.21b)
Equation (3.21) in dimensionless from can be written as
2
2* * * * * *
21 Re cos
d dM H M lm H t
d dt
(3.22a)
2
2* * * * * *
21 Re sin
d dM H M lm H t
d dt
(3.22b)
Where 1
x
R ,
1
y
R , *
0r
, *
1R
, *
s
MM
M ,
0r or 0s
s
Kr
M
The steady state solution of the above equation can be obtain in dimensionless form
as;
* *cos (3.23)
Where *
1R
and (3.24a)
*
22 2
* *
A
K C
, (3.24b)
*1
2*
tanc
K
, (3.24c)
* *
*
( )
1 Re
M lm HC
M H
, (3.24d)
*
1
1 ReK
M H
, (3.24e)
2* *
*1 ReA
M H
(3.24f)
Where; = Maximum dimensionless amplitude
Figure 3.1 shows the whirling motion of the cantilever rotor with attached disc during
rotating condition, in a magnified view. Theoretical analysis for the rotor system is carried
out taking the data mentioned above into account using the expression (3.1 to 3.23) with
the help of computer programming (i.e. MATLAB). The “Simpson’s 1/3 rule for
integration algorithm” is used in numerical analysis.
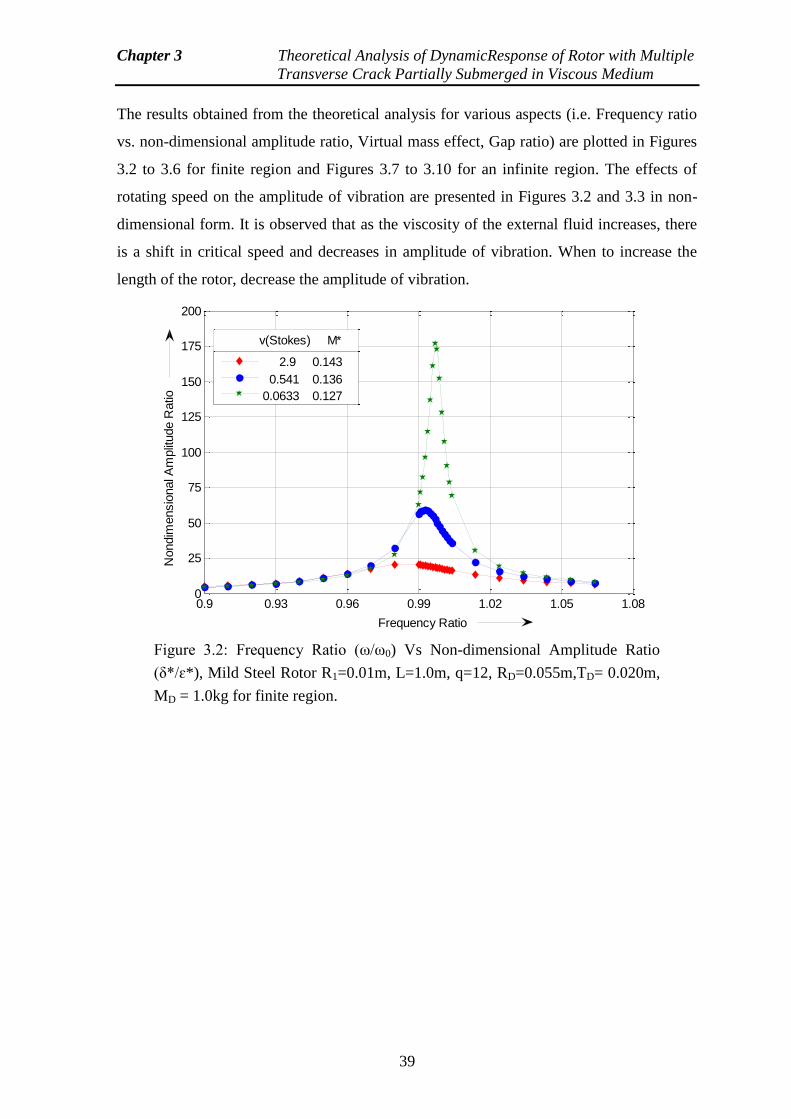
Chapter 3 Theoretical Analysis of DynamicResponse of Rotor with Multiple
Transverse Crack Partially Submerged in Viscous Medium
39
The results obtained from the theoretical analysis for various aspects (i.e. Frequency ratio
vs. non-dimensional amplitude ratio, Virtual mass effect, Gap ratio) are plotted in Figures
3.2 to 3.6 for finite region and Figures 3.7 to 3.10 for an infinite region. The effects of
rotating speed on the amplitude of vibration are presented in Figures 3.2 and 3.3 in non-
dimensional form. It is observed that as the viscosity of the external fluid increases, there
is a shift in critical speed and decreases in amplitude of vibration. When to increase the
length of the rotor, decrease the amplitude of vibration.
Figure 3.2: Frequency Ratio (ω/ω0) Vs Non-dimensional Amplitude Ratio
(δ*/ɛ*), Mild Steel Rotor R1=0.01m, L=1.0m, q=12, RD=0.055m,TD= 0.020m,
MD = 1.0kg for finite region.
0.9 0.93 0.96 0.99 1.02 1.05 1.080
25
50
75
100
125
150
175
200
Frequency Ratio
Nondim
ensio
nal A
mplit
ude R
atio
2.9 0.143
0.541 0.136
0.0633 0.127
v(Stokes) M*
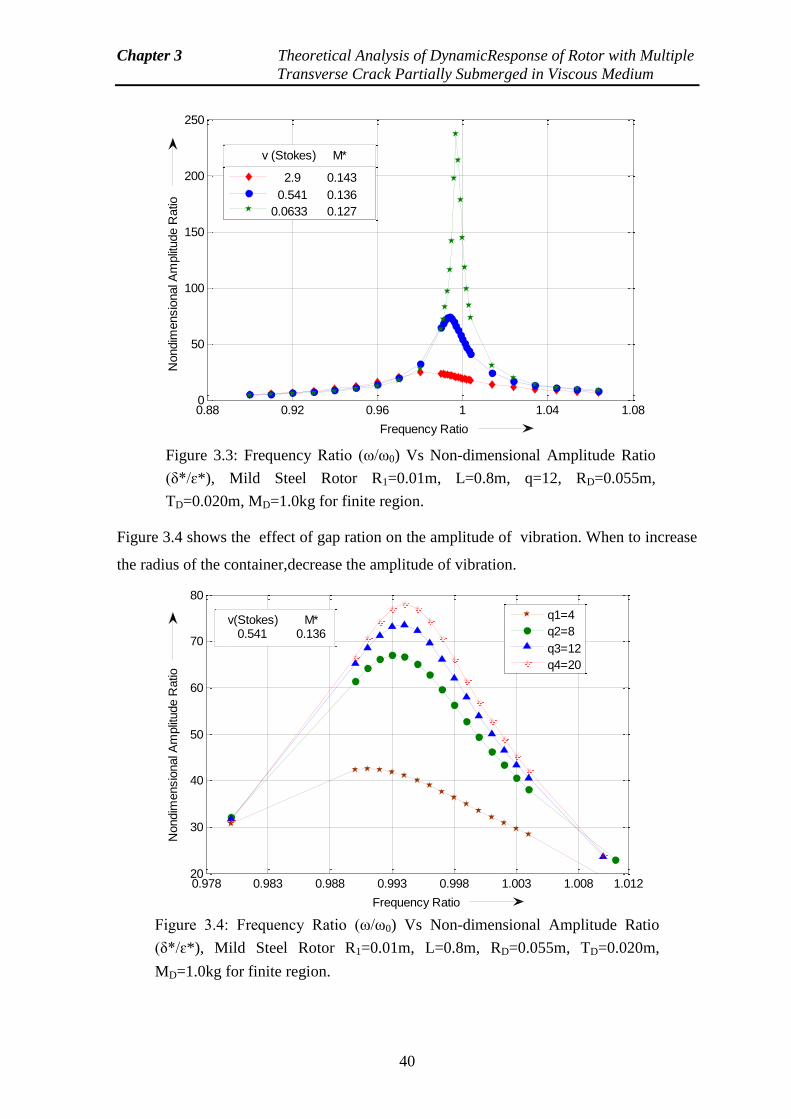
Chapter 3 Theoretical Analysis of DynamicResponse of Rotor with Multiple
Transverse Crack Partially Submerged in Viscous Medium
40
Figure 3.4 shows the effect of gap ration on the amplitude of vibration. When to increase
the radius of the container,decrease the amplitude of vibration.
Figure 3.3: Frequency Ratio (ω/ω0) Vs Non-dimensional Amplitude Ratio
(δ*/ɛ*), Mild Steel Rotor R1=0.01m, L=0.8m, q=12, RD=0.055m,
TD=0.020m, MD=1.0kg for finite region.
0.88 0.92 0.96 1 1.04 1.080
50
100
150
200
250
Frequency Ratio
Nondim
ensio
nal A
mplit
ude R
atio
2.9 0.143
0.541 0.136
0.0633 0.127
v (Stokes) M*
Figure 3.4: Frequency Ratio (ω/ω0) Vs Non-dimensional Amplitude Ratio
(δ*/ɛ*), Mild Steel Rotor R1=0.01m, L=0.8m, RD=0.055m, TD=0.020m,
MD=1.0kg for finite region.
0.978 0.983 0.988 0.993 0.998 1.003 1.008 1.01220
30
40
50
60
70
80
Frequency Ratio
Nondim
ensio
nal A
mplit
ude R
atio
q1=4
q2=8
q3=12
q4=20
v(Stokes) M* 0.541 0.136
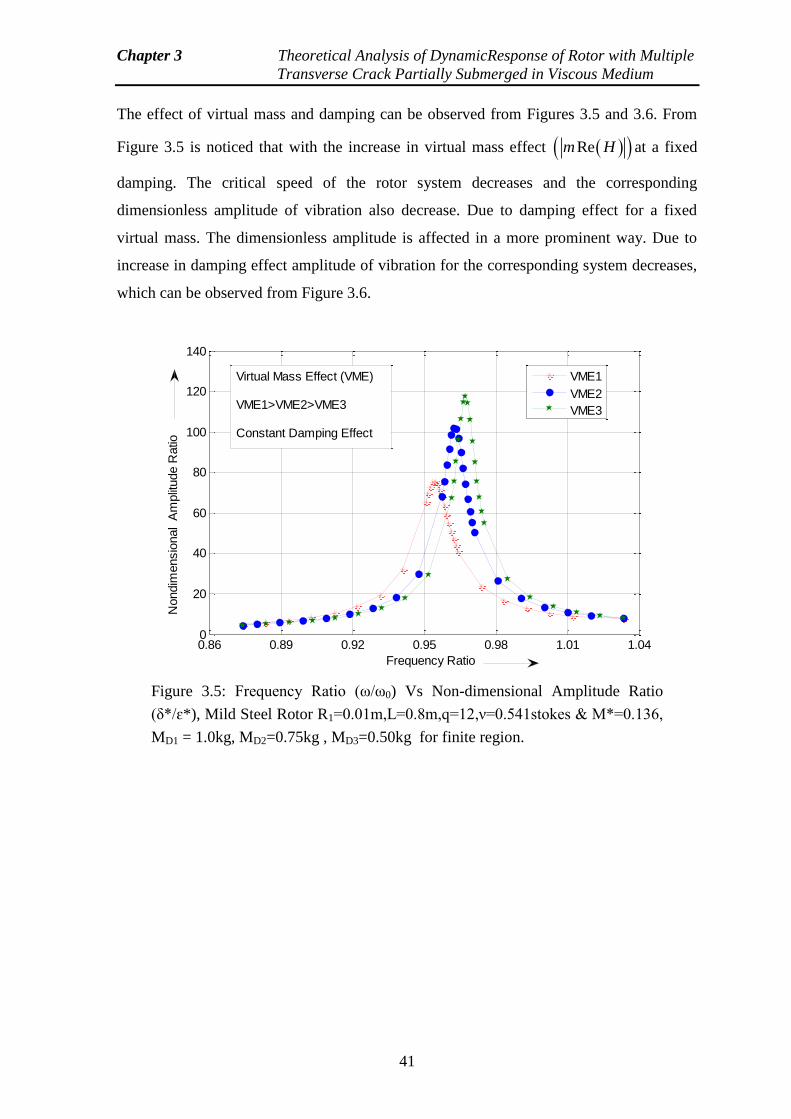
Chapter 3 Theoretical Analysis of DynamicResponse of Rotor with Multiple
Transverse Crack Partially Submerged in Viscous Medium
41
The effect of virtual mass and damping can be observed from Figures 3.5 and 3.6. From
Figure 3.5 is noticed that with the increase in virtual mass effect Rem H at a fixed
damping. The critical speed of the rotor system decreases and the corresponding
dimensionless amplitude of vibration also decrease. Due to damping effect for a fixed
virtual mass. The dimensionless amplitude is affected in a more prominent way. Due to
increase in damping effect amplitude of vibration for the corresponding system decreases,
which can be observed from Figure 3.6.
Figure 3.5: Frequency Ratio (ω/ω0) Vs Non-dimensional Amplitude Ratio
(δ*/ɛ*), Mild Steel Rotor R1=0.01m,L=0.8m,q=12,ν=0.541stokes & M*=0.136,
MD1 = 1.0kg, MD2=0.75kg , MD3=0.50kg for finite region.
0.86 0.89 0.92 0.95 0.98 1.01 1.040
20
40
60
80
100
120
140
Frequency Ratio
Nondim
ensio
nal
Am
plit
ude R
atio
VME1
VME2
VME3
Virtual Mass Effect (VME)
VME1>VME2>VME3
Constant Damping Effect
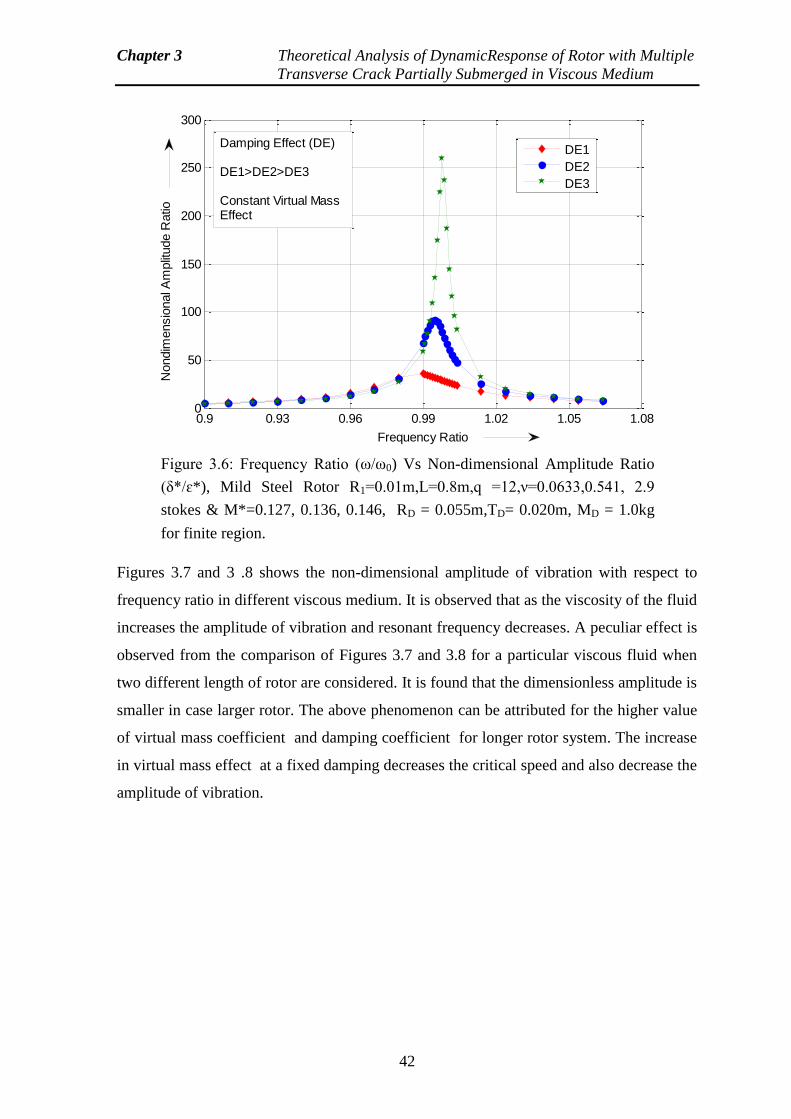
Chapter 3 Theoretical Analysis of DynamicResponse of Rotor with Multiple
Transverse Crack Partially Submerged in Viscous Medium
42
Figures 3.7 and 3 .8 shows the non-dimensional amplitude of vibration with respect to
frequency ratio in different viscous medium. It is observed that as the viscosity of the fluid
increases the amplitude of vibration and resonant frequency decreases. A peculiar effect is
observed from the comparison of Figures 3.7 and 3.8 for a particular viscous fluid when
two different length of rotor are considered. It is found that the dimensionless amplitude is
smaller in case larger rotor. The above phenomenon can be attributed for the higher value
of virtual mass coefficient and damping coefficient for longer rotor system. The increase
in virtual mass effect at a fixed damping decreases the critical speed and also decrease the
amplitude of vibration.
Figure 3.6: Frequency Ratio (ω/ω0) Vs Non-dimensional Amplitude Ratio
(δ*/ɛ*), Mild Steel Rotor R1=0.01m,L=0.8m,q =12,ν=0.0633,0.541, 2.9
stokes & M*=0.127, 0.136, 0.146, RD = 0.055m,TD= 0.020m, MD = 1.0kg
for finite region.
0.9 0.93 0.96 0.99 1.02 1.05 1.080
50
100
150
200
250
300
Frequency Ratio
Nondim
ensio
nal A
mplit
ude R
atio
DE1
DE2
DE3
Damping Effect (DE)
DE1>DE2>DE3
Constant Virtual MassEffect
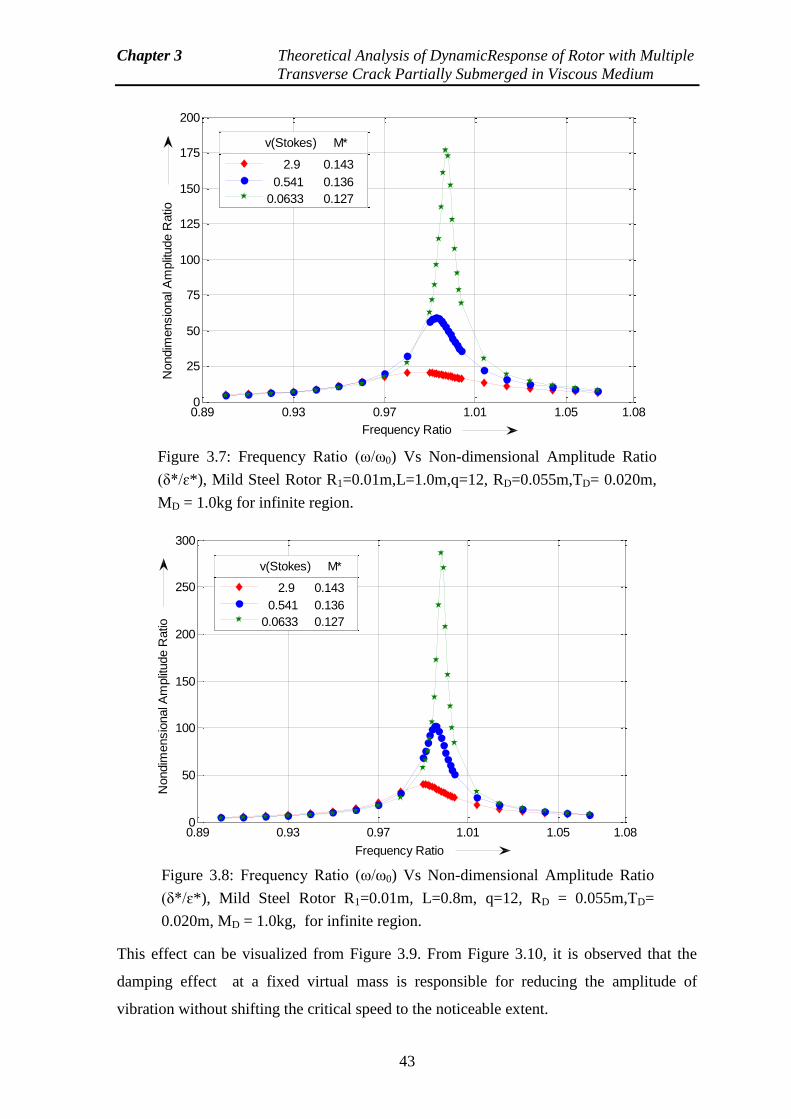
Chapter 3 Theoretical Analysis of DynamicResponse of Rotor with Multiple
Transverse Crack Partially Submerged in Viscous Medium
43
This effect can be visualized from Figure 3.9. From Figure 3.10, it is observed that the
damping effect at a fixed virtual mass is responsible for reducing the amplitude of
vibration without shifting the critical speed to the noticeable extent.
Figure 3.7: Frequency Ratio (ω/ω0) Vs Non-dimensional Amplitude Ratio
(δ*/ɛ*), Mild Steel Rotor R1=0.01m,L=1.0m,q=12, RD=0.055m,TD= 0.020m,
MD = 1.0kg for infinite region.
0.89 0.93 0.97 1.01 1.05 1.080
25
50
75
100
125
150
175
200
Frequency Ratio
Nondim
ensio
nal A
mplit
ude R
atio
2.9 0.143
0.541 0.136
0.0633 0.127
v(Stokes) M*
Figure 3.8: Frequency Ratio (ω/ω0) Vs Non-dimensional Amplitude Ratio
(δ*/ɛ*), Mild Steel Rotor R1=0.01m, L=0.8m, q=12, RD = 0.055m,TD=
0.020m, MD = 1.0kg, for infinite region.
0.89 0.93 0.97 1.01 1.05 1.080
50
100
150
200
250
300
Frequency Ratio
Nondim
ensio
nal A
mplit
ude R
atio
2.9 0.143
0.541 0.136
0.0633 0.127
v(Stokes) M*
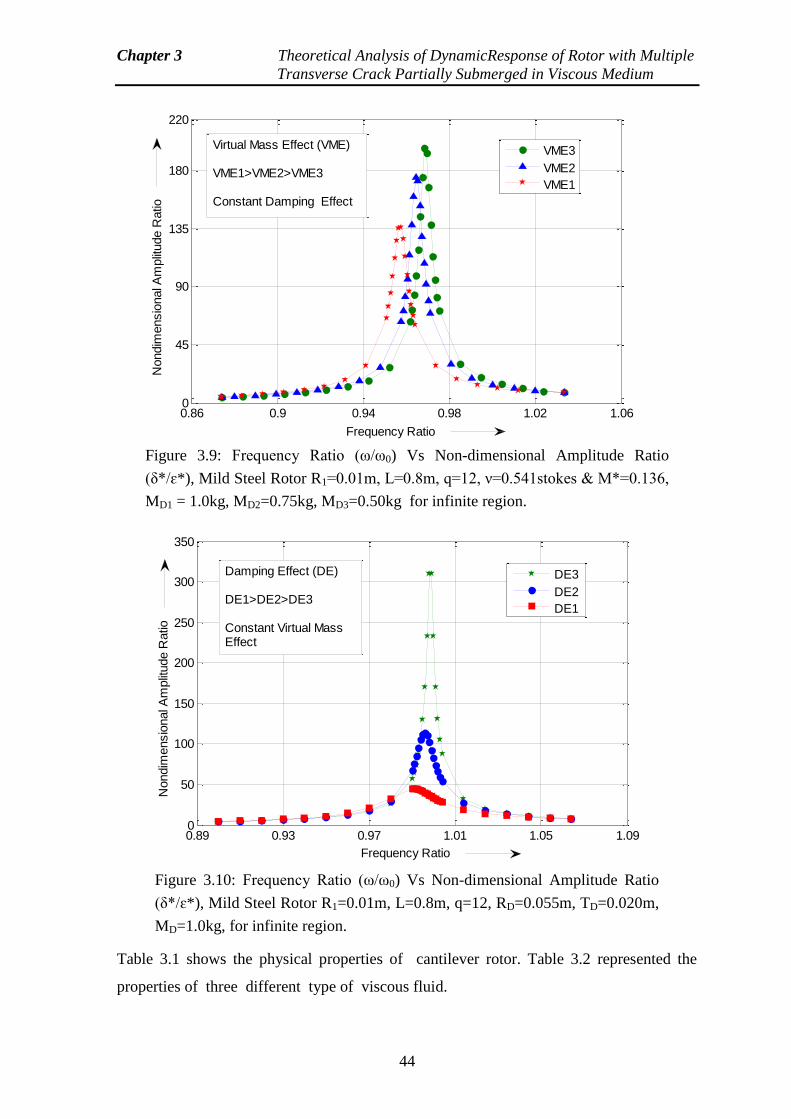
Chapter 3 Theoretical Analysis of DynamicResponse of Rotor with Multiple
Transverse Crack Partially Submerged in Viscous Medium
44
Table 3.1 shows the physical properties of cantilever rotor. Table 3.2 represented the
properties of three different type of viscous fluid.
Figure 3.9: Frequency Ratio (ω/ω0) Vs Non-dimensional Amplitude Ratio
(δ*/ɛ*), Mild Steel Rotor R1=0.01m, L=0.8m, q=12, ν=0.541stokes & M*=0.136,
MD1 = 1.0kg, MD2=0.75kg, MD3=0.50kg for infinite region.
0.86 0.9 0.94 0.98 1.02 1.060
45
90
135
180
220
Frequency Ratio
Nondim
ensio
nal A
mplit
ude R
atio
VME3
VME2
VME1
Virtual Mass Effect (VME)
VME1>VME2>VME3
Constant Damping Effect
Figure 3.10: Frequency Ratio (ω/ω0) Vs Non-dimensional Amplitude Ratio
(δ*/ɛ*), Mild Steel Rotor R1=0.01m, L=0.8m, q=12, RD=0.055m, TD=0.020m,
MD=1.0kg, for infinite region.
0.89 0.93 0.97 1.01 1.05 1.090
50
100
150
200
250
300
350
Frequency Ratio
Nondim
ensio
nal A
mplit
ude R
atio
DE3
DE2
DE1
Damping Effect (DE)
DE1>DE2>DE3
Constant Virtual MassEffect
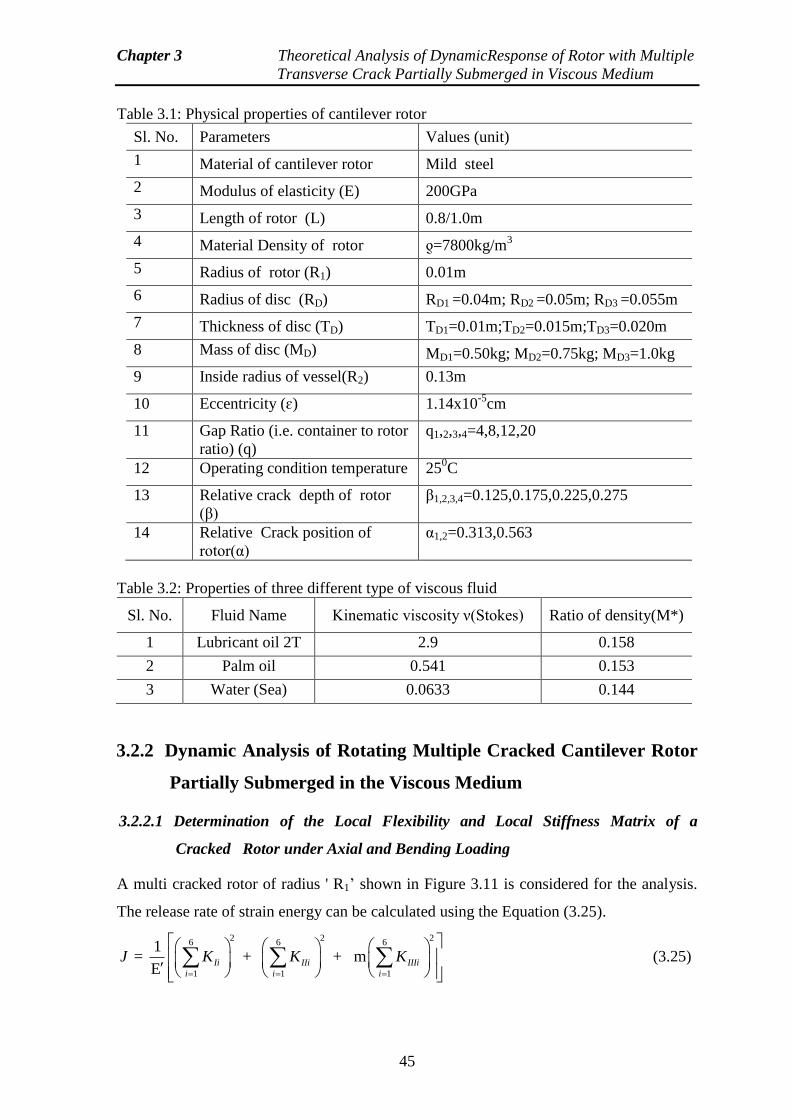
Chapter 3 Theoretical Analysis of DynamicResponse of Rotor with Multiple
Transverse Crack Partially Submerged in Viscous Medium
45
Table 3.1: Physical properties of cantilever rotor
Sl. No. Parameters Values (unit)
1 Material of cantilever rotor Mild steel
2 Modulus of elasticity (E) 200GPa
3 Length of rotor (L) 0.8/1.0m
4 Material Density of rotor ƍ=7800kg/m3
5 Radius of rotor (R1) 0.01m
6 Radius of disc (RD) RD1 =0.04m; RD2 =0.05m; RD3 =0.055m
7 Thickness of disc (TD) TD1=0.01m;TD2=0.015m;TD3=0.020m
8 Mass of disc (MD) MD1=0.50kg; MD2=0.75kg; MD3=1.0kg
9 Inside radius of vessel(R2) 0.13m
10 Eccentricity (ɛ) 1.14x10⁻⁵
cm
11 Gap Ratio (i.e. container to rotor
ratio) (q)
q1,2,3,4=4,8,12,20
12 Operating condition temperature 250C
13 Relative crack depth of rotor
(β)
β1,2,3,4=0.125,0.175,0.225,0.275
14 Relative Crack position of
rotor(α)
α1,2=0.313,0.563
Table 3.2: Properties of three different type of viscous fluid
Sl. No. Fluid Name Kinematic viscosity ν(Stokes) Ratio of density(M*)
1 Lubricant oil 2T 2.9 0.158
2 Palm oil 0.541 0.153
3 Water (Sea) 0.0633 0.144
3.2.2 Dynamic Analysis of Rotating Multiple Cracked Cantilever Rotor
Partially Submerged in the Viscous Medium
3.2.2.1 Determination of the Local Flexibility and Local Stiffness Matrix of a
Cracked Rotor under Axial and Bending Loading
A multi cracked rotor of radius ' R1’ shown in Figure 3.11 is considered for the analysis.
The release rate of strain energy can be calculated using the Equation (3.25).
2 2 26 6 6
1 1 1
1 = + + m
EIi IIi IIIi
i i i
J K K K
(3.25)
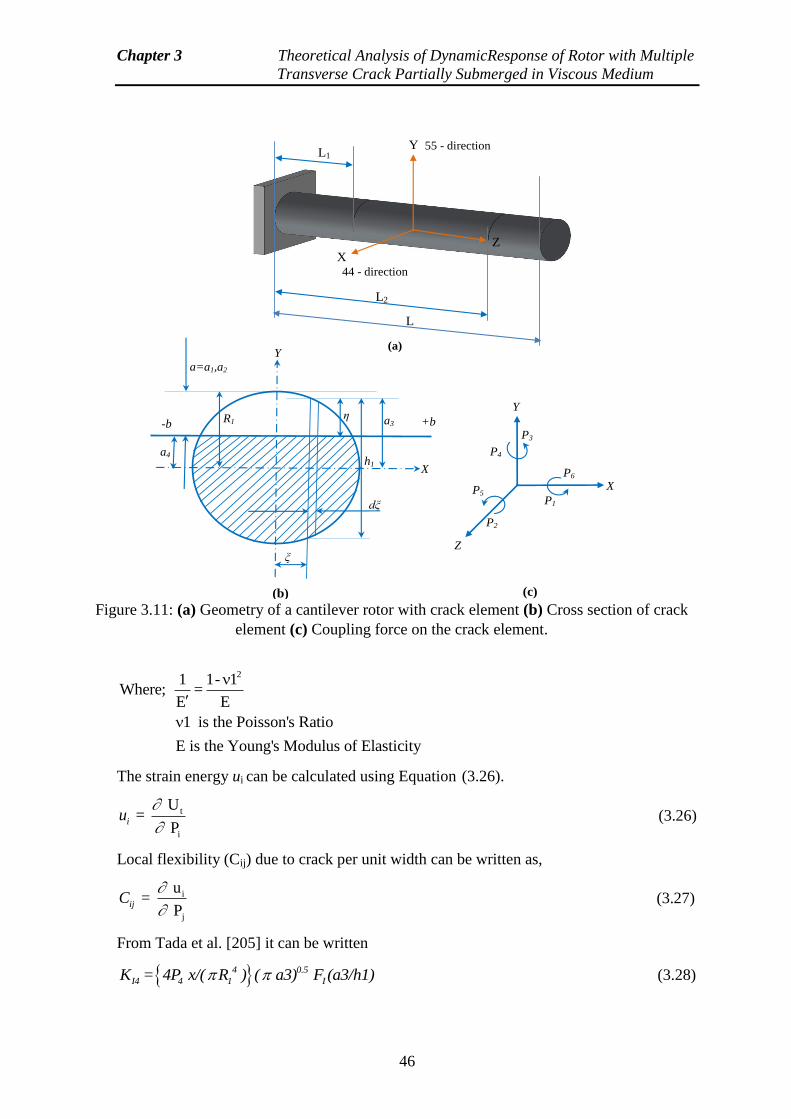
Chapter 3 Theoretical Analysis of DynamicResponse of Rotor with Multiple
Transverse Crack Partially Submerged in Viscous Medium
46
21 1- 1Where; =
E E
1 is the Poisson's Ratio
E is the Young's Modulus of Elasticity
The strain energy ui can be calculated using Equation (3.26).
t
i
U =
Piu
(3.26)
Local flexibility (Cij) due to crack per unit width can be written as,
i
j
u =
PijC
(3.27)
From Tada et al. [205] it can be written
4 0.5
I4 4 1 IK = 4P x/( R ) ( a3) F (a3/h1) (3.28)
X
+b
(b)
ξ
η a3
a4
-b
h1
R1
Y
a=a1,a2
dξ
(c)
P2
P6
P1
P5
Y
P4
P3
Z
X
(a)
44 - direction
L
L2
L1
Z
Y 55 - direction
X
Figure 3.11: (a) Geometry of a cantilever rotor with crack element (b) Cross section of crack
element (c) Coupling force on the crack element.
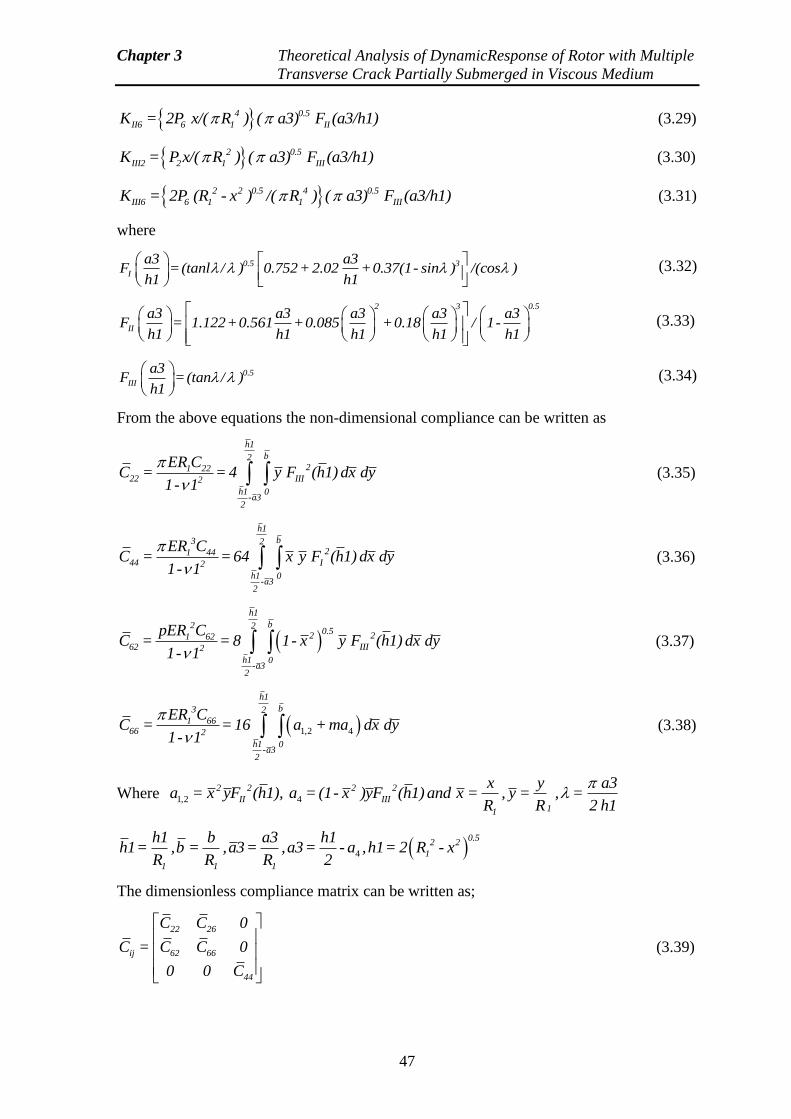
Chapter 3 Theoretical Analysis of DynamicResponse of Rotor with Multiple
Transverse Crack Partially Submerged in Viscous Medium
47
4 0.5
II6 6 1 IIK = 2P x/( R ) ( a3) F (a3/h1) (3.29)
2 0.5
III2 2 1 IIIK = P x/( R ) ( a3) F (a3/h1) (3.30)
2 2 0.5 4 0.5
III6 6 1 1 IIIK = 2P (R - x ) /( R ) ( a3) F (a3/h1) (3.31)
where
0.5 3
I
a3 a3F = (tanl / ) 0.752 + 2.02 + 0.37(1- sin ) /(cos )
h1 h1
(3.32)
2 3 0.5
II
a3 a3 a3 a3 a3F = 1.122+ 0.561 + 0.085 + 0.18 / 1-
h1 h1 h1 h1 h1
(3.33)
0.5
III
a3F = (tan / )
h1
(3.34)
From the above equations the non-dimensional compliance can be written as
h1
b221 22
22 III2
h1 0-a3
2
ER CC = = 4 y F (h1) dx dy
1- 1
(3.35)
h1
b3 221 44
44 I2
h1 0-a3
2
ER CC = = 64 x y F (h1) dx dy
1- 1
(3.36)
h1
b2 20.5
2 21 6262 III2
h1 0-a3
2
pER CC = = 8 1- x y F (h1) dx dy
1- 1 (3.37)
1,2 4
h1
b3 2
1 6666 2
h1 0-a3
2
ER CC = = 16 a + ma dx dy
1- 1
(3.38)
Where 1,2 4
2 2 2 2
II III11
x y a3 a = x yF (h1), a = (1- x )yF (h1) and x = , y = , =
R R 2 h1
4
0.52 2
1
1 1 1
h1 b a3 h1h1= , b = , a3= , a3= - a , h1= 2 R - x
R R R 2
The dimensionless compliance matrix can be written as;
22 26
ij 62 66
44
C C 0
C = C C 0
0 0 C
(3.39)
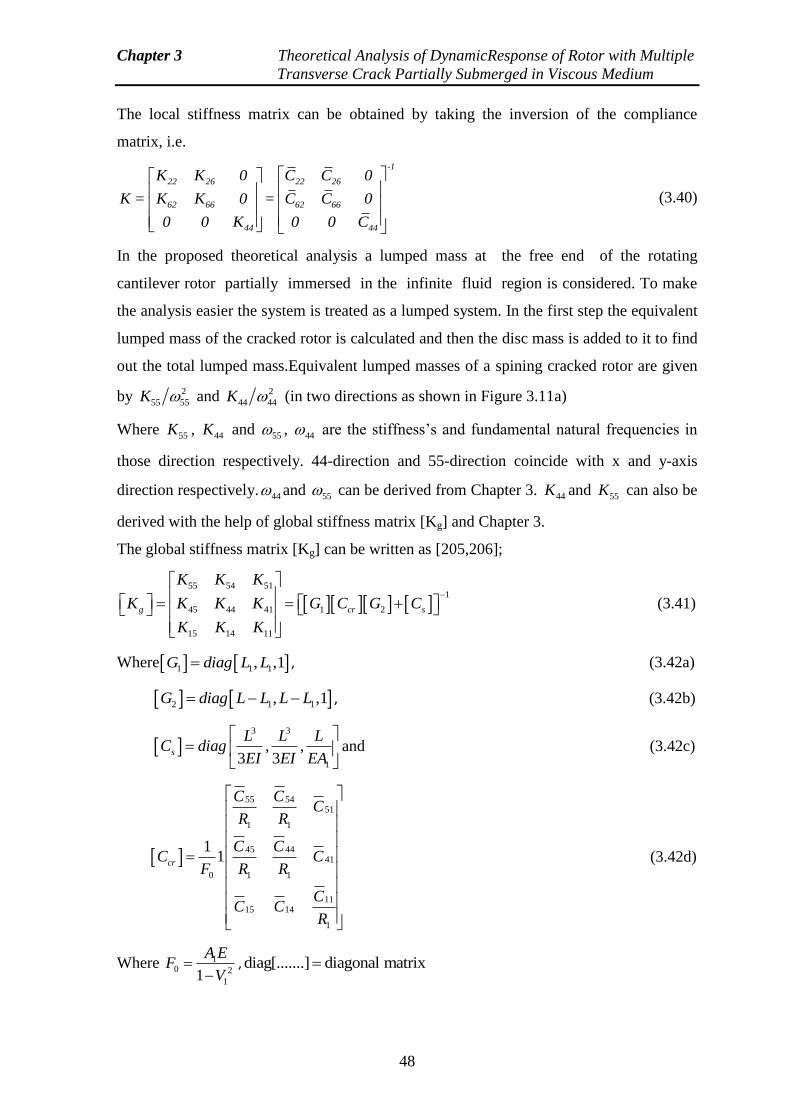
Chapter 3 Theoretical Analysis of DynamicResponse of Rotor with Multiple
Transverse Crack Partially Submerged in Viscous Medium
48
The local stiffness matrix can be obtained by taking the inversion of the compliance
matrix, i.e.
-1
22 26 22 26
62 66 62 66
44 44
K K 0 C C 0
K = K K 0 = C C 0
0 0 K 0 0 C
(3.40)
In the proposed theoretical analysis a lumped mass at the free end of the rotating
cantilever rotor partially immersed in the infinite fluid region is considered. To make
the analysis easier the system is treated as a lumped system. In the first step the equivalent
lumped mass of the cracked rotor is calculated and then the disc mass is added to it to find
out the total lumped mass.Equivalent lumped masses of a spining cracked rotor are given
by 2
55 55K and 2
44 44K (in two directions as shown in Figure 3.11a)
Where 55K , 44K and 55 , 44 are the stiffness’s and fundamental natural frequencies in
those direction respectively. 44-direction and 55-direction coincide with x and y-axis
direction respectively. 44 and 55 can be derived from Chapter 3. 44K and 55K can also be
derived with the help of global stiffness matrix [Kg] and Chapter 3.
The global stiffness matrix [Kg] can be written as [205,206];
55 54 51
1
45 44 41 1 2
15 14 11
g cr s
K K K
K K K K G C G C
K K K
(3.41)
Where 1 1 1, ,1G diag L L , (3.42a)
2 1 1, ,1G diag L L L L , (3.42b)
3 3
1
, ,3 3
s
L L LC diag
EI EI EA
and (3.42c)
55 5451
1 1
45 4441
0 1 1
1115 14
1
11cr
C CC
R R
C CC C
F R R
CC C
R
(3.42d)
Where 10 2
11
A EF
V
, diag[.......] diagonal matrix
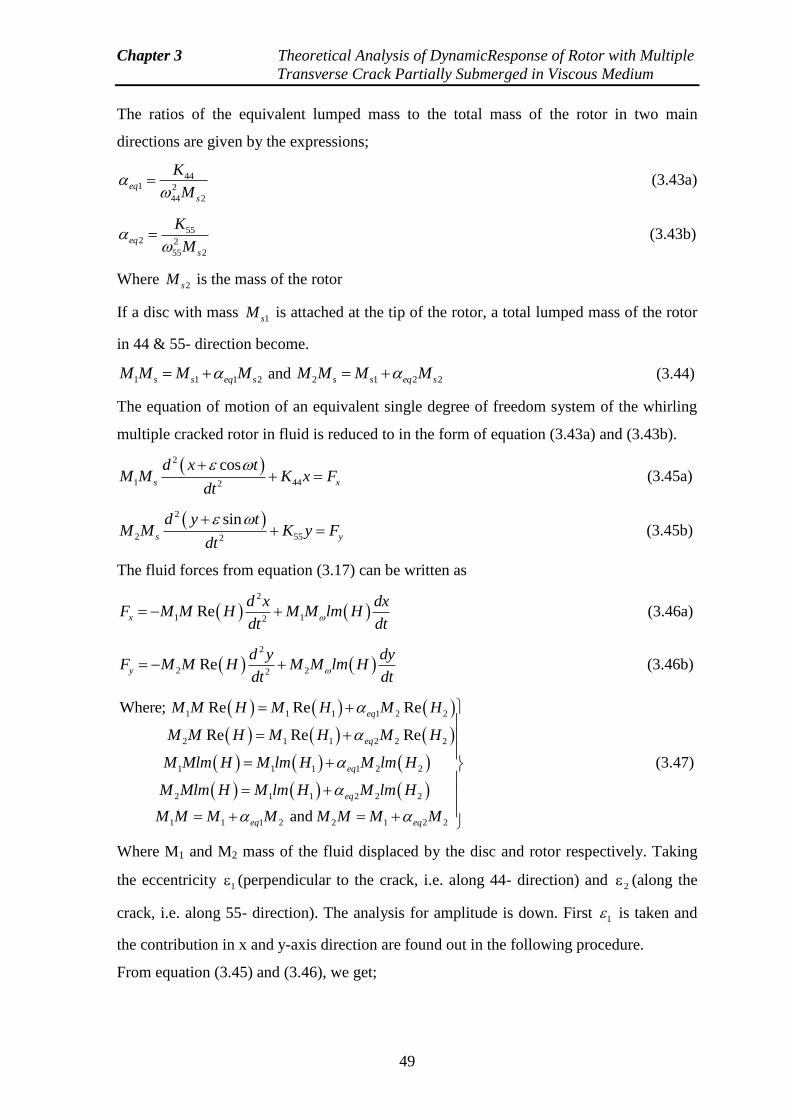
Chapter 3 Theoretical Analysis of DynamicResponse of Rotor with Multiple
Transverse Crack Partially Submerged in Viscous Medium
49
The ratios of the equivalent lumped mass to the total mass of the rotor in two main
directions are given by the expressions;
441 2
44 2
eq
s
K
M
(3.43a)
552 2
55 2
eq
s
K
M
(3.43b)
Where 2sM is the mass of the rotor
If a disc with mass 1sM is attached at the tip of the rotor, a total lumped mass of the rotor
in 44 & 55- direction become.
1 1 1 2s s eq sM M M M and 2 1 2 2s s eq sM M M M (3.44)
The equation of motion of an equivalent single degree of freedom system of the whirling
multiple cracked rotor in fluid is reduced to in the form of equation (3.43a) and (3.43b).
2
1 442
coss x
d x tM M K x F
dt
(3.45a)
2
2 552
sins y
d y tM M K y F
dt
(3.45b)
The fluid forces from equation (3.17) can be written as
2
1 12Rex
d x dxF M M H M M lm H
dt dt (3.46a)
2
2 22Rey
d y dyF M M H M M lm H
dt dt (3.46b)
1 1 1 1 2 2
2 1 1 2 2 2
1 1 1 1 2 2
2 1 1 2 2 2
1 1 1 2 2 1 2 2
Whe Re Re Re
Re Re Re
and
re; eq
eq
eq
eq
eq eq
M M H M H M H
M M H M H M H
M Mlm H M lm H M lm H
M Mlm H M lm H M lm H
M M M M M M M M
(3.47)
Where M1 and M2 mass of the fluid displaced by the disc and rotor respectively. Taking
the eccentricity 1 (perpendicular to the crack, i.e. along 44- direction) and 2 (along the
crack, i.e. along 55- direction). The analysis for amplitude is down. First 1 is taken and
the contribution in x and y-axis direction are found out in the following procedure.
From equation (3.45) and (3.46), we get;
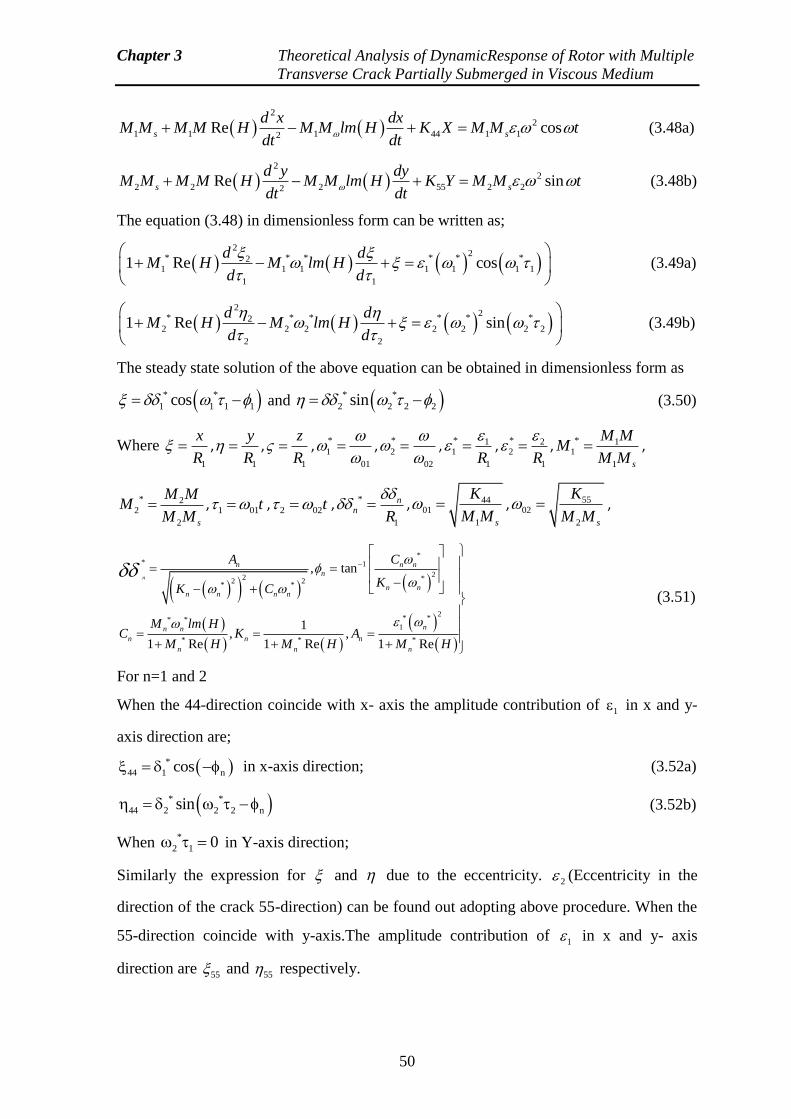
Chapter 3 Theoretical Analysis of DynamicResponse of Rotor with Multiple
Transverse Crack Partially Submerged in Viscous Medium
50
2
2
1 1 1 44 1 12Re coss s
d x dxM M M M H M M lm H K X M M t
dt dt (3.48a)
2
2
2 2 2 55 2 22Re sins s
d y dyM M M M H M M lm H K Y M M t
dt dt (3.48b)
The equation (3.48) in dimensionless form can be written as;
2
2* * * * * *2
1 1 1 1 1 1 1
1 1
1 Re cosd d
M H M lm Hd d
(3.49a)
2
2* * * * * *2
2 2 2 2 2 2 2
2 2
1 Re sind d
M H M lm Hd d
(3.49b)
The steady state solution of the above equation can be obtained in dimensionless form as
* *
1 1 1 1cos and * *
2 2 2 2sin (3.50)
Where 1
x
R ,
1
y
R ,
1
z
R , *
1
01
, *
2
02
, * 1
1
1R
, * 2
2
1R
, * 1
1
1 s
M MM
M M ,
* 22
2 s
M MM
M M ,
1 01t ,2 02t , *
1
nn
R
, 44
01
1 s
K
M M , 55
02
2 s
K
M M ,
** 1
22 *2 2* *
2* ** *
1
* * *
, tan
1, ,
1 Re 1 Re 1 Re
n
n n n
n
n nn n n n
nn n
n n n
n n n
A C
KK C
M lm HC K A
M H M H M H
(3.51)
For n=1 and 2
When the 44-direction coincide with x- axis the amplitude contribution of 1 in x and y-
axis direction are;
*
44 1 ncos in x-axis direction; (3.52a)
* *
44 2 2 2 nsin (3.52b)
When *
2 1 0 in Y-axis direction;
Similarly the expression for and due to the eccentricity. 2 (Eccentricity in the
direction of the crack 55-direction) can be found out adopting above procedure. When the
55-direction coincide with y-axis.The amplitude contribution of 1 in x and y- axis
direction are 55 and 55 respectively.
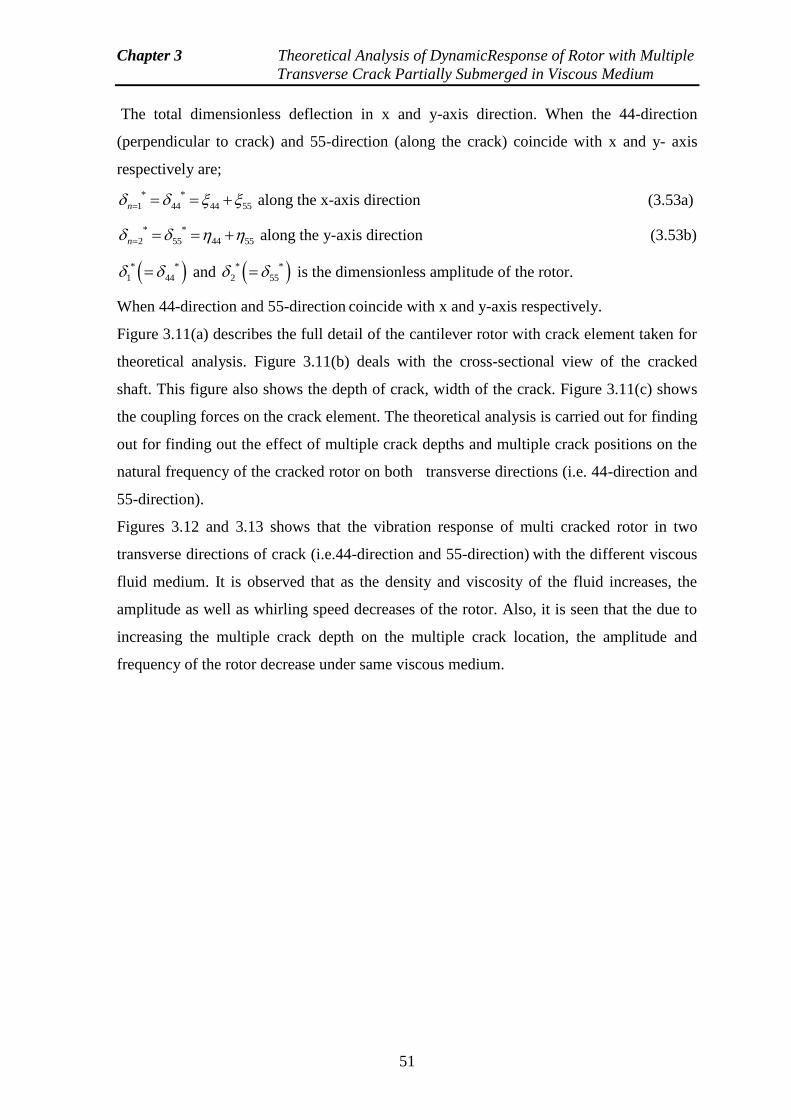
Chapter 3 Theoretical Analysis of DynamicResponse of Rotor with Multiple
Transverse Crack Partially Submerged in Viscous Medium
51
The total dimensionless deflection in x and y-axis direction. When the 44-direction
(perpendicular to crack) and 55-direction (along the crack) coincide with x and y- axis
respectively are;
* *
1 44 44 55n along the x-axis direction (3.53a)
* *
2 55 44 55n along the y-axis direction (3.53b)
* *
1 44 and * *
2 55 is the dimensionless amplitude of the rotor.
When 44-direction and 55-direction coincide with x and y-axis respectively.
Figure 3.11(a) describes the full detail of the cantilever rotor with crack element taken for
theoretical analysis. Figure 3.11(b) deals with the cross-sectional view of the cracked
shaft. This figure also shows the depth of crack, width of the crack. Figure 3.11(c) shows
the coupling forces on the crack element. The theoretical analysis is carried out for finding
out for finding out the effect of multiple crack depths and multiple crack positions on the
natural frequency of the cracked rotor on both transverse directions (i.e. 44-direction and
55-direction).
Figures 3.12 and 3.13 shows that the vibration response of multi cracked rotor in two
transverse directions of crack (i.e.44-direction and 55-direction) with the different viscous
fluid medium. It is observed that as the density and viscosity of the fluid increases, the
amplitude as well as whirling speed decreases of the rotor. Also, it is seen that the due to
increasing the multiple crack depth on the multiple crack location, the amplitude and
frequency of the rotor decrease under same viscous medium.
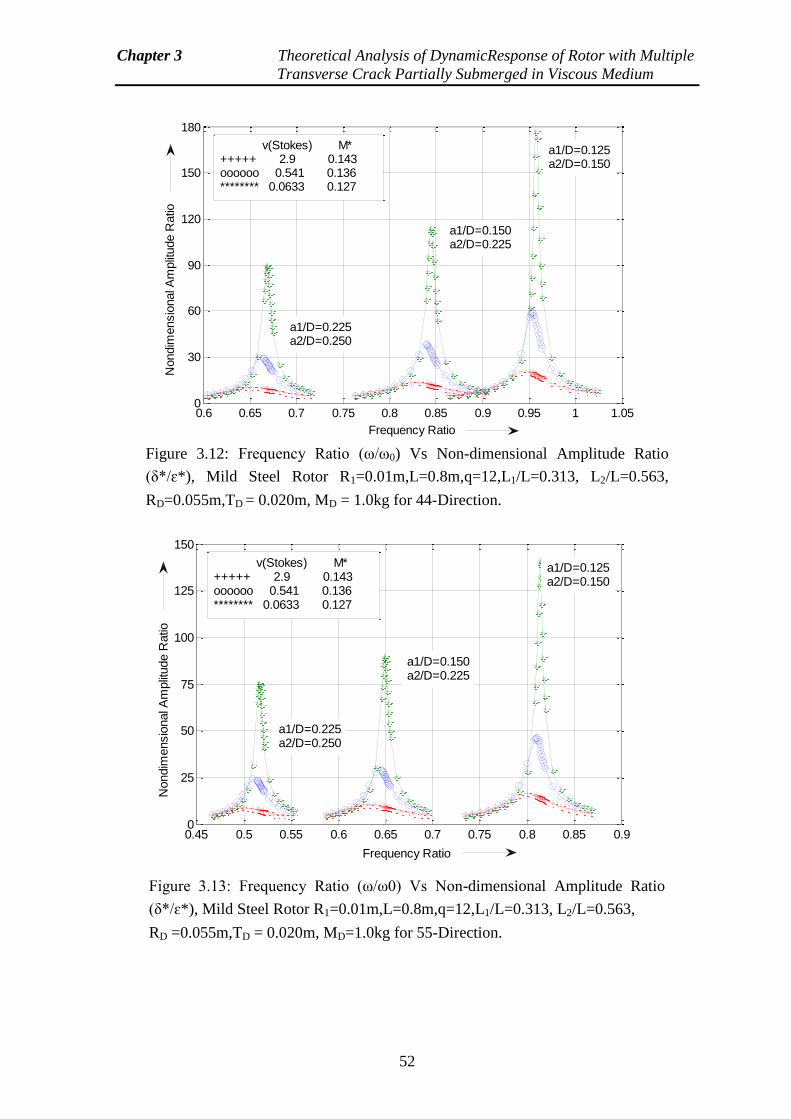
Chapter 3 Theoretical Analysis of DynamicResponse of Rotor with Multiple
Transverse Crack Partially Submerged in Viscous Medium
52
Figure 3.12: Frequency Ratio (ω/ω0) Vs Non-dimensional Amplitude Ratio
(δ*/ɛ*), Mild Steel Rotor R1=0.01m,L=0.8m,q=12,L1/L=0.313, L2/L=0.563,
RD=0.055m,TD = 0.020m, MD = 1.0kg for 44-Direction.
0.6 0.65 0.7 0.75 0.8 0.85 0.9 0.95 1 1.050
30
60
90
120
150
180
Frequency Ratio
Nondim
ensio
nal A
mplit
ude R
atio
v(Stokes) M*+++++ 2.9 0.143oooooo 0.541 0.136******** 0.0633 0.127
a1/D=0.225a2/D=0.250
a1/D=0.125a2/D=0.150
a1/D=0.150a2/D=0.225
Figure 3.13: Frequency Ratio (ω/ω0) Vs Non-dimensional Amplitude Ratio
(δ*/ɛ*), Mild Steel Rotor R1=0.01m,L=0.8m,q=12,L1/L=0.313, L2/L=0.563,
RD =0.055m,TD = 0.020m, MD=1.0kg for 55-Direction.
0.45 0.5 0.55 0.6 0.65 0.7 0.75 0.8 0.85 0.90
25
50
75
100
125
150
Frequency Ratio
Nondim
ensio
nal A
mplit
ude R
atio
v(Stokes) M*+++++ 2.9 0.143oooooo 0.541 0.136******** 0.0633 0.127
a1/D=0.125a2/D=0.150
a1/D=0.150a2/D=0.225
a1/D=0.225a2/D=0.250
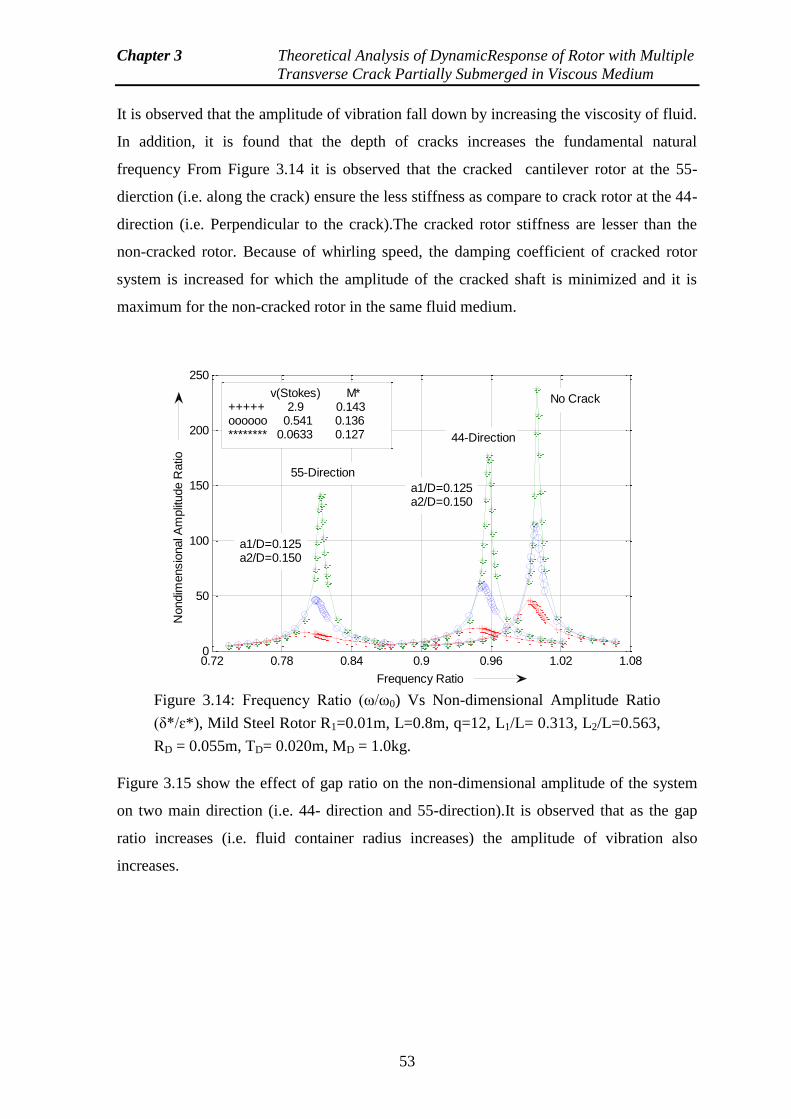
Chapter 3 Theoretical Analysis of DynamicResponse of Rotor with Multiple
Transverse Crack Partially Submerged in Viscous Medium
53
It is observed that the amplitude of vibration fall down by increasing the viscosity of fluid.
In addition, it is found that the depth of cracks increases the fundamental natural
frequency From Figure 3.14 it is observed that the cracked cantilever rotor at the 55-
dierction (i.e. along the crack) ensure the less stiffness as compare to crack rotor at the 44-
direction (i.e. Perpendicular to the crack).The cracked rotor stiffness are lesser than the
non-cracked rotor. Because of whirling speed, the damping coefficient of cracked rotor
system is increased for which the amplitude of the cracked shaft is minimized and it is
maximum for the non-cracked rotor in the same fluid medium.
Figure 3.15 show the effect of gap ratio on the non-dimensional amplitude of the system
on two main direction (i.e. 44- direction and 55-direction).It is observed that as the gap
ratio increases (i.e. fluid container radius increases) the amplitude of vibration also
increases.
Figure 3.14: Frequency Ratio (ω/ω0) Vs Non-dimensional Amplitude Ratio
(δ*/ɛ*), Mild Steel Rotor R1=0.01m, L=0.8m, q=12, L1/L= 0.313, L2/L=0.563,
RD = 0.055m, TD= 0.020m, MD = 1.0kg.
0.72 0.78 0.84 0.9 0.96 1.02 1.080
50
100
150
200
250
Frequency Ratio
Nondim
ensio
nal A
mplit
ude R
atio
v(Stokes) M*+++++ 2.9 0.143oooooo 0.541 0.136******** 0.0633 0.127 44-Direction
55-Direction
No Crack
a1/D=0.125a2/D=0.150
a1/D=0.125a2/D=0.150
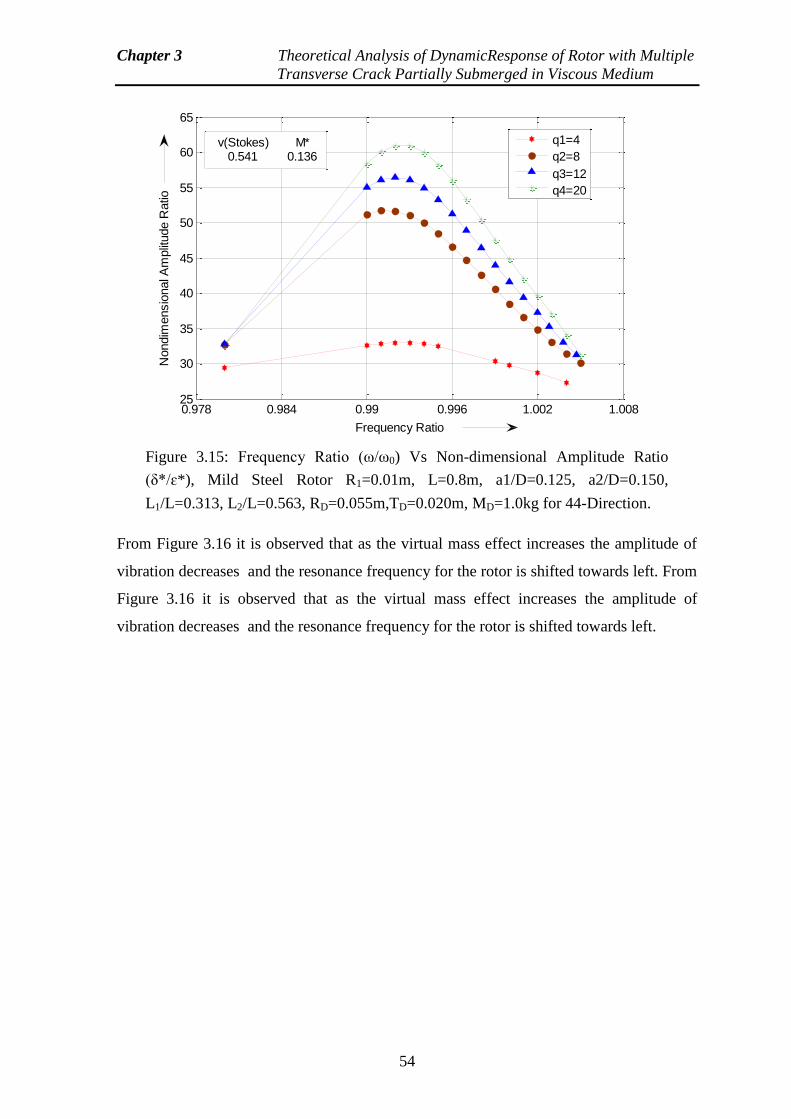
Chapter 3 Theoretical Analysis of DynamicResponse of Rotor with Multiple
Transverse Crack Partially Submerged in Viscous Medium
54
From Figure 3.16 it is observed that as the virtual mass effect increases the amplitude of
vibration decreases and the resonance frequency for the rotor is shifted towards left. From
Figure 3.16 it is observed that as the virtual mass effect increases the amplitude of
vibration decreases and the resonance frequency for the rotor is shifted towards left.
Figure 3.15: Frequency Ratio (ω/ω0) Vs Non-dimensional Amplitude Ratio
(δ*/ɛ*), Mild Steel Rotor R1=0.01m, L=0.8m, a1/D=0.125, a2/D=0.150,
L1/L=0.313, L2/L=0.563, RD=0.055m,TD=0.020m, MD=1.0kg for 44-Direction.
0.978 0.984 0.99 0.996 1.002 1.00825
30
35
40
45
50
55
60
65
Frequency Ratio
Nondim
ensio
nal A
mplit
ude R
atio
q1=4
q2=8
q3=12
q4=20
v(Stokes) M* 0.541 0.136
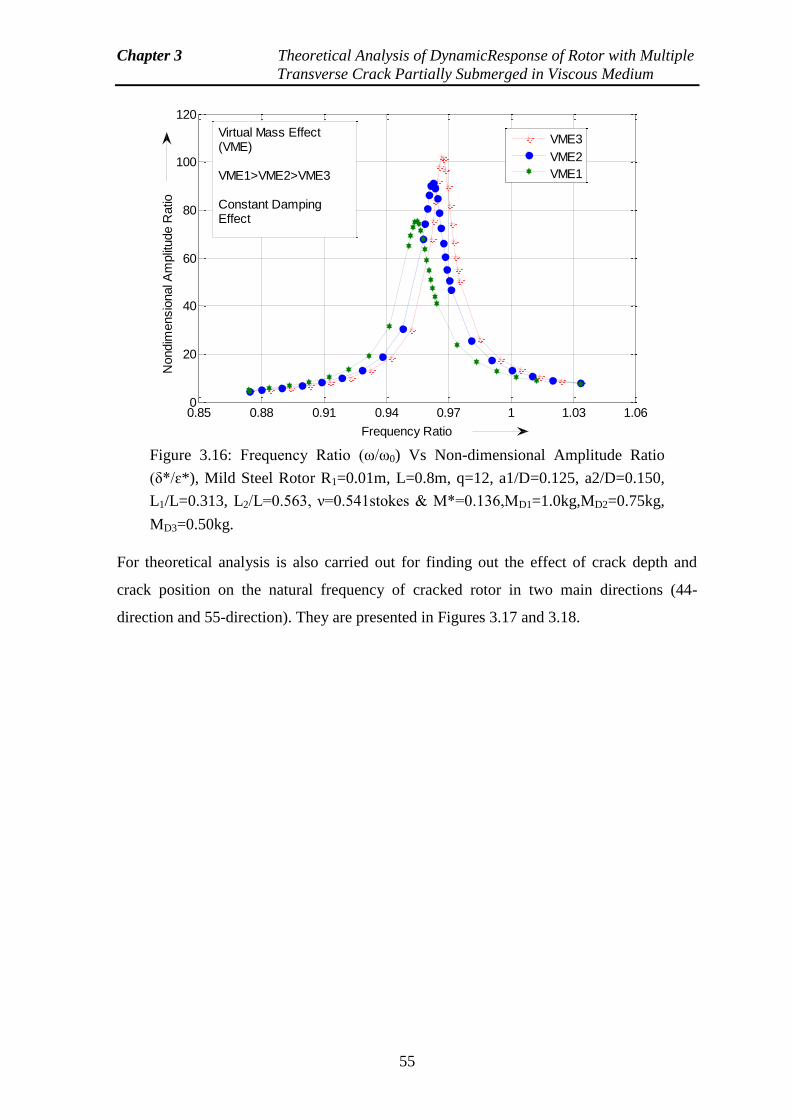
Chapter 3 Theoretical Analysis of DynamicResponse of Rotor with Multiple
Transverse Crack Partially Submerged in Viscous Medium
55
For theoretical analysis is also carried out for finding out the effect of crack depth and
crack position on the natural frequency of cracked rotor in two main directions (44-
direction and 55-direction). They are presented in Figures 3.17 and 3.18.
Figure 3.16: Frequency Ratio (ω/ω0) Vs Non-dimensional Amplitude Ratio
(δ*/ɛ*), Mild Steel Rotor R1=0.01m, L=0.8m, q=12, a1/D=0.125, a2/D=0.150,
L1/L=0.313, L2/L=0.563, ν=0.541stokes & M*=0.136,MD1=1.0kg,MD2=0.75kg,
MD3=0.50kg.
0.85 0.88 0.91 0.94 0.97 1 1.03 1.060
20
40
60
80
100
120
Frequency Ratio
Nondim
ensio
nal A
mplit
ude R
atio
VME3
VME2
VME1
Virtual Mass Effect(VME)
VME1>VME2>VME3
Constant DampingEffect
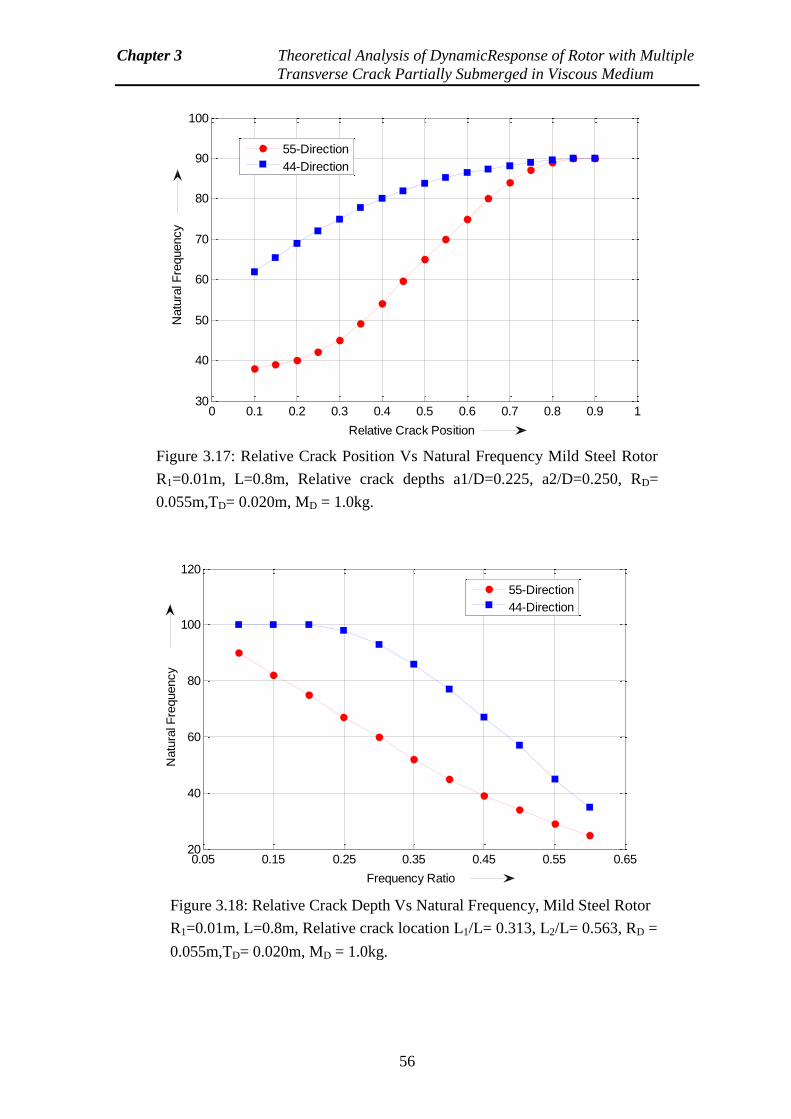
Chapter 3 Theoretical Analysis of DynamicResponse of Rotor with Multiple
Transverse Crack Partially Submerged in Viscous Medium
56
Figure 3.17: Relative Crack Position Vs Natural Frequency Mild Steel Rotor
R1=0.01m, L=0.8m, Relative crack depths a1/D=0.225, a2/D=0.250, RD=
0.055m,TD= 0.020m, MD = 1.0kg.
0 0.1 0.2 0.3 0.4 0.5 0.6 0.7 0.8 0.9 130
40
50
60
70
80
90
100
Relative Crack Position
Natu
ral F
requency
55-Direction
44-Direction
Figure 3.18: Relative Crack Depth Vs Natural Frequency, Mild Steel Rotor
R1=0.01m, L=0.8m, Relative crack location L1/L= 0.313, L2/L= 0.563, RD =
0.055m,TD= 0.020m, MD = 1.0kg.
0.05 0.15 0.25 0.35 0.45 0.55 0.6520
40
60
80
100
120
Frequency Ratio
Natu
ral F
requency
55-Direction
44-Direction
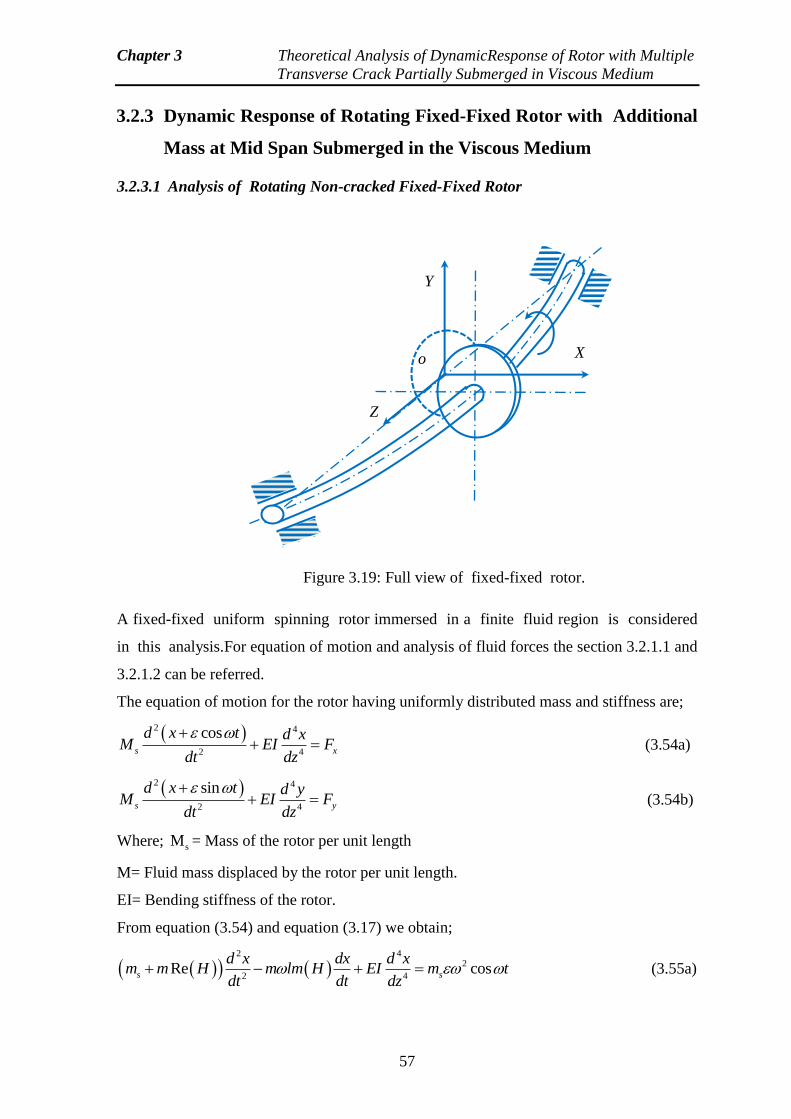
Chapter 3 Theoretical Analysis of DynamicResponse of Rotor with Multiple
Transverse Crack Partially Submerged in Viscous Medium
57
3.2.3 Dynamic Response of Rotating Fixed-Fixed Rotor with Additional
Mass at Mid Span Submerged in the Viscous Medium
3.2.3.1 Analysis of Rotating Non-cracked Fixed-Fixed Rotor
A fixed-fixed uniform spinning rotor immersed in a finite fluid region is considered
in this analysis.For equation of motion and analysis of fluid forces the section 3.2.1.1 and
3.2.1.2 can be referred.
The equation of motion for the rotor having uniformly distributed mass and stiffness are;
2 4
2 4
coss x
d x t d xM EI F
dt dz
(3.54a)
2 4
2 4
sins y
d x t d yM EI F
dt dz
(3.54b)
Where; sM = Mass of the rotor per unit length
M= Fluid mass displaced by the rotor per unit length.
EI= Bending stiffness of the rotor.
From equation (3.54) and equation (3.17) we obtain;
2 4
2
2 4Re coss s
d x dx d xm m H m lm H EI m t
dt dt dz (3.55a)
X
Y
Z
o
Figure 3.19: Full view of fixed-fixed rotor.
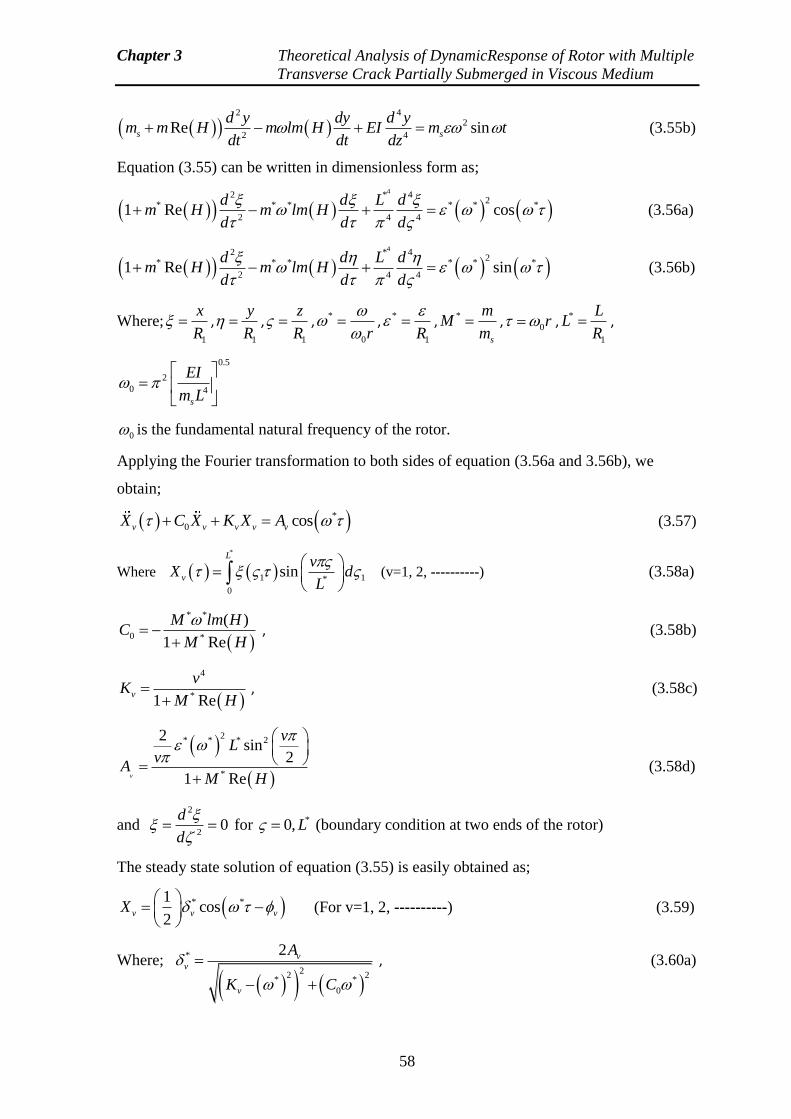
Chapter 3 Theoretical Analysis of DynamicResponse of Rotor with Multiple
Transverse Crack Partially Submerged in Viscous Medium
58
2 4
2
2 4Re sins s
d y dy d ym m H m lm H EI m t
dt dt dz (3.55b)
Equation (3.55) can be written in dimensionless form as;
42 * 4
2* * * * * *
2 4 41 Re cos
d d L dm H m lm H
d d d
(3.56a)
42 * 4
2* * * * * *
2 4 41 Re sin
d d L dm H m lm H
d d d
(3.56b)
Where;1
x
R ,
1
y
R ,
1
z
R ,
*
0r
,
*
1R
,
*
s
mM
m , 0r ,
*
1
LL
R ,
0.5
2
0 4
s
EI
m L
0 is the fundamental natural frequency of the rotor.
Applying the Fourier transformation to both sides of equation (3.56a and 3.56b), we
obtain;
*
0 cosv v v v vX C X K X A (3.57)
Where *
1 1*
0
sin
L
v
vX d
L
(v=1, 2, ----------) (3.58a)
* *
0 *
( )
1 Re
M lm HC
M H
, (3.58b)
4
*1 Rev
vK
M H
, (3.58c)
2* * * 2
*
2sin
2
1 Rev
vL
vA
M H
(3.58d)
and 2
20
d
d
for *0, L (boundary condition at two ends of the rotor)
The steady state solution of equation (3.55) is easily obtained as;
* *1cos
2v v vX
(For v=1, 2, ----------) (3.59)
Where;
*
22 2
* *
0
2 vv
v
A
K C
, (3.60a)
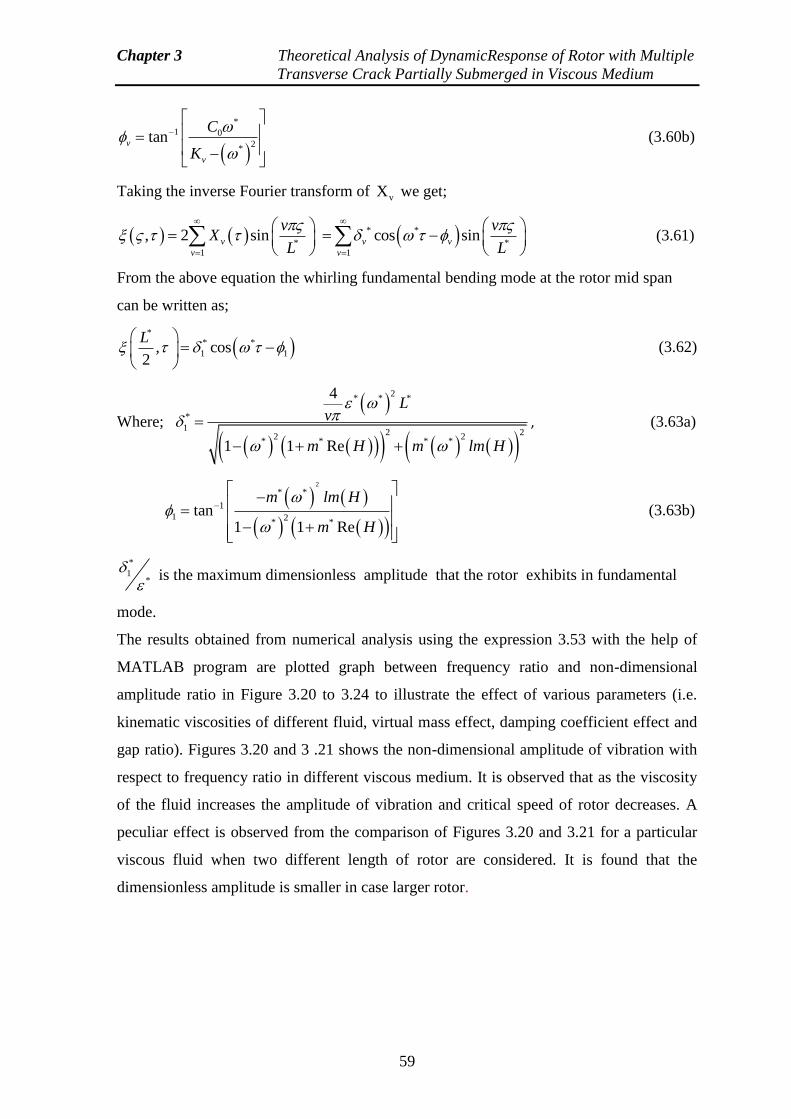
Chapter 3 Theoretical Analysis of DynamicResponse of Rotor with Multiple
Transverse Crack Partially Submerged in Viscous Medium
59
*1 0
2*
tanv
v
C
K
(3.60b)
Taking the inverse Fourier transform of vX we get;
*1
, 2 sinv
v
vX
L
* *
*1
cos sinv v
v
v
L
(3.61)
From the above equation the whirling fundamental bending mode at the rotor mid span
can be written as;
*
* *
1 1, cos2
L
(3.62)
Where;
2* * *
*
12 2
2 2* * * *
4
1 1 Re
Lv
m H m lm H
, (3.63a)
2
* *
1
1 2* *
tan1 1 Re
m lm H
m H
(3.63b)
*
1*
is the maximum dimensionless amplitude that the rotor exhibits in fundamental
mode.
The results obtained from numerical analysis using the expression 3.53 with the help of
MATLAB program are plotted graph between frequency ratio and non-dimensional
amplitude ratio in Figure 3.20 to 3.24 to illustrate the effect of various parameters (i.e.
kinematic viscosities of different fluid, virtual mass effect, damping coefficient effect and
gap ratio). Figures 3.20 and 3 .21 shows the non-dimensional amplitude of vibration with
respect to frequency ratio in different viscous medium. It is observed that as the viscosity
of the fluid increases the amplitude of vibration and critical speed of rotor decreases. A
peculiar effect is observed from the comparison of Figures 3.20 and 3.21 for a particular
viscous fluid when two different length of rotor are considered. It is found that the
dimensionless amplitude is smaller in case larger rotor.
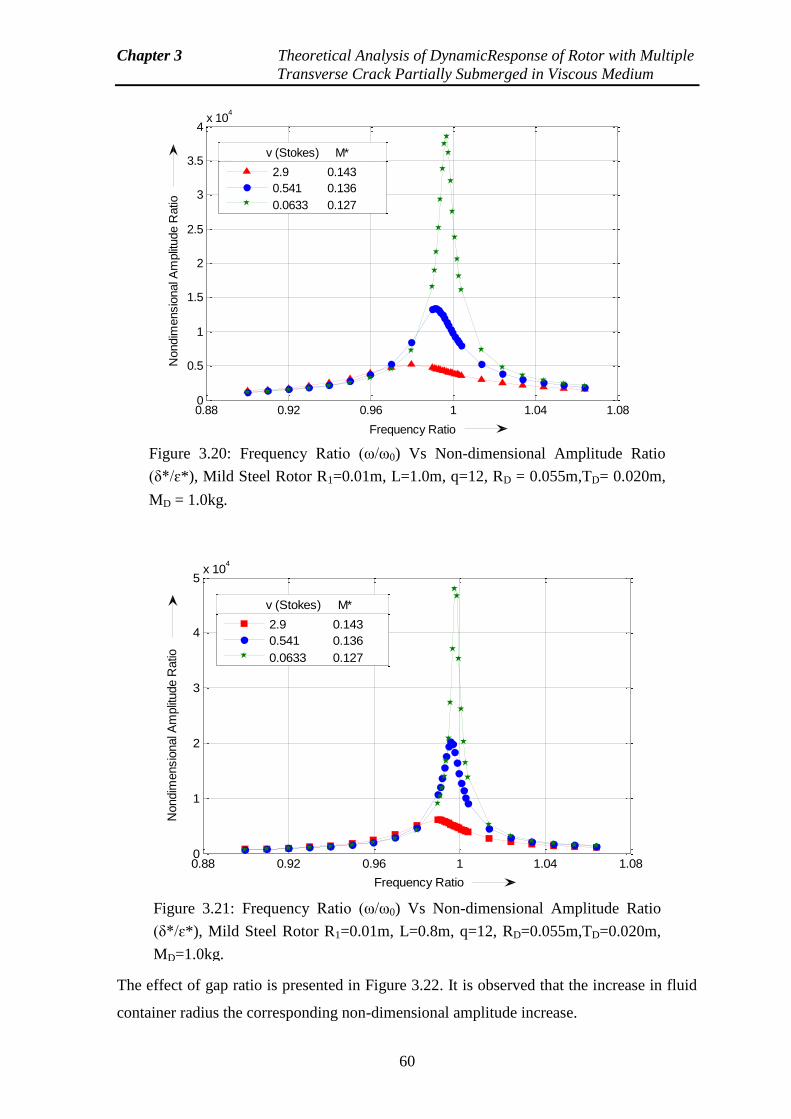
Chapter 3 Theoretical Analysis of DynamicResponse of Rotor with Multiple
Transverse Crack Partially Submerged in Viscous Medium
60
The effect of gap ratio is presented in Figure 3.22. It is observed that the increase in fluid
container radius the corresponding non-dimensional amplitude increase.
Figure 3.20: Frequency Ratio (ω/ω0) Vs Non-dimensional Amplitude Ratio
(δ*/ɛ*), Mild Steel Rotor R1=0.01m, L=1.0m, q=12, RD = 0.055m,TD= 0.020m,
MD = 1.0kg.
0.88 0.92 0.96 1 1.04 1.080
0.5
1
1.5
2
2.5
3
3.5
4x 10
4
Frequency Ratio
Nondim
ensio
nal A
mplit
ude R
atio
2.9 0.143
0.541 0.136
0.0633 0.127
v (Stokes) M*
Figure 3.21: Frequency Ratio (ω/ω0) Vs Non-dimensional Amplitude Ratio
(δ*/ɛ*), Mild Steel Rotor R1=0.01m, L=0.8m, q=12, RD=0.055m,TD=0.020m,
MD=1.0kg.
0.88 0.92 0.96 1 1.04 1.080
1
2
3
4
5x 10
4
Frequency Ratio
Nondim
ensio
nal A
mplit
ude R
atio
2.9 0.143
0.541 0.136
0.0633 0.127
v (Stokes) M*
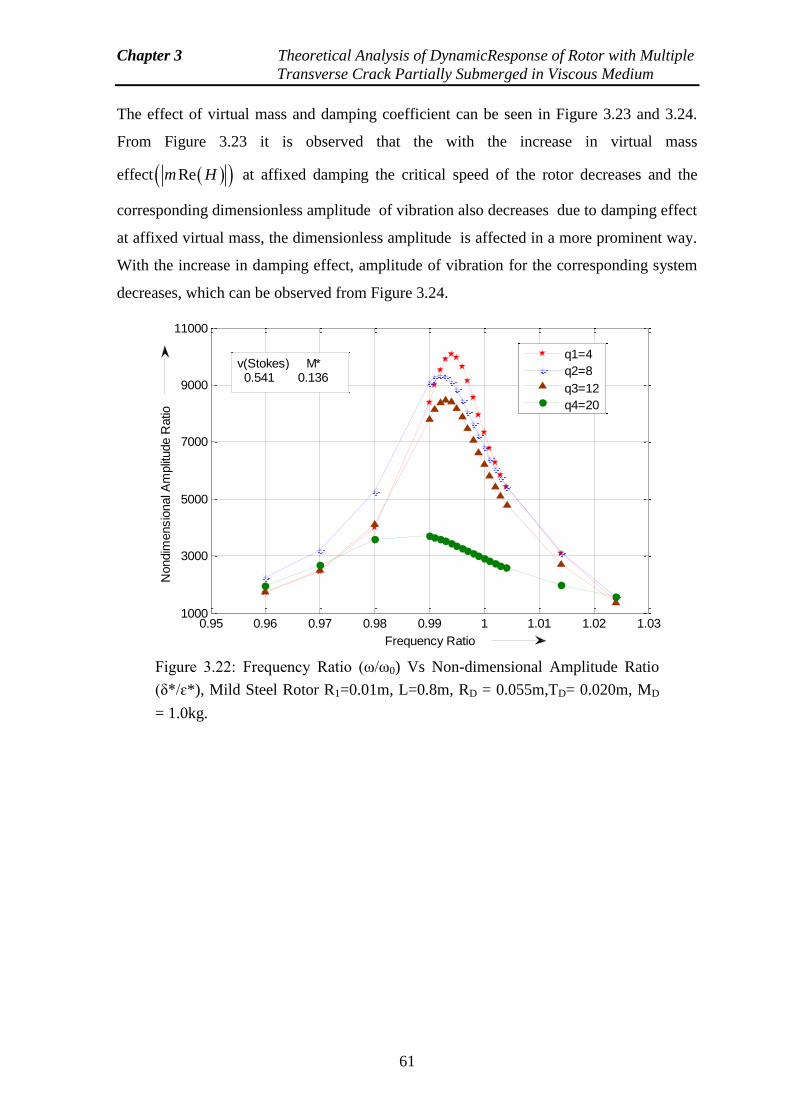
Chapter 3 Theoretical Analysis of DynamicResponse of Rotor with Multiple
Transverse Crack Partially Submerged in Viscous Medium
61
The effect of virtual mass and damping coefficient can be seen in Figure 3.23 and 3.24.
From Figure 3.23 it is observed that the with the increase in virtual mass
effect Rem H at affixed damping the critical speed of the rotor decreases and the
corresponding dimensionless amplitude of vibration also decreases due to damping effect
at affixed virtual mass, the dimensionless amplitude is affected in a more prominent way.
With the increase in damping effect, amplitude of vibration for the corresponding system
decreases, which can be observed from Figure 3.24.
Figure 3.22: Frequency Ratio (ω/ω0) Vs Non-dimensional Amplitude Ratio
(δ*/ɛ*), Mild Steel Rotor R1=0.01m, L=0.8m, RD = 0.055m,TD= 0.020m, MD
= 1.0kg.
0.95 0.96 0.97 0.98 0.99 1 1.01 1.02 1.031000
3000
5000
7000
9000
11000
Frequency Ratio
Nondim
ensio
nal A
mplit
ude R
atio
q1=4
q2=8
q3=12
q4=20
v(Stokes) M* 0.541 0.136
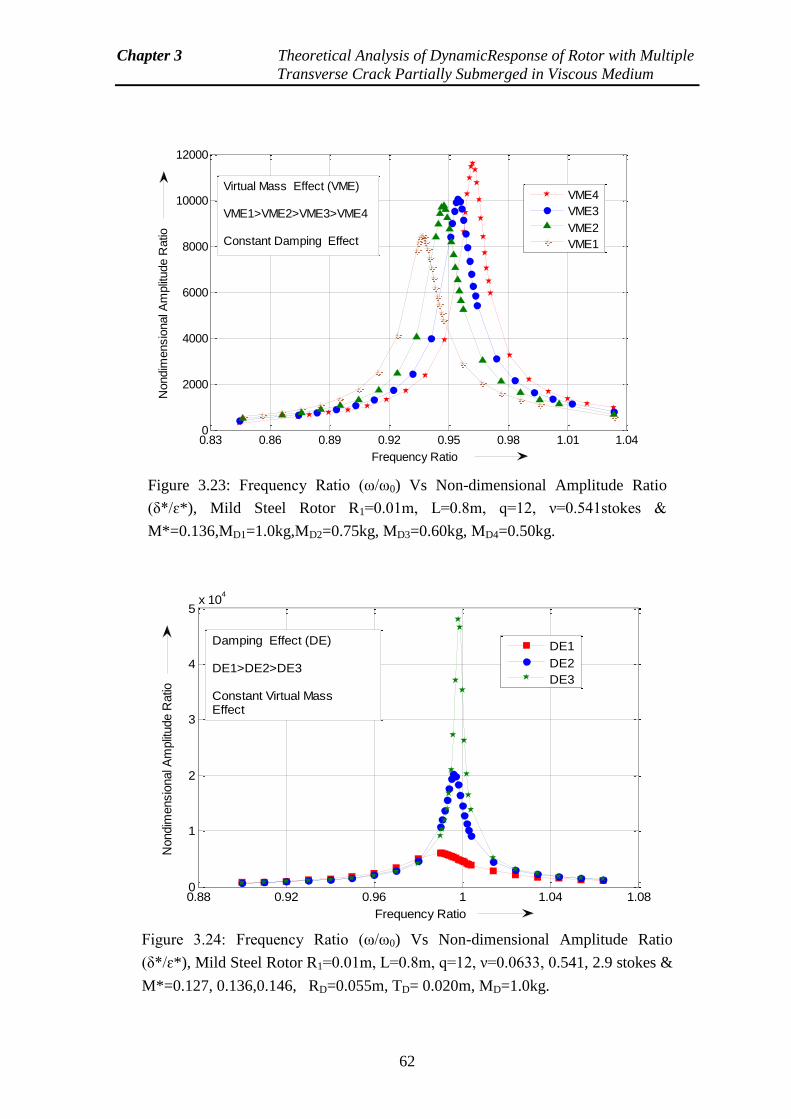
Chapter 3 Theoretical Analysis of DynamicResponse of Rotor with Multiple
Transverse Crack Partially Submerged in Viscous Medium
62
Figure 3.24: Frequency Ratio (ω/ω0) Vs Non-dimensional Amplitude Ratio
(δ*/ɛ*), Mild Steel Rotor R1=0.01m, L=0.8m, q=12, ν=0.0633, 0.541, 2.9 stokes &
M*=0.127, 0.136,0.146, RD=0.055m, TD= 0.020m, MD=1.0kg.
0.88 0.92 0.96 1 1.04 1.080
1
2
3
4
5x 10
4
Frequency Ratio
Nondim
ensio
nal A
mplit
ude R
atio
DE1
DE2
DE3
Damping Effect (DE)
DE1>DE2>DE3
Constant Virtual Mass Effect
Figure 3.23: Frequency Ratio (ω/ω0) Vs Non-dimensional Amplitude Ratio
(δ*/ɛ*), Mild Steel Rotor R1=0.01m, L=0.8m, q=12, ν=0.541stokes &
M*=0.136,MD1=1.0kg,MD2=0.75kg, MD3=0.60kg, MD4=0.50kg.
0.83 0.86 0.89 0.92 0.95 0.98 1.01 1.040
2000
4000
6000
8000
10000
12000
Frequency Ratio
Nondim
ensio
nal A
mplit
ude R
atio
VME4
VME3
VME2
VME1
Virtual Mass Effect (VME)
VME1>VME2>VME3>VME4
Constant Damping Effect
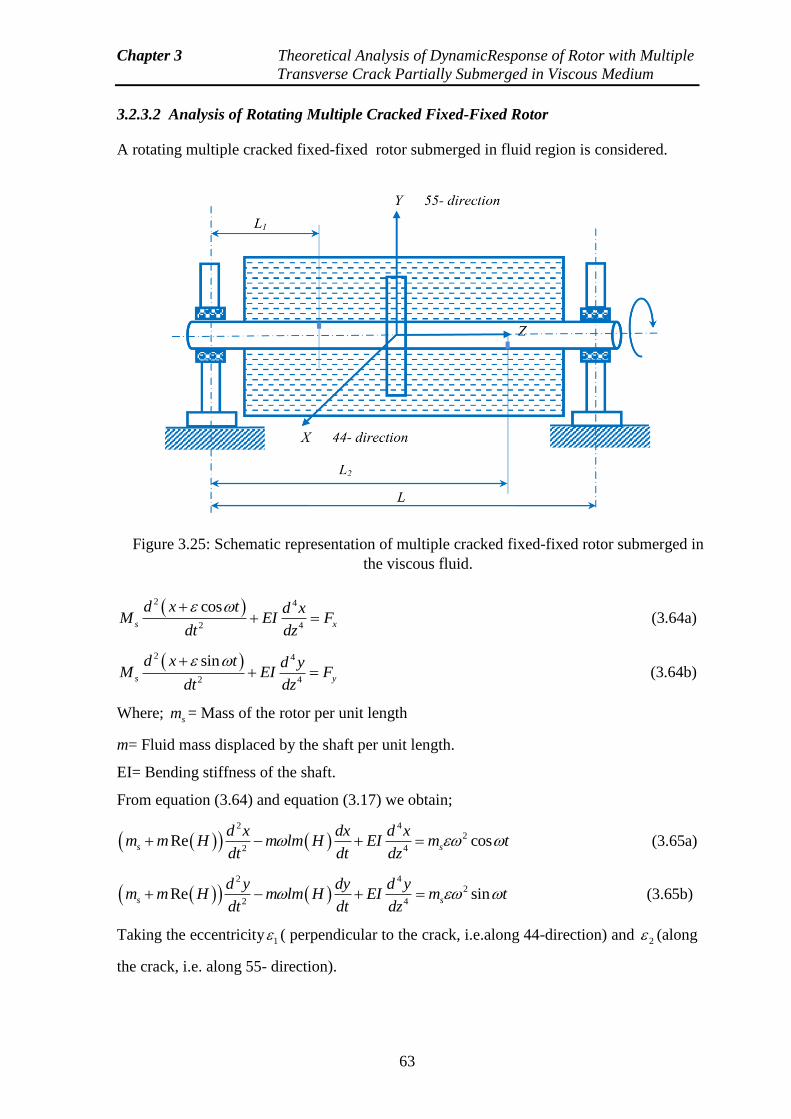
Chapter 3 Theoretical Analysis of DynamicResponse of Rotor with Multiple
Transverse Crack Partially Submerged in Viscous Medium
63
3.2.3.2 Analysis of Rotating Multiple Cracked Fixed-Fixed Rotor
A rotating multiple cracked fixed-fixed rotor submerged in fluid region is considered.
2 4
2 4
coss x
d x t d xM EI F
dt dz
(3.64a)
2 4
2 4
sins y
d x t d yM EI F
dt dz
(3.64b)
Where; sm = Mass of the rotor per unit length
m= Fluid mass displaced by the shaft per unit length.
EI= Bending stiffness of the shaft.
From equation (3.64) and equation (3.17) we obtain;
2 4
2
2 4Re coss s
d x dx d xm m H m lm H EI m t
dt dt dz (3.65a)
2 4
2
2 4Re sins s
d y dy d ym m H m lm H EI m t
dt dt dz (3.65b)
Taking the eccentricity 1 ( perpendicular to the crack, i.e.along 44-direction) and 2 (along
the crack, i.e. along 55- direction).
Figure 3.25: Schematic representation of multiple cracked fixed-fixed rotor submerged in
the viscous fluid.
Chapter 3 Theoretical Analysis of DynamicResponse of Rotor with Multiple
Transverse Crack Partially Submerged in Viscous Medium
64
The analysis for amplitude is drawn. At first 1 is taken and its contribution in x and y-
axis direction are found out in the following procedures.
Introducing dimensionless quantities;
Where 1
x
R ,
1
y
R ,
1
z
R , *
1
xx
, *
2
yy
, * 1
1
1R
, *
s
mM
m ,
1 xxt ,
2 yyt , *
1
LL
R ,
2
01
xx
F
,
2
02
yy
F
, *
s
mm
m
xx , yy are the fundamental natural frequency in x and y-axis direction respectively of
the cracked rotor as shown in Figure 3.25.
Where as 0 is the fundamental natural frequency of the non-cracked rotor
0 = 0.5
2 4
sEI M L
42 * 4
2* * * * * *
1 1 1 1 12 4 4
1
1 Re cosd d L d
m H m lm H Fd d d
(3.66a)
42 * 4
2* * * * * *
2 2 1 2 2 22 4 4
2 2
1 Re sind d L d
m H m lm H Fd d d
(3.66b)
Applying the Fourier transform to both side of equation (3.66), we obtain;
*
1 01 1 1 1 1cosv v v v vX C X K X A (3.67a)
*
2 02 2 2 2 2cosv v v v vY C Y K Y A (3.67b)
Where;
* *
0 *
( )
1 Re
n nn
n
M lm HC
M H
,
*1 Re
nvn
n
FK
M H
, (3.68a)
1
2* * * 2
1 1
*
1
2sin
2
1 Rev
vL
vA
M H
, (3.68b)
2
2* * * 2
1 2
*
2
2cos
2
1 Rev
vL
vA
M H
(3.68c)
[For n=1 &2 & V=1, 2, ------------]
Fn =F1 or F2 for n=1 or 2
The steady state solution of equation is easily obtained as;
Chapter 3 Theoretical Analysis of DynamicResponse of Rotor with Multiple
Transverse Crack Partially Submerged in Viscous Medium
65
* *
1 1 11 2 cosv vX (3.69a)
* *
2 2 21 2 cosv vY (3.69b)
For v=1, 2
Where
*
22 2
* *
0
vnvn
vn n n n
A
K C
,
*1 0
2*
tan n nvn
vn n
C
K
(3.70)
For V=1, 2, -------------------; n=1&2
Taking the inverse fourier transform of Xv, we get;
1 1 *1
2 sinv
v
v
XL
(3.71)
Similarly for Yv it can be done
From the above equation the whirling motion for fundamental bending mode in X and Y-
axis direction can be written respectively as;
*
* *
1 11 1 1 11, cos2
L
(3.72a)
*
* *
2 12 2 2 12, sin2
L
(3.72b)
and are the dimensionless deflection in x and y-axis direction respectively due to
eccentricity 1 ( Eccentricity in the direction perpendicular to the crack , 44- direction )
when the 44- directin axis coincides with x-axis direction the amplitude contribution
of 1 in x and y-axis direction are ;
*
*
44 1 11 11, cos2
L
in x-axis direction (3.73a)
*
* *
44 2 12 2 2 12, sin2
L
in y- axis direction (3.73b)
Similarly the expression for*
1,2
L
and*
2,2
L
due to eccentricity 2 (Eccentricity
in the direction of crack, 55- direction) can be found out adopting above procedure.When
the 55- direction coincide with y- axis the amplitude contribution of 1 in x and y
direction are *
55 1,2
L
and *
55 2,2
L
respectively.
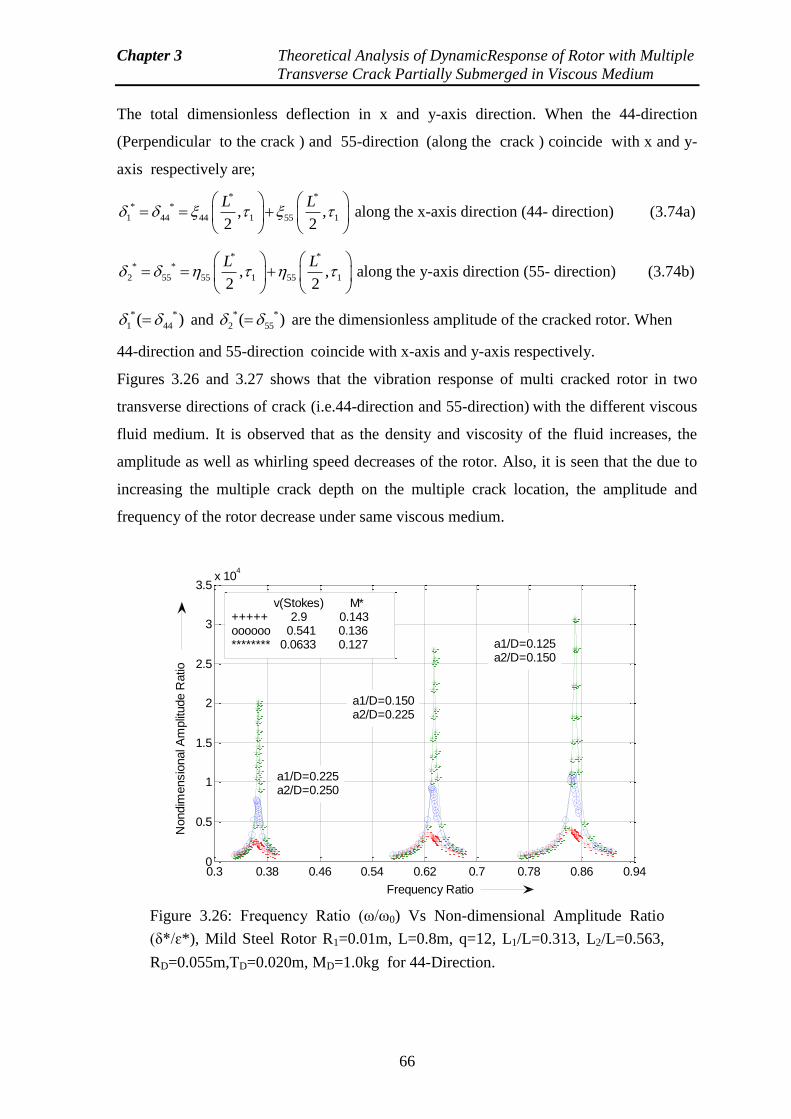
Chapter 3 Theoretical Analysis of DynamicResponse of Rotor with Multiple
Transverse Crack Partially Submerged in Viscous Medium
66
The total dimensionless deflection in x and y-axis direction. When the 44-direction
(Perpendicular to the crack ) and 55-direction (along the crack ) coincide with x and y-
axis respectively are;
* ** *
1 44 44 1 55 1, ,2 2
L L
along the x-axis direction (44- direction) (3.74a)
* ** *
2 55 55 1 55 1, ,2 2
L L
along the y-axis direction (55- direction) (3.74b)
* *
1 44( ) and * *
2 55( ) are the dimensionless amplitude of the cracked rotor. When
44-direction and 55-direction coincide with x-axis and y-axis respectively.
Figures 3.26 and 3.27 shows that the vibration response of multi cracked rotor in two
transverse directions of crack (i.e.44-direction and 55-direction) with the different viscous
fluid medium. It is observed that as the density and viscosity of the fluid increases, the
amplitude as well as whirling speed decreases of the rotor. Also, it is seen that the due to
increasing the multiple crack depth on the multiple crack location, the amplitude and
frequency of the rotor decrease under same viscous medium.
Figure 3.26: Frequency Ratio (ω/ω0) Vs Non-dimensional Amplitude Ratio
(δ*/ɛ*), Mild Steel Rotor R1=0.01m, L=0.8m, q=12, L1/L=0.313, L2/L=0.563,
RD=0.055m,TD=0.020m, MD=1.0kg for 44-Direction.
0.3 0.38 0.46 0.54 0.62 0.7 0.78 0.86 0.940
0.5
1
1.5
2
2.5
3
3.5x 10
4
Frequency Ratio
Nondim
ensio
nal A
mplit
ude R
atio
a1/D=0.225a2/D=0.250
a1/D=0.150a2/D=0.225
a1/D=0.125a2/D=0.150
v(Stokes) M*+++++ 2.9 0.143oooooo 0.541 0.136******** 0.0633 0.127
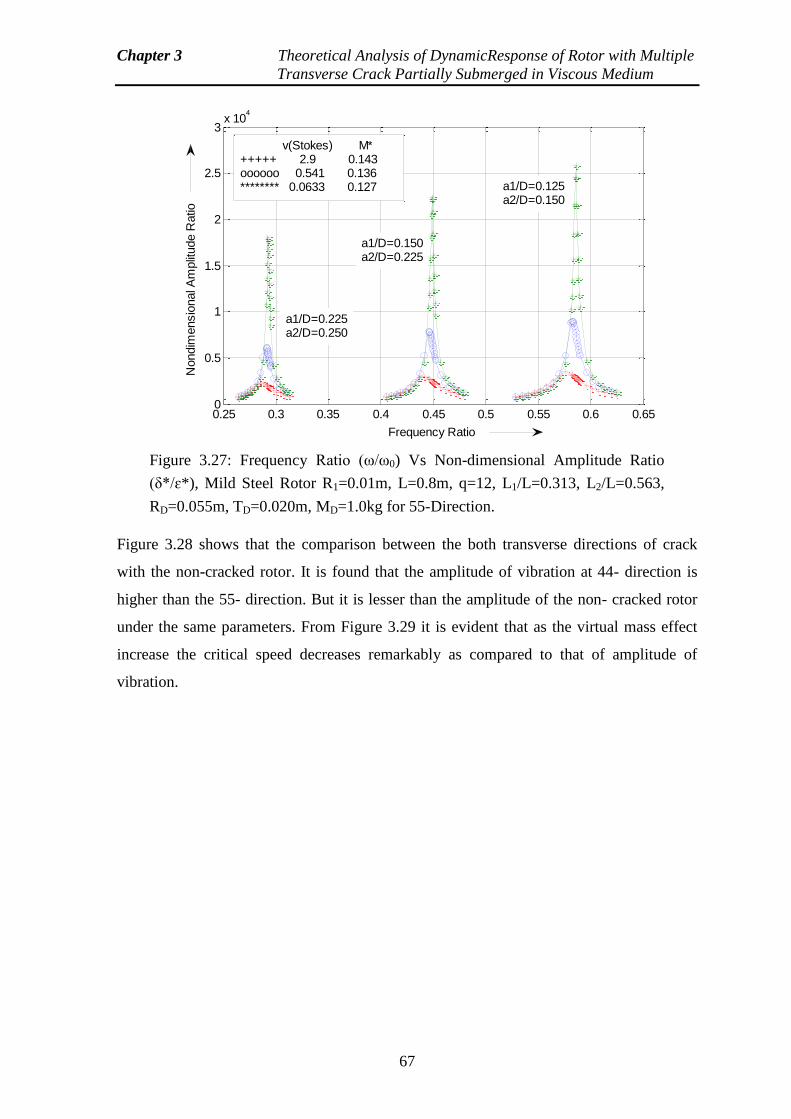
Chapter 3 Theoretical Analysis of DynamicResponse of Rotor with Multiple
Transverse Crack Partially Submerged in Viscous Medium
67
Figure 3.28 shows that the comparison between the both transverse directions of crack
with the non-cracked rotor. It is found that the amplitude of vibration at 44- direction is
higher than the 55- direction. But it is lesser than the amplitude of the non- cracked rotor
under the same parameters. From Figure 3.29 it is evident that as the virtual mass effect
increase the critical speed decreases remarkably as compared to that of amplitude of
vibration.
Figure 3.27: Frequency Ratio (ω/ω0) Vs Non-dimensional Amplitude Ratio
(δ*/ɛ*), Mild Steel Rotor R1=0.01m, L=0.8m, q=12, L1/L=0.313, L2/L=0.563,
RD=0.055m, TD=0.020m, MD=1.0kg for 55-Direction.
0.25 0.3 0.35 0.4 0.45 0.5 0.55 0.6 0.650
0.5
1
1.5
2
2.5
3x 10
4
Frequency Ratio
Nondim
ensio
nal A
mplit
ude R
atio
a1/D=0.225a2/D=0.250
a1/D=0.150a2/D=0.225
a1/D=0.125a2/D=0.150
v(Stokes) M*+++++ 2.9 0.143oooooo 0.541 0.136******** 0.0633 0.127
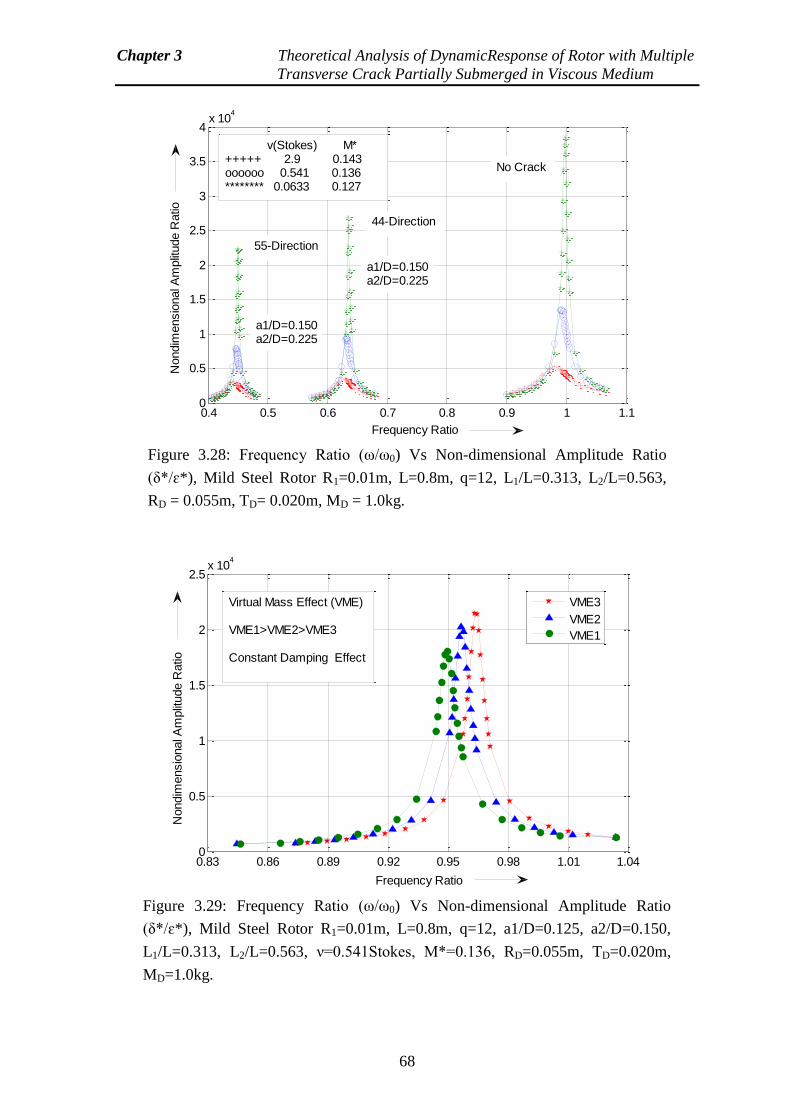
Chapter 3 Theoretical Analysis of DynamicResponse of Rotor with Multiple
Transverse Crack Partially Submerged in Viscous Medium
68
Figure 3.28: Frequency Ratio (ω/ω0) Vs Non-dimensional Amplitude Ratio
(δ*/ɛ*), Mild Steel Rotor R1=0.01m, L=0.8m, q=12, L1/L=0.313, L2/L=0.563,
RD = 0.055m, TD= 0.020m, MD = 1.0kg.
0.4 0.5 0.6 0.7 0.8 0.9 1 1.10
0.5
1
1.5
2
2.5
3
3.5
4x 10
4
Frequency Ratio
Nondim
ensio
nal A
mplit
ude R
atio
v(Stokes) M*+++++ 2.9 0.143oooooo 0.541 0.136******** 0.0633 0.127
No Crack
a1/D=0.150a2/D=0.225
a1/D=0.150a2/D=0.225
55-Direction
44-Direction
Figure 3.29: Frequency Ratio (ω/ω0) Vs Non-dimensional Amplitude Ratio
(δ*/ɛ*), Mild Steel Rotor R1=0.01m, L=0.8m, q=12, a1/D=0.125, a2/D=0.150,
L1/L=0.313, L2/L=0.563, ν=0.541Stokes, M*=0.136, RD=0.055m, TD=0.020m,
MD=1.0kg.
0.83 0.86 0.89 0.92 0.95 0.98 1.01 1.040
0.5
1
1.5
2
2.5x 10
4
Frequency Ratio
Nondim
ensio
nal A
mplit
ude R
atio
VME3
VME2
VME1
Virtual Mass Effect (VME)
VME1>VME2>VME3
Constant Damping Effect
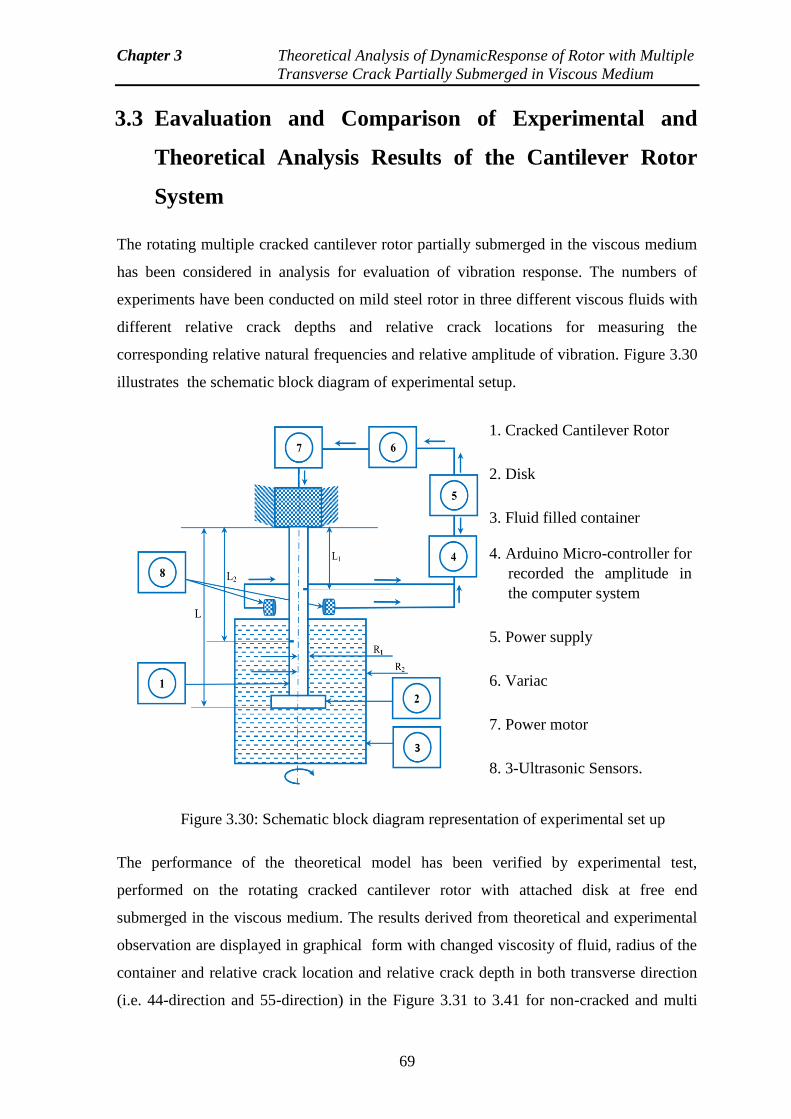
Chapter 3 Theoretical Analysis of DynamicResponse of Rotor with Multiple
Transverse Crack Partially Submerged in Viscous Medium
69
3.3 Eavaluation and Comparison of Experimental and
Theoretical Analysis Results of the Cantilever Rotor
System
The rotating multiple cracked cantilever rotor partially submerged in the viscous medium
has been considered in analysis for evaluation of vibration response. The numbers of
experiments have been conducted on mild steel rotor in three different viscous fluids with
different relative crack depths and relative crack locations for measuring the
corresponding relative natural frequencies and relative amplitude of vibration. Figure 3.30
illustrates the schematic block diagram of experimental setup.
The performance of the theoretical model has been verified by experimental test,
performed on the rotating cracked cantilever rotor with attached disk at free end
submerged in the viscous medium. The results derived from theoretical and experimental
observation are displayed in graphical form with changed viscosity of fluid, radius of the
container and relative crack location and relative crack depth in both transverse direction
(i.e. 44-direction and 55-direction) in the Figure 3.31 to 3.41 for non-cracked and multi
Figure 3.30: Schematic block diagram representation of experimental set up
1. Cracked Cantilever Rotor
2. Disk
3. Fluid filled container
4. Arduino Micro-controller for
recorded the amplitude in
the computer system
5. Power supply
6. Variac
7. Power motor
8. 3-Ultrasonic Sensors.
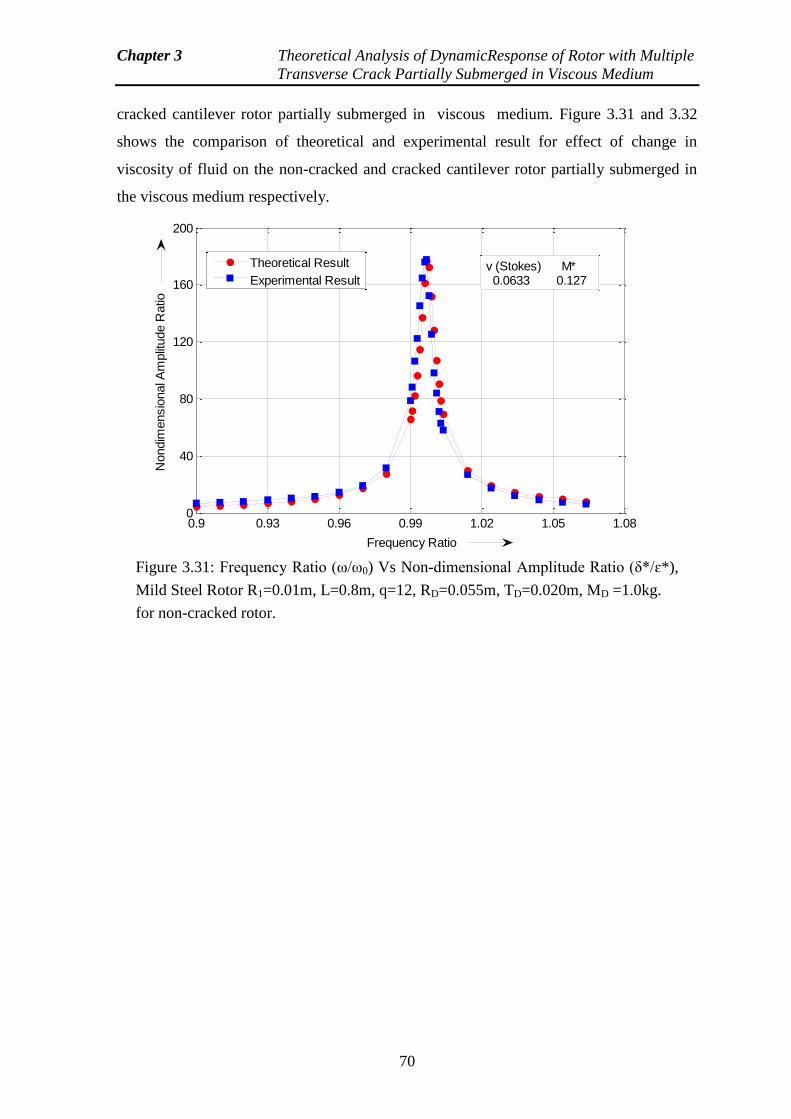
Chapter 3 Theoretical Analysis of DynamicResponse of Rotor with Multiple
Transverse Crack Partially Submerged in Viscous Medium
70
cracked cantilever rotor partially submerged in viscous medium. Figure 3.31 and 3.32
shows the comparison of theoretical and experimental result for effect of change in
viscosity of fluid on the non-cracked and cracked cantilever rotor partially submerged in
the viscous medium respectively.
Figure 3.31: Frequency Ratio (ω/ω0) Vs Non-dimensional Amplitude Ratio (δ*/ɛ*),
Mild Steel Rotor R1=0.01m, L=0.8m, q=12, RD=0.055m, TD=0.020m, MD =1.0kg.
for non-cracked rotor.
0.9 0.93 0.96 0.99 1.02 1.05 1.080
40
80
120
160
200
Frequency Ratio
Nondim
ensio
nal A
mplit
ude R
atio
Theoretical Result
Experimental Resultv (Stokes) M* 0.0633 0.127
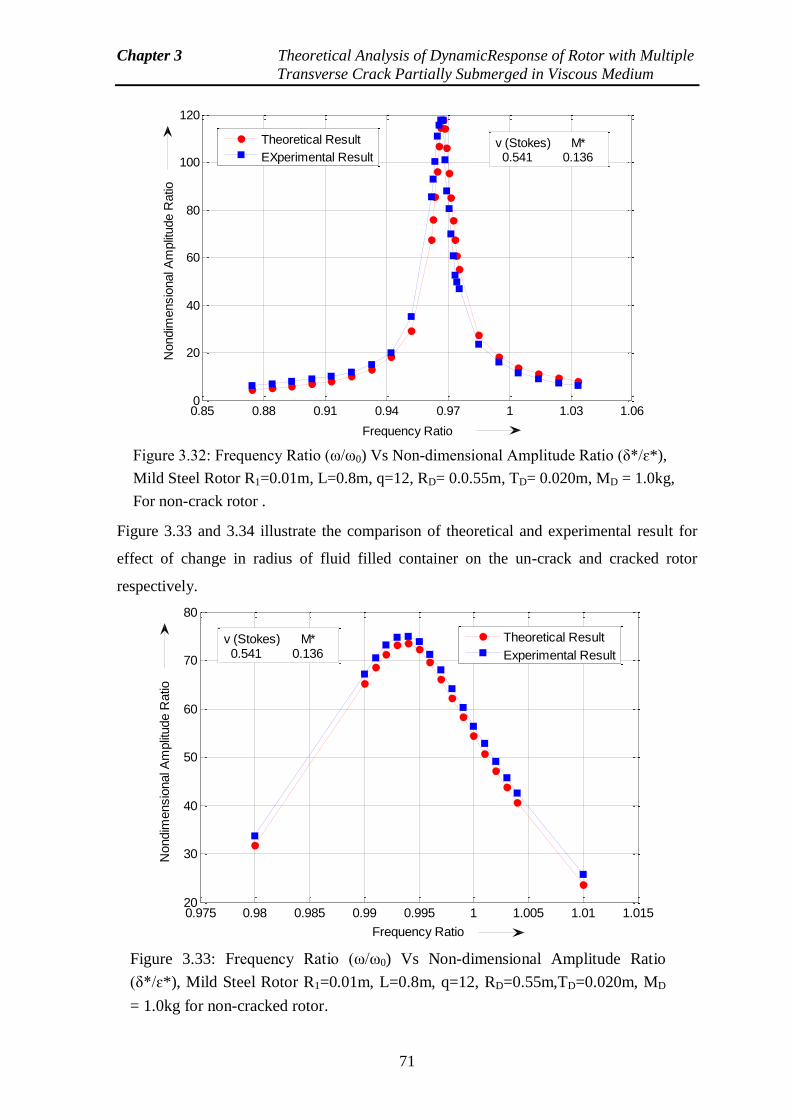
Chapter 3 Theoretical Analysis of DynamicResponse of Rotor with Multiple
Transverse Crack Partially Submerged in Viscous Medium
71
Figure 3.33 and 3.34 illustrate the comparison of theoretical and experimental result for
effect of change in radius of fluid filled container on the un-crack and cracked rotor
respectively.
Figure 3.32: Frequency Ratio (ω/ω0) Vs Non-dimensional Amplitude Ratio (δ*/ɛ*),
Mild Steel Rotor R1=0.01m, L=0.8m, q=12, RD= 0.0.55m, TD= 0.020m, MD = 1.0kg,
For non-crack rotor .
0.85 0.88 0.91 0.94 0.97 1 1.03 1.060
20
40
60
80
100
120
Frequency Ratio
Nondim
ensio
nal A
mplit
ude R
atio
Theoretical Result
EXperimental Resultv (Stokes) M* 0.541 0.136
Figure 3.33: Frequency Ratio (ω/ω0) Vs Non-dimensional Amplitude Ratio
(δ*/ɛ*), Mild Steel Rotor R1=0.01m, L=0.8m, q=12, RD=0.55m,TD=0.020m, MD
= 1.0kg for non-cracked rotor.
0.975 0.98 0.985 0.99 0.995 1 1.005 1.01 1.01520
30
40
50
60
70
80
Frequency Ratio
Nondim
ensio
nal A
mplit
ude R
atio
Theoretical Result
Experimental Result
v (Stokes) M* 0.541 0.136
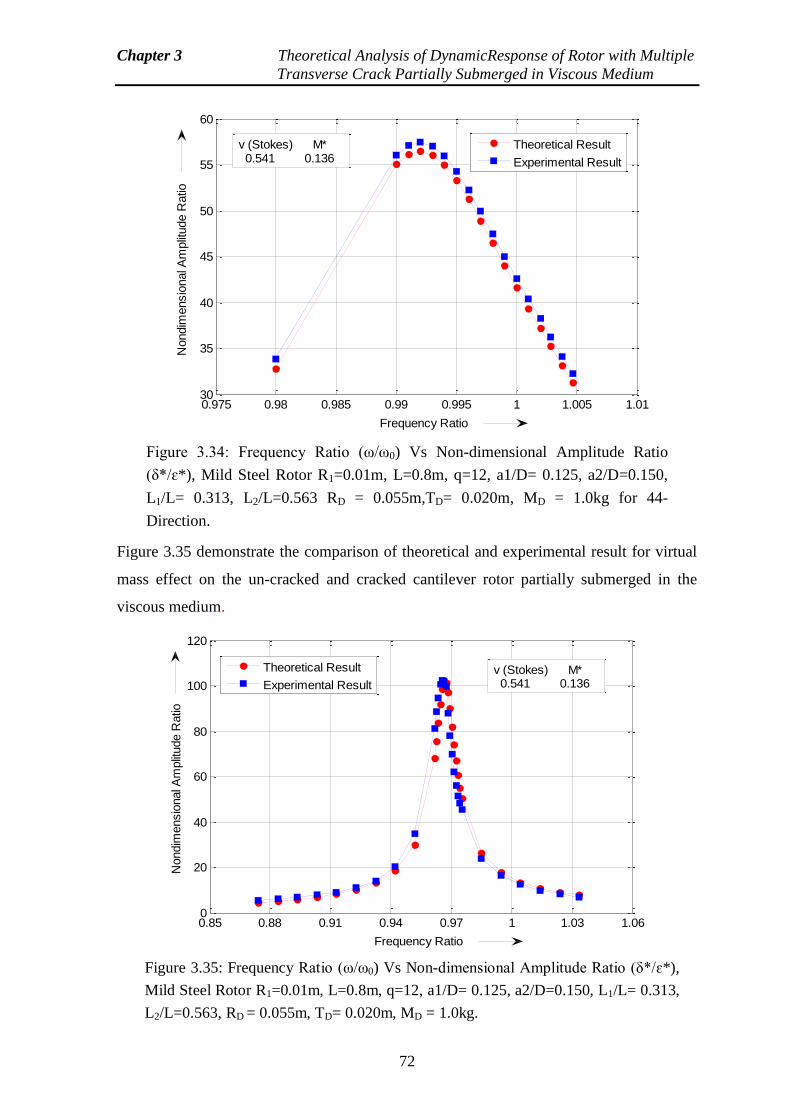
Chapter 3 Theoretical Analysis of DynamicResponse of Rotor with Multiple
Transverse Crack Partially Submerged in Viscous Medium
72
Figure 3.35 demonstrate the comparison of theoretical and experimental result for virtual
mass effect on the un-cracked and cracked cantilever rotor partially submerged in the
viscous medium.
Figure 3.34: Frequency Ratio (ω/ω0) Vs Non-dimensional Amplitude Ratio
(δ*/ɛ*), Mild Steel Rotor R1=0.01m, L=0.8m, q=12, a1/D= 0.125, a2/D=0.150,
L1/L= 0.313, L2/L=0.563 RD = 0.055m,TD= 0.020m, MD = 1.0kg for 44-
Direction.
0.975 0.98 0.985 0.99 0.995 1 1.005 1.0130
35
40
45
50
55
60
Frequency Ratio
Nondim
ensio
nal A
mplit
ude R
atio
Theoretical Result
Experimental Result
v (Stokes) M* 0.541 0.136
Figure 3.35: Frequency Ratio (ω/ω0) Vs Non-dimensional Amplitude Ratio (δ*/ɛ*),
Mild Steel Rotor R1=0.01m, L=0.8m, q=12, a1/D= 0.125, a2/D=0.150, L1/L= 0.313,
L2/L=0.563, RD = 0.055m, TD= 0.020m, MD = 1.0kg.
0.85 0.88 0.91 0.94 0.97 1 1.03 1.060
20
40
60
80
100
120
Frequency Ratio
Nondim
ensio
nal A
mplit
ude R
atio
Theoretical Result
Experimental Result
v (Stokes) M* 0.541 0.136
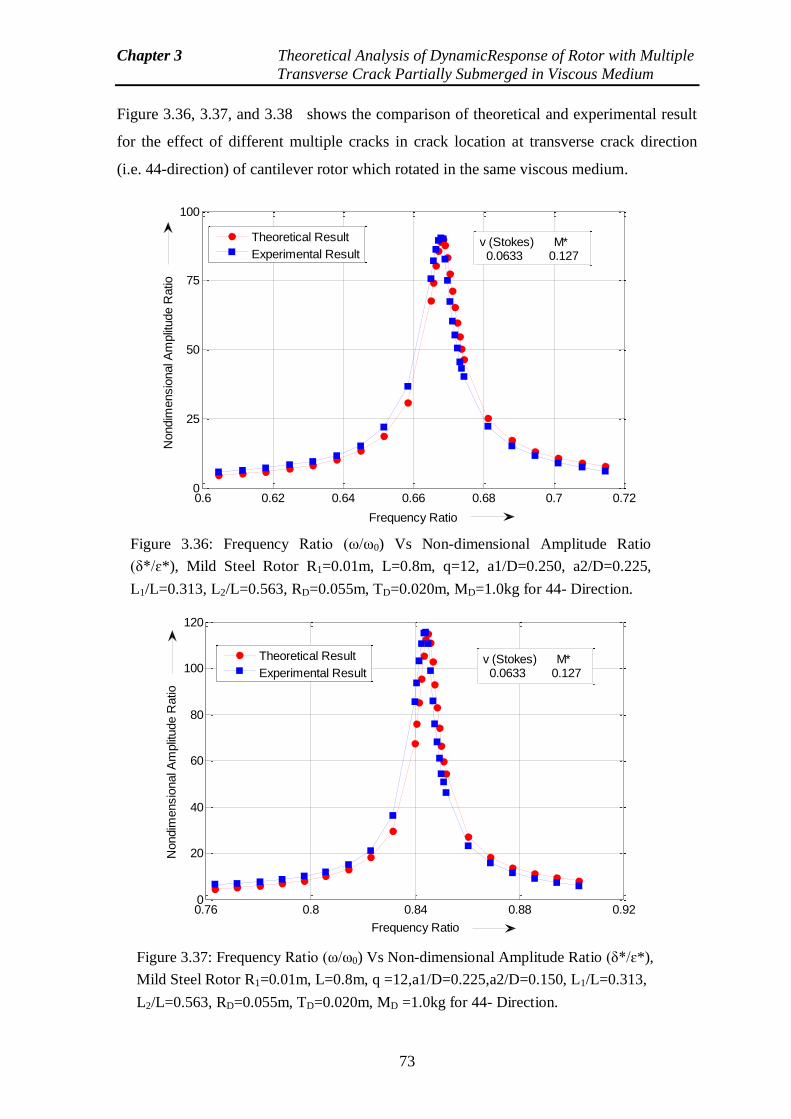
Chapter 3 Theoretical Analysis of DynamicResponse of Rotor with Multiple
Transverse Crack Partially Submerged in Viscous Medium
73
Figure 3.36, 3.37, and 3.38 shows the comparison of theoretical and experimental result
for the effect of different multiple cracks in crack location at transverse crack direction
(i.e. 44-direction) of cantilever rotor which rotated in the same viscous medium.
Figure 3.36: Frequency Ratio (ω/ω0) Vs Non-dimensional Amplitude Ratio
(δ*/ɛ*), Mild Steel Rotor R1=0.01m, L=0.8m, q=12, a1/D=0.250, a2/D=0.225,
L1/L=0.313, L2/L=0.563, RD=0.055m, TD=0.020m, MD=1.0kg for 44- Direction.
0.6 0.62 0.64 0.66 0.68 0.7 0.720
25
50
75
100
Frequency Ratio
Nondim
ensio
nal A
mplit
ude R
atio
Theoretical Result
Experimental Resultv (Stokes) M* 0.0633 0.127
Figure 3.37: Frequency Ratio (ω/ω0) Vs Non-dimensional Amplitude Ratio (δ*/ɛ*),
Mild Steel Rotor R1=0.01m, L=0.8m, q =12,a1/D=0.225,a2/D=0.150, L1/L=0.313,
L2/L=0.563, RD=0.055m, TD=0.020m, MD =1.0kg for 44- Direction.
0.76 0.8 0.84 0.88 0.920
20
40
60
80
100
120
Frequency Ratio
Nondim
ensio
nal A
mplit
ude R
atio
Theoretical Result
Experimental Resultv (Stokes) M* 0.0633 0.127
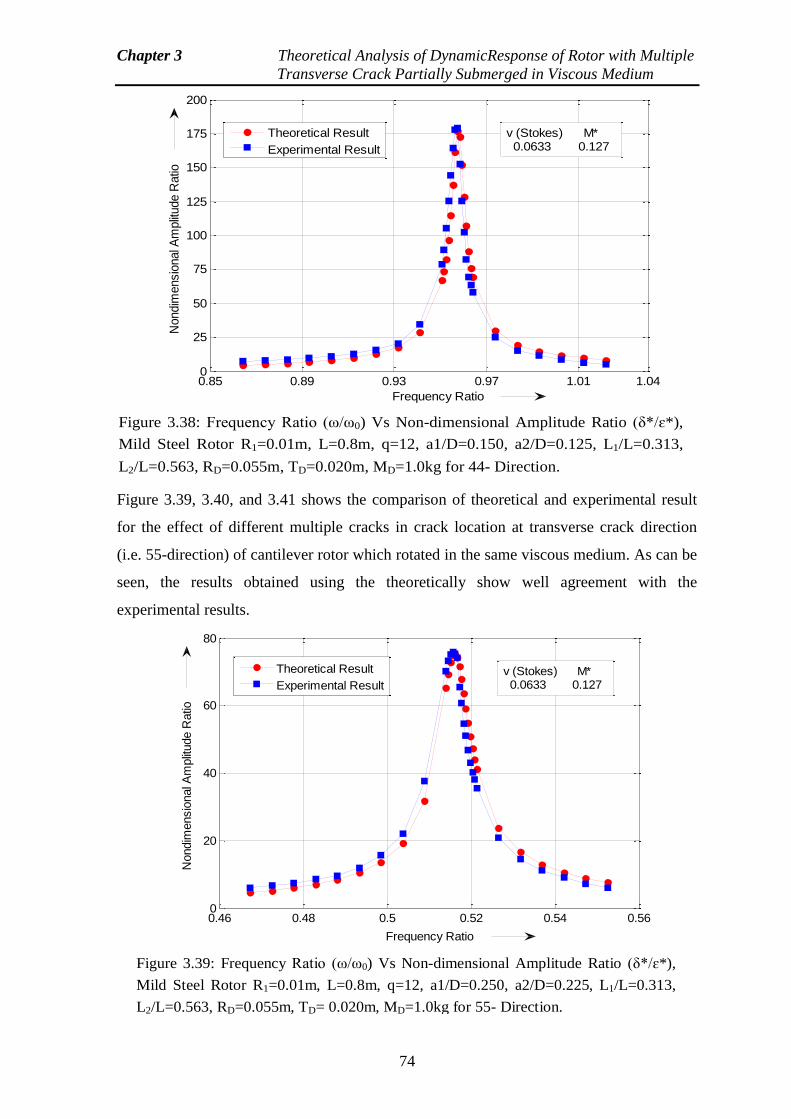
Chapter 3 Theoretical Analysis of DynamicResponse of Rotor with Multiple
Transverse Crack Partially Submerged in Viscous Medium
74
Figure 3.39, 3.40, and 3.41 shows the comparison of theoretical and experimental result
for the effect of different multiple cracks in crack location at transverse crack direction
(i.e. 55-direction) of cantilever rotor which rotated in the same viscous medium. As can be
seen, the results obtained using the theoretically show well agreement with the
experimental results.
Figure 3.38: Frequency Ratio (ω/ω0) Vs Non-dimensional Amplitude Ratio (δ*/ɛ*),
Mild Steel Rotor R1=0.01m, L=0.8m, q=12, a1/D=0.150, a2/D=0.125, L1/L=0.313,
L2/L=0.563, RD=0.055m, TD=0.020m, MD=1.0kg for 44- Direction.
0.85 0.89 0.93 0.97 1.01 1.040
25
50
75
100
125
150
175
200
Frequency Ratio
Nondim
ensio
nal A
mplit
ude R
atio
Theoretical Result
Experimental Result
v (Stokes) M* 0.0633 0.127
Figure 3.39: Frequency Ratio (ω/ω0) Vs Non-dimensional Amplitude Ratio (δ*/ɛ*),
Mild Steel Rotor R1=0.01m, L=0.8m, q=12, a1/D=0.250, a2/D=0.225, L1/L=0.313,
L2/L=0.563, RD=0.055m, TD= 0.020m, MD=1.0kg for 55- Direction.
0.46 0.48 0.5 0.52 0.54 0.560
20
40
60
80
Frequency Ratio
Nondim
ensio
nal A
mplit
ude R
atio
Theoretical Result
Experimental Result
v (Stokes) M* 0.0633 0.127
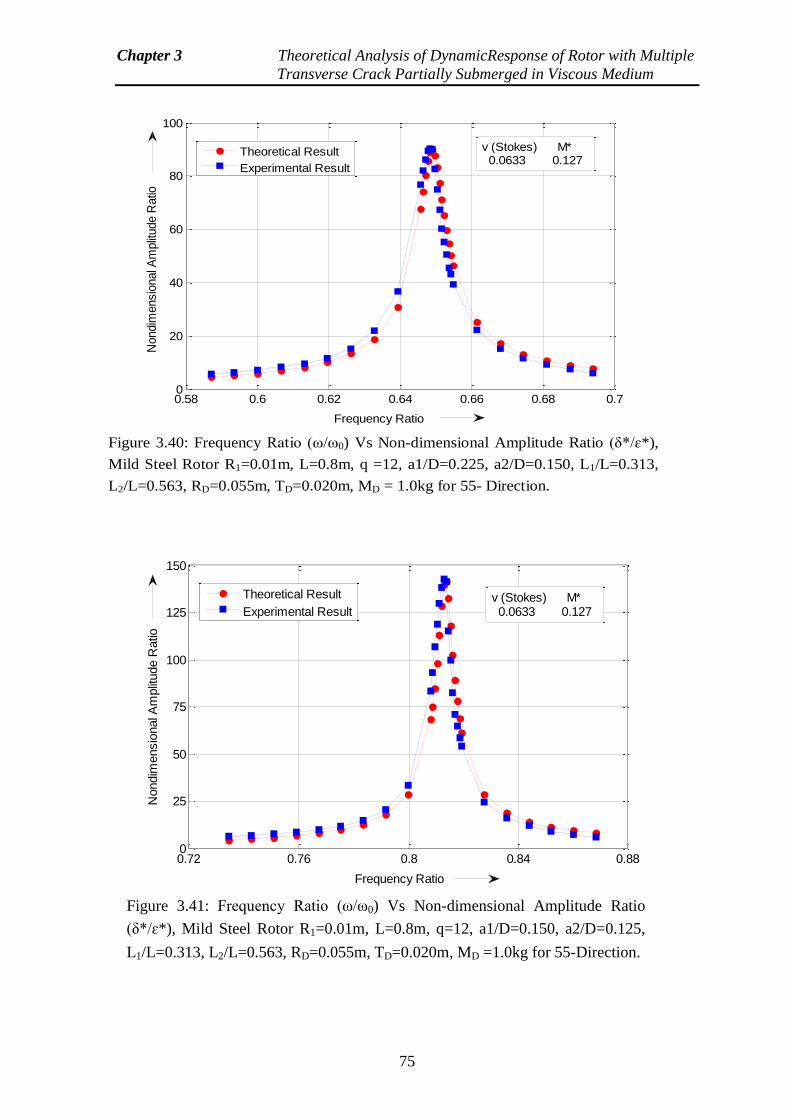
Chapter 3 Theoretical Analysis of DynamicResponse of Rotor with Multiple
Transverse Crack Partially Submerged in Viscous Medium
75
Figure 3.41: Frequency Ratio (ω/ω0) Vs Non-dimensional Amplitude Ratio
(δ*/ɛ*), Mild Steel Rotor R1=0.01m, L=0.8m, q=12, a1/D=0.150, a2/D=0.125,
L1/L=0.313, L2/L=0.563, RD=0.055m, TD=0.020m, MD =1.0kg for 55-Direction.
0.72 0.76 0.8 0.84 0.880
25
50
75
100
125
150
Frequency Ratio
Nondim
ensio
nal A
mplit
ude R
atio
Theoretical Result
Experimental Resultv (Stokes) M* 0.0633 0.127
Figure 3.40: Frequency Ratio (ω/ω0) Vs Non-dimensional Amplitude Ratio (δ*/ɛ*),
Mild Steel Rotor R1=0.01m, L=0.8m, q =12, a1/D=0.225, a2/D=0.150, L1/L=0.313,
L2/L=0.563, RD=0.055m, TD=0.020m, MD = 1.0kg for 55- Direction.
0.58 0.6 0.62 0.64 0.66 0.68 0.70
20
40
60
80
100
Nondim
ensio
nal A
mplit
ude R
atio
Frequency Ratio
Theoretical Result
Experimental Result
v (Stokes) M* 0.0633 0.127
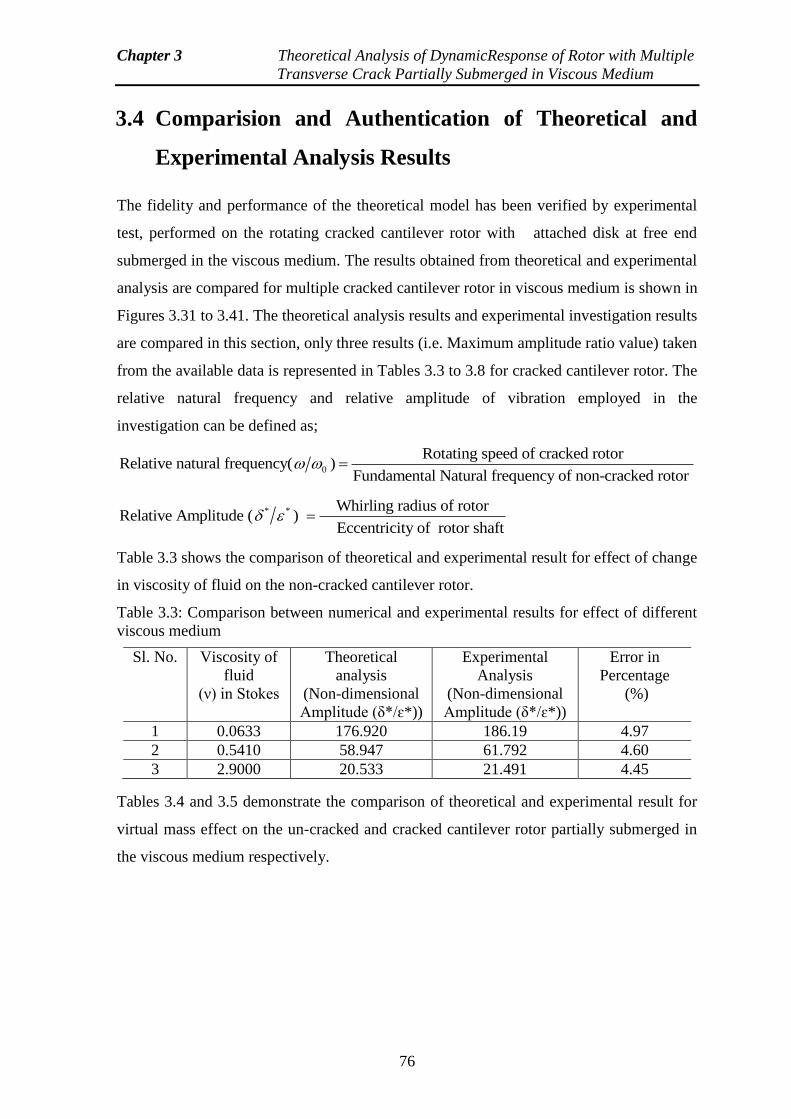
Chapter 3 Theoretical Analysis of DynamicResponse of Rotor with Multiple
Transverse Crack Partially Submerged in Viscous Medium
76
3.4 Comparision and Authentication of Theoretical and
Experimental Analysis Results
The fidelity and performance of the theoretical model has been verified by experimental
test, performed on the rotating cracked cantilever rotor with attached disk at free end
submerged in the viscous medium. The results obtained from theoretical and experimental
analysis are compared for multiple cracked cantilever rotor in viscous medium is shown in
Figures 3.31 to 3.41. The theoretical analysis results and experimental investigation results
are compared in this section, only three results (i.e. Maximum amplitude ratio value) taken
from the available data is represented in Tables 3.3 to 3.8 for cracked cantilever rotor. The
relative natural frequency and relative amplitude of vibration employed in the
investigation can be defined as;
0
Rotating speed of cracked rotorRelative natural frequency( )
Fundamental Natural frequency of non-cracked rotor
* * Whirling radius of rotorRelative Amplitude ( )
Eccentricity of rotor shaft
Table 3.3 shows the comparison of theoretical and experimental result for effect of change
in viscosity of fluid on the non-cracked cantilever rotor.
Table 3.3: Comparison between numerical and experimental results for effect of different
viscous medium
Tables 3.4 and 3.5 demonstrate the comparison of theoretical and experimental result for
virtual mass effect on the un-cracked and cracked cantilever rotor partially submerged in
the viscous medium respectively.
Sl. No. Viscosity of
fluid
(ν) in Stokes
Theoretical
analysis
(Non-dimensional
Amplitude (δ*/ɛ*))
Experimental
Analysis
(Non-dimensional
Amplitude (δ*/ɛ*))
Error in
Percentage
(%)
1 0.0633 176.920 186.19 4.97
2 0.5410 58.947 61.792 4.60
3 2.9000 20.533 21.491 4.45
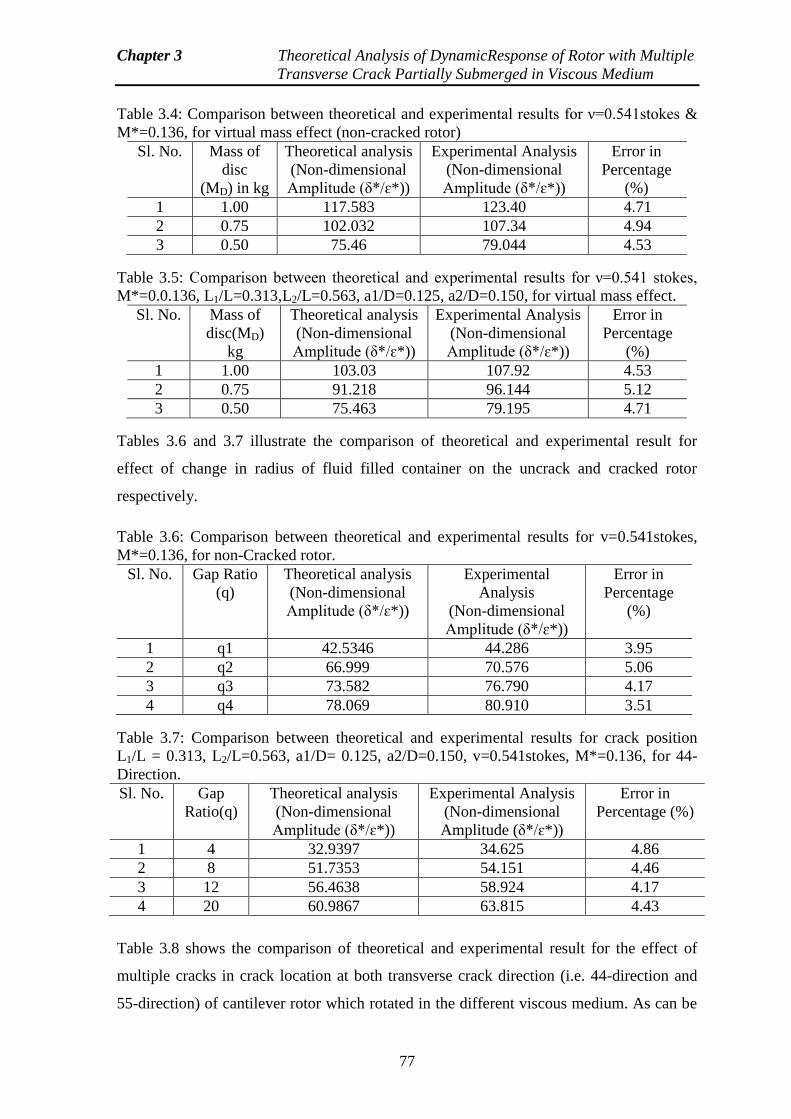
Chapter 3 Theoretical Analysis of DynamicResponse of Rotor with Multiple
Transverse Crack Partially Submerged in Viscous Medium
77
Table 3.4: Comparison between theoretical and experimental results for ν=0.541stokes &
M*=0.136, for virtual mass effect (non-cracked rotor)
Sl. No. Mass of
disc
(MD) in kg
Theoretical analysis
(Non-dimensional
Amplitude (δ*/ɛ*))
Experimental Analysis
(Non-dimensional
Amplitude (δ*/ɛ*))
Error in
Percentage
(%)
1 1.00 117.583 123.40 4.71
2 0.75 102.032 107.34 4.94
3 0.50 75.46 79.044 4.53
Table 3.5: Comparison between theoretical and experimental results for ν=0.541 stokes,
M*=0.0.136, L1/L=0.313,L2/L=0.563, a1/D=0.125, a2/D=0.150, for virtual mass effect. Sl. No. Mass of
disc(MD)
kg
Theoretical analysis
(Non-dimensional
Amplitude (δ*/ɛ*))
Experimental Analysis
(Non-dimensional
Amplitude (δ*/ɛ*))
Error in
Percentage
(%)
1 1.00 103.03 107.92 4.53
2 0.75 91.218 96.144 5.12
3 0.50 75.463 79.195 4.71
Tables 3.6 and 3.7 illustrate the comparison of theoretical and experimental result for
effect of change in radius of fluid filled container on the uncrack and cracked rotor
respectively.
Table 3.6: Comparison between theoretical and experimental results for v=0.541stokes,
M*=0.136, for non-Cracked rotor. Sl. No. Gap Ratio
(q)
Theoretical analysis
(Non-dimensional
Amplitude (δ*/ɛ*))
Experimental
Analysis
(Non-dimensional
Amplitude (δ*/ɛ*))
Error in
Percentage
(%)
1 q1 42.5346 44.286 3.95
2 q2 66.999 70.576 5.06
3 q3 73.582 76.790 4.17
4 q4 78.069 80.910 3.51
Table 3.7: Comparison between theoretical and experimental results for crack position
L1/L = 0.313, L2/L=0.563, a1/D= 0.125, a2/D=0.150, v=0.541stokes, M*=0.136, for 44-
Direction. Sl. No. Gap
Ratio(q)
Theoretical analysis
(Non-dimensional
Amplitude (δ*/ɛ*))
Experimental Analysis
(Non-dimensional
Amplitude (δ*/ɛ*))
Error in
Percentage (%)
1 4 32.9397 34.625 4.86
2 8 51.7353 54.151 4.46
3 12 56.4638 58.924 4.17
4 20 60.9867 63.815 4.43
Table 3.8 shows the comparison of theoretical and experimental result for the effect of
multiple cracks in crack location at both transverse crack direction (i.e. 44-direction and
55-direction) of cantilever rotor which rotated in the different viscous medium. As can be
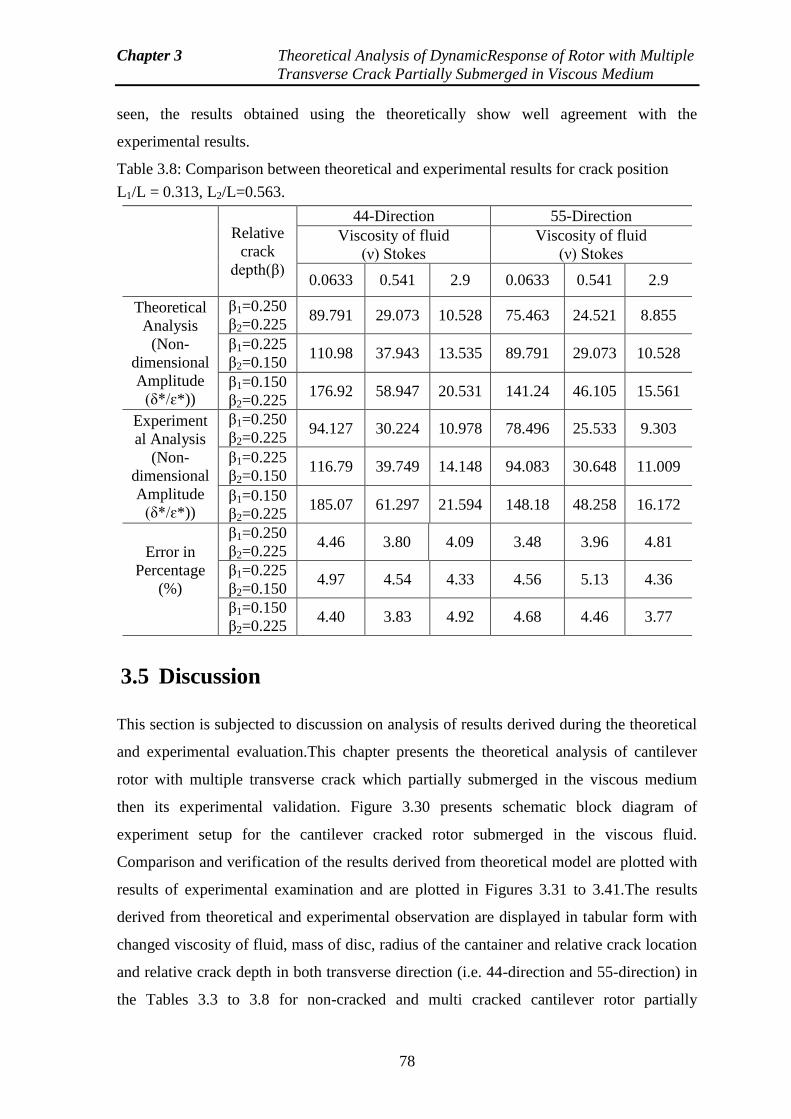
Chapter 3 Theoretical Analysis of DynamicResponse of Rotor with Multiple
Transverse Crack Partially Submerged in Viscous Medium
78
seen, the results obtained using the theoretically show well agreement with the
experimental results.
Table 3.8: Comparison between theoretical and experimental results for crack position
L1/L = 0.313, L2/L=0.563.
Relative
crack
depth(β)
44-Direction 55-Direction
Viscosity of fluid
(ν) Stokes
Viscosity of fluid
(ν) Stokes
0.0633 0.541 2.9 0.0633 0.541 2.9
Theoretical
Analysis
(Non-
dimensional
Amplitude
(δ*/ɛ*))
β1=0.250
β2=0.225 89.791 29.073 10.528 75.463 24.521 8.855
β1=0.225
β2=0.150 110.98 37.943 13.535 89.791 29.073 10.528
β1=0.150
β2=0.225 176.92 58.947 20.531 141.24 46.105 15.561
Experiment
al Analysis
(Non-
dimensional
Amplitude
(δ*/ɛ*))
β1=0.250
β2=0.225 94.127 30.224 10.978 78.496 25.533 9.303
β1=0.225
β2=0.150 116.79 39.749 14.148 94.083 30.648 11.009
β1=0.150
β2=0.225 185.07 61.297 21.594 148.18 48.258 16.172
Error in
Percentage
(%)
β1=0.250
β2=0.225 4.46 3.80 4.09 3.48 3.96 4.81
β1=0.225
β2=0.150 4.97 4.54 4.33 4.56 5.13 4.36
β1=0.150
β2=0.225 4.40 3.83 4.92 4.68 4.46 3.77
3.5 Discussion
This section is subjected to discussion on analysis of results derived during the theoretical
and experimental evaluation.This chapter presents the theoretical analysis of cantilever
rotor with multiple transverse crack which partially submerged in the viscous medium
then its experimental validation. Figure 3.30 presents schematic block diagram of
experiment setup for the cantilever cracked rotor submerged in the viscous fluid.
Comparison and verification of the results derived from theoretical model are plotted with
results of experimental examination and are plotted in Figures 3.31 to 3.41.The results
derived from theoretical and experimental observation are displayed in tabular form with
changed viscosity of fluid, mass of disc, radius of the cantainer and relative crack location
and relative crack depth in both transverse direction (i.e. 44-direction and 55-direction) in
the Tables 3.3 to 3.8 for non-cracked and multi cracked cantilever rotor partially
Chapter 3 Theoretical Analysis of DynamicResponse of Rotor with Multiple
Transverse Crack Partially Submerged in Viscous Medium
79
submerged in viscous medium.Table 3.3 shows the comparison of theoretical and
experimental result for effect of change in viscosity of fluid on the non-cracked cantilever
rotor. Tables 3.4 and 3.5 demonstrate the comparison of theoretical and experimental
result for virtual mass effect on the un-cracked and cracked cantilever rotor partially
submerged in the viscous medium respectively. Tables 3.6 and 3.7 illustrate the
comparison of theoretical and experimental result for effect of change in radius of fluid
filled container on the uncrack and cracked rotor respectively.Table 3.8 shows the
comparison of theoretical and experimental result for the effect of multiple cracks in crack
location at both transverse crack direction (i.e. 44-direction and 55-direction) of cantilever
rotor which rotated in the different viscous medium. As can be seen, the results obtained
using the theoretically show well agreement with the experimental results.
3.6 Summary
The summary is outlined are drawn in this section based on the results derived from
theoretical and experimental examination in this chapter. The vibration response (i.e.
natural frequencies and amplitude) are changed due to altered viscosity of fluid, mass of
disc, radius of fluid filled container and presence of transverse crack in the cantilever
rotor.The vibration responses derived from theoretical analysis have been verified with the
obtained results of experimental investigation and a close proximity is found. The
percentage of error between the theoretical and experimental analysis is found within
5%.The error in the dynamic behavior of the rotor can be used as the factor for diagnosis
of the crack. The proposed method can be successfully applied for the design of smart
artificial intelligent techniques for online measurement of the crack present in the rotor
partially submerged in viscous medium. In the successive chapters various artificial
intelligent based techniques have been discussed for identification of multiple cracks
present in rotor system.
80
Chapter 4
Finite Element Analysis of Multiple
Cracked Cantilever Rotor Partially
Submerged in Fluid Medium for
Measurement of Dynamic Response
The presence of cracks in the rotor, beam and structural components is a serious risk to the
integrity of the system. This may be because of destruction and collapse of the structures.
The detection of the crack in the early stage of the system is beneficial. In the last two
decades, many researchers and engineers have developed several methods and presented
many models for the prediction of cracks, based on vibrational behaviors of cracked
structures. The techniques based on vibration are used for identification of damage; given
some benifits over other conventional methodologies. These technique can help to detect
crack depth and location using vibrational data, obtained from the cracked structure. The
presence of the crack in structures generates flexibility at the vicinity of crack which
causes the reduction of natural frequencies and amplitude. Hence it may be possible to
detect crack location and intensity by measuring the change in vibration parameters. The
current chapter introduces the finite element analysis for detection the multiple cracks in
the cantilever rotor partially submerged in the viscous fluid medium. The results of finite
element analysis have been compared with the results of theoretical analysis and
experimental analysis to secure the consistance of proposed numerical method. Finally it
is concluded that proposed finite element method can be successfully applied for
identification of multiple crack in structures(i.e. Rotor, beam,plates etc).
4.1 Introduction
Mechanism of damage detection techniques in different engineering system can be
characterized as a organized methodology to predict and compute the damage existing in
Chapter 4 Finite Element Analysis of Multiple Cracked Cantilever Rotor
Partially Submerged in Fluid Medium for Measurement of
Dynamic Response
81
the system. The concerned of the failure analysis of faulty beam structure is to secure the
overall safety and performance of the system. The vibration characteristics of faulty
structural members can be effectively used to seize the damage feature such as crack
location and crack depth. The researchers have proposed various damage detection
methods based on thermal radiation, energy, discreet wavelet and numerical methods such
as artificial intelligent and finite element methods. In the past few decades, scientists have
developed a model for single crack structure based on the finite element method and found
that the enactment of finite element method is enhanced as compared to the theoretical
model designed for identification of crack. Hence, this method can be employed to detect
the crack parameters such as location and depth of crack in the system using the modal
response of the system. In the present section finite element method has been used to find
crack locations and depths for multiple cracked composites and structural steel beams. It is
found that the presence of cracks in the beam structure potentially affect the dynamic
behavior of the beam. The finite element result has been compared to that of theoretical
and experimental analysis results and close proximity between the results is found.
4.2 Analysis of Finite Element Method using ANSYS
The finite element method is a powerful finite element method that can be used to solve
the complex problem using interpolation or approximation method. The finite element
method is a systematic approach for solving the complicated problems. So the finite
element method can be applied in vibrating structures with different boundary conditions
to get the exact solution. In the finite element analysis, the whole structure is first divided
into small parts in various shapes. These small parts known as elements and method
employed to split the structures in small parts is called discretization and generation of the
regular shape pattern in the structure are called meshing. The efficiency of finite element
method is dependent on the quality of the mesh. Convergence test is considered for
choosing the appropriate size of mesh element. Each element of finite element model has
corner points that connect to another element called nodes. Each finite element associated
with the equation of motion and that can be easily interpolated. The solutions of each
finite element are combined to get global mass and stiffness matrices, which describes the
vibration response of the structure. The global mass and stiffness matrices can be analyzed
to get vibrational parameters of the structure. The finite element analysis of cantilever
Chapter 4 Finite Element Analysis of Multiple Cracked Cantilever Rotor
Partially Submerged in Fluid Medium for Measurement of
Dynamic Response
82
beam has been done using ANSYS software. ANSYS is commercially available finite
element analysis software with capacity of solving wide range of complex problems. The
application of ANSYS is spread over many fields of engineering and technology such as
structural, thermal, mechanical, electromagnetic and computational fluid dynamics. The
modelling and simulation of mild steel cantilever rotor submerged in the viscous medium
has been done in ANSYS using multi-physics platform. The natural frequencies and
relevant amplitude at both transverse direction (i.e. 44 and 55-axis) have been extracted
from block lanczos. ANSYS involves the following steps in order to solve the problem:
(1) Preprocessing Phase: This section of the ANSYS involves the selection of type of the
element with respect to problem types. The ANSYS also provides the CAD modelling
facility. Meshing process is the most important feature of FE analysis. Convergence test is
conducted to evaluate the suitable size of mesh element.
(2) Solution Phase: Applying the boundary conditions and load on the structural
component are the most significant feature of this section. ANSYS then attempts to solve
the equation of motion of the system element. The block lanczos method is taken in the
present investigation.
(3) Post processing phase: This section allows the review of the results. The post
processing is most significant tool for viewing the results after the solution phase. These
results may be in form of color contour plot and graphical representation of the stress,
thermal, buckling, electromagnetic, vibration and computation fluid dynamics analysis etc.
4.3 Analysis of Finite Element Analysis of Rotor with
Transverse Cracks Partially Submerged in the Viscous
Fluid
The finite element analysis is performed for studying the modal response of a rotating
cracked rotor.The natural frequencies and amplitude are the most important parameters in
designing a structure under the dynamic and complex loading conditions. The finite
element analysis is performed using the ANSYS software in the frequency domain to find
change in behaviors of vibration parameters. The presence of damage in the form of crack
and different viscous fluid medium parameters alters the vibration indices. The change in
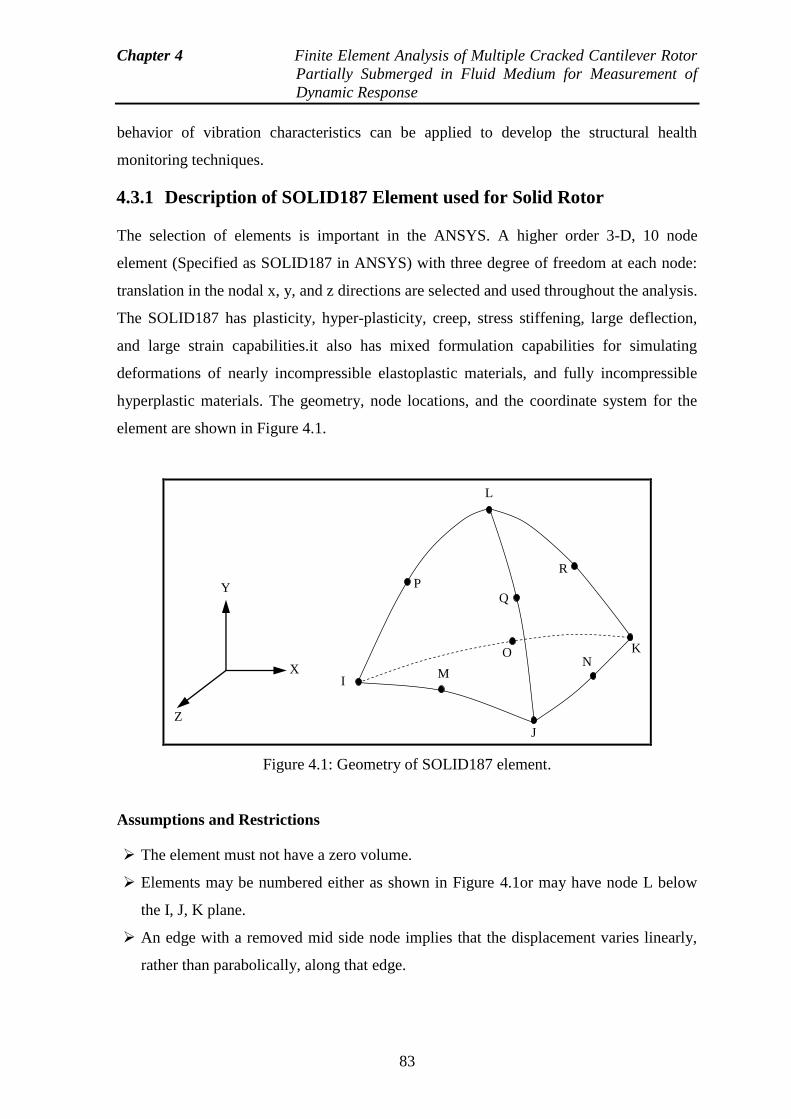
Chapter 4 Finite Element Analysis of Multiple Cracked Cantilever Rotor
Partially Submerged in Fluid Medium for Measurement of
Dynamic Response
83
behavior of vibration characteristics can be applied to develop the structural health
monitoring techniques.
4.3.1 Description of SOLID187 Element used for Solid Rotor
The selection of elements is important in the ANSYS. A higher order 3-D, 10 node
element (Specified as SOLID187 in ANSYS) with three degree of freedom at each node:
translation in the nodal x, y, and z directions are selected and used throughout the analysis.
The SOLID187 has plasticity, hyper-plasticity, creep, stress stiffening, large deflection,
and large strain capabilities.it also has mixed formulation capabilities for simulating
deformations of nearly incompressible elastoplastic materials, and fully incompressible
hyperplastic materials. The geometry, node locations, and the coordinate system for the
element are shown in Figure 4.1.
L
M I
P R
Q
J
O N
K
Z
Y
X
Figure 4.1: Geometry of SOLID187 element.
Assumptions and Restrictions
The element must not have a zero volume.
Elements may be numbered either as shown in Figure 4.1or may have node L below
the I, J, K plane.
An edge with a removed mid side node implies that the displacement varies linearly,
rather than parabolically, along that edge.
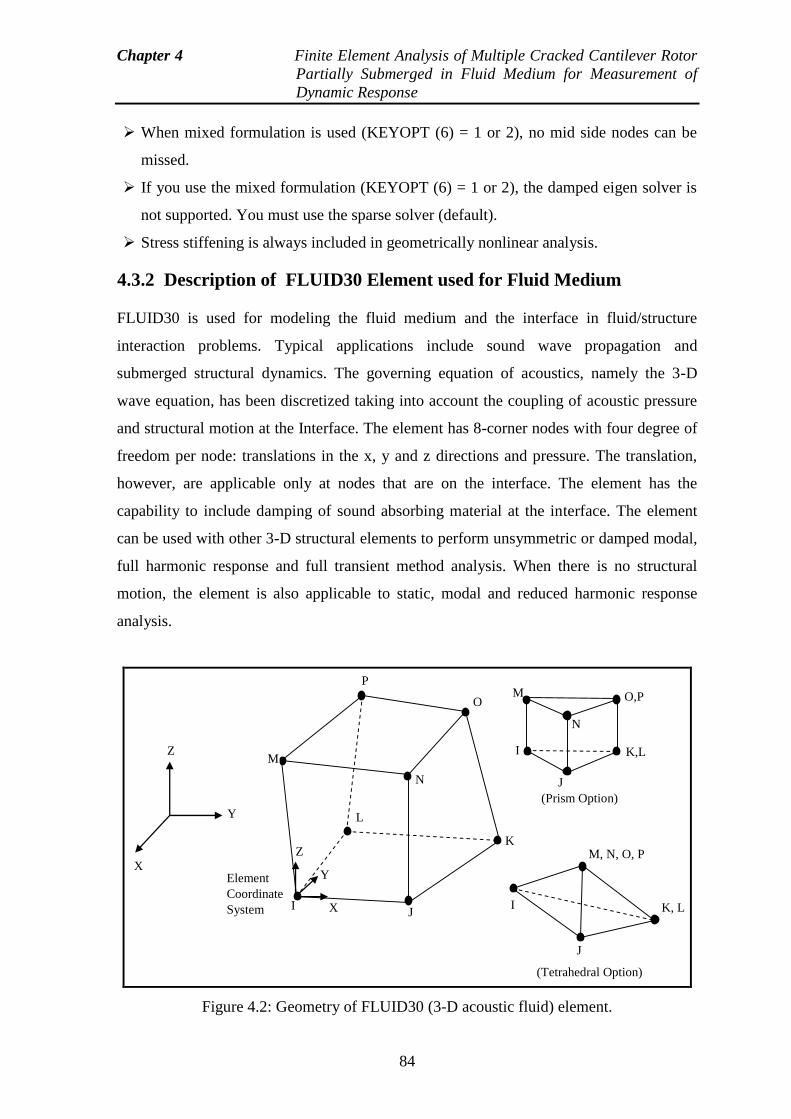
Chapter 4 Finite Element Analysis of Multiple Cracked Cantilever Rotor
Partially Submerged in Fluid Medium for Measurement of
Dynamic Response
84
When mixed formulation is used (KEYOPT (6) = 1 or 2), no mid side nodes can be
missed.
If you use the mixed formulation (KEYOPT (6) = 1 or 2), the damped eigen solver is
not supported. You must use the sparse solver (default).
Stress stiffening is always included in geometrically nonlinear analysis.
4.3.2 Description of FLUID30 Element used for Fluid Medium
FLUID30 is used for modeling the fluid medium and the interface in fluid/structure
interaction problems. Typical applications include sound wave propagation and
submerged structural dynamics. The governing equation of acoustics, namely the 3-D
wave equation, has been discretized taking into account the coupling of acoustic pressure
and structural motion at the Interface. The element has 8-corner nodes with four degree of
freedom per node: translations in the x, y and z directions and pressure. The translation,
however, are applicable only at nodes that are on the interface. The element has the
capability to include damping of sound absorbing material at the interface. The element
can be used with other 3-D structural elements to perform unsymmetric or damped modal,
full harmonic response and full transient method analysis. When there is no structural
motion, the element is also applicable to static, modal and reduced harmonic response
analysis.
Z
Y
X
M O,P
K,L I
J
N
M, N, O, P
K, L I
J
(Tetrahedral Option)
(Prism Option)
X
Z
X Y
P
O
M
M
L
K
J I
Element
Coordinate
System
N
M
Figure 4.2: Geometry of FLUID30 (3-D acoustic fluid) element.
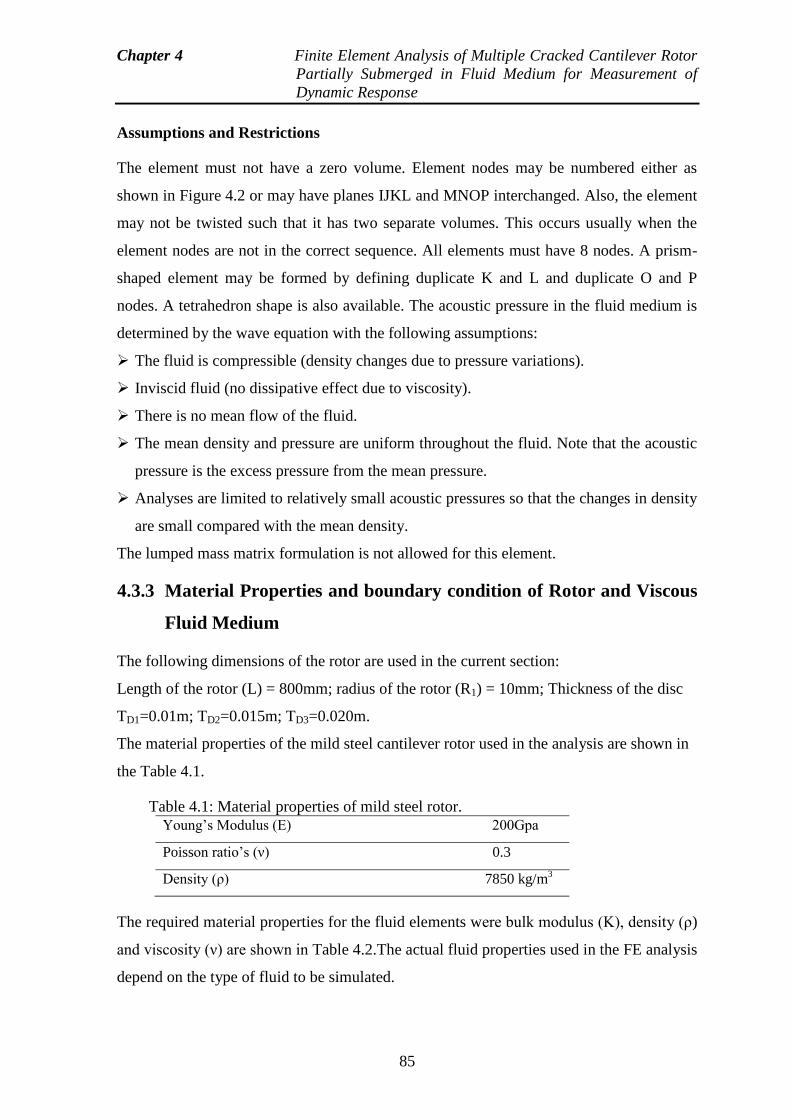
Chapter 4 Finite Element Analysis of Multiple Cracked Cantilever Rotor
Partially Submerged in Fluid Medium for Measurement of
Dynamic Response
85
Assumptions and Restrictions
The element must not have a zero volume. Element nodes may be numbered either as
shown in Figure 4.2 or may have planes IJKL and MNOP interchanged. Also, the element
may not be twisted such that it has two separate volumes. This occurs usually when the
element nodes are not in the correct sequence. All elements must have 8 nodes. A prism-
shaped element may be formed by defining duplicate K and L and duplicate O and P
nodes. A tetrahedron shape is also available. The acoustic pressure in the fluid medium is
determined by the wave equation with the following assumptions:
The fluid is compressible (density changes due to pressure variations).
Inviscid fluid (no dissipative effect due to viscosity).
There is no mean flow of the fluid.
The mean density and pressure are uniform throughout the fluid. Note that the acoustic
pressure is the excess pressure from the mean pressure.
Analyses are limited to relatively small acoustic pressures so that the changes in density
are small compared with the mean density.
The lumped mass matrix formulation is not allowed for this element.
4.3.3 Material Properties and boundary condition of Rotor and Viscous
Fluid Medium
The following dimensions of the rotor are used in the current section:
Length of the rotor (L) = 800mm; radius of the rotor (R1) = 10mm; Thickness of the disc
TD1=0.01m; TD2=0.015m; TD3=0.020m.
The material properties of the mild steel cantilever rotor used in the analysis are shown in
the Table 4.1.
Table 4.1: Material properties of mild steel rotor.
Young’s Modulus (E) 200Gpa
Poisson ratio’s (ν) 0.3
Density (ρ) 7850 kg/m3
The required material properties for the fluid elements were bulk modulus (K), density (ρ)
and viscosity (ν) are shown in Table 4.2.The actual fluid properties used in the FE analysis
depend on the type of fluid to be simulated.
Chapter 4 Finite Element Analysis of Multiple Cracked Cantilever Rotor
Partially Submerged in Fluid Medium for Measurement of
Dynamic Response
86
Table 4.2: Physical properties of viscous fluid medium (for water).
Bulk Modulus (E) 2.05GPa
Viscosity (ν) 0.01poise
Density (ρ) 1000 kg/m3
Cantilever rotor has fixed at both x and y direction (X=0,Y=0) and rotated at z direction
those are parallel direction of axis of rotor. Rotor speed has been set between the ranges of
300 to 700 rpm. Fluid container is fixed in all direction( X=0,Y=0 and Z=0) from the
bottom side. Mesh size has been chosen on the basis of conversion test. Mesh size is 4710.
The natural frequency and amplitude for cracked rotor derived from finite element based
finite element analysis are plotted along with theoretical and experimental analysis results
of cracked cantilever rotor with viscous medium and the orientation of cracks (β1=0.125,
β2=0.175, β3=0.225 and β4=0.275) is shown in the Figures 4.3 to 4.13.
Figure 4.3: Frequency Ratio (ω/ω0) Vs Non-dimensional Amplitude Ratio (δ*/ɛ*),
Mild Steel Rotor R1=0.01m, L=0.8m, q =12, RD = 0.055m, TD= 0.020m, MD =
1.0kg .
0.9 0.93 0.96 0.99 1.02 1.05 1.080
25
50
75
100
125
150
175
200
Frequency Ratio
Nondim
ensio
nal A
mplit
ude R
atio
Theoretical Result
FEA Result
Experimental Result
v (Stokes) M* 0.0633 0.127
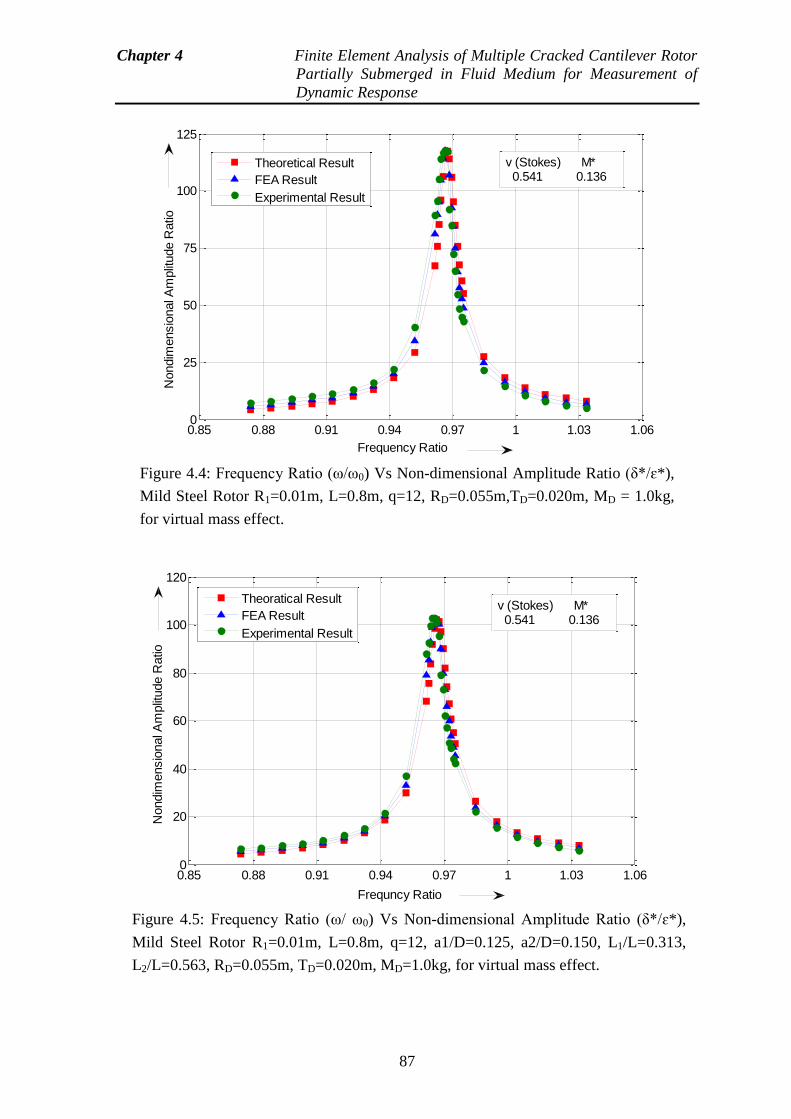
Chapter 4 Finite Element Analysis of Multiple Cracked Cantilever Rotor
Partially Submerged in Fluid Medium for Measurement of
Dynamic Response
87
Figure 4.4: Frequency Ratio (ω/ω0) Vs Non-dimensional Amplitude Ratio (δ*/ɛ*),
Mild Steel Rotor R1=0.01m, L=0.8m, q=12, RD=0.055m,TD=0.020m, MD = 1.0kg,
for virtual mass effect.
0.85 0.88 0.91 0.94 0.97 1 1.03 1.060
25
50
75
100
125
Frequency Ratio
Nondim
ensio
nal A
mplit
ude R
atio
Theoretical Result
FEA Result
Experimental Result
v (Stokes) M* 0.541 0.136
Figure 4.5: Frequency Ratio (ω/ ω0) Vs Non-dimensional Amplitude Ratio (δ*/ɛ*),
Mild Steel Rotor R1=0.01m, L=0.8m, q=12, a1/D=0.125, a2/D=0.150, L1/L=0.313,
L2/L=0.563, RD=0.055m, TD=0.020m, MD=1.0kg, for virtual mass effect.
0.85 0.88 0.91 0.94 0.97 1 1.03 1.060
20
40
60
80
100
120
Frequncy Ratio
Nondim
ensio
nal A
mplit
ude R
atio
Theoratical Result
FEA Result
Experimental Result
v (Stokes) M* 0.541 0.136
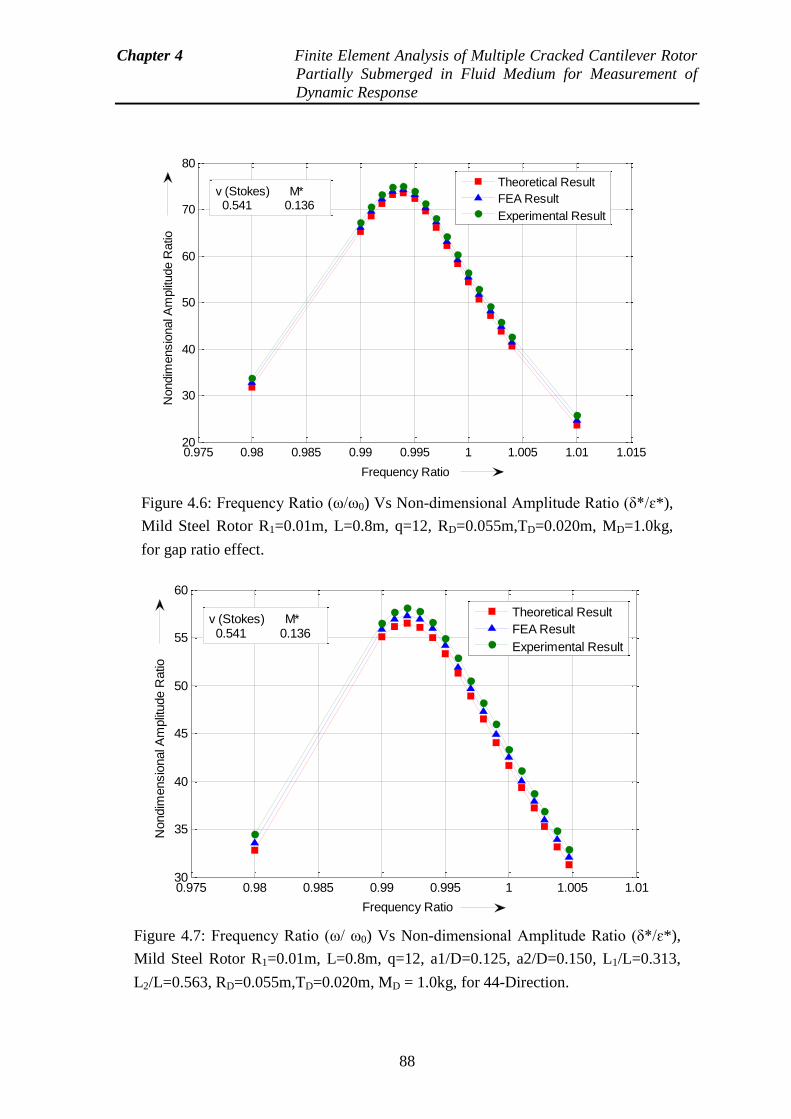
Chapter 4 Finite Element Analysis of Multiple Cracked Cantilever Rotor
Partially Submerged in Fluid Medium for Measurement of
Dynamic Response
88
Figure 4.6: Frequency Ratio (ω/ω0) Vs Non-dimensional Amplitude Ratio (δ*/ɛ*),
Mild Steel Rotor R1=0.01m, L=0.8m, q=12, RD=0.055m,TD=0.020m, MD=1.0kg,
for gap ratio effect.
0.975 0.98 0.985 0.99 0.995 1 1.005 1.01 1.01520
30
40
50
60
70
80
Frequency Ratio
Nondim
ensio
nal A
mplit
ude R
atio
Theoretical Result
FEA Result
Experimental Result
v (Stokes) M* 0.541 0.136
Figure 4.7: Frequency Ratio (ω/ ω0) Vs Non-dimensional Amplitude Ratio (δ*/ɛ*),
Mild Steel Rotor R1=0.01m, L=0.8m, q=12, a1/D=0.125, a2/D=0.150, L1/L=0.313,
L2/L=0.563, RD=0.055m,TD=0.020m, MD = 1.0kg, for 44-Direction.
0.975 0.98 0.985 0.99 0.995 1 1.005 1.0130
35
40
45
50
55
60
Frequency Ratio
Nondim
ensio
nal A
mplit
ude R
atio
Theoretical Result
FEA Result
Experimental Result
v (Stokes) M* 0.541 0.136
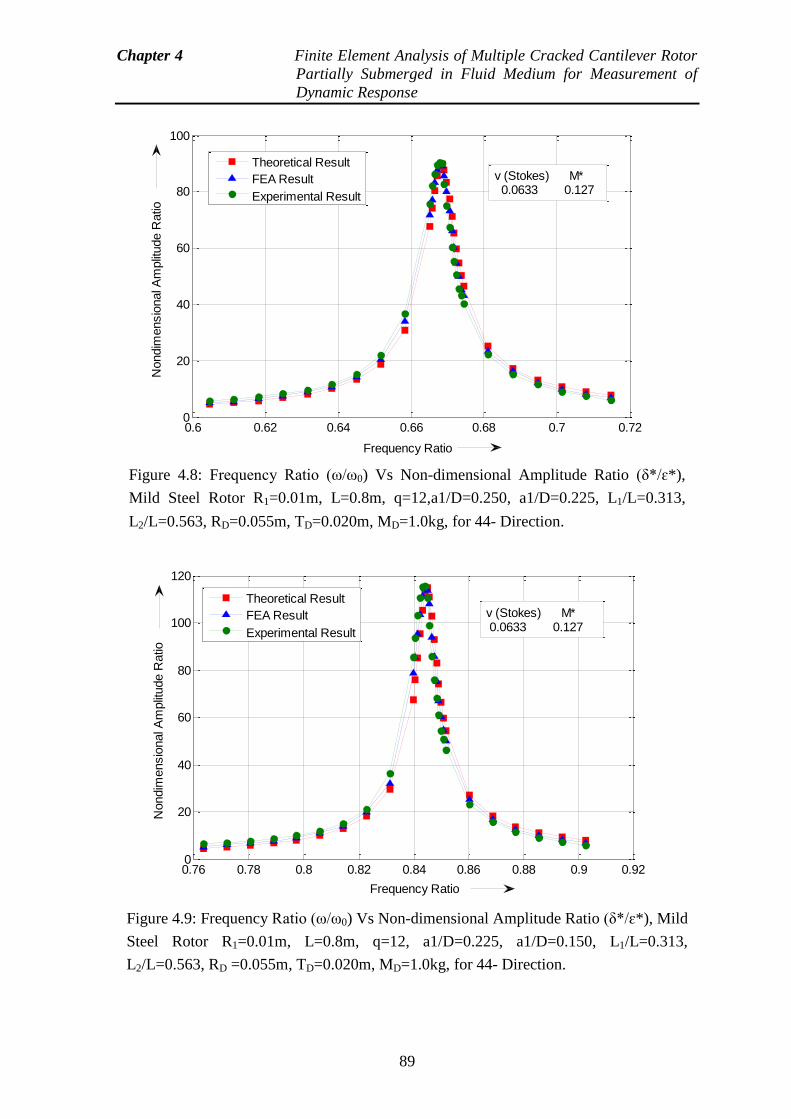
Chapter 4 Finite Element Analysis of Multiple Cracked Cantilever Rotor
Partially Submerged in Fluid Medium for Measurement of
Dynamic Response
89
Figure 4.8: Frequency Ratio (ω/ω0) Vs Non-dimensional Amplitude Ratio (δ*/ɛ*),
Mild Steel Rotor R1=0.01m, L=0.8m, q=12,a1/D=0.250, a1/D=0.225, L1/L=0.313,
L2/L=0.563, RD=0.055m, TD=0.020m, MD=1.0kg, for 44- Direction.
0.6 0.62 0.64 0.66 0.68 0.7 0.720
20
40
60
80
100
Frequency Ratio
Nondim
ensio
nal A
mplit
ude R
atio
Theoretical Result
FEA Result
Experimental Result
v (Stokes) M* 0.0633 0.127
Figure 4.9: Frequency Ratio (ω/ω0) Vs Non-dimensional Amplitude Ratio (δ*/ɛ*), Mild
Steel Rotor R1=0.01m, L=0.8m, q=12, a1/D=0.225, a1/D=0.150, L1/L=0.313,
L2/L=0.563, RD =0.055m, TD=0.020m, MD=1.0kg, for 44- Direction.
0.76 0.78 0.8 0.82 0.84 0.86 0.88 0.9 0.920
20
40
60
80
100
120
Frequency Ratio
Nondim
ensio
nal A
mplit
ude R
atio
Theoretical Result
FEA Result
Experimental Result
v (Stokes) M* 0.0633 0.127
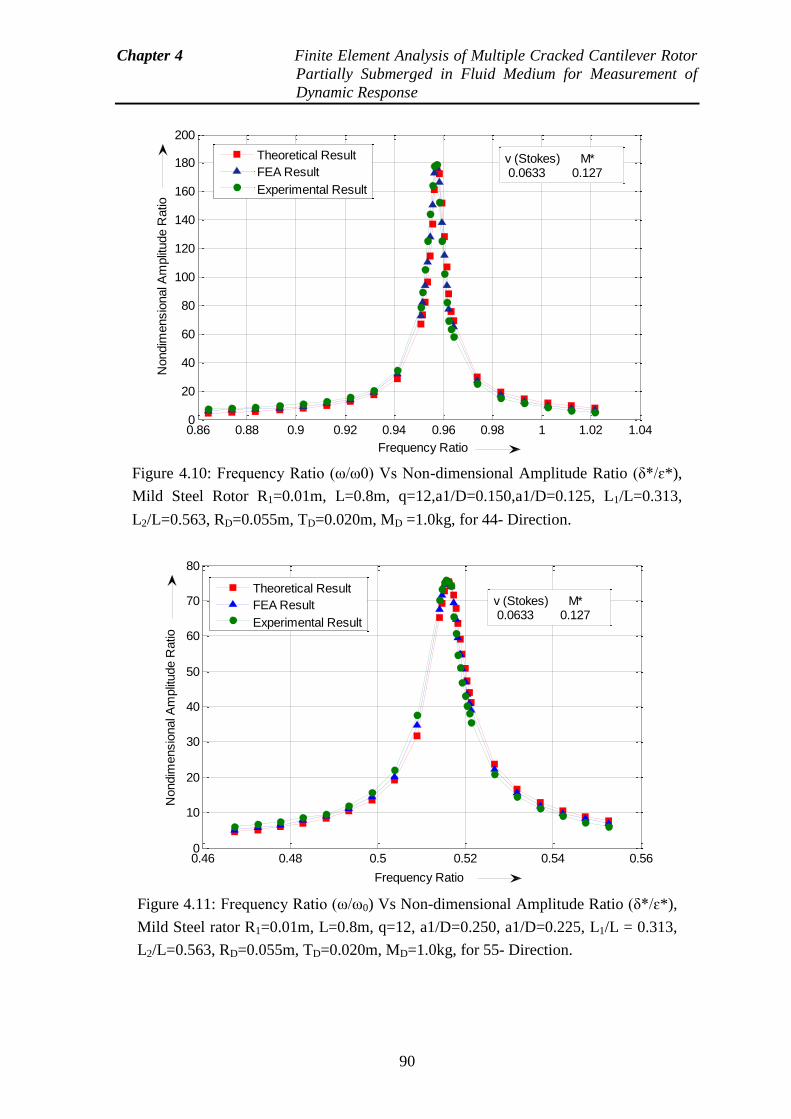
Chapter 4 Finite Element Analysis of Multiple Cracked Cantilever Rotor
Partially Submerged in Fluid Medium for Measurement of
Dynamic Response
90
Figure 4.10: Frequency Ratio (ω/ω0) Vs Non-dimensional Amplitude Ratio (δ*/ɛ*),
Mild Steel Rotor R1=0.01m, L=0.8m, q=12,a1/D=0.150,a1/D=0.125, L1/L=0.313,
L2/L=0.563, RD=0.055m, TD=0.020m, MD =1.0kg, for 44- Direction.
0.86 0.88 0.9 0.92 0.94 0.96 0.98 1 1.02 1.040
20
40
60
80
100
120
140
160
180
200
Frequency Ratio
Nondim
ensio
nal A
mplit
ude R
atio
Theoretical Result
FEA Result
Experimental Result
v (Stokes) M* 0.0633 0.127
Figure 4.11: Frequency Ratio (ω/ω0) Vs Non-dimensional Amplitude Ratio (δ*/ɛ*),
Mild Steel rator R1=0.01m, L=0.8m, q=12, a1/D=0.250, a1/D=0.225, L1/L = 0.313,
L2/L=0.563, RD=0.055m, TD=0.020m, MD=1.0kg, for 55- Direction.
0.46 0.48 0.5 0.52 0.54 0.560
10
20
30
40
50
60
70
80
Frequency Ratio
Nondim
ensio
nal A
mplit
ude R
atio
Theoretical Result
FEA Result
Experimental Result
v (Stokes) M* 0.0633 0.127
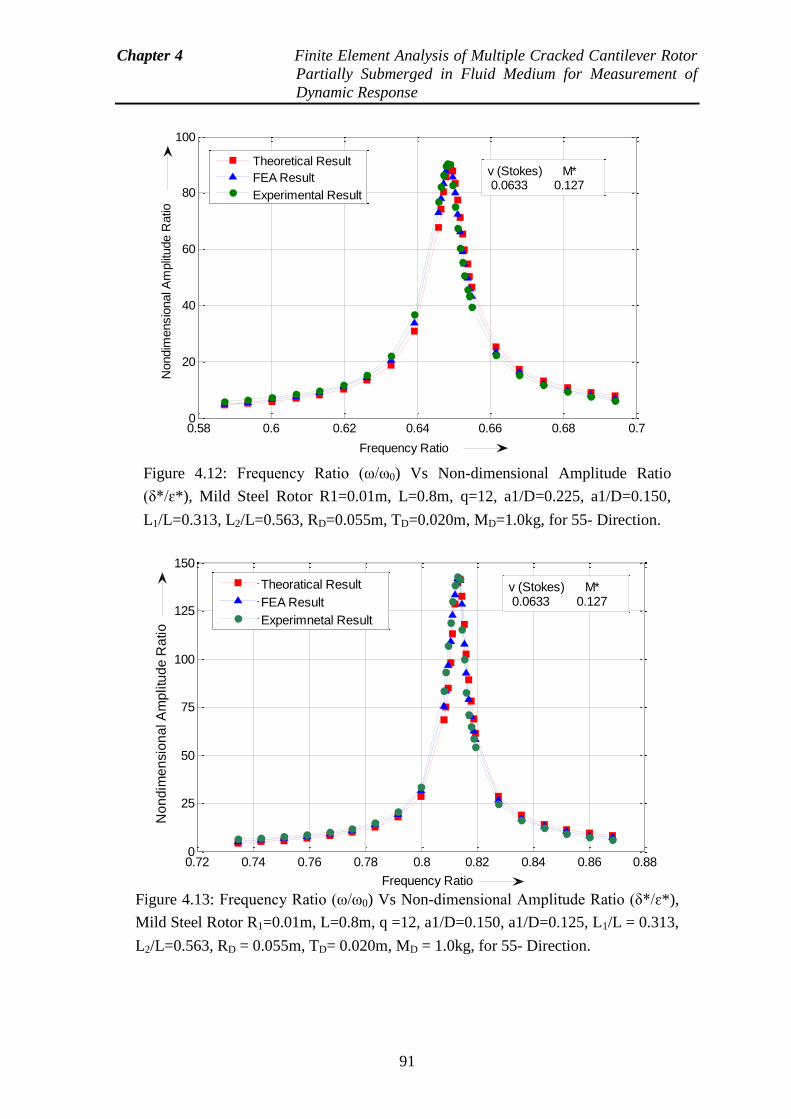
Chapter 4 Finite Element Analysis of Multiple Cracked Cantilever Rotor
Partially Submerged in Fluid Medium for Measurement of
Dynamic Response
91
Figure 4.12: Frequency Ratio (ω/ω0) Vs Non-dimensional Amplitude Ratio
(δ*/ɛ*), Mild Steel Rotor R1=0.01m, L=0.8m, q=12, a1/D=0.225, a1/D=0.150,
L1/L=0.313, L2/L=0.563, RD=0.055m, TD=0.020m, MD=1.0kg, for 55- Direction.
0.58 0.6 0.62 0.64 0.66 0.68 0.70
20
40
60
80
100
Frequency Ratio
Nondim
ensio
nal A
mplit
ude R
atio
Theoretical Result
FEA Result
Experimental Result
v (Stokes) M* 0.0633 0.127
Figure 4.13: Frequency Ratio (ω/ω0) Vs Non-dimensional Amplitude Ratio (δ*/ɛ*),
Mild Steel Rotor R1=0.01m, L=0.8m, q =12, a1/D=0.150, a1/D=0.125, L1/L = 0.313,
L2/L=0.563, RD = 0.055m, TD= 0.020m, MD = 1.0kg, for 55- Direction.
0.72 0.74 0.76 0.78 0.8 0.82 0.84 0.86 0.880
25
50
75
100
125
150
Frequency Ratio
No
nd
ime
nsio
na
l A
mp
litu
de
Ra
tio
Theoratical Result
FEA Result
Experimnetal Result
v (Stokes) M* 0.0633 0.127
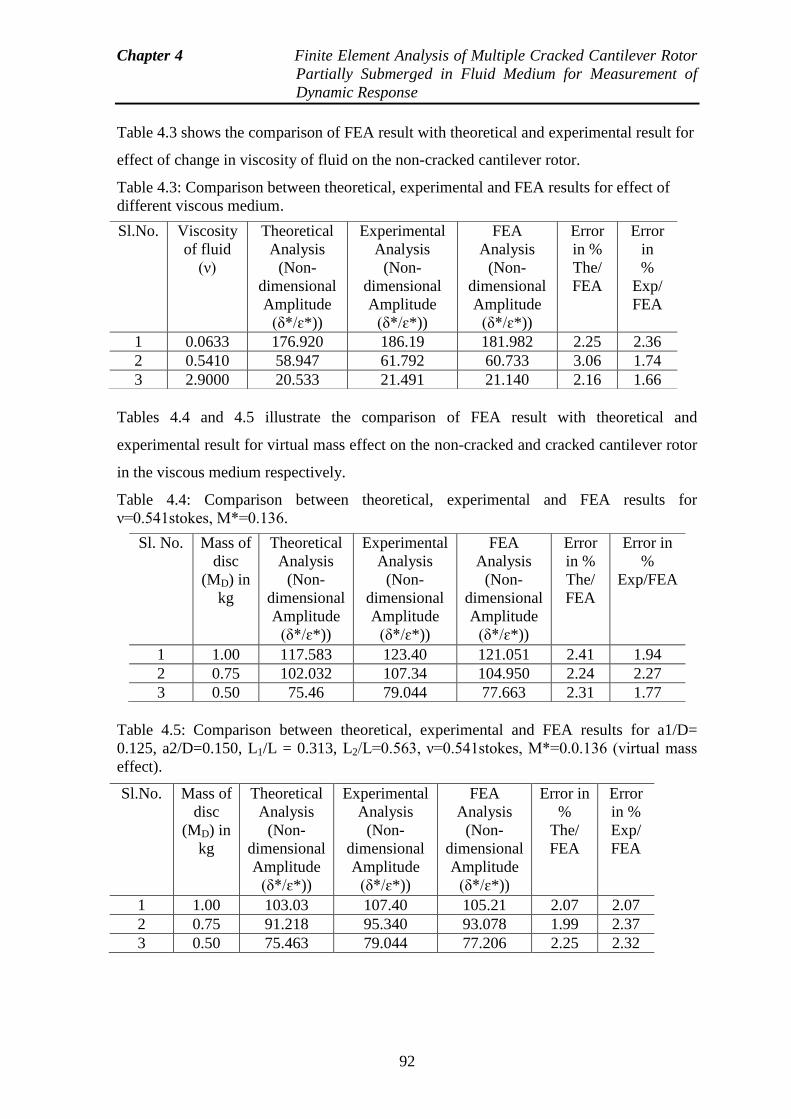
Chapter 4 Finite Element Analysis of Multiple Cracked Cantilever Rotor
Partially Submerged in Fluid Medium for Measurement of
Dynamic Response
92
Table 4.3 shows the comparison of FEA result with theoretical and experimental result for
effect of change in viscosity of fluid on the non-cracked cantilever rotor.
Table 4.3: Comparison between theoretical, experimental and FEA results for effect of
different viscous medium.
Tables 4.4 and 4.5 illustrate the comparison of FEA result with theoretical and
experimental result for virtual mass effect on the non-cracked and cracked cantilever rotor
in the viscous medium respectively.
Table 4.4: Comparison between theoretical, experimental and FEA results for
ν=0.541stokes, M*=0.136.
Table 4.5: Comparison between theoretical, experimental and FEA results for a1/D=
0.125, a2/D=0.150, L1/L = 0.313, L2/L=0.563, ν=0.541stokes, M*=0.0.136 (virtual mass
effect).
Sl.No. Viscosity
of fluid
(ν)
Theoretical
Analysis
(Non-
dimensional
Amplitude
(δ*/ɛ*))
Experimental
Analysis
(Non-
dimensional
Amplitude
(δ*/ɛ*))
FEA
Analysis
(Non-
dimensional
Amplitude
(δ*/ɛ*))
Error
in %
The/
FEA
Error
in
%
Exp/
FEA
1 0.0633 176.920 186.19 181.982 2.25 2.36
2 0.5410 58.947 61.792 60.733 3.06 1.74
3 2.9000 20.533 21.491 21.140 2.16 1.66
Sl. No. Mass of
disc
(MD) in
kg
Theoretical
Analysis
(Non-
dimensional
Amplitude
(δ*/ɛ*))
Experimental
Analysis
(Non-
dimensional
Amplitude
(δ*/ɛ*))
FEA
Analysis
(Non-
dimensional
Amplitude
(δ*/ɛ*))
Error
in %
The/
FEA
Error in
%
Exp/FEA
1 1.00 117.583 123.40 121.051 2.41 1.94
2 0.75 102.032 107.34 104.950 2.24 2.27
3 0.50 75.46 79.044 77.663 2.31 1.77
Sl.No. Mass of
disc
(MD) in
kg
Theoretical
Analysis
(Non-
dimensional
Amplitude
(δ*/ɛ*))
Experimental
Analysis
(Non-
dimensional
Amplitude
(δ*/ɛ*))
FEA
Analysis
(Non-
dimensional
Amplitude
(δ*/ɛ*))
Error in
%
The/
FEA
Error
in %
Exp/
FEA
1 1.00 103.03 107.40 105.21 2.07 2.07
2 0.75 91.218 95.340 93.078 1.99 2.37
3 0.50 75.463 79.044 77.206 2.25 2.32
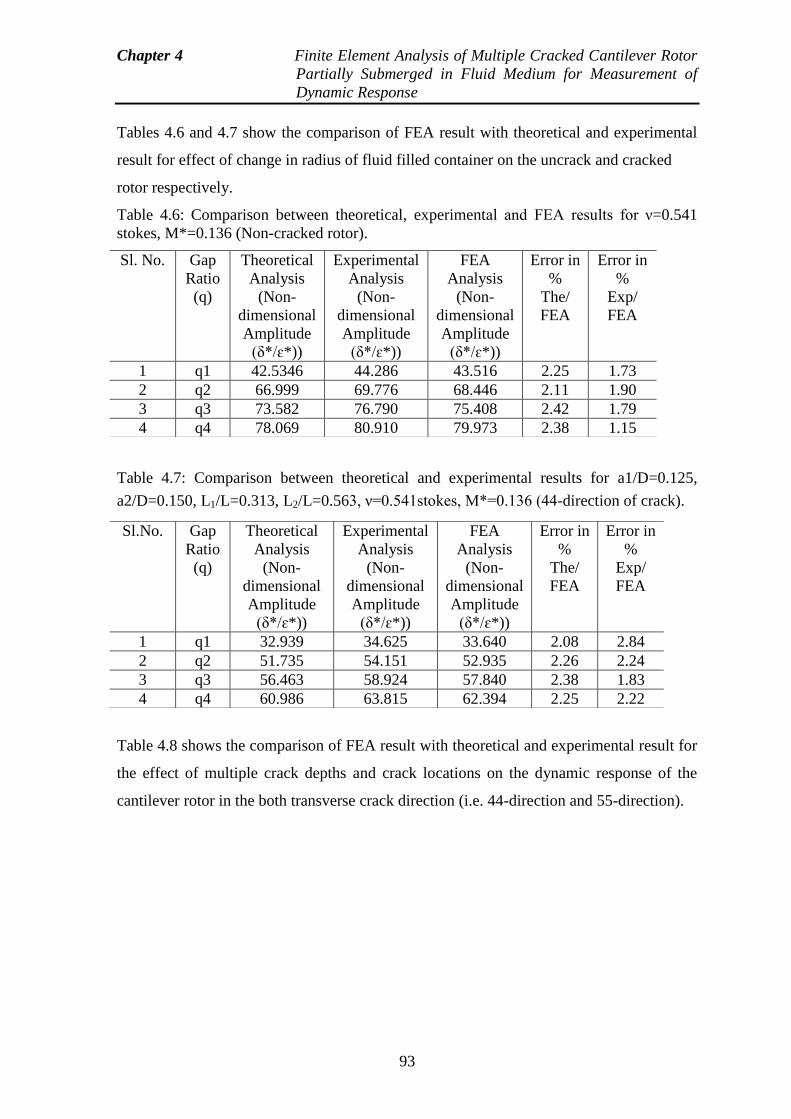
Chapter 4 Finite Element Analysis of Multiple Cracked Cantilever Rotor
Partially Submerged in Fluid Medium for Measurement of
Dynamic Response
93
Tables 4.6 and 4.7 show the comparison of FEA result with theoretical and experimental
result for effect of change in radius of fluid filled container on the uncrack and cracked
rotor respectively.
Table 4.6: Comparison between theoretical, experimental and FEA results for ν=0.541
stokes, M*=0.136 (Non-cracked rotor).
Table 4.7: Comparison between theoretical and experimental results for a1/D=0.125,
a2/D=0.150, L1/L=0.313, L2/L=0.563, ν=0.541stokes, M*=0.136 (44-direction of crack).
Table 4.8 shows the comparison of FEA result with theoretical and experimental result for
the effect of multiple crack depths and crack locations on the dynamic response of the
cantilever rotor in the both transverse crack direction (i.e. 44-direction and 55-direction).
Sl. No. Gap
Ratio
(q)
Theoretical
Analysis
(Non-
dimensional
Amplitude
(δ*/ɛ*))
Experimental
Analysis
(Non-
dimensional
Amplitude
(δ*/ɛ*))
FEA
Analysis
(Non-
dimensional
Amplitude
(δ*/ɛ*))
Error in
%
The/
FEA
Error in
%
Exp/
FEA
1 q1 42.5346 44.286 43.516 2.25 1.73
2 q2 66.999 69.776 68.446 2.11 1.90
3 q3 73.582 76.790 75.408 2.42 1.79
4 q4 78.069 80.910 79.973 2.38 1.15
Sl.No. Gap
Ratio
(q)
Theoretical
Analysis
(Non-
dimensional
Amplitude
(δ*/ɛ*))
Experimental
Analysis
(Non-
dimensional
Amplitude
(δ*/ɛ*))
FEA
Analysis
(Non-
dimensional
Amplitude
(δ*/ɛ*))
Error in
%
The/
FEA
Error in
%
Exp/
FEA
1 q1 32.939 34.625 33.640 2.08 2.84
2 q2 51.735 54.151 52.935 2.26 2.24
3 q3 56.463 58.924 57.840 2.38 1.83
4 q4 60.986 63.815 62.394 2.25 2.22
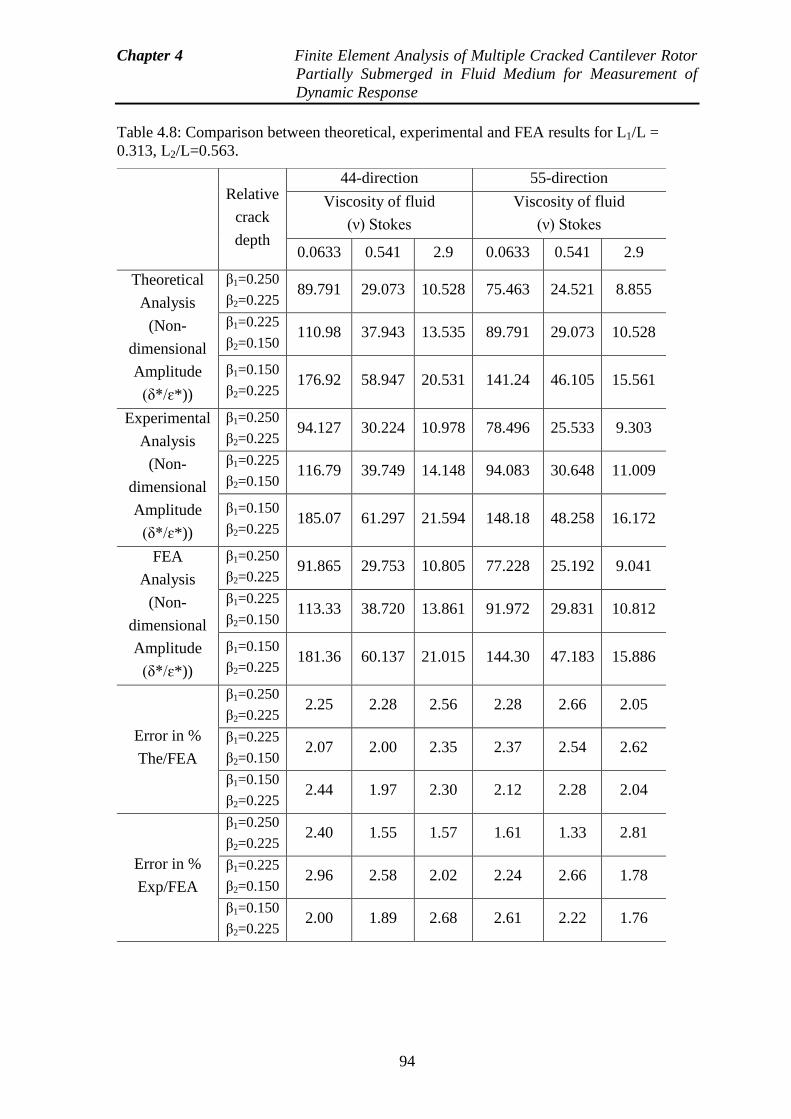
Chapter 4 Finite Element Analysis of Multiple Cracked Cantilever Rotor
Partially Submerged in Fluid Medium for Measurement of
Dynamic Response
94
Table 4.8: Comparison between theoretical, experimental and FEA results for L1/L =
0.313, L2/L=0.563.
Relative
crack
depth
44-direction 55-direction
Viscosity of fluid
(ν) Stokes
Viscosity of fluid
(ν) Stokes
0.0633 0.541 2.9 0.0633 0.541 2.9
Theoretical
Analysis
(Non-
dimensional
Amplitude
(δ*/ɛ*))
β1=0.250
β2=0.225 89.791 29.073 10.528 75.463 24.521 8.855
β1=0.225
β2=0.150 110.98 37.943 13.535 89.791 29.073 10.528
β1=0.150
β2=0.225 176.92 58.947 20.531 141.24 46.105 15.561
Experimental
Analysis
(Non-
dimensional
Amplitude
(δ*/ɛ*))
β1=0.250
β2=0.225 94.127 30.224 10.978 78.496 25.533 9.303
β1=0.225
β2=0.150 116.79 39.749 14.148 94.083 30.648 11.009
β1=0.150
β2=0.225 185.07 61.297 21.594 148.18 48.258 16.172
FEA
Analysis
(Non-
dimensional
Amplitude
(δ*/ɛ*))
β1=0.250
β2=0.225 91.865 29.753 10.805 77.228 25.192 9.041
β1=0.225
β2=0.150 113.33 38.720 13.861 91.972 29.831 10.812
β1=0.150
β2=0.225 181.36 60.137 21.015 144.30 47.183 15.886
Error in %
The/FEA
β1=0.250
β2=0.225 2.25 2.28 2.56 2.28 2.66 2.05
β1=0.225
β2=0.150 2.07 2.00 2.35 2.37 2.54 2.62
β1=0.150
β2=0.225 2.44 1.97 2.30 2.12 2.28 2.04
Error in %
Exp/FEA
β1=0.250
β2=0.225 2.40 1.55 1.57 1.61 1.33 2.81
β1=0.225
β2=0.150 2.96 2.58 2.02 2.24 2.66 1.78
β1=0.150
β2=0.225 2.00 1.89 2.68 2.61 2.22 1.76
Chapter 4 Finite Element Analysis of Multiple Cracked Cantilever Rotor
Partially Submerged in Fluid Medium for Measurement of
Dynamic Response
95
4.4 Discussion
The brief discussion on the results of proposed finite element method has been presented
in this section. It is noticed that presence of changed viscosity of fluid, mass of disc,
radius of container and multiple crack in the rotor alters the vibration response.Various
steps involved in the ANSYS to solve any problem are discussed. These steps are:
preprocessing phase, solution phase and post processing phase. The selection of the
element is very important to get the most refined results from the ANSYS. The SOLID187
element is chosen for mild steel rotor and FLUID30 has been selected for the fluid
medium.The geometrical configurations (i.e. geometry of element and nodal position) of
SOLID187 and FLUID30 are shown in the Figures 4.1 and 4.2 respectively. The
properties of mild steel rotor and fluid medium are presented in Tables 4.1 and 4.2
respectively.Finite element model of crack rotor is illustrated in Figure A1. FE model of
rotor with fluid medium is demonstrated in the Figure A2. FEA simulation result is
presented in the Figures A3 and A4. The results derived from finite element method are
authenticated by results obtained from theoretical and experimental test for non-cracked
and multi-cracked cantilever rotor partially submerged in altered viscous medium. The
results obtained from the finite element analysis are plotted with results derived from
theoretical and experimental analysis for cracked cantilever rotor partially submerged in
the viscous medium and are shown in Figures 4.3 to 4.13. Table 4.3 shows the comparison
of FEA result with theoretical and experimental result for effect of change in viscosity of
fluid on the non-cracked cantilever rotor. Tables 4.4 and 4.5 illustrate the comparison of
FEA result with theoretical and experimental result for virtual mass effect on the non-
cracked and cracked cantilever rotor in the viscous medium respectively. Tables 4.6 and
4.7 show the comparison of FEA result with theoretical and experimental result for effect
of change in radius of fluid filled container on the uncrack and cracked rotor respectively.
Table 4.8 shows the comparison of FEA result with theoretical and experimental result for
the effect of multiple crack depths and crack locations on the dynamic response of the
cantilever rotor in the both transverse crack direction (i.e. 44-direction and 55-direction).
It is observed that results are in good agreement.
Chapter 4 Finite Element Analysis of Multiple Cracked Cantilever Rotor
Partially Submerged in Fluid Medium for Measurement of
Dynamic Response
96
4.5 Summary
The summary is outlined from the results derived from numerical method. The simple,
effective and robust finite element method is presented to analyze the multiple cracks in
the cantilever rotor partially submerged in the viscous medium. It is observed that the
dynamic response obtained from finite element analysis show the error between non-
cracked and cracked rotor model. This can be observed in Figures 4.3 and 4.13.The
dynamic response such as natural frequencies and amplitude are derived from finite
element analysis and found to be of close proximity with results obtained from theoretical
and experimental observations. The percentage of error of finite element analysis is within
3% for rotor. The dynamic response derived from finite element analysis can be utilized to
design and develop the fault diagnosis and condition monitoring techniques based on
artificial intelligent techniques such as fuzzy logic and various types of neural
networks.The artificial intelligent techniques based structural health monitoring
algorithms have been discussed in the upcoming chapters.
97
Chapter 5
Analysis of Fuzzy System for Detecting
the Multiple Crack in Cantilever Rotor
The presence of a crack is a grave threat to the integrity of the system, which leads to
reducing the life and may cause the failure of the system. Hence, it is needed to develop
the online automated method to predict the damage effectively, present in the engineering
system. It is well-established fact that the presence of the crack in the system upset the
vibration parameters (e.g. Change the natural frequencies and amplitude). So these
changes can be successfully used to locate fault position and intensity. On the ground of
these modifications in vibration parameters, automated AI techniques can be used to
detect the crack locations and depths to circumvent the catastrophic failure of engineering
systems. In the current chapter, inverse techniques are employed to implement the
proposed methodology using the induced vibration response parameters of the rotor for
predicting the locations and depths of the multiple cracks present in the rotor.
5.1 Introduction
Fuzzy Logic System (FLS) was first developed by Mamdani and Assilan around 1975
[211], although L A Zadeh [212] has presented the concept of fuzzy set in 1965.
Essentially, Fuzzy Logic System (FLS) is a multi-value logic, which permits interval
qualities to be characterized by linguistic expressions like true/false, high/low, yes/no. In
the most recent couple of decades, specialists are utilized the FL approach for
applications, such as feature extraction, identification and classification of geometrical
properties and so on. FLS can mimic the human conduct by taking the distinctive thinking
modes keeping in mind the end goal to make the computer system act like humans. The
investigation of the imprecision and vulnerability motivates the exceptional human being
capacity to comprehend different engineering or industrial applications. FL can determine
mapping principles regarding words instead of numbers. Another essential idea in FLS is
fuzzy if–then rule which is for the most part utilized as a part of the advancement of the
fuzzy rule-based system. FLS can show nonlinear capacities of self-assertive many-sided
Chapter 5 Analysis of Fuzzy System for Detecting the Multiple Crack in
Cantilever Rotor
98
quality to a desired level of precision. FLS is an advantageous approach to guide a data
space to output space and is one of the apparatuses used to model multi-inputs, multi-
outputs systems. Henceforth the fuzzy methodology can be adequately utilized as a crack
diagnostics tool for multiple cracked systems. In the present chapter, multiple crack
detection techniques using fuzzy logic system have been developed. The fuzzy inference
system for identification of multiple crack tool has been designed and developed with five
inputs (two relative natural frequency, two relative amplitude and viscosity of fluid) and
four outputs (two relative crack locations and two relative crack depths). The proposed
multiple crack identification tool has been developed using the triangular, trapezoidal and
gaussian membership functions. The Mamdani fuzzy, Takagi-Sugeno fuzzy and fuzzy
based hybrid system is developed for identification of crack in rotor. The dynamic
characteristics acquired from the theoretical, FE and experimental analysis have been used
for development of the fuzzy controller model. The results of the proposed fuzzy systems
for identification of crack have been compared with the results found from the theoretical,
experimental and FE analysis. It is found that the fuzzy logic models can be used
excellently for crack detection in the rotor. The present chapter is organized in the seven
altered sections. Section 5.1 introduces the introductory part of the fuzzy logic system. A
fuzzy logic system has been discussed in Section 5.2. The investigation of the Mamdani
fuzzy system used for identification of multiple crack in rotor has been described in
section 5.3. The analysis of Takagi-Sugeno fuzzy system for the identification in rotor has
been described in section 5.4. The analysis of gaussian fuzzy based hybrid system for the
identification of multiple crack in the rotor has been introduced in section 5.5. Section 5.6
discusses the obtained results from the Mamdani fuzzy, Takagi-Sugeno fuzzy and Hybrid
fuzzy model and finally, section 5.7 discuses a summary of the analysis of fuzzy system
used for identification of multiple transverse crack in the rotor.
5.2 Fuzzy Logic System
The fuzzy technique is a popular computing system based on the concept of fuzzy set
theory, fuzzy reasoning, and fuzzy if-then rules. The application of fuzzy logic is found
successfully in wide variety of fields such as bioinformatics, pattern recognition, business,
data classification, automatic control, decision analysis, robotics, expert systems and time
series prediction. A fuzzy logic controller primarily takes a judgement by nonlinear
mapping of the input information in a scalar output, applying fuzzy rules. The mapping
Chapter 5 Analysis of Fuzzy System for Detecting the Multiple Crack in
Cantilever Rotor
99
could be possible through fuzzy if–then rules, input/output membership functions, a total
of output sets, and de-fuzzification. An FLC can be taken as a congregation of
autonomous multi-data, single-output network. The FLC mainly comprises four parts: the
inference engine, rules base, fuzzifier and de-fuzzifier. The rule base of the FLC can be
created using the numeric information. When the fuzzy rules are developed, FLC becomes
a system that gives output data, after processing the input data using fuzzy rules and fuzzy
linguistic expressions. The fuzzifier receive data values and checks the level of
relationship with each of the fuzzy sets along with membership functions. The FLC
changes crisp inputs into crisp outputs. The fuzzy logic system consists of five stages to
complete the operation. These are as follows;
Step 1: Feed input data to FLC
The input data is fed to FLS. The fuzzy system distinguishes the degree of association of
input variables using fuzzy rule database and membership functions. That is called
fuzzification of input data.
Step 2: Functions of Fuzzy Operator
The fuzzy system measures the degree of association of each fuzzified input data that
fulfils for each rule of the fuzzy rule base. If the rule exists among more than one
membership functions, the fuzzy operator gets a single value of the rule.
Step 3: Apply the algorithm for generation of rules
The fuzzy membership function is reshaped through an algorithm, which is a parameter of
a fuzzy set. A function is associated for reshaping the output, related to the forerunner.
Step 4: Clustering the results
Each rule of the fuzzy database produces a result, that is integrated to get a decision from
fuzzy logic system. The clustering of each rule base results leads to an aggregated fuzzy
set as output.
Step 5: Aggregate all output
The aggregate output fuzzy set consider as an input for the defuzzification method and the
output is single value. The aggregate of a fuzzy set incorporate a sort of output values and
defuzzified in order to determine a single output value from the set.
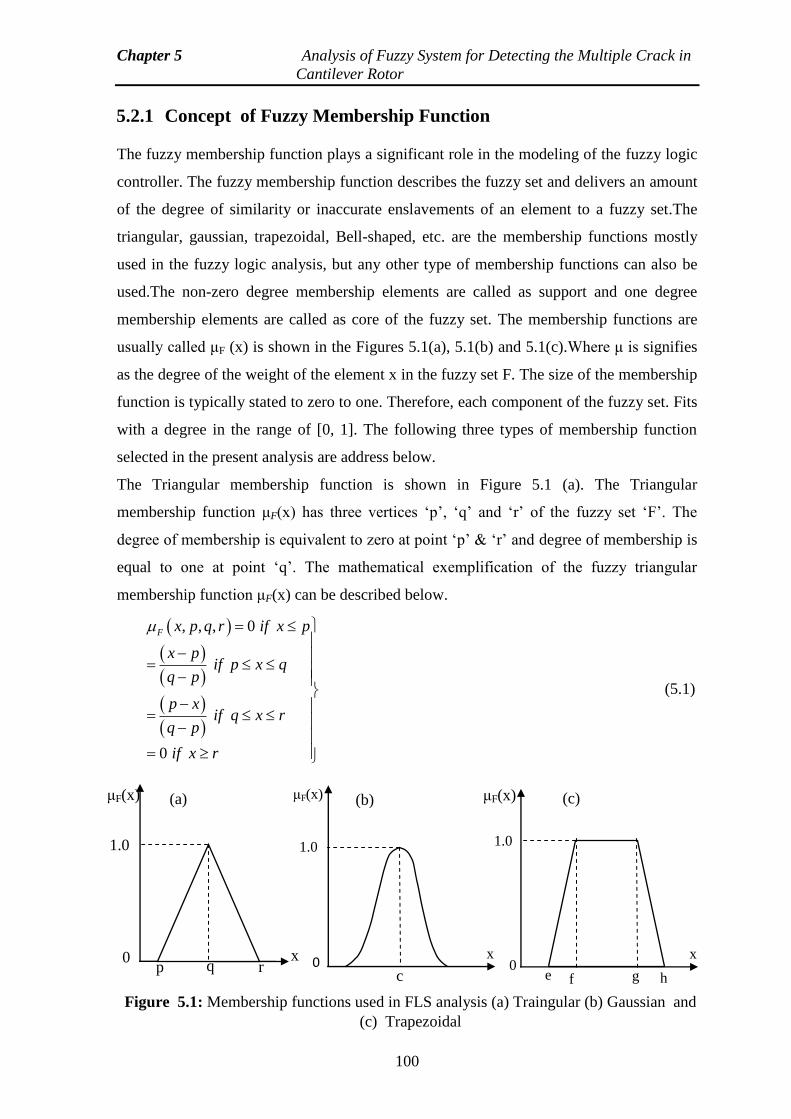
Chapter 5 Analysis of Fuzzy System for Detecting the Multiple Crack in
Cantilever Rotor
100
5.2.1 Concept of Fuzzy Membership Function
The fuzzy membership function plays a significant role in the modeling of the fuzzy logic
controller. The fuzzy membership function describes the fuzzy set and delivers an amount
of the degree of similarity or inaccurate enslavements of an element to a fuzzy set.The
triangular, gaussian, trapezoidal, Bell-shaped, etc. are the membership functions mostly
used in the fuzzy logic analysis, but any other type of membership functions can also be
used.The non-zero degree membership elements are called as support and one degree
membership elements are called as core of the fuzzy set. The membership functions are
usually called μF (x) is shown in the Figures 5.1(a), 5.1(b) and 5.1(c).Where μ is signifies
as the degree of the weight of the element x in the fuzzy set F. The size of the membership
function is typically stated to zero to one. Therefore, each component of the fuzzy set. Fits
with a degree in the range of [0, 1]. The following three types of membership function
selected in the present analysis are address below.
The Triangular membership function is shown in Figure 5.1 (a). The Triangular
membership function μF(x) has three vertices ‘p’, ‘q’ and ‘r’ of the fuzzy set ‘F’. The
degree of membership is equivalent to zero at point ‘p’ & ‘r’ and degree of membership is
equal to one at point ‘q’. The mathematical exemplification of the fuzzy triangular
membership function μF(x) can be described below.
, , , 0
0
F x p q r if x p
x pif p x q
q p
p xif q x r
q p
if x r
(5.1)
0 x
c 0
Figure 5.1: Membership functions used in FLS analysis (a) Traingular (b) Gaussian and
(c) Trapezoidal
(a)
:
1.0
0 p q r
x
μF(x)
1.0
μF(x)
(b)
:
x
h e f g
μF(x)
1.0
(c)
:
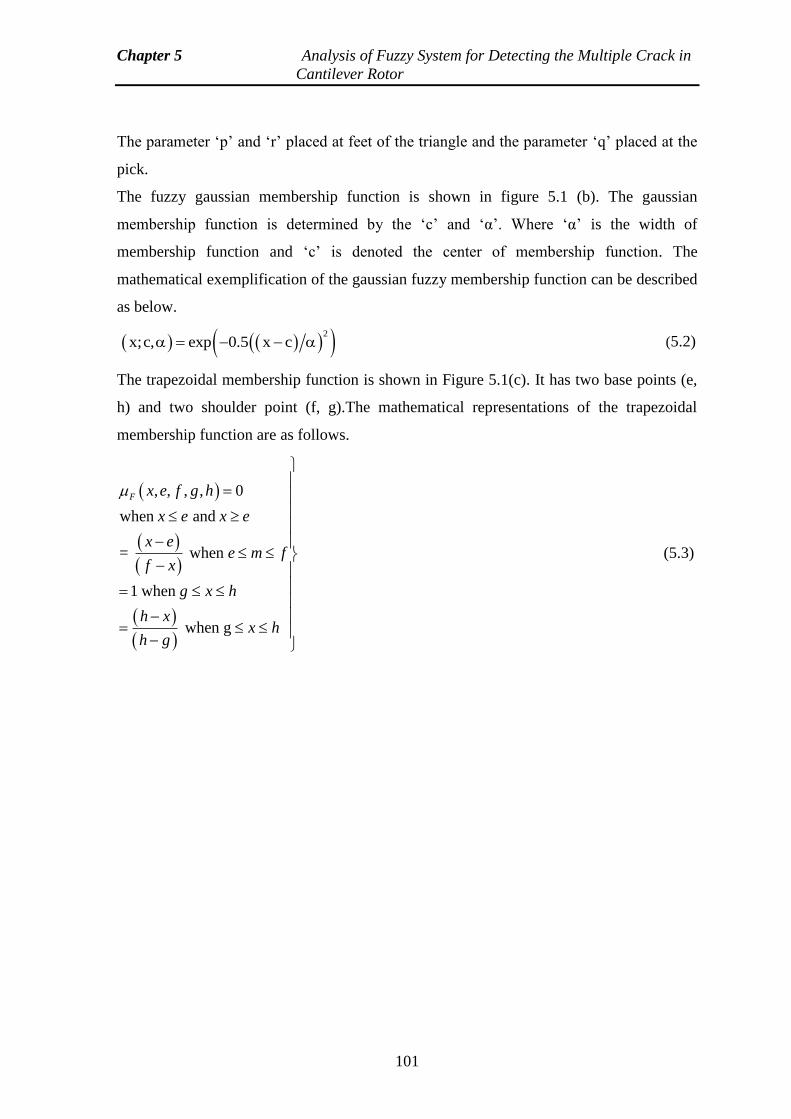
Chapter 5 Analysis of Fuzzy System for Detecting the Multiple Crack in
Cantilever Rotor
101
The parameter ‘p’ and ‘r’ placed at feet of the triangle and the parameter ‘q’ placed at the
pick.
The fuzzy gaussian membership function is shown in figure 5.1 (b). The gaussian
membership function is determined by the ‘c’ and ‘α’. Where ‘α’ is the width of
membership function and ‘c’ is denoted the center of membership function. The
mathematical exemplification of the gaussian fuzzy membership function can be described
as below.
2
x;c, exp 0.5 x c (5.2)
The trapezoidal membership function is shown in Figure 5.1(c). It has two base points (e,
h) and two shoulder point (f, g).The mathematical representations of the trapezoidal
membership function are as follows.
, , , , 0
when and
= when
1 when
when g
F x e f g h
x e x e
x ee m f
f x
g x h
h xx h
h g
(5.3)
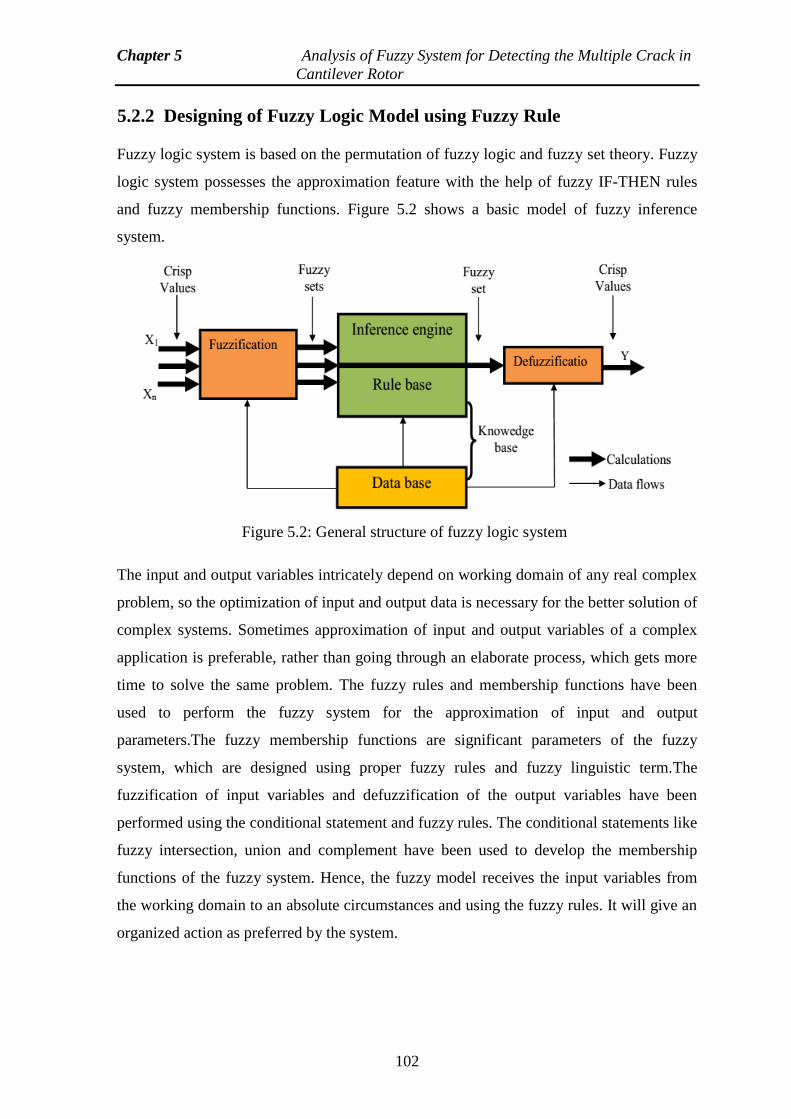
Chapter 5 Analysis of Fuzzy System for Detecting the Multiple Crack in
Cantilever Rotor
102
5.2.2 Designing of Fuzzy Logic Model using Fuzzy Rule
Fuzzy logic system is based on the permutation of fuzzy logic and fuzzy set theory. Fuzzy
logic system possesses the approximation feature with the help of fuzzy IF-THEN rules
and fuzzy membership functions. Figure 5.2 shows a basic model of fuzzy inference
system.
The input and output variables intricately depend on working domain of any real complex
problem, so the optimization of input and output data is necessary for the better solution of
complex systems. Sometimes approximation of input and output variables of a complex
application is preferable, rather than going through an elaborate process, which gets more
time to solve the same problem. The fuzzy rules and membership functions have been
used to perform the fuzzy system for the approximation of input and output
parameters.The fuzzy membership functions are significant parameters of the fuzzy
system, which are designed using proper fuzzy rules and fuzzy linguistic term.The
fuzzification of input variables and defuzzification of the output variables have been
performed using the conditional statement and fuzzy rules. The conditional statements like
fuzzy intersection, union and complement have been used to develop the membership
functions of the fuzzy system. Hence, the fuzzy model receives the input variables from
the working domain to an absolute circumstances and using the fuzzy rules. It will give an
organized action as preferred by the system.
Figure 5.2: General structure of fuzzy logic system
Chapter 5 Analysis of Fuzzy System for Detecting the Multiple Crack in
Cantilever Rotor
103
5.2.3 Modeling of Defuzzification Mechanism
The conversion of fuzzy outputs into crisp output in the fuzzy system is called
defuzzification. Defuzzification approach is selected based on the features of the
application. The last step in modeling of fuzzy system is the transformation of fuzzy
output set to a crisp output. The crisp output illustrates the possible distribution of the
conditional fuzzy control action. The correlation between the fuzzy output set (K), non-
fuzzy output (X0) and defuzzifier in the following equation;
X0 = Defuzzifier (K).
For the development of the fuzzy system, several defuzzification methods are used. The
mostly used defuzzication methods are listed below;
(1) Centroid of the area method (2) Mean of maximum method
(3) Maximum membership principle (4) Weighted average method
5.3 Analysis of Mamdani Fuzzy Logic Mechanism for
Identification of Multiple Crack in Rotor
In the present segment introduces the analysis of triangular, gaussian and trapezoidal
membership functions for the development of Mamdani fuzzy models. The five input data
are fed into fuzzy model and four variables are received as output. The linguistic variables
used for the inputs are as follows;
(1) rnfx = Relative natural frequency in x-axis direction
(2) rnfy = Relative natural frequency in y-axis direction
(3) rax = Relative amplitude in x-axis direction
(4) ray = Relative amplitude in y-axis direction
(5) ν = Viscosity of fluid
The linguistic variables used for the outputs are as follows;
(1) rfcl = Relative first crack location (2) rfcd =Relative first crack location
(3) rscl =Relative second crack depth (4) rscd =Relative second crack depth
Figures 5.3(a), 5.3(b) and 5.3(c) illustrate the triangular membership, gaussian
membership and trapezoidal membership fuzzy models respectively. The various fuzzy
linguistic variables with detail description of the membership function name and range of
linguistic term have been illustrated in the Table 5.1. Fuzzy controller has been trained
with the help of many defined fuzzy rules. Twenty fuzzy rules are taken from the several
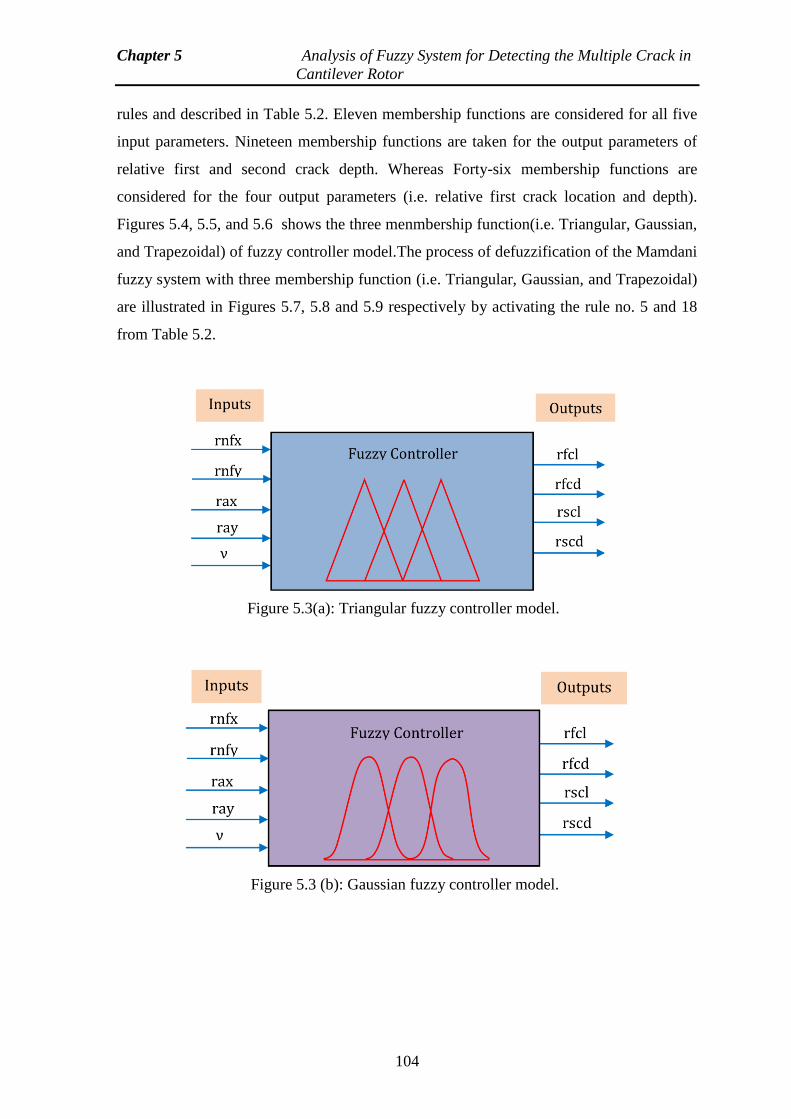
Chapter 5 Analysis of Fuzzy System for Detecting the Multiple Crack in
Cantilever Rotor
104
rules and described in Table 5.2. Eleven membership functions are considered for all five
input parameters. Nineteen membership functions are taken for the output parameters of
relative first and second crack depth. Whereas Forty-six membership functions are
considered for the four output parameters (i.e. relative first crack location and depth).
Figures 5.4, 5.5, and 5.6 shows the three menmbership function(i.e. Triangular, Gaussian,
and Trapezoidal) of fuzzy controller model.The process of defuzzification of the Mamdani
fuzzy system with three membership function (i.e. Triangular, Gaussian, and Trapezoidal)
are illustrated in Figures 5.7, 5.8 and 5.9 respectively by activating the rule no. 5 and 18
from Table 5.2.
Figure 5.3(a): Triangular fuzzy controller model.
Figure 5.3 (b): Gaussian fuzzy controller model.
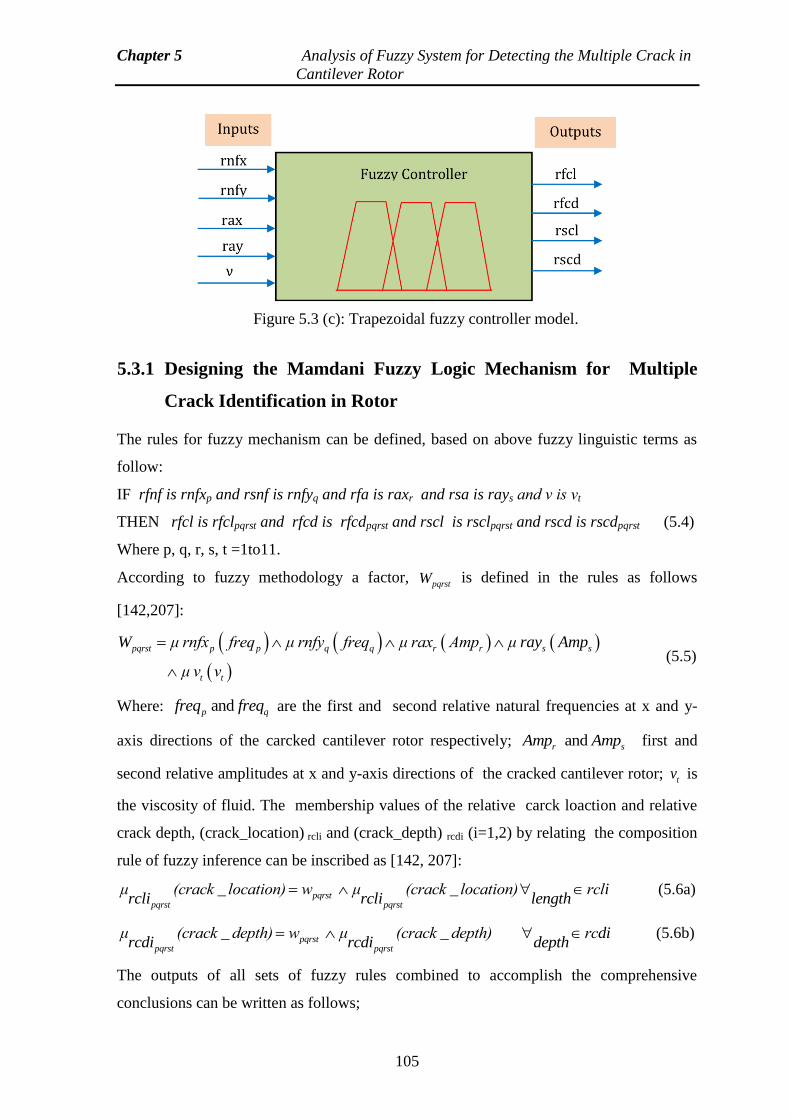
Chapter 5 Analysis of Fuzzy System for Detecting the Multiple Crack in
Cantilever Rotor
105
5.3.1 Designing the Mamdani Fuzzy Logic Mechanism for Multiple
Crack Identification in Rotor
The rules for fuzzy mechanism can be defined, based on above fuzzy linguistic terms as
follow:
IF rfnf is rnfxp and rsnf is rnfyq and rfa is raxr and rsa is rays and ν is vt
THEN rfcl is rfclpqrst and rfcd is rfcdpqrst and rscl is rsclpqrst and rscd is rscdpqrst (5.4)
Where p, q, r, s, t =1to11.
According to fuzzy methodology a factor, pqrstW is defined in the rules as follows
[142,207]:
pqrst p p q q r r s s
t t
W μ rnfx freq μ rnfy freq μ rax Amp μ ray Amp
μ v v
(5.5)
Where: and p qfreq freq are the first and second relative natural frequencies at x and y-
axis directions of the carcked cantilever rotor respectively; and r sAmp Amp first and
second relative amplitudes at x and y-axis directions of the cracked cantilever rotor; tv is
the viscosity of fluid. The membership values of the relative carck loaction and relative
crack depth, (crack_location) rcli and (crack_depth) rcdi (i=1,2) by relating the composition
rule of fuzzy inference can be inscribed as [142, 207]:
_ _pqrst pqrst pqrst
μ (crack location) w μ (crack location) rclircli rcli length
(5.6a)
_ _pqrst pqrst pqrst
μ (crack depth) w μ (crack depth) rcdircdi rcdi depth
(5.6b)
The outputs of all sets of fuzzy rules combined to accomplish the comprehensive
conclusions can be written as follows;
Figure 5.3 (c): Trapezoidal fuzzy controller model.
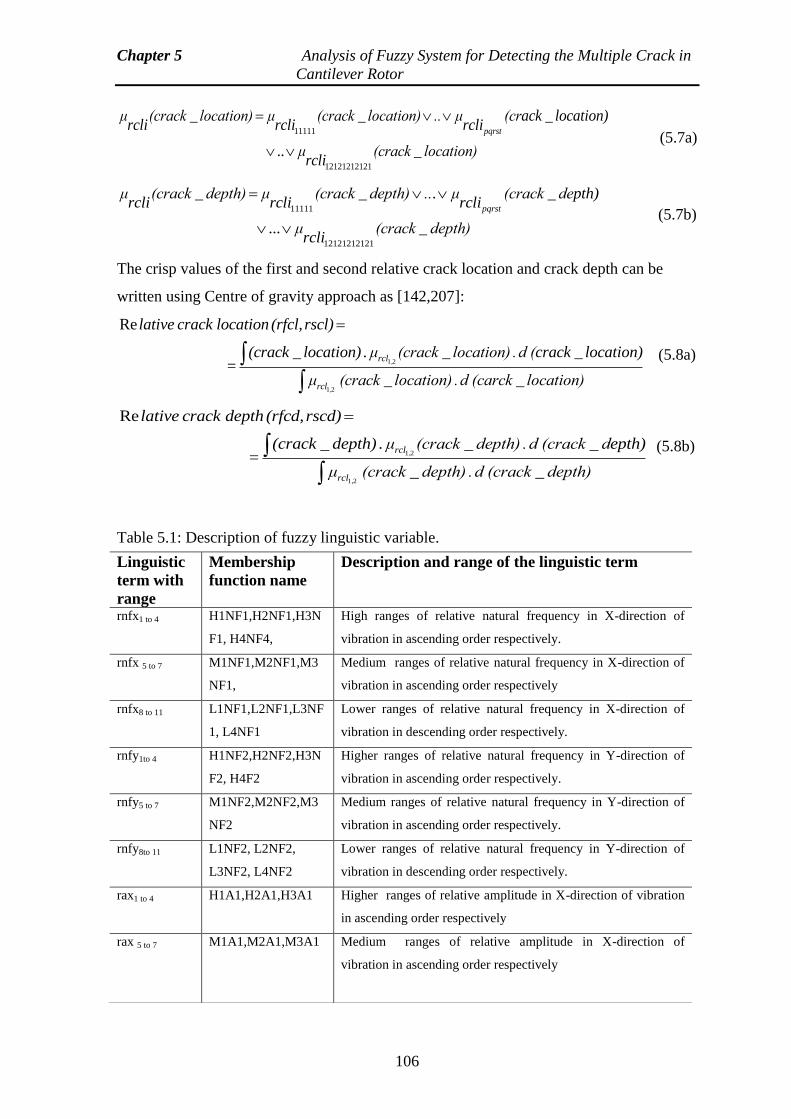
Chapter 5 Analysis of Fuzzy System for Detecting the Multiple Crack in
Cantilever Rotor
106
11111
12121212121
_ _ _
_
pqrst
μ (crack location) μ (crack location) .. μ (crack location) rcli rcli rcli
.. μ (crack location)rcli
(5.7a)
11111
12121212121
_ _ . _
_
pqrst
μ (crack depth) μ (crack depth) .. μ (crack depth) rcli rcli rcli
... μ (crack depth)rcli
(5.7b)
The crisp values of the first and second relative crack location and crack depth can be
written using Centre of gravity approach as [142,207]:
1 2
1 2
Re
_ _ _ =
_ _
,
,
rcl
rcl
lative crack location (rfcl, rscl)
(crack location) . μ (crack location) . d (crack location)
μ (crack location) . d (carck location)
(5.8a)
1 2
1 2
Re
_ _ _ =
_ _
,
,
rcl
rcl
lative crack depth (rfcd, rscd)
(crack depth) . μ (crack depth) . d (crack depth)
μ (crack depth) . d (crack depth)
(5.8b)
Table 5.1: Description of fuzzy linguistic variable.
Linguistic
term with
range
Membership
function name
Description and range of the linguistic term
rnfx1 to 4 H1NF1,H2NF1,H3N
F1, H4NF4,
High ranges of relative natural frequency in X-direction of
vibration in ascending order respectively.
rnfx 5 to 7 M1NF1,M2NF1,M3
NF1,
Medium ranges of relative natural frequency in X-direction of
vibration in ascending order respectively
rnfx8 to 11 L1NF1,L2NF1,L3NF
1, L4NF1
Lower ranges of relative natural frequency in X-direction of
vibration in descending order respectively.
rnfy1to 4 H1NF2,H2NF2,H3N
F2, H4F2
Higher ranges of relative natural frequency in Y-direction of
vibration in ascending order respectively.
rnfy5 to 7 M1NF2,M2NF2,M3
NF2
Medium ranges of relative natural frequency in Y-direction of
vibration in ascending order respectively.
rnfy8to 11 L1NF2, L2NF2,
L3NF2, L4NF2
Lower ranges of relative natural frequency in Y-direction of
vibration in descending order respectively.
rax1 to 4 H1A1,H2A1,H3A1 Higher ranges of relative amplitude in X-direction of vibration
in ascending order respectively
rax 5 to 7 M1A1,M2A1,M3A1 Medium ranges of relative amplitude in X-direction of
vibration in ascending order respectively
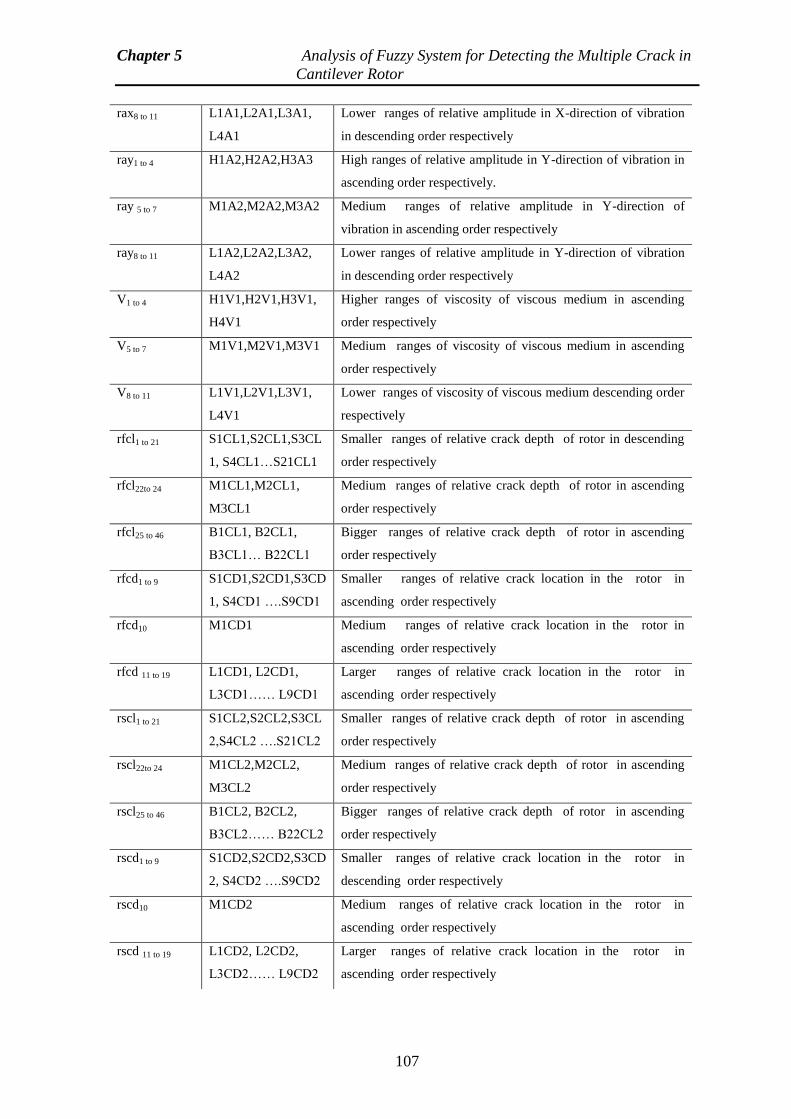
Chapter 5 Analysis of Fuzzy System for Detecting the Multiple Crack in
Cantilever Rotor
107
rax8 to 11 L1A1,L2A1,L3A1,
L4A1
Lower ranges of relative amplitude in X-direction of vibration
in descending order respectively
ray1 to 4 H1A2,H2A2,H3A3 High ranges of relative amplitude in Y-direction of vibration in
ascending order respectively.
ray 5 to 7 M1A2,M2A2,M3A2 Medium ranges of relative amplitude in Y-direction of
vibration in ascending order respectively
ray8 to 11 L1A2,L2A2,L3A2,
L4A2
Lower ranges of relative amplitude in Y-direction of vibration
in descending order respectively
V1 to 4 H1V1,H2V1,H3V1,
H4V1
Higher ranges of viscosity of viscous medium in ascending
order respectively
V5 to 7 M1V1,M2V1,M3V1 Medium ranges of viscosity of viscous medium in ascending
order respectively
V8 to 11 L1V1,L2V1,L3V1,
L4V1
Lower ranges of viscosity of viscous medium descending order
respectively
rfcl1 to 21 S1CL1,S2CL1,S3CL
1, S4CL1…S21CL1
Smaller ranges of relative crack depth of rotor in descending
order respectively
rfcl22to 24 M1CL1,M2CL1,
M3CL1
Medium ranges of relative crack depth of rotor in ascending
order respectively
rfcl25 to 46 B1CL1, B2CL1,
B3CL1… B22CL1
Bigger ranges of relative crack depth of rotor in ascending
order respectively
rfcd1 to 9 S1CD1,S2CD1,S3CD
1, S4CD1 ….S9CD1
Smaller ranges of relative crack location in the rotor in
ascending order respectively
rfcd10 M1CD1 Medium ranges of relative crack location in the rotor in
ascending order respectively
rfcd 11 to 19 L1CD1, L2CD1,
L3CD1…… L9CD1
Larger ranges of relative crack location in the rotor in
ascending order respectively
rscl1 to 21 S1CL2,S2CL2,S3CL
2,S4CL2 ….S21CL2
Smaller ranges of relative crack depth of rotor in ascending
order respectively
rscl22to 24 M1CL2,M2CL2,
M3CL2
Medium ranges of relative crack depth of rotor in ascending
order respectively
rscl25 to 46 B1CL2, B2CL2,
B3CL2…… B22CL2
Bigger ranges of relative crack depth of rotor in ascending
order respectively
rscd1 to 9 S1CD2,S2CD2,S3CD
2, S4CD2 ….S9CD2
Smaller ranges of relative crack location in the rotor in
descending order respectively
rscd10 M1CD2 Medium ranges of relative crack location in the rotor in
ascending order respectively
rscd 11 to 19 L1CD2, L2CD2,
L3CD2…… L9CD2
Larger ranges of relative crack location in the rotor in
ascending order respectively
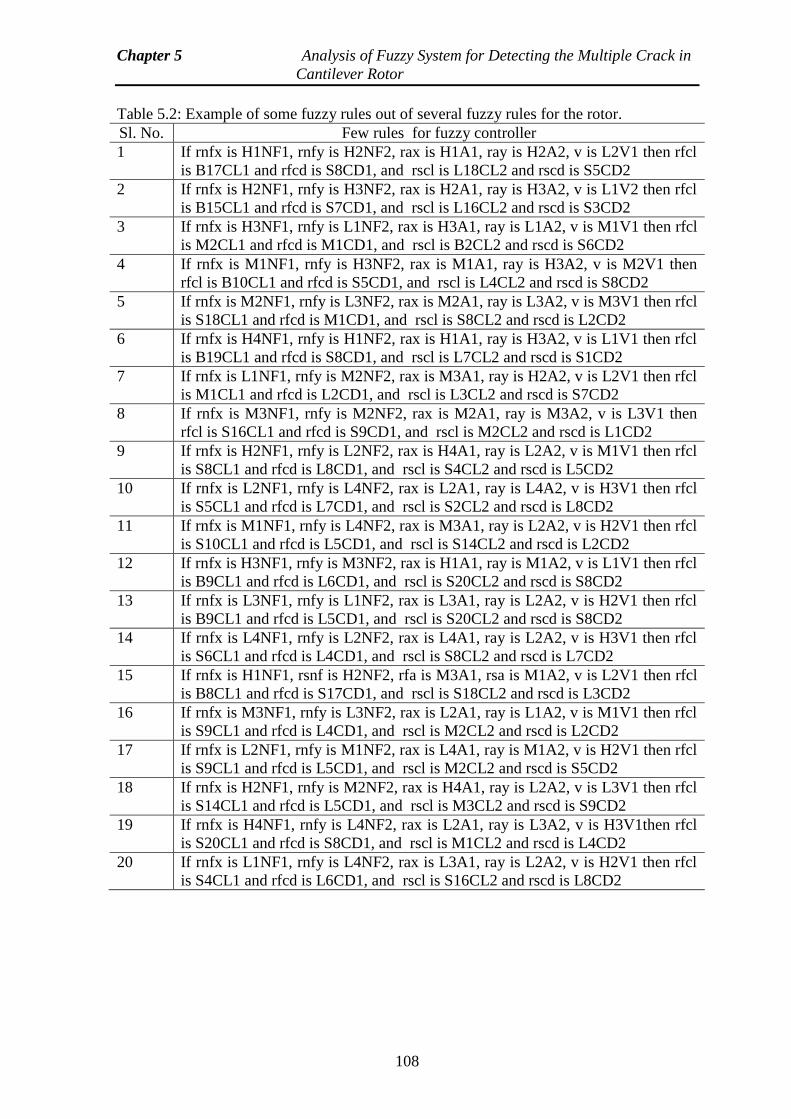
Chapter 5 Analysis of Fuzzy System for Detecting the Multiple Crack in
Cantilever Rotor
108
Table 5.2: Example of some fuzzy rules out of several fuzzy rules for the rotor.
Sl. No. Few rules for fuzzy controller
1 If rnfx is H1NF1, rnfy is H2NF2, rax is H1A1, ray is H2A2, v is L2V1 then rfcl
is B17CL1 and rfcd is S8CD1, and rscl is L18CL2 and rscd is S5CD2
2 If rnfx is H2NF1, rnfy is H3NF2, rax is H2A1, ray is H3A2, v is L1V2 then rfcl
is B15CL1 and rfcd is S7CD1, and rscl is L16CL2 and rscd is S3CD2
3 If rnfx is H3NF1, rnfy is L1NF2, rax is H3A1, ray is L1A2, v is M1V1 then rfcl
is M2CL1 and rfcd is M1CD1, and rscl is B2CL2 and rscd is S6CD2
4 If rnfx is M1NF1, rnfy is H3NF2, rax is M1A1, ray is H3A2, v is M2V1 then
rfcl is B10CL1 and rfcd is S5CD1, and rscl is L4CL2 and rscd is S8CD2
5 If rnfx is M2NF1, rnfy is L3NF2, rax is M2A1, ray is L3A2, v is M3V1 then rfcl
is S18CL1 and rfcd is M1CD1, and rscl is S8CL2 and rscd is L2CD2
6 If rnfx is H4NF1, rnfy is H1NF2, rax is H1A1, ray is H3A2, v is L1V1 then rfcl
is B19CL1 and rfcd is S8CD1, and rscl is L7CL2 and rscd is S1CD2
7 If rnfx is L1NF1, rnfy is M2NF2, rax is M3A1, ray is H2A2, v is L2V1 then rfcl
is M1CL1 and rfcd is L2CD1, and rscl is L3CL2 and rscd is S7CD2
8 If rnfx is M3NF1, rnfy is M2NF2, rax is M2A1, ray is M3A2, v is L3V1 then
rfcl is S16CL1 and rfcd is S9CD1, and rscl is M2CL2 and rscd is L1CD2
9 If rnfx is H2NF1, rnfy is L2NF2, rax is H4A1, ray is L2A2, v is M1V1 then rfcl
is S8CL1 and rfcd is L8CD1, and rscl is S4CL2 and rscd is L5CD2
10 If rnfx is L2NF1, rnfy is L4NF2, rax is L2A1, ray is L4A2, v is H3V1 then rfcl
is S5CL1 and rfcd is L7CD1, and rscl is S2CL2 and rscd is L8CD2
11 If rnfx is M1NF1, rnfy is L4NF2, rax is M3A1, ray is L2A2, v is H2V1 then rfcl
is S10CL1 and rfcd is L5CD1, and rscl is S14CL2 and rscd is L2CD2
12 If rnfx is H3NF1, rnfy is M3NF2, rax is H1A1, ray is M1A2, v is L1V1 then rfcl
is B9CL1 and rfcd is L6CD1, and rscl is S20CL2 and rscd is S8CD2
13 If rnfx is L3NF1, rnfy is L1NF2, rax is L3A1, ray is L2A2, v is H2V1 then rfcl
is B9CL1 and rfcd is L5CD1, and rscl is S20CL2 and rscd is S8CD2
14 If rnfx is L4NF1, rnfy is L2NF2, rax is L4A1, ray is L2A2, v is H3V1 then rfcl
is S6CL1 and rfcd is L4CD1, and rscl is S8CL2 and rscd is L7CD2
15 If rnfx is H1NF1, rsnf is H2NF2, rfa is M3A1, rsa is M1A2, v is L2V1 then rfcl
is B8CL1 and rfcd is S17CD1, and rscl is S18CL2 and rscd is L3CD2
16 If rnfx is M3NF1, rnfy is L3NF2, rax is L2A1, ray is L1A2, v is M1V1 then rfcl
is S9CL1 and rfcd is L4CD1, and rscl is M2CL2 and rscd is L2CD2
17 If rnfx is L2NF1, rnfy is M1NF2, rax is L4A1, ray is M1A2, v is H2V1 then rfcl
is S9CL1 and rfcd is L5CD1, and rscl is M2CL2 and rscd is S5CD2
18 If rnfx is H2NF1, rnfy is M2NF2, rax is H4A1, ray is L2A2, v is L3V1 then rfcl
is S14CL1 and rfcd is L5CD1, and rscl is M3CL2 and rscd is S9CD2
19 If rnfx is H4NF1, rnfy is L4NF2, rax is L2A1, ray is L3A2, v is H3V1then rfcl
is S20CL1 and rfcd is S8CD1, and rscl is M1CL2 and rscd is L4CD2
20 If rnfx is L1NF1, rnfy is L4NF2, rax is L3A1, ray is L2A2, v is H2V1 then rfcl
is S4CL1 and rfcd is L6CD1, and rscl is S16CL2 and rscd is L8CD2
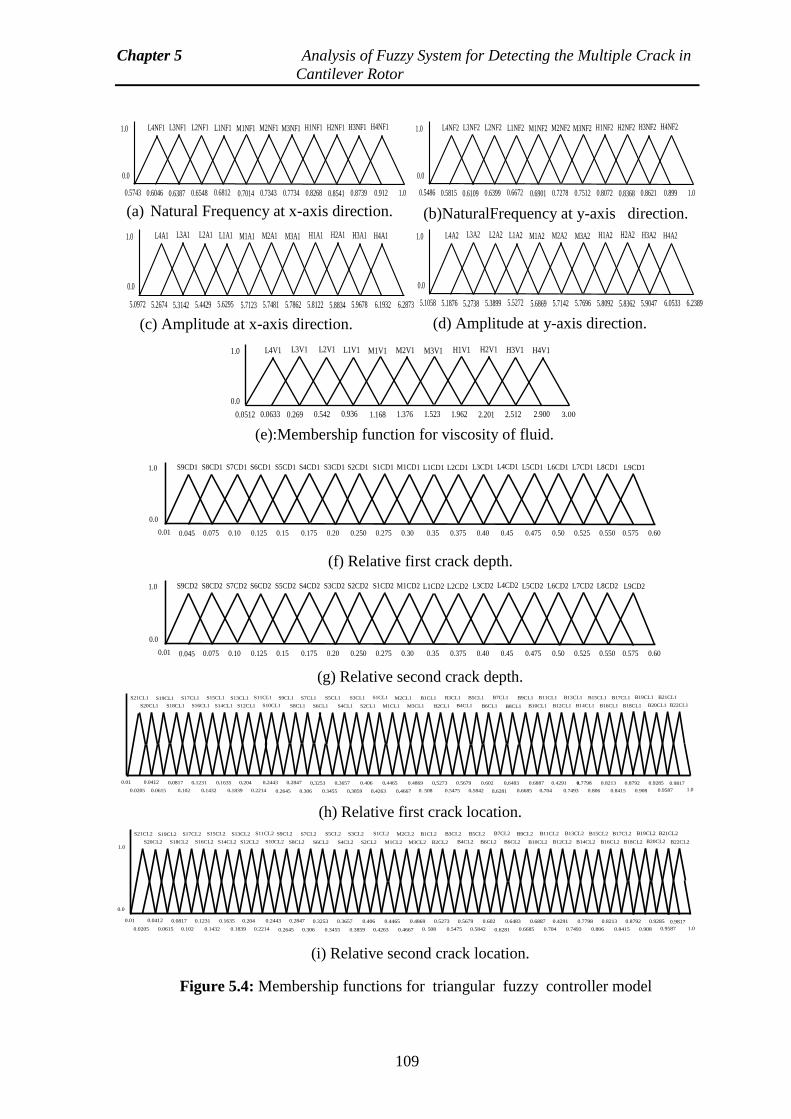
Chapter 5 Analysis of Fuzzy System for Detecting the Multiple Crack in
Cantilever Rotor
109
(b)NaturalFrequency at y-axis direction. (a) Natural Frequency at x-axis direction.
(c) Amplitude at x-axis direction. (d) Amplitude at y-axis direction.
(e):Membership function for viscosity of fluid.
(f) Relative first crack depth.
(g) Relative second crack depth.
(h) Relative first crack location.
(i) Relative second crack location.
Figure 5.4: Membership functions for triangular fuzzy controller model
6.2389
H2A2
6.0533 5.9047 5.8362 5.8092 5.7696 5.7142 5.6869 5.5272 5.3899 5.2738 5.1876
0.0
L4A2 L3A2 L2A2 L1A2 M1A2 M2A2 M3A2 H1A2 H3A2 H4A2
5.1058
1.0
0.908
1.0
0.0
0.2645 0.306
0.3253
0.3455
0.3657
0.3859
0.406
0.4263
0.4465
0.4667
0.4869
0. 508
0.5273
0.5475
0.5679
0.5842
0.602
0.6281
0.6483
0.6685
0.6887
0.704
0.4291
0.7493
0.7798
0.806
0.8213
0.8415
0.8792 0.9285
0.9587
0.9817 0.2847 0.2443
0.2214
0.204
0.1839
0.1635
0.1432
0.1231
0.102
0.0817
0.0615
0.0412
0.0205
0.01
S9CL2 S7CL2 S5CL2 S3CL2 S1CL2 M2CL2 B1CL2 B3CL2 B5CL2 B7CL2 B9CL2 B11CL2 B13CL2 B15CL2 B17CL2 B19CL2 B21CL2
B22CL2 B20CL2 B18CL2 B16CL2 B14CL2 B12CL2 B10CL2 B6CL2 B6CL2 B4CL2 B2CL2 M3CL2 M1CL2 S2CL2 S4CL2 S6CL2 S8CL2 S12CL2 S10CL2
S11CL2 S13CL2
S14CL2
S15CL2
S16CL2
S17CL2
S18CL2
S19CL2
S20CL2
S21CL2
1.0
S7CD1 L9CD1 L8CD1 L7CD1 L6CD1 L5CD1 L4CD1 L3CD1 L2CD1 L1CD1 M1CD1 S1CD1 S2CD1 S3CD1 S4CD1 S5CD1 S6CD1 S8CD1 S9CD1 1.0
0.0
0.60 0.575 0.550 0.525
0 0.50 0.475 0.45 0.40 0.375 0.35 0.30 0.275 0.250 0.20 0.175 0.15 0.125 0.10 0.075 0.045 0.01
S7CD2 L9CD2 L8CD2 L7CD2 L6CD2 L5CD2 L4CD2 L3CD2 L2CD2 L1CD2 M1CD2 S1CD2 S2CD2 S3CD2 S4CD2 S5CD2 S6CD2 S8CD2 S9CD2 1.0
0.0
0.60 0.575 0.550 0.525
0 0.50 0.475 0.45 0.40 0.375 0.35 0.30 0.275 0.250 0.20 0.175 0.15 0.125 0.10 0.075 0.045 0.01
H2V1
2.900 2.512 2.201 1.962 1.523 1.376 1.168 0.936 0.542 0.269 0.0633
1.0 H4V1 H3V1 H1V1 M3V1 M2V1 M1V1 L1V1 L2V1 L3V1 L4V1
0.0
0.0512
1
3.00
B22CL1
0.908 0.2645 0.306
0.3253
0.3455
0.3657
0.3859
0.406
0.4263
0.4465
0.4667
0.4869
0. 508
0.5273
0.5475
0.5679
0.5842
0.602
0.6281
0.6483
0.6685
0.6887
0.704
0.4291
0.7493
0.7798
0.806
0.8213
0.8415
0.8792 0.9285
0.9587
0.9817 0.2847 0.2443
0.2214
0.204
0.1839
0.1635
0.1432
0.1231
0.102
0.0817
0.0615
0.0412
0.0205
0.01
S9CL1 S7CL1 S5CL1 S3CL1 S1CL1 M2CL1 B1CL1 B3CL1 B5CL1 B7CL1 B9CL1 B11CL1 B13CL1 B15CL1 B17CL1 B19CL1 B21CL1
B20CL1 B18CL1 B16CL1 B14CL1 B12CL1 B10CL1 B4CL1 B2CL1 M3CL1 M1CL1 S2CL1 S4CL1 S6CL1 S8CL1 S12CL1 S10CL1
S11CL1 S13CL1
S14CL1
S15CL1
S16CL1
S17CL1
S18CL1
S19CL1
S20CL1
S21CL1
B6CL1 B8CL1
1.0
H2A1
6.2873 6.1932 5.9678 5.8834 5.8122 5.7862 5.7481 5.7123 5.6295 5.4429 5.3142 5.2674
0.0
L4A1 L3A1 L2A1 L1A1 M1A1 M2A1 M3A1 H1A1 H3A1 H4A1
5.0972
1.0
H2NF1
1.0 0.912 0.8739 0.8541 0.8268 0.7734 0.7343 0.7014 0.6812 0.6548 0.6387 0.6046
0.0
L4NF1 L3NF1 L2NF1 L1NF1 M1NF1 M2NF1 M3NF1 H1NF1 H3NF1 H4NF1
0.5743
1.0 H2NF2
1.0 0.899 0.8621 0.8368 0.8072 0.7512 0.7278 0.6901 0.6672 0.6399 0.6109 0.5815
0.0
L4NF2 L3NF2 L2NF2 L1NF2 M1NF2 M2NF2 M3NF2 H1NF2 H3NF2 H4NF2
0.5486
1.0
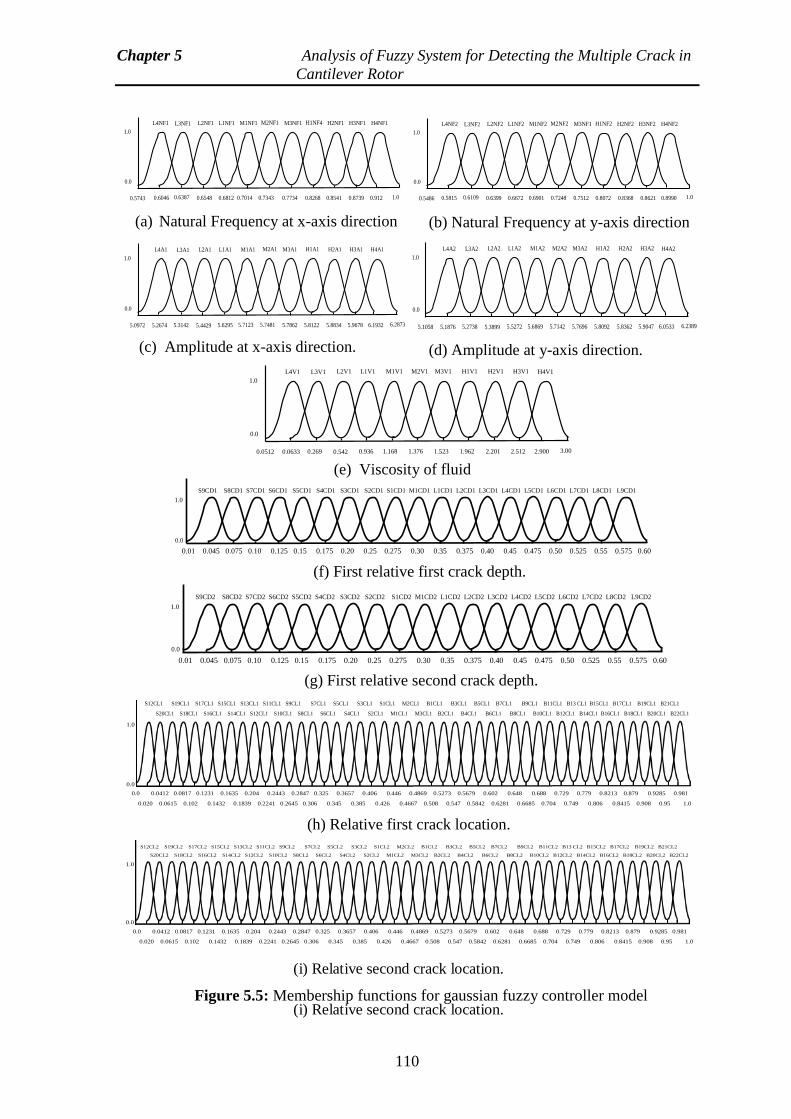
Chapter 5 Analysis of Fuzzy System for Detecting the Multiple Crack in
Cantilever Rotor
110
(b) Natural Frequency at y-axis direction (a) Natural Frequency at x-axis direction
(c) Amplitude at x-axis direction. (d) Amplitude at y-axis direction.
(e) Viscosity of fluid
(i) Relative second crack location.
(i) Relative second crack location.
Figure 5.5: Membership functions for gaussian fuzzy controller model
(f) First relative first crack depth.
(g) First relative second crack depth.
1.0
1.0
L4NF1 L3NF1 L2NF1 L1NF1 M1NF1 M2NF1 M3NF1 H1NF4 H2NF1 H3NF1 H4NF1
0.0
0.5743 0.6046 0.6387 0.6812 0.6548 0.7014 0.7343 0.7734 0.8268 0.8541 0.8739 0.912
1.0
L4NF2 L3NF2 L2NF2 L1NF2 M1NF2 M2NF2
1
M3NF1 H1NF2 H2NF2 H3NF2 H4NF2
0.0
0.5486 0.5815 0.6109 0.6672 0.6399 0.6901 0.7248 0.7512 0.8072 0.8368 0.8621 0.8990 1.0
1.0
L4A1 L3A1 L2A1 L1A1 M1A1 M2A1 M3A1 H1A1 H2A1 H3A1 H4A1
0.0
5.0972 5.2674 5.3142 5.6295 5.4429 5.7123 5.7481 5.7862 5.8122 5.8834 5.9678 6.1932 6.2873
1.0
L4A2 L3A2 L2A2 L1A2 M1A2 M2A2 M3A2 H1A2 H2A2 H3A2 H4A2
0.0
5.1058 5.1876 5.2738 5.5272 5.3899 5.6869 5.7142 5.7696 5.8092 5.8362 5.9047 6.0533 6.2389
1.0
L4V1 L3V1 L2V1 L1V1 M1V1 M2V1 M3V1 H1V1 H2V1 H3V1 H4V1
0.0
0.0512 0.0633 0.269 0.936 0.542 1.168 1.376 1.523 1.962 2.201 2.512 2.900 3.00
1.0
0.0
0.0 0.0412 0.0817 0.1231 0.1635 0.204 0.2443 0.2847 0.325 0.3657 0.406 0.446 0.4869 0.5273 0.5679 0.602 0.648 0.688 0.729 0.779 0.8213 0.879 0.9285 0.981
0.020 0.0615 0.102 0.1432 0.1839 0.2241 0.2645 0.306 0.345 0.385 0.426 0.4667 0.508 0.547 0.5842 0.6281 0.6685 0.704 0.749 0.806 0.8415 0.908 0.95 1.0
S12CL1 S19CL1 S17CL1 S15CL1 S13CL1 S11CL1 S9CL1 S7CL1 S5CL1 S3CL1 S1CL1 M2CL1 B1CL1 B3CL1 B5CL1 B7CL1 B9CL1 B11CL1 B13 CL1 B15CL1 B17CL1 B19CL1 B21CL1
S20CL1 S18CL1 S16CL1 S14CL1 S12CL1 S10CL1 S8CL1 S6CL1 S4CL1 S2CL1 M1CL1 M3CL1 B2CL1 B4CL1 B6CL1 B8CL1 B10CL1 B12CL1 B14CL1 B16CL1 B18CL1 B20CL1 B22CL1
1.0
0.0
S12CL2 S19CL2 S17CL2 S15CL2 S13CL2 S11CL2 S9CL2 S7CL2 S5CL2 S3CL2 S1CL2 M2CL2 B1CL2 B3CL2 B5CL2 B7CL2 B9CL2 B11CL2 B13 CL2 B15CL2 B17CL2 B19CL2 B21CL2
S20CL2 S18CL2 S16CL2 S14CL2 S12CL2 S10CL2 S8CL2 S6CL2 S4CL2 S2CL2 M1CL2 M3CL2 B2CL2 B4CL2 B6CL2 B8CL2 B10CL2 B12CL2 B14CL2 B16CL2 B18CL2 B20CL2 B22CL2
0.0 0.0412 0.0817 0.1231 0.1635 0.204 0.2443 0.2847 0.325 0.3657 0.406 0.446 0.4869 0.5273 0.5679 0.602 0.648 0.688 0.729 0.779 0.8213 0.879 0.9285 0.981
0.020 0.0615 0.102 0.1432 0.1839 0.2241 0.2645 0.306 0.345 0.385 0.426 0.4667 0.508 0.547 0.5842 0.6281 0.6685 0.704 0.749 0.806 0.8415 0.908 0.95 1.0
0.0
1.0
0.01 0.045 0.075 0.10 0.125 0.15 0.175 0.20 0.25 0.275 0.30 0.35 0.375 0.40 0.45 0.475 0.50 0.525 0.55 0.575 0.60
0.60
S9CD2 S8CD2 S7CD2 S6CD2 S5CD2 S4CD2 S3CD2 S2CD2 S1CD2 M1CD2 L1CD2 L2CD2 L3CD2 L4CD2 L5CD2 L6CD2 L7CD2 L8CD2 L9CD2
0.0
1.0
0.01 0.045 0.075 0.10 0.125 0.15 0.175 0.20 0.25 0.275 0.30 0.35 0.375 0.40 0.45 0.475 0.50 0.525 0.55 0.575 0.60
0.60
S9CD1 S8CD1 S7CD1 S6CD1 S5CD1 S4CD1 S3CD1 S2CD1 S1CD1 M1CD1 L1CD1 L2CD1 L3CD1 L4CD1 L5CD1 L6CD1 L7CD1 L8CD1 L9CD1
(h) Relative first crack location.
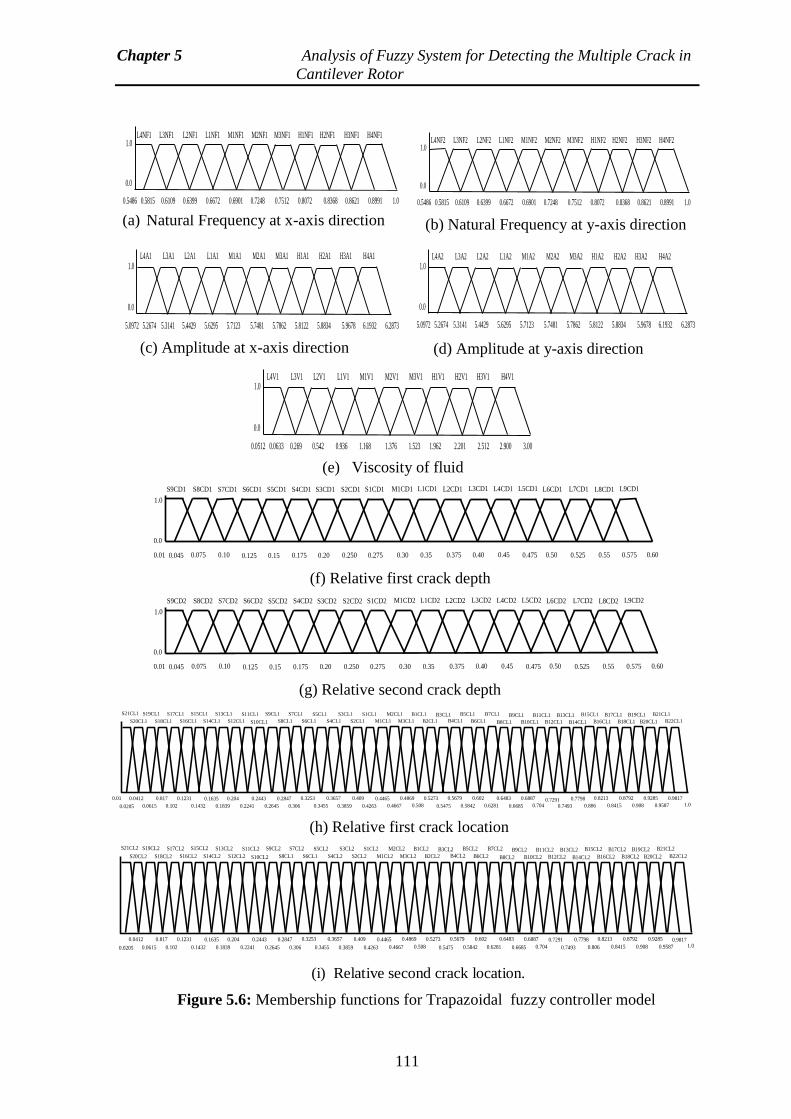
Chapter 5 Analysis of Fuzzy System for Detecting the Multiple Crack in
Cantilever Rotor
111
(g) Relative second crack depth
(a) Natural Frequency at x-axis direction
0.250 0.50 0.525 0.55 0.575 0.60 0.475 0.45 0.40 0.375 0.35 0.30 0.275 0.20 0.175 0.15 0.125 0.10 0.075 0.045 0.01
L6CD1 L7CD1 L8CD1
2
L9CD1
2
L5CD1 L4CD1 L3CD1 L2CD1 L1CD1 M1CD1 S1CD1 S2CD1 S3CD1 S4CD1 S5CD1 S6CD1 S7CD1 S8CD1 S9CD1
1.0
0.0
0.250 0.50 0.525 0.55 0.575 0.60 0.475 0.45 0.40 0.375 0.35 0.30 0.275 0.20 0.175 0.15 0.125 0.10 0.075 0.045 0.01
L6CD2 L7CD2 L8CD2 L9CD2 L5CD2 L4CD2 L3CD2 L2CD2 L1CD2 M1CD2 S1CD2 S2CD2 S3CD2 S4CD2 S5CD2 S6CD2 S7CD2 S8CD2 S9CD2
1.0
0.0
0.9817 1.0 0.7493
B6CL2 B20CL2
B3CL2
@
B15CL2
B16CL2 B18CL2
B17CL2 B19CL2 B21CL2
B22CL2 B14CL2
B11CL2
B12CL2
B13CL2
B10CL2
B9CL2
B8CL2
B7CL2 B5CL2
B4CL2 B2CL2
@
B1CL2
M3CL2
M2CL2
@ M1CL2
@
S1CL2
S2CL2
@
S3CL2
S4CL2
@
S5CL2
S6CL1
@
S7CL2
S8CL1
@
S9CL2
S10CL2
@
S11CL2
S12CL2
@
S13CL2
S14CL2
@
S15CL2
S16CL2
@
S18CL2
@
S17CL2
0.704
0.6887
0.6685
0.6483
0.6281
S19CL2
S20CL2
@
S21CL2
0.7798
0.806
0.8213
0.8415
0.8792
0.908
0.9285
0.9587
0.602
0.5842
0.5679
0.5475
0.5273
0.508
0.4869
0.4667
0.4465
0.4263
0.409
0.3859
0.3657
0.3455 0.306
0.3253 0.2847
0.2645
0.2443
0.2241
0.204
0.1839
0.1635
0.1432
0.1231
0.102
0.817
0.0615
0.0412
0.0205
0.7291
0.9817
1.0
0.01
0.7493
B6CL1 B20CL1
B3CL1
@
B15CL1
B16CL1 B18CL1
B17CL1 B19CL1 B21CL1
B22CL1 B14CL1
B11CL1
B12CL1
B13CL1
B10CL1
B9CL1
B8CL1
B7CL1 B5CL1
B4CL1 B2CL1
@
B1CL1
M3CL1
M2CL1
@ M1CL1
@
S1CL1
S2CL1
@
S3CL1
S4CL1
@
S5CL1
S6CL1
@
S7CL1
S8CL1
@
S9CL1
S10CL1
@
S11CL1
S12CL1
@
S13CL1
S14CL1
@
S15CL1
S16CL1
@
S18CL1
@
S17CL1
0.704
0.6887
0.6685
0.6483
0.6281
S19CL1
S20CL1
@
S21CL1
0.7798
0.806
0.8213
0.8415
0.8792
0.908
0.9285
0.9587
0.602
0.5842
0.5679
0.5475
0.5273
0.508
0.4869
0.4667
0.4465
0.4263
0.409
0.3859
0.3657
0.3455 0.306
0.3253 0.2847
0.2645
0.2443
0.2241
0.204
0.1839
0.1635
0.1432
0.1231
0.102
0.817
0.0615
0.0412
0.0205
0.7291
0.0
1.0
0.5486 0.5815 0.6109 0.6399 0.6672 0.6901 0.7248 0.7512 0.8072 0.8368 0.8621 0.8991 1.0
L4NF1 L3NF1 L2NF1 L1NF1 M1NF1 M2NF1 M3NF1 H1NF1 H2NF1 H3NF1 H4NF1
0.0
1.0
0.5486 0.5815 0.6109 0.6399 0.6672 0.6901 0.7248 0.7512 0.8072 0.8368 0.8621 0.8991 1.0
L4NF2 L3NF2 L2NF2 L1NF2 M1NF2 M2NF2 M3NF2 H1NF2 H2NF2 H3NF2 H4NF2
0.0
1.0
5.0972 5.2674 5.3141 5.4429 5.6295 5.7123 5.7481 5.7862 5.8122 5.8834 5.9678 6.1932 6.2873
L4A1 L3A1 L2A1 L1A1 M1A1 M2A1 M3A1 H1A1 H2A1 H3A1 H4A1
0.0
1.0
5.0972 5.2674 5.3141 5.4429 5.6295 5.7123 5.7481 5.7862 5.8122 5.8834 5.9678 6.1932 6.2873
L4A2 L3A2 L2A2 L1A2 M1A2 M2A2 M3A2 H1A2 H2A2 H3A2 H4A2
0.0512 0.0633 0.269 0.542 0.936 1.168 1.376 1.523 1.962 2.201 2.512 2.900 3.00
0.0
1.0 L4V1 L3V1 L2V1 L1V1 M1V1 M2V1 M3V1 H1V1 H2V1 H3V1 H4V1
(b) Natural Frequency at y-axis direction
(c) Amplitude at x-axis direction (d) Amplitude at y-axis direction
(e) Viscosity of fluid
(f) Relative first crack depth
(h) Relative first crack location
(i) Relative second crack location.
Figure 5.6: Membership functions for Trapazoidal fuzzy controller model
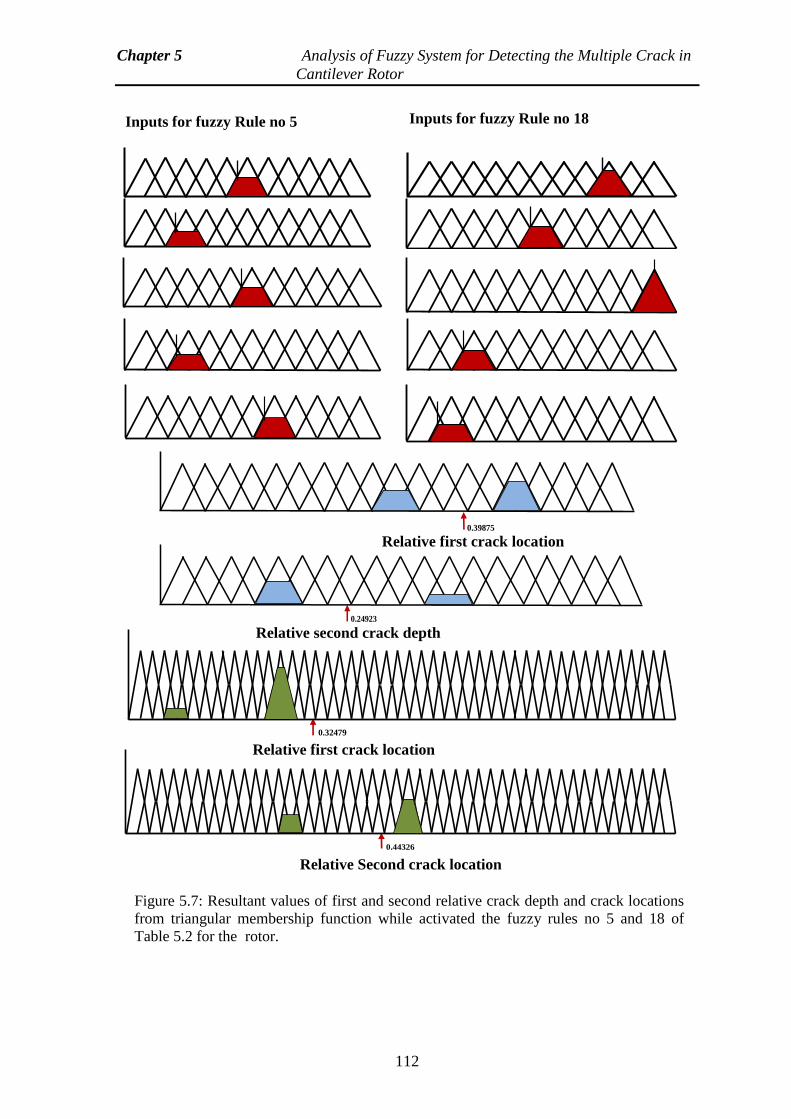
Chapter 5 Analysis of Fuzzy System for Detecting the Multiple Crack in
Cantilever Rotor
112
0.39875
0.24923
0.32479
0.44326
Relative first crack location
Relative Second crack location
Relative second crack depth
Relative first crack location
Figure 5.7: Resultant values of first and second relative crack depth and crack locations
from triangular membership function while activated the fuzzy rules no 5 and 18 of
Table 5.2 for the rotor.
Inputs for fuzzy Rule no 5
Inputs for fuzzy Rule no 18
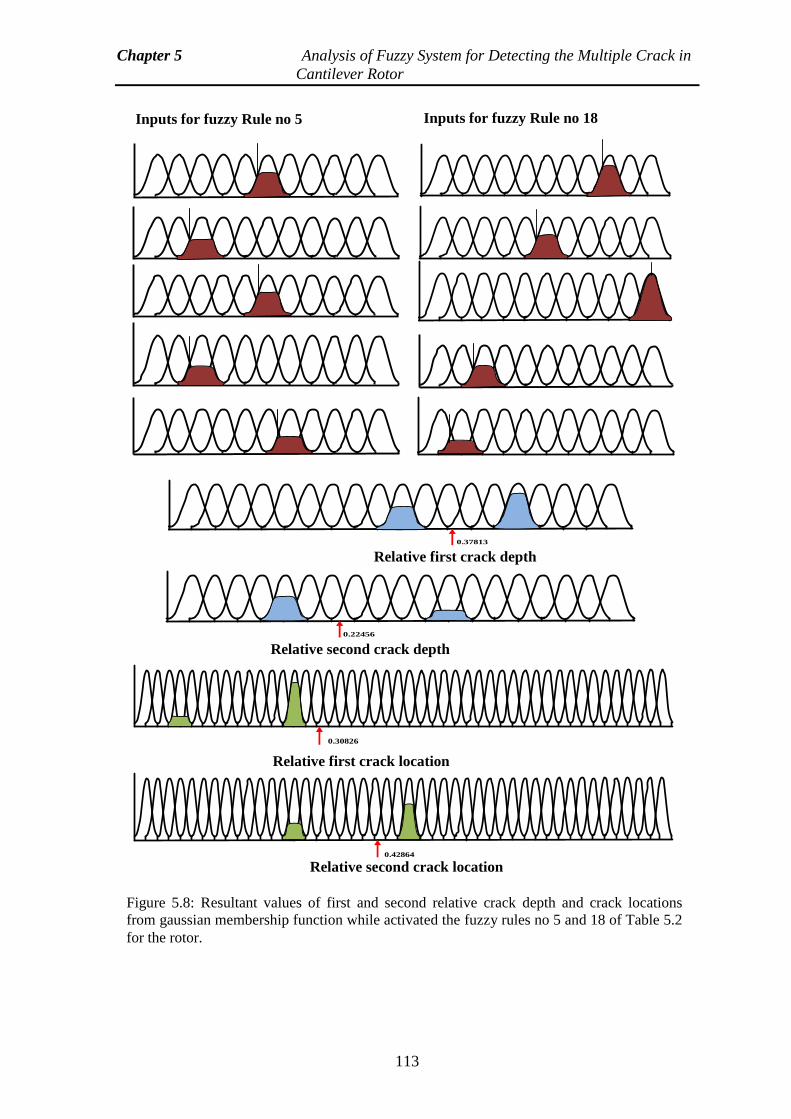
Chapter 5 Analysis of Fuzzy System for Detecting the Multiple Crack in
Cantilever Rotor
113
0.37813
0.22456
0.30826
0.42864
Relative second crack location
Relative first crack location
Relative second crack depth
Relative first crack depth
Inputs for fuzzy Rule no 5
Inputs for fuzzy Rule no 18
Figure 5.8: Resultant values of first and second relative crack depth and crack locations
from gaussian membership function while activated the fuzzy rules no 5 and 18 of Table 5.2
for the rotor.
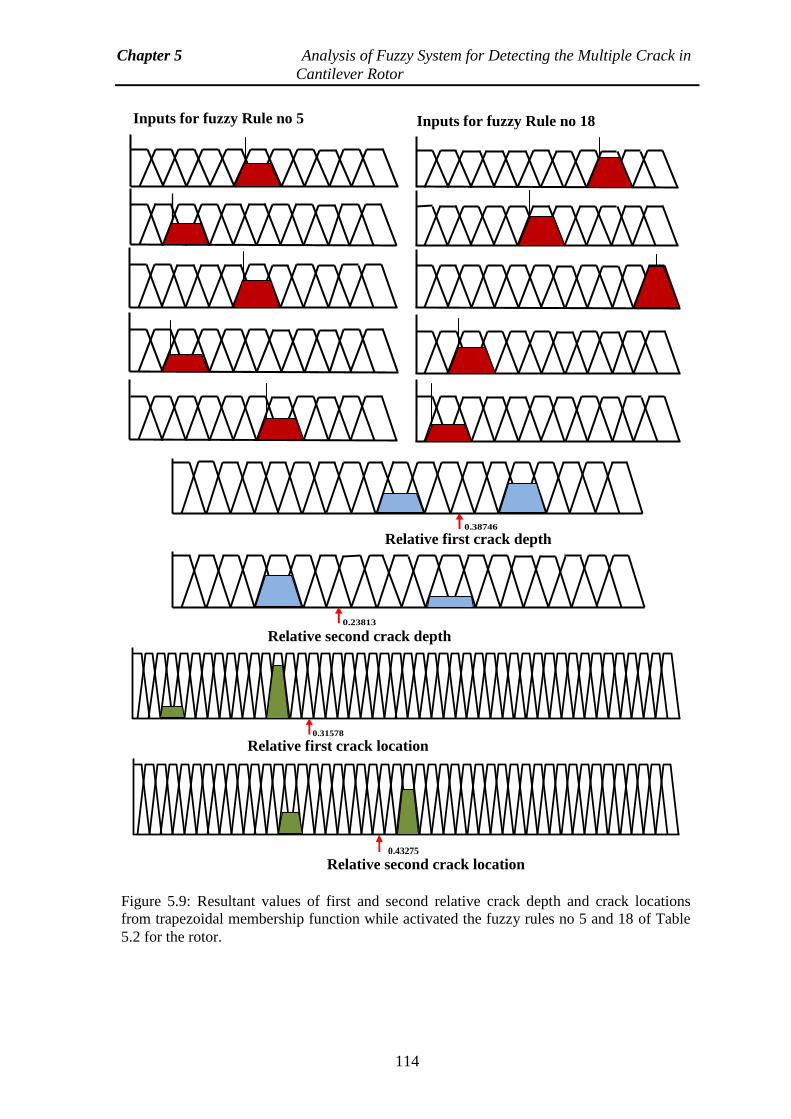
Chapter 5 Analysis of Fuzzy System for Detecting the Multiple Crack in
Cantilever Rotor
114
0.31578
0.38746
0.23813
0.43275
Relative second crack location
Relative first crack location
Relative second crack depth
Relative first crack depth
Figure 5.9: Resultant values of first and second relative crack depth and crack locations
from trapezoidal membership function while activated the fuzzy rules no 5 and 18 of Table
5.2 for the rotor.
Inputs for fuzzy Rule no 5
Inputs for fuzzy Rule no 18
Chapter 5 Analysis of Fuzzy System for Detecting the Multiple Crack in
Cantilever Rotor
115
5.4 Analysis of Takagi-Sugeno Fuzzy Logic Mechanism for
Identification of Crack in Rotor
In this segment, the Takagi-Sugeno fuzzy controller is used for identification of crack in
cantilever rotor partially submerged in the viscous medium. The input and output variables
are taken for T-S fuzzy controller system as similar as the Mamdani type fuzzy system.
The Takagi-Sugeno method of fuzzy inference was introduced by the Takagi, sugeno and
Kang [1985] to develop a systematic approach for producing fuzzy rules from a given
input-output data set. In general, the structure of Takagi-Sugeno type fuzzy model is
similar to the Mamdani type fuzzy model. The first order Takagi-Sugeno model has more
degrees of freedom and hence the estimated capability is higher, with a more risk to over
fit. The practice of minimum degrees of freedom is employed to control overfitting the
problem. Zero-order Sugeno fuzzy is highly interpretable than the first-order Sugeno
fuzzy model. Hence, the assortment of the Tagaki-Sugeno type model depend on the
requirements of the problem and the probability to overfit the fuzzy system. For the n-
dimensional input, m-dimensional output of the system, the rule of the T-S fuzzy inference
system is described by the equation are as follows;
1 1 1 1( P ) ...... ( P ) ( Q ) .... ( Q )k k k k
n n m mIF y is and and y is then u is and and u is (5.9)
Where 1( ,........., )ny y y are the input variables and 1( ,..... )mu u u are the output
variables, k
nP are the set of fuzzy defined on the input variables and k
i 1,....,Q i m are
fuzzy singletons defined on the output variables over the output variables iu .When u is
constant the resulting model is called as the Zero-order Sugeno fuzzy model. It can be
viewed in the case of the Mamdani fuzzy logic system, in which a fuzzy singleton
specifies each rule's consequent. Figure 5.10 represents the cognitive mechanism for zero-
order Sugeno model. More specifically, the consequent part of this fuzzy simplified rule
can be seen either as a singleton fuzzy set in the Mamdani model or as a constant output
function in TS models. In this work, the membership functions have been verified based
on the analysis of error (average error calculation). The three membership function (i.e.
Triangular, Gaussian and Trapezoidal) employed in the zero-order Sugeno based models.
Based on a set of K rules, the output of any unknown input vector y(0) is obtained by the
following fuzzy cognitive formula:
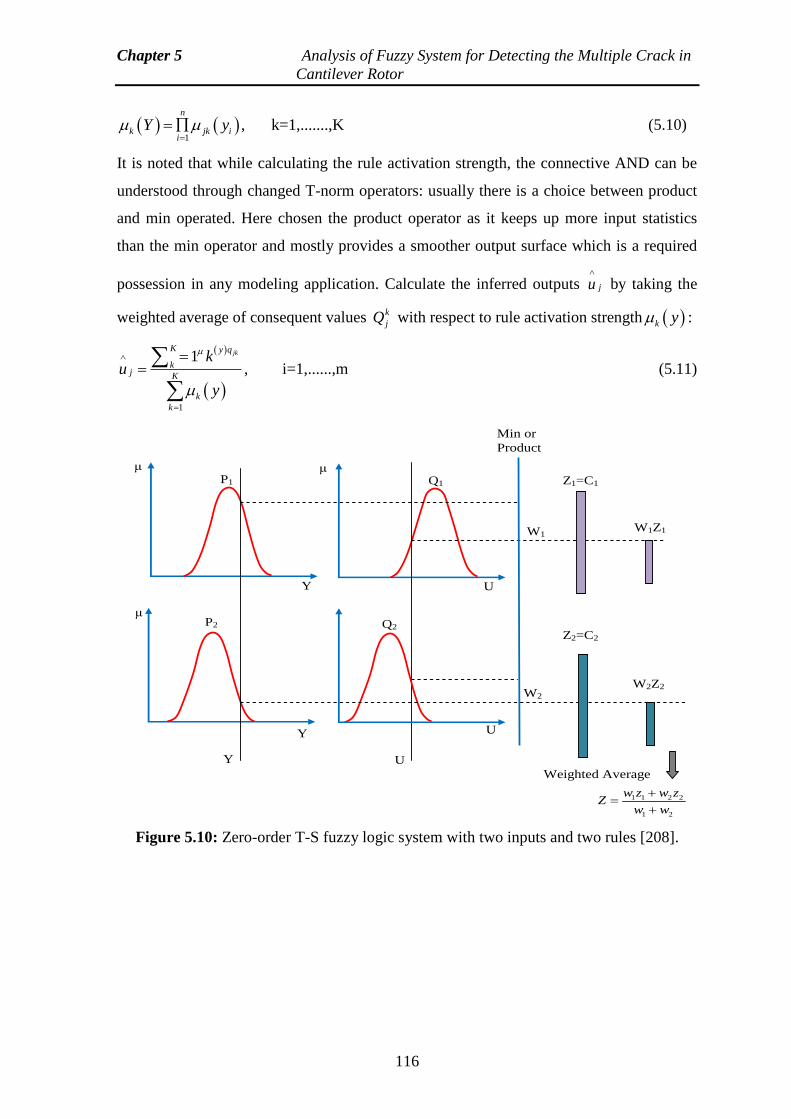
Chapter 5 Analysis of Fuzzy System for Detecting the Multiple Crack in
Cantilever Rotor
116
1
, k=1,.......,Kn
k jk ii
Y y
(5.10)
It is noted that while calculating the rule activation strength, the connective AND can be
understood through changed T-norm operators: usually there is a choice between product
and min operated. Here chosen the product operator as it keeps up more input statistics
than the min operator and mostly provides a smoother output surface which is a required
possession in any modeling application. Calculate the inferred outputs ju
by taking the
weighted average of consequent values k
jQ with respect to rule activation strength k y :
1
1, i=1,......,m
jkK y q
kj K
k
k
ku
y
(5.11)
W1
Y U
W2
U
P1 Q1
Q2 P2
Y
μ
μ
Min or
Product
Z1=C1
W1Z1
Z2=C2
W2Z2
Weighted Average
1 1 2 2
1 2
w z w zZ
w w
μ
Y U
Figure 5.10: Zero-order T-S fuzzy logic system with two inputs and two rules [208].
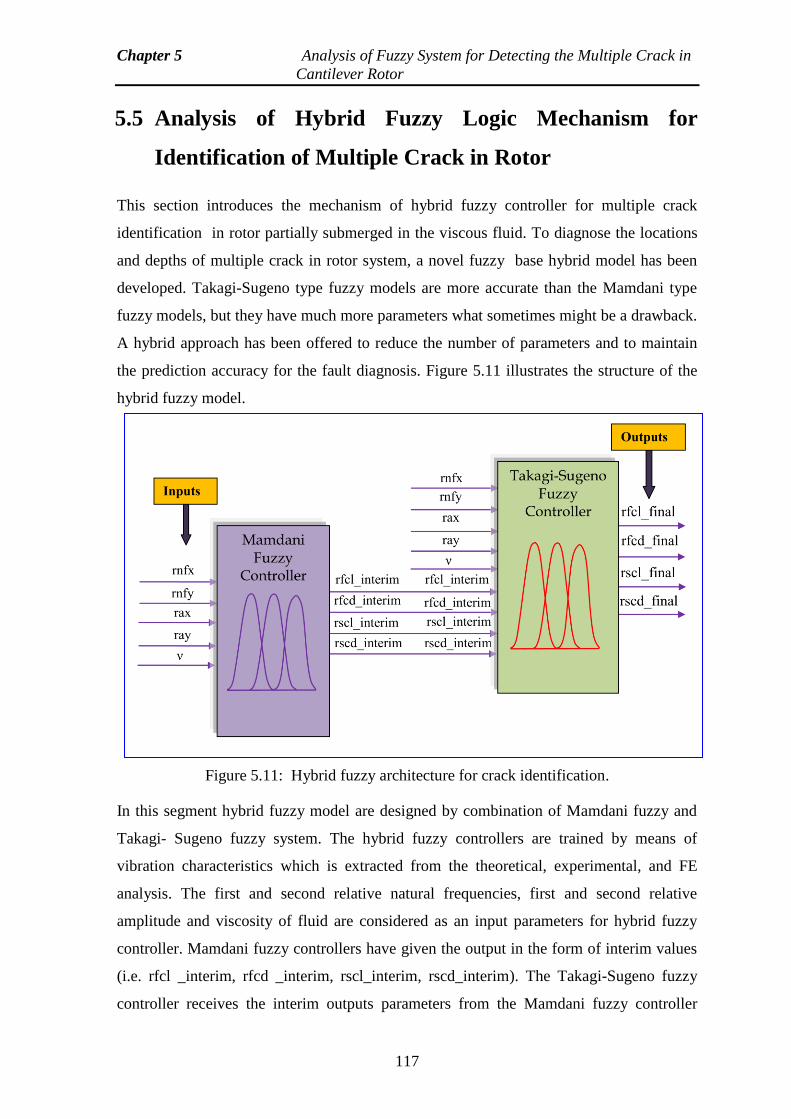
Chapter 5 Analysis of Fuzzy System for Detecting the Multiple Crack in
Cantilever Rotor
117
5.5 Analysis of Hybrid Fuzzy Logic Mechanism for
Identification of Multiple Crack in Rotor
This section introduces the mechanism of hybrid fuzzy controller for multiple crack
identification in rotor partially submerged in the viscous fluid. To diagnose the locations
and depths of multiple crack in rotor system, a novel fuzzy base hybrid model has been
developed. Takagi-Sugeno type fuzzy models are more accurate than the Mamdani type
fuzzy models, but they have much more parameters what sometimes might be a drawback.
A hybrid approach has been offered to reduce the number of parameters and to maintain
the prediction accuracy for the fault diagnosis. Figure 5.11 illustrates the structure of the
hybrid fuzzy model.
Figure 5.11: Hybrid fuzzy architecture for crack identification.
In this segment hybrid fuzzy model are designed by combination of Mamdani fuzzy and
Takagi- Sugeno fuzzy system. The hybrid fuzzy controllers are trained by means of
vibration characteristics which is extracted from the theoretical, experimental, and FE
analysis. The first and second relative natural frequencies, first and second relative
amplitude and viscosity of fluid are considered as an input parameters for hybrid fuzzy
controller. Mamdani fuzzy controllers have given the output in the form of interim values
(i.e. rfcl _interim, rfcd _interim, rscl_interim, rscd_interim). The Takagi-Sugeno fuzzy
controller receives the interim outputs parameters from the Mamdani fuzzy controller
Chapter 5 Analysis of Fuzzy System for Detecting the Multiple Crack in
Cantilever Rotor
118
along with the two relative natural frequencies, two relative amplitude, and viscosity of
fluid as inputs.Finally, the output parameters rfcl_final, rfcd_final, rscl_final, rscd_final
are obtained from the hybrid fuzzy controller. The comparison of result obtained from the
Mamdani fuzzy, Sugeno fuzzy, hybrid fuzzy and experimental analysis have been
illustrated in Table 5.7 and the results are obtained to be in close agreement.
5.6 Results and Discussion
In this section analysis of results are carried out from developed Mamdani fuzzy, Takagi-
Sugeno fuzzy and fuzzy based hybrid model to forcast the multiple crack locations and
depths in cantilever rotor system partially immersed in the viscous fluid medium. The
Mamdani and Takagi-Sugeno fuzzy model are used the triangular, gaussian and
trapezoidal membership functions. The fuzzy based hybrid systems are active with the
gaussian membership function. The proposed FL model with three different type of fuzzy
membership function (i.e. Triangular, Gaussian and Trapezoidal) has been developed for
the five input variable (two relative natural frequency, two relative amplitude and
viscosity of fluid) and four output variables (first and second relative crack locations and
depths). Figures 5.1(a), 5.1(b) and 5.1(c) illustrate the three type of membership function
(Triangular, Gaussian and Trapezoidal) employed for the progress of the knowledge base
system. The different stages incorporated in the fuzzy logic system are presented in Figure
5.2. Figures 5.3(a), 5.3(b) and 5.3(c) present the triangular, gaussian and trapezoidal
membership function with linguistic term respectively. Tables 5.1 and 5.2 show the
various linguistic term with range and twenty fuzzy rules used to train the fuzzy logic
based crack identification system for rotor respectively. The complete structure of the
Mamdani fuzzy system including three different type of membership function with the
linguistic variable has been illustrated in Figures 5.4 to 5.6. The process of defuzzification
for the Mamdani fuzzy model has been implemented using triangular, gaussian and
trapezoidal membership functions with the help of activated rules 5 and 18 of Table 5.2
and presented in Figures 5.7 to 5.9. The obtained results from the developed Mamdani
fuzzy models using triangular, gaussian and trapezoidal membership functions and
experimental analysis have been compared in Table 5.3 for the rotor.Table 5.3 present the
analysis result of the Mamdani fuzzy system. It has been observed that the Mamdani
gaussian fuzzy gives the better results as compared to Mamdani triangular fuzzy and
Mamdani trapazoidal fuzzy system. The illustrative view of mechanism of zero-order
Chapter 5 Analysis of Fuzzy System for Detecting the Multiple Crack in
Cantilever Rotor
119
Sugeno fuzzy model is presented in Figure 5.10. The comparison of results obtained from
the implemented sugeno triangular fuzzy model, Sugeno gaussian fuzzy model, Sugeno
trapezoidal fuzzy model and experimental analysis have been presented in Table 5.5.
From the analysis of sugeno fuzzy model, it has been observed that the sugeno gaussain
fuzzy gives the closer result as compared to sugeno trapezoidal fuzzy and sugeno
triangular fuzzy model.Table 5.6 represents the comparison of results obtained from
theoretical, experimental, FE analysis and Sugeno fuzzy gaussian model for the rotor. The
hybrid fuzzy model is the combination of the Mamdani fuzzy and Sugeno fuzzy model
with gaussian membership function has been implemented. Figure 5.11 represents the
structure of the hybrid fuzzy controller. The obtained results from the developed hybrid
fuzzy model with gaussian membership function and experimental analysis have been
compared in Table 5.7 for the rotor. Table 5.7 represents the comparison of results
obtained from Mamdani fuzzy, Sugeno fuzzy, hybrid fuzzy and experimental analysis for
the rotor. It has been observed that the hybrid fuzzy model provides the better result as
compared to Mamdani fuzzy and Sugeno fuzzy model.
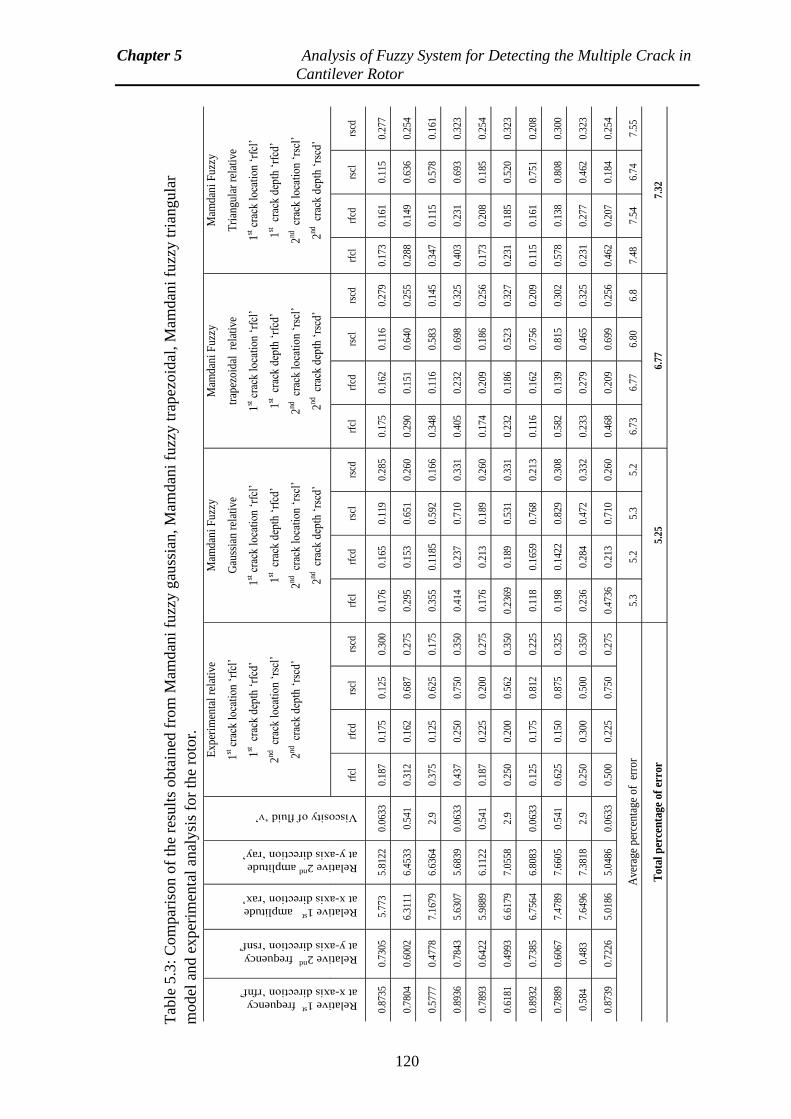
Chapter 5 Analysis of Fuzzy System for Detecting the Multiple Crack in
Cantilever Rotor
120
Tab
le 5
.3:
Com
par
ison o
f th
e re
sult
s obta
ined
fro
m M
amdan
i fu
zzy g
auss
ian,
Mam
dan
i fu
zzy t
rap
ezoid
al,
Mam
dan
i fu
zzy t
rian
gula
r
model
and e
xper
imen
tal
anal
ysi
s fo
r th
e ro
tor.
Relative 1st frequency
at x-axis direction ‘rfnf’
Relative 2nd
frequency
at y-axis direction ‘rsnf’
Relative 1st amplitude
at x-axis direction ‘rax’
Relative 2nd
amplitude
at y-axis direction ‘ray’
Viscosity of fluid ‘ν’
Exp
erim
enta
l re
lati
ve
1st c
rack
lo
cati
on ‘
rfcl
’
1st c
rack
dep
th ‘
rfcd
’
2nd
cr
ack
loca
tio
n ‘
rscl
’
2nd
cr
ack
dep
th ‘
rscd
’
Mam
dan
i F
uzz
y
Gau
ssia
n r
elat
ive
1st c
rack
lo
cati
on ‘
rfcl
’
1st c
rack
dep
th ‘
rfcd
’
2nd
cr
ack
loca
tio
n ‘
rscl
’
2nd
cr
ack
dep
th ‘
rscd
’
Mam
dan
i F
uzz
y
trap
ezo
idal
re
lati
ve
1st c
rack
lo
cati
on ‘
rfcl
’
1st c
rack
dep
th ‘
rfcd
’
2nd
cr
ack
loca
tio
n ‘
rscl
’
2nd
cr
ack
dep
th ‘
rscd
’
Mam
dan
i F
uzz
y
Tri
angu
lar
rela
tive
1st c
rack
lo
cati
on ‘
rfcl
’
1st c
rack
dep
th ‘
rfcd
’
2nd
cr
ack
loca
tio
n ‘
rscl
’
2nd
cr
ack
dep
th ‘
rscd
’
rfcl
rf
cd
rscl
rs
cd
rfcl
rf
cd
rscl
rs
cd
rfcl
rf
cd
rscl
rs
cd
rfcl
rf
cd
rscl
rs
cd
0.8
735
0.7
305
5.7
73
5.8
122
0.0
633
0.1
87
0.1
75
0.1
25
0.3
00
0.1
76
0.1
65
0.1
19
0.2
85
0.1
75
0.1
62
0.1
16
0.2
79
0.1
73
0.1
61
0.1
15
0.2
77
0.7
804
0.6
002
6.3
111
6.4
533
0.5
41
0.3
12
0.1
62
0.6
87
0.2
75
0.2
95
0.1
53
0.6
51
0.2
60
0.2
90
0.1
51
0.6
40
0.2
55
0.2
88
0.1
49
0.6
36
0.2
54
0.5
777
0.4
778
7.1
679
6.6
364
2.9
0
.375
0
.125
0
.625
0
.175
0
.355
0
.118
5 0
.592
0
.166
0
.348
0
.116
0
.583
0
.145
0
.347
0
.115
0
.578
0
.161
0.8
936
0.7
843
5.6
307
5.6
839
0.0
633
0.4
37
0.2
50
0.7
50
0.3
50
0.4
14
0.2
37
0.7
10
0.3
31
0.4
05
0.2
32
0.6
98
0.3
25
0.4
03
0.2
31
0.6
93
0.3
23
0.7
893
0.6
422
5.9
889
6.1
122
0.5
41
0.1
87
0.2
25
0.2
00
0.2
75
0.1
76
0.2
13
0.1
89
0.2
60
0.1
74
0.2
09
0.1
86
0.2
56
0.1
73
0.2
08
0.1
85
0.2
54
0.6
181
0.4
993
6.6
179
7.0
558
2.9
0
.250
0
.200
0
.562
0
.350
0
.236
9 0
.189
0
.531
0
.331
0
.232
0
.186
0
.523
0
.327
0
.231
0
.185
0
.520
0
.323
0.8
932
0.7
385
6.7
564
6.8
083
0.0
633
0.1
25
0.1
75
0.8
12
0.2
25
0.1
18
0.1
659
0.7
68
0.2
13
0.1
16
0.1
62
0.7
56
0.2
09
0.1
15
0.1
61
0.7
51
0.2
08
0.7
889
0.6
067
7.4
789
7.6
605
0.5
41
0.6
25
0.1
50
0.8
75
0.3
25
0.1
98
0.1
422
0.8
29
0.3
08
0.5
82
0.1
39
0.8
15
0.3
02
0.5
78
0.1
38
0.8
08
0.3
00
0.5
84
0.4
83
7.6
496
7.3
818
2.9
0
.250
0
.300
0
.500
0
.350
0
.236
0
.284
0
.472
0
.332
0
.233
0
.279
0
.465
0
.325
0
.231
0
.277
0
.462
0
.323
0.8
739
0.7
226
5.0
186
5.0
486
0.0
633
0.5
00
0.2
25
0.7
50
0.2
75
0.4
736
0.2
13
0.7
10
0.2
60
0.4
68
0.2
09
0.6
99
0.2
56
0.4
62
0.2
07
0.1
84
0.2
54
Ave
rage
per
cen
tag
e o
f e
rro
r 5
.3
5.2
5
.3
5.2
6
.73
6.7
7 6
.80
6.8
7
.48
7.5
4 6
.74
7.5
5
Tot
al
per
cen
tag
e of
err
or
5.2
5
6.7
7
7.3
2
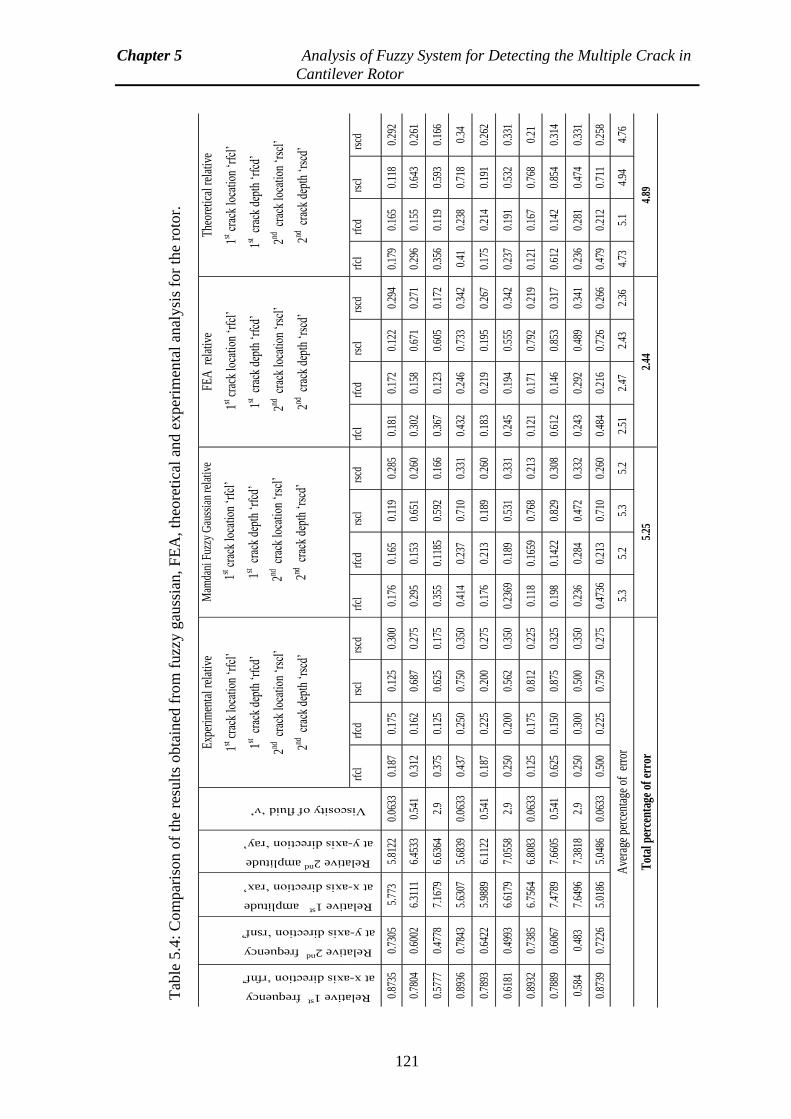
Chapter 5 Analysis of Fuzzy System for Detecting the Multiple Crack in
Cantilever Rotor
121
Tab
le 5
.4:
Com
par
ison o
f th
e re
sult
s obta
ined
fro
m f
uzz
y g
auss
ian,
FE
A, th
eore
tica
l an
d e
xper
imen
tal
anal
ysi
s fo
r th
e ro
tor.
Relative 1st frequency
at x-axis direction ‘rfnf’
Relative 2nd
frequency
at y-axis direction ‘rsnf’
Relative 1st amplitude
at x-axis direction ‘rax’
Relative 2nd
amplitude
at y-axis direction ‘ray’
Viscosity of fluid ‘ν’
Exp
erim
enta
l rel
ativ
e
1st c
rack
loca
tion
‘rfc
l’
1st c
rack
dep
th ‘
rfcd
’
2nd c
rack
loca
tion
‘rsc
l’
2nd c
rack
dep
th ‘
rscd
’
Mam
dani
Fuz
zy G
auss
ian
rela
tive
1st c
rack
loca
tion
‘rfc
l’
1st c
rack
dep
th ‘
rfcd
’
2nd
cra
ck lo
catio
n ‘r
scl’
2nd c
rack
dep
th ‘
rscd
’
FEA
rel
ativ
e
1st c
rack
loca
tion
‘rfc
l’
1st c
rack
dep
th ‘
rfcd
’
2nd
cra
ck lo
catio
n ‘r
scl’
2nd c
rack
dep
th ‘
rscd
’
The
oret
ical
rel
ativ
e
1st c
rack
loca
tion
‘rfc
l’
1st c
rack
dep
th ‘
rfcd
’
2nd
cra
ck lo
catio
n ‘r
scl’
2nd c
rack
dep
th ‘
rscd
’
rfcl
rfcd
rs
cl
rscd
rf
cl
rf
cd
rscl
rs
cd
rfcl
rfcd
rs
cl
rscd
rf
cl
rf
cd
rscl
rs
cd
0.87
35
0.73
05
5.77
3 5.
8122
0.
0633
0.
187
0.17
5 0.
125
0.30
0 0.
176
0.16
5 0.
119
0.28
5 0.
181
0.17
2 0.
122
0.29
4 0.
179
0.16
5 0.
118
0.29
2
0.78
04
0.60
02
6.31
11
6.45
33
0.54
1 0.
312
0.16
2 0.
687
0.27
5 0.
295
0.15
3 0.
651
0.26
0 0.
302
0.15
8 0.
671
0.27
1 0.
296
0.15
5 0.
643
0.26
1
0.57
77
0.47
78
7.16
79
6.63
64
2.9
0.37
5 0.
125
0.62
5 0.
175
0.35
5 0.
1185
0.
592
0.16
6 0.
367
0.12
3 0.
605
0.17
2 0.
356
0.11
9 0.
593
0.16
6
0.89
36
0.78
43
5.63
07
5.68
39
0.06
33
0.43
7 0.
250
0.75
0 0.
350
0.41
4 0.
237
0.71
0 0.
331
0.43
2 0.
246
0.73
3 0.
342
0.41
0.
238
0.71
8 0.
34
0.78
93
0.64
22
5.98
89
6.11
22
0.54
1 0.
187
0.22
5 0.
200
0.27
5 0.
176
0.21
3 0.
189
0.26
0 0.
183
0.21
9 0.
195
0.26
7 0.
175
0.21
4 0.
191
0.26
2
0.61
81
0.49
93
6.61
79
7.05
58
2.9
0.25
0 0.
200
0.56
2 0.
350
0.23
69
0.18
9 0.
531
0.33
1 0.
245
0.19
4 0.
555
0.34
2 0.
237
0.19
1 0.
532
0.33
1
0.89
32
0.73
85
6.75
64
6.80
83
0.06
33
0.12
5 0.
175
0.81
2 0.
225
0.11
8 0.
1659
0.
768
0.21
3 0.
121
0.17
1 0.
792
0.21
9 0.
121
0.16
7 0.
768
0.21
0.78
89
0.60
67
7.47
89
7.66
05
0.54
1 0.
625
0.15
0 0.
875
0.32
5 0.
198
0.14
22
0.82
9 0.
308
0.61
2 0.
146
0.85
3 0.
317
0.61
2 0.
142
0.85
4 0.
314
0.58
4 0.
483
7.64
96
7.38
18
2.9
0.25
0 0.
300
0.50
0 0.
350
0.23
6 0.
284
0.47
2 0.
332
0.24
3 0.
292
0.48
9 0.
341
0.23
6 0.
281
0.47
4 0.
331
0.87
39
0.72
26
5.01
86
5.04
86
0.06
33
0.50
0 0.
225
0.75
0 0.
275
0.47
36
0.21
3 0.
710
0.26
0 0.
484
0.21
6 0.
726
0.26
6 0.
479
0.21
2 0.
711
0.25
8
Ave
rage
per
cent
age
of e
rror
5.
3 5.
2 5.
3 5.
2 2.
51
2.47
2.
43
2.36
4.
73
5.1
4.94
4.
76
Tot
al p
erce
ntag
e of
err
or
5.25
2.
44
4.89
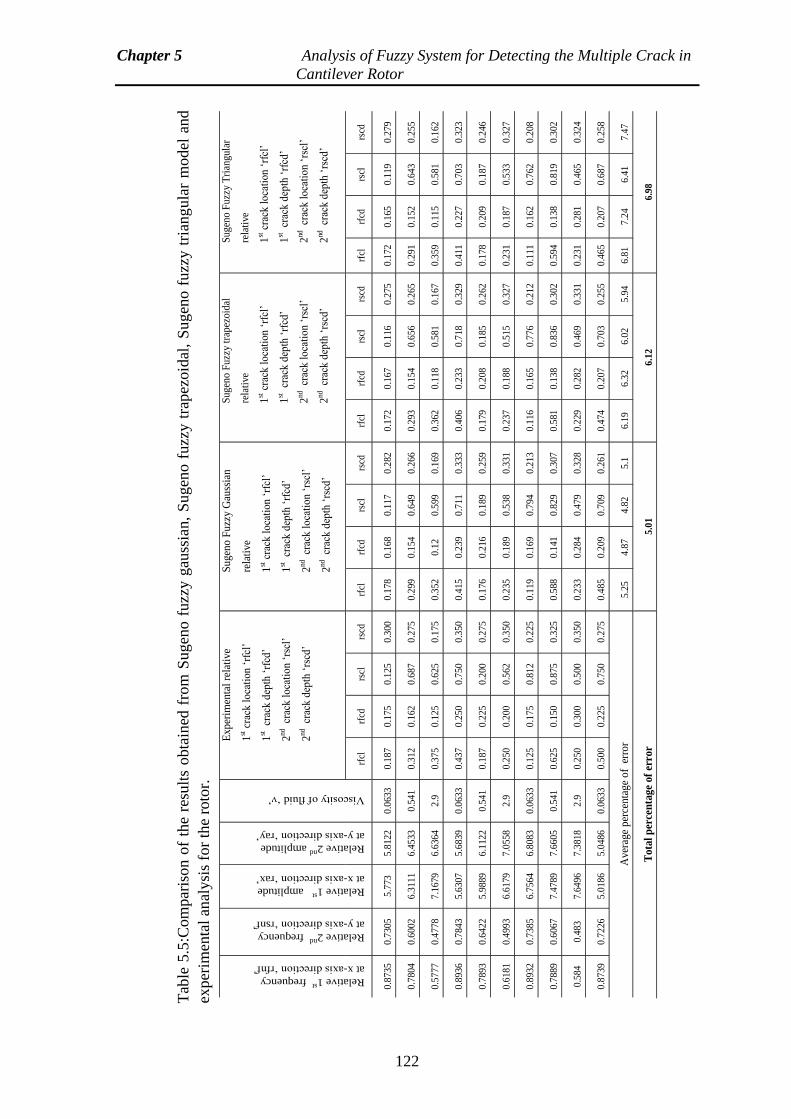
Chapter 5 Analysis of Fuzzy System for Detecting the Multiple Crack in
Cantilever Rotor
122
Tab
le 5
.5:C
om
par
ison o
f th
e re
sult
s obta
ined
fro
m S
ugen
o f
uzz
y g
auss
ian,
Sugen
o f
uzz
y t
rapez
oid
al,
Sugen
o f
uzz
y t
rian
gula
r m
odel
and
exper
imen
tal
anal
ysi
s fo
r th
e ro
tor.
Relative 1st frequency
at x-axis direction ‘rfnf’
Relative 2nd
frequency
at y-axis direction ‘rsnf’
Relative 1st amplitude
at x-axis direction ‘rax’
Relative 2nd
amplitude
at y-axis direction ‘ray’
Viscosity of fluid ‘ν’
Exp
erim
enta
l re
lati
ve
1st c
rack
lo
cati
on
‘rf
cl’
1st cr
ack d
epth
‘rf
cd’
2nd
cr
ack l
oca
tio
n ‘
rscl
’
2nd
cr
ack d
epth
‘rs
cd’
Su
gen
o F
uzz
y G
auss
ian
rela
tive
1st c
rack
lo
cati
on
‘rf
cl’
1st cr
ack d
epth
‘rf
cd’
2nd
cr
ack l
oca
tio
n ‘
rscl
’
2nd
cr
ack d
epth
‘rs
cd’
Sug
eno F
uzz
y tr
apez
oid
al
rela
tive
1st c
rack
lo
cati
on
‘rf
cl’
1st cr
ack d
epth
‘rf
cd’
2nd
cr
ack l
oca
tio
n ‘
rscl
’
2nd
cr
ack d
epth
‘rs
cd’
Sug
eno F
uzz
y T
rian
gula
r
rela
tive
1st c
rack
lo
cati
on
‘rf
cl’
1st cr
ack d
epth
‘rf
cd’
2nd
cr
ack l
oca
tio
n ‘
rscl
’
2nd
cr
ack d
epth
‘rs
cd’
rfcl
rf
cd
rscl
rs
cd
rfcl
rf
cd
rscl
rs
cd
rfcl
rf
cd
rscl
rs
cd
rfcl
rf
cd
rscl
rs
cd
0.8
735
0.7
305
5.7
73
5.8
122
0.0
633
0.1
87
0.1
75
0.1
25
0.3
00
0.1
78
0.1
68
0.1
17
0.2
82
0.1
72
0.1
67
0.1
16
0.2
75
0.1
72
0.1
65
0.1
19
0.2
79
0.7
804
0.6
002
6.3
111
6.4
533
0.5
41
0.3
12
0.1
62
0.6
87
0.2
75
0.2
99
0.1
54
0.6
49
0.2
66
0.2
93
0.1
54
0.6
56
0.2
65
0.2
91
0.1
52
0.6
43
0.2
55
0.5
777
0.4
778
7.1
679
6.6
364
2.9
0
.375
0.1
25
0.6
25
0.1
75
0.3
52
0.1
2
0.5
99
0.1
69
0.3
62
0.1
18
0.5
81
0.1
67
0.3
59
0.1
15
0.5
81
0.1
62
0.8
936
0.7
843
5.6
307
5.6
839
0.0
633
0.4
37
0.2
50
0.7
50
0.3
50
0.4
15
0.2
39
0.7
11
0.3
33
0.4
06
0.2
33
0.7
18
0.3
29
0.4
11
0.2
27
0.7
03
0.3
23
0.7
893
0.6
422
5.9
889
6.1
122
0.5
41
0.1
87
0.2
25
0.2
00
0.2
75
0.1
76
0.2
16
0.1
89
0.2
59
0.1
79
0.2
08
0.1
85
0.2
62
0.1
78
0.2
09
0.1
87
0.2
46
0.6
181
0.4
993
6.6
179
7.0
558
2.9
0
.250
0.2
00
0.5
62
0.3
50
0.2
35
0.1
89
0.5
38
0.3
31
0.2
37
0.1
88
0.5
15
0.3
27
0.2
31
0.1
87
0.5
33
0.3
27
0.8
932
0.7
385
6.7
564
6.8
083
0.0
633
0.1
25
0.1
75
0.8
12
0.2
25
0.1
19
0.1
69
0.7
94
0.2
13
0.1
16
0.1
65
0.7
76
0.2
12
0.1
11
0.1
62
0.7
62
0.2
08
0.7
889
0.6
067
7.4
789
7.6
605
0.5
41
0.6
25
0.1
50
0.8
75
0.3
25
0.5
88
0.1
41
0.8
29
0.3
07
0.5
81
0.1
38
0.8
36
0.3
02
0.5
94
0.1
38
0.8
19
0.3
02
0.5
84
0.4
83
7.6
496
7.3
818
2.9
0
.250
0.3
00
0.5
00
0.3
50
0.2
33
0.2
84
0.4
79
0.3
28
0.2
29
0.2
82
0.4
69
0.3
31
0.2
31
0.2
81
0.4
65
0.3
24
0.8
739
0.7
226
5.0
186
5.0
486
0.0
633
0.5
00
0.2
25
0.7
50
0.2
75
0.4
85
0.2
09
0.7
09
0.2
61
0.4
74
0.2
07
0.7
03
0.2
55
0.4
65
0.2
07
0.6
87
0.2
58
Aver
age
per
cen
tag
e o
f e
rro
r 5
.25
4.8
7
4.8
2
5.1
6
.19
6.3
2
6.0
2
5.9
4
6.8
1
7.2
4
6.4
1
7.4
7
Tota
l p
erce
nta
ge
of
erro
r 5
.01
6.1
2
6.9
8
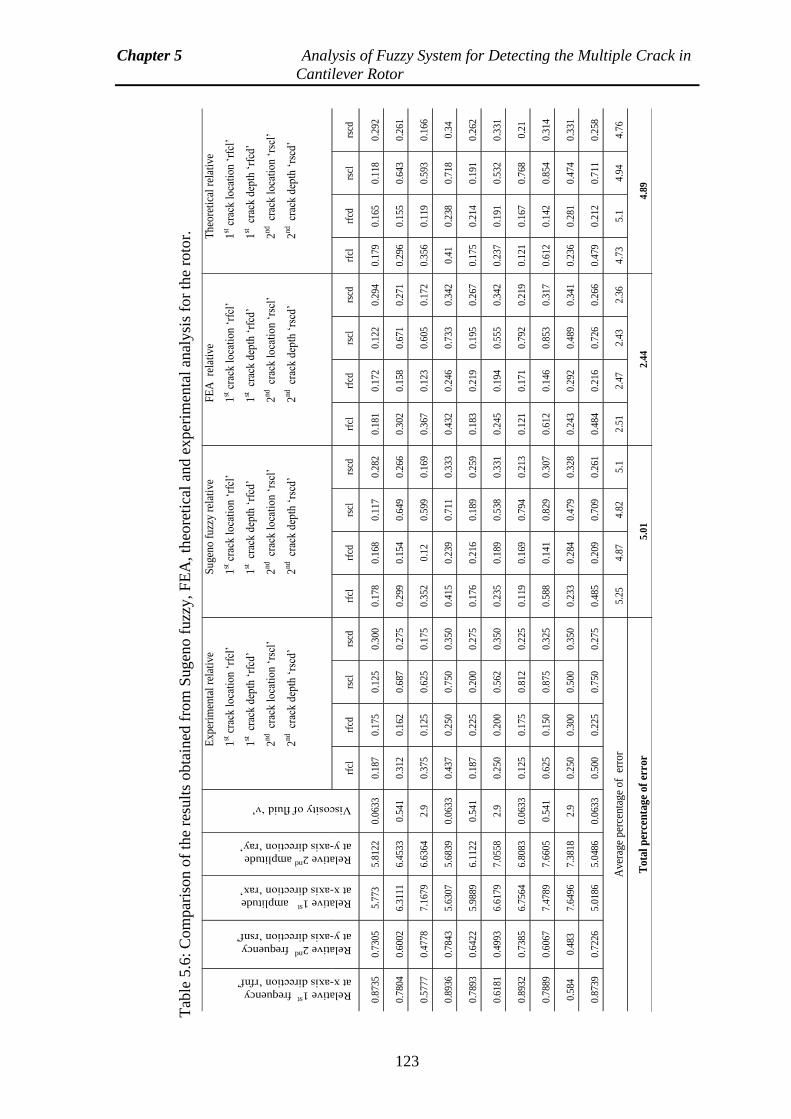
Chapter 5 Analysis of Fuzzy System for Detecting the Multiple Crack in
Cantilever Rotor
123
Tab
le 5
.6:
Com
par
ison o
f th
e re
sult
s o
bta
ined
fro
m S
ugen
o f
uzz
y, F
EA
, th
eore
tica
l an
d e
xper
imen
tal
anal
ysi
s fo
r th
e ro
tor.
Relative 1st frequency
at x-axis direction ‘rfnf’
Relative 2nd
frequency
at y-axis direction ‘rsnf’
Relative 1st amplitude
at x-axis direction ‘rax’
Relative 2nd
amplitude
at y-axis direction ‘ray’
Viscosity of fluid ‘ν’
Exp
erim
enta
l re
lati
ve
1st c
rack
lo
cati
on ‘
rfcl
’
1st c
rack
dep
th ‘
rfcd
’
2nd
cr
ack
loca
tio
n ‘
rscl
’
2nd
cr
ack
dep
th ‘
rscd
’
Su
gen
o f
uzz
y re
lati
ve
1st c
rack
lo
cati
on ‘
rfcl
’
1st c
rack
dep
th ‘
rfcd
’
2nd
cr
ack
loca
tio
n ‘
rscl
’
2nd
cr
ack
dep
th ‘
rscd
’
FE
A
rela
tive
1st c
rack
lo
cati
on ‘
rfcl
’
1st c
rack
dep
th ‘
rfcd
’
2nd
cr
ack
loca
tio
n ‘
rscl
’
2nd
cr
ack
dep
th ‘
rscd
’
Th
eore
tica
l re
lati
ve
1st c
rack
lo
cati
on ‘
rfcl
’
1st c
rack
dep
th ‘
rfcd
’
2nd
cr
ack
loca
tio
n ‘
rscl
’
2nd
cr
ack
dep
th ‘
rscd
’
rfcl
rf
cd
rscl
rs
cd
rfcl
rf
cd
rscl
rs
cd
rfcl
rf
cd
rscl
rs
cd
rfcl
rf
cd
rscl
rs
cd
0.8
735
0.7
305
5.7
73
5.8
122
0.0
633
0.1
87
0.1
75
0.1
25
0.3
00
0.1
78
0.1
68
0.1
17
0.2
82
0.1
81
0.1
72
0.1
22
0.2
94
0.1
79
0.1
65
0.1
18
0.2
92
0.7
804
0.6
002
6.3
111
6.4
533
0.5
41
0.3
12
0.1
62
0.6
87
0.2
75
0.2
99
0.1
54
0.6
49
0.2
66
0.3
02
0.1
58
0.6
71
0.2
71
0.2
96
0.1
55
0.6
43
0.2
61
0.5
777
0.4
778
7.1
679
6.6
364
2.9
0
.375
0
.125
0
.625
0
.175
0
.352
0
.12
0.5
99
0.1
69
0.3
67
0.1
23
0.6
05
0.1
72
0.3
56
0.1
19
0.5
93
0.1
66
0.8
936
0.7
843
5.6
307
5.6
839
0.0
633
0.4
37
0.2
50
0.7
50
0.3
50
0.4
15
0.2
39
0.7
11
0.3
33
0.4
32
0.2
46
0.7
33
0.3
42
0.4
1
0.2
38
0.7
18
0.3
4
0.7
893
0.6
422
5.9
889
6.1
122
0.5
41
0.1
87
0.2
25
0.2
00
0.2
75
0.1
76
0.2
16
0.1
89
0.2
59
0.1
83
0.2
19
0.1
95
0.2
67
0.1
75
0.2
14
0.1
91
0.2
62
0.6
181
0.4
993
6.6
179
7.0
558
2.9
0
.250
0
.200
0
.562
0
.350
0
.235
0
.189
0
.538
0
.331
0
.245
0
.194
0
.555
0
.342
0
.237
0
.191
0
.532
0
.331
0.8
932
0.7
385
6.7
564
6.8
083
0.0
633
0.1
25
0.1
75
0.8
12
0.2
25
0.1
19
0.1
69
0.7
94
0.2
13
0.1
21
0.1
71
0.7
92
0.2
19
0.1
21
0.1
67
0.7
68
0.2
1
0.7
889
0.6
067
7.4
789
7.6
605
0.5
41
0.6
25
0.1
50
0.8
75
0.3
25
0.5
88
0.1
41
0.8
29
0.3
07
0.6
12
0.1
46
0.8
53
0.3
17
0.6
12
0.1
42
0.8
54
0.3
14
0.5
84
0.4
83
7.6
496
7.3
818
2.9
0
.250
0
.300
0
.500
0
.350
0
.233
0
.284
0
.479
0
.328
0
.243
0
.292
0
.489
0
.341
0
.236
0
.281
0
.474
0
.331
0.8
739
0.7
226
5.0
186
5.0
486
0.0
633
0.5
00
0.2
25
0.7
50
0.2
75
0.4
85
0.2
09
0.7
09
0.2
61
0.4
84
0.2
16
0.7
26
0.2
66
0.4
79
0.2
12
0.7
11
0.2
58
Ave
rage
per
cen
tag
e o
f e
rro
r 5
.25
4.8
7
4.8
2
5.1
2
.51
2.4
7
2.4
3
2.3
6
4.7
3
5.1
4
.94
4.7
6
Tota
l p
erce
nta
ge
of
erro
r 5
.01
2.4
4
4.8
9
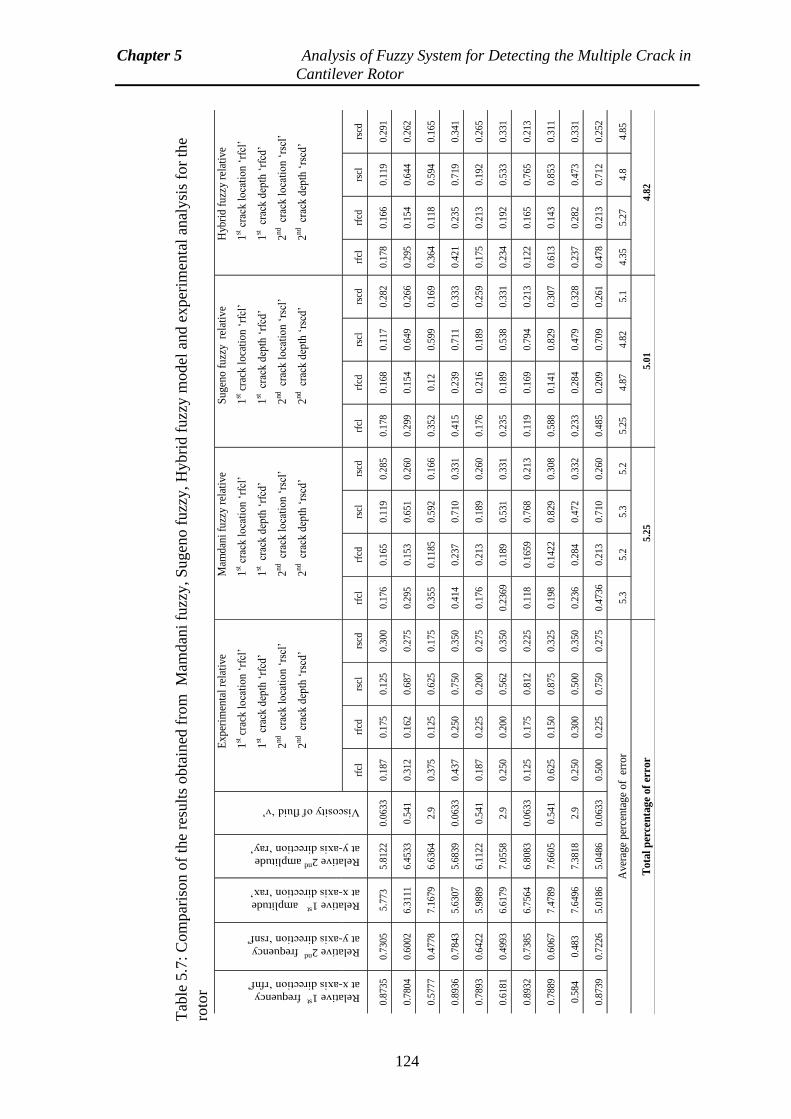
Chapter 5 Analysis of Fuzzy System for Detecting the Multiple Crack in
Cantilever Rotor
124
Tab
le 5
.7:
Com
par
ison o
f th
e re
sult
s obta
ined
fro
m M
amdan
i fu
zzy, S
ugen
o f
uzz
y, H
yb
rid f
uzz
y m
odel
and e
xper
imen
tal
anal
ysi
s fo
r th
e
roto
r
Relative 1st frequency
at x-axis direction ‘rfnf’
Relative 2nd
frequency
at y-axis direction ‘rsnf’
Relative 1st amplitude
at x-axis direction ‘rax’
Relative 2nd
amplitude
at y-axis direction ‘ray’
Viscosity of fluid ‘ν’
Exp
erim
enta
l re
lati
ve
1st c
rack
lo
cati
on
‘rf
cl’
1st cr
ack d
epth
‘rf
cd’
2nd
cr
ack l
oca
tio
n ‘
rscl
’
2nd
cr
ack d
epth
‘rs
cd’
Mam
dan
i fu
zzy r
elat
ive
1st c
rack
lo
cati
on
‘rf
cl’
1st cr
ack d
epth
‘rf
cd’
2nd
cr
ack l
oca
tio
n ‘
rscl
’
2nd
cr
ack d
epth
‘rs
cd’
Su
gen
o f
uzz
y r
elat
ive
1st c
rack
lo
cati
on
‘rf
cl’
1st cr
ack d
epth
‘rf
cd’
2nd
cr
ack l
oca
tio
n ‘
rscl
’
2nd
cr
ack d
epth
‘rs
cd’
Hyb
rid
fu
zzy
rela
tive
1st c
rack
lo
cati
on
‘rf
cl’
1st cr
ack d
epth
‘rf
cd’
2nd
cr
ack l
oca
tio
n ‘
rscl
’
2nd
cr
ack d
epth
‘rs
cd’
rfcl
rf
cd
rscl
rs
cd
rfcl
rf
cd
rscl
rs
cd
rfcl
rf
cd
rscl
rs
cd
rfcl
rf
cd
rscl
rs
cd
0.8
735
0.7
305
5.7
73
5.8
122
0.0
633
0.1
87
0.1
75
0.1
25
0.3
00
0.1
76
0.1
65
0.1
19
0.2
85
0.1
78
0.1
68
0.1
17
0.2
82
0.1
78
0.1
66
0.1
19
0.2
91
0.7
804
0.6
002
6.3
111
6.4
533
0.5
41
0.3
12
0.1
62
0.6
87
0.2
75
0.2
95
0.1
53
0.6
51
0.2
60
0.2
99
0.1
54
0.6
49
0.2
66
0.2
95
0.1
54
0.6
44
0.2
62
0.5
777
0.4
778
7.1
679
6.6
364
2.9
0
.375
0.1
25
0.6
25
0.1
75
0.3
55
0.1
185
0.5
92
0.1
66
0.3
52
0.1
2
0.5
99
0.1
69
0.3
64
0.1
18
0.5
94
0.1
65
0.8
936
0.7
843
5.6
307
5.6
839
0.0
633
0.4
37
0.2
50
0.7
50
0.3
50
0.4
14
0.2
37
0.7
10
0.3
31
0.4
15
0.2
39
0.7
11
0.3
33
0.4
21
0.2
35
0.7
19
0.3
41
0.7
893
0.6
422
5.9
889
6.1
122
0.5
41
0.1
87
0.2
25
0.2
00
0.2
75
0.1
76
0.2
13
0.1
89
0.2
60
0.1
76
0.2
16
0.1
89
0.2
59
0.1
75
0.2
13
0.1
92
0.2
65
0.6
181
0.4
993
6.6
179
7.0
558
2.9
0
.250
0.2
00
0.5
62
0.3
50
0.2
369
0.1
89
0.5
31
0.3
31
0.2
35
0.1
89
0.5
38
0.3
31
0.2
34
0.1
92
0.5
33
0.3
31
0.8
932
0.7
385
6.7
564
6.8
083
0.0
633
0.1
25
0.1
75
0.8
12
0.2
25
0.1
18
0.1
659
0.7
68
0.2
13
0.1
19
0.1
69
0.7
94
0.2
13
0.1
22
0.1
65
0.7
65
0.2
13
0.7
889
0.6
067
7.4
789
7.6
605
0.5
41
0.6
25
0.1
50
0.8
75
0.3
25
0.1
98
0.1
422
0.8
29
0.3
08
0.5
88
0.1
41
0.8
29
0.3
07
0.6
13
0.1
43
0.8
53
0.3
11
0.5
84
0.4
83
7.6
496
7.3
818
2.9
0
.250
0.3
00
0.5
00
0.3
50
0.2
36
0.2
84
0.4
72
0.3
32
0.2
33
0.2
84
0.4
79
0.3
28
0.2
37
0.2
82
0.4
73
0.3
31
0.8
739
0.7
226
5.0
186
5.0
486
0.0
633
0.5
00
0.2
25
0.7
50
0.2
75
0.4
736
0.2
13
0.7
10
0.2
60
0.4
85
0.2
09
0.7
09
0.2
61
0.4
78
0.2
13
0.7
12
0.2
52
Aver
age
per
cen
tag
e o
f e
rro
r 5
.3
5.2
5
.3
5.2
5
.25
4.8
7
4.8
2
5.1
4
.35
5.2
7
4.8
4
.85
Tota
l p
erce
nta
ge
of
erro
r 5
.25
5.0
1
4.8
2
Chapter 5 Analysis of Fuzzy System for Detecting the Multiple Crack in
Cantilever Rotor
125
5.7 Summary
The Mamdani fuzzy, Takagi-Sugeno fuzzy and hybrid fuzzy approaches are implemented
in the present analysis.The following summary can be drawn by considering the results
derived from Mamdani fuzzy, Sugeno fuzzy and hybrid fuzzy models.The two relative
natural frequencies, two relative amplitude and viscosity of fluid are considered as input
parameters and two relative crack locations, two relative crack depths are taken as the
output parameters for proposed fuzzy models. The result derived from the developed
Mamdani fuzzy model, Sugeno fuzzy model and hybrid fuzzy model have been compared
with experimental test results to authenticate the effectiveness of proposed fuzzy
models. The total percentage of error of the obtained result of the Mamdani triangular
fuzzy model is 7.32%, for the Mamdani gaussian fuzzy model is 5.25% and for the
Mamdani trapezoidal fuzzy model is 6.77%. From the analysis result of takagi-sugeno
fuzzy model, It has been observed that the error of the percentage of the obtained result of
the Sugeno triangular fuzzy model is 6.98%, for the sugeno gaussian fuzzy model is
5.01% and for the sugeno trapezoidal fuzzy model is 6.12%.The results found to be good
in agreement. Based on above study, it is found that fuzzy model with gaussian
membership function gives better results as comparison to triangular and trapezoidal
models for both Mamdani and takagi-sugeno fuzzy model. Therefore, the developed
gaussian membership fuzzy controller can be efficiently used as fault diagnosis tools in
dynamically analysis of rotor. The fuzzy based hybrid model gives more precise result as
compared to Mamdani fuzzy and Sugeno fuzzy. It is found that total percentage of error
for hybrid fuzzy model is 4.82 %.
126
Chapter 6
Analysis of Hybrid BPNN-RBFNN Neural
Network for Identification of Multiple
Crack in Cantilever Rotor Partially
Submerged in the Viscous Medium
The presence of damage is a serious threat to proper functioning of structures and
machines. Early detection of damage now has become the subject of serious concern for
the researchers to secure the performance of systems. The efficient structural fault
diagnosis methodology can be a valuable technique for proper identification of crack and
worsening in engineering or industrial structural members. Since the last few years, many
techniques have been applied to identify the fault in the engineering system. Few of them
have used the sensors (Radiograph, Magnetic field, eddy current and thermal fields) to
identify damage and others based on visual method (Dye penetration method). These
methods consume much time to seize the fault in the system. Since last few years, some
mathematical models and experimental investigations have been proposed by the
researchers to determine the crack initiation and propagation. In the current chapter,
intelligent techniques have been applied based on artificial network techniques to locate
the multiple crack, present in the rotor which is rotates in the viscous fluid medium. The
Back Propagation Neural Network (BPNN) and Radial Basis Function Neural Network
(RBFNN) have been used in the present study. Finally, the obtained results from the
proposed neural network model are validated with results of experimental analysis and
show a very well agreement.
6.1 Introduction
The present chapter, proposed an introduction of basic design and development of neural
network controller and learning rule. In a human body, the biological neural network has a
Chapter 6 Analysis of Hybrid BPNN-RBFNN Neural Network for
Identification of Multiple Crack in Cantilever Rotor Partially
Submerged in the Viscous Medium
127
systematized set of neurons, assist for several kinds of output (i.e. breathing, thinking etc.)
The Artificial Neural Networks (ANNs) are simplified models of the biological central
nervous system. ANN is a massively parallel distributed information processing system
made up of highly interconnected neural computing elements that have the ability to learn
and thereby acquire knowledge and make it available for use. Neural network can be used
to distinguish patterns and recognize trends that are more difficult to be remarked by the
humans being or other computer system. Many researchers believe neural models offer a
most promising integrated approach to build truly intelligent computer system. The
biological network able to process millions of input stimuli in milisec even through the
process is electrochemical in nature and, therefore, propagates relatively at slow milisec
rate. Some of its properties of neural network are outlined below;
a) Self-Organization: Neural network can acquire outcomes for inputs that are not used
during training by producing its specific depiction of the information it obtains during
learning time. This ability benefits in resolving the higher level complicated problem.
b) Adaptive learning: The neural network system has the ability to control the altering of
the environment by regulating the synaptic weights and execute as per the condition.
This features of the neural network system can be applied for industrial applications in
non- stationary environment.
c) Real time operation: This feature of the neural network is to compile maximum
number connected neurons employed in parallel to resolve a particular problem. Neural
networks learn by example. For this particular hardware devices are manufactured
which takes advantages of this ability.
d) Non-linearity: Artificial neural networks (ANNs) have ability to solve the non-linear
problems. This capability is tremendously used in the field of structural health
monitoring as the signals from multifaceted structures with inconstant loading.
e) Input-Output mapping: This is the very influential feature of the artificial neural
network which includes controlled learning. The network efforts to associate a single
input signal with a desire response. It revises the synaptic weights by a learning process
in order to achieve the desired response.
f) Fault Tolerance: Neural network is integrally fault tolerant. In case of failure of
neuron in neural network system there will be a partial damage of the network system
which leads to only weakening the excellence of output instead of crumpling the entire
system.
Chapter 6 Analysis of Hybrid BPNN-RBFNN Neural Network for
Identification of Multiple Crack in Cantilever Rotor Partially
Submerged in the Viscous Medium
128
Since last few decades, many researchers have developed a health monitoring algorithm
for the structural elements. The development of structural health monitoring techniques is
a significant achievement of science fraternity because the existence of crack decreases the
service life of the structural element and accountable for commercial damage and in few
cases may be loss of human life. The various non-destructive techniques are available in
the literature for predicting the structural damage, that is not efficient in term of
correctness and computation time for real problems. Moreover the development of
mathematical model for the complicated problems is almost impossible. In the present
analysis, application of ANN with adaptive learning, self-organization capacity, real time
operation, fault tolerance ability and pattern recognition capability are suitable for design
of an automated intelligent system. It is capable for fault recognition with very high
accuracy and less are computation time for faulty dynamic structure. In the present
scenario various scientist continuously engaged for developing a damage detection tool
using ANNs.In this section, three types of ANNs have been discussed (i.e. BPNN and
RBFNN). All two types of ANNs are designed for five input variables (relative first and
second natural frequencies & relative first and second amplitde and viscosity of fluid) and
four output variables (relative first and second crack location and relative first and second
crack depth). A comparison of results obtained from all three ANN models with results
obtained from theoretical, numerical and experimental is done in current chapter. The
RBFNN gives the best results as compared to other discussed ANNs models.
Experimental investigation authenticates the fidelity of neural models.Therefore, it is
decided that the proposed method can be effectively using for multiple crack
identification. The current chapter has been organized into six different segments. Section
6.1 presents the introduction part of neural network technique. The analysis of the ANN
model used for identification of multiple crack have been discussed in section 6.2. The
representation of complete view of the BPNN is presented in section 6.3. The
representation of complete view of the RBFNN is presented in section 6.4. The results and
discussions of the results obtained from BPNN and RBFNN model have been discussed in
section 6.5. Finally the summary of the complete chapter described in section 6.6.
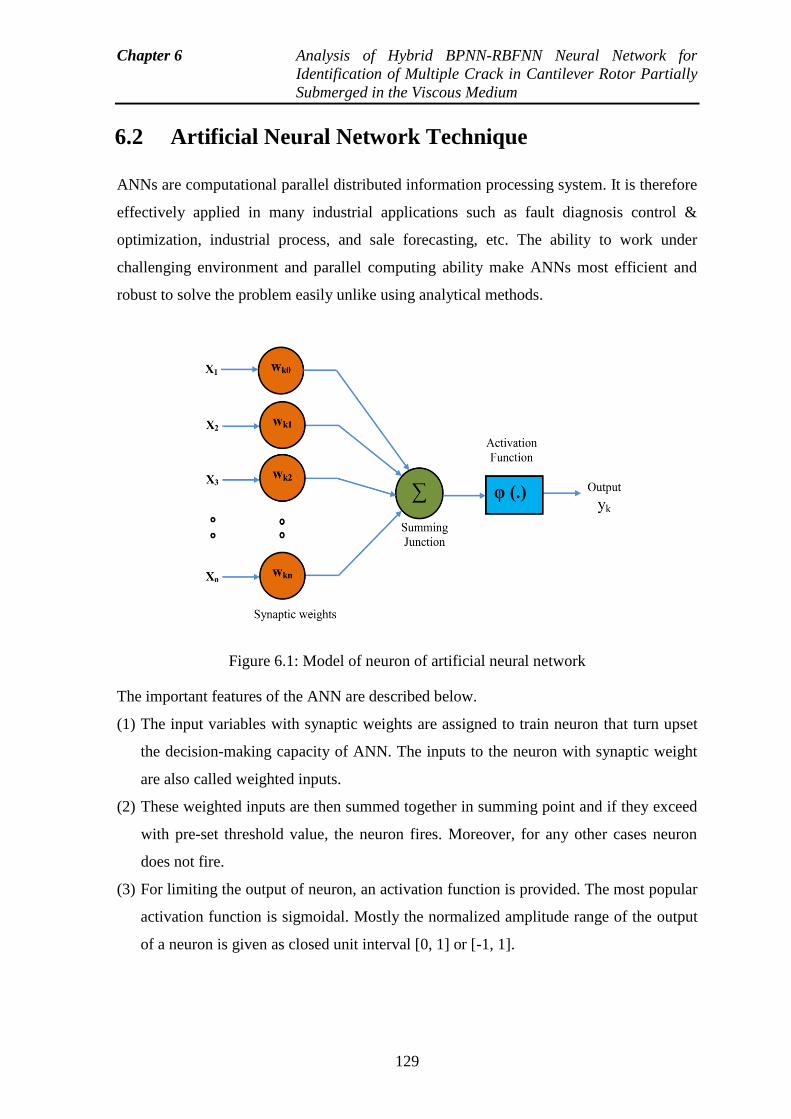
Chapter 6 Analysis of Hybrid BPNN-RBFNN Neural Network for
Identification of Multiple Crack in Cantilever Rotor Partially
Submerged in the Viscous Medium
129
6.2 Artificial Neural Network Technique
ANNs are computational parallel distributed information processing system. It is therefore
effectively applied in many industrial applications such as fault diagnosis control &
optimization, industrial process, and sale forecasting, etc. The ability to work under
challenging environment and parallel computing ability make ANNs most efficient and
robust to solve the problem easily unlike using analytical methods.
Figure 6.1: Model of neuron of artificial neural network
The important features of the ANN are described below.
(1) The input variables with synaptic weights are assigned to train neuron that turn upset
the decision-making capacity of ANN. The inputs to the neuron with synaptic weight
are also called weighted inputs.
(2) These weighted inputs are then summed together in summing point and if they exceed
with pre-set threshold value, the neuron fires. Moreover, for any other cases neuron
does not fire.
(3) For limiting the output of neuron, an activation function is provided. The most popular
activation function is sigmoidal. Mostly the normalized amplitude range of the output
of a neuron is given as closed unit interval [0, 1] or [-1, 1].
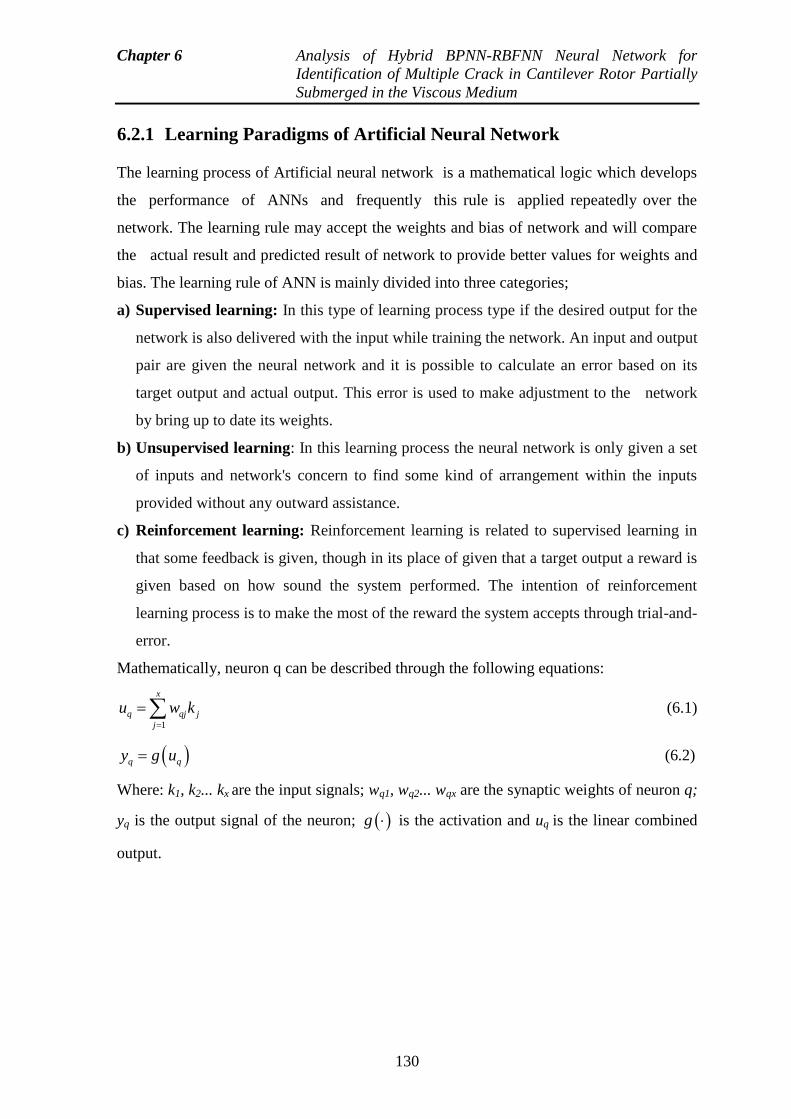
Chapter 6 Analysis of Hybrid BPNN-RBFNN Neural Network for
Identification of Multiple Crack in Cantilever Rotor Partially
Submerged in the Viscous Medium
130
6.2.1 Learning Paradigms of Artificial Neural Network
The learning process of Artificial neural network is a mathematical logic which develops
the performance of ANNs and frequently this rule is applied repeatedly over the
network. The learning rule may accept the weights and bias of network and will compare
the actual result and predicted result of network to provide better values for weights and
bias. The learning rule of ANN is mainly divided into three categories;
a) Supervised learning: In this type of learning process type if the desired output for the
network is also delivered with the input while training the network. An input and output
pair are given the neural network and it is possible to calculate an error based on its
target output and actual output. This error is used to make adjustment to the network
by bring up to date its weights.
b) Unsupervised learning: In this learning process the neural network is only given a set
of inputs and network's concern to find some kind of arrangement within the inputs
provided without any outward assistance.
c) Reinforcement learning: Reinforcement learning is related to supervised learning in
that some feedback is given, though in its place of given that a target output a reward is
given based on how sound the system performed. The intention of reinforcement
learning process is to make the most of the reward the system accepts through trial-and-
error.
Mathematically, neuron q can be described through the following equations:
1
x
q qj j
j
u w k
(6.1)
q qy g u (6.2)
Where: k1, k2... kx are the input signals; wq1, wq2... wqx are the synaptic weights of neuron q;
yq is the output signal of the neuron; g is the activation and uq is the linear combined
output.
Chapter 6 Analysis of Hybrid BPNN-RBFNN Neural Network for
Identification of Multiple Crack in Cantilever Rotor Partially
Submerged in the Viscous Medium
131
6.3 Analysis of Feed Forward Back Propagation Neural
Network Controller used for Multiple Crack
Identification in Rotor
The proposed multilayer feed forward neural network controller trained by back-
propagation algorithm has been built for the prediction of relative crack depth and relative
crack location of the cantilever rotor partially submerged in the viscous medium. (Figure
6.3.). The neural network has got five input parameters (two relative natural frequency in
x and y-axis directions, two relative amplitude in x and y- axis directions and viscosity of
fluid) and four output parameters (first and second relative crack location and depths).Five
input parameters have been taken from the experimental results.
6.3.1 Learning Back Propagation Technique
The feed forward multilayer neural network has been trained using the back propagation
technique (Figure 6.2). The backpropagation technique is based on delta learning rule in
which the synaptic weight modification is ended by the mean square error of the output
value to the input value. This technique computes the loss function gradient for all the
weights in the network. The gradient is supplied to the optimization method which uses it
to bring up to date the synaptic weights, in an order to reduce the loss function. To
computes the gradient of a loss function, backpropagation requires a known and desired
output for each input value. Each hidden layer error in an opposite way towards the
propagate movement by the network to be calculated and supply to the network using
back propagation algorithm to reduce the error in the actual output value and desired
output value. It is considered as a supervised learning method while it is also used in some
unsupervised networks such as auto-encoders.
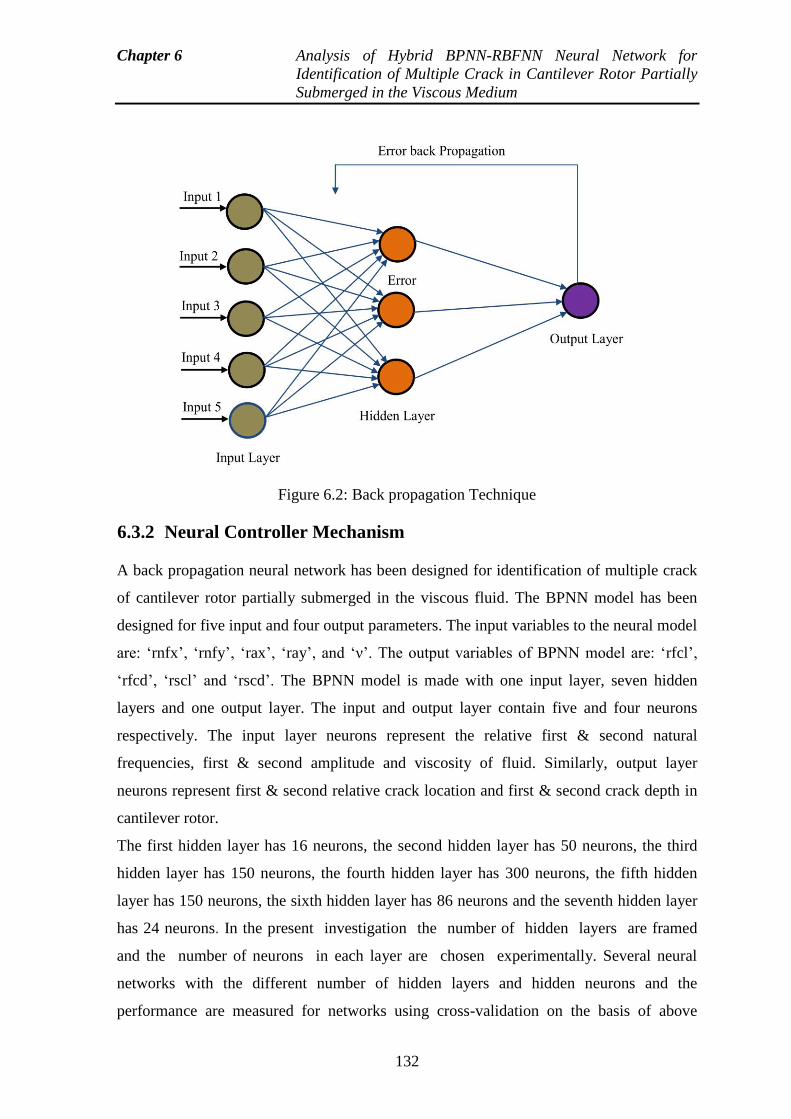
Chapter 6 Analysis of Hybrid BPNN-RBFNN Neural Network for
Identification of Multiple Crack in Cantilever Rotor Partially
Submerged in the Viscous Medium
132
Figure 6.2: Back propagation Technique
6.3.2 Neural Controller Mechanism
A back propagation neural network has been designed for identification of multiple crack
of cantilever rotor partially submerged in the viscous fluid. The BPNN model has been
designed for five input and four output parameters. The input variables to the neural model
are: ‘rnfx’, ‘rnfy’, ‘rax’, ‘ray’, and ‘ν’. The output variables of BPNN model are: ‘rfcl’,
‘rfcd’, ‘rscl’ and ‘rscd’. The BPNN model is made with one input layer, seven hidden
layers and one output layer. The input and output layer contain five and four neurons
respectively. The input layer neurons represent the relative first & second natural
frequencies, first & second amplitude and viscosity of fluid. Similarly, output layer
neurons represent first & second relative crack location and first & second crack depth in
cantilever rotor.
The first hidden layer has 16 neurons, the second hidden layer has 50 neurons, the third
hidden layer has 150 neurons, the fourth hidden layer has 300 neurons, the fifth hidden
layer has 150 neurons, the sixth hidden layer has 86 neurons and the seventh hidden layer
has 24 neurons. In the present investigation the number of hidden layers are framed
and the number of neurons in each layer are chosen experimentally. Several neural
networks with the different number of hidden layers and hidden neurons and the
performance are measured for networks using cross-validation on the basis of above
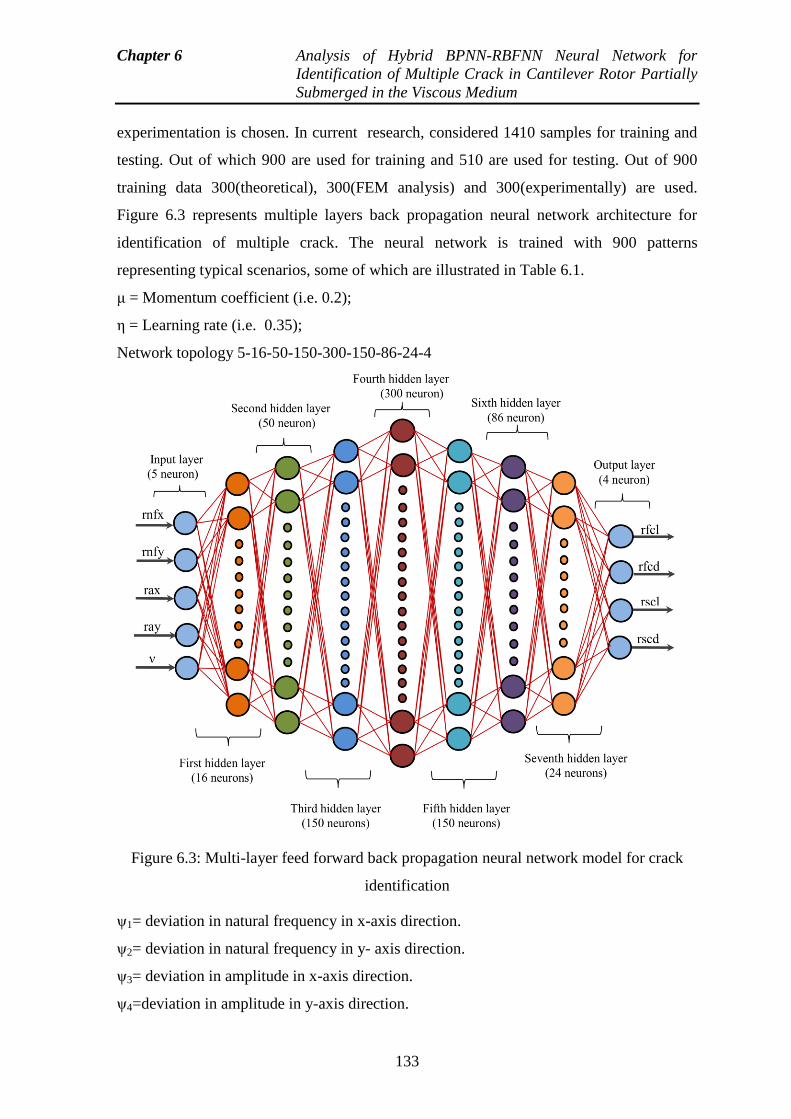
Chapter 6 Analysis of Hybrid BPNN-RBFNN Neural Network for
Identification of Multiple Crack in Cantilever Rotor Partially
Submerged in the Viscous Medium
133
experimentation is chosen. In current research, considered 1410 samples for training and
testing. Out of which 900 are used for training and 510 are used for testing. Out of 900
training data 300(theoretical), 300(FEM analysis) and 300(experimentally) are used.
Figure 6.3 represents multiple layers back propagation neural network architecture for
identification of multiple crack. The neural network is trained with 900 patterns
representing typical scenarios, some of which are illustrated in Table 6.1.
μ = Momentum coefficient (i.e. 0.2);
η = Learning rate (i.e. 0.35);
Network topology 5-16-50-150-300-150-86-24-4
Figure 6.3: Multi-layer feed forward back propagation neural network model for crack
identification
ψ1= deviation in natural frequency in x-axis direction.
ψ2= deviation in natural frequency in y- axis direction.
ψ3= deviation in amplitude in x-axis direction.
ψ4=deviation in amplitude in y-axis direction.
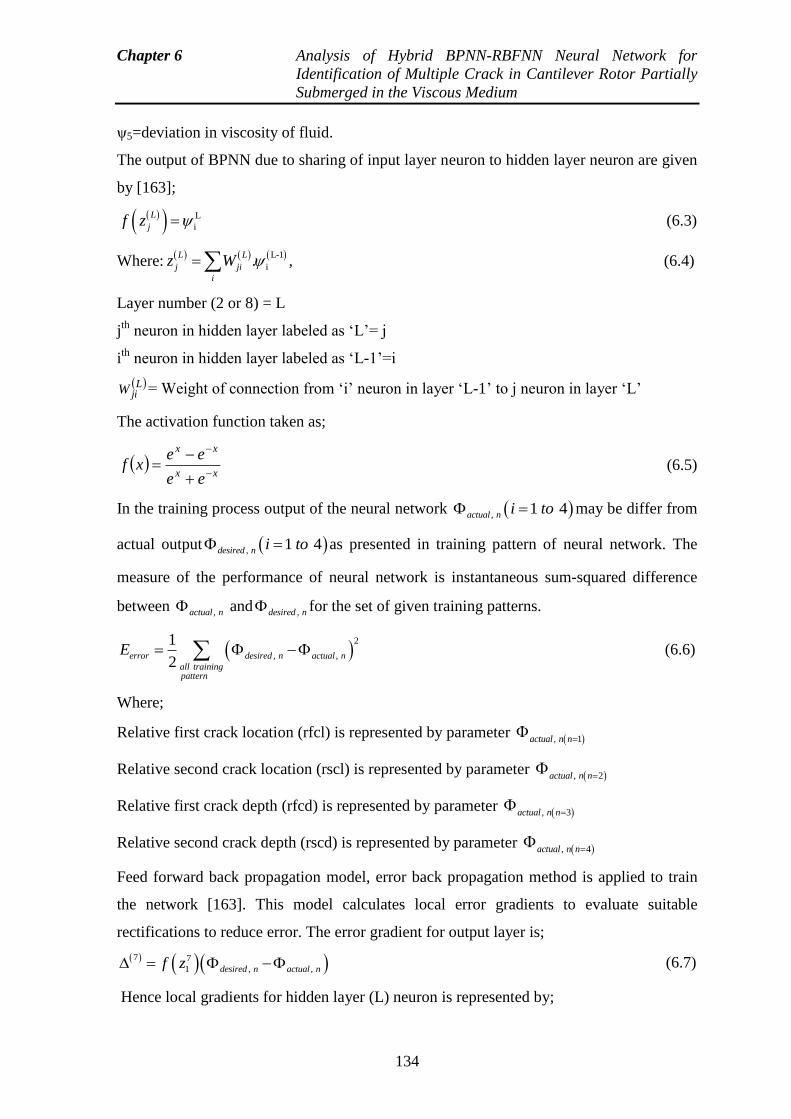
Chapter 6 Analysis of Hybrid BPNN-RBFNN Neural Network for
Identification of Multiple Crack in Cantilever Rotor Partially
Submerged in the Viscous Medium
134
ψ5=deviation in viscosity of fluid.
The output of BPNN due to sharing of input layer neuron to hidden layer neuron are given
by [163];
L
i
L
jf z (6.3)
Where: L-1
i.L L
j ji
i
z W , (6.4)
Layer number (2 or 8) = L
jth
neuron in hidden layer labeled as ‘L’= j
ith
neuron in hidden layer labeled as ‘L-1’=i
LjiW = Weight of connection from ‘i’ neuron in layer ‘L-1’ to j neuron in layer ‘L’
The activation function taken as;
xx
xx
ee
eexf
(6.5)
In the training process output of the neural network , 1 4actual n i to may be differ from
actual output , 1 4desired n i to as presented in training pattern of neural network. The
measure of the performance of neural network is instantaneous sum-squared difference
between , actual n and , desired n for the set of given training patterns.
2
, ,
1
2error desired n actual n
all trainingpattern
E (6.6)
Where;
Relative first crack location (rfcl) is represented by parameter , 1actual n n
Relative second crack location (rscl) is represented by parameter , 2actual n n
Relative first crack depth (rfcd) is represented by parameter , 3actual n n
Relative second crack depth (rscd) is represented by parameter , 4actual n n
Feed forward back propagation model, error back propagation method is applied to train
the network [163]. This model calculates local error gradients to evaluate suitable
rectifications to reduce error. The error gradient for output layer is;
7 7
1 , , desired n actual nf z (6.7)
Hence local gradients for hidden layer (L) neuron is represented by;
Chapter 6 Analysis of Hybrid BPNN-RBFNN Neural Network for
Identification of Multiple Crack in Cantilever Rotor Partially
Submerged in the Viscous Medium
135
1 1
L L L L
j J k kj
k
f z W
(6.8)
The weights are modified as per the following terms;
1 1ji ji jiW W W (6.9)
L-1
j1 L
ji ji ji jW W W (6.10)
Where α (momentum co-efficient) = 0.2 (chosen statically)
η (learning rate) = 0.35 (chosen statically)
φ = iteration number
The final output of the feed forward back propagation can be expressed as;
9
, actual n nf z (6.11)
Where 9 9 8
i n ni
i
z W
6.4 Analysis of Radial Basis Function Neural Network used
for Multiple Crack Identification in Rotor
The radial basis function neural network, as a type of feed-forward neural network has
recently attracted extensive research interest because of its simple architecture, high
approximation and regularization capability, and good local specialization and global
generalization ability. RBFNN is a powerful technique for interpolation in multi-
dimensional space. The RBFNN chosen is usually a gaussian-kernel transfer function, the
response of such a function is positive for all input values.
6.4.1 RBFNN Mechanism for Identification the Multiple Crack
Radial basis function neural network (RBFNN) model typically have three layers. The
first layer is linear and only distributes the input signal, while the next layer is nonlinear
and uses gaussian functions. The third layer linearly combines the gaussian outputs. The
nodes of each layer are completely linked to the previous layer. Each node of the input
layers have been assigned by the input variable and transformed directly towards the
hidden layer without weights. RBF contained by the hidden nodes, called as the transfer
functions. RBF is symmetrical about a given center point in a multi-dimensional space.
Number of hidden node of layer with RBF activation functions are connected in a feed
Chapter 6 Analysis of Hybrid BPNN-RBFNN Neural Network for
Identification of Multiple Crack in Cantilever Rotor Partially
Submerged in the Viscous Medium
136
forward parallel manner in the RBFN model. The RBFs related parameters are enhanced
for the duration of training. These values of parameter are not essentially the same all over
the network nor are they directly associated by the actual training vectors. When the
training vectors are supposed to be precise and it is required to implement a smooth
interpolation between them, then a linear combination of RBFs can be established which
provide no error at the training vectors. The methods of fitting RBFs to data, for function
approximation, are closely related to distance weighted regression.
2
1
expG
k kj j j
j
Y x w c x
(6.12)
Where kY x = thk output, kjw = weight from the thj kernel node to the thk output node,
jc = centroid of the thi kernel node, j =width of the thj kernel node and G = number of
kernel nodes. Generally jc are selected constantly by the parameters
kjw ,jc and
j .The
singular value decomposed (SVD) are employed to solve the kjw and
j . Leonard et al
[209] have proposed the enhance and better methodology include using K -means
clustering for finding thejc . K -nearest heuristic to evaluate the
je .kjw is evaluated using
multiple linear regression. The K -means clustering algorithm determine a set of cluster
centers and splits the training data into subsets. Every center of cluster is then linked with
one of the centers presented in the hidden layer.
After the centers are established the width of each kernel is determined to cover the
training points. To allow a smooth fit of the desired network outputs. The width is selected
so that j is greater than the distance to the nearest kernel center but also as small as
possible to keep its distance of influence to its local region. For designing the radial basis
function unit algorithms are used which are discussed in detail below. Consider training a
model that has ‘r’ inputs. Because all inputs are associated to the hidden node, each node
has r-dimensions center but only one width value is used to scale all r-dimensions.The
prearrangement of the value of these centers and widths is discussed below.
Let tx be the received vector with modules 1tx , 2tx ,……….., rtx . The output of the thj unit,
j tu x , in the hidden layer for this input pattern is;
2
2
1
expr
j t it ij j
i
u x x x
(6.13)
Chapter 6 Analysis of Hybrid BPNN-RBFNN Neural Network for
Identification of Multiple Crack in Cantilever Rotor Partially
Submerged in the Viscous Medium
137
Where ijx is the center of thj radial basis function unit for input variable i,
j is the
width of the thj RBF unit and itx is the ith
variable of the pattern. The connection between
the hidden layer units and output layer units are weight sums. The output value ( mtY ) of
the mth
output node is equal to the summation of the weighted outputs of the hidden units,
given by;
1
expH
mt jm j k
j
Y w u x
(6.14)
Where H is denoted the quantity of hidden nodes, mtY is represented the output value of
the mth
node in the third layer(i.e. output layer) for the tth
received pattern, jmw is the
weight between the jth
unit of radial basis function which is calculated by three steps of
the training action:
(1) The centers of RBF unit are identified by a ‘K-means’ clustering algorithm.
(2) The nearest-neighbor approaches are used to find the width.
(3) By applying the multiple linear regression techniques to determine the output unit and
also the weights linking the RBF units.
6.4.1.1 Finding the Centers of RBF Unit
We can use any clustering algorithm for evaluation of RBF unit centers. The K-means
clustering algorithm has been used to determined a set of cluster from a particular data.
The numbers of input variable of the first layer (i.e. input layer) are used to calculate the
dimensions of the RBF unit centers. The centers of the RBF units are coincident to the
clusters centers. The K-means clustering algorithm begins as follows:
1. Altered arbitrarily selected training pattern has been used for adjusting the
development of each cluster.
2. Allocate each training pattern to closest cluster. It can be completed by determining
the Euclidean distance between the cluster centers and the training patterns.
3. Compute the average location for each other center after allocating all the training
patterns. Then they become a fresh cluster centers.
4. The steps 2 and 3 repeats, until the cluster centers do not changed for the period of the
successive iteration.
Chapter 6 Analysis of Hybrid BPNN-RBFNN Neural Network for
Identification of Multiple Crack in Cantilever Rotor Partially
Submerged in the Viscous Medium
138
6.4.1.2 Finding the Width of RBF Unit
After allocating the centers of RBF unit, the width of RBF unit can be detrmined. The
width of any RBF distance to the closest q of RBF units.
Where q is represent as a design parameter for the RBFN network, for unit is given by
2
1 1
1 q r
j kj ki
i k
x xQ
(6.15)
Where kjx and
kix are the kth
items of the centers of the jth
and ith
hidden RBF units.
This algorithm section determines the required centers and width of the RBF unit.
6.4.1.3 Finding the Weights
When the centers and widths of the RBF units have been selected, then the N training
patterns are processed through the hidden nodes to generate an NxN matrix, called D. Let
T be the MxN desired output nodes. The aim is to determine the weights that decreases the
error between the actual output and the desired output of the RBF network.
Essentially, we are trying to minimize the objective function.
z WD (6.16)
Where W is the T × N matrix of weights on the links between the hidden node and output
nodes of the network. The selection of weights between the hidden layer and the output
layer of network is determined using linear least square regression.The result to the earlier
equation can be acquired using the pseudo-inverse of D and is given by;
1( )T TW ZD DD (6.17)
6.4.1.4 Selection of H and q
The design parameters, i.e. the number of RBF units in the hidden layer ‘H’ and the value
of overlap parameter ‘q’ for the nearest neighbor method, are selected by the model
builder to achieve the optimal RBF network structure for better performance. The
parameters can be easily determined by using an S-fold cross-validation method (SFCV)
[210], the procedure is as follows:
(1) Training data are arbitrarily separated into P equal sized sets.
(2) RBFNN is trained using P -1 data sets for a given set H and q.
(3) The remaining subset is used to test the network’s local specialization and global
generalization ability.
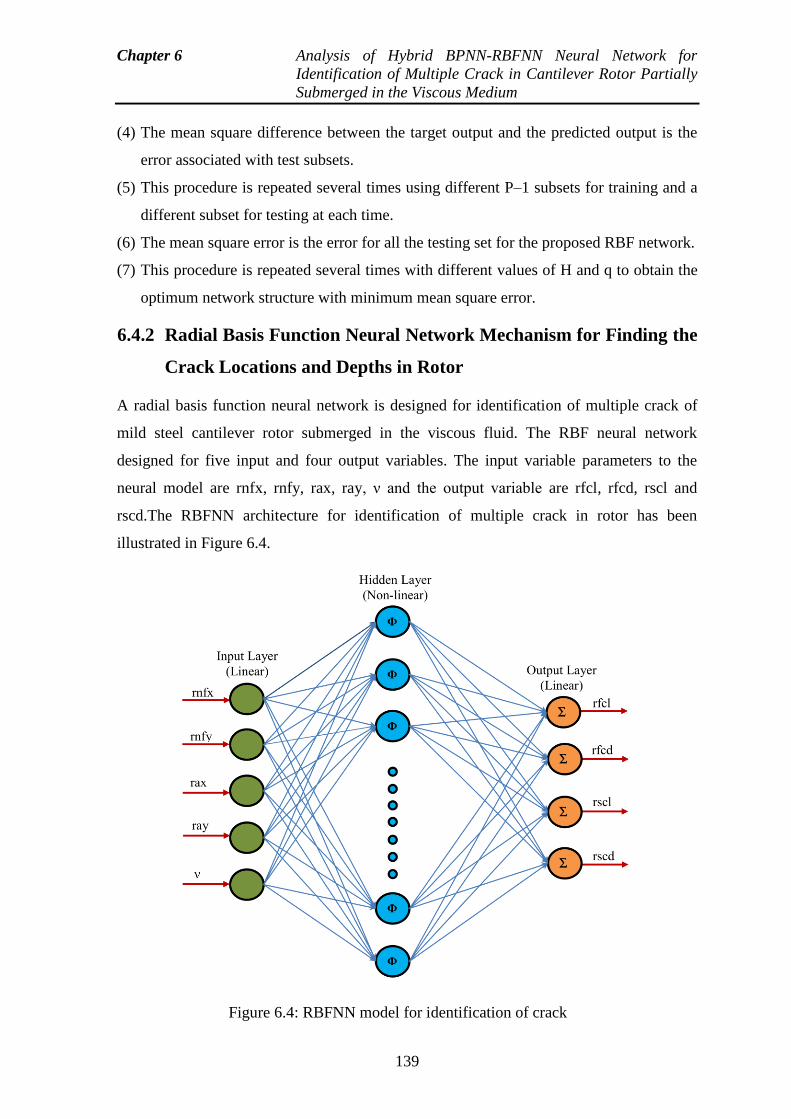
Chapter 6 Analysis of Hybrid BPNN-RBFNN Neural Network for
Identification of Multiple Crack in Cantilever Rotor Partially
Submerged in the Viscous Medium
139
(4) The mean square difference between the target output and the predicted output is the
error associated with test subsets.
(5) This procedure is repeated several times using different P–1 subsets for training and a
different subset for testing at each time.
(6) The mean square error is the error for all the testing set for the proposed RBF network.
(7) This procedure is repeated several times with different values of H and q to obtain the
optimum network structure with minimum mean square error.
6.4.2 Radial Basis Function Neural Network Mechanism for Finding the
Crack Locations and Depths in Rotor
A radial basis function neural network is designed for identification of multiple crack of
mild steel cantilever rotor submerged in the viscous fluid. The RBF neural network
designed for five input and four output variables. The input variable parameters to the
neural model are rnfx, rnfy, rax, ray, ν and the output variable are rfcl, rfcd, rscl and
rscd.The RBFNN architecture for identification of multiple crack in rotor has been
illustrated in Figure 6.4.
Figure 6.4: RBFNN model for identification of crack
Chapter 6 Analysis of Hybrid BPNN-RBFNN Neural Network for
Identification of Multiple Crack in Cantilever Rotor Partially
Submerged in the Viscous Medium
140
6.5 Hybrid BPNN-RBFNN Neural Network Mechanism
for Finding the Multiple Crack Locations and Crack
Depths
This section introduces the mechanism of hybrid BPNN-RBFNN neural network for
finding the multiple crack in cantilever rotor partially immersed in the viscous fluid
medium. A novel hybrid BPNN-RBFNN neural network technique has been designed to
identifying the locations and depths of multiple crack in cantilever rotor. Hybrid BPNN-
RBFNN neural network controller has been designed with combination of BPNN and
RBFNN controller. The extracted dynamic response from the theoretical, finite element
and experimental analysis are used to train the hybrid BPNN-RBFNN neural network
model.first & second relative natural frequency, first & second relative amplitude and
viscosity of fluid are used as input parameters to a BPNN controller and rfcl_interim,
rfcd_interim, rscl_interim, rscd_interim are the outputs from the BPNN controller. The
output from the BPNN controller along with first & second relative natural frequency, first
& second relative amplitude and viscosity of fluid are fed to the RBFNN controller.
Finally, rfcl_final, rfcd_final, rscl_final, rscd_final are the output parameters from the
hybrid BPNN-RBFNN model. The detail architecture of the hybrid fuzzy-rule base
controller model has been shown in Figure 6.6.
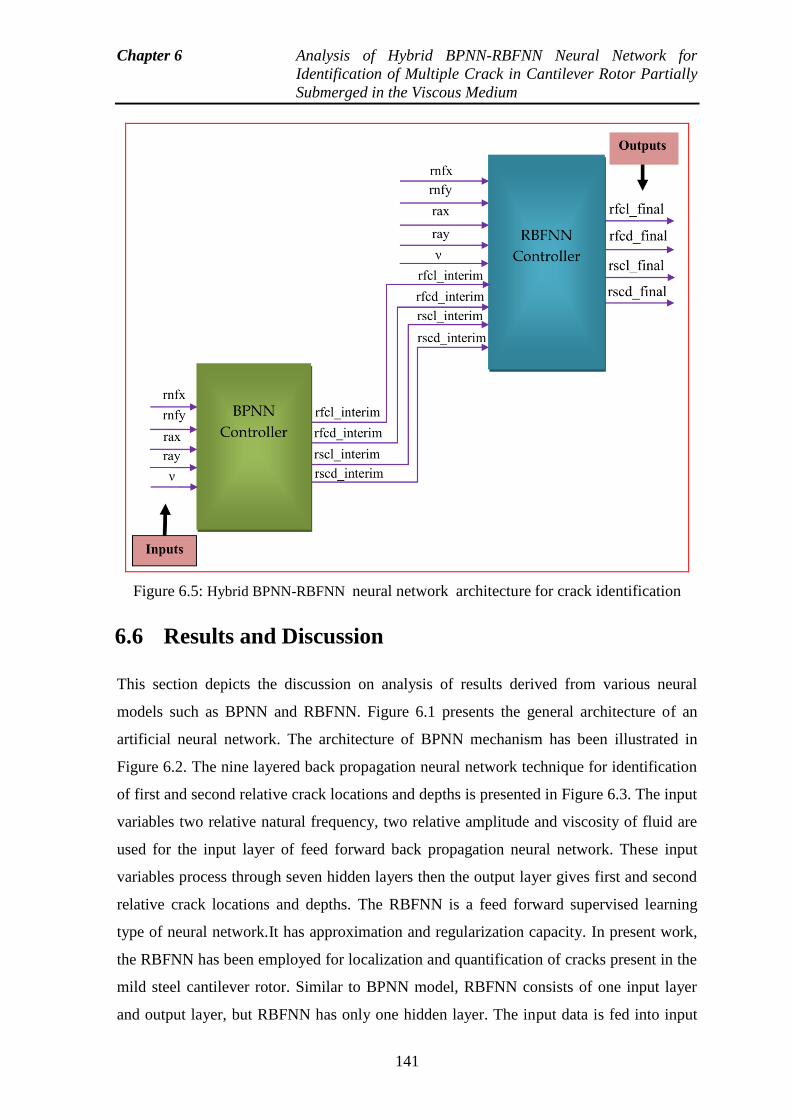
Chapter 6 Analysis of Hybrid BPNN-RBFNN Neural Network for
Identification of Multiple Crack in Cantilever Rotor Partially
Submerged in the Viscous Medium
141
Figure 6.5: Hybrid BPNN-RBFNN neural network architecture for crack identification
6.6 Results and Discussion
This section depicts the discussion on analysis of results derived from various neural
models such as BPNN and RBFNN. Figure 6.1 presents the general architecture of an
artificial neural network. The architecture of BPNN mechanism has been illustrated in
Figure 6.2. The nine layered back propagation neural network technique for identification
of first and second relative crack locations and depths is presented in Figure 6.3. The input
variables two relative natural frequency, two relative amplitude and viscosity of fluid are
used for the input layer of feed forward back propagation neural network. These input
variables process through seven hidden layers then the output layer gives first and second
relative crack locations and depths. The RBFNN is a feed forward supervised learning
type of neural network.It has approximation and regularization capacity. In present work,
the RBFNN has been employed for localization and quantification of cracks present in the
mild steel cantilever rotor. Similar to BPNN model, RBFNN consists of one input layer
and output layer, but RBFNN has only one hidden layer. The input data is fed into input
Chapter 6 Analysis of Hybrid BPNN-RBFNN Neural Network for
Identification of Multiple Crack in Cantilever Rotor Partially
Submerged in the Viscous Medium
142
layer. Output layer gives relative crack locations and relative crack depths. Figure 6.4
illustrates the architecture of RBFNN for identification of multiple crack. The hybrid
BPNN-RBFNN model is the combination of the BPNN and RBFNN controller has been
implemented. Figure 6.5 represents the architecture of the hybrid BPNN-RBFNN
controller for finding the multiple crack in rotor.The results obtained from BPNN model,
FEA, theoretical compared with the experimental analysis are presented in Table 6.1.The
results obtained from RBFNN model, FEA, theoretical compared with the experimental
analysis are presented in Table 6.2. The results obtained from BPNN, RBFNN, Mamdani
fuzzy gaussian model and experimental analysis has been compared in Tables 6.3. The
results obtained from the BPNN, RBFNN, hybrid BPNN-RBFNN model and experimental
analysis has been compared in Table 6.4. The results obtained from BPNN, RBFNN,
hybrid BPNN-RBFNN model and experimental test are compared, and close agreement is
observed between each other. It is observed that the hybrid BPNN-RBFNN model gives
better results as compared to BPNN, RBFNN and Mamdani fuzzy gaussian model for
cracked rotor.The obtained results from the developed hybrid BPNN-RBFNN model,
BPNN, RBFNN and experimental analysis has been compared in Table 6.4 for the rotor
and proximity found between them. It has been observed that the hybrid BPNN-RBFNN
model provides the better result as compared to BPNN and RBFNN model.
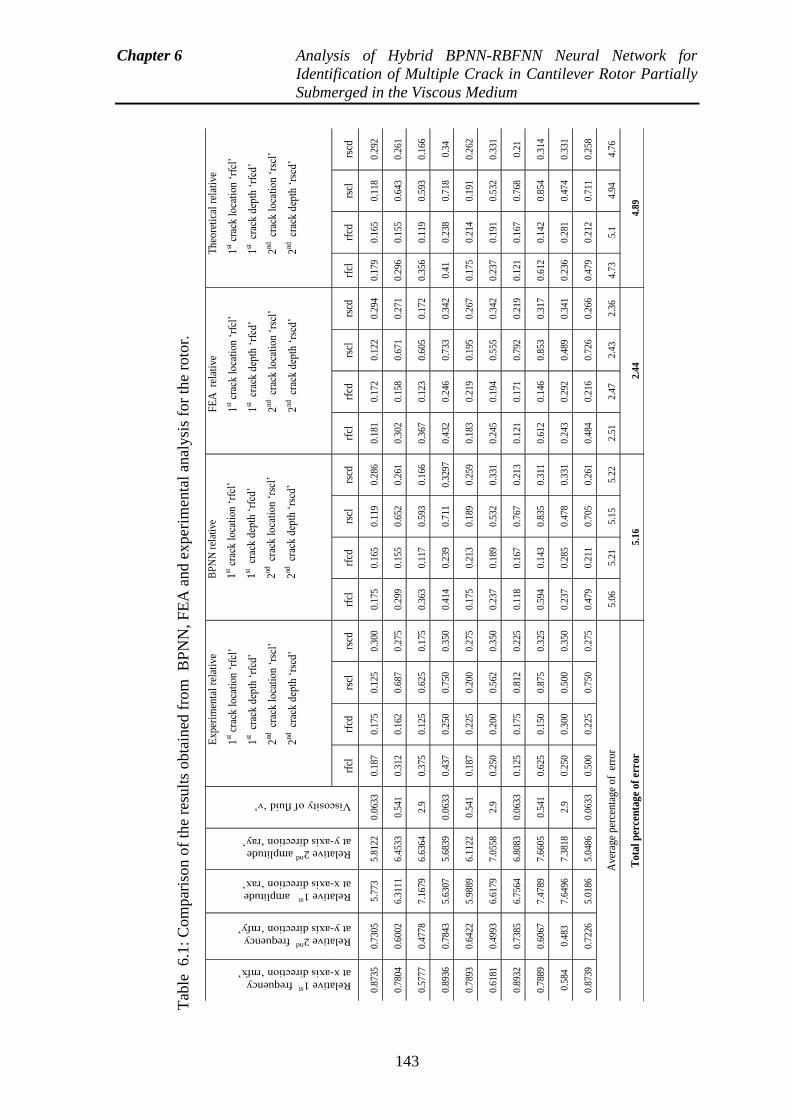
Chapter 6 Analysis of Hybrid BPNN-RBFNN Neural Network for
Identification of Multiple Crack in Cantilever Rotor Partially
Submerged in the Viscous Medium
143
Tab
le 6.1
: C
om
par
ison o
f th
e re
sult
s obta
ined
fro
m B
PN
N,
FE
A a
nd e
xper
imen
tal
anal
ysi
s fo
r th
e ro
tor.
Relative 1st frequency
at x-axis direction ‘rnfx’
Relative 2nd
frequency
at y-axis direction ‘rnfy’
Relative 1st amplitude
at x-axis direction ‘rax’
Relative 2nd
amplitude
at y-axis direction ‘ray’
Viscosity of fluid ‘ν’
Exp
erim
enta
l re
lati
ve
1st c
rack
lo
cati
on ‘
rfcl
’
1st c
rack
dep
th ‘
rfcd
’
2nd
cr
ack
loca
tio
n ‘
rscl
’
2nd
cr
ack
dep
th ‘
rscd
’
BP
NN
rel
ativ
e
1st c
rack
lo
cati
on ‘
rfcl
’
1st c
rack
dep
th ‘
rfcd
’
2nd
cr
ack
loca
tio
n ‘
rscl
’
2nd
cr
ack
dep
th ‘
rscd
’
FE
A
rela
tive
1st c
rack
lo
cati
on ‘
rfcl
’
1st c
rack
dep
th ‘
rfcd
’
2nd
cr
ack
loca
tio
n ‘
rscl
’
2nd
cr
ack
dep
th ‘
rscd
’
Th
eore
tica
l re
lati
ve
1st c
rack
lo
cati
on ‘
rfcl
’
1st c
rack
dep
th ‘
rfcd
’
2nd
cr
ack
loca
tio
n ‘
rscl
’
2nd
cr
ack
dep
th ‘
rscd
’
rfcl
rf
cd
rscl
rs
cd
rfcl
rf
cd
rscl
rs
cd
rfcl
rf
cd
rscl
rs
cd
rfcl
rf
cd
rscl
rs
cd
0.8
735
0.7
305
5.7
73
5.8
122
0.0
633
0.1
87
0.1
75
0.1
25
0.3
00
0.1
75
0.1
65
0.1
19
0.2
86
0.1
81
0.1
72
0.1
22
0.2
94
0.1
79
0.1
65
0.1
18
0.2
92
0.7
804
0.6
002
6.3
111
6.4
533
0.5
41
0.3
12
0.1
62
0.6
87
0.2
75
0.2
99
0.1
55
0.6
52
0.2
61
0.3
02
0.1
58
0.6
71
0.2
71
0.2
96
0.1
55
0.6
43
0.2
61
0.5
777
0.4
778
7.1
679
6.6
364
2.9
0
.375
0
.125
0
.625
0
.175
0
.363
0
.117
0
.593
0
.166
0
.367
0
.123
0
.605
0
.172
0
.356
0
.119
0
.593
0
.166
0.8
936
0.7
843
5.6
307
5.6
839
0.0
633
0.4
37
0.2
50
0.7
50
0.3
50
0.4
14
0.2
39
0.7
11
0.3
297
0.4
32
0.2
46
0.7
33
0.3
42
0.4
1 0
.238
0
.718
0
.34
0.7
893
0.6
422
5.9
889
6.1
122
0.5
41
0.1
87
0.2
25
0.2
00
0.2
75
0.1
75
0.2
13
0.1
89
0.2
59
0.1
83
0.2
19
0.1
95
0.2
67
0.1
75
0.2
14
0.1
91
0.2
62
0.6
181
0.4
993
6.6
179
7.0
558
2.9
0
.250
0
.200
0
.562
0
.350
0
.237
0
.189
0
.532
0
.331
0
.245
0
.194
0
.555
0
.342
0
.237
0
.191
0
.532
0
.331
0.8
932
0.7
385
6.7
564
6.8
083
0.0
633
0.1
25
0.1
75
0.8
12
0.2
25
0.1
18
0.1
67
0.7
67
0.2
13
0.1
21
0.1
71
0.7
92
0.2
19
0.1
21
0.1
67
0.7
68
0.2
1
0.7
889
0.6
067
7.4
789
7.6
605
0.5
41
0.6
25
0.1
50
0.8
75
0.3
25
0.5
94
0.1
43
0.8
35
0.3
11
0.6
12
0.1
46
0.8
53
0.3
17
0.6
12
0.1
42
0.8
54
0.3
14
0.5
84
0.4
83
7.6
496
7.3
818
2.9
0
.250
0
.300
0
.500
0
.350
0
.237
0
.285
0
.478
0
.331
0
.243
0
.292
0
.489
0
.341
0
.236
0
.281
0
.474
0
.331
0.8
739
0.7
226
5.0
186
5.0
486
0.0
633
0.5
00
0.2
25
0.7
50
0.2
75
0.4
79
0.2
11
0.7
05
0.2
61
0.4
84
0.2
16
0.7
26
0.2
66
0.4
79
0.2
12
0.7
11
0.2
58
Ave
rage
per
cen
tag
e o
f e
rro
r 5
.06
5.2
1 5
.15
5.2
2 2
.51
2.4
7 2
.43
2.3
6 4
.73
5.1
4
.94
4.7
6
Tota
l p
erce
nta
ge
of
erro
r 5
.16
2.4
4
4.8
9
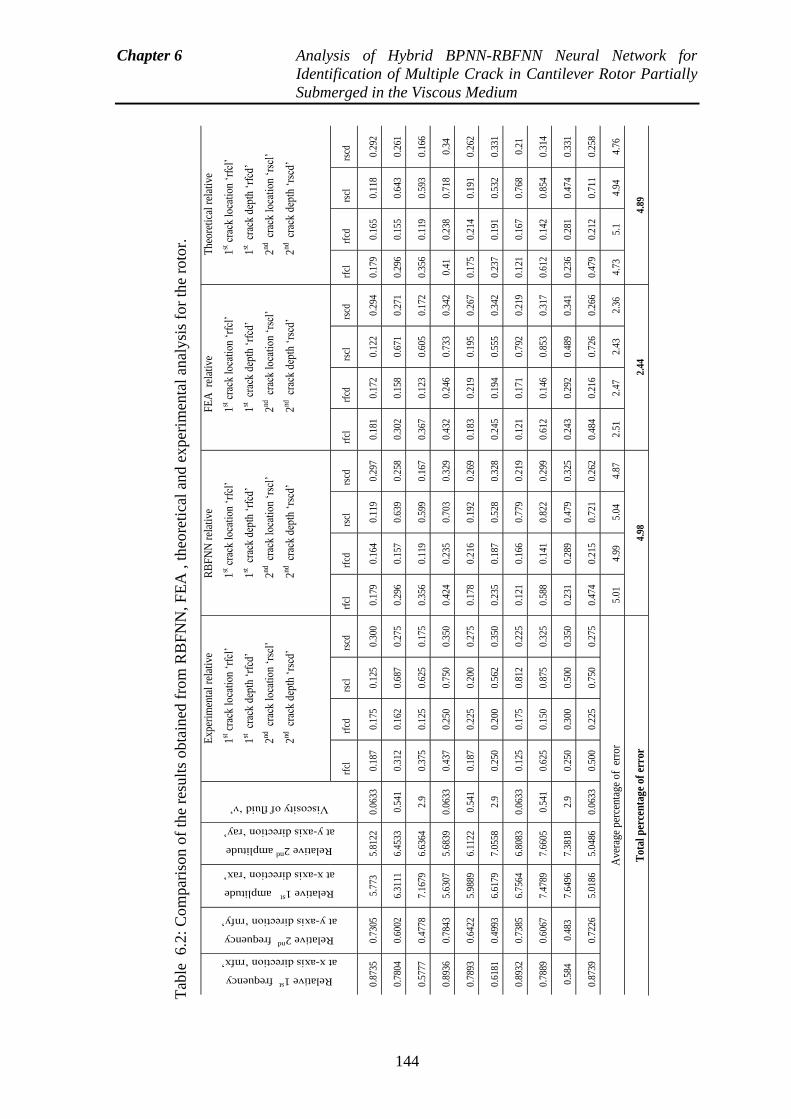
Chapter 6 Analysis of Hybrid BPNN-RBFNN Neural Network for
Identification of Multiple Crack in Cantilever Rotor Partially
Submerged in the Viscous Medium
144
Tab
le 6.2
: C
om
par
ison o
f th
e re
sult
s obta
ined
fro
m R
BF
NN
, F
EA
, t
heo
reti
cal
and e
xper
imen
tal
anal
ysi
s fo
r th
e ro
tor.
Relative 1st frequency
at x-axis direction ‘rnfx’
Relative 2nd
frequency
at y-axis direction ‘rnfy’
Relative 1st amplitude
at x-axis direction ‘rax’
Relative 2nd
amplitude
at y-axis direction ‘ray’
Viscosity of fluid ‘ν’
Exp
erim
enta
l re
lati
ve
1st c
rack
loc
atio
n ‘r
fcl’
1st c
rack
dep
th ‘
rfcd
’
2nd c
rack
loc
atio
n ‘r
scl’
2nd c
rack
dep
th ‘
rscd
’
RB
FN
N r
elat
ive
1st c
rack
loc
atio
n ‘r
fcl’
1st c
rack
dep
th ‘
rfcd
’
2nd c
rack
loc
atio
n ‘r
scl’
2nd c
rack
dep
th ‘
rscd
’
FE
A r
elat
ive
1st c
rack
loc
atio
n ‘r
fcl’
1st c
rack
dep
th ‘
rfcd
’
2nd c
rack
loc
atio
n ‘r
scl’
2nd c
rack
dep
th ‘
rscd
’
The
oret
ical
rel
ativ
e
1st c
rack
loc
atio
n ‘r
fcl’
1st c
rack
dep
th ‘
rfcd
’
2nd c
rack
loc
atio
n ‘r
scl’
2nd c
rack
dep
th ‘
rscd
’
rfcl
rfcd
rs
cl
rscd
rf
cl
rf
cd
rscl
rs
cd
rfcl
rfcd
rs
cl
rscd
rf
cl
rf
cd
rscl
rscd
0.87
35
0.73
05
5.77
3 5.
8122
0.
0633
0.
187
0.17
5 0.
125
0.30
0 0.
179
0.16
4 0.
119
0.29
7 0.
181
0.17
2 0.
122
0.29
4 0.
179
0.16
5 0.
118
0.29
2
0.78
04
0.60
02
6.31
11
6.45
33
0.54
1 0.
312
0.16
2 0.
687
0.27
5 0.
296
0.15
7 0.
639
0.25
8 0.
302
0.15
8 0.
671
0.27
1 0.
296
0.15
5 0.
643
0.26
1
0.57
77
0.47
78
7.16
79
6.63
64
2.9
0.37
5 0.
125
0.62
5 0.
175
0.35
6 0.
119
0.59
9 0.
167
0.36
7 0.
123
0.60
5 0.
172
0.35
6 0.
119
0.59
3 0.
166
0.89
36
0.78
43
5.63
07
5.68
39
0.06
33
0.43
7 0.
250
0.75
0 0.
350
0.42
4 0.
235
0.70
3 0.
329
0.43
2 0.
246
0.73
3 0.
342
0.41
0.
238
0.71
8 0.
34
0.78
93
0.64
22
5.98
89
6.11
22
0.54
1 0.
187
0.22
5 0.
200
0.27
5 0.
178
0.21
6 0.
192
0.26
9 0.
183
0.21
9 0.
195
0.26
7 0.
175
0.21
4 0.
191
0.26
2
0.61
81
0.49
93
6.61
79
7.05
58
2.9
0.25
0 0.
200
0.56
2 0.
350
0.23
5 0.
187
0.52
8 0.
328
0.24
5 0.
194
0.55
5 0.
342
0.23
7 0.
191
0.53
2 0.
331
0.89
32
0.73
85
6.75
64
6.80
83
0.06
33
0.12
5 0.
175
0.81
2 0.
225
0.12
1 0.
166
0.77
9 0.
219
0.12
1 0.
171
0.79
2 0.
219
0.12
1 0.
167
0.76
8 0.
21
0.78
89
0.60
67
7.47
89
7.66
05
0.54
1 0.
625
0.15
0 0.
875
0.32
5 0.
588
0.14
1 0.
822
0.29
9 0.
612
0.14
6 0.
853
0.31
7 0.
612
0.14
2 0.
854
0.31
4
0.58
4 0.
483
7.64
96
7.38
18
2.9
0.25
0 0.
300
0.50
0 0.
350
0.23
1 0.
289
0.47
9 0.
325
0.24
3 0.
292
0.48
9 0.
341
0.23
6 0.
281
0.47
4 0.
331
0.87
39
0.72
26
5.01
86
5.04
86
0.06
33
0.50
0 0.
225
0.75
0 0.
275
0.47
4 0.
215
0.72
1 0.
262
0.48
4 0.
216
0.72
6 0.
266
0.47
9 0.
212
0.71
1 0.
258
Ave
rage
per
cent
age
of
erro
r 5.
01
4.99
5.
04
4.87
2.
51
2.47
2.
43
2.36
4.
73
5.1
4.94
4.
76
Tot
al p
erce
nta
ge
of e
rror
4
.98
2.4
4 4
.89
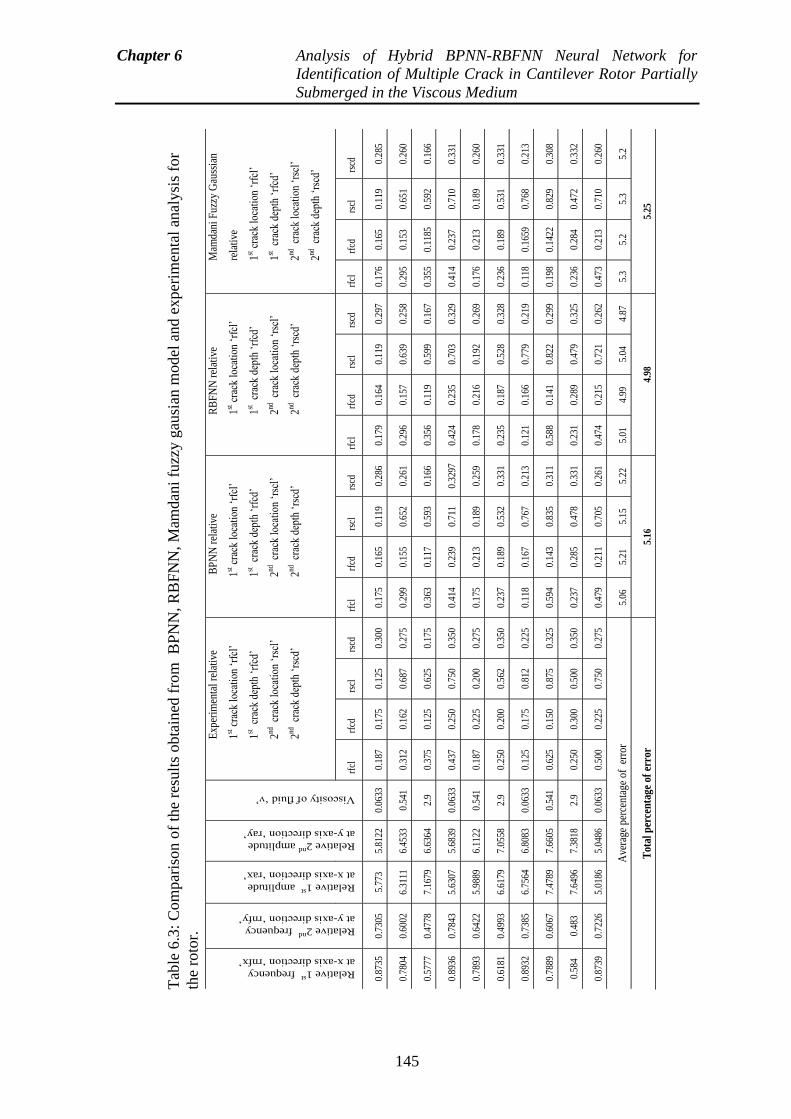
Chapter 6 Analysis of Hybrid BPNN-RBFNN Neural Network for
Identification of Multiple Crack in Cantilever Rotor Partially
Submerged in the Viscous Medium
145
Tab
le 6
.3:
Com
par
ison o
f th
e re
sult
s obta
ined
fro
m B
PN
N, R
BF
NN
, M
amdan
i fu
zzy g
ausi
an m
odel
and e
xper
imen
tal
anal
ysi
s fo
r
the
roto
r.
Relative 1st frequency
at x-axis direction ‘rnfx’
Relative 2nd
frequency
at y-axis direction ‘rnfy’
Relative 1st amplitude
at x-axis direction ‘rax’
Relative 2nd
amplitude
at y-axis direction ‘ray’
Viscosity of fluid ‘ν’
Exp
erim
enta
l re
lati
ve
1st c
rack
loc
atio
n ‘r
fcl’
1st c
rack
dep
th ‘
rfcd
’
2nd c
rack
loc
atio
n ‘r
scl’
2nd c
rack
dep
th ‘
rscd
’
BP
NN
rel
ativ
e
1st c
rack
loc
atio
n ‘r
fcl’
1st c
rack
dep
th ‘
rfcd
’
2nd c
rack
loc
atio
n ‘r
scl’
2nd c
rack
dep
th ‘
rscd
’
RB
FN
N r
elat
ive
1st c
rack
loc
atio
n ‘r
fcl’
1st c
rack
dep
th ‘
rfcd
’
2nd c
rack
loc
atio
n ‘r
scl’
2nd c
rack
dep
th ‘
rscd
’
Mam
dani
Fuz
zy G
auss
ian
rela
tive
1st c
rack
loc
atio
n ‘r
fcl’
1st c
rack
dep
th ‘
rfcd
’
2nd c
rack
loc
atio
n ‘r
scl’
2nd c
rack
dep
th ‘
rscd
’
rfcl
rfcd
rs
cl
rscd
rf
cl
rf
cd
rscl
rs
cd
rfcl
rfcd
rs
cl
rscd
rf
cl
rf
cd
rscl
rs
cd
0.87
35
0.73
05
5.77
3 5.
8122
0.
0633
0.
187
0.17
5 0.
125
0.30
0 0.
175
0.16
5 0.
119
0.28
6 0.
179
0.16
4 0.
119
0.29
7 0.
176
0.16
5 0.
119
0.28
5
0.78
04
0.60
02
6.31
11
6.45
33
0.54
1 0.
312
0.16
2 0.
687
0.27
5 0.
299
0.15
5 0.
652
0.26
1 0.
296
0.15
7 0.
639
0.25
8 0.
295
0.15
3 0.
651
0.26
0
0.57
77
0.47
78
7.16
79
6.63
64
2.9
0.37
5 0.
125
0.62
5 0.
175
0.36
3 0.
117
0.59
3 0.
166
0.35
6 0.
119
0.59
9 0.
167
0.35
5 0.
1185
0.
592
0.16
6
0.89
36
0.78
43
5.63
07
5.68
39
0.06
33
0.43
7 0.
250
0.75
0 0.
350
0.41
4 0.
239
0.71
1 0.
3297
0.
424
0.23
5 0.
703
0.32
9 0.
414
0.23
7 0.
710
0.33
1
0.78
93
0.64
22
5.98
89
6.11
22
0.54
1 0.
187
0.22
5 0.
200
0.27
5 0.
175
0.21
3 0.
189
0.25
9 0.
178
0.21
6 0.
192
0.26
9 0.
176
0.21
3 0.
189
0.26
0
0.61
81
0.49
93
6.61
79
7.05
58
2.9
0.25
0 0.
200
0.56
2 0.
350
0.23
7 0.
189
0.53
2 0.
331
0.23
5 0.
187
0.52
8 0.
328
0.23
6 0.
189
0.53
1 0.
331
0.89
32
0.73
85
6.75
64
6.80
83
0.06
33
0.12
5 0.
175
0.81
2 0.
225
0.11
8 0.
167
0.76
7 0.
213
0.12
1 0.
166
0.77
9 0.
219
0.11
8 0.
1659
0.
768
0.21
3
0.78
89
0.60
67
7.47
89
7.66
05
0.54
1 0.
625
0.15
0 0.
875
0.32
5 0.
594
0.14
3 0.
835
0.31
1 0.
588
0.14
1 0.
822
0.29
9 0.
198
0.14
22
0.82
9 0.
308
0.58
4 0.
483
7.64
96
7.38
18
2.9
0.25
0 0.
300
0.50
0 0.
350
0.23
7 0.
285
0.47
8 0.
331
0.23
1 0.
289
0.47
9 0.
325
0.23
6 0.
284
0.47
2 0.
332
0.87
39
0.72
26
5.01
86
5.04
86
0.06
33
0.50
0 0.
225
0.75
0 0.
275
0.47
9 0.
211
0.70
5 0.
261
0.47
4 0.
215
0.72
1 0.
262
0.47
3 0.
213
0.71
0 0.
260
Ave
rage
per
cent
age
of e
rror
5.
06
5.21
5.
15
5.22
5.
01
4.99
5.
04
4.87
5.
3 5.
2 5.
3 5.
2
Tot
al p
erce
nta
ge o
f er
ror
5.16
4.
98
5.25
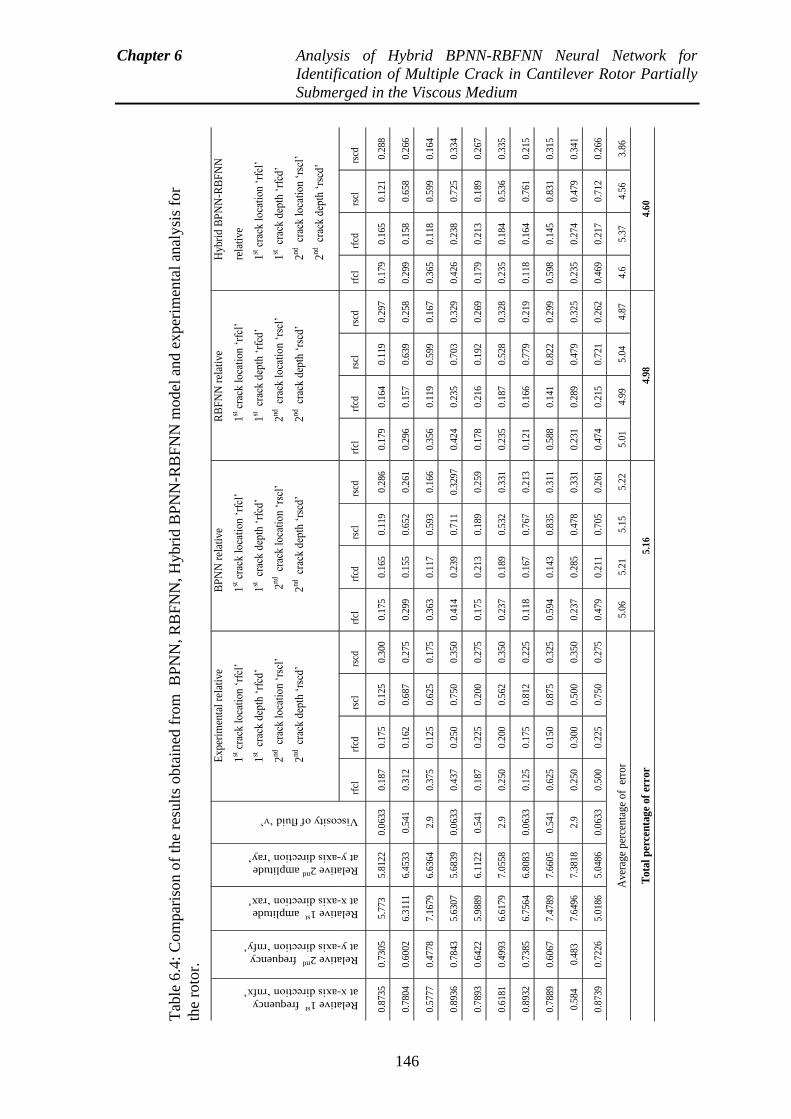
Chapter 6 Analysis of Hybrid BPNN-RBFNN Neural Network for
Identification of Multiple Crack in Cantilever Rotor Partially
Submerged in the Viscous Medium
146
Tab
le 6
.4:
Com
par
ison o
f th
e re
sult
s obta
ined
fro
m B
PN
N, R
BF
NN
, H
ybri
d B
PN
N-R
BF
NN
model
and e
xper
imen
tal
anal
ysi
s fo
r
the
roto
r.
Relative 1st frequency
at x-axis direction ‘rnfx’
Relative 2nd
frequency
at y-axis direction ‘rnfy’
Relative 1st amplitude
at x-axis direction ‘rax’
Relative 2nd
amplitude
at y-axis direction ‘ray’
Viscosity of fluid ‘ν’
Exp
erim
enta
l re
lati
ve
1st c
rack
lo
cati
on
‘rf
cl’
1st cr
ack d
epth
‘rf
cd’
2nd
cr
ack l
oca
tio
n ‘
rscl
’
2nd
cr
ack d
epth
‘rs
cd’
BP
NN
rel
ativ
e
1st c
rack
lo
cati
on
‘rf
cl’
1st cr
ack d
epth
‘rf
cd’
2nd
cr
ack l
oca
tio
n ‘
rscl
’
2nd
cr
ack d
epth
‘rs
cd’
RB
FN
N r
elat
ive
1st c
rack
lo
cati
on
‘rf
cl’
1st cr
ack d
epth
‘rf
cd’
2nd
cr
ack l
oca
tio
n ‘
rscl
’
2nd
cr
ack d
epth
‘rs
cd’
Hyb
rid
BP
NN
-RB
FN
N
rela
tive
1st c
rack
lo
cati
on
‘rf
cl’
1st cr
ack d
epth
‘rf
cd’
2nd
cr
ack l
oca
tio
n ‘
rscl
’
2nd
cr
ack d
epth
‘rs
cd’
rfcl
rfcd
rs
cl
rs
cd
rfcl
rfcd
rs
cl
rs
cd
rfcl
rfcd
rs
cl
rs
cd
rfcl
rfcd
rs
cl
rs
cd
0.8
735
0.7
305
5.7
73
5.8
122
0.0
633
0.1
87
0.1
75
0.1
25
0.3
00
0.1
75
0.1
65
0.1
19
0.2
86
0.1
79
0.1
64
0.1
19
0.2
97
0.1
79
0.1
65
0.1
21
0.2
88
0.7
804
0.6
002
6.3
111
6.4
533
0.5
41
0.3
12
0.1
62
0.6
87
0.2
75
0.2
99
0.1
55
0.6
52
0.2
61
0.2
96
0.1
57
0.6
39
0.2
58
0.2
99
0.1
58
0.6
58
0.2
66
0.5
777
0.4
778
7.1
679
6.6
364
2.9
0
.375
0.1
25
0.6
25
0.1
75
0.3
63
0.1
17
0.5
93
0.1
66
0.3
56
0.1
19
0.5
99
0.1
67
0.3
65
0.1
18
0.5
99
0.1
64
0.8
936
0.7
843
5.6
307
5.6
839
0.0
633
0.4
37
0.2
50
0.7
50
0.3
50
0.4
14
0.2
39
0.7
11
0.3
297
0.4
24
0.2
35
0.7
03
0.3
29
0.4
26
0.2
38
0.7
25
0.3
34
0.7
893
0.6
422
5.9
889
6.1
122
0.5
41
0.1
87
0.2
25
0.2
00
0.2
75
0.1
75
0.2
13
0.1
89
0.2
59
0.1
78
0.2
16
0.1
92
0.2
69
0.1
79
0.2
13
0.1
89
0.2
67
0.6
181
0.4
993
6.6
179
7.0
558
2.9
0
.250
0.2
00
0.5
62
0.3
50
0.2
37
0.1
89
0.5
32
0.3
31
0.2
35
0.1
87
0.5
28
0.3
28
0.2
35
0.1
84
0.5
36
0.3
35
0.8
932
0.7
385
6.7
564
6.8
083
0.0
633
0.1
25
0.1
75
0.8
12
0.2
25
0.1
18
0.1
67
0.7
67
0.2
13
0.1
21
0.1
66
0.7
79
0.2
19
0.1
18
0.1
64
0.7
61
0.2
15
0.7
889
0.6
067
7.4
789
7.6
605
0.5
41
0.6
25
0.1
50
0.8
75
0.3
25
0.5
94
0.1
43
0.8
35
0.3
11
0.5
88
0.1
41
0.8
22
0.2
99
0.5
98
0.1
45
0.8
31
0.3
15
0.5
84
0.4
83
7.6
496
7.3
818
2.9
0
.250
0.3
00
0.5
00
0.3
50
0.2
37
0.2
85
0.4
78
0.3
31
0.2
31
0.2
89
0.4
79
0.3
25
0.2
35
0.2
74
0.4
79
0.3
41
0.8
739
0.7
226
5.0
186
5.0
486
0.0
633
0.5
00
0.2
25
0.7
50
0.2
75
0.4
79
0.2
11
0.7
05
0.2
61
0.4
74
0.2
15
0.7
21
0.2
62
0.4
69
0.2
17
0.7
12
0.2
66
Ave
rage
per
cen
tag
e o
f e
rro
r 5
.06
5.2
1
5.1
5
5.2
2
5.0
1
4.9
9
5.0
4
4.8
7
4.6
5
.37
4.5
6
3.8
6
Tota
l p
erce
nta
ge
of
erro
r 5
.16
4.9
8
4.6
0
Chapter 6 Analysis of Hybrid BPNN-RBFNN Neural Network for
Identification of Multiple Crack in Cantilever Rotor Partially
Submerged in the Viscous Medium
147
6.7 Summary
This chapter discusses the summary drawn from the analysis carried out in the present
section. The neural network models (BPNN and RBFNN) and Hybrid BPNN-RBFNN
neural network model has been designed and developed on the basis of the change of
dynamic behavior such as amplitude and natural frequency because of the presence of the
crack in the mild steel cantilever rotor. The two natural frequencies, two relative
amplitude and viscosity of fluid have been employed as inputs to neural network model
and the final outputs of the neural model are relative first and second crack location and
crack depth. For the prediction of crack, two hundred training pattern have been taken to
train the BPFNN and RBFNN model. BPNN model has a several number of neurons in
the nine layers for treating the input data such as relative natural frequency and relative
amplitude. It is found that the error in the output of the controller is significantly
decreased from the preferred output by applying BPNN and RBFNN. The obtained results
from the developed neural network have been compared with the obtained results of the
theoretical analysis, experimental analysis, finite element analysis and Mamdani fuzzy
gaussian method to examine the success of the model. The total percentage of error for
BPNN is 5.16% , for RBFNN is 4.98% and for hybrid BPNN-RBFNN model is 4.60%.
From the investigation of the operation of the developed BPNN, RBFNN and hybrid
BPNN-RBFNN controller for multiple crack identification, it is observed that the hybrid
BPNN-RBFNN controller can predict the crack locations and their intensities very close to
the results as compared to BPNN, RBFNN and hybrid fuzzy model. In the next sections,
the artificial neural network model has been to construct to several hybrid technique like
as adaptive neuro-fuzzy inference system, Multi-adaptive neuro-fuzzy inference system
methodology for online structural monitoring conditioning.
148
Chapter 7
Analysis of MANFIS For Identification of
Multiple Crack in Rotor
The presence of crack is a serious threat to proper functioning of structures (i.e. rotor,
beam, and shaft etc.) and structures suffers a prospective risk of failure. The catastrophe in
structures produces the high expenses of maintenance. The influence of crack on the
dynamic response of the structure depends mainly on the location and size of crack.In this
chapter a novel technique is introduced to detect the multiple crack locations and depths in
the rotor partially submerged in the viscous fluid medium using multiple adaptive neuro
fuzzy-interference system (MANFIS). The proposed MANFIS controller comprises with
the five layers. The first layer has the five inputs named as adaptive layer. The fourth and
fifth layers are also called as adaptive layer. The fifth layer has provided the four output
parameters. The second and third layers are fixed layer. The four input parameters two
relative natural frequencies and two relative amplitudes at both transvers direction (i.e. 44
and 55-axis direction) and viscosity of fluid and four output parameters first and second
relative crack depths and locations are utilized for the performance of proposed MANFIS
controller. MANFIS is a prolonged form of the ANFIS to provide a multiple output for the
required system. This methodology can be employed efficiently for modeling functions
with complexity and nonlinearities without the use of precise measurable analysis. This
approach has been utilized to diagnose the cracked cantilever rotor submerged in the
viscous fluid medium and the results are favorable. The input and output parameters are
extracted using the Takagi-Sugeno fuzzy model. The extracted data are used to train the
FL model [199]. Through combination of excellent feature of both Fuzzy logic system and
neural networks have been used to develop the ANFIS model. The proposed MANFIS
method has been observed to be in agreement with the obtained results of experiment
analysis.
Chapter 7 Analysis of MANFIS For Identification of Multiple Crack in
Rotor
149
7.1 Introduction
Many research work has been carried out by researchers to improve the methodology for
fault diagnosis of structure. It has been analyzed that the AI based techniques such as FL
System, ANNs etc. have been used to implement the well-organized intelligent techniques
for detection of damages in faulty structures. Currently the science and engineering
community have been used the multiple adaptive neuro-fuzzy inference system for design
and development of the expert system.The combined features of neural network and
fuzzy system of the multiple ANFIS model have been provided the robust stand to
implement the controller for various application in engineering or industrial field. The
present chapter introduces a method based on the MANFIS which is a postponement of
ANFIS system to identify a multiple transverse crack in a rotor system.The recognized
MANFIS controller model consists of single input layer, single output layer and three
hidden layer. From the five layers of MANFIS system, the first layer name as input layer
has been trained using the FL system. The residual four layers are trained using the ANNs.
Many fuzzy rule and various fuzzy linguistic terms have been incorporated for the values
of the five input parameters (first and second relative natural frequencies, first and second
relative amplitude and viscosity of fluid) and four output parameters (first and second
relative crack locations and depths) to train the fuzzy layer of the MANFIS controller.
Many training patterns have been implemented to train the layer based on the neural
network of the MANFIS controller. The first layer based on the fuzzy uses the two relative
natural frequencies, two relative amplitude and viscosity of fluid as the inputs. The output
of the fuzzy model fed to the hidden layer and Finally output parameters first and second
relative crack locations and depths have been received from the MANFIS controller. From
the analysis of predictive result of proposed technique. It has been observed that the output
values agree well with the result of experimental investigation. Based on the analysis it is
confirmed that the proposed technique reveals its capability to be an appropriate non-
destructive method for identification of damages in vibrant structure. The present chapter
has been organized into four different sections. First Section 7.1 discusses the introductory
part of the proposed MANFIS and explains the application of MANFIS in advance
computing. The analysis of MANFIS applied for identification of crack in rotor has been
described in section 7.2. The comparison of the results obtained from MANFIS model
with the results obtained from the techniques discoursed in the earlier chapters have been
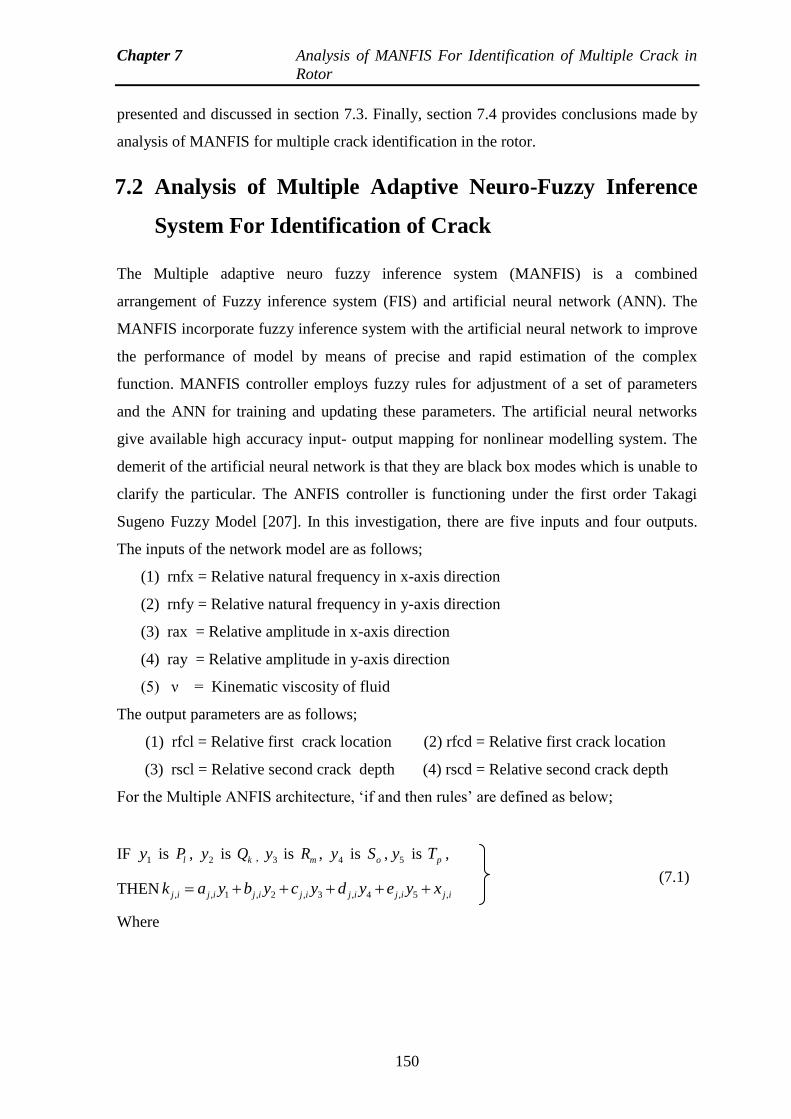
Chapter 7 Analysis of MANFIS For Identification of Multiple Crack in
Rotor
150
presented and discussed in section 7.3. Finally, section 7.4 provides conclusions made by
analysis of MANFIS for multiple crack identification in the rotor.
7.2 Analysis of Multiple Adaptive Neuro-Fuzzy Inference
System For Identification of Crack
The Multiple adaptive neuro fuzzy inference system (MANFIS) is a combined
arrangement of Fuzzy inference system (FIS) and artificial neural network (ANN). The
MANFIS incorporate fuzzy inference system with the artificial neural network to improve
the performance of model by means of precise and rapid estimation of the complex
function. MANFIS controller employs fuzzy rules for adjustment of a set of parameters
and the ANN for training and updating these parameters. The artificial neural networks
give available high accuracy input- output mapping for nonlinear modelling system. The
demerit of the artificial neural network is that they are black box modes which is unable to
clarify the particular. The ANFIS controller is functioning under the first order Takagi
Sugeno Fuzzy Model [207]. In this investigation, there are five inputs and four outputs.
The inputs of the network model are as follows;
(1) rnfx = Relative natural frequency in x-axis direction
(2) rnfy = Relative natural frequency in y-axis direction
(3) rax = Relative amplitude in x-axis direction
(4) ray = Relative amplitude in y-axis direction
(5) ν = Kinematic viscosity of fluid
The output parameters are as follows;
(1) rfcl = Relative first crack location (2) rfcd = Relative first crack location
(3) rscl = Relative second crack depth (4) rscd = Relative second crack depth
For the Multiple ANFIS architecture, ‘if and then rules’ are defined as below;
IF 1y is lP , 2y is kQ , 3y is mR , 4y is oS , 5y is pT ,
THEN , , 1 , 2 , 3 , 4 , 5 ,j i j i j i j i j i j i j ik a y b y c y d y e y x
Where
(7.1)
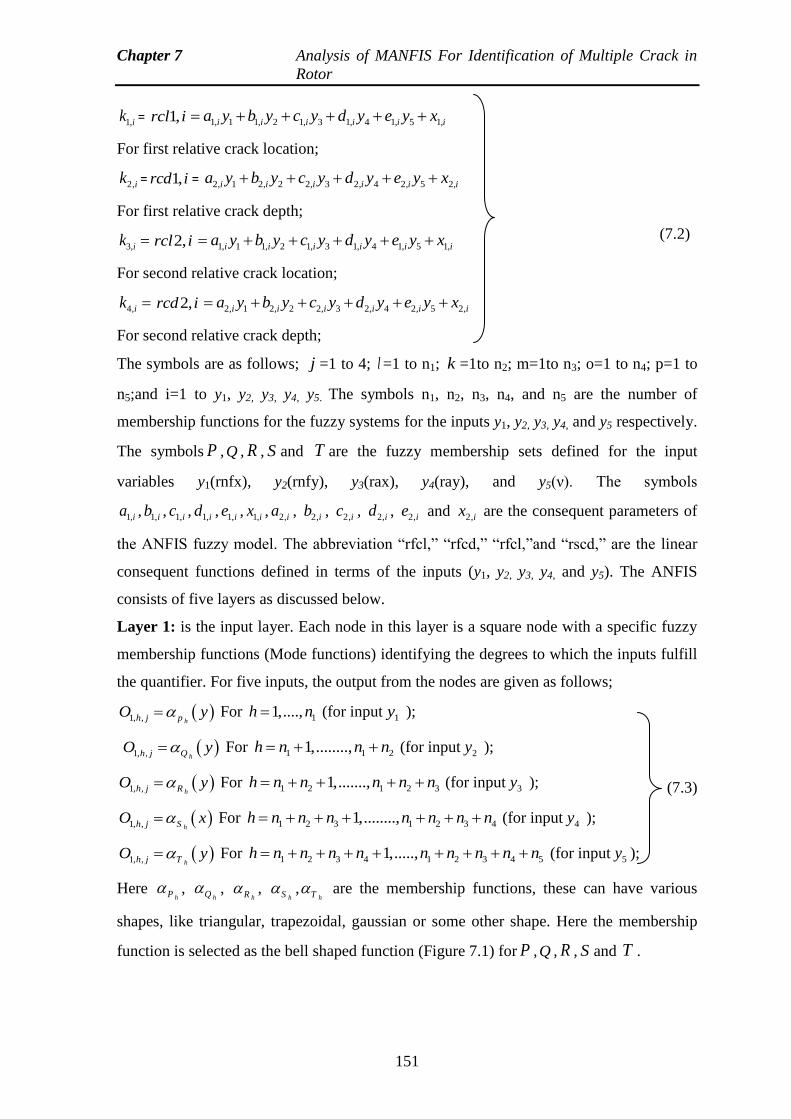
Chapter 7 Analysis of MANFIS For Identification of Multiple Crack in
Rotor
151
1,ik = 1,rcl i 1, 1 1, 2 1, 3 1, 4 1, 5 1,i i i i i ia y b y c y d y e y x
For first relative crack location;
2,ik = 1,rcd i = 2, 1 2, 2 2, 3 2, 4 2, 5 2,i i i i i ia y b y c y d y e y x
For first relative crack depth;
3,ik 2,rcl i 1, 1 1, 2 1, 3 1, 4 1, 5 1,i i i i i ia y b y c y d y e y x
For second relative crack location;
4,ik 2,rcd i 2, 1 2, 2 2, 3 2, 4 2, 5 2,i i i i i ia y b y c y d y e y x
For second relative crack depth;
The symbols are as follows; j =1 to 4; l =1 to n1; k =1to n2; m=1to n3; o=1 to n4; p=1 to
n5;and i=1 to y1, y2, y3, y4, y5. The symbols n1, n2, n3, n4, and n5 are the number of
membership functions for the fuzzy systems for the inputs y1, y2, y3, y4, and y5 respectively.
The symbols P , Q , R , S and T are the fuzzy membership sets defined for the input
variables y1(rnfx), y2(rnfy), y3(rax), y4(ray), and y5(ν). The symbols
1,ia , 1,ib , 1,ic , 1,id , 1,ie , 1,ix , 2,ia , 2,ib , 2,ic , 2,id , 2,ie and 2,ix are the consequent parameters of
the ANFIS fuzzy model. The abbreviation “rfcl,” “rfcd,” “rfcl,”and “rscd,” are the linear
consequent functions defined in terms of the inputs (y1, y2, y3, y4, and y5). The ANFIS
consists of five layers as discussed below.
Layer 1: is the input layer. Each node in this layer is a square node with a specific fuzzy
membership functions (Mode functions) identifying the degrees to which the inputs fulfill
the quantifier. For five inputs, the output from the nodes are given as follows;
1, , hh j pO y For 11,....,h n (for input 1y );
1, , hh j QO y For 1 1 21,........,h n n n (for input 2y );
1, , hh j RO y For 1 2 1 2 31,.......,h n n n n n (for input 3y );
1, , hh j SO x For 1 2 3 1 2 3 41,........,h n n n n n n n (for input 4y );
1, , hh j TO y For 1 2 3 4 1 2 3 4 51,.....,h n n n n n n n n n (for input 5y );
Here hP ,
hQ , hR ,
hS ,hT are the membership functions, these can have various
shapes, like triangular, trapezoidal, gaussian or some other shape. Here the membership
function is selected as the bell shaped function (Figure 7.1) for P ,Q , R , S and T .
(7.2)
(7.3)
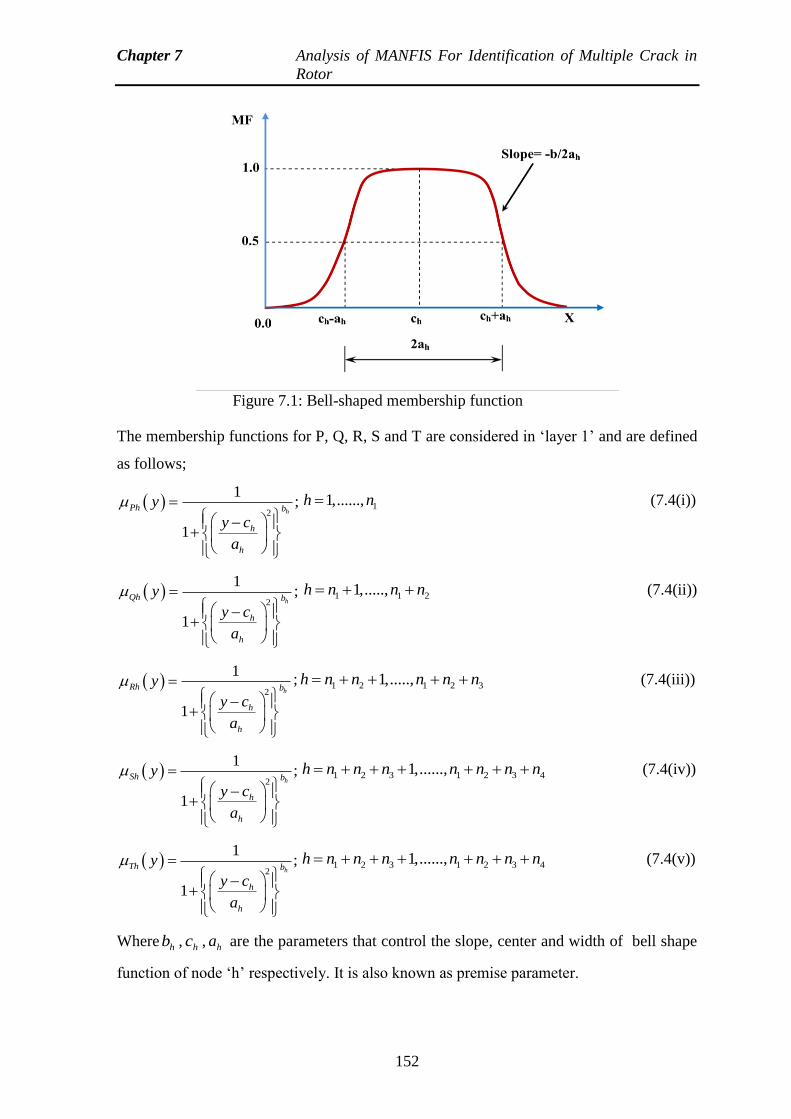
Chapter 7 Analysis of MANFIS For Identification of Multiple Crack in
Rotor
152
Figure 7.1: Bell-shaped membership function
The membership functions for P, Q, R, S and T are considered in ‘layer 1’ and are defined
as follows;
2
1;
1
hPh b
h
h
y
y c
a
11,......,h n (7.4(i))
2
1;
1
hQh b
h
h
y
y c
a
1 1 21,.....,h n n n (7.4(ii))
2
1
1
hRh b
h
h
y
y c
a
; 1 2 1 2 31,.....,h n n n n n (7.4(iii))
2
1;
1
hSh b
h
h
y
y c
a
1 2 3 1 2 3 41,......,h n n n n n n n (7.4(iv))
2
1;
1
hTh b
h
h
y
y c
a
1 2 3 1 2 3 41,......,h n n n n n n n (7.4(v))
Where hb , hc , ha are the parameters that control the slope, center and width of bell shape
function of node ‘h’ respectively. It is also known as premise parameter.
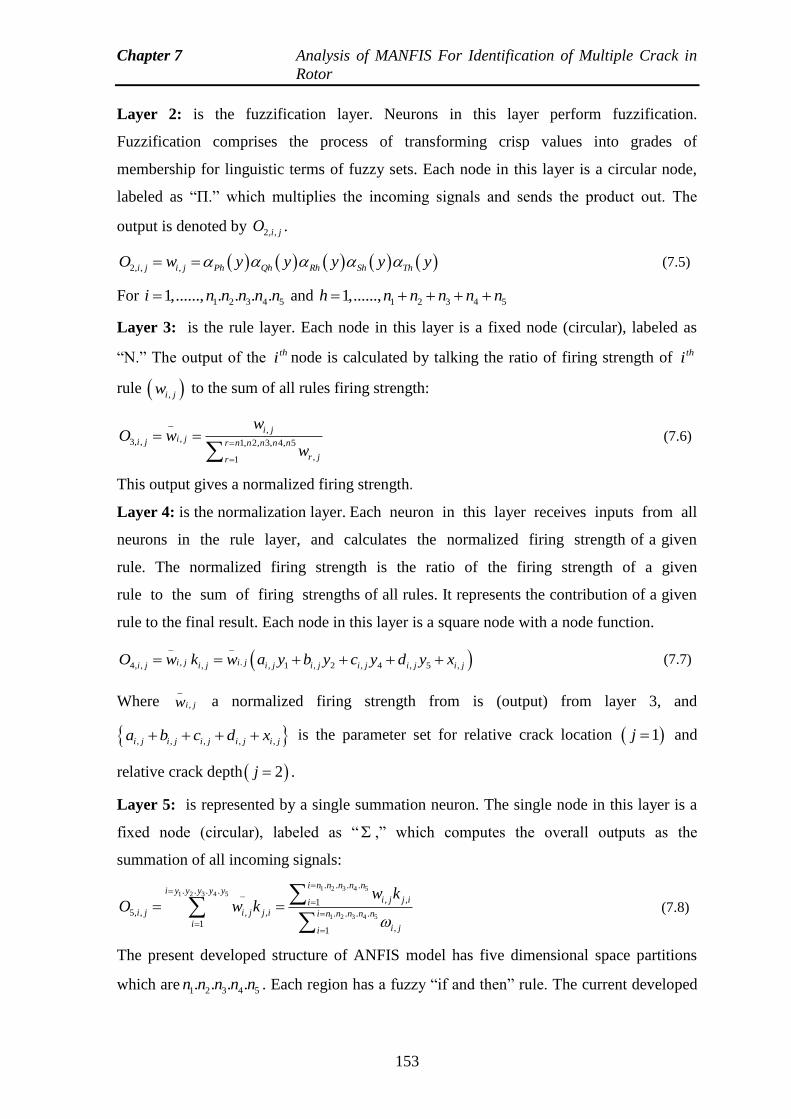
Chapter 7 Analysis of MANFIS For Identification of Multiple Crack in
Rotor
153
Layer 2: is the fuzzification layer. Neurons in this layer perform fuzzification.
Fuzzification comprises the process of transforming crisp values into grades of
membership for linguistic terms of fuzzy sets. Each node in this layer is a circular node,
labeled as “П.” which multiplies the incoming signals and sends the product out. The
output is denoted by 2, ,i jO .
2, , ,i j i j Ph Qh Rh Sh ThO w y y y y y (7.5)
For 1 2 3 4 51,......, . . . .i n n n n n and 1 2 3 4 51,......,h n n n n n
Layer 3: is the rule layer. Each node in this layer is a fixed node (circular), labeled as
“N.” The output of the thi node is calculated by talking the ratio of firing strength of thi
rule ,i jw to the sum of all rules firing strength:
_,
,3, , 1, 2, 3, 4, 5
,1
i ji ji j r n n n n n
r jr
wO w
w
(7.6)
This output gives a normalized firing strength.
Layer 4: is the normalization layer. Each neuron in this layer receives inputs from all
neurons in the rule layer, and calculates the normalized firing strength of a given
rule. The normalized firing strength is the ratio of the firing strength of a given
rule to the sum of firing strengths of all rules. It represents the contribution of a given
rule to the final result. Each node in this layer is a square node with a node function.
_ _
, .4, , , , 1 , 2 , 4 , 5 ,i j i ji j i j i j i j i j i j i jO w k w a y b y c y d y x (7.7)
Where _
,i jw a normalized firing strength from is (output) from layer 3, and
, , , , ,i j i j i j i j i ja b c d x is the parameter set for relative crack location 1j and
relative crack depth 2j .
Layer 5: is represented by a single summation neuron. The single node in this layer is a
fixed node (circular), labeled as “ ,” which computes the overall outputs as the
summation of all incoming signals:
1 2 3 4 51 2 3 4 5
1 2 3 4 5
. . . .. . . . _
, ,15, , , , . . . .
1 ,1
i n n n n ni y y y y y
i j j iii j i j j i i n n n n n
i i ji
w kO w k
(7.8)
The present developed structure of ANFIS model has five dimensional space partitions
which are 1 2 3 4 5. . . .n n n n n . Each region has a fuzzy “if and then” rule. The current developed
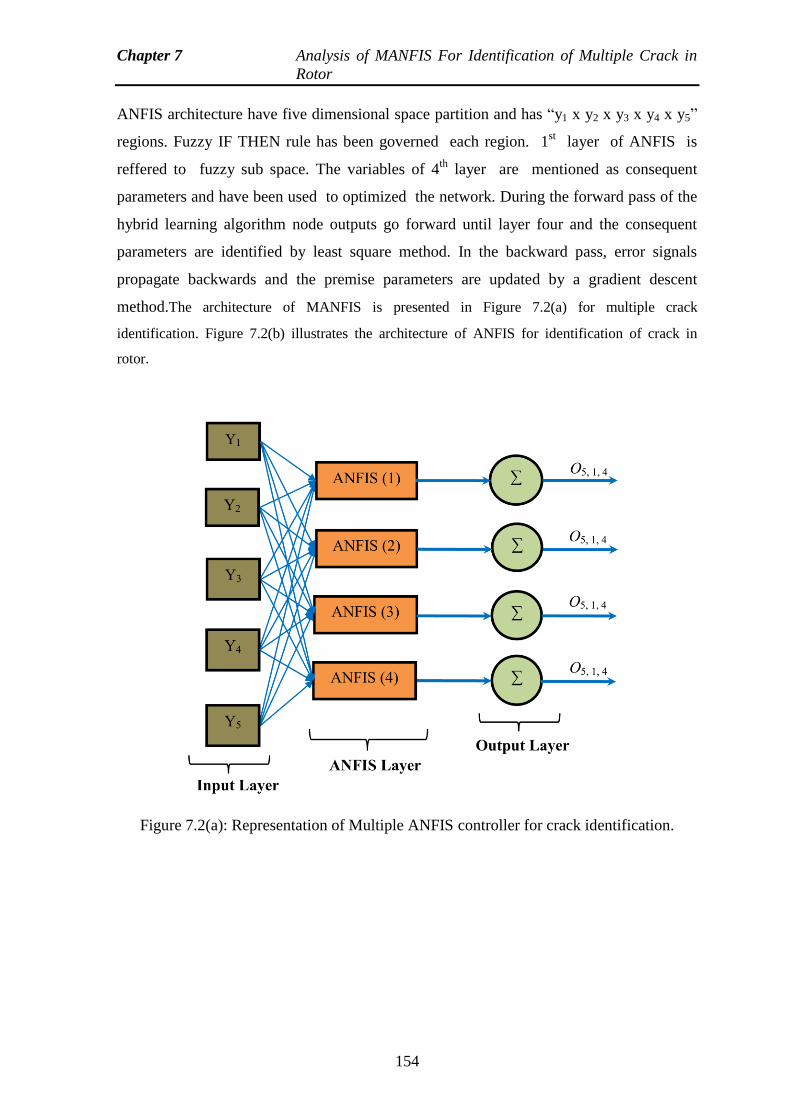
Chapter 7 Analysis of MANFIS For Identification of Multiple Crack in
Rotor
154
ANFIS architecture have five dimensional space partition and has “y1 x y2 x y3 x y4 x y5”
regions. Fuzzy IF THEN rule has been governed each region. 1st layer of ANFIS is
reffered to fuzzy sub space. The variables of 4th
layer are mentioned as consequent
parameters and have been used to optimized the network. During the forward pass of the
hybrid learning algorithm node outputs go forward until layer four and the consequent
parameters are identified by least square method. In the backward pass, error signals
propagate backwards and the premise parameters are updated by a gradient descent
method.The architecture of MANFIS is presented in Figure 7.2(a) for multiple crack
identification. Figure 7.2(b) illustrates the architecture of ANFIS for identification of crack in
rotor.
Figure 7.2(a): Representation of Multiple ANFIS controller for crack identification.
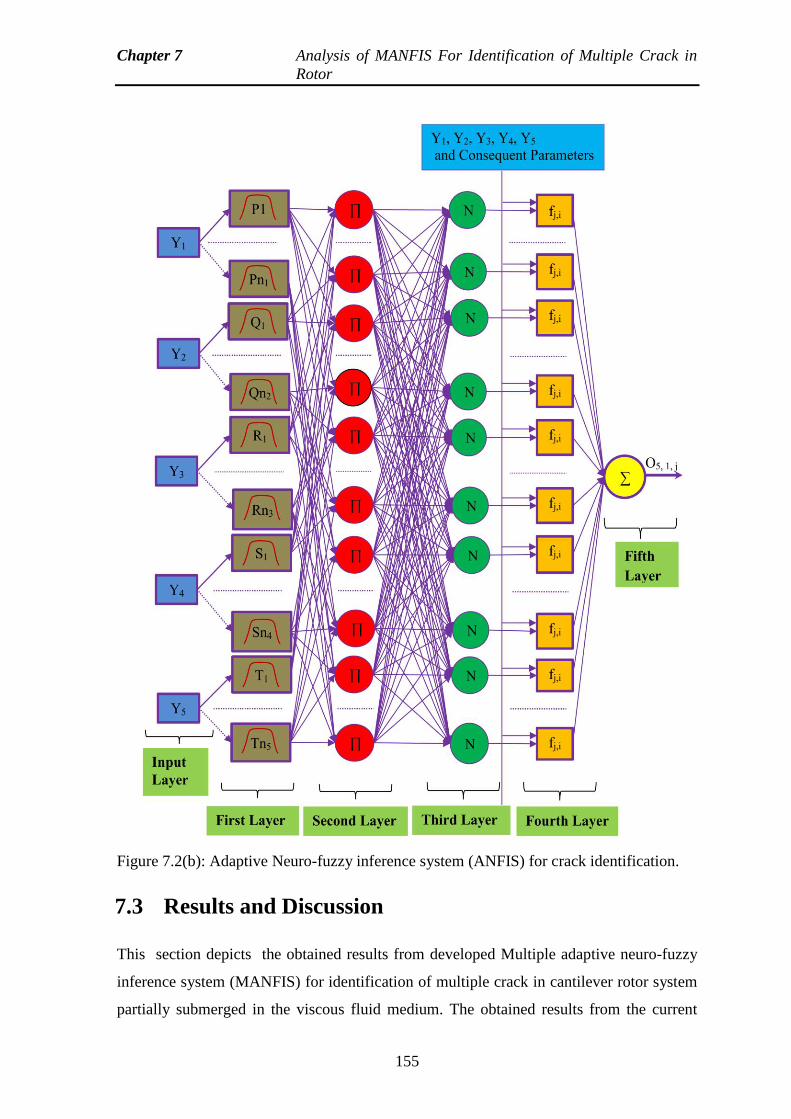
Chapter 7 Analysis of MANFIS For Identification of Multiple Crack in
Rotor
155
Figure 7.2(b): Adaptive Neuro-fuzzy inference system (ANFIS) for crack identification.
7.3 Results and Discussion
This section depicts the obtained results from developed Multiple adaptive neuro-fuzzy
inference system (MANFIS) for identification of multiple crack in cantilever rotor system
partially submerged in the viscous fluid medium. The obtained results from the current
Chapter 7 Analysis of MANFIS For Identification of Multiple Crack in
Rotor
156
analysis exhibit the effect of crack locations and depths on the vibration response of the
cantilever rotor. Figure 7.1 illustrates the model of Bell shaped membership functions
employed for developing ANFIS model. The structure of the proposed MANFIS model
for multiple crack detection and the complete structure with altered layers of the ANFIS
system for crack identification have been presented in Figure 7.2(a) and Figure 7.2(b)
respectively.Table 7.1 presents the comparison of obtained results from the theoretical
analysis, FEA and MANFIS model.The appropriateness of the MANFIS approach has
been tested by comparing the results with the hybrid Fuzzy models of Chapter-5, hybrid
BPNN-RBFNN neural network models of Chapter-6 and experimental analysis of
Chapter-8. Comparison have been illustrated in the Table 7.2. Ten sets of inputs (two
relative natural frequencies, two relative amplitudes and viscosity of fluid) from the many
sets of inputs have been taken for the proposed technique and the corresponding outputs
(relative first and second crack locations and depths) are presented in the Tables 7.1 and
7.2. The first five columns of Tables 7.1 and 7.2 presents the inputs for the MANFIS
technique i.e. first relative natural frequency at x-axis direction (rnfx), second relative
natural frequency at y-axis direction (rnfy), first relative amplitude at x-axis direction
(rax), second relative natural frequency (ray) and viscosity of fluid (ν).The remaining
columns from the Table represent the outputs such as first relative crack location, first
relative crack depth, second crack location and second crack depth from the respective
techniques.
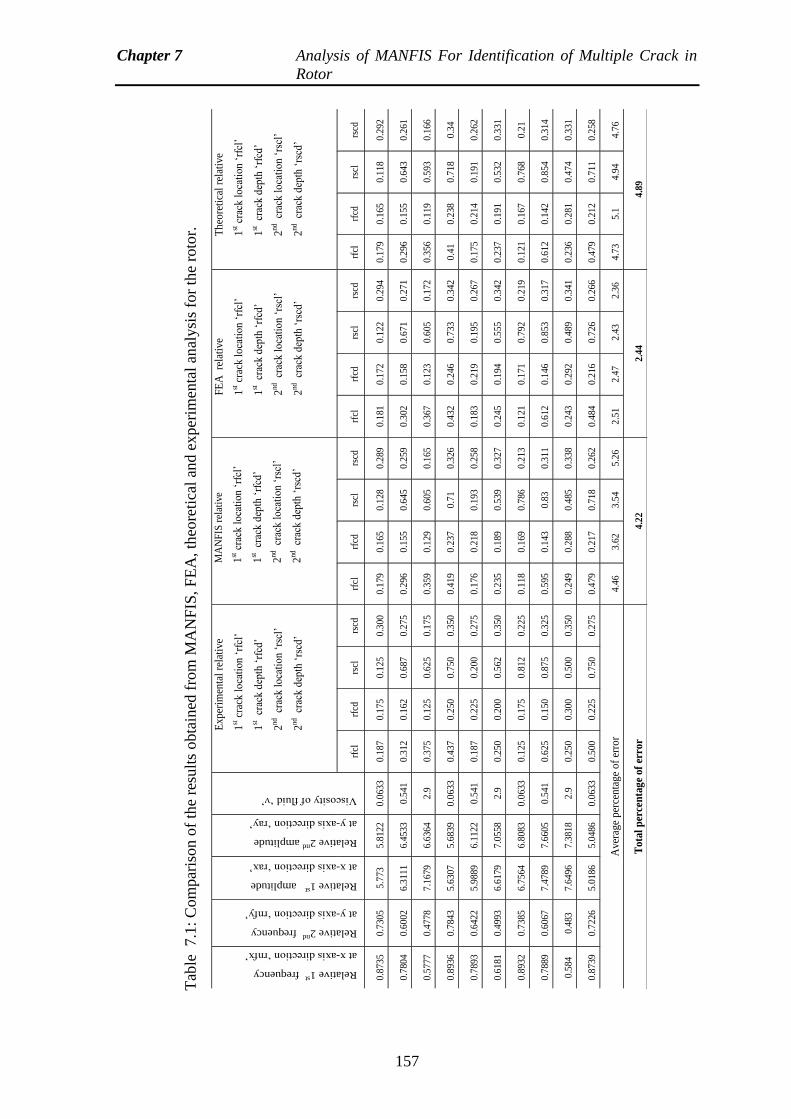
Chapter 7 Analysis of MANFIS For Identification of Multiple Crack in
Rotor
157
Tab
le 7.1
: C
om
par
ison o
f th
e re
sult
s obta
ined
fro
m M
AN
FIS
, F
EA
, th
eore
tica
l an
d e
xper
imen
tal
anal
ysi
s fo
r th
e ro
tor.
Relative 1st frequency
at x-axis direction ‘rnfx’
Relative 2nd
frequency
at y-axis direction ‘rnfy’
Relative 1st amplitude
at x-axis direction ‘rax’
Relative 2nd
amplitude
at y-axis direction ‘ray’
Viscosity of fluid ‘ν’
Exp
erim
enta
l re
lati
ve
1st c
rack
lo
cati
on
‘rf
cl’
1st cr
ack d
epth
‘rf
cd’
2nd
cr
ack l
oca
tio
n ‘
rscl
’
2nd
cr
ack d
epth
‘rs
cd’
MA
NF
IS r
elat
ive
1st c
rack
lo
cati
on
‘rf
cl’
1st cr
ack d
epth
‘rf
cd’
2nd
cr
ack l
oca
tio
n ‘
rscl
’
2nd
cr
ack d
epth
‘rs
cd’
FE
A
rela
tive
1st c
rack
lo
cati
on
‘rf
cl’
1st cr
ack d
epth
‘rf
cd’
2nd
cr
ack l
oca
tio
n ‘
rscl
’
2nd
cr
ack d
epth
‘rs
cd’
Th
eore
tica
l re
lati
ve
1st c
rack
lo
cati
on
‘rf
cl’
1st cr
ack d
epth
‘rf
cd’
2nd
cr
ack l
oca
tio
n ‘
rscl
’
2nd
cr
ack d
epth
‘rs
cd’
rfcl
rf
cd
rscl
rs
cd
rfcl
rf
cd
rscl
rs
cd
rfcl
rf
cd
rscl
rs
cd
rfcl
rf
cd
rscl
rs
cd
0.8
735
0.7
305
5.7
73
5.8
122
0.0
633
0.1
87
0.1
75
0.1
25
0.3
00
0.1
79
0.1
65
0.1
28
0.2
89
0.1
81
0.1
72
0.1
22
0.2
94
0.1
79
0.1
65
0.1
18
0.2
92
0.7
804
0.6
002
6.3
111
6.4
533
0.5
41
0.3
12
0.1
62
0.6
87
0.2
75
0.2
96
0.1
55
0.6
45
0.2
59
0.3
02
0.1
58
0.6
71
0.2
71
0.2
96
0.1
55
0.6
43
0.2
61
0.5
777
0.4
778
7.1
679
6.6
364
2.9
0
.375
0.1
25
0.6
25
0.1
75
0.3
59
0.1
29
0.6
05
0.1
65
0.3
67
0.1
23
0.6
05
0.1
72
0.3
56
0.1
19
0.5
93
0.1
66
0.8
936
0.7
843
5.6
307
5.6
839
0.0
633
0.4
37
0.2
50
0.7
50
0.3
50
0.4
19
0.2
37
0.7
1
0.3
26
0.4
32
0.2
46
0.7
33
0.3
42
0.4
1
0.2
38
0.7
18
0.3
4
0.7
893
0.6
422
5.9
889
6.1
122
0.5
41
0.1
87
0.2
25
0.2
00
0.2
75
0.1
76
0.2
18
0.1
93
0.2
58
0.1
83
0.2
19
0.1
95
0.2
67
0.1
75
0.2
14
0.1
91
0.2
62
0.6
181
0.4
993
6.6
179
7.0
558
2.9
0
.250
0.2
00
0.5
62
0.3
50
0.2
35
0.1
89
0.5
39
0.3
27
0.2
45
0.1
94
0.5
55
0.3
42
0.2
37
0.1
91
0.5
32
0.3
31
0.8
932
0.7
385
6.7
564
6.8
083
0.0
633
0.1
25
0.1
75
0.8
12
0.2
25
0.1
18
0.1
69
0.7
86
0.2
13
0.1
21
0.1
71
0.7
92
0.2
19
0.1
21
0.1
67
0.7
68
0.2
1
0.7
889
0.6
067
7.4
789
7.6
605
0.5
41
0.6
25
0.1
50
0.8
75
0.3
25
0.5
95
0.1
43
0.8
3
0.3
11
0.6
12
0.1
46
0.8
53
0.3
17
0.6
12
0.1
42
0.8
54
0.3
14
0.5
84
0.4
83
7.6
496
7.3
818
2.9
0
.250
0.3
00
0.5
00
0.3
50
0.2
49
0.2
88
0.4
85
0.3
38
0.2
43
0.2
92
0.4
89
0.3
41
0.2
36
0.2
81
0.4
74
0.3
31
0.8
739
0.7
226
5.0
186
5.0
486
0.0
633
0.5
00
0.2
25
0.7
50
0.2
75
0.4
79
0.2
17
0.7
18
0.2
62
0.4
84
0.2
16
0.7
26
0.2
66
0.4
79
0.2
12
0.7
11
0.2
58
Aver
age
per
cen
tag
e o
f er
ror
4.4
6
3.6
2
3.5
4
5.2
6
2.5
1
2.4
7
2.4
3
2.3
6
4.7
3
5.1
4
.94
4.7
6
Tota
l p
erce
nta
ge
of
erro
r 4
.22
2.4
4
4.8
9
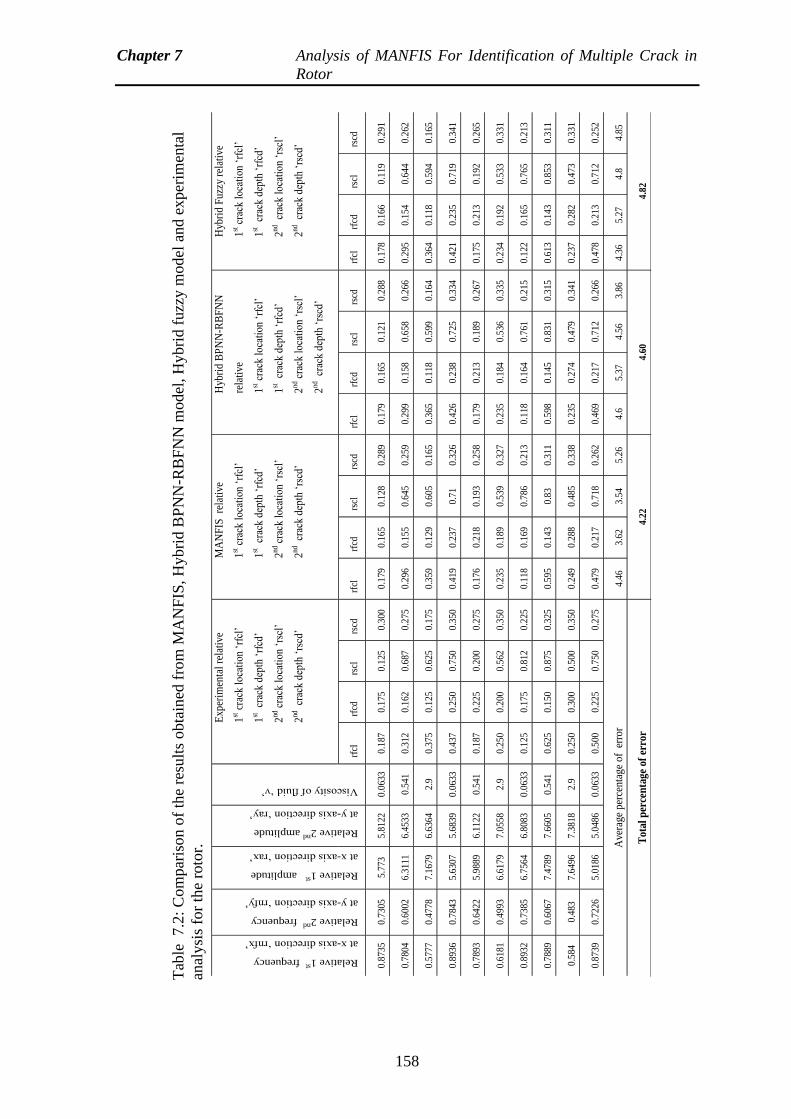
Chapter 7 Analysis of MANFIS For Identification of Multiple Crack in
Rotor
158
Tab
le 7.2
: C
om
par
ison o
f th
e re
sult
s obta
ined
fro
m M
AN
FIS
, H
ybri
d B
PN
N-R
BF
NN
model
, H
ybri
d f
uzz
y m
odel
and e
xper
imen
tal
anal
ysi
s fo
r th
e ro
tor.
Relative 1st frequency
at x-axis direction ‘rnfx’
Relative 2nd
frequency
at y-axis direction ‘rnfy’
Relative 1st amplitude
at x-axis direction ‘rax’
Relative 2nd
amplitude
at y-axis direction ‘ray’
Viscosity of fluid ‘ν’
Exp
erim
enta
l re
lati
ve
1st c
rack
lo
cati
on ‘
rfcl
’
1st c
rack
dep
th ‘
rfcd
’
2nd
cra
ck l
oca
tio
n ‘
rscl
’
2nd
cr
ack
dep
th ‘
rscd
’
MA
NF
IS
rela
tive
1st c
rack
lo
cati
on ‘
rfcl
’
1st c
rack
dep
th ‘
rfcd
’
2nd
cra
ck l
oca
tio
n ‘
rscl
’
2nd
cr
ack
dep
th ‘
rscd
’
Hyb
rid
BP
NN
-RB
FN
N
rela
tive
1st c
rack
lo
cati
on ‘
rfcl
’
1st c
rack
dep
th ‘
rfcd
’
2nd
cra
ck l
oca
tio
n ‘
rscl
’
2nd
cr
ack
dep
th ‘
rscd
’
Hyb
rid
Fu
zzy
rela
tive
1st c
rack
lo
cati
on ‘
rfcl
’
1st c
rack
dep
th ‘
rfcd
’
2nd
cr
ack
loca
tio
n ‘
rscl
’
2nd
cr
ack
dep
th ‘
rscd
’
rfcl
rfcd
rs
cl
rs
cd
rfcl
rfcd
rs
cl
rs
cd
rfcl
rfcd
rs
cl
rs
cd
rfcl
rfcd
rs
cl
rs
cd
0.8
735
0.7
305
5.7
73
5.8
122
0.0
633
0.1
87
0.1
75
0.1
25
0.3
00
0.1
79
0.1
65
0.1
28
0.2
89
0.1
79
0.1
65
0.1
21
0.2
88
0.1
78
0.1
66
0.1
19
0.2
91
0.7
804
0.6
002
6.3
111
6.4
533
0.5
41
0.3
12
0.1
62
0.6
87
0.2
75
0.2
96
0.1
55
0.6
45
0.2
59
0.2
99
0.1
58
0.6
58
0.2
66
0.2
95
0.1
54
0.6
44
0.2
62
0.5
777
0.4
778
7.1
679
6.6
364
2.9
0
.375
0
.125
0
.625
0
.175
0
.359
0
.129
0
.605
0
.165
0
.365
0
.118
0
.599
0
.164
0
.364
0
.118
0
.594
0
.165
0.8
936
0.7
843
5.6
307
5.6
839
0.0
633
0.4
37
0.2
50
0.7
50
0.3
50
0.4
19
0.2
37
0.7
1 0
.326
0
.426
0
.238
0
.725
0
.334
0
.421
0
.235
0
.719
0
.341
0.7
893
0.6
422
5.9
889
6.1
122
0.5
41
0.1
87
0.2
25
0.2
00
0.2
75
0.1
76
0.2
18
0.1
93
0.2
58
0.1
79
0.2
13
0.1
89
0.2
67
0.1
75
0.2
13
0.1
92
0.2
65
0.6
181
0.4
993
6.6
179
7.0
558
2.9
0
.250
0
.200
0
.562
0
.350
0
.235
0
.189
0
.539
0
.327
0
.235
0
.184
0
.536
0
.335
0
.234
0
.192
0
.533
0
.331
0.8
932
0.7
385
6.7
564
6.8
083
0.0
633
0.1
25
0.1
75
0.8
12
0.2
25
0.1
18
0.1
69
0.7
86
0.2
13
0.1
18
0.1
64
0.7
61
0.2
15
0.1
22
0.1
65
0.7
65
0.2
13
0.7
889
0.6
067
7.4
789
7.6
605
0.5
41
0.6
25
0.1
50
0.8
75
0.3
25
0.5
95
0.1
43
0.8
3 0
.311
0
.598
0
.145
0
.831
0
.315
0
.613
0
.143
0
.853
0
.311
0.5
84
0.4
83
7.6
496
7.3
818
2.9
0
.250
0
.300
0
.500
0
.350
0
.249
0
.288
0
.485
0
.338
0
.235
0
.274
0
.479
0
.341
0
.237
0
.282
0
.473
0
.331
0.8
739
0.7
226
5.0
186
5.0
486
0.0
633
0.5
00
0.2
25
0.7
50
0.2
75
0.4
79
0.2
17
0.7
18
0.2
62
0.4
69
0.2
17
0.7
12
0.2
66
0.4
78
0.2
13
0.7
12
0.2
52
Ave
rage
per
cen
tag
e o
f e
rro
r 4
.46
3.6
2 3
.54
5.2
6 4
.6
5.3
7 4
.56
3.8
6 4
.36
5.2
7 4
.8
4.8
5
Tot
al
per
cen
tag
e of
err
or
4.2
2
4.6
0
4.8
2
Chapter 7 Analysis of MANFIS For Identification of Multiple Crack in
Rotor
159
7.4 Summary
The results derived from MANFIS technique for multiple crack identification in the rotor
partially submerged in the viscous fluid medium have been summarized below. In the
present analysis a technique based on the values of natural frequencies and amplitudes of
the rotor system has been proposed for recognition of the crack location and their
severities in a rotor using MANFIS model. MANFIS model has one input layer, four
hidden layer and one output layer. Two relative natural frequencies, two relative amplitude
and viscosity of fluid are used as inputs to the fuzzy segment of the MANFIS model. The
output of the developed model is relative crack depth and relative crack location. The
result derived from the developed hybrid BPNN-RBFNN, hybrid fuzzy model, FEA,
theoretical analysis and MANFIS model have been compared with experimental test
results to authenticate the effectiveness of proposed fuzzy models. The total percentage of
error of the obtained result of the hybrid BPNN-RBFNN model is 4.60%, for the hybrid
fuzzy model is 4.82% for the FEA model is 2.44%, and for the Theoretical analysis is
4.89%.The results found to be good in agreement. Based on above study, it is found that
MANFIS model gives better results as comparison to hybrid BPNN-RBFNN, hybrid fuzzy
model, FEA, theoretical analysis. Therefore, the developed MANFIS controller can be
efficiently used as fault diagnosis tools in dynamically analysis of rotor. The MANFIS
model gives more precise result as compared to hybrid BPNN-RBFNN and hybrid fuzzy
model. It is found that total percentage of error for MANFIS model is 4.22 %.
160
Chapter 8
Analysis of Hybrid Fuzzy-Rule Base
Technique for Multiple Crack
Identification in Rotor
Different fault diagnostics techniques are required to observe the health of various
machine components and structural elements for acquiring the un-interrupted service. The
detection of crack before failure of the rotor system not only prevents loss of economy but
also saves the human life. Various non-destructive techniques have been applied by
researchers to locate the damage but they are costly and time consuming. The vibration
based method along with intelligent techniques can be used to effectively identify the
damage. The rule base system has been done by engineers and researchers from various
fields of science and technology for developing intelligent systems for identification of
multiple crack. The rule base technique has potential to solve various engineering
problems based on concepts of sets of rules.
8.1 Introduction
The current chapter introduces the hybrid fuzzy-rule base technique. Rule base technique
stated the knowledge of the environment in the form of rules. Rules are one of the leading
type of information exemplification formalisms used in expert systems. The rule
comprises the set of conditions (antecedents) and set of conclusions (consequents).The
rule base, inference engine and working memory are the typical main component of the
rule-base system. The working memory has the information regarding the specific instant
of the problem being solved. The rule base controller has been used the set of rules which
signify the solving knowledge of problem for a particular domain. The working memory
used to derive a new statistics and inference engine uses the rule base. Basically rule-base
controller is a tabel look-up technique which is representing the dynamic complex system.
In rule base system, each rule is a command of motion control for a particular permutation
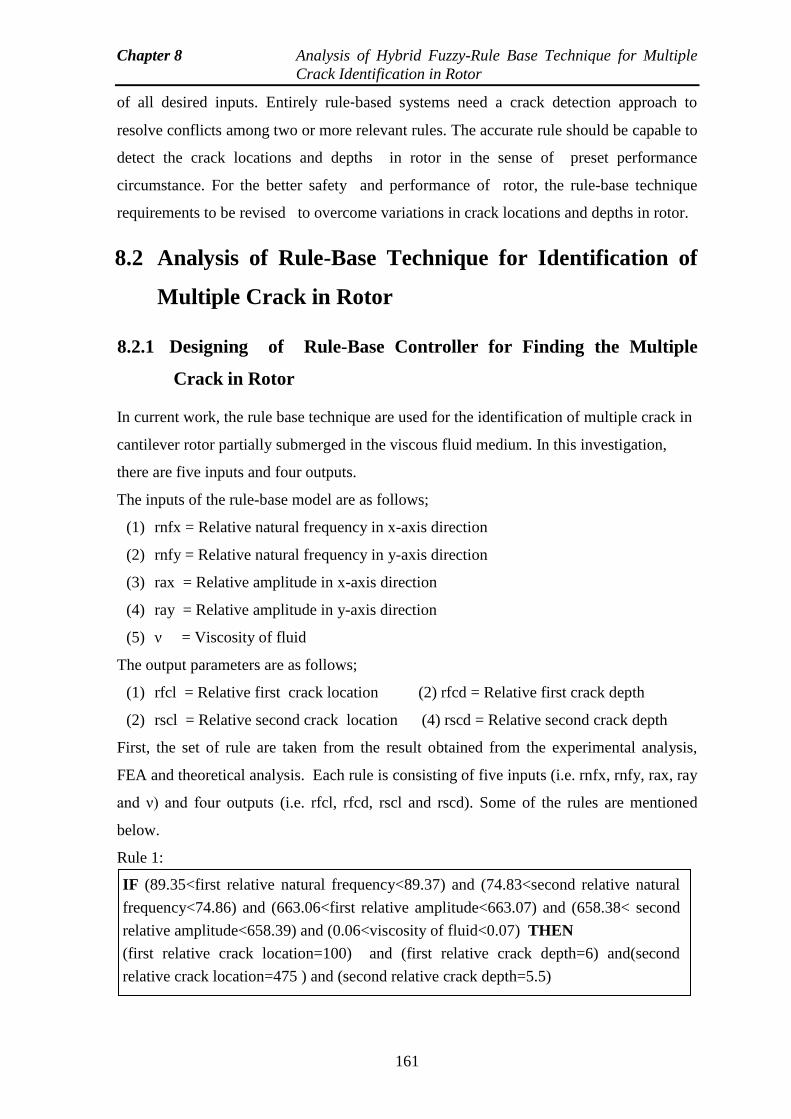
Chapter 8 Analysis of Hybrid Fuzzy-Rule Base Technique for Multiple
Crack Identification in Rotor
161
of all desired inputs. Entirely rule‐based systems need a crack detection approach to
resolve conflicts among two or more relevant rules. The accurate rule should be capable to
detect the crack locations and depths in rotor in the sense of preset performance
circumstance. For the better safety and performance of rotor, the rule-base technique
requirements to be revised to overcome variations in crack locations and depths in rotor.
8.2 Analysis of Rule-Base Technique for Identification of
Multiple Crack in Rotor
8.2.1 Designing of Rule-Base Controller for Finding the Multiple
Crack in Rotor
In current work, the rule base technique are used for the identification of multiple crack in
cantilever rotor partially submerged in the viscous fluid medium. In this investigation,
there are five inputs and four outputs.
The inputs of the rule-base model are as follows;
(1) rnfx = Relative natural frequency in x-axis direction
(2) rnfy = Relative natural frequency in y-axis direction
(3) rax = Relative amplitude in x-axis direction
(4) ray = Relative amplitude in y-axis direction
(5) ν = Viscosity of fluid
The output parameters are as follows;
(1) rfcl = Relative first crack location (2) rfcd = Relative first crack depth
(2) rscl = Relative second crack location (4) rscd = Relative second crack depth
First, the set of rule are taken from the result obtained from the experimental analysis,
FEA and theoretical analysis. Each rule is consisting of five inputs (i.e. rnfx, rnfy, rax, ray
and ν) and four outputs (i.e. rfcl, rfcd, rscl and rscd). Some of the rules are mentioned
below.
Rule 1:
IF (89.35<first relative natural frequency<89.37) and (74.83<second relative natural
frequency<74.86) and (663.06<first relative amplitude<663.07) and (658.38< second
relative amplitude<658.39) and (0.06<viscosity of fluid<0.07) THEN
(first relative crack location=100) and (first relative crack depth=6) and(second
relative crack location=475 ) and (second relative crack depth=5.5)
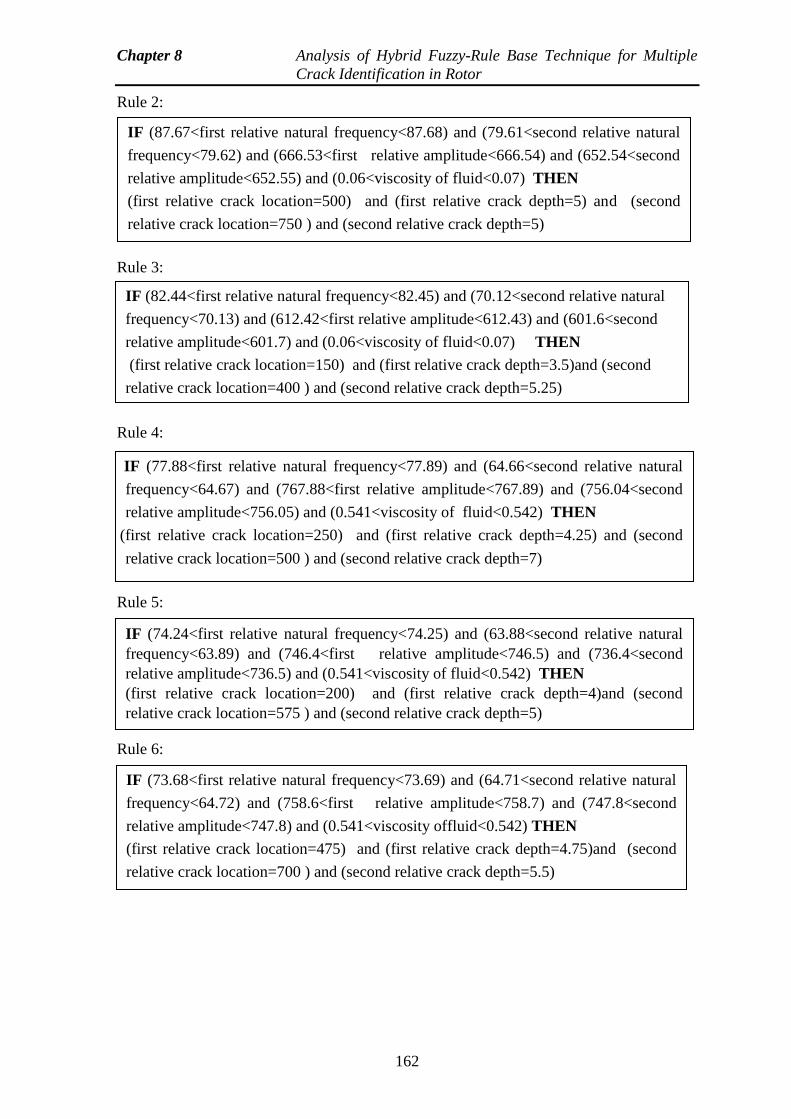
Chapter 8 Analysis of Hybrid Fuzzy-Rule Base Technique for Multiple
Crack Identification in Rotor
162
Rule 2:
Rule 3:
Rule 4:
Rule 5:
Rule 6:
IF (87.67<first relative natural frequency<87.68) and (79.61<second relative natural
frequency<79.62) and (666.53<first relative amplitude<666.54) and (652.54<second
relative amplitude<652.55) and (0.06<viscosity of fluid<0.07) THEN
(first relative crack location=500) and (first relative crack depth=5) and (second
relative crack location=750 ) and (second relative crack depth=5)
IF (82.44<first relative natural frequency<82.45) and (70.12<second relative natural
frequency<70.13) and (612.42<first relative amplitude<612.43) and (601.6<second
relative amplitude<601.7) and (0.06<viscosity of fluid<0.07) THEN
(first relative crack location=150) and (first relative crack depth=3.5)and (second
relative crack location=400 ) and (second relative crack depth=5.25)
IF (77.88<first relative natural frequency<77.89) and (64.66<second relative natural
frequency<64.67) and (767.88<first relative amplitude<767.89) and (756.04<second
relative amplitude<756.05) and (0.541<viscosity of fluid<0.542) THEN
(first relative crack location=250) and (first relative crack depth=4.25) and (second
relative crack location=500 ) and (second relative crack depth=7)
IF (74.24<first relative natural frequency<74.25) and (63.88<second relative natural
frequency<63.89) and (746.4<first relative amplitude<746.5) and (736.4<second
relative amplitude<736.5) and (0.541<viscosity of fluid<0.542) THEN
(first relative crack location=200) and (first relative crack depth=4)and (second
relative crack location=575 ) and (second relative crack depth=5)
IF (73.68<first relative natural frequency<73.69) and (64.71<second relative natural
frequency<64.72) and (758.6<first relative amplitude<758.7) and (747.8<second
relative amplitude<747.8) and (0.541<viscosity offluid<0.542) THEN
(first relative crack location=475) and (first relative crack depth=4.75)and (second
relative crack location=700 ) and (second relative crack depth=5.5)
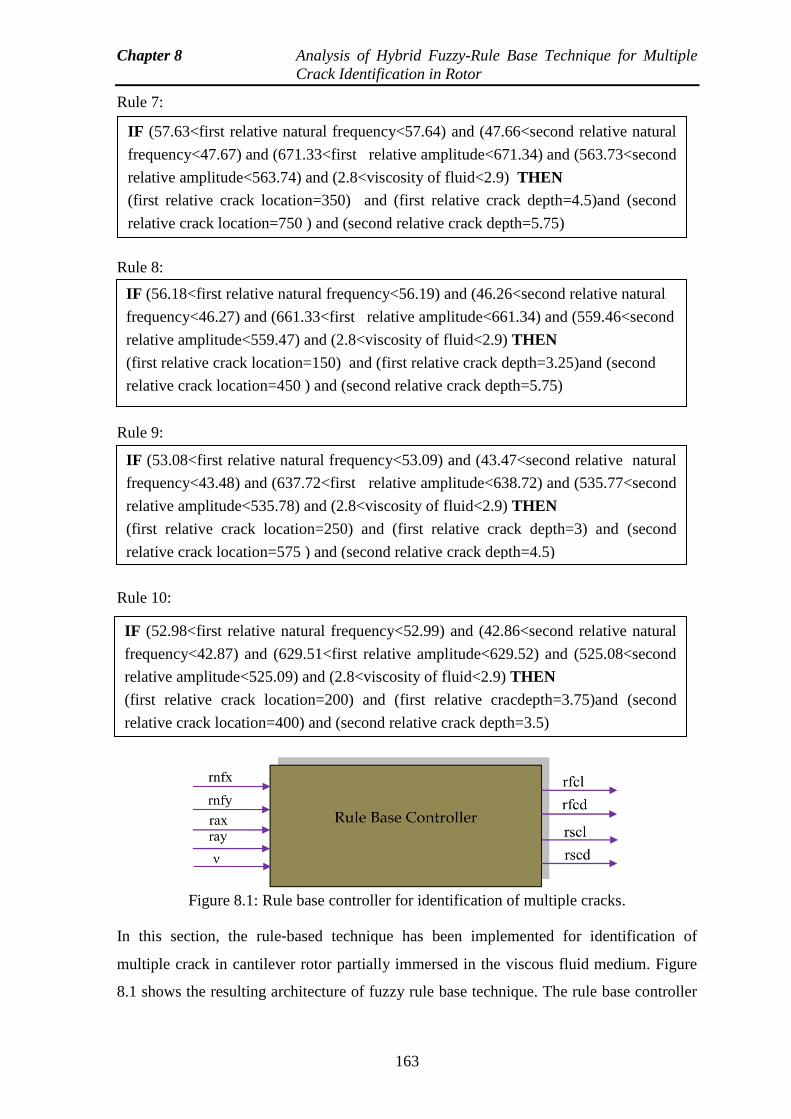
Chapter 8 Analysis of Hybrid Fuzzy-Rule Base Technique for Multiple
Crack Identification in Rotor
163
Rule 7:
Rule 8:
Rule 9:
Rule 10:
Figure 8.1: Rule base controller for identification of multiple cracks.
In this section, the rule‐based technique has been implemented for identification of
multiple crack in cantilever rotor partially immersed in the viscous fluid medium. Figure
8.1 shows the resulting architecture of fuzzy rule base technique. The rule base controller
IF (57.63<first relative natural frequency<57.64) and (47.66<second relative natural
frequency<47.67) and (671.33<first relative amplitude<671.34) and (563.73<second
relative amplitude<563.74) and (2.8<viscosity of fluid<2.9) THEN
(first relative crack location=350) and (first relative crack depth=4.5)and (second
relative crack location=750 ) and (second relative crack depth=5.75)
IF (56.18<first relative natural frequency<56.19) and (46.26<second relative natural
frequency<46.27) and (661.33<first relative amplitude<661.34) and (559.46<second
relative amplitude<559.47) and (2.8<viscosity of fluid<2.9) THEN
(first relative crack location=150) and (first relative crack depth=3.25)and (second
relative crack location=450 ) and (second relative crack depth=5.75)
IF (53.08<first relative natural frequency<53.09) and (43.47<second relative natural
frequency<43.48) and (637.72<first relative amplitude<638.72) and (535.77<second
relative amplitude<535.78) and (2.8<viscosity of fluid<2.9) THEN
(first relative crack location=250) and (first relative crack depth=3) and (second
relative crack location=575 ) and (second relative crack depth=4.5)
IF (52.98<first relative natural frequency<52.99) and (42.86<second relative natural
frequency<42.87) and (629.51<first relative amplitude<629.52) and (525.08<second
relative amplitude<525.09) and (2.8<viscosity of fluid<2.9) THEN
(first relative crack location=200) and (first relative cracdepth=3.75)and (second
relative crack location=400) and (second relative crack depth=3.5)
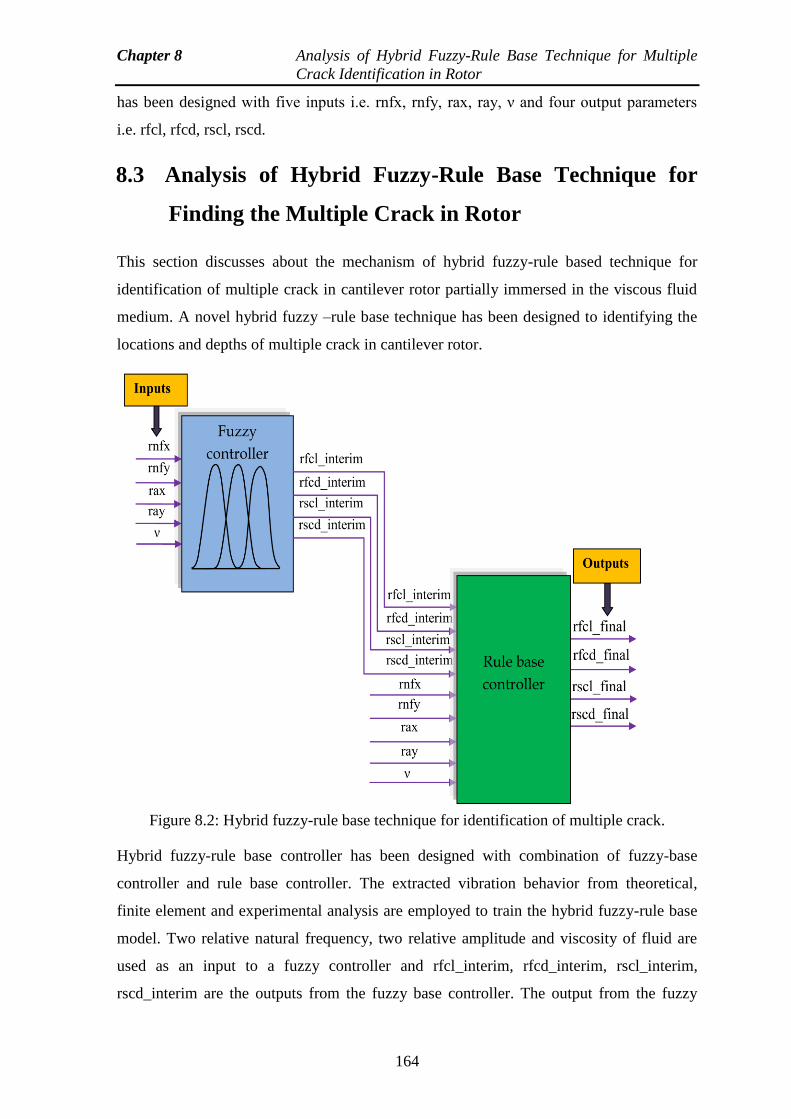
Chapter 8 Analysis of Hybrid Fuzzy-Rule Base Technique for Multiple
Crack Identification in Rotor
164
has been designed with five inputs i.e. rnfx, rnfy, rax, ray, ν and four output parameters
i.e. rfcl, rfcd, rscl, rscd.
8.3 Analysis of Hybrid Fuzzy-Rule Base Technique for
Finding the Multiple Crack in Rotor
This section discusses about the mechanism of hybrid fuzzy-rule based technique for
identification of multiple crack in cantilever rotor partially immersed in the viscous fluid
medium. A novel hybrid fuzzy –rule base technique has been designed to identifying the
locations and depths of multiple crack in cantilever rotor.
Figure 8.2: Hybrid fuzzy-rule base technique for identification of multiple crack.
Hybrid fuzzy-rule base controller has been designed with combination of fuzzy-base
controller and rule base controller. The extracted vibration behavior from theoretical,
finite element and experimental analysis are employed to train the hybrid fuzzy-rule base
model. Two relative natural frequency, two relative amplitude and viscosity of fluid are
used as an input to a fuzzy controller and rfcl_interim, rfcd_interim, rscl_interim,
rscd_interim are the outputs from the fuzzy base controller. The output from the fuzzy
Chapter 8 Analysis of Hybrid Fuzzy-Rule Base Technique for Multiple
Crack Identification in Rotor
165
controller along with two relative natural frequency, two relative amplitude and viscosity
of fluid are fed to the rule base controller. Finally, rfcl_final, rfcd_final, rscl_final,
rscd_final are the output parameters from the hybrid fuzzy-rule base technique. The fuzzy
controller used here is a taken from Chapter‐4. From the previous chapter it is concluded
that gaussian membership function is the best among other membership function.
Therefore gaussian membership function is used in the fuzzy controller. A comparison of
results obtained from theoretical, finite element, gaussian fuzzy, MANFIS, hybrid fuzzy
rule base model and experimental analysis have been presented in Table 8.1 and Table 8.2
and the results are found to be in close agreement. The proposed hybrid fuzzy-rule base
technique can be used as a robust technique to identify multiple crack in cantilever rotor
partially submerged in the viscous medium. The detail architecture of the hybrid fuzzy-
rule base controller model has been shown in Figure 8.2.
8.4 Results and Discussion
The current section of this chapter analyses the results obtained from the developed rule
base technique and hybrid fuzzy-rule base technique employed for identifying the multiple
crack in cantilever rotor partially submerged in the viscous medium. The extracted results
from theoretical, finite element and experimental analysis are used to train the rule base
model and hybrid fuzzy-rule base model. The rule base model has been designed with
inputs i.e. two relative natural frequencies, two relative amplitudes, viscosity of fluid and
outputs i.e. first and second relative crack locations and crack depths. Figure 8.1 illustrates
the architecture of rule base technique.The proposed hybrid fuzzy- rule base system
comprises with two layers. The first layer is the fuzzy base controller, where as the second
layer is rule-base controller. The gaussian membership based fuzzy segment of the hybrid
fuzzy-rule base model has been developed using the set of fuzzy rules, fuzzy linguistic
terms, two relative natural frequencies, two relative amplitudes, viscosity of fluid and the
interim output i.e. the rfcl_interim, rfcd_interim, rscl_interim, rscd_interim.The interim
outputs from the fuzzy base model along with two relative natural frequencies, two
relative amplitudes, viscosity of fluid are fed to the rule base model. Finally, the output
parameters i.e. rfcl_final, rfcd_final, rscl_final, rscd_final are obtained. Figure 8.2
illustrates the architecture of hybrid fuzzy-rule base technique.The depiction of the fuzzy
linguistic terms for the input and output parameters are shown in Table 5.1. and 5.2
represents twenty numbers of the fuzzy rules out of the several hundred fuzzy rules used

Chapter 8 Analysis of Hybrid Fuzzy-Rule Base Technique for Multiple
Crack Identification in Rotor
166
for designing the fuzzy membership functions. A comparison of results obtained from
theoretical, finite element, hybrid fuzzy-rule base model and experimental analysis have
been presented in Table 8.1. The comparision of obtained results from the rule-base
technique, hybrid fuzzy-rule base controller, MANFIS and experimental analysis have
been illustrated in Table 8.2.
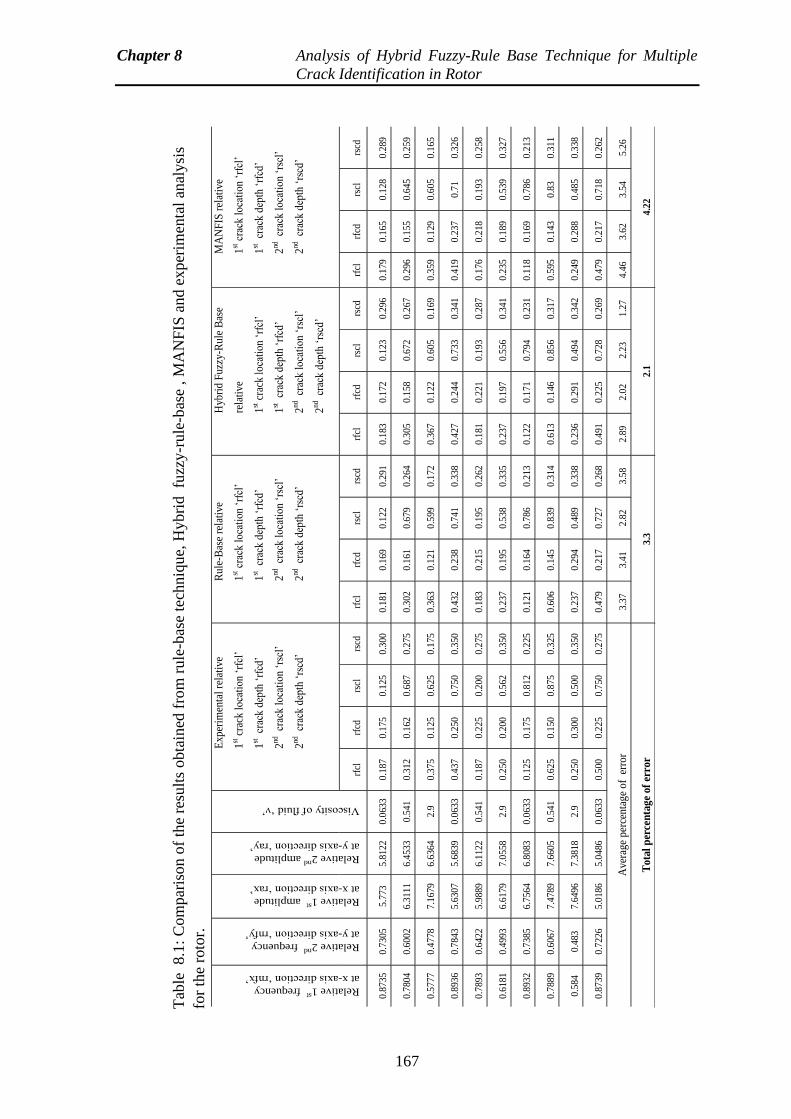
Chapter 8 Analysis of Hybrid Fuzzy-Rule Base Technique for Multiple
Crack Identification in Rotor
167
Tab
le 8.1
: C
om
par
ison o
f th
e re
sult
s obta
ined
fro
m r
ule
-bas
e te
chniq
ue,
Hybri
d fu
zzy
-ru
le-b
ase
, M
AN
FIS
and e
xper
imen
tal
anal
ysi
s
for
the
roto
r.
Relative 1st frequency
at x-axis direction ‘rnfx’
Relative 2nd
frequency
at y-axis direction ‘rnfy’
Relative 1st amplitude
at x-axis direction ‘rax’
Relative 2nd
amplitude
at y-axis direction ‘ray’
Viscosity of fluid ‘ν’
Exp
erim
enta
l re
lati
ve
1st c
rack
lo
cati
on ‘
rfcl
’
1st c
rack
dep
th ‘
rfcd
’
2nd
cr
ack
loca
tio
n ‘
rscl
’
2nd
cr
ack
dep
th ‘
rscd
’
Ru
le-B
ase
rela
tive
1st c
rack
lo
cati
on ‘
rfcl
’
1st c
rack
dep
th ‘
rfcd
’
2nd
cr
ack
loca
tio
n ‘
rscl
’
2nd
cr
ack
dep
th ‘
rscd
’
Hyb
rid
Fu
zzy-
Ru
le B
ase
rela
tive
1st c
rack
lo
cati
on ‘
rfcl
’
1st c
rack
dep
th ‘
rfcd
’
2nd
cr
ack
loca
tio
n ‘
rscl
’
2nd
cr
ack
dep
th ‘
rscd
’
MA
NF
IS r
elat
ive
1st c
rack
lo
cati
on ‘
rfcl
’
1st c
rack
dep
th ‘
rfcd
’
2nd
cr
ack
loca
tio
n ‘
rscl
’
2nd
cr
ack
dep
th ‘
rscd
’
rfcl
rf
cd
rscl
rs
cd
rfcl
rf
cd
rscl
rs
cd
rfcl
rf
cd
rscl
rs
cd
rfcl
rf
cd
rscl
rs
cd
0.8
735
0.7
305
5.7
73
5.8
122
0.0
633
0.1
87
0.1
75
0.1
25
0.3
00
0.1
81
0.1
69
0.1
22
0.2
91
0.1
83
0.1
72
0.1
23
0.2
96
0.1
79
0.1
65
0.1
28
0.2
89
0.7
804
0.6
002
6.3
111
6.4
533
0.5
41
0.3
12
0.1
62
0.6
87
0.2
75
0.3
02
0.1
61
0.6
79
0.2
64
0.3
05
0.1
58
0.6
72
0.2
67
0.2
96
0.1
55
0.6
45
0.2
59
0.5
777
0.4
778
7.1
679
6.6
364
2.9
0
.375
0
.125
0
.625
0
.175
0
.363
0
.121
0
.599
0
.172
0
.367
0
.122
0
.605
0
.169
0
.359
0
.129
0
.605
0
.165
0.8
936
0.7
843
5.6
307
5.6
839
0.0
633
0.4
37
0.2
50
0.7
50
0.3
50
0.4
32
0.2
38
0.7
41
0.3
38
0.4
27
0.2
44
0.7
33
0.3
41
0.4
19
0.2
37
0.7
1 0
.326
0.7
893
0.6
422
5.9
889
6.1
122
0.5
41
0.1
87
0.2
25
0.2
00
0.2
75
0.1
83
0.2
15
0.1
95
0.2
62
0.1
81
0.2
21
0.1
93
0.2
87
0.1
76
0.2
18
0.1
93
0.2
58
0.6
181
0.4
993
6.6
179
7.0
558
2.9
0
.250
0
.200
0
.562
0
.350
0
.237
0
.195
0
.538
0
.335
0
.237
0
.197
0
.556
0
.341
0
.235
0
.189
0
.539
0
.327
0.8
932
0.7
385
6.7
564
6.8
083
0.0
633
0.1
25
0.1
75
0.8
12
0.2
25
0.1
21
0.1
64
0.7
86
0.2
13
0.1
22
0.1
71
0.7
94
0.2
31
0.1
18
0.1
69
0.7
86
0.2
13
0.7
889
0.6
067
7.4
789
7.6
605
0.5
41
0.6
25
0.1
50
0.8
75
0.3
25
0.6
06
0.1
45
0.8
39
0.3
14
0.6
13
0.1
46
0.8
56
0.3
17
0.5
95
0.1
43
0.8
3 0
.311
0.5
84
0.4
83
7.6
496
7.3
818
2.9
0
.250
0
.300
0
.500
0
.350
0
.237
0
.294
0
.489
0
.338
0
.236
0
.291
0
.494
0
.342
0
.249
0
.288
0
.485
0
.338
0.8
739
0.7
226
5.0
186
5.0
486
0.0
633
0.5
00
0.2
25
0.7
50
0.2
75
0.4
79
0.2
17
0.7
27
0.2
68
0.4
91
0.2
25
0.7
28
0.2
69
0.4
79
0.2
17
0.7
18
0.2
62
Ave
rage
per
cen
tag
e o
f e
rro
r 3
.37
3.4
1 2
.82
3.5
8 2
.89
2.0
2 2
.23
1.2
7 4
.46
3.6
2 3
.54
5.2
6
Tota
l p
erce
nta
ge
of
erro
r 3
.3
2.1
4
.22
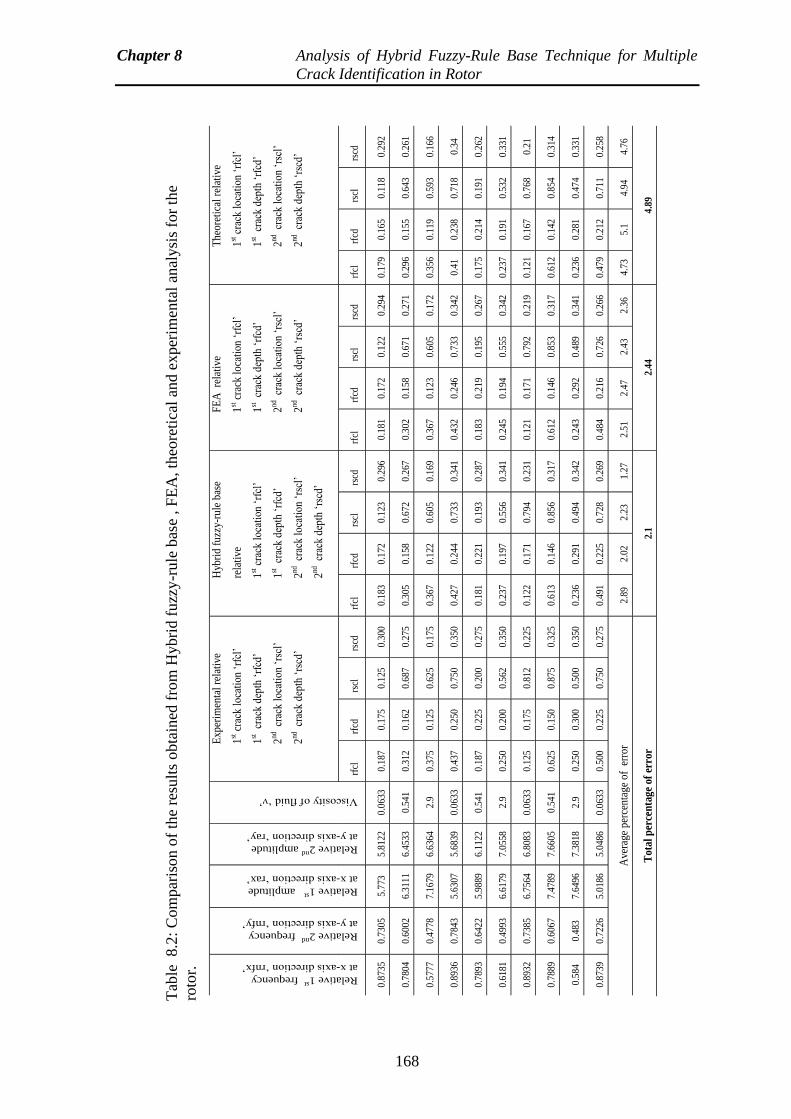
Chapter 8 Analysis of Hybrid Fuzzy-Rule Base Technique for Multiple
Crack Identification in Rotor
168
Tab
le 8.2
: C
om
par
ison o
f th
e re
sult
s obta
ined
fro
m H
ybri
d f
uzz
y-r
ule
bas
e , F
EA
, th
eore
tica
l an
d e
xper
imen
tal
anal
ysi
s fo
r th
e
roto
r.
Relative 1st frequency
at x-axis direction ‘rnfx’
Relative 2nd
frequency
at y-axis direction ‘rnfy’
Relative 1st amplitude
at x-axis direction ‘rax’
Relative 2nd
amplitude
at y-axis direction ‘ray’
Viscosity of fluid ‘ν’
Exp
erim
enta
l re
lati
ve
1st c
rack
loc
atio
n ‘r
fcl’
1st c
rack
dep
th ‘
rfcd
’
2nd c
rack
loc
atio
n ‘r
scl’
2nd c
rack
dep
th ‘
rscd
’
Hyb
rid
fuzz
y-ru
le b
ase
rela
tive
1st c
rack
loc
atio
n ‘r
fcl’
1st c
rack
dep
th ‘
rfcd
’
2nd c
rack
loc
atio
n ‘r
scl’
2nd c
rack
dep
th ‘
rscd
’
FE
A r
elat
ive
1st c
rack
loc
atio
n ‘r
fcl’
1st c
rack
dep
th ‘
rfcd
’
2nd c
rack
loc
atio
n ‘r
scl’
2nd c
rack
dep
th ‘
rscd
’
The
oret
ical
rel
ativ
e
1st c
rack
loc
atio
n ‘r
fcl’
1st c
rack
dep
th ‘
rfcd
’
2nd c
rack
loc
atio
n ‘r
scl’
2nd c
rack
dep
th ‘
rscd
’
rfcl
rfcd
rs
cl
rscd
rf
cl
rf
cd
rscl
rs
cd
rfcl
rfcd
rs
cl
rscd
rf
cl
rf
cd
rscl
rs
cd
0.87
35
0.73
05
5.77
3 5.
8122
0.
0633
0.
187
0.17
5 0.
125
0.30
0 0.
183
0.17
2 0.
123
0.29
6 0.
181
0.17
2 0.
122
0.29
4 0.
179
0.16
5 0.
118
0.29
2
0.78
04
0.60
02
6.31
11
6.45
33
0.54
1 0.
312
0.16
2 0.
687
0.27
5 0.
305
0.15
8 0.
672
0.26
7 0.
302
0.15
8 0.
671
0.27
1 0.
296
0.15
5 0.
643
0.26
1
0.57
77
0.47
78
7.16
79
6.63
64
2.9
0.37
5 0.
125
0.62
5 0.
175
0.36
7 0.
122
0.60
5 0.
169
0.36
7 0.
123
0.60
5 0.
172
0.35
6 0.
119
0.59
3 0.
166
0.89
36
0.78
43
5.63
07
5.68
39
0.06
33
0.43
7 0.
250
0.75
0 0.
350
0.42
7 0.
244
0.73
3 0.
341
0.43
2 0.
246
0.73
3 0.
342
0.41
0.
238
0.71
8 0.
34
0.78
93
0.64
22
5.98
89
6.11
22
0.54
1 0.
187
0.22
5 0.
200
0.27
5 0.
181
0.22
1 0.
193
0.28
7 0.
183
0.21
9 0.
195
0.26
7 0.
175
0.21
4 0.
191
0.26
2
0.61
81
0.49
93
6.61
79
7.05
58
2.9
0.25
0 0.
200
0.56
2 0.
350
0.23
7 0.
197
0.55
6 0.
341
0.24
5 0.
194
0.55
5 0.
342
0.23
7 0.
191
0.53
2 0.
331
0.89
32
0.73
85
6.75
64
6.80
83
0.06
33
0.12
5 0.
175
0.81
2 0.
225
0.12
2 0.
171
0.79
4 0.
231
0.12
1 0.
171
0.79
2 0.
219
0.12
1 0.
167
0.76
8 0.
21
0.78
89
0.60
67
7.47
89
7.66
05
0.54
1 0.
625
0.15
0 0.
875
0.32
5 0.
613
0.14
6 0.
856
0.31
7 0.
612
0.14
6 0.
853
0.31
7 0.
612
0.14
2 0.
854
0.31
4
0.58
4 0.
483
7.64
96
7.38
18
2.9
0.25
0 0.
300
0.50
0 0.
350
0.23
6 0.
291
0.49
4 0.
342
0.24
3 0.
292
0.48
9 0.
341
0.23
6 0.
281
0.47
4 0.
331
0.87
39
0.72
26
5.01
86
5.04
86
0.06
33
0.50
0 0.
225
0.75
0 0.
275
0.49
1 0.
225
0.72
8 0.
269
0.48
4 0.
216
0.72
6 0.
266
0.47
9 0.
212
0.71
1 0.
258
Ave
rage
per
cent
age
of
erro
r 2.
89
2.02
2.
23
1.27
2.
51
2.47
2.
43
2.36
4.
73
5.1
4.94
4.
76
Tot
al p
erce
nta
ge
of e
rror
2
.1
2.4
4 4
.89
Chapter 8 Analysis of Hybrid Fuzzy-Rule Base Technique for Multiple
Crack Identification in Rotor
169
8.5 Summary
This chapter has described rule‐based and hybrid fuzzy-rule based techniques for
identifying the multiple crack in cantilever rotor partially submerged inside the viscous
medium. The following summary can be drawn by analyzing the results in terms of crack
locations and crack depths derived from rule-base controller and hybrid fuzzy rule base
controller. The rule base technique has a set of rules obtained through rule induction and
enhanced with manually derived heuristics. In this chapter, an intelligent hybrid fuzzy-rule
based controller have been presented. The vibration characteristics and property of viscous
fluid derived from theoretical, finite element and experimental analysis for various crack
depths and crack locations for cantilever rotor partially submerged in the viscous
medium.These data is fed as inputs to the hybrid fuzzy-rule base model and outputs are
first and second relative crack depth and location. The gaussian fuzzy model gives most
efficient results. It is suggested that the gaussian fuzzy-base controller is used in the
hybrid fuzzy-rule base controller. The feasibility of rule-base controller and hybrid fuzzy-
rule base model has been verified by experimental examination. It is observed that
percentage of error is least in the rule-based controller when compared with experimental
results.The error 3.3 % for the cantilever rotor. The hybrid fuzzy-rule base controller
produces best results for first and second crack locations and cracks depth in comparison
to other artificial intelligence model.The error is found to be 2.1 % for the cantilever rotor
when diagnosis is done using rule-base technique.
170
Chapter 9
Analysis & Description of Experimental
Investigation
The experimental investigation has been carried out to evaluate the vibration behavior
(natural frequencies and amplitude) of non-cracked and cracked cantilever rotor partially
submerged in the viscous fluid medium for the different combination of crack depths and
crack locations. The dynamic response evaluated from experimental test has been
compared with that of theoretical, numerical and various AI techniques data as discussed
in previous chapters. This chapter addresses the organized experimental investigation
procedure and discusses vibration behavior measuring devices for evaluating the vibration
response of cantilever rotor.
9.1 Detail Specification of Apparatuses used in the
Experimental Analysis
Experiments have been accomplished using the developed experimental setup (Figure 9.1)
for measuring the dynamic response (natural frequency and amplitude of vibration) of the
mild steel cantilever rotor attached disc at the free end (length and radius are 0.8m, 0.01m
respectively).The experiments are conducted for cantilever rotor partially submerged in
the viscous medium. Cracked mild steel rotor specimens have been taken for experimental
analysis with different crack locations and depths. Three different viscous fluids are used
as a viscous medium. The cantilever rotor is connected to the power motor which is
supported by the ball bearing. The cracked, and non-cracked cantilever rotor has been
displaced from its original position while rotating with the help of power motor. The
amplitude of the rotor has been recorded by ultrasonic sensors which are connected to
Arduino micro-controller with the help of jumper wire. The ultrasonic sensors are used for
recognizing the displacement of the rotating rotor from the original position. The sensing
displacement data of ultrasonic sensor are displaced in the computer system with the help
of Arduino microcontroller. The rotating speed of rotor is controlled by the variac.The

Chapter 9 Analysis & Description of Experimental Investigation
171
accessories used in the experimental analysis have been shown in Table 9.1with their
specifications in detail.
Table 9.1: Detail description and specifications of the apparatus used in the experiments
Sl. No. Name of the Instrument Description of Instruments
1
Power motor
Type AC/DC, FHP Motor
125 Watt, 220V,
Speed: 6000RPM
2 Micro-controller Arduino UNO ATmega 328 ,32KB
Operating Voltage 5V, SRAM 2KB
Analog Input Pins 6
Input voltage 6-20V
Digital Input Pins 14
3 Communication USB connection Serial Port
4 Bread board Small Size Bread Board.
5 3 Ultrasonic Sensors Range of distance measure: 0.01m to 4m
6 Power supply 50Hz ,230 to 240v AC
7 Variac Input : 230v, 50 to 60 Hz,
Output: 0 to 270 v
Maximum Load 8 Amp.
8 Vessel Dia. of vessel= 260mm, Height=400mm
9 Display device Computer system
10 Test specimen Double cracked mild steel rotor
Radius of Rotor ( R1) is 0.01m
Length of Rotor( Ls) = 0.8m
11 Techo meter Laser photo /contact tachometer
Detacting 5 digits, 10 mm ( 0.4" ) LCD.
Measuring range 0.5 to 20000 RPM
± ( 0.05% + 1 digit ), RPM only.
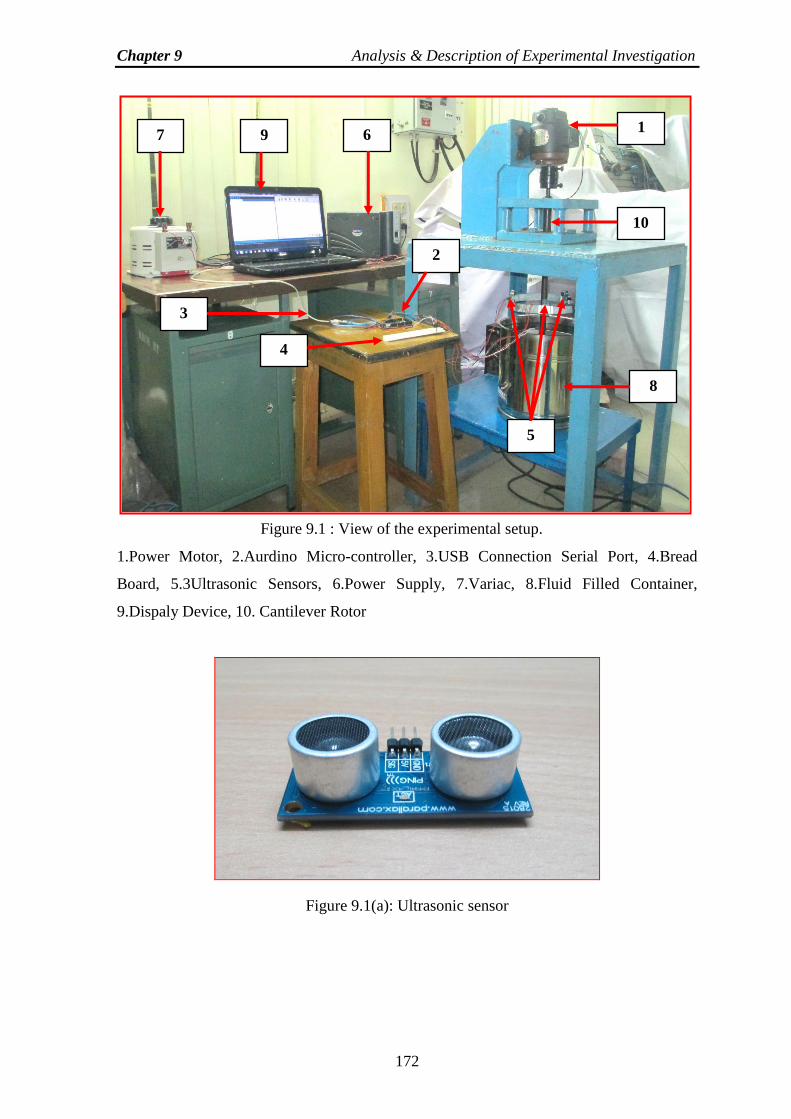
Chapter 9 Analysis & Description of Experimental Investigation
172
Figure 9.1 : View of the experimental setup.
1.Power Motor, 2.Aurdino Micro-controller, 3.USB Connection Serial Port, 4.Bread
Board, 5.3Ultrasonic Sensors, 6.Power Supply, 7.Variac, 8.Fluid Filled Container,
9.Dispaly Device, 10. Cantilever Rotor
Figure 9.1(a): Ultrasonic sensor
7 9 1
4
6
10
5
2
8
3
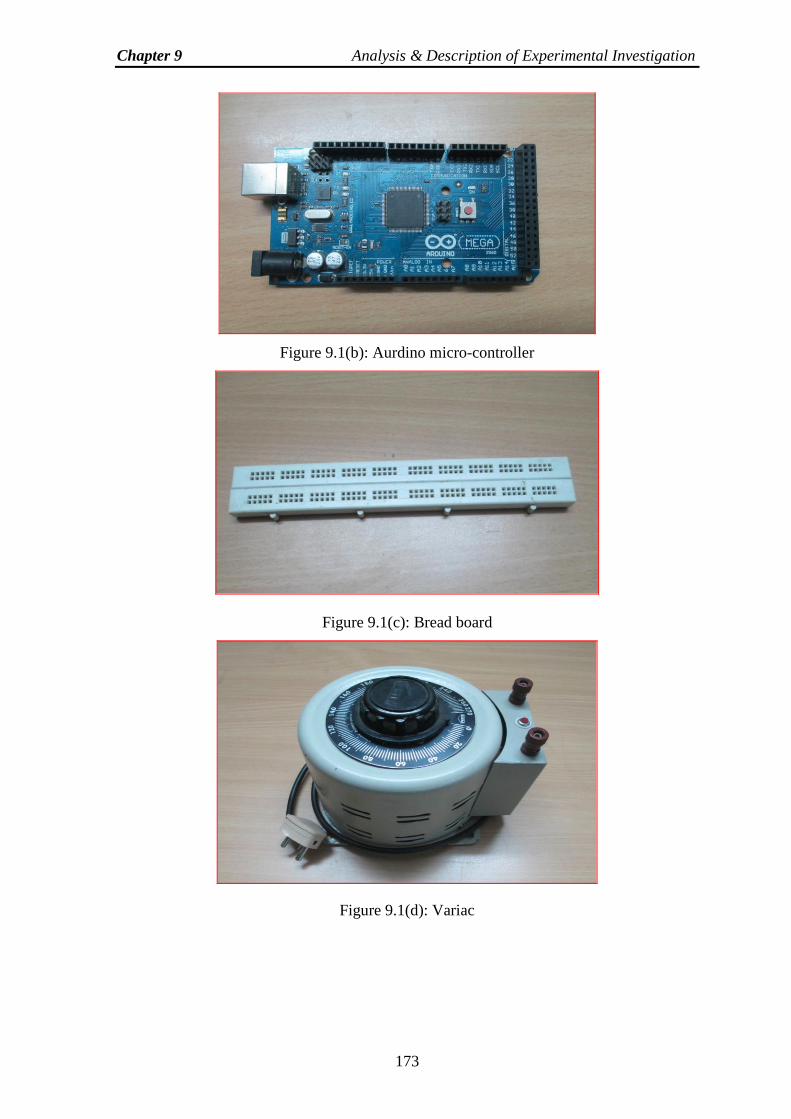
Chapter 9 Analysis & Description of Experimental Investigation
173
Figure 9.1(b): Aurdino micro-controller
Figure 9.1(c): Bread board
Figure 9.1(d): Variac
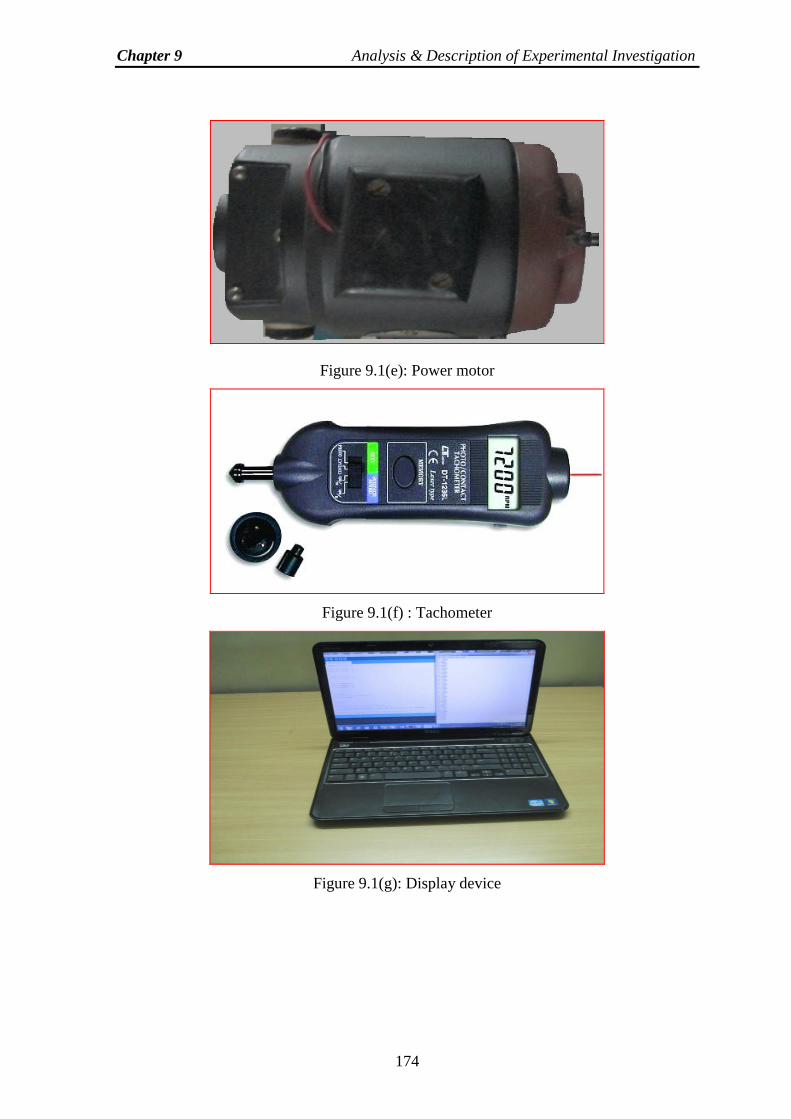
Chapter 9 Analysis & Description of Experimental Investigation
174
Figure 9.1(e): Power motor
Figure 9.1(f) : Tachometer
Figure 9.1(g): Display device
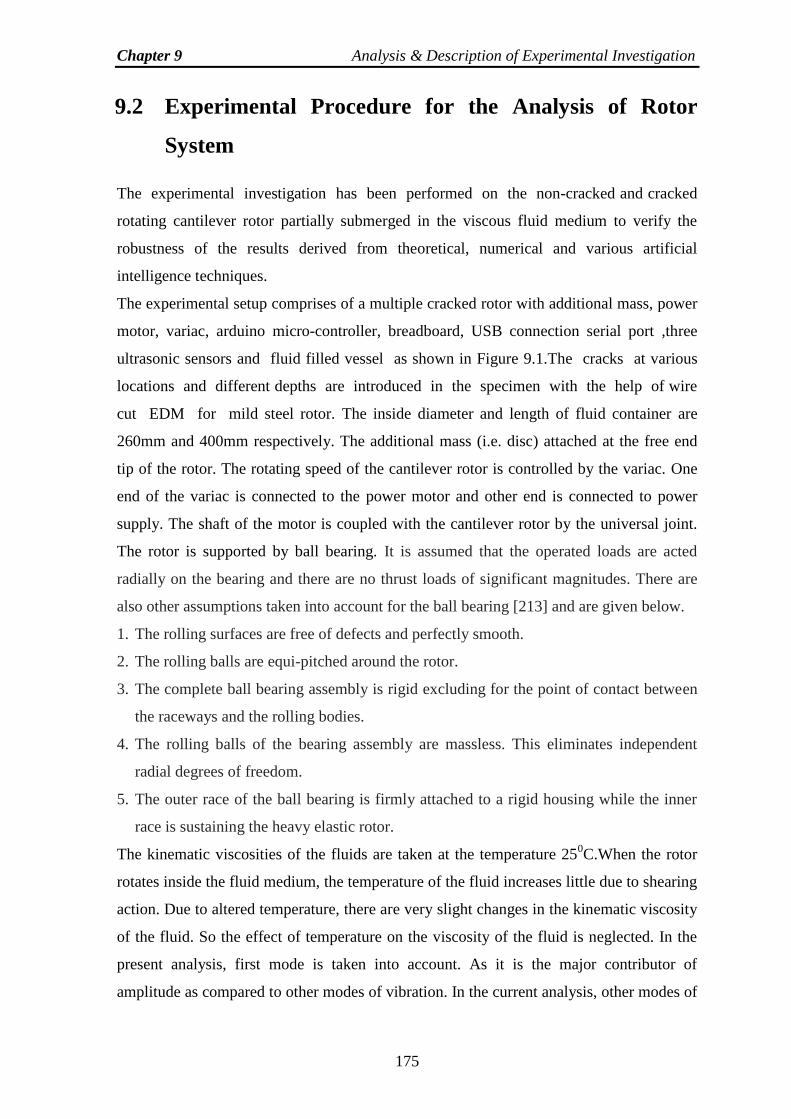
Chapter 9 Analysis & Description of Experimental Investigation
175
9.2 Experimental Procedure for the Analysis of Rotor
System
The experimental investigation has been performed on the non-cracked and cracked
rotating cantilever rotor partially submerged in the viscous fluid medium to verify the
robustness of the results derived from theoretical, numerical and various artificial
intelligence techniques.
The experimental setup comprises of a multiple cracked rotor with additional mass, power
motor, variac, arduino micro-controller, breadboard, USB connection serial port ,three
ultrasonic sensors and fluid filled vessel as shown in Figure 9.1.The cracks at various
locations and different depths are introduced in the specimen with the help of wire
cut EDM for mild steel rotor. The inside diameter and length of fluid container are
260mm and 400mm respectively. The additional mass (i.e. disc) attached at the free end
tip of the rotor. The rotating speed of the cantilever rotor is controlled by the variac. One
end of the variac is connected to the power motor and other end is connected to power
supply. The shaft of the motor is coupled with the cantilever rotor by the universal joint.
The rotor is supported by ball bearing. It is assumed that the operated loads are acted
radially on the bearing and there are no thrust loads of significant magnitudes. There are
also other assumptions taken into account for the ball bearing [213] and are given below.
1. The rolling surfaces are free of defects and perfectly smooth.
2. The rolling balls are equi-pitched around the rotor.
3. The complete ball bearing assembly is rigid excluding for the point of contact between
the raceways and the rolling bodies.
4. The rolling balls of the bearing assembly are massless. This eliminates independent
radial degrees of freedom.
5. The outer race of the ball bearing is firmly attached to a rigid housing while the inner
race is sustaining the heavy elastic rotor.
The kinematic viscosities of the fluids are taken at the temperature 250C.When the rotor
rotates inside the fluid medium, the temperature of the fluid increases little due to shearing
action. Due to altered temperature, there are very slight changes in the kinematic viscosity
of the fluid. So the effect of temperature on the viscosity of the fluid is neglected. In the
present analysis, first mode is taken into account. As it is the major contributor of
amplitude as compared to other modes of vibration. In the current analysis, other modes of
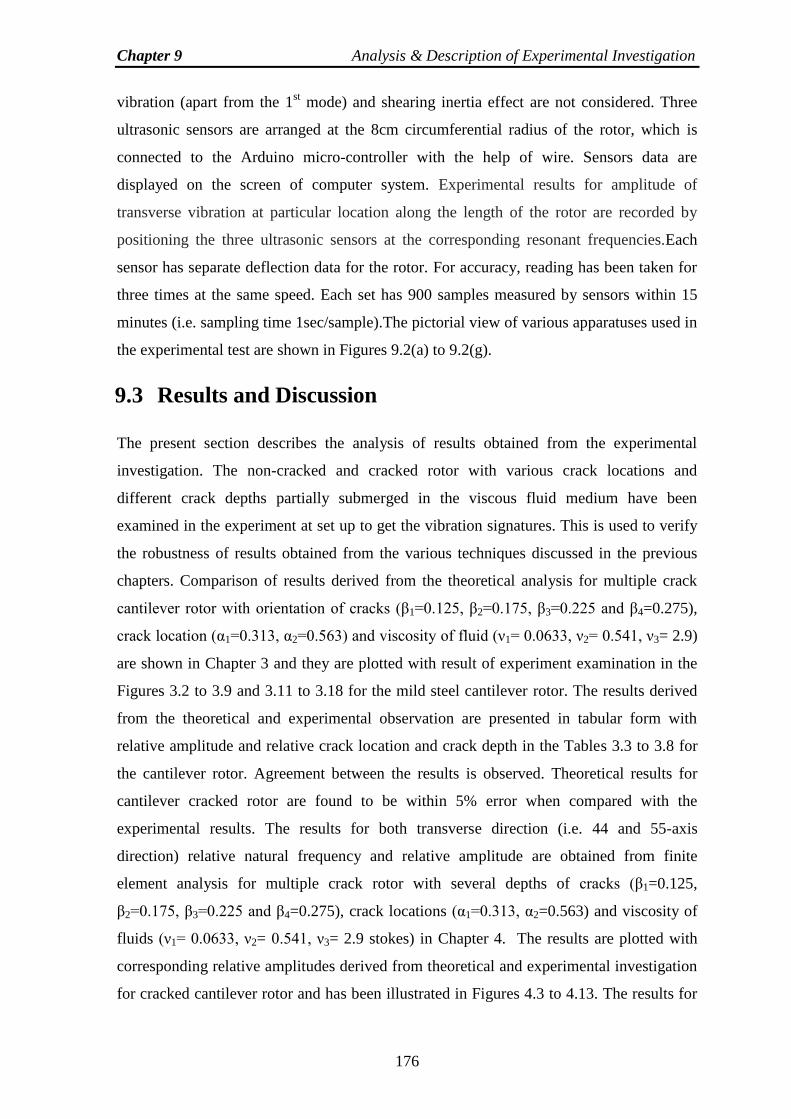
Chapter 9 Analysis & Description of Experimental Investigation
176
vibration (apart from the 1st mode) and shearing inertia effect are not considered. Three
ultrasonic sensors are arranged at the 8cm circumferential radius of the rotor, which is
connected to the Arduino micro-controller with the help of wire. Sensors data are
displayed on the screen of computer system. Experimental results for amplitude of
transverse vibration at particular location along the length of the rotor are recorded by
positioning the three ultrasonic sensors at the corresponding resonant frequencies.Each
sensor has separate deflection data for the rotor. For accuracy, reading has been taken for
three times at the same speed. Each set has 900 samples measured by sensors within 15
minutes (i.e. sampling time 1sec/sample).The pictorial view of various apparatuses used in
the experimental test are shown in Figures 9.2(a) to 9.2(g).
9.3 Results and Discussion
The present section describes the analysis of results obtained from the experimental
investigation. The non-cracked and cracked rotor with various crack locations and
different crack depths partially submerged in the viscous fluid medium have been
examined in the experiment at set up to get the vibration signatures. This is used to verify
the robustness of results obtained from the various techniques discussed in the previous
chapters. Comparison of results derived from the theoretical analysis for multiple crack
cantilever rotor with orientation of cracks (β1=0.125, β2=0.175, β3=0.225 and β4=0.275),
crack location (α1=0.313, α2=0.563) and viscosity of fluid (ν1= 0.0633, ν2= 0.541, ν3= 2.9)
are shown in Chapter 3 and they are plotted with result of experiment examination in the
Figures 3.2 to 3.9 and 3.11 to 3.18 for the mild steel cantilever rotor. The results derived
from the theoretical and experimental observation are presented in tabular form with
relative amplitude and relative crack location and crack depth in the Tables 3.3 to 3.8 for
the cantilever rotor. Agreement between the results is observed. Theoretical results for
cantilever cracked rotor are found to be within 5% error when compared with the
experimental results. The results for both transverse direction (i.e. 44 and 55-axis
direction) relative natural frequency and relative amplitude are obtained from finite
element analysis for multiple crack rotor with several depths of cracks (β1=0.125,
β2=0.175, β3=0.225 and β4=0.275), crack locations (α1=0.313, α2=0.563) and viscosity of
fluids (ν1= 0.0633, ν2= 0.541, ν3= 2.9 stokes) in Chapter 4. The results are plotted with
corresponding relative amplitudes derived from theoretical and experimental investigation
for cracked cantilever rotor and has been illustrated in Figures 4.3 to 4.13. The results for
Chapter 9 Analysis & Description of Experimental Investigation
177
first relative crack depth and crack position and second relative crack location and crack
depth are derived from theoretical, numerical and experimental examination
corresponding to relative natural frequencies and amplitude in both transverse direction.
The results are presented in Tables 4.3 to 4.13 for cantilever rotor. The finite element
analysis results for cantilever cracked rotor are found within 2.5% error when compared
with the experimental results. In Chapter 5, the results derived from Mamdani gaussian
fuzzy, Sugeno gaussian fuzzy, hybrid gaussian fuzzy model and experimental test have
been compared in Table 5.7 for cantilever rotor. Tables 5.3 to 5.6 present the comparison
of results obtained from Mamdani and Sugeno fuzzy model along with three membership
function (Triangular, Gaussian and Trapezoidal) for cantilever rotor. The total percentage
of error of results for Mamdani Triangular fuzzy model is 7.32%, for Mamdani gaussian
fuzzy model is 5.25%, for Mamdani Trapezoidal fuzzy model is 6.77% for the cantilever
rotor. Similarly, total percentage of error of results for Sugeno Triangular fuzzy model is
6.98%, for Sugeno gaussian fuzzy model is 5.01 %, for Sugeno Trapezoidal fuzzy model
is 6.12%. The total percentage of error of results for hybrid gaussian fuzzy model is
4.82%. Chapter 6 presents discussion about BPNN, RBFNN and hybrid BPNN-RBFNN
neural network model. The results derived from BPNN, RBFNN and hybrid BPNN-
RBFNN model are compared with experimental analysis results and have been presented
in Table 6.4 for cantilever rotor. The percentage of total error for BPNN is 5.16% ,for
RBFNN is 4.98% and hybrid BPNN-RBFNN model is 4.60% for cantilever rotor. The
comparison of results derived from MANFIS systems have been displayed in Tables 7.1,
and 7.2 for cantilever rotor. The total percentage of error for MANFIS is 4.22% for
cantilever rotor. The comparison of results obtained from rule base technique have been
presented in Tables 8.1 and 8.2. The total percentage of error for rule-base controller and
hybrid fuzzy-rule base controller is 3.3% and 2.1% respectively. Close proximity is found
between the compared results. After the study of results, it is observed that Sugeno
gaussian fuzzy, RBFNN, hybrid fuzzy,MANFIS, rule-base technique and hybrid fuzzy-
rule base system provides the least error in the result when compared with results obtained
from experimental analysis.
178
Chapter 10
Results and Discussion
10.1 Introduction
This chapter introduces the systematic analysis of performance of various techniques used
for identification of multiple crack in cantilever rotor partially submerged in the viscous
fluid cited in the above chapters. The dynamic responses of cracked rotor have been used
for development of fault diagnosis tool. Several techniques are discussed in the current
dissertation for assessment of multiple crack in cantilever rotor. These techniques are:
theoretical method (Chapter 3), Finite element method (Chapter 4), fuzzy logic system
(Chapter 5), and artificial neural network (Chapter 6), MANFIS (Chapter 7), hybrid fuzzy-
rule base technique (Chapter 8) and experimental investigation (Chapter 9).
10.2 Analysis of Results
Ten techniques have been employed in current research for development of crack
identification tool of cantilever rotor partially immersed in the viscous fluid as discussed
in introduction (Chapter 1). This dissertation comprises two introductory chapters
(Chapter 1- Introduction and Chapter 2 - Literature review) besides eight chapters. This
section addressed the analysis of results derived from various methods cited in different
chapters. The introduction section (Chapter 1) of the thesis addressed aims and objective
along with the motivation factors to carry out current research. The outline of the
dissertation is also discussed in last section of Chapter 1. The literature review (Chapter 2)
part addresses the various methodologies that have been presented by researchers and
engineers for prediction of cracks in structures (i.e. rotor, beam, plate) and machine
components. Finally, this section discusses the results obtained from the investigations.
The vibration response has been obtained by theoretical analysis of rotating non-cracked
and cracked fixed-fixed supported rotor and cantilever rotor partially submerged in the
viscous medium cited in Chapter 3. The whirling position of cantilever rotor with attached
disc at the free end has been illustrated in Figure 3.1. The results obtained from the
theoretical analysis are depends upon viscosity and density, length of rotor, radius of fluid
Chapter 10 Results and Discussion
179
filled container, mass of disc and damping coefficient. Figures 3.2, 3.3, 3.7, 3.8, 3.20 and
3.21 represent the effect of viscosity and density of fluid on the vibration response of non-
cracked rotor. It is observed that as the viscosity and density of the external fluid
increases, the amplitude as well as critical speed decreases. Comparing the results
presented in Figures 3.2-3.3, 3.7-3.8 and 3.20-3.21, it is found that the amplitude of
vibration for the longer rotor is smaller than that of the smaller rotor. This is a peculiar
phenomenon which is caused because of higher values of the virtual mass coefficient and
damping coefficient in case of longer rotor. Figures 3.4 and 3.22 show the effect of gap
ratio (i.e. fluid container radius increases) on the vibration response of non-cracked rotor.
It is observed that the amplitude of rotor increases with the increase in container radius.
Figures 3.5, 3.9 and 3.23 show the virtual mass effect on the amplitude of non-cracked
rotor. It is noticed that as the virtual mass effect increases the amplitude of vibration
decreases and it also decreases the resonance frequency for the rotor. Figures 3.6 and 3.24
illustrate the damping coefficient on the vibration response of rotor. It is observed that the
damping has reduced only the amplitude of vibration rather then shifting the resonance
frequency for the rotor. Figures 3.12, 3.13, 3.26 and 3.27 show the effect of multiple crack
depths on the vibration response of the rotor in the both transverse direction (i.e.44-
direction and 55-direction). It is observed that due to increase in multiple crack depths, the
critical speed as well as amplitude of vibration decreases. The comparison between 44-
direction and 55-direction amplitude of vibration has been presented in the Figures 3.14
and 3.28. It is found that the obtained amplitude of vibration in 44-direction is greater then
the obtained amplitude of vibration in 55-direction of crack in rotor. It is found that there
is significant error in the amplitude and natural frequency due to the presence of a crack.
Figures 3.16 and 3.29 illustrate the effect of virtual mass on the vibration response of the
cracked rotor. A comparison and authentication of the results obtained from theoretical
analysis are plotted with results from experimental analysis and have been plotted in
Figures 3.31 to 3.41. Figures 3.11(a), 3.11(b) and 3.11(c) describe the full view of the
cantilever rotor with crack element, Cross-section of crack element and coupling forces on
the crack element for the theoretical analysis of cracked rotor respectively. Full view of
fixed-fixed rotor and schematic of multiple cracked fixed-fixed rotor submerged in the
viscous fluid have been illustrated in the Figures 3.19 and 3.25 respectively. Schematic
block diagram of experimental setup for the multi-cracked cantilever rotor partially
submerged in the viscous medium has been presented in the Figure 3.30. A comparison
and authentication of the results obtained from the theoretical analysis and experimental
Chapter 10 Results and Discussion
180
analysis have been plotted in Figures 3.31 to 3.41. The result obtained from theoretical
and experimental observation have been presented in Tables 3.3 to 3.8 for cantilever rotor.
The results derived from the theoretical analysis compared with the experimental results
for effect of change in viscosity of fluid on the vibration response of non-cracked
cantilever rotor and has been presented in Table 3.4.The result derived from the
theoretical analysis compared with the experimental results for effect of virtual mass on
vibration behavior of non-cracked and cracked cantilever rotor have been presented in
Tables 3.4 and 3.5 respectively. Tables 3.6 and 3.7 have presented the comparison of
derived theoretical and experimental result for the effect of change in radius of fluid filled
container on non-cracked and cracked cantilever rotor. A comparison between theoretical
and experimental results for the effect of multiple crack depths in crack locations in both
transverse directions (i.e. 44-direction and 55-direction) of cantilever rotor partially
submerged in the viscous fluid medium and has been presented in Table 3.8. As can be
seen, the results obtained using the theoretically shows agreement with the experimental
results.The total percentage of error of finite element analysis is 5% for cantilever
rotor.The finite element based simulation software package ANSYS has been used to
extract vibrational features of cantilever rotor (in Chapter 4). It is noticed that presence of
damage in the form of crack in the cantilever rotor can vary the vibration responses. The
various steps involved in the ANSYS to solve the problem have been discussed. The
results obtained from the finite element method have been authenticated by results of
experimental analysis for the cantilever rotor partially submerged in the viscous medium.
The SOLID187 element is used for the solid mild steel cantilever rotor. The geometry of
the SOLID187 element is presented in Figure 4.1. The FLUID30 3-D acoustic fluid
element is used for the viscous fluid. The geometry of FLUID30 3-D acoustic fluid is
presented in the Figure 4.2. The properties of the mild steel rotor and fluid medium are
presented in Tables 4.1 and 4.2.The results obtained from the finite element analysis are
plotted with results derived from theoretical and experimental analyses for non-cracked
and cracked cantilever rotor partially submerged in the viscous medium and have been
presented in Figures 4.3 to 4.13. The results for 44-direction with altered relative crack
depths and relative crack locations obtained from finite element analysis have been plotted
with results derived from the theoretical and experimental analysis for cracked cantilever
rotor and are shown in Figures 4.8 to 4.10. The results for 55-direction with altered
relative crack depths and relative crack locations obtained from finite element analysis
have been plotted with results derived from the theoretical and experimental analysis for
Chapter 10 Results and Discussion
181
cracked cantilever rotor and are shown in Figures 4.11 to 4.13.The comparison of
obtained FEA result with the theoretical and experimental result for effect of change in
viscosity of fluid on the non-cracked cantilever rotor has been presented in Table 4.3. The
comparison of FEA result with theoretical and experimental result for virtual mass effect
on the non-cracked and cracked cantilever rotor partially submerged in the viscous
medium and have been represented in Tables 4.4 and 4.5 respectively. The comparison
of FEA result with theoretical and experimental results for effect of change in radius of
fluid filled container on the vibration response of non-cracked and cracked cantilever rotor
has been illustrated in Tables 4.6 and 4.7 respectively. The comparison of FEA result
with theoretical and experimental results for the effect of different relative crack depths
and crack locations on the vibration response of the cantilever rotor partially submerged in
the viscous medium in both transverse direction (i.e. 44-direction and 55-direction) have
been presented in the Table 4.8. It is observed that results have good agreement with each
other. The total percentage of error of results from finite element analysis and
experimental results is 3% for cantilever rotor. The analysis of results derived from the
developed fuzzy model for identification of multiple crack in cantilever rotor has been
depicted in Chapter 5. The fuzzy logic system has been developed with simple but
effective architecture for five input variables (relative first natural frequencies, relative
second natural frequency, relative first amplitude, relative second amplitude and viscosity
of fluid) and four output variables (relative first and second crack locations and crack
depths). Three types of membership functions (Triangular, Gaussian and Trapezoidal) are
employed in the development of the Mamdani and Takagi-Sugeno fuzzy system and are
presented in Figures 5.1(a), 5.1(b) and 5.1(c) respectively. The various phase involved in
the fuzzy logic system has been shown in Figure 5.2. The complete structure of the
Mamdani fuzzy system including three different type of membership functions with the
linguistic variable has been illustrated in Figures 5.4 to 5.6.The defuzzification of inputs
using various membership functions (Triangular, Gaussian and Trapezoidal) have been
performed with the help of activated rules 5 and 18 of Table 5.2 and are presented in
Figures 5.7 to 5.9. Figure 5.11 represents the structure of the hybrid fuzzy model. The
results derived from various Mamdani and Takagi-Sugeno fuzzy models (Triangular,
Gaussian and Trapezoidal) and experimental test have been compared in Tables 5.3 and
5.5 respectively for cantilever rotor. Table 5.4 represents the comparison of results
obtained from theoretical, finite element analysis, Mamdani Fuzzy gaussian model and
experimental analysis for cantilever rotor. The comparison of results obtained from
Chapter 10 Results and Discussion
182
theoretical, finite element analysis, Takagi-Sugeno fuzzy gaussian model and
experimental analysis have been represented in Table 5.6.The comparison of results
obtained from the Mamdani gaussian fuzzy, Takagi-Sugeno gaussian fuzzy and hybrid
gaussian fuzzy system have been presented in Table 5.7. The total percentage of error of
results for the Mamdani triangular fuzzy model is 7.32%, for Mamdani gaussian fuzzy
model is 5.25%, for the Mamdani Trapezoidal fuzzy model is 6.77% for the cantilever
rotor. Similarly, the total percentage of error of results for the Sugeno Triangular fuzzy
model is 6.98%, for Sugeno gaussian fuzzy model is 5.01 %, for the Sugeno Trapezoidal
fuzzy model is 6.12% for cantilever rotor. The total percentage of error of results for
hybrid gaussian fuzzy model is 4.82% for cantilever rotor. Chapter 6 depicts the
discussion on the analysis of results derived from various neural models such as BPNN
and RBFNN. Figure 6.1 presents the model of neuron of artificial neural network. Figure
6.2 illustrates the nine-layered Feed forward back propagation neural network techniques
used for identification of first and second crack locations, and crack depths and are
presented in Figure 6.3. First relative natural frequency, second relative natural frequency,
first relative amplitude, second relative amplitude and viscosity of fluid have been used as
input variables to input layer of Feed forward back propagation neural network model.
These input variables process through seven hidden layers then output layer gives first and
second relative crack depths and relative crack locations. The RBFNN is a feed forward,
supervised learning type of neural network. In present work, RBFNN is employed for
localization and quantification of cracks, present in the cantilever rotor partially
submerged in the viscous medium. Similar to BPNN model, RBFNN consists of one input
layer and output layer. But RBFNN has only one hidden layer. Moreover, output layer
gives relative crack locations and crack depths. Figure 6.5 denotes architecture of radial
basis function neural network for identification of multiple crack. The results obtained
from neural network techniques (BPNN and RBFNN) and the experimental test are
compared and close agreement between each other is observed. The results derived from
BPNN model compared with theoretical, finite element and experimental analysis results
are presented in Tables 6.1. The results derived from RBFNN model compared with
theoretical, finite element and experimental analysis results are presented in Tables 6.2.
The total percentage of error for BPNN is 5.16%, for RBFNN is 4.98% and for hybrid
BPNN-RBFNN is 4.60% for the cantilever rotor. The results obtained from BPNN,
RBFNN, Mamdani fuzzy gaussian model and experimental analysis has been compared in
Table 6.3 for cantilever rotor. The results obtained from BPNN, RBFNN, hybrid BPNN-
Chapter 10 Results and Discussion
183
RBFNN and experimental analysis has been compared in Table 6.4. It is observed that the
hybrid BPNN-RBFNN model gives better results as compared to BPNN, RBFNN and the
Mamdani fuzzy gaussian model for the cantilever rotor. Chapter 7 describes the analysis
of results obtained from the Multiple Adaptive neuro fuzzy system (MANFIS). The fuzzy
system with bell-shaped membership function is integrated with MANFIS models for
designing the smart crack identification mechanism for cantilever rotor. Figure 7.1
presents the model of bell shaped membership function and Figures 7.2(a) and 7.2(b)
represent the MANFIS controller and Adaptive neuro fuzzy inference system (ANFIS)
for crack identification in cantilever rotor respectively. First relative natural frequencies,
second relative natural frequencies, first relative amplitude second relative amplitude and
viscosity of fluid are used as inputs to the fuzzy segment of the MANFIS model. The
output of the MANFIS model is first and second relative crack locations and crack depths.
MANFIS can predict the crack depth and its location using the vibration response (i.e.
natural frequency and amplitude) of the rotating cantilever rotor partially submerged in the
viscous medium. The comparison of results derived from MANFIS, RBFNN, Sugeno
fuzzy gaussian model and experimental analysis have been presented in the Table 7.1. The
comparison of results derived from MANFIS, FEA, theoretical and experimental analysis
have been presented in the Table 7.2. The total percentage of error is 4.22% for MANFIS
model for multiple crack identification in the rotor. It is observed that the MANFIS can
predict the crack locations and their intensities and are very close to the results compared
to results from FEA, RBFNN, Sugeno fuzzy gaussian and experimental analysis.The
analysis of results obtained from the developed hybrid fuzzy-rule base model for
identification of multiple crack in cantilever rotor partially submerged in the viscous
medium and has been depicted in Chapter 8. The total percentage of error for rule-base
controller and hybrid fuzzy-rule base controller is 3.3% and 2.1% respectively. The hybrid
fuzzy-rule base controller has given least error as compared to other artificial intelligence
techniques.The experimental investigation is performed to verify the robustness of the
results derived from the theoretical analysis, finite element analysis, fuzzy logic system,
neural network techniques, MANFIS and hybrid fuzzy-rule base technique and is
discussed in Chapter 9. The schematic and snapshot view of the experimental set up with
all required instruments and test specimen are shown in Figures 3.12 and 9.1.The
developed experimental setup comprises of the following apparatuses: 1-Cracked
cantilever rotor, 2-Disk, 3-Fluid filled container, 4-Arduino Micro-controller, 5-Vraiac, 6-

Chapter 10 Results and Discussion
184
Power motor, 8-there ultrasonic sensors.The systematic experimental procedure is
described in the section 9.3 of Chapter 9.
10.3 Summary
After the comprehensive investigation of the current chapter it is observed that the hybrid
fuzzy model provides better results as compared to the results derived from standalone AI
techniques. Among all proposed hybrid models, hybrid fuzzy-rule base technique gives far
better results. The total percentage of error for hybrid fuzzy-rule base model with
experimental results is 2.1%.
185
Chapter 11
Conclusions and Scope for Future
Research
11.1 Introduction
In the current investigation, localization and quantification of crack locations and depths
present in the cantilever rotor partially submerged in the viscous fluid using vibration
response have been addressed. The effects of multiple transverse cracks on cantilever rotor
are analyzed using the intelligent fault diagnosis system. The dynamic responses of
cantilever rotor have been determined using theoretical, finite element and experimental
analysis. The influence of cracks on the dynamic behavior of the rotor is found to be very
sensitive in regards to crack location, crack depth in the viscous medium. The dynamic
response has been adopted to design inverse intelligent crack identification tools such as
fuzzy logic system, neural network, multiple adaptive neuro fuzzy-interference system
(MANFIS) and hybrid fuzzy-rule base technique for assessment of relative crack locations
and relative crack depths.
11.2 Conclusions
The conclusions are drawn on the basis of results derived from various methods as
discussed in the above chapters and are as follows;
The theoretical, finite element and experimental analyses for cantilever rotor containing
multiple transverse crack partially submerged in the viscous fluid have been derived to
evaluate the natural frequencies and amplitude of the system.
The rheological properties (i.e.viscosity and density) of viscous fluid have great
influence on the dynamic response of the spinning rotor. From the theoretical analysis,
it is observed that the resonant frequency of the rotor is decreased with the increasing
viscosity and density of the viscous fluid. Also, the critical speed of the rotor reduces
due to increasing in virtual mass and the amplitude of vibration decreases due to
increasing in damping coefficient factor.
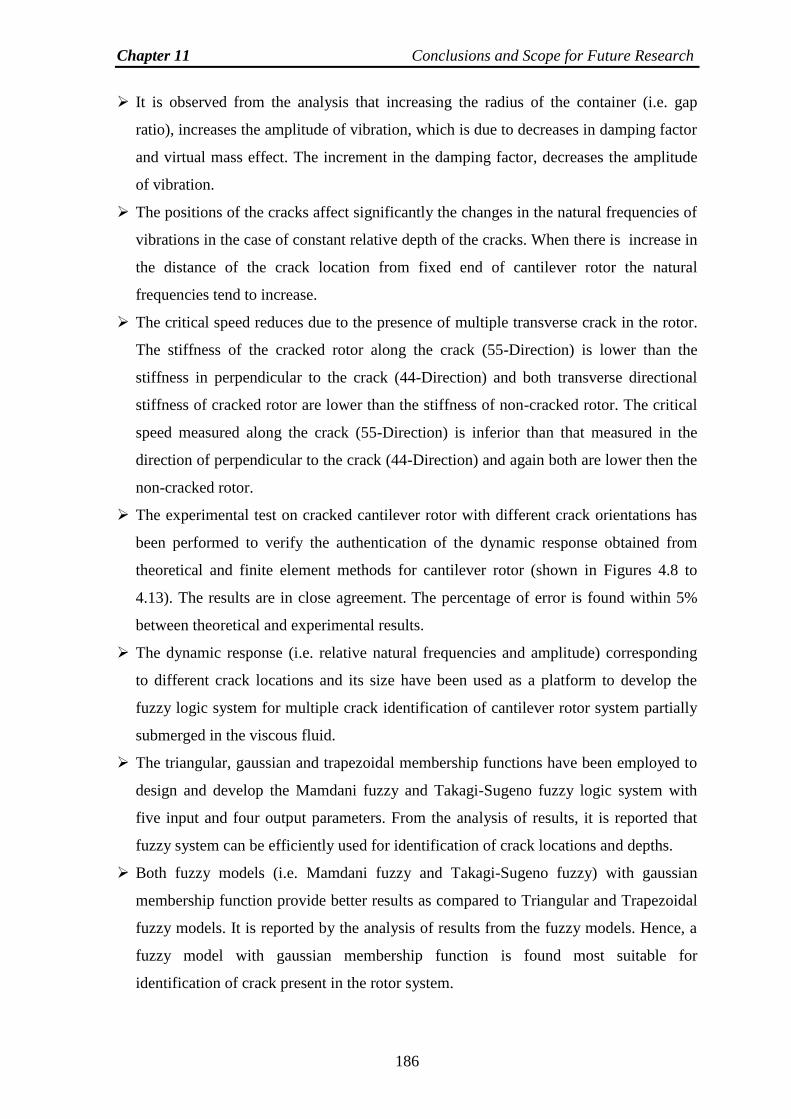
Chapter 11 Conclusions and Scope for Future Research
186
It is observed from the analysis that increasing the radius of the container (i.e. gap
ratio), increases the amplitude of vibration, which is due to decreases in damping factor
and virtual mass effect. The increment in the damping factor, decreases the amplitude
of vibration.
The positions of the cracks affect significantly the changes in the natural frequencies of
vibrations in the case of constant relative depth of the cracks. When there is increase in
the distance of the crack location from fixed end of cantilever rotor the natural
frequencies tend to increase.
The critical speed reduces due to the presence of multiple transverse crack in the rotor.
The stiffness of the cracked rotor along the crack (55-Direction) is lower than the
stiffness in perpendicular to the crack (44-Direction) and both transverse directional
stiffness of cracked rotor are lower than the stiffness of non-cracked rotor. The critical
speed measured along the crack (55-Direction) is inferior than that measured in the
direction of perpendicular to the crack (44-Direction) and again both are lower then the
non-cracked rotor.
The experimental test on cracked cantilever rotor with different crack orientations has
been performed to verify the authentication of the dynamic response obtained from
theoretical and finite element methods for cantilever rotor (shown in Figures 4.8 to
4.13). The results are in close agreement. The percentage of error is found within 5%
between theoretical and experimental results.
The dynamic response (i.e. relative natural frequencies and amplitude) corresponding
to different crack locations and its size have been used as a platform to develop the
fuzzy logic system for multiple crack identification of cantilever rotor system partially
submerged in the viscous fluid.
The triangular, gaussian and trapezoidal membership functions have been employed to
design and develop the Mamdani fuzzy and Takagi-Sugeno fuzzy logic system with
five input and four output parameters. From the analysis of results, it is reported that
fuzzy system can be efficiently used for identification of crack locations and depths.
Both fuzzy models (i.e. Mamdani fuzzy and Takagi-Sugeno fuzzy) with gaussian
membership function provide better results as compared to Triangular and Trapezoidal
fuzzy models. It is reported by the analysis of results from the fuzzy models. Hence, a
fuzzy model with gaussian membership function is found most suitable for
identification of crack present in the rotor system.
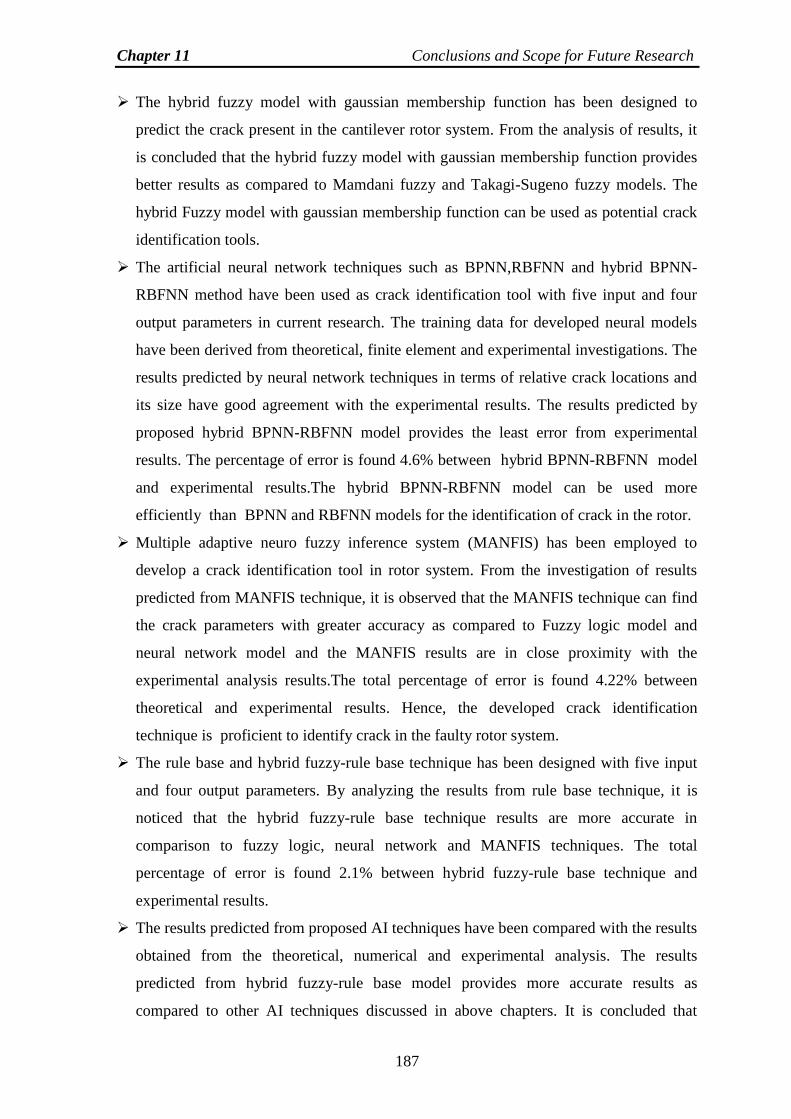
Chapter 11 Conclusions and Scope for Future Research
187
The hybrid fuzzy model with gaussian membership function has been designed to
predict the crack present in the cantilever rotor system. From the analysis of results, it
is concluded that the hybrid fuzzy model with gaussian membership function provides
better results as compared to Mamdani fuzzy and Takagi-Sugeno fuzzy models. The
hybrid Fuzzy model with gaussian membership function can be used as potential crack
identification tools.
The artificial neural network techniques such as BPNN,RBFNN and hybrid BPNN-
RBFNN method have been used as crack identification tool with five input and four
output parameters in current research. The training data for developed neural models
have been derived from theoretical, finite element and experimental investigations. The
results predicted by neural network techniques in terms of relative crack locations and
its size have good agreement with the experimental results. The results predicted by
proposed hybrid BPNN-RBFNN model provides the least error from experimental
results. The percentage of error is found 4.6% between hybrid BPNN-RBFNN model
and experimental results.The hybrid BPNN-RBFNN model can be used more
efficiently than BPNN and RBFNN models for the identification of crack in the rotor.
Multiple adaptive neuro fuzzy inference system (MANFIS) has been employed to
develop a crack identification tool in rotor system. From the investigation of results
predicted from MANFIS technique, it is observed that the MANFIS technique can find
the crack parameters with greater accuracy as compared to Fuzzy logic model and
neural network model and the MANFIS results are in close proximity with the
experimental analysis results.The total percentage of error is found 4.22% between
theoretical and experimental results. Hence, the developed crack identification
technique is proficient to identify crack in the faulty rotor system.
The rule base and hybrid fuzzy-rule base technique has been designed with five input
and four output parameters. By analyzing the results from rule base technique, it is
noticed that the hybrid fuzzy-rule base technique results are more accurate in
comparison to fuzzy logic, neural network and MANFIS techniques. The total
percentage of error is found 2.1% between hybrid fuzzy-rule base technique and
experimental results.
The results predicted from proposed AI techniques have been compared with the results
obtained from the theoretical, numerical and experimental analysis. The results
predicted from hybrid fuzzy-rule base model provides more accurate results as
compared to other AI techniques discussed in above chapters. It is concluded that
Chapter 11 Conclusions and Scope for Future Research
188
hybrid fuzzy-rule base technique can be used as an efficient crack identification tool in
the engineering system.
The developed artificial intelligent fault diagnosis system can be used for identification
of cracks present in cantilever type long rotating shaft used in drilling jigs, high speed
centrifuges, high-speed turbine rotor, mechanical systems, marine structures, various
engineering systems etc. This theory can also be used for fault detection of the rotor
rotating in the viscous medium for conditioning monitoring.
11.3 Future Scope of Research
Bearing characteristics for rotor system play an important role on its dynamics
behaviour, which can be incorporated in the theory for higher accuracy.
The application of AI techniques may be extended to estimation of damage present in
the dynamic engineering system.
The hybridization of AI techniques can be used as an effiecient, accurate and robust
fault detection technique for identification of damage present in various vibrating
dynamic systems such as turbine shafts, helicopter rotors etc.
189
Appendix-A
Crack section
Figure A1: FEA model of crack rotor
Interaction point
of rotor and fluid
Figure A2: FEA model of rotor immersed in the fluid medium
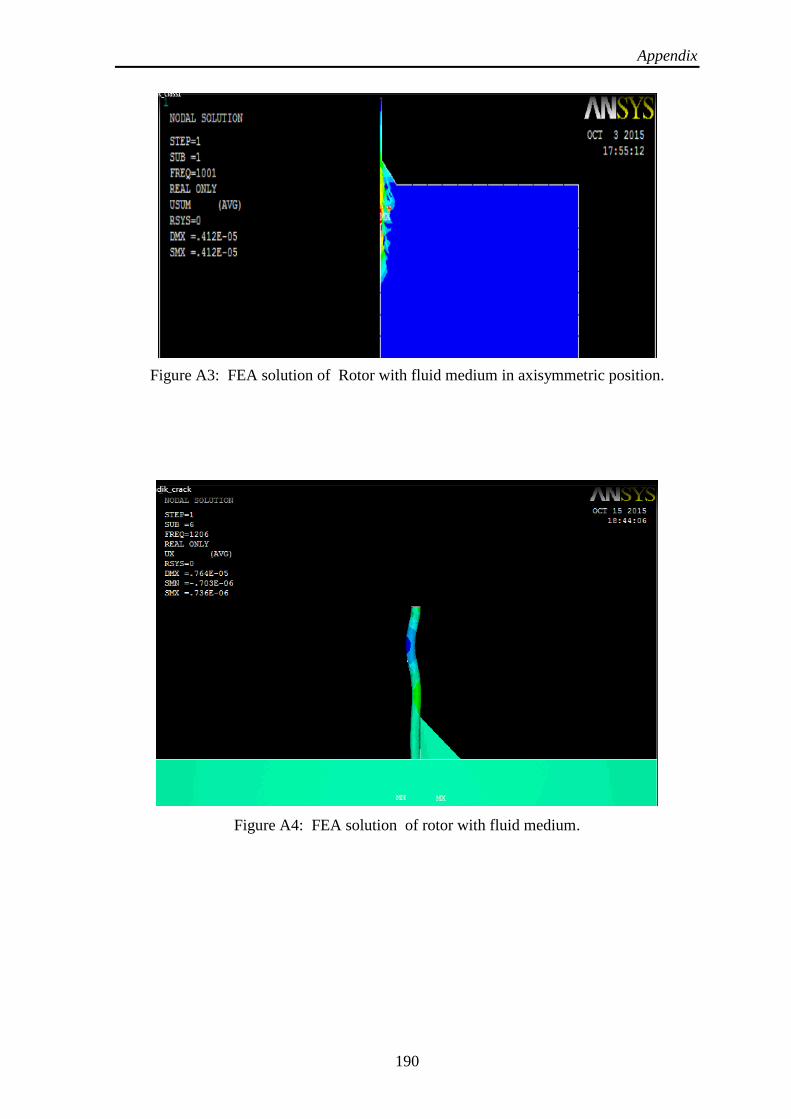
Appendix
190
Figure A3: FEA solution of Rotor with fluid medium in axisymmetric position.
Figure A4: FEA solution of rotor with fluid medium.
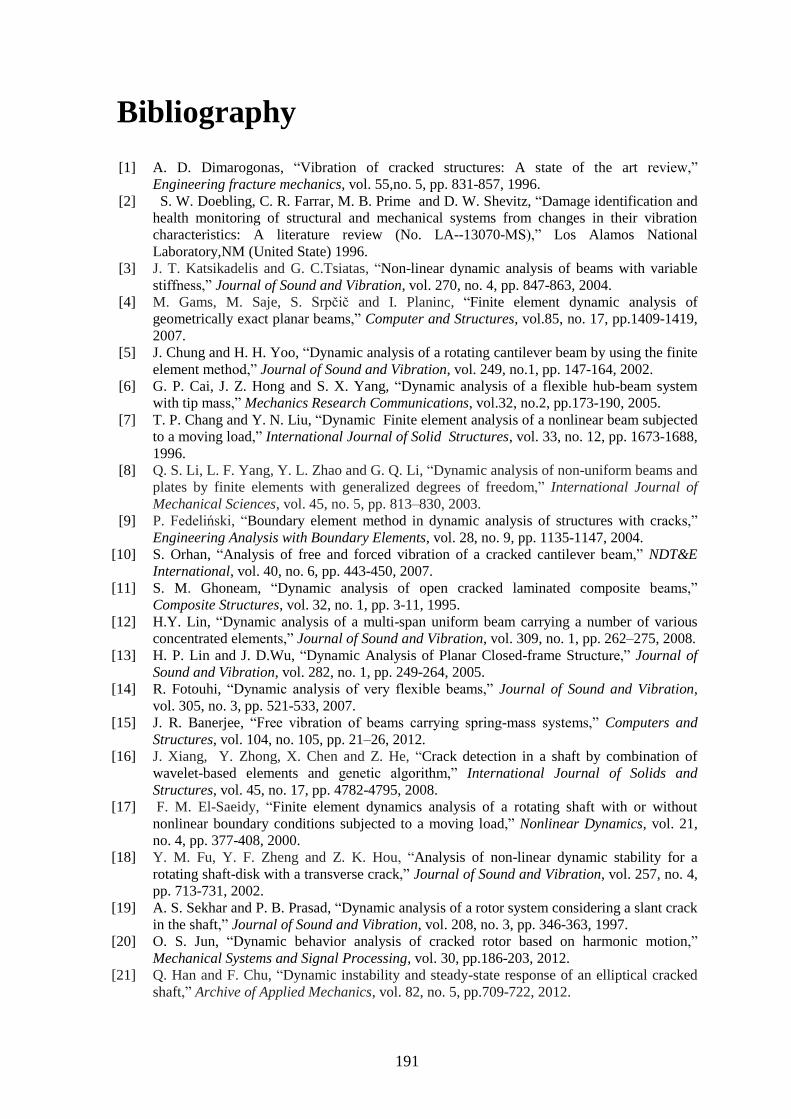
191
Bibliography
[1] A. D. Dimarogonas, “Vibration of cracked structures: A state of the art review,”
Engineering fracture mechanics, vol. 55,no. 5, pp. 831-857, 1996.
[2] S. W. Doebling, C. R. Farrar, M. B. Prime and D. W. Shevitz, “Damage identification and
health monitoring of structural and mechanical systems from changes in their vibration
characteristics: A literature review (No. LA--13070-MS),” Los Alamos National
Laboratory,NM (United State) 1996.
[3] J. T. Katsikadelis and G. C.Tsiatas, “Non-linear dynamic analysis of beams with variable
stiffness,” Journal of Sound and Vibration, vol. 270, no. 4, pp. 847-863, 2004.
[4] M. Gams, M. Saje, S. Srpčič and I. Planinc, “Finite element dynamic analysis of
geometrically exact planar beams,” Computer and Structures, vol.85, no. 17, pp.1409-1419,
2007.
[5] J. Chung and H. H. Yoo, “Dynamic analysis of a rotating cantilever beam by using the finite
element method,” Journal of Sound and Vibration, vol. 249, no.1, pp. 147-164, 2002.
[6] G. P. Cai, J. Z. Hong and S. X. Yang, “Dynamic analysis of a flexible hub-beam system
with tip mass,” Mechanics Research Communications, vol.32, no.2, pp.173-190, 2005.
[7] T. P. Chang and Y. N. Liu, “Dynamic Finite element analysis of a nonlinear beam subjected
to a moving load,” International Journal of Solid Structures, vol. 33, no. 12, pp. 1673-1688,
1996.
[8] Q. S. Li, L. F. Yang, Y. L. Zhao and G. Q. Li, “Dynamic analysis of non-uniform beams and
plates by finite elements with generalized degrees of freedom,” International Journal of
Mechanical Sciences, vol. 45, no. 5, pp. 813–830, 2003.
[9] P. Fedeliński, “Boundary element method in dynamic analysis of structures with cracks,”
Engineering Analysis with Boundary Elements, vol. 28, no. 9, pp. 1135-1147, 2004.
[10] S. Orhan, “Analysis of free and forced vibration of a cracked cantilever beam,” NDT&E
International, vol. 40, no. 6, pp. 443-450, 2007.
[11] S. M. Ghoneam, “Dynamic analysis of open cracked laminated composite beams,”
Composite Structures, vol. 32, no. 1, pp. 3-11, 1995.
[12] H.Y. Lin, “Dynamic analysis of a multi-span uniform beam carrying a number of various
concentrated elements,” Journal of Sound and Vibration, vol. 309, no. 1, pp. 262–275, 2008.
[13] H. P. Lin and J. D.Wu, “Dynamic Analysis of Planar Closed-frame Structure,” Journal of
Sound and Vibration, vol. 282, no. 1, pp. 249-264, 2005.
[14] R. Fotouhi, “Dynamic analysis of very flexible beams,” Journal of Sound and Vibration,
vol. 305, no. 3, pp. 521-533, 2007.
[15] J. R. Banerjee, “Free vibration of beams carrying spring-mass systems,” Computers and
Structures, vol. 104, no. 105, pp. 21–26, 2012.
[16] J. Xiang, Y. Zhong, X. Chen and Z. He, “Crack detection in a shaft by combination of
wavelet-based elements and genetic algorithm,” International Journal of Solids and
Structures, vol. 45, no. 17, pp. 4782-4795, 2008.
[17] F. M. El-Saeidy, “Finite element dynamics analysis of a rotating shaft with or without
nonlinear boundary conditions subjected to a moving load,” Nonlinear Dynamics, vol. 21,
no. 4, pp. 377-408, 2000.
[18] Y. M. Fu, Y. F. Zheng and Z. K. Hou, “Analysis of non-linear dynamic stability for a
rotating shaft-disk with a transverse crack,” Journal of Sound and Vibration, vol. 257, no. 4,
pp. 713-731, 2002.
[19] A. S. Sekhar and P. B. Prasad, “Dynamic analysis of a rotor system considering a slant crack
in the shaft,” Journal of Sound and Vibration, vol. 208, no. 3, pp. 346-363, 1997.
[20] O. S. Jun, “Dynamic behavior analysis of cracked rotor based on harmonic motion,”
Mechanical Systems and Signal Processing, vol. 30, pp.186-203, 2012.
[21] Q. Han and F. Chu, “Dynamic instability and steady-state response of an elliptical cracked
shaft,” Archive of Applied Mechanics, vol. 82, no. 5, pp.709-722, 2012.
Bibliography
192
[22] M. D. Rajab and A. Al-Sabeeh, “Vibrational characteristics of cracked shafts,” Journal of
Sound and Vibration, vol.147, no. 3, pp. 465-473, 1991.
[23] T. C. Tsai and Y. Z. Wang, “Vibration analysis and diagnosis of a cracked shaft,” Journal of
Sound and Vibration, vol. 192, no. 3, pp. 596-519, 1996.
[24] S. K. Singh and R. Tiwari, “Identification of a multi-crack in a shaft system using transverse
frequency response functions,” Mechanism and Machine Theory, vol. 45, no. 12, pp. 1813-
1827, 2010.
[25] C. A. Papadopoulos and A. D. Dimarogonas, “Coupled longitudinal and bending vibrations
of a rotating shaft with an open crack,” Journal of Sound and Vibration, vol. 117, no. l, pp.
81-93, 1987.
[26] M. S. Nerantzaki and J. T. Katsikadelis, “Nonlinear dynamic analysis of circular plates with
varying thickness,” Archive of Applied Mechanics, vol. 77, no. 6, pp. 381–391, 2007.
[27] S. H. Hashemi, S. Farhadi and S. Carra, “Free vibration analysis of rotating thick
plates,”Journal of Sound and Vibration. Vol. 323, no. 1, pp. 366–384, 2009.
[28] X. Si, W. Lu and F. Chu, “Dynamic analysis of rectangular plates with a single side crack
and in contact with water on one side based on the Rayleigh-Ritz method,” Journal of Fluids
and Structures, vol. 34, pp. 90-104, 2012.
[29] M. H. Hsu, “Vibration analysis of edge-cracked beam on elastic foundation with axial
loading using the differential quadrature method,” Computer Methods in Applied Mechanics
and Engineering, vol. 194, no. 1, pp. 1-17, 2005.
[30] O. S. Jun, H. J. Eun, Y. Y. Earmme and C. W. Lee, “Modeling and vibration analysis of a
simple rotor with a breathing crack,” Journal of Sound and Vibration, vol. 155, no. 2, pp.
273-290, 1992.
[31] A. K. Darpe, K. Gupta and A. Chawla, “Dynamics of a two-crack rotor,” Journal of Sound
and Vibration, vol. 259, no. 3, pp. 649-675, 2003.
[32] I. Takahashi, “Vibration and stability of a cracked shaft simultaneously subjected to a
follower force with an axial force,” International Journal of Solid Structures, vol. 35, no.
23, pp. 3071-3080, 1998.
[33] J. Buśkiewicz, “A dynamic analysis of a coupled beam/slider system,” Applied
Mathematical Modelling, vol. 32, no. 10, pp. 1941–1955, 2008.
[34] H. Nahvi and M. Jabbari, “Crack detection in beams using experimental modal data and
finite element model,” International Journal of Mechanical Sciences, vol. 47, no. 10, pp.
1477-1497, 2005.
[35] H. Y. Hwang and C. Kim, “Damage detection in structures using a few frequency
responses measurements,” Journal of Sound and Vibration, vol. 270, no. 1, pp. 1–14, 2004.
[36] B. Binici, “Vibration of beams with multiple open cracks subjected to axial force,” Journal
of Sound and Vibration, vol. 287, no. 1, pp. 277–295, 2005.
[37] E. Çam, S. Orhan and M., Lüy, “An analysis of cracked beam structure using impact echo
method,” NDT&E International, vol. 38, no. 5, pp. 368–373, 2005.
[38] O. S. Jun and M. S. Gadala, “Dynamic behavior analysis of cracked rotor,” Journal of Sound
and Vibration, vol. 309, no. 1, pp. 210-245, 2008.
[39] A. Prokić and D. Lukić, “Dynamic analysis of thin-walled closed-section beams,” Journal
of Sound and Vibration, vol. 302, no. 4, pp. 962–980, 2007.
[40] P. N. Saavedra and L. A. Cuitino, “Crack detection and vibration behavior of cracked
beam,” Computers and Structures, vol. 79, no. 16, pp. 1451-1459, 2001.
[41] L. W. Chen and H. K. Chen, “Stability analyses of a cracked shaft subjected to the end
load,” Journal of Sound and Vibration, vol.188, no. 4, pp. 497-513, 1995.
[42] G. L. Qian, S. N. Gu and J. S. Jiang, “The dynamic behavior and crack detection of a beam
with a crack,” Journal of Sound and Vibration, vol.138, no. 2, pp. 233-243, 1990.
[43] J. J. Sinou and A. W. Lees, “The influence of cracks in rotating shaft,” Journal of Sound and
Vibration, vol. 285, no. 4, pp. 1015–1037, 2005.
[44] C. Song, F. Tin-Loi and W. Gao, “Transient dynamic analysis of interface in anisotropic
biomaterials by the scaled boundary finite-element method,” International Journal of Solids
and Structures, vol. 47, pp. 978-989, 2010.
Bibliography
193
[45] M. R. Arruda and L. M. S. Castro, “Structural dynamic analysis using hybrid and mixed
finite element models,” Finite Elements in Analysis and Design, vol. 57, pp. 43-54, 2012.
[46] B. K. Eshmatov, “Dynamic stability of viscoelastic plates under increasing compressing
loads,” Journal of Applied Mechanics and Technical Physics, vol. 47, no. 2, pp. 289-297,
2006.
[47] L. Cheng and M. Hatam, “Vibrational analysis of point-coupled structures,” Thin-Walled
Structures, vol. 36, no. 3, pp. 197-212, 2000.
[48] D. P. Patil and S. K. Maiti, Detection of multiple cracks using frequency
measurements,” Engineering Fracture Mechanics, vol. 70, no. 12, pp.1553-1572, 2003.
[49] S. Ebersbach and Z. Peng, “Expert system development for vibration analysis in machine
condition monitoring,” Expert systems with applications, vol. 34, no. 1, pp. 291-299, 2008.
[50] M. N. Cerri, M. Dilena and G. C. Ruta, “Vibration and damage detection in undamaged and
cracked circular arches: experimental and analytical results,” Journal of sound and
vibration, vol. 314, no. 1, pp. 83-94, 2008.
[51] J. Humar, A. Bagchi and H. Xu, “Performance of vibration-based techniques for the
identification of structural damage,” Structural Health Monitoring, vol. 5, no. 3, pp. 215-
241, 2006.
[52] Y. He, J. Ye, X. Chen and Z. He, “Discussion on calculation of the local flexibility due to
the crack in a pipe,” Mechanical systems and signal processing, vol. 23, no. 3, pp. 804-810,
2009.
[53] J. Zou, J. Chen, J. C. Niu and Z. M. Geng, “Discussion on the local flexibility due to the
crack in a cracked rotor system,” Journal of Sound and Vibration, vol. 262, no. 2, pp. 365-
369, 2003.
[54] T. H. Patel and A. K. Darpe, “Influence of crack breathing model on nonlinear dynamics of
a cracked rotor,” Journal of Sound and Vibration, vol. 311, no. 3, pp. 953-972, 2008.
[55] N. Bachschmid, P. Pennacchi and E. Tanzi, “Some remarks on breathing mechanism, on
non-linear effects and on slant and helicoidal cracks,” Mechanical Systems and Signal
Processing, vol. 22, no. 4, pp. 879-904, 2008.
[56] J. T. Sawicki, M. I. Friswell, Z. Kulesza, A. Wroblewski and J. D. Lekki,” Detecting
cracked rotors using auxiliary harmonic excitation,” Journal of Sound and Vibration, vol.
330, no. 7, pp.1365-1381, 2011.
[57] L. Xiao-feng, X. Ping-yong, S. Tie-lin and Y. Shu-zi, “Nonlinear analysis of cracked rotor
with whirling,” Applied Mathematics and Mechanics, vol. 23, no. 6, pp.721-731, 2002.
[58] C. Zhu, D. A. Robb and D. J. Ewins, “The dynamics of a cracked rotor with an active
magnetic bearing,” Journal of Sound and Vibration, vol. 265, no. 3, pp. 469–487, 2003.
[59] A. P. Bovsunovskii, On determination of the natural frequency of transverse and
longitudinal vibrations of cracked beam: part 1: analytical approach,” Strength of Materials,
vol. 31, no. 2, pp. 130-137, 1999.
[60] P. C. Müller, J. Bajkowski and D. Söffker, “Chaotic motions and fault detection in a cracked
rotor,” Nonlinear Dynamics, vol. 5, no. 2, pp. 233-254, 1994.
[61] T. Zhou, Z. Sun, J. Xu and W. Han, “Experimental analysis of cracked rotor,” Journal of
Dynamic Systems, Measurement and Control, vol.127, no. 3, pp. 313-320, 2005.
[62] Y. Ishida and T. Inoue, “Detection of a rotor crack using harmonic excitation and nonlinear
vibration analysis,” Journal of Vibration and Acoustics, vol. 128, no. 6, pp. 741-749, 2006.
[63] W. Qin, G. Chen and X. Ren, “Grazing bifurcation in the response of cracked jeffcott rotor,”
Nonlinear Dynamics, vol. 35, no. 2, pp. 147-157, 2004.
[64] J. K. Sinha, “Higher order spectra for crack and misalignment identification in the shaft of a
rotating machine,” Structural Health Monitoring, vol. 6, no. 4, pp. 325-334, 2007.
[65] T. R. Babu, S. Srikanth and A. S. Sekhar, “Hilbert–Huang transform for detection and
monitoring of crack in a transient rotor,” Mechanical Systems and Signal Processing, vol.
22, no. 4, pp. 905-914, 2008.
[66] D. Guo and Z. K. Peng, “Vibration analysis of a cracked rotor using Hilbert–Huang
transform,” Mechanical Systems and Signal Processing, vol. 21, no. 8, pp. 3030-3041, 2007.
[67] Q. Han, J. Zhao and F. Chu, “Dynamic analysis of a geared rotor system considering a slant
crack on the shaft,” Journal of Sound and Vibration, vol. 331, no. 26, pp. 5803-5823, 2012.
Bibliography
194
[68] H. M. Khanlo, M. Ghayour and S. Ziaei-Rad, “The effects of lateral-torsional coupling on
the nonlinear dynamic behavior of a rotating continuous flexible shaft-disk system with rub-
impact,” Communications in Nonlinear Science and Numerical Simulation, vol. 18, no. 6,
pp. 1524-1538, 2013.
[69] C. Guo, M. A. AL-Shudeifat, J. Yan, L.A. Bergman, D. M. McFarland and E. A. Butcher,
“Stability analysis for transverse breathing cracks in rotor systems,” European Journal of
Mechanics A/Solids, vol. 42, pp. 27-34, 2013.
[70] N. M. Auciello and G. Nole, “Vibrations of a cantilever tapered beam with varying section
properties and carrying a mass at the free end,” Journal of Sound and Vibration, vol. 214,
no. 1, pp. 105-119, 1998.
[71] S. Caddemi, I. Caliò and M. Marletta, “The non-linear dynamic response of the Euler-
Bernoulli beam with an arbitrary number of switching cracks,” International Journal of
Non-Linear Mechanics, vol. 45, no. 7, pp. 714-726, 2010.
[72] A. Presas, D. Valentin, E. Egusquiza and C. Valero, “Influence of the rotation on the
natural frequencies of a submerged-confined disk in water,” Journal of Sound and Vibration,
vol. 337, pp. 161-180, 2015.
[73] A. K. Darpe, K. Gupta and A. Chawla, “Dynamics of a bowed rotor with a transverse
surface crack,” Journal of Sound and Vibration, vol. 296, no. 4, pp. 888-907, 2006.
[74] S. K. Georgantzinos and N. K. Anifantis, “An insight into the breathing mechanism of a
crack in a rotating shaft,” Journal of Sound and Vibration, vol. 318, no. 1, pp. 279-295,
2008.
[75] N. Bachschmid and E. Tanzi, “Deflections and strains in cracked shafts due to rotating
loads: A numerical and experimental analysis international,” Journal of Rotating Machinery,
vol. 10, no. 4, pp. 283–291, 2003.
[76] A. S. Sekhar, Vibration characteristics of a cracked rotor with two open cracks,” Journal of
Sound and Vibration, vol. 223, no. 4, pp. 497-512, 1999.
[77] A. C. Chasalevris and C. A. Papadopoulos, “Identification of multiple cracks in beams under
bending,” Mechanical Systems and Signal Processing, vol. 20, no.7, pp.1631-1673, 2006.
[78] A. Nandi, Reduction of finite element equations for a rotor model on non-isotropic spring
support in a rotating frame,” Finite Elements in Analysis and Design, vol. 40, no. 9, pp. 935-
952, 2004.
[79] A. A. Mohamed, R. Neilson, P. MacConnell, N. C. Renton and W. Deans, “Monitoring of
fatigue crack stages in a high carbon steel rotating shaft using vibration,” Procedia
Engineering, vol. 10, pp. 130-135, 2011.
[80] P. R. Baviskar and V. B. Tungikar, “Analysis of crack in shaft of blower using finite
element analysis and experimental technique,” International Journal of Research and
Reviews in Applied Sciences, vol. 8, no. 1, pp. 30-36, 2011.
[81] A. Hossain, L. Humphrey and A. Mian, “Prediction of the dynamic response of a mini
cantilever beam partially submerged in viscous media using finite element method,” Finite
Elements in Analysis and Design, vol. 48, no. 1, pp.1339-1345, 2012.
[82] S. K. Georgantzinos and N. K. Anifantis, “An insight into the breathing mechanism of a
crack in a rotating shaft,” Journal of Sound and Vibration, vol. 318, no. 1, pp. 279-295,
2008.
[83] Y. Kerboua, A. A. Lakis, M. Thomas and L. Marcouiller, “Vibration analysis of rectangular
plates coupled with fluid,” Applied Mathematical Modelling, vol. 32, no. 12, pp. 2570-2586,
2008.
[84] A. K. Darpe, “A novel way to detect transverse surface crack in a rotating shaft,” Journal of
Sound and Vibration, vol. 305, no. 1, pp.151-171, 2007.
[85] A. K. Darpe, “Coupled vibrations of a rotor with slant crack,” Journal of Sound and
Vibration, vol. 305, no. 1, pp.172-193, 2007.
[86] A. K. Darpe,” Dynamics of a jeffcott rotor with slant crack,” Journal of Sound and
Vibration, vol. 303, pp. 1–28, 2007.
[87] M. Silani, S. Ziaei-Rad and H. Talebi, “Vibration analysis of rotating systems with open
and breathing cracks,” Applied Mathematical Modelling, vol. 37, no. 24, pp. 9907-9921,
2013.
Bibliography
195
[88] Z. Kulesza, “Dynamic behavior of cracked rotor subjected to multisine excitation,” Journal
of Sound and Vibration, vol. 333, no. 5, pp. 1369-137, 2014.
[89] A. S. Sekhar and P. B. Prasad, “Dynamic analysis of a rotor system considering a slant crack
in the shaft,” Journal of Sound and Vibration, vol. 208, no. 3, pp. 346-363, 1997.
[90] K. V. Nguyen and H. T. Tran, “Multi-cracks detection of a beam-like structure based on the
on-vehicle vibration signal and wavelet analysis,” Journal of Sound and Vibration, vol. 329,
no. 21, pp. 4455-4465, 2010.
[91] Z. Ren, S. Zhou, E. Chunhui, M. Gong, B. Li and B. Wen, “Crack fault diagnosis of rotor
systems using wavelet transforms,” Computers & Electrical Engineering, vol. 45, pp. 33-41,
2015.
[92] B. Yang, C. S. Suh and A. K. Chan, “Characterization and detection of crack-induced rotary
instability,” Journal of Vibration and Acoustics, vol. 124, no. 1, pp. 40-48, 2002.
[93] J. Xiang, X. Chen, Q. Mo and Z. He, “Identification of crack in a rotor system based on
wavelet finite element method,” Finite Elements in Analysis and Design, vol. 43, no.14, pp.
1068-1081, 2007.
[94] Z. Jibing, G. Hangshan and G. Yinchao, “Application to wavelet transform to bifurcation
and chaos study,” Applied mathematics and mechanics,vol. 19, no. 6, pp. 593-599, 1998.
[95] J. Ma, J. Xue, S. Yang and Z. He, “A study of the construction and application of a
Daubechies wavelet-based beam element,” Finite Elements in Analysis and Design, vol. 39,
no. 10, pp. 965-975, 2003.
[96] B. Li, X. F. Chen, J. X. Ma and Z. J. He, “Detection of crack location and size in structures
using wavelet finite element methods,” Journal of Sound and Vibration, vol. 285, no. 4, 767-
782, 2005.
[97] J. Gomez-Mancilla, J. J. Sinou, V. R. Nosov, F. Thouverez and A. Zambrano, “The
influence of crack-imbalance orientation and orbital evolution for an extended cracked
jeffcott rotor,” Comptes Rendus Mecaniques, vol. 332, no. 12, pp. 955-962, 2004.
[98] R. Gasch, “Dynamic behavior of the laval rotor with a transverse crack,” Mechanical
Systems and Signal Processing, vol. 22, no. 4, pp. 790-804, 2008.
[99] R. Sino, T. N. Baranger, E. Chatelet and G. Jacquet, “Dynamic analysis of a rotating
composite shaft,” Composites Science and Technology, vol. 68, no. 2, pp. 337-345, 2008.
[100] J. Wang, D. Qin and T. C. Lim, “Dynamic analysis of horizontal axis wind turbine by thin-
walled beam theory,” Journal of Sound and Vibration, vol. 329, no. 17, pp. 3565-3586,
2010.
[101] T. Szolc, P. Tauzowski, R. Stocki and J. Knabel, “Damage identification in vibrating rotor-
shaft systems by efficient sampling approach,” Mechanical Systems and Signal Processing,
vol. 23, no. 5, pp.1615-1633, 2009.
[102] M. J. Gómez, C. Castejón and J. C. García-Prada, “Crack detection in rotating shafts based
on 3 × energy: Analytical and experimental analyses,” Mechanism and Machine Theory, vol.
96, pp. 94-106, 2016.
[103] N. G. Shulzhenko and G. B. Ovcharova, “Effect of break of the elastic axis of a rotor with
transverse crack on its vibrational characteristics,” Strength of Materials, vol. 29, no. 4, pp.
382-385, 1997.
[104] H. B. Dong, X. F. Chen, B. Li, K. Y. Qi and Z. J. He, “Rotor crack detection based on
high-precision modal parameter identification method and wavelet finite element model,”
Mechanical Systems and Signal Processing, vol. 23, no. 3, pp. 869-883, 2009.
[105] C. M. Stoisser and S. Audebert, A comprehensive theoretical, numerical and experimental
approach for crack detection in power plant rotating machinery,” Mechanical Systems and
Signal Processing, vol. 22, no. 4, pp. 818-844, 2008.
[106] F. Mueller, A. Scholz and C. Berger, Comparison of different approaches for estimation of
creep crack initiation,” Engineering Failure Analysis, vol. 14, no. 8, pp.1574-1585, 2007.
[107] C. Chen, L. Dai and Y. Fu, Nonlinear response and dynamic stability of a cracked rotor,”
Communications in Nonlinear Science and Numerical Simulation, vol. 12, no. 6, pp. 1023-
1037, 2007.
Bibliography
196
[108] P. Pennacchi and A. Vania, “Diagnostics of a crack in a load coupling of a gas turbine
using the machine model and the analysis of the shaft vibrations,” Mechanical Systems and
Signal Processing, vol. 22, no. 5, pp. 1157-1178, 2008.
[109] M. Shahgholi, S. E. Khadem and S. Bab, “Free vibration analysis of a nonlinear slender
rotating shaft with simply support conditions,” Mechanism and Machine Theory, vol. 82,
pp.128-140, 2014.
[110] C. N. Phan, M. Aureli and M. Porfiri, “Finite amplitude vibrations of cantilevers of
rectangular cross sections in viscous fluids,” Journal of Fluids and Structures, vol. 40, pp.
52-69, 2013.
[111] O. Curadelli, D. Ambrosini, A. Mirasso and M. Amani, “Resonant frequencies in an
elevated spherical container partially filled with water: FEM and measurement,” Journal of
Fluids and Structures, vol. 26, no. 1, pp. 148-159, 2010.
[112] M. Chouksey, J. K. Dutt and S. V. Modak, “Modal analysis of rotor-shaft system under the
influence of rotor-shaft material damping and fluid film forces,” Mechanism and Machine
Theory, vol. 48, pp. 81-93, 2012.
[113] C. C. Liang, C. C. Liao, Y. S. Tai and W. H. Lai, “The free vibration analysis of
submerged cantilever plates,” Ocean Engineering, vol. 28, no. 9, pp.1225-1245, 2001.
[114] A. Uściłowska and J. A. Kołodziej, “Free vibration of immersed column carrying a tip
mass,” Journal of Sound and Vibration, vol. 216, no. 1, pp. 147-157, 1998.
[115] M. R. Arruda and L. M. S. Castro, “Structural dynamic analysis using hybrid and mixed
finite element models. Finite Elements in Analysis and Design, 57: 43-54, 2012.
[116] S. K. Singh and R. Tiwari, “Detection and localisation of multiple cracks in a shaft
system:An experimental investigation. Measurement, vol. 53, pp. 182-193, 2014.
[117] L. Rubio, B. Muñoz-Abella and G. Loaiza, “Static behaviour of a shaft with an elliptical
crack,” Mechanical Systems and Signal Processing, vol. 25, no. 5, pp.1674-1686, 2011.
[118] A. Vaziri and H. Nayeb-Hashemi, “The effect of crack surface interaction on the stress
intensity factor in mode III crack growth in round shafts,” Engineering Fracture Mechanics,
vol. 72, no. 4, pp. 617-629, 2005.
[119] A. A. Gubran and J. K. Sinha, “Shaft instantaneous angular speed for blade vibration in
rotating machine,” Mechanical Systems and Signal Processing, vol. 44, no. 1, pp. 47–59,
2014.
[120] B. Eftekharnejad, A. Addali, and D. Mba, “Shaft crack diagnostics in a gearbox,” Applied
Acoustics, vol. 73, no. 8, pp. 723-733, 2012.
[121] R. T. Liong and C. Proppe, “Application of the cohesive zone model for the evaluation of
stiffness losses in a rotor with a transverse breathing crack,” Journal of Sound and
Vibration, vol. 332, no. 8, pp. 2098-2110, 2013.
[122] O. M. Abuzeid and M. H. Dado, “Fractal model to predict the crack roughness effect on the
local bending compliance of circular shafts,” International Journal of Mechanical Sciences,
vol. 46, no. 5, pp. 695-702, 2004.
[123] L. Cheng, N. Li, X. F. Chen and Z. J. He, “The influence of crack breathing and imbalance
orientation angle on the characteristics of the critical speed of a cracked rotor,” Journal of
Sound and Vibration, vol. 330, no. 9, pp. 2031-2048, 2011.
[124] Y. Yadykin, V. Tenetov and D. Levin,” The added mass of a flexible plate oscillating in a
fluid, Journal of Fluids and Structures, vol. 17, no. 1, pp.115-123, 2003.
[125] Y. Fu and W. G. Price, Interactions between a partially or totally immersed vibrating
cantilever plate and the surrounding fluid,” Journal of Sound and Vibration, vol. 118,
no. 3, pp. 495-513, 1987.
[126] K. Wada, N. Hayano and H. Oka, “Application of the fuzzy control method for level
control of a hopper,” Advance Power Technol, vol. 2, no. 3, pp. 163-172, 1991.
[127] R. Ganguli, A fuzzy logic system for ground based structural health monitoring of a
helicopter rotor using modal data, Journal of Intelligent Material Systems and Structures,
vol. 12, no. 6, pp. 397-407, 2001.
[128] L. J. De Miguel and L. F. Blázquez, “Fuzzy logic-based decision-making for fault diagnosis
in a DC motor,” Engineering Applications of Artificial Intelligence, vol. 18, no. 4, pp. 423-
450, 2005.
Bibliography
197
[129] C. W. Chen, “Stability conditions of fuzzy systems and its application to structural and
mechanical systems,” Advances in Engineering Software, vol. 37, no. 9, pp. 624-629, 2006.
[130] T. Boutros and M. Liang, “Mechanical fault detection using fuzzy index fusion,”
International Journal of Machine Tools and Manufacture, vol. 47, no. 11, pp.1702-1714,
2007.
[131] L. Zhang, Z. Wang and S. Zhao, “Short-term fault prediction of mechanical rotating parts
on the basis of fuzzy-grey optimising method,” Mechanical Systems and Signal Processing,
vol. 21, no. 2, pp. 856-865, 2007.
[132] Y. M. Kim, C. K. Kim, and G. H. Hong, “Fuzzy set based crack diagnosis system for
reinforced concrete structures, “Computers and Structures, vol. 85, no. 23, pp.1828-1844,
2007.
[133] P. Angelov, E. Lughofer and X. Zhou, “Evolving fuzzy classifiers using different model
architectures,” Fuzzy Sets and Systems, vol. 159, no. 23, pp. 3160-3182, 2008.
[134] M. Chandrashekhar and R. Ganguli, “Damage assessment of structures with uncertainty by
using mode shape curvatures and fuzzy logic,” Journal of Sound and Vibration, vol.326, no.
3, pp. 939-957, 2009.
[135] N. Saravanan, S. Cholairajan and K. I. Ramachandran, “Vibration-based fault diagnosis of
spur bevel gear box using fuzzy technique,” Expert Systems with Applications, vol. 36, no.
2, pp.3119-3135, 2009.
[136] Q. Wu and R. Law, “Complex system fault diagnosis based on a fuzzy robust wavelet
support vector classifier and an adaptive gaussian particle swarm optimization,” Information
Sciences, vol. 180, no. 23, pp. 4514-4528, 2010.
[137] D. R. Parhi and S. Choudhury, “Smart crack detection of a cracked cantilever beam using
fuzzy logic technology with hybrid membership functions,” Journal of Engineering and
Technology Research, vol. 3, no. 8, pp. 270-278, 2011.
[138] H. H. Choi and J. W. Jung, “Takagi–Sugeno fuzzy speed controller design for a permanent
magnet synchronous motor,” Mechatronics, vol. 21, no. 8, pp.1317-1328, 2011.
[139] R. P. Hasanzadeh, S. H. H. Sadeghi, M. Ravan, A. R. Moghaddamjoo and R. Moini, “A
fuzzy alignment approach to sizing surface cracks by the ac field measurement technique,”
NDT&E International, vol. 44, no.1, pp. 75-83, 2011.
[140] V. Sugumaran and K. I. Ramachandran, “Fault diagnosis of roller bearing using fuzzy
classifier and histogram features with focus on automatic rule learning,” Expert Systems with
Applications, vol. 38, no. 5, pp. 4901-4907, 2011.
[141] D. K. Mohanta, P. K. Sadhu and R. Chakrabarti, “Fuzzy Markov model for determination of
fuzzy state probabilities of generating units including the effect of maintenance scheduling,”
IEEE Transactions on Power Systems, vol. 20, no. 4, pp. 2117-2124, 2005.
[142] D. R. Parhi, “Navigation of mobile robots using a fuzzy logic controller,” Journal of
Intelligent and Robotic Systems, vol. 42, no. 3, pp. 253-273, 2005.
[143] S. W. Liu, J. H. Huang, J. C. Sung and C. C. Lee, “Detection of cracks using neural
networks and computational mechanics,” Computer Methods in Applied Mechanics and
Engineering, vol. 191, no. 25, pp. 2831-2845, 2002.
[144] X. Fang, H. Luo and J. Tang, “Structural damage detection using neural network with
learning rate improvement,” Computers and Structures, vol. 83, no. 25, pp. 2150-2161,
2005.
[145] M. Mehrjoo, N. Khaji, H. Moharrami and A. Bahreininejad, “Damage detection of truss
bridge joints using artificial neural networks,” Expert Systems with Applications, vol. 35, no.
3, pp. 1122-1131, 2008.
[146] J. D. Wu and C. H. Liu, “Investigation of engine fault diagnosis using discrete wavelet
transform and neural network,” Expert Systems with Applications, vol. 35, no. 3, pp.1200-
1213, 2008.
[147] F. Just-Agosto, D. Serrano, B. Shafiq and A. Cecchini, “Neural network based non-
destructive evaluation of sandwich composites,” Composites Part B: Engineering, vol. 39,
no. 1, pp. 217-225, 2008.
Bibliography
198
[148] J. D. Wu and J. J. Chan, “Faulted gear identification of a rotating machinery based on
wavelet transform and artificial neural network,” Expert Systems with Applications, vol. 36,
no. 5, pp. 8862-8875, 2009.
[149] V. N. Ghate and S. V. Dudul, “Optimal MLP neural network classifier for fault detection of
three phase induction motor,” Expert Systems with Applications, vol. 37, no. 4, pp. 3468-
348, 2010.
[150] B. Fan, Z. Du, X. Jin, X. Yang and Y. Guo, “A hybrid FDD strategy for local system of
AHU based on artificial neural network and wavelet analysis,” Building and Environment,
vol. 45, no. 12, pp. 2698-2708, 2010.
[151] C. C. Wang, Y. Kang, P. C. Shen, Y. P. Chang and Y. L. Chung, “Applications of fault
diagnosis in rotating machinery by using time series analysis with neural network,” Expert
Systems with Applications, vol. 37, no. 2, pp.1696-1702, 2010.
[152] N. Saravanan, V. K. Siddabattuni and K. I. Ramachandran, “Fault diagnosis of spur bevel
gear box using artificial neural network (ann) and proximal support vector machine
(PSVM). Applied Soft Computing, vol. 10, no. 1, pp. 344-360, 2010.
[153] G. Paviglianiti, F. Pierri, F. Caccavale and M. Mattei, “Robust fault detection and isolation
for proprioceptive sensors of robot manipulators,” Mechatronics, vol. 20, no. 1, pp.162-170,
2010.
[154] M. Schlechtingen and I. F. Santos, “Comparative analysis of neural network and regression
based condition monitoring approaches for wind turbine fault detection,” Mechanical
Systems and Signal Processing, vol. 25, no. 5, pp.1849-1875, 2011.
[155] I. Eski, S. Erkaya, S. Savas and S. Yildirim, “Fault detection on robot manipulators using
artificial neural networks,” Robotics and Computer-Integrated Manufacturing, vol. 27, no.
1, pp.115-123, 2011.
[156] D. Thatoi and P. K. Jena, “Inverse analysis of crack in fixed-fixed structure by neural
network with the aid of modal analysis,” Advances in Artificial Neural Systems, 2013.
[157] A. J. Oberholster and P. S. Heyns, “On-line fan blade damage detection using neural
networks,” Mechanical Systems and Signal Processing, vol. 20, no. 1, pp.78-93, 2006.
[158] M. Rakideh, M. Dardel and M. H. Pashaei, “Crack detection of timoshenko beams using
vibration behavior and neural network,” International Journal of Engineering-Transactions
C: Aspects, vol. 26, no. 12, pp.1433-1444, 2013.
[159] C. Y. Kao and S. L Hung, “Detection of structural damage via free vibration responses
generated by approximating artificial neural networks,” Computers & Structures, vol. 81,
no. 28, pp. 2631-2644, 2003.
[160] A. Quteishat and C. P. Lim, “A modified fuzzy min-max neural network with rule extraction
and its application to fault detection and classification,” Applied Soft Computing, vol. 8, no.
2, pp. 985-995. 2008.
[161] A. Hajnayeb, A. Ghasemloonia, S. E. Khadem and M. H. Moradi, “Application and
comparison of an ann-based feature selection method and the genetic algorithm in gearbox
fault diagnosis,” Expert Systems with Applications, vol. 38, no. 8, pp. 10205-10209, 2011.
[162] B. Samanta, “Gear fault detection using artificial neural networks and support vector
machines with genetic algorithms,” Mechanical Systems and Signal Processing, vol. 18, no.
3, pp. 625-644, 2004.
[163] S. Haykin, “Neural Networks: A Comprehensive Foundation,” Pearson Education, 2006.
[164] B. Samanta, K. R. Al-Balushi and S. A. Al-Araimi, “Artificial neural networks and support
vector machines with genetic algorithm for bearing fault detection,” Engineering
Applications of Artificial Intelligence, vol. 16, no. 7, pp. 657-665, 2003.
[165] W. Q. Wang, M. F. Golnaraghi and F. Ismail, “Prognosis of machine health condition using
neuro-fuzzy systems,” Mechanical Systems and Signal Processing, vol.18, no. 4, 813-831,
2004.
[166] H. C. Kuo and H. K. Chang, “A new symbiotic evolution-based fuzzy-neural approach to
fault diagnosis of marine propulsion systems,” Engineering Applications of Artificial
Intelligence, vol.17, no. 8, pp. 919-930, 2004.
Bibliography
199
[167] Z. Ye, A. Sadeghian and B. Wu, “Mechanical fault diagnostics for induction motor with
variable speed drives using adaptive neuro-fuzzy inference system,” Electric Power Systems
Research, vol. 76, no. 9, pp.742-752, 2006.
[168] E. Zio and G. Gola, “A neuro-fuzzy technique for fault diagnosis and its application to
rotating machinery,” Reliability Engineering & System Safety, vol. 94, no. 1, pp.78-88,
2009.
[169] B. S. Yang, M. S. Oh and A. C. C. Tan, “Fault diagnosis of induction motor based on
decision trees and adaptive neuro-fuzzy inference,” Expert Systems with Applications, vol.
36, no. 2, pp. 1840-1849, 2009.
[170] R. Eslamloueyan, “Designing a hierarchical neural network based on fuzzy clustering for
fault diagnosis of the Tennessee-eastman process,” Applied Soft Computing, vol.11, no. 1,
pp.1407-1415, 2011.
[171] K. Salahshoor, M. S. Khoshro and M. Kordestani, “Fault detection and diagnosis of an
industrial steam turbine using a distributed configuration of adaptive neuro-fuzzy inference
systems,” Simulation Modelling Practice and Theory, vol. 19, no. 5, pp. 1280-1293, 2011.
[172] M. Sadeghian and A. Fatehi, “Identification, prediction and detection of the process fault in
a cement rotary kiln by locally linear neuro-fuzzy technique,” Journal of Process Control,
vol. 21, no. 2, pp. 302-308, 2011.
[173] P. Beena and R. Ganguli, “Structural damage detection using fuzzy cognitive maps and
hebbian learning,” Applied Soft Computing, vol. 11, no. 1, pp. 1014-1020, 2011.
[174] F. Zhu, Z. Deng and J. Zhang, “An integrated approach for structural damage identification
using wavelet neuro-fuzzy model,” Expert Systems with Applications, vol. 40, no.18, pp.
7415-7427, 2013.
[175] B. Chen, P. C. Matthews and P. J. Tavner, “Wind turbine pitch faults prognosis using a-
priori knowledge-based ANFIS,” Expert Systems with Applications, vol. 40, no. 17, pp.
6863-6876, 2013.
[176] I. O. Bachi, N. Abdulrazzaq and Z. He, “Neuro fuzzy model for predicting the dynamic
characteristics of beams. Acta. Mechanica Solida Sinica, vol. 27, no. 1, pp. 85-96, 2014.
[177] E. T. Al-Shammari, M. Amirmojahedi, S. Shamshirband, D. Petković, N. T. Pavlović and
H. Bonakdari, “Estimation of wind turbine wake effect by adaptive neuro-fuzzy approach,”
Flow Measurement and Instrumentation, vol. 45, pp.1-6, 2015.
[178] D. Petković, M. Issa, N. D. Pavlović and L. Zentner, “Potential of adaptive neuro-fuzzy
inference system for contact positions detection of sensing structure,” Measurement, vol.61,
pp. 234-242, 2015.
[179] L. Zhang, G. Xiong, H. Liu, H. Zou and W. Guo, “Bearing fault diagnosis using multi-scale
entropy and adaptive neuro-fuzzy inference,” Expert Systems with Applications, vol. 37, no.
8, pp. 6077-6085, 2010.
[180] M. A. Boyacioglu and D. Avci, “An adaptive network-based fuzzy inference system
(ANFIS) for the prediction of stock market return: the case of the istanbul stock
exchange,” Expert Systems with Applications, vol. 37, no. 12, pp. 7908-7912, 2010.
[181] J. Zhang, W. Dai, M. Fan, H. Chung, Z. Wei and D. Bi, “An investigation into the use of
delay coordinate embedding technique with MIMO ANFIS for nonlinear prediction of
chaotic signals,” Springer-Verlag Berlin Heidelberg, pp. 677- 688, 2005.
[182] J. Hinojosa and G. Doménech-Asensi, “Space-mapped neuro-fuzzy optimization for
microwave device modelling,” Microwave And Optical Technology Letters, vol. 49, no. 6,
pp. 1328-1334, 2007.
[183] Y. Lei, Z. He, Y. Zi and Q. Hu, “Fault diagnosis of rotating machinery based on multiple
ANFIS combination with gas,” Mechanical Systems and Signal Processing, vol. 21, no. 5,
pp. 2280-2294, 2007.
[184] G. D. Asensi, J. Hinojosa, R. Ruiz and J. A. D. Madrid, “Accurate and reusable
macromodeling technique using a fuzzy-logic approach,” Circuits and Systems, ISCAS
2008, IEEE International Symposium, pp. 508-511, 2008.
[185] A. F. Güneri, T. Ertay and A. YüCel, “An approach based on ANFIS input selection and
modeling for supplier selection problem,” Expert Systems with Applications, vol. 38, no. 12,
pp. 14907-14917, 2011.
Bibliography
200
[186] A. K. Dash and D. R. Parhi, “Development of a vibration based crack diagnostic application
using the MANFIS technique,” International Journal of Acoustics and Vibration, vol. 17,
no. 2, pp. 90-99, 2012.
[187] A. Ghaffari, A. Khodayari, F. Alimardani and H. Sadati, “MANFIS based modeling and
prediction of the driver-vehicle unit behavior in overtaking scenarios,” International Journal
of Automotive Engineering, vol. 3, no. 2, pp. 394-411, 2013.
[188] R. A. Saeed, A. N. Galybin and V. Popov, “3D fluid-structure modelling and vibration
analysis for fault diagnosis of francis turbine using multiple ANN and multiple ANFIS,”
Mechanical Systems and Signal Processing, vol. 34, no. 1, pp. 259-276, 2013.
[189] N. D. Linh and H.V. Long, “A lossless DEM compression for fast retrieval method using
fuzzy clustering and MANFIS neural network,” Engineering Applications of Artificial
Intelligence, vol. 29, pp. 33-42, 2014.
[190] M. Subhi Al-batah, N. A. Mat Isa, M. F. Klaib and M. A. Al-Betar, “Multiple adaptive
neuro-fuzzy inference system with automatic features extraction algorithm for cervical
cancer recognition,” Computational and Mathematical Methods in Medicine, 2014.
doi.org/10.1155/2014/181245.
[191] S. Takagi and Y. Okawa, “Rule‐based control of a mobile robot for the push- a- box
operation,” IEEE/RSJ International Workshop on Intelligent Robots and Systems, pp.1338-
1343, 1991.
[192] H. Gaeta, D. Friedman, W. Ritter and G. Hunt, “Age‐related changes in neural trace
generation of rule‐based auditory features,” Neurobiology of Aging, vol. 23, no. 3, pp.
443‐455, 2002.
[193] M. A. F. De Souza and M. A. G. V. Ferreira, “Designing reusable rule‐based architectures
with design patterns,” Expert Systems with Applications, vol. 23, no. 4, pp. 395‐403, 2002.
[194] J. Dietrich, A. Kozlenkov, M. Schroeder and G. Wagner, “Rule‐based agents for the
semantic web,” Electronic Commerce Research and Applications, vol. 2, no. 4, pp.
323‐338, 2003.
[195] E. Tunstel, A. Howard and H. Seraji, “Rule-based reasoning and neural network perception
for safe off-road robot mobility,” Expert Systems, vol. 19, no. 4, pp. 191‐200, 2002.
[196] B. S. McIntosh, R. I., Muetzelfeldt, C. J. Legg, S. Mazzoleni and P. Csontos, “Reasoning
with Direction and Rate of Change in Vegetation State Transition Modeling,”
Environmental Modelling & Software, vol. 18, no. 10, pp. 915‐927, 2003.
[197] J. J. Pfeiffer Jr, “A rule‐based visual language for small mobile robots,” IEEE Symposium on
Visual Languages, pp. 164‐165, 1997.
[198] J. J. Pfeiffer Jr, “Case study: Developing a rule‐based language for mobile robots,”
IEEE Symposium Visual Languages, pp. 204-209, 1998.
[199] J. J. Pfeiffer Jr, “Altaira: A rule‐based visual language for small mobile robots,” Journal of
Visual Languages and Computing, vol. 9, no. 2, pp. 127-150, 1998.
[200] J. Fei and C. Isik, “Adapting to environmental variations in a rule‐based mobile robot
controller,” IEEE International Conference on Systems, Man and Cybernetics, vol. 1, pp.
332‐333, 1989.
[201] B. J. Gilmore and D. A. Streit, “A rule‐based algorithm to predict the dynamic
behavior of mechanical part orienting operations,” IEEE International Conference
Robotics and Automation, vol. 2, pp. 1251-1259, 1988.
[202] S. Bonner and R. B. Kelley, “A representation scheme for rapid 3d collision
detection,” IEEE International Symposium Intelligent Control, pp. 320-325, 1988.
[203] S. Bonner and R. B. Kelley, “Planning 3‐D collision‐free paths,” IEEE International
Symposium Intelligent Control, pp. 550-555, 1989.
[204] S. Bonner and R. B. Kelley, “A novel representation for planning 3‐d collision‐free paths,”
IEEE Transactions on Systems, Man and Cybernetics, vol. 20, no. 6, pp. 1337-1351, 1990.
[205] H. Tada, P.C. Paris and G. R. Irwin, “The stress analysis of cracks handbook 2nd ed. St.
Louis, MO: Paris production incorporated and del research corporation,” 1985.
[206] W.T. Thomson, “Theory of vibration with application,Third edition, Prentics Hall,” 1988.
Bibliography
201
[207] T. Takagi and M. Sugeno, “Fuzzy identification of system and its application to modelling
and control,” IEEE Transactions on systems, Man and Cybernetics,vol. 15, no. 1, pp. 116-
132,1985.
[208] P. Melin and O. Castillo, “A new method for adaptive model-based control of non-linear
dynamic plants using a neuro-fuzzy-fractal approach,” Soft Computing, vol. 5, no. 2, pp.
171-177, 2001.
[209] J. A. Leonard, M. A. Kramer and L. H. Ungar, “Using radial basis functions to approximate
a function and its error bounds,” IEEE Transactions on Neural Networks/ A Publication of
the IEEE Neural Networks Council, vol. 3, no. 4, pp. 624-627,1991.
[210] S. Weiss and C. Kulikowski, “Computer systems that learn,”1991.
[211] E. H. Mamdani and S. Assilian, “An experiment in linguistic synthesis with fuzzy
logic controller,” International Journal of Man-machine Studies, vol. 7, no. 1, pp. 1-
13,1975.
[212] L. A. Zadeh, “Fuzzy sets,” Information and control, vol. 8, no. 3, pp. 338-353, 1965.
[213] M. Matsubara, H. Rahnejat and R. Gohar, “Computational modelling of precision spindles
supported by ball bearings,” International Journal of Machine Tools and Manufacture, vol.
28, no. 4, pp. 429-442,1988.
202
Dissemination
Journal Articles
1. Dayal R. Parhi and Adik R. Yadao, Analysis of Dynamic Behavior of Multi-
cracked Cantilever Rotor in Viscous Medium. Proceeding of the Institution of
Mechanical Engineers: Part K Journal of Multi-body, 12/2015,
DOI:10.1177/146441931561803.
2. Adik R. Yadao and Dayal R.Parhi, The Influence of Crack in Cantilever Rotor
System with Viscous Medium. International Journal of Dynamics and Control,
DOI.10.1007/s40435-014-0141-2, 2014.
3. Dayal R. Parhi, Adik R. Yadao and Ranjan K. Behera, A review on the dynamic
analysis of cracked rotor by different method. International Journal of Artificial
Intelligence and Computational Research, 6(1): 1-8, 2014.
4. Adik R. Yadao and Dayal R. Parhi, Dynamic Analysis of Fixed-Fixed Type
Cracked Rotor in Viscous Medium. Journal of Vibration Engineering &
Technologies (Accepted).
5. D. R. Parhi and Adik R. Yadao, Review of dynamic analysis of structure by
different method. International Journal of Artificial Intelligence and Computation
Research, 4(2): 87-94, 2012.
6. D. R. Parhi, Adik Yadao and Irshad A khan, “Vibration Analysis of Spinning
Cantilever Shaft with a Disc in Viscous Fluid”, International Journal of Artificial
Intelligence and Computational Research, 6(1), 17-24, 2014.
Book Chapters
1. Adik R. Yadao and D. R. Parhi, Experimental and Numerical Analysis of Cracked
Shaft in Viscous Medium a Finite Region. Book Chapter of Advances in structural
engineering,1601-1609, 2015.
Conference Presentations
1. Adik Yadao, Irshad A. Khan and D. R. Parhi, Vibration Characteristics of Rotating
Simply Supported Shaft in Viscous Fluid. In proceeding of International
Conference on Industrial Engineering, Science and Applications, 58-63,2014.
2. Adik Yadao, Irshad A. Khan and D. R.Parhi, Modal Analysis of a Multiple
Cracked Cantilever Bar. International Conference on Advances in Engineering and
Technology, IOSR Journal of Mechanical and civil Engineering, 6: 12-15, 2013.
3. Adik R.Yadao, Ravi P. Singh and Dayal R. Parhi, Influence of Parameters of
Cracked Rotor System on its Vibration Characteristics in Viscous Medium at Finite
Dissemination
203
Region. International Mechanical Engineering Congress: International Journal of
Applied Mechanics and Materials, 592(594):2061-2065, 2014.
4. Adik Yadao and D.R.Parhi, Theoretical and Experimental Verification of
Vibration Characteristics of Cracked Rotor System in Viscous Medium. In
Proceeding of 5thInternational & 26
thAll India Manufacturing Technology, Design
and Research Conference, pages 46(1-6), 2014.
5. Adik Yadao and D. R. Parhi, Experimental and Numerical Analysis of Cracked
Shaft in Viscous Medium a Finite Region. Structural Engineering Convention,2015.
Communicated Articles
1. Adik R. Yadao and Dayal R. Parhi, Effect of Variable Fluid Properties on the
Vibration Response of Cantilever Rotor. Journal of Low Frequency Noise, Vibration
and Active Control, Manuscript ID. LF_2015-65.
2. Dayal R. Parhi and Adik R. Yadao, Dyanamic Analysis of Multi-Cracked Rotor in
Viscous Medium using Artificial Neural Network. Proceedings of the Institution of
Mechanical Engineers, Part L: Journal of Materials: Design and Applications,
Manuscript ID. JMDA-16-0144.
204
Vitae
Mr. Adik Ramdayal Yadao was born in August 1982 at Darbhanga district of Bihar. He
has completed his class X from Zilha Parishad High School, Tumsar (Maharastra) in 1999
and Diploma in Mechanical Engineering from Maharastra State Board of Technical
Education,Mumbai, Maharastra. He completed his Bachelor of Engineering in Mechanical
Engineering from Goverment College of Engineering, Chandarapur, Nagpur University in
2006 and his Master of Engineering in Mechanical Engineering (specialization in
Computer aided Design and Computer aided Manufacturing) from University college of
Engineering, Osmania University, Hydrabad (A.P.) in 2011. After the completion of his
Post-Graduation he has joined Ph.D. program at Department of Mechanical Engineering,
National Institute of Technology, Rourkela in July 2012 and submitted the Ph.D. thesis in
June 2016. His research interest includes Mechanical vibration, Rotor Dynamics and
Fluid Structure Interaction.


![Review Article ABriefReviewonDynamicsofaCrackedRotor · 2.5. Analysis through Nonlinear Dynamics of Cracked Rotor. Muller et al. [¨ 34] investigated nonlinear dynamics of a cracked](https://img.pdfslide.net/doc/110x75/60b33aac24d3ce56890752bd/review-article-abriefreviewondynamicsofacrackedrotor-25-analysis-through-nonlinear.jpg)


![Simulations of the Yawed MEXICO Rotor Using a Viscous ... · Simulations of the Yawed MEXICO Rotor Using a Viscous ... Following Katz and Plotkin [6] ... of 4.5 m tested in the Large](https://img.pdfslide.net/doc/110x75/5b89392c7f8b9abf5c8d471b/simulations-of-the-yawed-mexico-rotor-using-a-viscous-simulations-of-the.jpg)