Embed Size (px)
Citation preview

PERFORMANCE EVALUATION OF FIBER REINFORCED POLYMER (FRP)
COMPOSITE DECK BRIDGES
DYNAMIC RESPONSE OF FIBER
REINFORCED POLYMER (FRP)
COMPOSITE BRIDGES
Srinivas Aluri, Hara Industries
Prof. Hota GangaRao, West Virginia University
2012

Co – Author
Hota GangaRao, PhD, P.E., F. ASCEMaurice A. and Jo Ann Wadsworth
Distinguished Professor of CEE, CEMRDirector, Constructed Facilities Center
Director, Center for Integration of Composites into Infrastructure
West Virginia University
Outline
• FRP Bridge Decks
• FRP Bridge Construction
• Description of FRP Bridges Tested
• Importance of Dynamic Response
• Testing Procedure
• Results
• Conclusion

Acknowledgements
SPONSOR
US – Federal Highway Administration
West Virginia Department of Transportation
Division of Highways

FRP BRIDGE DECKS
First Generation FRP Bridge Deck
Weight – 25 lb/ft2 (122 kg/m2 )
Cost ~ $80 sq. ft (Rs.4000 sq.ft)
E-glass Fabrics & Vinyl Ester Resin
Trade Name: SuperdeckTM

FRP BRIDGE DECKS
Third Generation FRP Bridge Deck
Weight – 11 lb/ft2 (~50 kg/m2)
Cost ~ $30 sq. ft (Rs. 1650 sq.ft)
E-glass Fabrics & Vinyl Ester Resin
Trade Name: Prodeck 4
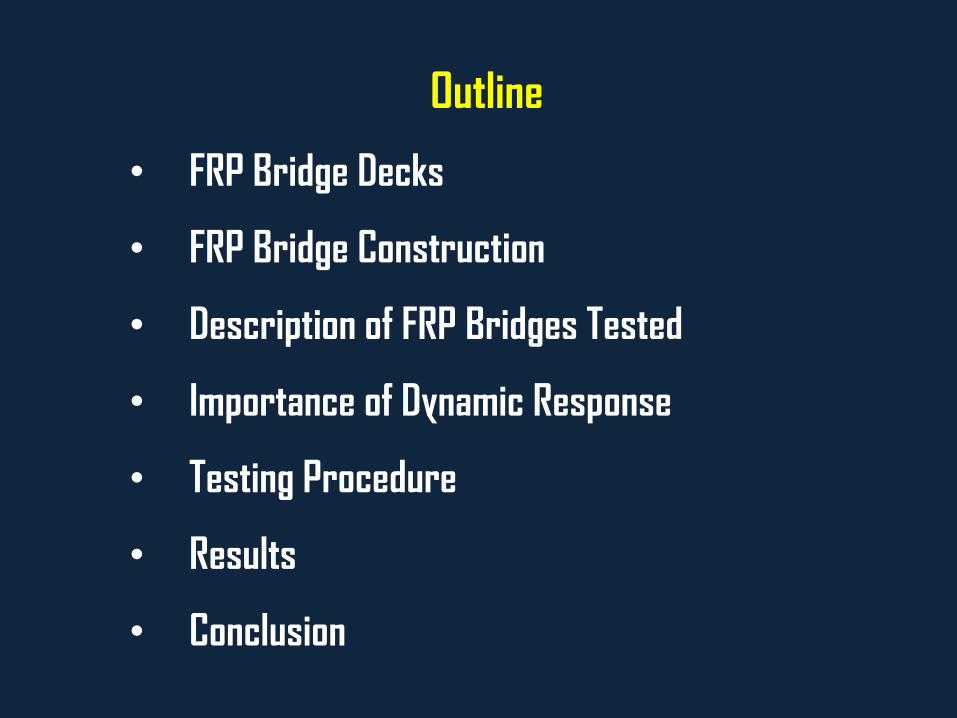
FRP BRIDGE CONSTRUCTION
FRP BRIDGE CONSTRUCTION

FRP BRIDGE CONSTRUCTION
Structural Adhesive
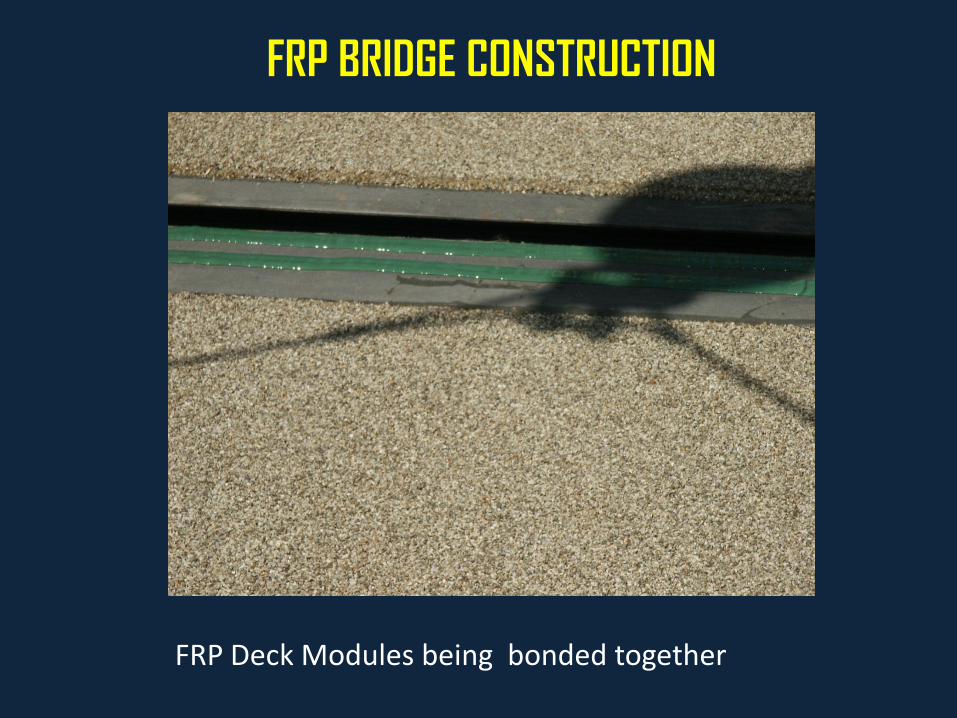
FRP BRIDGE CONSTRUCTION
FRP Deck Modules being bonded together
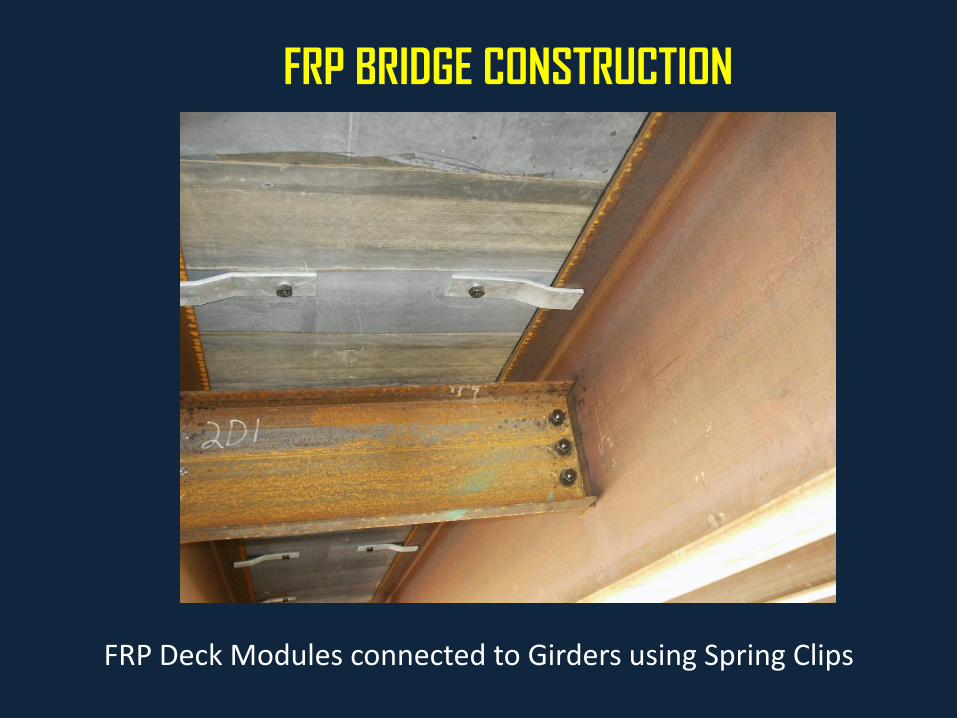
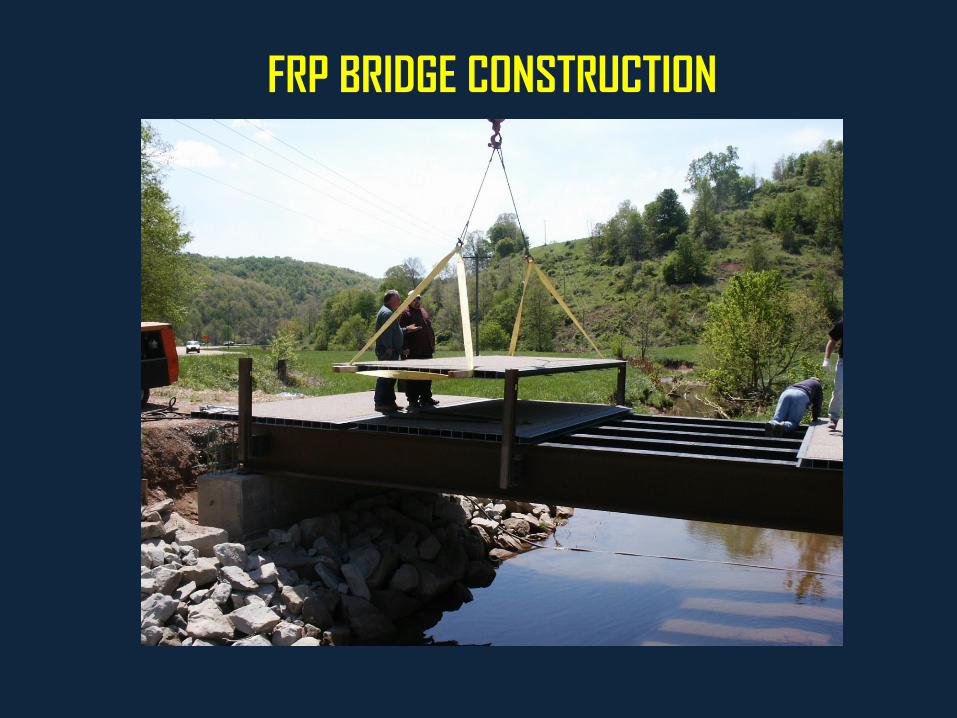
FRP BRIDGE CONSTRUCTION
FRP Deck Modules connected to Girders using Spring Clips

FRP BRIDGE CONSTRUCTION
FRP Deck Joints Reinforced with Glass Fabric and Resin
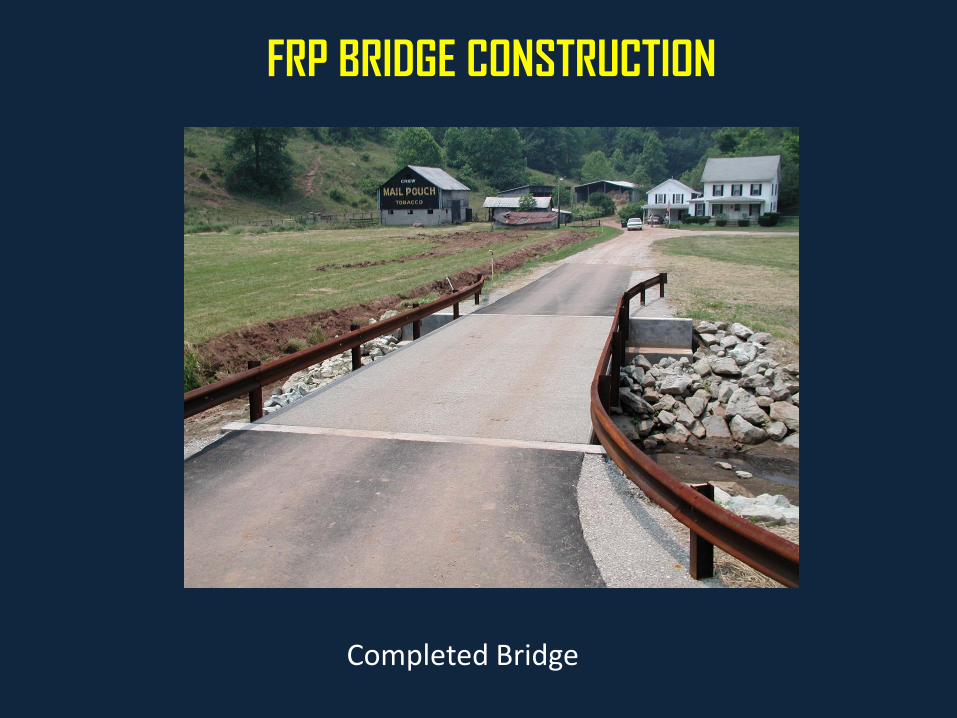
FRP BRIDGE CONSTRUCTION
Completed Bridge
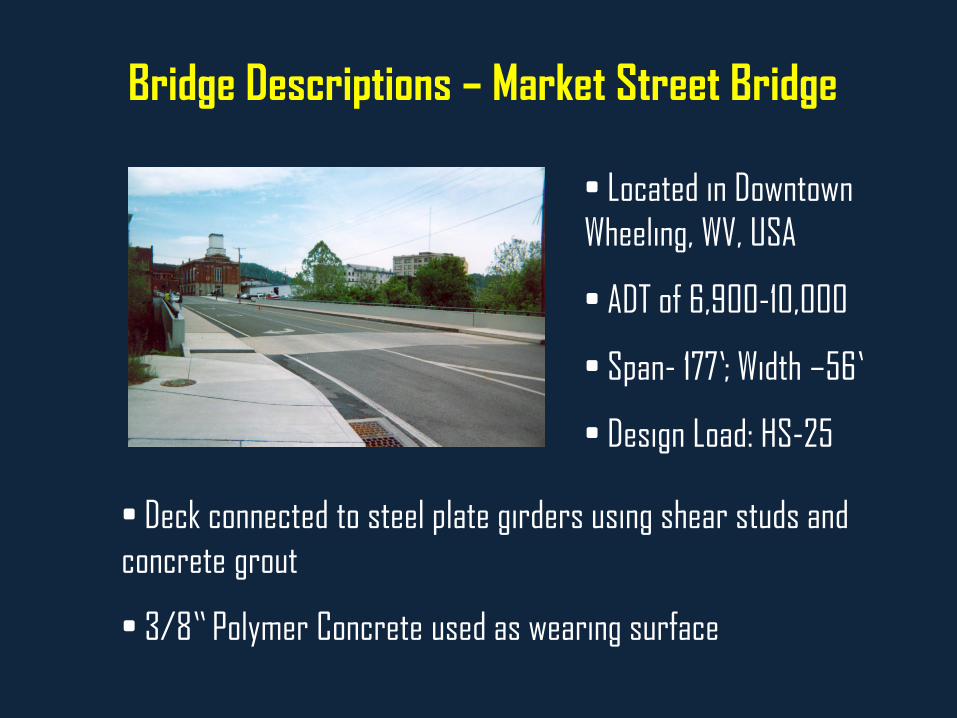
Bridge Descriptions – Market Street Bridge
• Located in Downtown
Wheeling, WV, USA
• ADT of 6,900-10,000
• Span- 177’; Width –56’
• Design Load: HS-25
• Deck connected to steel plate girders using shear studs and
concrete grout
• 3/8’’ Polymer Concrete used as wearing surface
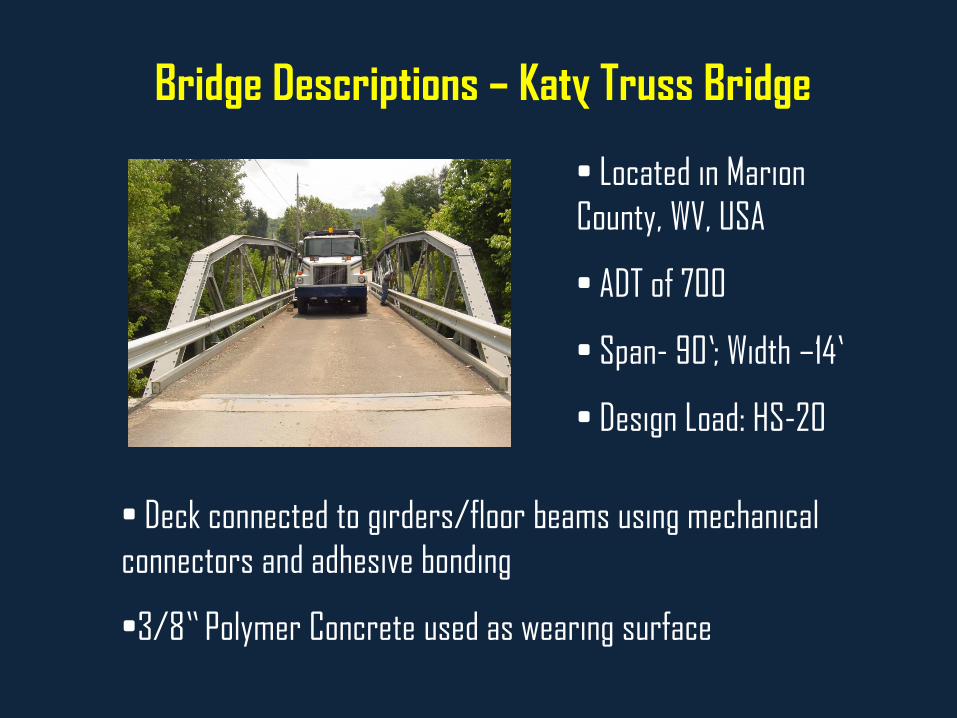
Bridge Descriptions – Katy Truss Bridge
• Located in Marion
County, WV, USA
• ADT of 700
• Span- 90’; Width –14’
• Design Load: HS-20
• Deck connected to girders/floor beams using mechanical
connectors and adhesive bonding
•3/8’’ Polymer Concrete used as wearing surface

Bridge Descriptions – Laurel Lick Bridge
• Located in WV, USA
• FRP deck and FRP stringer
• Six FRP girders (WF 12 x 12 x ½)
•Span- 19’; Width –15’
• Design Load: HS-25

Performance Evaluation – FRP Deck Bridges
Overall objective is to evaluate the structural response of the
three FRP deck bridges. Specifically, the following parameters
were evaluated:
DYNAMIC
1. Natural frequencies, damping ratios
2. Dynamic load allowance factor

Importance of Dynamics FRP Bridges
Vibration of bridges due to moving traffic has two potential
problems
• Dynamic amplification of stresses/deflections
• Vibration Serviceability - Not accounted in design- No
provisions in AASHTO LRFD Spec- AASHTO LRFD commentary
refers to OHBDC.
Test Procedure for FRP Bridges
• Dynamic amplification of stresses/deflections
•Natural Frequencies/Acceleration

Dynamic Response of FRP Bridges
Dynamic Load Allowance (DLA) Factor or Impact Factor is
determined by allowing a loaded truck to pass at 2 mph and
at highway speeds and calculated using the formula below.
stat
statdynDLA
dyn = maximum strain as the vehicle travels at test speedstat = maximum strain as the vehicle travels at crawl speed
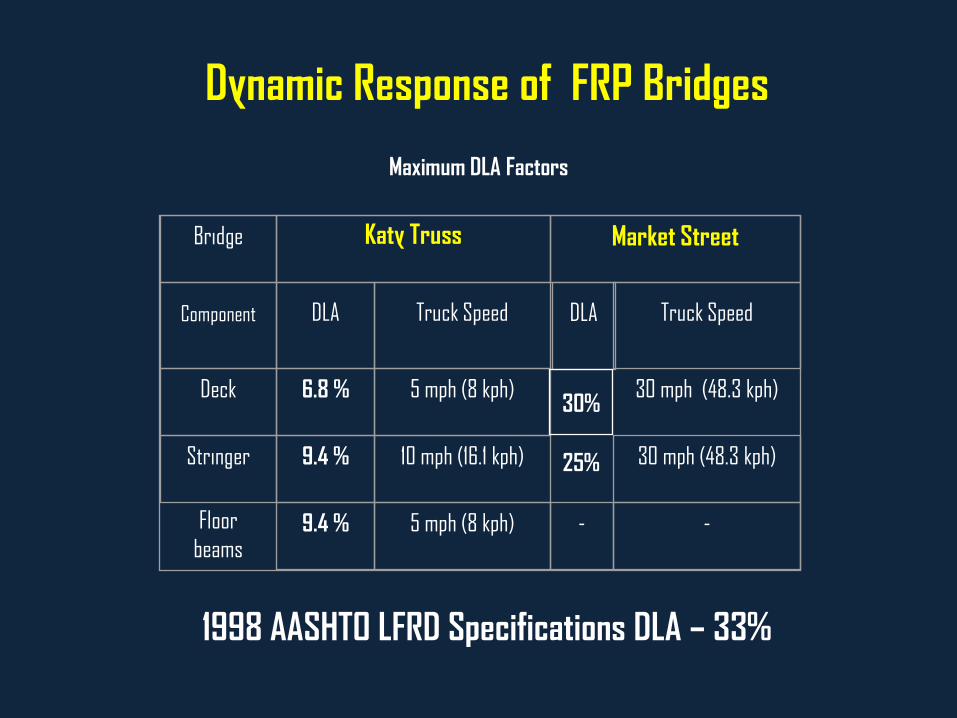
Dynamic Response of FRP Bridges
Maximum DLA Factors
25%
30%
Bridge Katy Truss Market Street
Component DLA Truck Speed DLA Truck Speed
Deck 6.8 % 5 mph (8 kph) 30 mph (48.3 kph)
Stringer 9.4 % 10 mph (16.1 kph) 30 mph (48.3 kph)
Floor
beams9.4 % 5 mph (8 kph) - -
1998 AASHTO LFRD Specifications DLA – 33%
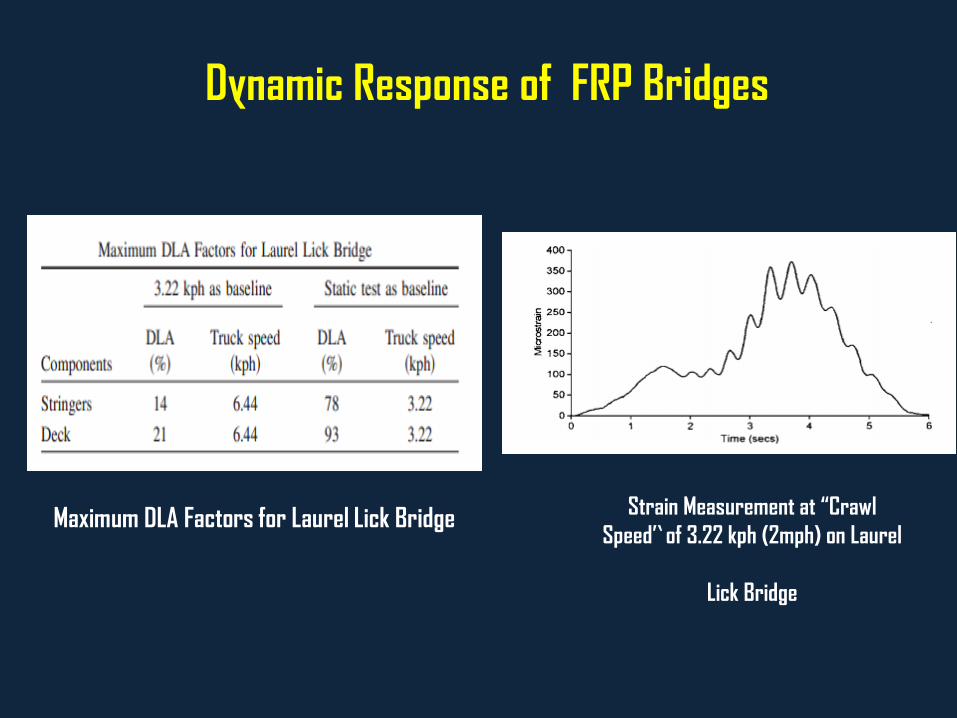
Strain Measurement at “Crawl
Speed” of 3.22 kph (2mph) on Laurel
Lick Bridge
Maximum DLA Factors for Laurel Lick Bridge
Dynamic Response of FRP Bridges

Dynamic Response of FRP Bridges
Vibration Serviceability
• No current provisions in AASHTO LRFD Specifications
• 1983/1991 Ontario Highway Bridge Design Code provides static deflection
limits for bridges based on their natural frequency
Dynamic Response of FRP Bridges
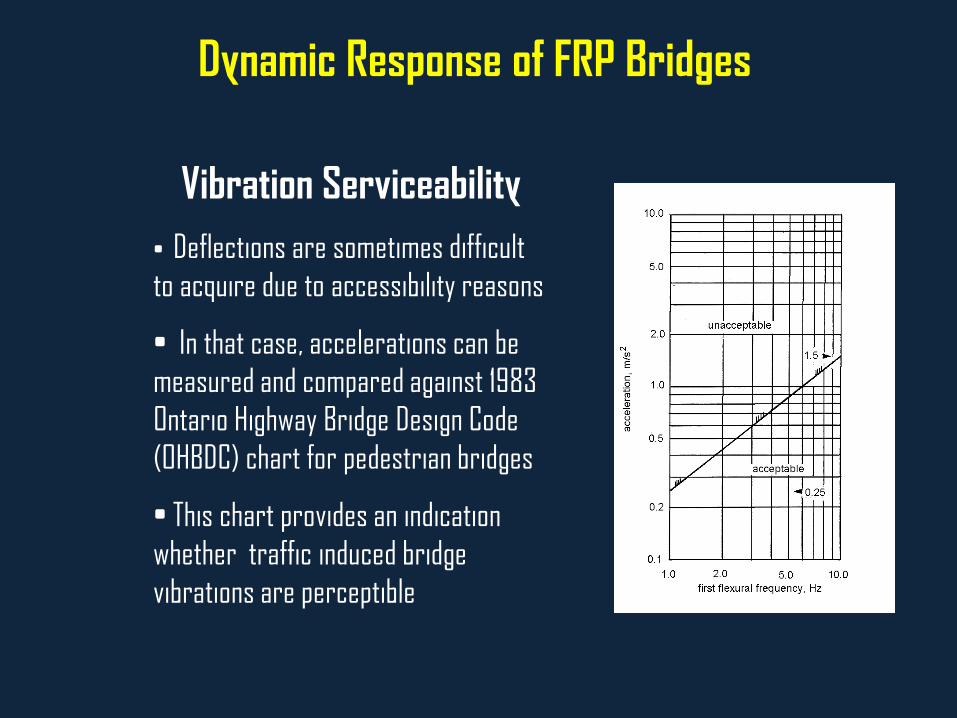
Vibration Serviceability
• Deflections are sometimes difficult
to acquire due to accessibility reasons
• In that case, accelerations can be
measured and compared against 1983
Ontario Highway Bridge Design Code
(OHBDC) chart for pedestrian bridges
• This chart provides an indication
whether traffic induced bridge
vibrations are perceptible

Dynamic Response of FRP Bridges
Bridge parameters needed to check against OHBDC chart –
First natural frequency and Amplitude of acceleration
y = 0.0669e-0.1804x
R2 = 0.9786
-0.1
-0.08
-0.06
-0.04
-0.02
0
0.02
0.04
0.06
0.08
0.1
0 5 10 15 20 25 30 35 40
Time (secs)
Accel.
(g)
Free Vibration Response of Katy Truss Bridge
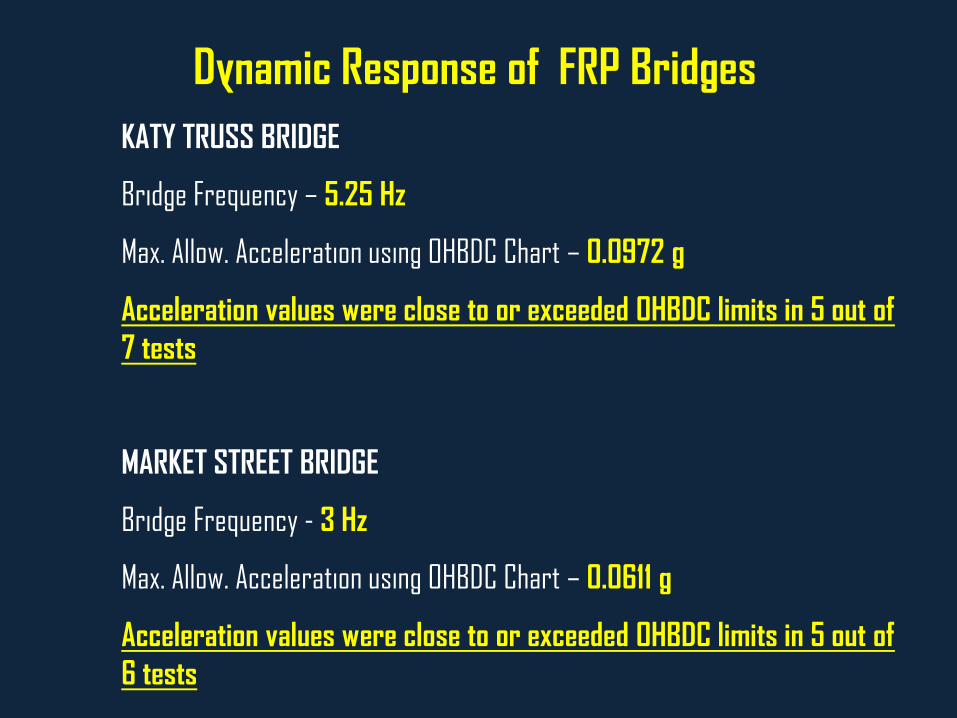
KATY TRUSS BRIDGE
Bridge Frequency – 5.25 Hz
Max. Allow. Acceleration using OHBDC Chart – 0.0972 g
Acceleration values were close to or exceeded OHBDC limits in 5 out of
7 tests
MARKET STREET BRIDGE
Bridge Frequency - 3 Hz
Max. Allow. Acceleration using OHBDC Chart – 0.0611 g
Acceleration values were close to or exceeded OHBDC limits in 5 out of
6 tests
Dynamic Response of FRP Bridges
Dynamic Response of FRP Bridges
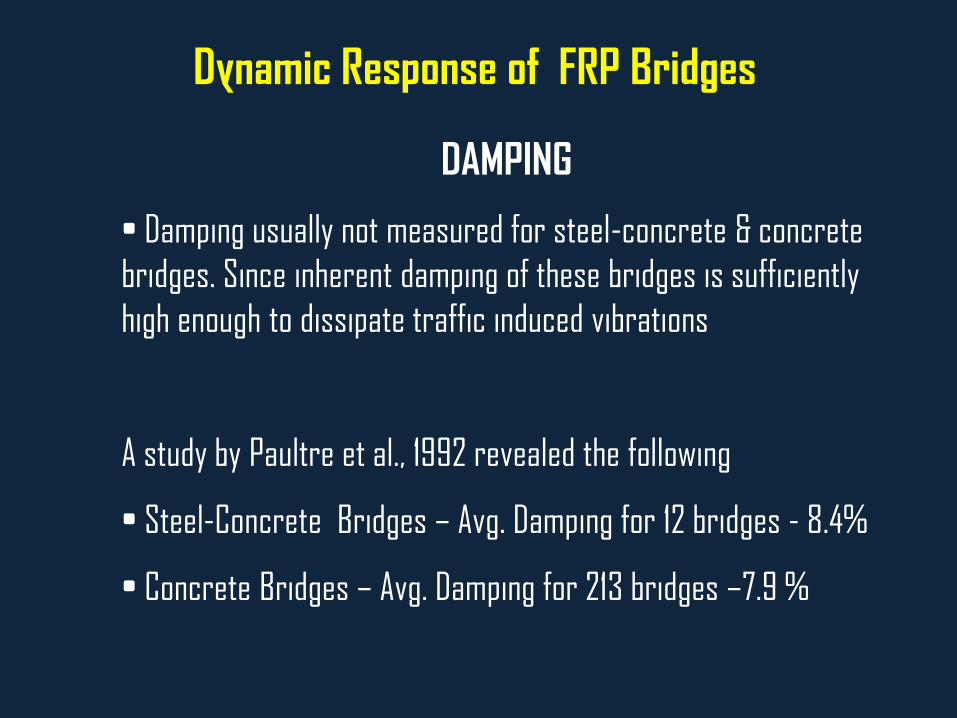
DAMPING
• Damping usually not measured for steel-concrete & concrete
bridges. Since inherent damping of these bridges is sufficiently
high enough to dissipate traffic induced vibrations
A study by Paultre et al., 1992 revealed the following
• Steel-Concrete Bridges – Avg. Damping for 12 bridges - 8.4%
• Concrete Bridges – Avg. Damping for 213 bridges –7.9 %
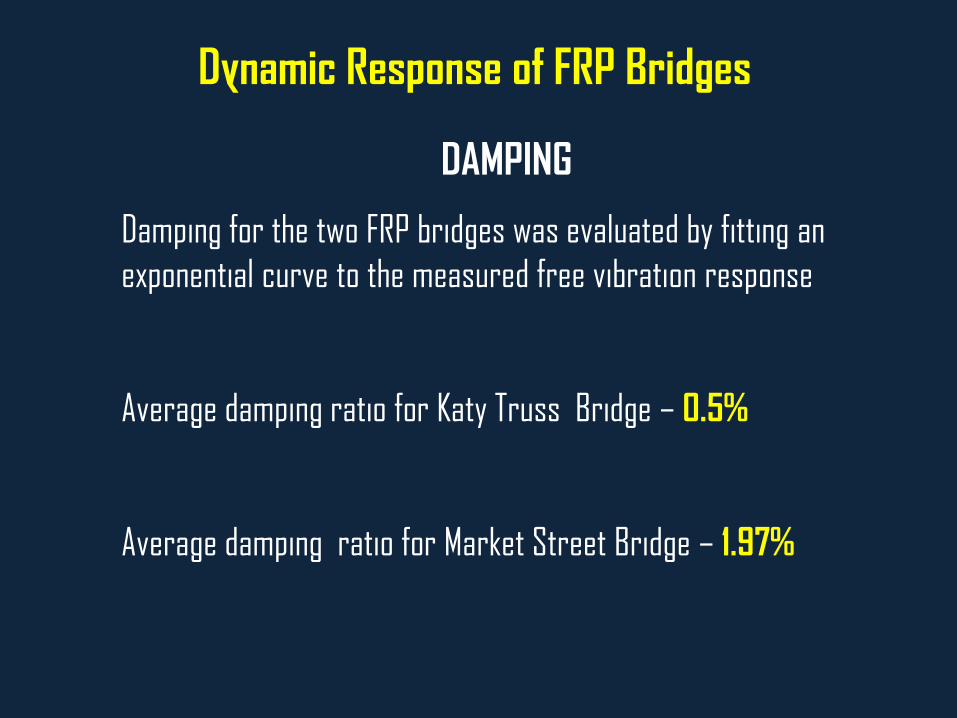
DAMPING
Damping for the two FRP bridges was evaluated by fitting an
exponential curve to the measured free vibration response
Average damping ratio for Katy Truss Bridge – 0.5%
Average damping ratio for Market Street Bridge – 1.97%
Dynamic Response of FRP Bridges
Performance Evaluation – FRP Deck Bridges
• Dynamic load allowance factors for the two bridges are within design
code limits. The limits are exceeded for Laurel Lick Bridge.
• Traffic induced bridge vibrations are clearly perceptible in the two FRP
bridges,
• Lack of inherent damping in these two bridges is the primary reason for
high amplitudes of vibration.
•As a general takeaway, as Composites are primarily lightweight, dynamic
issues need to be addressed during design stage.
CONCLUSIONS
DYNAMIC RESPONSE OF FIBER
REINFORCED POLYMER (FRP)
COMPOSITE BRIDGES
QUESTIONS!!!