Embed Size (px)
Citation preview

1 INTRODUCTION
The Rock Mechanics Group at the Western Australia School of Mines (WASM) commenced development, design and construction of a unique dynamic testing facility in Kalgoorlie during 2002 (Player et al., 2004). The facility is designed to quantify the force-displacement responses of reinforcement and support systems subjected to dynamic loading. Reinforcement system tests are undertaken on full scale double embedment samples, with the simulation of important pa-rameters that are expected to affect the performance of the reinforcement system. A wide range of reinforcement and support systems have been tested and the results reported by Player et al. (2008a, 2008b and 2008c) and Varden et al. (2008). Particularly it has been found that it is im-portant to test the reinforcement with sufficient input energy to cause failure on the first loading and to report the critical states of energy dissipation, displacement, velocity and acceleration.
1.1 Dynamic Testing of Friction Stabilisers The testing of friction rock stabiliser bolts such as the Split Set (oversize c-section driven into an undersized hole and referred to as split tube bolt in this paper) and the Omega bolt (inflatable closed steel tube of the same principle and made in the same factory as the Atlas Copco Swellex) have presented challenges to understanding the performance characteristics of this class of reinforcement system.
The test program required the development of rough simulated boreholes of similar dimen-sions and texture to the holes drilled underground by bolting equipment. Another requirement was to be able to install the bolts into the simulated holes using underground equipment. The in-stalled bolt and rough simulated borehole samples were then recovered and tested. Some static pull tests were undertaken prior to dynamic testing, to compare capacities with underground pull tests.
Dynamic Testing of Friction Rock Stabilisers
J.R. Player, E. Villaescusa & A.G. Thompson Western Australian School of Mines, Kalgoorlie, West Australia, Australia
ABSTRACT: An extensive axial test program has been used to quantify the difference between the static and dynamic capacities (kN/m of embedment) for friction rock stabilisers once sliding starts. Rough simulated boreholes have been developed for the installation and dynamic testing of rock bolts at the WASM Dynamic Test Facility. The rough simulated borehole is used for rock bolts that are sensitive to equipment installation technique or borehole geometry (particu-larly friction rock stabilisers and resin encapsulated bolts). The 47mm split tube bolt has a 50% reduction in embedment capacity (but with significant variation) dissipating 2.7kJ/100mm of sliding per metre of embedment, and the Omega (inflatable) bolt had a 70% reduction in em-bedment capacity dissipating 6.2kJ/100mm of sliding per metre of embedment. The Omega bolt dynamic capacity remained at least equivalent to the split tube bolt static capacity.
ROCKENG09: Proceedings of the 3rd CANUS Rock Mechanics Symposium, Toronto, May 2009 (Ed: M.Diederichs and G. Grasselli)
PAPER 4027 1

1.2 WASM Dynamic Testing When a seismic wave encounters an excavation, a potential may exist for dynamic ejection of failed material. This potential depends on the energy in the wave (e.g. radiated energy and seismic mo-ment), seismic source parameters (e.g. stress drop, corner frequency, and source radius), and site characteristics of the excavation (e.g. degree of fracturing, stored strain energy, and rock properties). The installed ground support (dynamic or non-dynamic capable) only acts to control the rock behav-iour after failure; it does not prevent a dynamically induced rock failure from occurring.
The double embedment configuration is employed at the WASM dynamic testing facility to represent the unstable rock being ejected from the excavation and the toe embedment length which tries to resist the deformation from occurring. Steel plates are integrated with the collar component of the simulated borehole to behave as a single loading mass. A significant amount of instrumentation is employed at the facility to understand the displacements, accelerations, timing and energy dissipation of the sample under test and other components of the facility.
1.3 WASM dynamic test facility The WASM Dynamic Test Facility shown in Figure 1 has been designed to study the dynamic load-ing on reinforcement and support systems or combined schemes as used in underground mines. The bolts are predominately loaded axially. It is accepted that shear loading can significantly alter the performance of rock bolt but the amount is highly variable and not well understood. Refer to Player et al. (2008d) for a full discussion on this and other dynamic testing facilities.
Figure 1. Descriptive photo of the main components of the test facility.
Loading Mass
ROCKENG09: Proceedings of the 3rd CANUS Rock Mechanics Symposium, Toronto, May 2009 (Ed: M.Diederichs and G. Grasselli)
PAPER 4027 2

The standard test performed at the WASM Dynamic Test Facility uses a drop velocity of 6m/s at impact with 2000kg of simulated ejected rock. This provides an input of 36kJ of kinetic en-ergy that must be dissipated by the reinforcement system and the buffers plus any change in po-tential energy from displacement of the mass following impact. A schematic of the test configu-ration is shown in Figure 2. The simulated discontinuity has been located 1.0m from the collar of each tested bolt. Due to the low capacity of all friction rock stabilisers in comparison to grouted reinforcement systems the input energies were lowered by reductions to the loading mass and impact velocity.
The first drop provides the primary results for each analysis. In practice, it is not expected that after yielding, the ejected rock would still be intact, if the reinforcement system was subject to repeated loading there would be a change in the boundary conditions / encapsulation proper-ties. When testing friction rock stabilisers it maybe possible to compare reasonable data from successive loadings where it is considered that the yielding mechanism and properties has re-mained consistent.
The analysis technique examines all energy dissipation and change in potential energy from the point of contact of the drop beam with the buffers until the systems come to rest. Typical in-formation obtained during a test includes the dynamic force-displacement response for the sys-tem under test, the deceleration time graph and relative velocity time graph of the loading mass. These are primary details that can be summarised to report the difference between various ground reinforcement systems.
Figure 2. Schematic of loading mass integration with simulated borehole.
2 CONSTRUCTION OF ROUGH SIMULATED BOREHOLES
An extensive development process was required to create a consistent roughened straight bore-hole for rock bolts where their performance is known to be sensitive to wall conditions of the drill hole or the equipment used for installation. It is not practical to simulate the amount of hole deviation that occurs during the drilling of rock bolt holes as it varies significantly between op-erators and between mines. The following sections describe the materials selected for the con-struction of the rough simulated boreholes, the construction process, and installation of the rock bolt by the equipment.
ROCKENG09: Proceedings of the 3rd CANUS Rock Mechanics Symposium, Toronto, May 2009 (Ed: M.Diederichs and G. Grasselli)
PAPER 4027 3
2.1 Material Selection The roughness and strength of the material in the simulated borehole was an evolutionary proc-ess and was achieved by making three decisions; − First, the simulated hole should be a single length and not two half shells clamped together, − Secondly, the hole was to be drilled by an airleg and machine rather than poured about a
polystyrene cast of the required dimensions that was later removed. − Thirdly, the selection of a high strength non-shrinkage construction grout with basalt aggre-
gate added to increase stiffness and improve drill performance The second and third decision removed the initial test data of 11 split tube bolt tests that used
a low heat grout cast about a polystyrene mould. Their dynamic performance was very poor, de-spite achieving static test pull resistance comparable with underground test results.
2.2 Simulated Borehole Construction The simulated boreholes are constructed to the length of the rock bolt to be tested; in this case 2.4m in length. They required a steel outer casing, a high strength cement core, and a polysty-rene guide for the airleg drill to follow, Figure 3. Polystyrene cylinders of nominal 20mm di-ameter were predrilled and threaded along an 8mm steel rod that held the polystyrene near the middle of the pipe.
Hollow steel bar (80mm internal and 100mm external diameter) is used to provide confine-ment for the grout cylinder that will be drilled out and for attaching the anchor point to test. An end plate is used at the toe and a top bar is used at the collar (pouring end) to hold the polysty-rene on the guide rod, Figure 4.
Figure 3. Schematic of a rough simulated sample.
The grouts used were Masterflow 880 and 870 construction grouts, 80-90MPa strength and non-shrink. The 880 product has iron filing reinforcement of the grout matrix. This was initially thought to be necessary but later trials proved it was not required. It was also noted that the iron filings promoted corrosion when hyper-saline drilling water was used with installation of the split tube bolt. The grouts had 20% by weight of sized 10-12mm basalt aggregate chips incorpo-rated to form the cement. The product was mixed in a conventional cement mixer at the recom-mended water cement ratio and hand poured into the hollow bar to form the grout annulus.
Cement grout test cylinders were poured for uniaxial compressive strength testing of the product, Figure 5. A Young's Modulus of 31.4GPa was achieved when aggregate was used compared with 25GPa for the Masterflow products without aggregate addition. Expanding upon the work by Hyett et al. (1992), a series of calculations were undertaken to determine the equivalent radial stiffness of the twin annulus composite. A typical equivalent rockmass modulus of 36GPa was calculated for the rough simulated boreholes.
80*100 hollow bar
Poured grout annulus
20mm diameter polystyrene guide tube
8mm guide rod to hold polysty-rene in place
Dimension of rough borehole once drilled out by airleg
ROCKENG09: Proceedings of the 3rd CANUS Rock Mechanics Symposium, Toronto, May 2009 (Ed: M.Diederichs and G. Grasselli)
PAPER 4027 4

Figure 4. Simulated boreholes ready for filing.
Figure 5. Poured cement mix and tested cement sample.
The cement mix was set for 28 days prior to reaming out of the polystyrene by an experienced airleg driller, Figure 6. Significant skill on the part of the operator and understanding of the ce-ment grout mix and how it drilled was required to successfully ream out the polystyrene from a diameter of 20mm to the nominal 45mm. The range of hole sizes was limited to available knock on drill bits for an airleg steel.
Figure 6. Airleg drilling of the sample to form the rough simulated borehole.
ROCKENG09: Proceedings of the 3rd CANUS Rock Mechanics Symposium, Toronto, May 2009 (Ed: M.Diederichs and G. Grasselli)
PAPER 4027 5

Once drilled the samples were thoroughly washed out to remove drill chips from the side of the hole. This was done to maximize the grip available between the installed bolt and the side of the simulated borehole and to prevent dust or grit acting as a layer of weakness when the test is per-formed. The next stage was to weld on an appropriate front plate or end piece that the simulated borehole will require to allow installation of the reinforcement system surface hardware against and for fitting into the WASM Dynamic Test Facility. The final requirement is to measure the rough simulated borehole diameters with a custom built device; this information is used to cre-ate the borehole diameters are shown in Figure 7.
2.3 Mine Site Installation The rough simulated boreholes were taken to a mine site for friction rock stabiliser installation. This decision was made to ensure that the actual equipment and operators that were installing the bolts in practice underground would also be installing the bolts into the rough simulated boreholes. This is important for reinforcement systems that are sensitive to the equipment and operator skills.
42
42.5
43
43.5
44
44.5
45
45.5
46
0 0.5 1 1.5 2 2.5
Distance from Toe (m)
Dia
met
er (m
m)
Sample 104Sample 108Sample 111Sample 106UG1UG2
Samples for Omega bolts, underground holes for split tube tubebolts.
42
42.5
43
43.5
44
44.5
45
45.5
46
0 0.5 1 1.5 2 2.5
Distance from Toe (m)
Dia
met
er (m
m)
Sample 104Sample 108Sample 111Sample 106UG1UG2
Samples for Omega bolts, underground holes for split tube tubebolts.
Figure 7. Typical borehole profile results.
2.3.1 Split Tube Bolts The simulated boreholes that had split tube bolts installed were taken underground to the bolt installation jumbo. A large hole was drilled into the tunnel wall for the sample tube to slide into. The jumbo was then used to drive the bolt into the rough simulated borehole, Figure 8. The simulated borehole with the installed bolt was recovered and brought back to surface.
Some of the split tube bolts had pull rings installed to allow static pull testing. A data set of 13 samples was acquired (not including the initial 11 samples) and two manufactures split tube bolts, including galvanised and non-galvanised.
ROCKENG09: Proceedings of the 3rd CANUS Rock Mechanics Symposium, Toronto, May 2009 (Ed: M.Diederichs and G. Grasselli)
PAPER 4027 6

Figure 8. Installation of a split tube bolt into a rough simulated borehole.
2.3.2 Omega Bolts The Omega bolts were inflated by the pump on the Jumbo when it was on the surface for ser-vice. The bolt was installed by simply pushing into a rough simulated bore hole, and then at-taching the inflation wand. The pump inflates to a set pressure of 300bar and hold. Seven Omega bolts were installed, with a range of hold times from one second to 15 seconds, and one interesting case of twenty repeated inflations with a one second hold due to wand problems, Figure 9. Both jumbos during the installation trials required the seals on the wand to be changed to achieve and hold the required pressure.
Figure 9. Omega bolt installation.
The Omega bolt installation was done as an initial program of four followed a second program of three. The first program had strain gauges installed onto the outside of the steel hollow bar to assess strain change from inflation. These changes were also monitored during dynamic tests.
wand
wand
Strain gauge monitoring
ROCKENG09: Proceedings of the 3rd CANUS Rock Mechanics Symposium, Toronto, May 2009 (Ed: M.Diederichs and G. Grasselli)
PAPER 4027 7

3 STATIC PULL TEST RESULTS
The friction rock stabilisers have specific test equipment for undertaking static pull tests. In both cases a pressure is read off a gauge in-line with a hydraulic cylinder and converted to an applied load at the collar of the bolt. With each pressure reading the extension of the ram on the jack is measured to obtain the displacement at the collar. The tests could also be referred to as quasi-static as the load is progressively increased to cause displacement.
Although there is the potential for the short amount of displacement that occurs by the static tests to influence the test result, it is important to validate the installed quality of the reinforcement system before proceeding to dynamic testing. This allows for poor dynamic reinforcement to be explained if it is known that a particular sample also had a low static resistance to pull out.
3.1 Split Tube Bolts The split tube bolts were 47mm diameter and driven into an undersized hole. The industry stan-dard is to use between a 43mm and 45mm drill bit depending on the rock type. The testing pro-grams were; − One; bolt numbers 93 to 96 Type A galvanised, − Two; bolt numbers 115, 116 and 118, Type B galvanized, − Three; bolt numbers 119 to 123 Type A non-galvanised. None of the bolts could be pull
tested statically due to the angle of the ring to the plate or the ring being driven through the surface hardware.
In practice when the split tube bolts are installed underground and "quality assurance" pull tests are undertaken, the pull tests are stopped between 80 and 120kN for a 2.4m long bolt, although the total effective embedment would only be 2.28m allowing for the taper at the toe of the bolt and pull ring at the collar. Static pull test results for 47mm split tube bolts are shown in Figure 10; all tests were stopped once a collar load of 120kN was reached or sliding started to occur.
0
20
40
60
80
100
120
140
0 2 4 6 8 10 12 14 16
Ram Extension (zeroed at first reading) (mm)
App
lied
Col
lar L
oad
(kN
) Bolt 96, Type A Galv, ave 44.5mm
Bolt 95, Type A galv, ave 44.3mm
Bolt 94, Type A Galv, ave 44.3mm
Bolt 116, Type B Galv, ave 44.3mm
Bolt 118, Type B Galv, ave 44.6mm
Bolt 115, Type B Galv, ave 44.8mm
Figure 10. Static applied collar load and displacement for 47mm diameter split tube bolts.
A static pull test result on a split tube bolt at the collar would be expected to show an increase in load to the point where sliding starts due to contraction of the split steel tube reducing the resistance to sliding. Sliding should occur at a reasonably consistent load. The capacity is often reported as kN per metre of embedment. The embedment length of interest is the toe length of the bolt that is be-yond a discontinuity; it is the toe length that can potentially stabilize an otherwise unstable block.
The results in Figure 10 can be compared with pull test results from an underground operation in Figure 11. A set of five, 2.4m long galvanized friction stabilisers were tested at installation and again five months later; the bolts were an earlier product similar to those tested for the results shown in Figure 9. Importantly it shows the variation in response as observed in the simulated boreholes, and a similar overall performance. Note the stiffening of response when pulled the second time.
ROCKENG09: Proceedings of the 3rd CANUS Rock Mechanics Symposium, Toronto, May 2009 (Ed: M.Diederichs and G. Grasselli)
PAPER 4027 8

2
4
6
8
10
12
14
16
0 5 10 15 20
Ram Extension (mm)
App
lied
Col
lar L
oad
(kN
) 55SS2 Bit Dia 43.8mm
55SS3 Bit Dia 45mm
55SS4 Bit Dia 44.8mm
55SS5 Bit Dia 44.3mm
55SS1 -2nd loading
55SS2 -2nd loading
55SS3 -2nd loading
55SS4 -2nd loading
55SS5 -2nd loading
0
20
40
60
08
100
120
140
160
0 5 10 15 20
55SS2 Bit Dia 43.8mm
55SS3 Bit Dia 45mm
55SS4 Bit Dia 44.8mm
55SS5 Bit Dia 44.3mm
55SS1 -2nd loading
55SS2 -2nd loading
55SS3 -2nd loading
55SS4 -2nd loading
55SS5 -2nd loading2
4
6
8
10
12
14
16
0 5 10 15 20
Ram Extension (mm)
App
lied
Col
lar L
oad
(kN
) 55SS2 Bit Dia 43.8mm
55SS3 Bit Dia 45mm
55SS4 Bit Dia 44.8mm
55SS5 Bit Dia 44.3mm
55SS1 -2nd loading
55SS2 -2nd loading
55SS3 -2nd loading
55SS4 -2nd loading
55SS5 -2nd loading
0
20
40
60
08
100
120
140
160
0 5 10 15 20
55SS2 Bit Dia 43.8mm
55SS3 Bit Dia 45mm
55SS4 Bit Dia 44.8mm
55SS5 Bit Dia 44.3mm
55SS1 -2nd loading
55SS2 -2nd loading
55SS3 -2nd loading
55SS4 -2nd loading
55SS5 -2nd loading
Figure 11. Underground static pull tests on 46mm split tube bolts.
3.2 Inflatable Bolts The Omega bolts have an undersized profile bolt that is inserted into a hole and then inflated to partially contour to the profile of the hole. The mine sites use a standard sized 45mm drill bit, rather than up to 50mm bit size recommended by the supplier. Omega bolts are non-galvanised. However, the second set had a protective coating for transportation to Australia. Static testing of the inflatable bolt was performed in two stages.
3.2.1 First Stage – validation of rough simulated borehole An Atlas Copco Swellex MN24 bolt was installed at 280bar (because the pump couldn't reach 300bar) and held for 4 minutes. The rough simulated borehole was cut off to allow examination of the toe sample as sliding occurred, Figure 12 with a 1.0m embedment test.
The collar of the bolt was pulled with readings taken of collar load, ram extension and toe dis-placement. The 200mm of free length allowed elastic stretch, followed by sliding of the bolt at a consistent force of 160kN. The purpose of this trial was to evaluate embedment capacity and whether consistent load transfer was achieved once sliding started to occur. Frequent "cracks and pops" were heard during the ram extension for this test; these were considered to indicate shearing of asperities on the rough simulated borehole or "flexing" of the inflated bolt.
Figure 12. Swellex sample configuration and pull test results for one metre embedment test.
Hydraulic Jack
Ram and cylinder 1000mm embedment
200,mm free length
0
20
40
60
80
100
120
140
160
180
0 10 20 30 40 50 60 70
Displacement (mm)
Col
lar L
oad
(kN
)
0
20
40
60
80
100
120
140
160
180
0 10 20 30 40 50 60 70
Displacement (mm)
Col
lar L
oad
(kN
)
In-line gauge
ROCKENG09: Proceedings of the 3rd CANUS Rock Mechanics Symposium, Toronto, May 2009 (Ed: M.Diederichs and G. Grasselli)
PAPER 4027 9
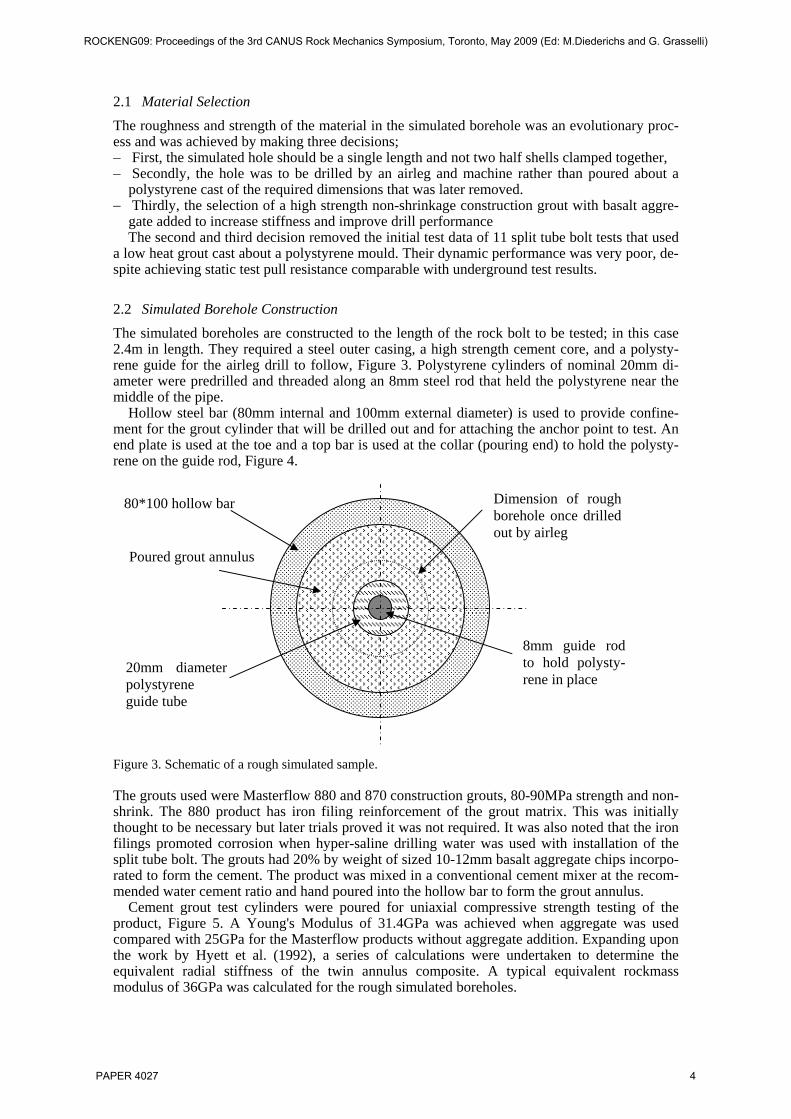
3.2.2 Second Stage - pre dynamic load tests Stage One was considered to show sufficient static capacity to commence dynamic testing. Static testing was possible for the first four Omega bolts; dynamic tests were undertaken for two of these bolts. The pre-dynamic tests can be compared with the post dynamic static tests. Post dynamic static tests were performed by welding spacer bars between the separated toe and collar embedment lengths and pulling the bolt at the collar again.
The static test conducted prior to a dynamic load was limited to a maximum force of 160kN to ensure minimal disturbance to the toe embedment length of the rough simulated borehole, Figure 13. The post dynamic static tests are shown in Figure 14, the embedment given is the toe length. Table 1 summaries the static results. A key feature from the post dynamic static test re-sults was that bolts that had displaced further during the dynamic test exhibited lower resistance to further displacement under static loading. This would be due to either shearing of asperities or deformation of the tube away from the side wall of the simulated borehole during the dy-namic test.
Figure 13. Static pull tests on Omega bolts prior to dynamic testing.
Figure 14. Static pull test on Omega bolts after dynamic testing.
Table 1. Summary of static pull test results on Omega bolts.
Initial Performance Post Dynamic Load Performance
Bolt Embedment (m)
Collar Force (kN)
Capacity (kN/m)
Displacement due to dynamic
test (m)
Total Embedment
(m)
Collar Force (kN)
Sliding Capacity
(kN/m) 104 2.25 >160 >70 0.82 1.43 50 - 80 34 – 56 106 2.25 - - 0.26 1.99 120 60 111 2.25 >160 >70 0.71 1.54 50 - 80 32 – 52
0
20
40
60
80
100
120
140
160
180
0 10 20 30 40 50 60 70
Displacement (mm)
Forc
e (k
N)
Bolt 111 After drop (1.06m) Bolt 104 After drop (0.95m) Bolt 106 After Drop (1.5m)
0
20
40
60
80
100
120
140
160
180
0 10 20 30 40 50 60 70
Displacement (mm)
Forc
e (k
N)
Bolt 111 After drop (1.06m) Bolt 104 After drop (0.95m) Bolt 106 After Drop (1.5m)Bolt 111 After drop (1.06m) Bolt 104 After drop (0.95m) Bolt 106 After Drop (1.5m)
0
20
40
60
80
100
120
140
160
180
0 10 20 30 40 50 60 70
Forc
e (k
N)
Bolt 111 Before Drop (2.25m) Bolt 104 Before Drop (2.25m)
0
20
40
60
80
100
120
140
160
180
0 10 20 30 40 50 60 70
Forc
e (k
N)
Bolt 111 Before Drop (2.25m)Bolt 111 Before Drop (2.25m) Bolt 104 Before Drop (2.25m)Bolt 104 Before Drop (2.25m)
Ram extension (mm)
ROCKENG09: Proceedings of the 3rd CANUS Rock Mechanics Symposium, Toronto, May 2009 (Ed: M.Diederichs and G. Grasselli)
PAPER 4027 10

4 FRICTION ROCK STABILISER RESULTS
Tests have been undertaken on 19 friction rock stabiliser samples in the rough simulated bore-holes with a total of 36 loadings. Observations show increased performance variability from the primary loading to the second or tertiary loadings. This could be due to change in the installed state of the bolt, inconsistent change in the roughness of the borehole, or that the types of fric-tion stabiliser do not have a consistent response to dynamic load. This final idea is derived from the primary load test scatter of results. Therefore only the initial loading results will be pre-sented. The friction rock stabiliser program testing will be summarised in three graphs; − the dynamic force-displacement curve with embedment versus displacement graph (embed-
ment capacity is calculated and corrected for the mass displacement so it only considers the remaining length of embedment that is actually doing work to dissipate energy), this is only shown to 500mm for clarity purposes. The "cycles" along the response are due to the use of a fast fourier transform filter when processing the mass deceleration data.
− energy dissipated by the reinforcement system versus the separation at the discontinuity on the simulated borehole. The dynamic performance of reinforcement systems must consider displacement. A high energy dissipation could be associated with a large displacement which maybe in excess of the deformation capacity of the support system or the limit of deformation required for excavation serviceability. A mine site must make its own decision on how much deformation of the ground support scheme is allowable prior to rehabilitation; a larger amount of deformation may result in greater breakage and loosening of the rockmass about the excavation.
− a summary graph of the velocity of the mass relative to the drop beam versus the displace-ment distance for the test (the relative velocity between the mass and the beam is zero at con-tact with the buffers, and then increases as the beam is slowed by the buffers faster than the rate at which the reinforcement system can dissipate the kinetic energy of the loading mass)
In all graphs the same y-axis scale will be used for comparison purposes for equivalent data be-tween the split tube bolts and the Omega bolts. A circled data point indicates that the loading mass and hence the reinforcement system has impacted the bottom of the pit.
4.1 47mm Split Tube Bolt Results Figure 15 shows the dynamic force-displacement curves for the split tube bolts, and highlights the variability in the response of the reinforcement system; there is also a trend for higher resis-tive response to lower input energies and lower resistive response to high input energy. How-ever, the most important fact is that the dynamic frictional resistance is lower than the static re-sistance. The spike at the end of a trace represents the mass coming to rest.
0
20
40
60
80
100
120
140
0 100 200 300 400 500Displacement (mm)
Forc
e pe
r met
er o
f em
bedm
ent (
dyna
mic
) (kN
/m)
93-194-195-196-1115-1116-1118-1119-1120-1121-1122-1123-1
Type A
Non-galv
Type A
Galv
Type B
Galv
KEimpact15.515.612.628.714.911.95.612.111.711.811.823.6
Bolt
0
20
40
60
80
100
120
140
0 100 200 300 400 500Displacement (mm)
Forc
e pe
r met
er o
f em
bedm
ent (
dyna
mic
) (kN
/m)
93-194-195-196-1115-1116-1118-1119-1120-1121-1122-1123-1
Type A
Non-galv
Type A
Galv
Type B
Galv
KEimpact15.515.612.628.714.911.95.612.111.711.811.823.6
Bolt
Figure 15. Dynamic force displacement curve for split tube bolts for active toe embedment length.
ROCKENG09: Proceedings of the 3rd CANUS Rock Mechanics Symposium, Toronto, May 2009 (Ed: M.Diederichs and G. Grasselli)
PAPER 4027 11
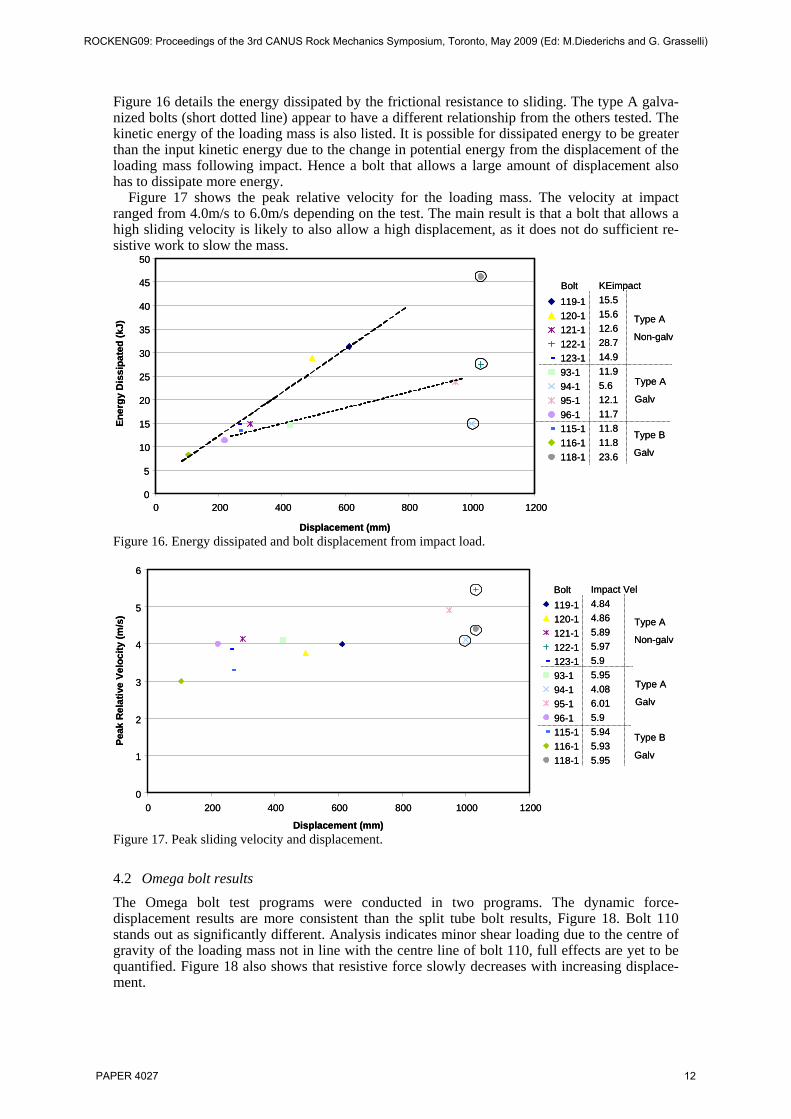
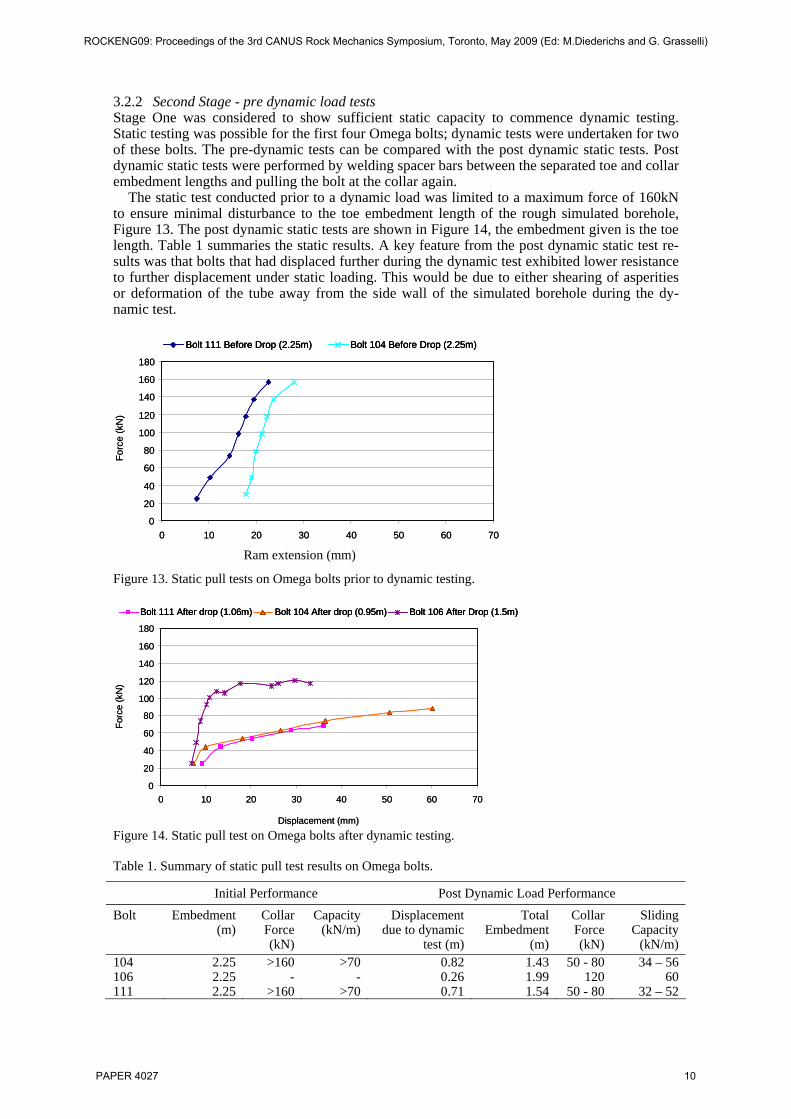
Figure 16 details the energy dissipated by the frictional resistance to sliding. The type A galva-nized bolts (short dotted line) appear to have a different relationship from the others tested. The kinetic energy of the loading mass is also listed. It is possible for dissipated energy to be greater than the input kinetic energy due to the change in potential energy from the displacement of the loading mass following impact. Hence a bolt that allows a large amount of displacement also has to dissipate more energy.
Figure 17 shows the peak relative velocity for the loading mass. The velocity at impact ranged from 4.0m/s to 6.0m/s depending on the test. The main result is that a bolt that allows a high sliding velocity is likely to also allow a high displacement, as it does not do sufficient re-sistive work to slow the mass.
0
5
10
15
20
25
30
35
40
45
50
0 200 400 600 800 1000 1200
Displacement (mm)
Ener
gy D
issi
pate
d (k
J)
119-1120-1121-1122-1123-193-194-195-196-1115-1116-1118-1
Type A
Non-galv
Type A
Galv
Type B
Galv
KEimpact15.515.612.628.714.911.95.612.111.711.811.823.6
Bolt
0
5
10
15
20
25
30
35
40
45
50
0 200 400 600 800 1000 1200
Displacement (mm)
Ener
gy D
issi
pate
d (k
J)
119-1120-1121-1122-1123-193-194-195-196-1115-1116-1118-1
Type A
Non-galv
Type A
Galv
Type B
Galv
KEimpact15.515.612.628.714.911.95.612.111.711.811.823.6
Bolt
Figure 16. Energy dissipated and bolt displacement from impact load.
0
1
2
3
4
5
6
0 200 400 600 800 1000 1200
Displacement (mm)
Peak
Rel
ativ
e Ve
loci
ty (m
/s)
119-1120-1121-1122-1123-193-194-195-196-1115-1116-1118-1
Type A
Non-galv
Type A
Galv
Type B
Galv
Impact Vel4.844.865.895.975.95.954.086.015.95.945.935.95
Bolt
0
1
2
3
4
5
6
0 200 400 600 800 1000 1200
Displacement (mm)
Peak
Rel
ativ
e Ve
loci
ty (m
/s)
119-1120-1121-1122-1123-193-194-195-196-1115-1116-1118-1
Type A
Non-galv
Type A
Galv
Type B
Galv
Impact Vel4.844.865.895.975.95.954.086.015.95.945.935.95
Bolt
Figure 17. Peak sliding velocity and displacement.
4.2 Omega bolt results The Omega bolt test programs were conducted in two programs. The dynamic force-displacement results are more consistent than the split tube bolt results, Figure 18. Bolt 110 stands out as significantly different. Analysis indicates minor shear loading due to the centre of gravity of the loading mass not in line with the centre line of bolt 110, full effects are yet to be quantified. Figure 18 also shows that resistive force slowly decreases with increasing displace-ment.
ROCKENG09: Proceedings of the 3rd CANUS Rock Mechanics Symposium, Toronto, May 2009 (Ed: M.Diederichs and G. Grasselli)
PAPER 4027 12

The comparison of initial and secondary tests in Figure 19 shows that a higher displacement oc-curs on a repeat test. Repeat load results on the Omega bolt are included on Figure 19 and 20. They show a second loading on a bolt that has already displaced 200mm allows significantly more displacement for equivalent energy input on an initial loading. This is because sliding oc-curs at a lower resistive load on the secondary loading.
Figure 20 shows the peak relative velocity and displacement graph for all tests on the Omega bolts. This graph supports the concept that axial sliding velocity up to 3.5m/s were stabilised by the bolt, particularly if it is a primary loading, but a sliding velocity of 5m/s will result in failure of the system.
0
20
40
60
80
100
120
140
0 50 100 150 200 250 300 350 400 450 500
Displacement (mm)
Forc
e pe
r met
er o
f em
bedm
ent (
dyna
mic
) (kN
/m)
104-1106-1108-1111-1105-1110-1113-1
KE Input23.913.333.123.824.030.032.0
Pro
gram
O
neP
rogr
am
Two
Bolt
0
20
40
60
80
100
120
140
0 50 100 150 200 250 300 350 400 450 500
Displacement (mm)
Forc
e pe
r met
er o
f em
bedm
ent (
dyna
mic
) (kN
/m)
104-1106-1108-1111-1105-1110-1113-1
0
20
40
60
80
100
120
140
0 50 100 150 200 250 300 350 400 450 500
Displacement (mm)
Forc
e pe
r met
er o
f em
bedm
ent (
dyna
mic
) (kN
/m)
104-1106-1108-1111-1105-1110-1113-1
KE Input23.913.333.123.824.030.032.0
Pro
gram
O
neP
rogr
am
Two
Bolt
Figure 18. Dynamic force displacement curve calculated for active toe embedment length.
0
5
10
15
20
25
30
35
40
45
50
0 200 400 600 800 1000 1200Displacement (mm)
Abs
orbe
d En
ergy
(kJ)
104-1104-2106-1106-2106-3108-1111-1111-2105-1105-2105-3110-1110-2113-1
KE impact23.923.913.313.213.333.123.823.924.022.99.9
30.025.632.0
Pro
gram
One
Pro
gram
Tw
o
Bolt
0
5
10
15
20
25
30
35
40
45
50
0 200 400 600 800 1000 1200Displacement (mm)
Abs
orbe
d En
ergy
(kJ)
104-1104-2106-1106-2106-3108-1111-1111-2105-1105-2105-3110-1110-2113-1
KE impact23.923.913.313.213.333.123.823.924.022.99.9
30.025.632.0
Pro
gram
One
Pro
gram
Tw
o
Bolt
Figure 19. Energy dissipated and bolt displacement from impact load.
ROCKENG09: Proceedings of the 3rd CANUS Rock Mechanics Symposium, Toronto, May 2009 (Ed: M.Diederichs and G. Grasselli)
PAPER 4027 13

0
1
2
3
4
5
6
0 200 400 600 800 1000 1200
Displacement (mm)
Peak
Rel
ativ
e Ve
loci
ty (m
/s)
104-1104-2106-1106-2106-3108-1111-1111-2105-1105-2105-3110-1110-2113-1
Impact Vel5.945.945.935.95.935.985.935.945.935.893.886.756.236.96
Pro
gram
One
Pro
gram
Tw
o
Bolt
0
1
2
3
4
5
6
0 200 400 600 800 1000 1200
Displacement (mm)
Peak
Rel
ativ
e Ve
loci
ty (m
/s)
104-1104-2106-1106-2106-3108-1111-1111-2105-1105-2105-3110-1110-2113-1
0
1
2
3
4
5
6
0 200 400 600 800 1000 1200
Displacement (mm)
Peak
Rel
ativ
e Ve
loci
ty (m
/s)
104-1104-2106-1106-2106-3108-1111-1111-2105-1105-2105-3110-1110-2113-1
Impact Vel5.945.945.935.95.935.985.935.945.935.893.886.756.236.96
Pro
gram
One
Pro
gram
Tw
o
Bolt
Figure 20. Peak sliding velocity and displacement.
5 CONCLUDING REMARKS
A comprehensive static and dynamic testing program has been undertaken on friction rock sta-bilisers. The investigations included the development of high strength rough simulated bore-holes that would provide conditions similar to those in rock. The dynamic loading methodology, instrumentation and analysis techniques promote a comprehensive understanding of accelera-tion, displacement, force and time for components of the test facility and sample. This allows the calculation of energy dissipation, force-displacement curves, acceleration and velocity time curves.
Figure 21 enables comparisons of the axial static versus dynamic performance for the 47mm diameter split tube bolt and the Omega bolts. The Omega bolt even when sliding has an equiva-lent or greater capacity than the static capacity for the split tube bolt. The Omega bolt and split tube bolt have a reduced resistance to sliding on repetitive loadings. The split tube bolt shows a greater variation in performance than the Omega bolt.
0
20
40
60
80
100
120
140
160
180
0 100 200 300 400 500
Displacement (mm)
Emed
men
tCap
acity
(kN
/m)
Averaged DynamicSplitset Performance
Averaged Dynamic Omega Performance
Static Swellex MN24 1m embedment test
Normalised Static Splitset Capacity
0
20
40
60
80
100
120
140
160
180
0 100 200 300 400 500
Displacement (mm)
Emed
men
tCap
acity
(kN
/m)
Averaged DynamicSplitset Performance
Averaged Dynamic Omega Performance
Static Swellex MN24 1m embedment test
Normalised Static Splitset Capacity
Figure 21. Comparison of static and dynamic performance.
Averaged Dynamic Split Tube Performance
Normalised Static Split Tube Capacity
Static Swellex Mn24 1m embedment test
Averaged Dynamic Omega Performance
ROCKENG09: Proceedings of the 3rd CANUS Rock Mechanics Symposium, Toronto, May 2009 (Ed: M.Diederichs and G. Grasselli)
PAPER 4027 14

5.1 47mm Split Tube Bolt The 47mm split tube bolt should be expected to have an axial static capacity of 50kN/m of em-bedment, with a reduction of 30-25kN/m as the bolt slides under dynamic load. This can be cal-culated to an average energy dissipate of 2.7kJ (sd+/-1.0) per 100mm of slip normalised to per metre of embedment (the standard deviation is reported in brackets). This can be compared to Ortlepp and Stacey (1998) for 39mm split tube bolt projected at 1kJ/100mm of sliding for one metre of embedment, although they noted a low level of confidence in the result.
5.2 Omega Bolt Omega bolt (equivalent to Swellex MN24) expect an axial static capacity of 160kN/m of em-bedment and a reduction to 70kN/m of embedment that will reduce to 50kN/m as it slides under dynamic load. This can be calculated to an average energy dissipation of 6.2kJ (sd+/-1.3) per 100mm of slip normalised to per metre of embedment. This can be compared to Ortlepp and Stacey (1998) for Swellex PM12 bolts of 3.0-5.8kJ/100mm of sliding with 1.4m of embedment. In Figure 21, bolt 110 has not been included in the average Omega bolt performance as it was a significant outlier and was not only axially loaded.
ACKNOWLEDGEMENTS
The writers would like to thank the sponsoring organisations of MERIWA Projects M349 and M349A – Dynamic Testing of Reinforcement and Support Systems, Minerals and Energy Re-search Institute of Western Australia, namely Barrick – Kanowna Belle, Strata Control Systems, DSI, Atlas Copco, BHP Nickel West, Geobrugg, Newmont Gold, Harmony Gold, Kalgoorlie Consolidated Gold Mines, Lightning Nickel, Onesteel and the WA government through MERIWA
REFERENCES
Hyett, A, Bawden, WF & Reichardt, R 1992, 'The Effect of Rockmass Confinement on the Bond Strength of Fully Grouted Cable Bolts', Int. J. Rock Mech. Min. Sc.& Geomech. Abstr, vol. 29, no. 5, pp. 503-524.
Ortlepp, WD & Stacey, D 1998, Dynamic Loading of Rockbolt Elements to Provide Data for Safer Sup-port Design, Safety In Mines Research Advisory Committee Report, South Africa, GAP423, 49pages + 3 Appendix
Player, JR, Villaescusa, E & Thompson, AG 2004, 'Dynamic testing of rock reinforcement using the momentum transfer concept', Proceedings of the Fifth International Symposium on Ground Support, eds. E Villaescusa & E Potvin, Balkema, Perth, pp. 327-340.
Player, J, Morton, E, Thompson, AG & Villaescusa, E 2008a, 'Static and Dynamic Testing of steel wire mesh for mining applications of rock surface support ', 6th International Symposium on Ground Sup-port in Mining and Civil Engineering Construction, eds. TR Stacey & DF Malan, Southern African In-stitute of Mining nad Metallurgy, Capetown, pp. 693-706.
Player, J, Thompson, AG & Villaescusa, E 2008b, 'Dynamic Testing of Reinforcement Systems', 6th In-ternational Symposium on Ground Support in Mining and Civil Engineering Construction, eds. TR Stacey & DF Malan, Southern African Institute of Mining add Metallurgy, Capetown, pp. 597-622.
Player, JR, Thompson, AG & Villaescusa, E, 2008c, 'Improvements to Reinforcement Systems through Dynamic Testing', 10th AusIMM Underground Operators Conference, AusIMM, Launceston, pp. 79-88.
Player, J, Villaescusa, E & Thompson, AG 2008d, 'An Examination of Dynamic Test Facilities', Austra-lian Mining Technology Conference., CRC Mining, pp, AusIMM, pp349-379
Varden, R, Lachenicht, R, Player, J, Thompson, AG & Villaescusa, E 2008, 'Development and Imple-mentation of the Garford Dynamic Bolt at Kanowna Belle Gold Mine', 10th AusIMM Underground Operators Conference, AusIMM, Launceston, pp. 95-104.
ROCKENG09: Proceedings of the 3rd CANUS Rock Mechanics Symposium, Toronto, May 2009 (Ed: M.Diederichs and G. Grasselli)
PAPER 4027 15