Embed Size (px)
Citation preview
Dynamic Tidal Power
Introduction by:
Dimitri de Boer Team Leader EU Programs United Nations Industrial Development Organization ITPO - China
Seoul, 6 December 2010
Seminar on New & Renewable EnergyNetherlands Embassy, Korea
Korea Wind Energy Industry Association
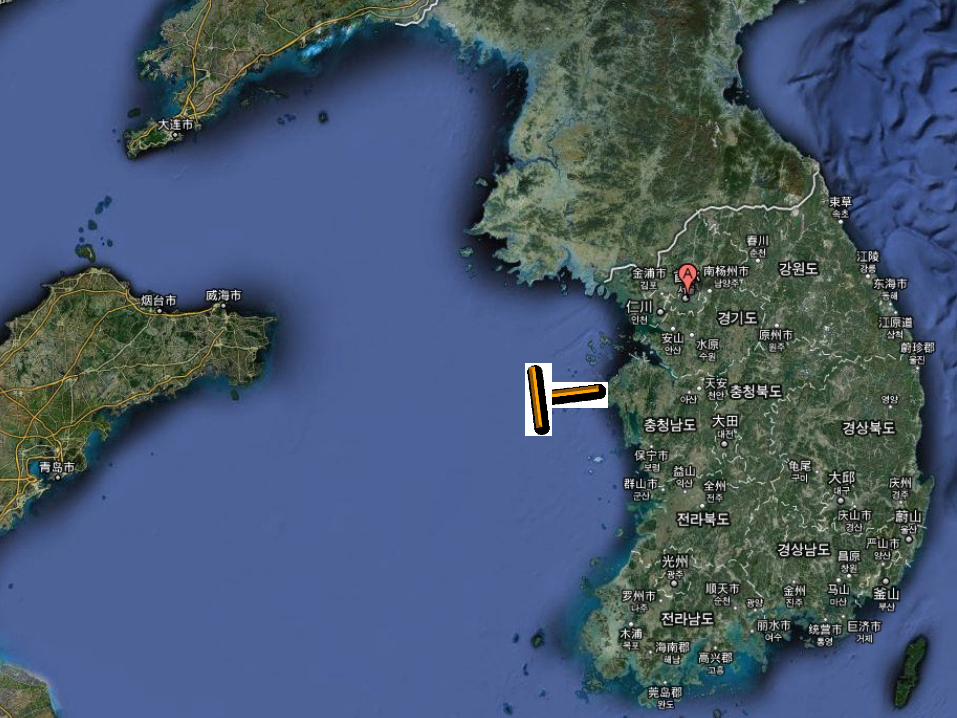
Revolving Tides in Yellow Sea
Can Korea generate up to 20% of national power consumption from the tides with a few big projects?
Introduction
Description
Benefits
Technological Development
Challenges
How does it work?
Recent Progress & Next Steps

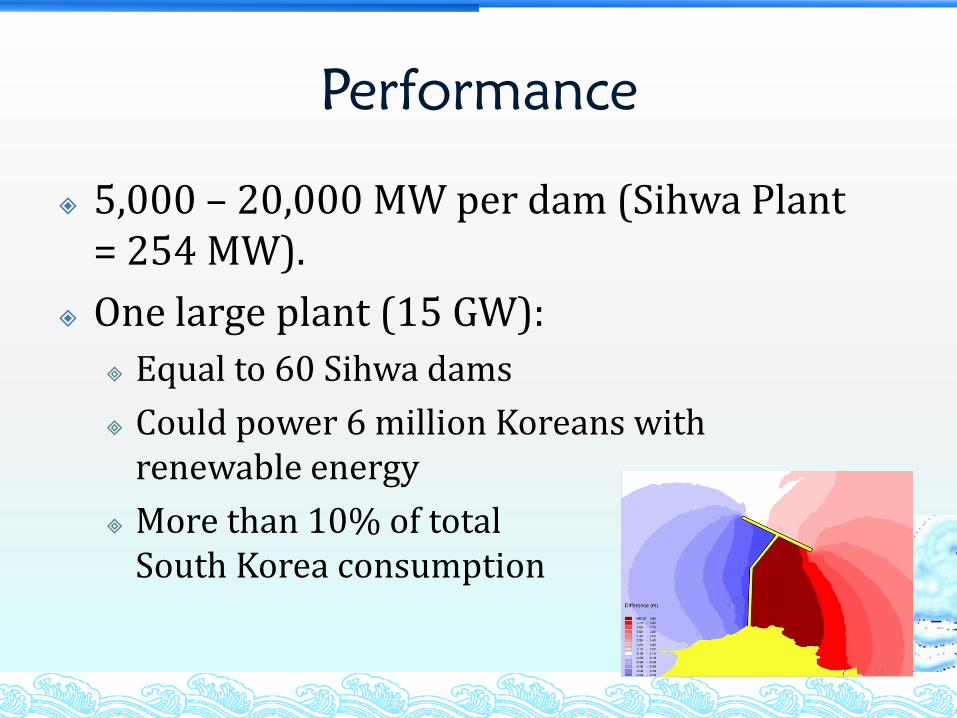
Performance
5,000 – 20,000 MW per dam (Sihwa Plant = 254 MW).
One large plant (15 GW):
Equal to 60 Sihwa dams
Could power 6 million Koreans with renewable energy
More than 10% of total South Korea consumption
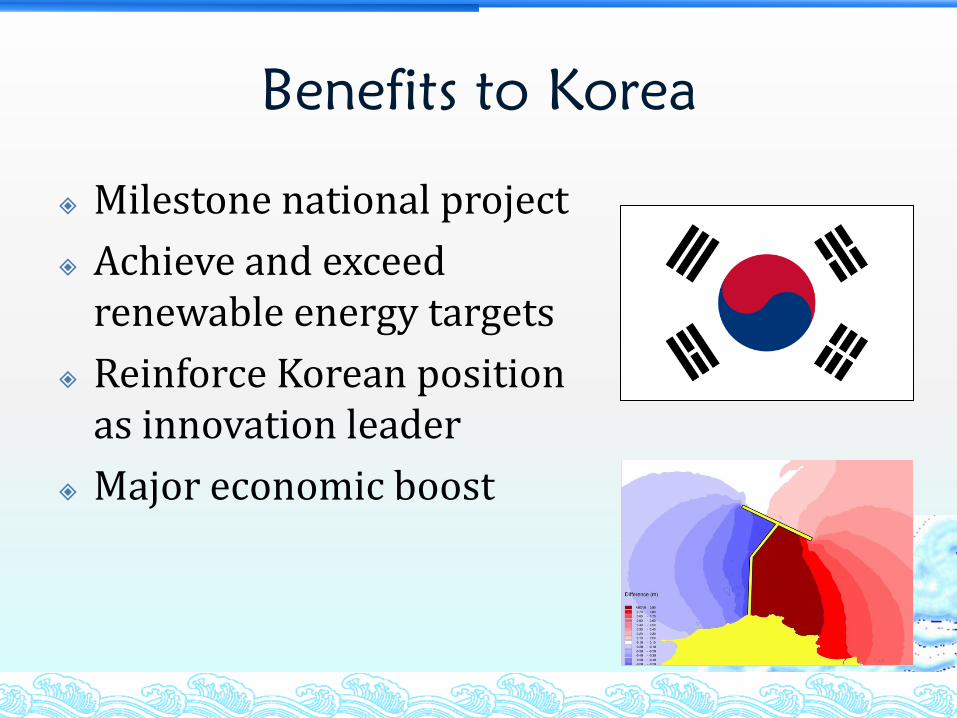
Benefits to Korea
Milestone national project
Achieve and exceed renewable energy targets
Reinforce Korean position as innovation leader
Major economic boost
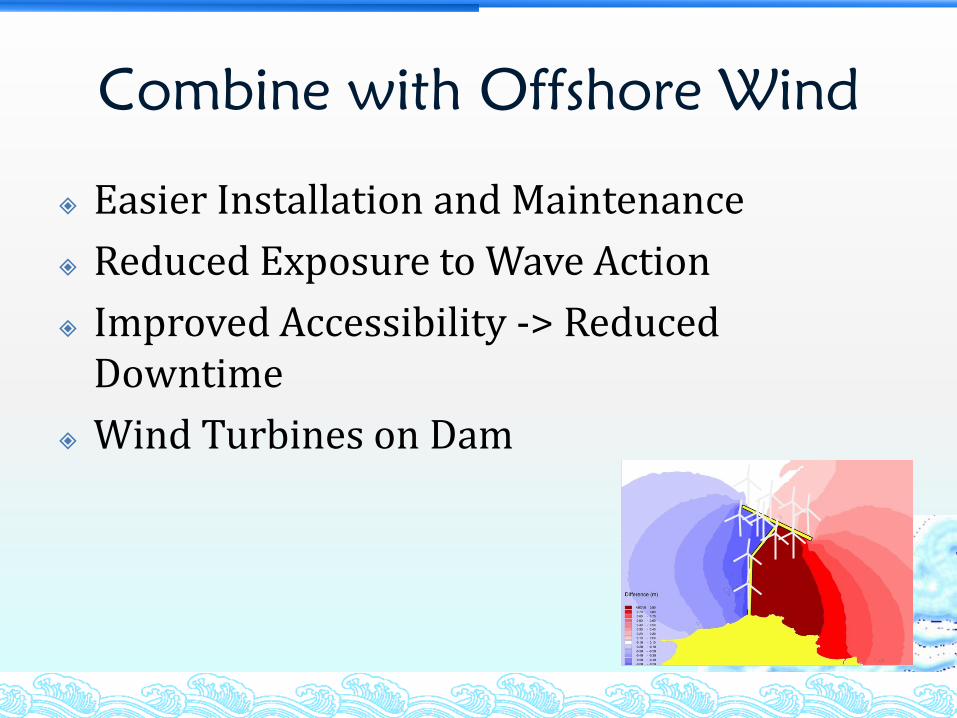
Combine with Offshore Wind
Easier Installation and Maintenance
Reduced Exposure to Wave Action
Improved Accessibility -> Reduced Downtime
Wind Turbines on Dam
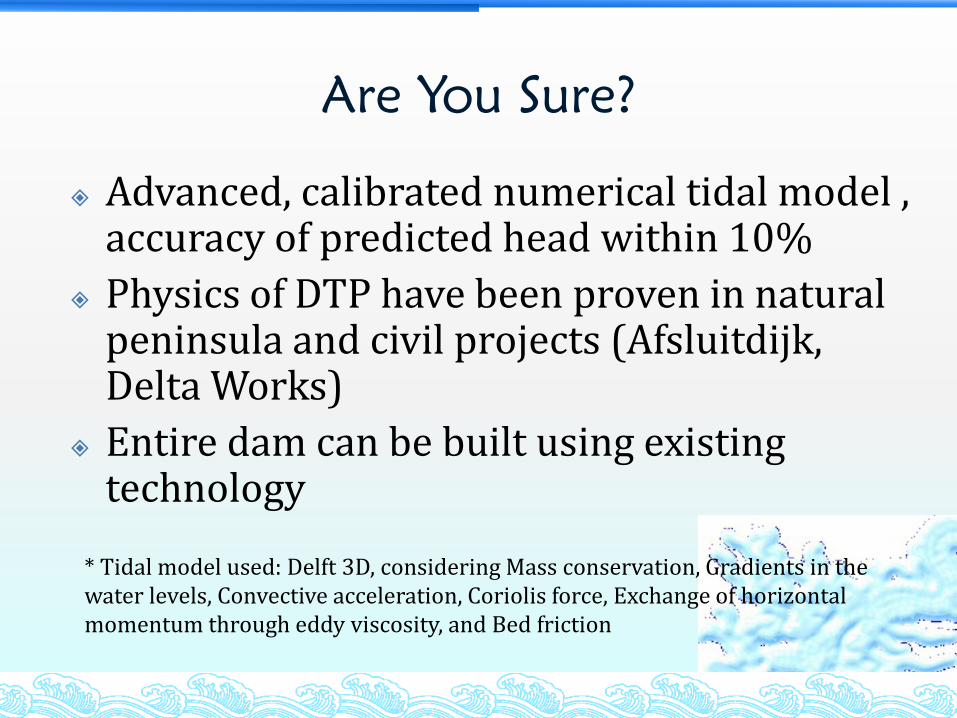
Are You Sure?
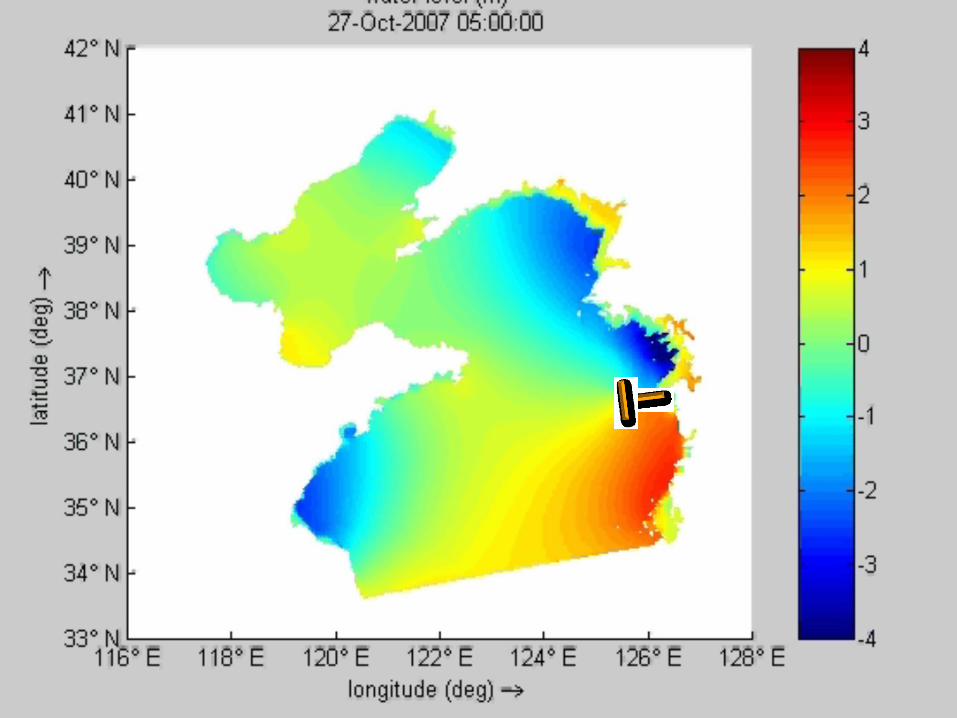
Advanced, calibrated numerical tidal model , accuracy of predicted head within 10%
Physics of DTP have been proven in natural peninsula and civil projects (Afsluitdijk, Delta Works)
Entire dam can be built using existing technology
* Tidal model used: Delft 3D, considering Mass conservation, Gradients in the water levels, Convective acceleration, Coriolis force, Exchange of horizontal momentum through eddy viscosity, and Bed friction
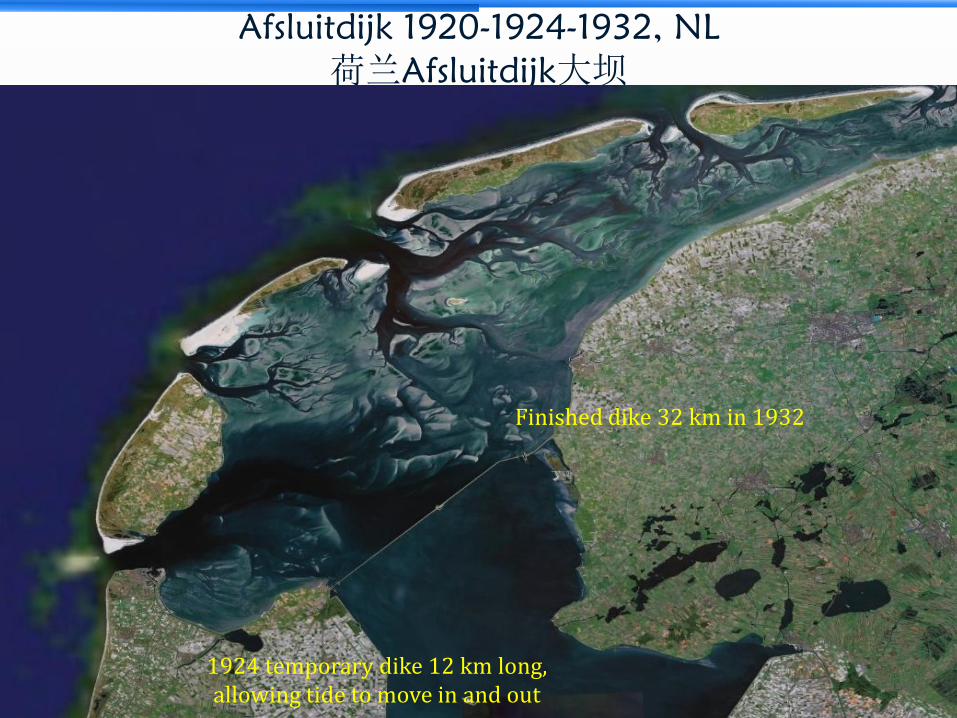
Afsluitdijk 1920-1924-1932, NL
荷兰Afsluitdijk大坝
Finished dike 32 km in 1932
1924 temporary dike 12 km long, allowing tide to move in and out
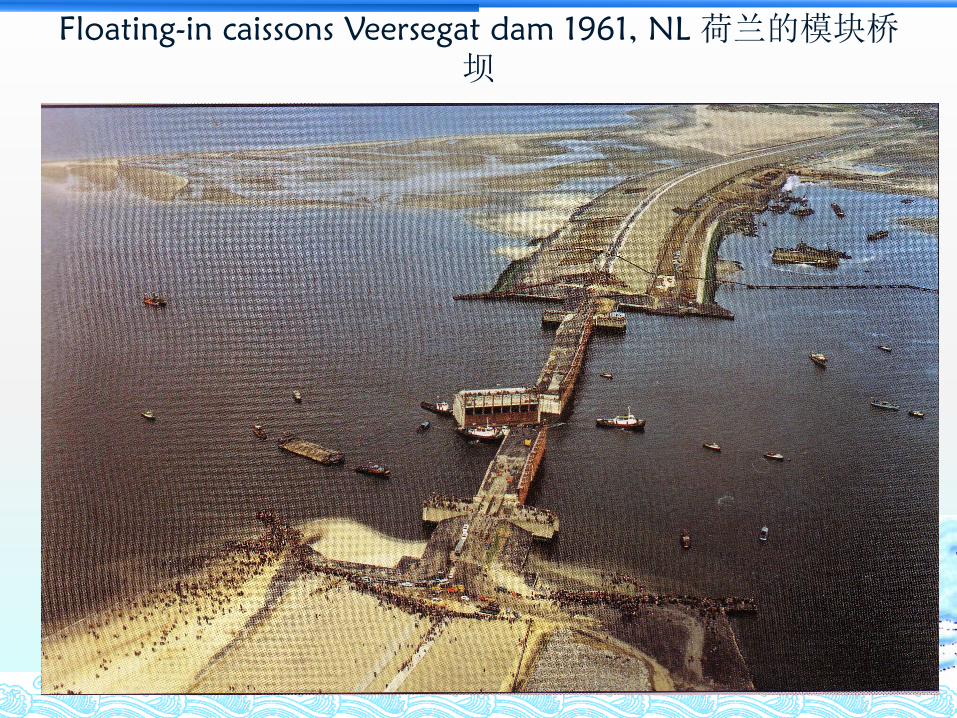
Floating-in caissons Veersegat dam 1961, NL 荷兰的模块桥坝

Delta Werken, NL, 1950 - 1997

Power Generation: Turbines
Bi-directional, low head turbines
1000 – 2500 units, 4 MW – 8 MW per unit
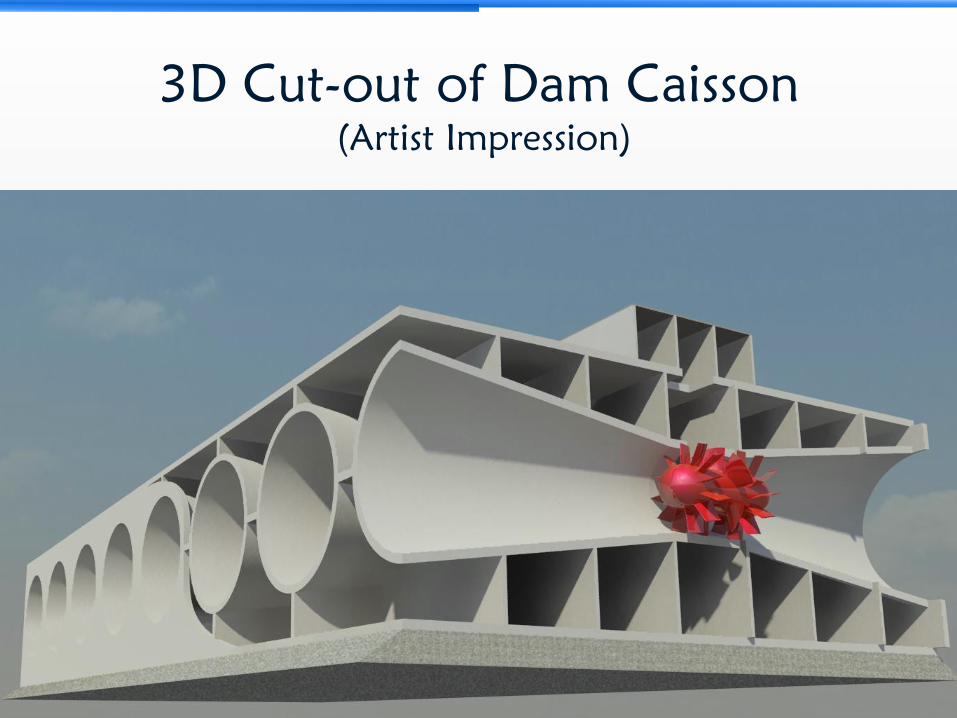
3D Cut-out of Dam Caisson
(Artist Impression)
Tidal wave
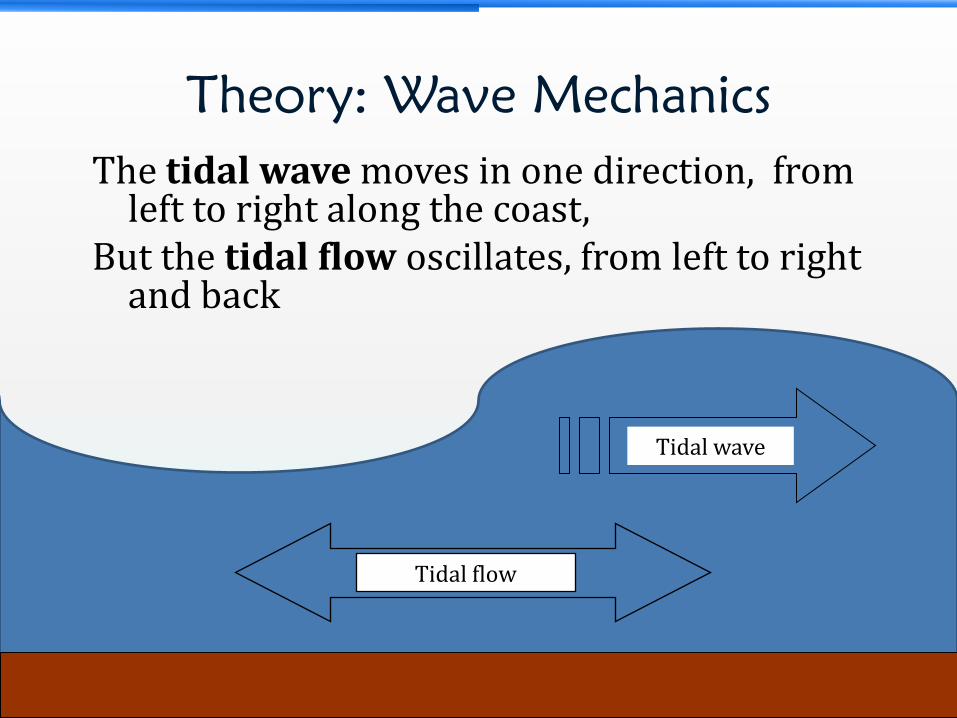
The tidal wave moves in one direction, from left to right along the coast,
But the tidal flow oscillates, from left to right and back
Tidal flow
Theory: Wave Mechanics
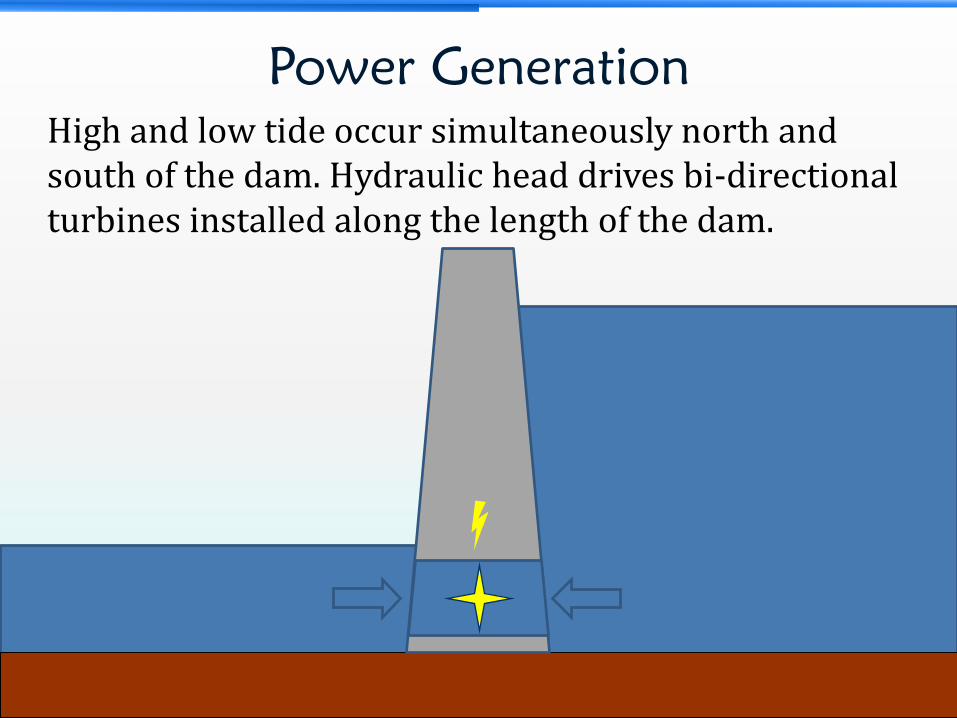
Power Generation
High and low tide occur simultaneously north and south of the dam. Hydraulic head drives bi-directional turbines installed along the length of the dam.
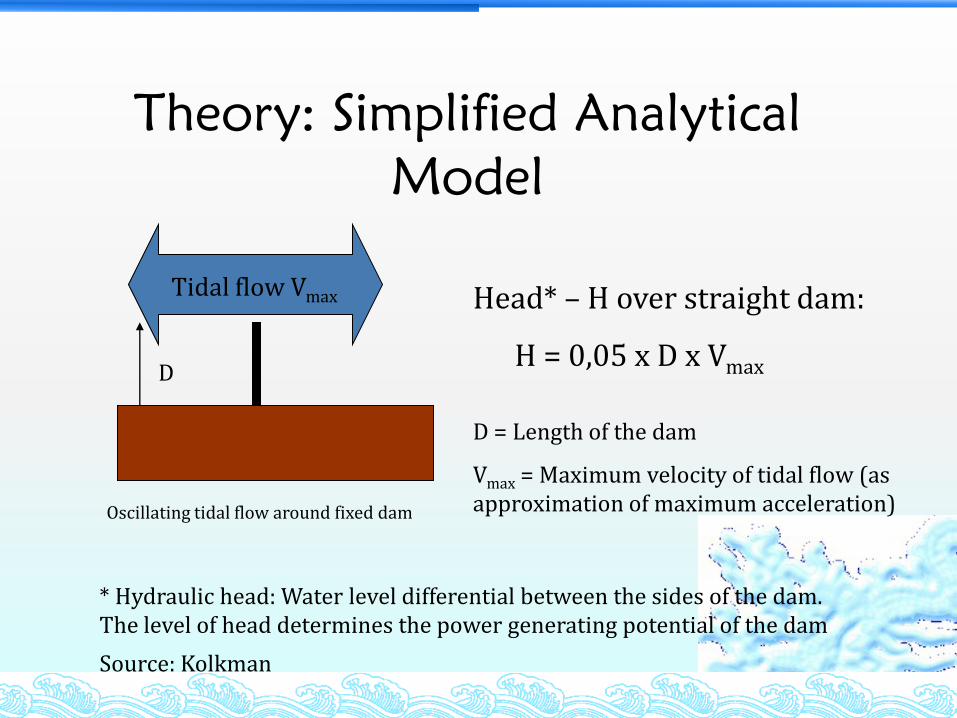
Oscillating tidal flow around fixed dam
Tidal flow Vmax
D
Head* – H over straight dam:
H = 0,05 x D x Vmax
D = Length of the dam
Vmax = Maximum velocity of tidal flow (as approximation of maximum acceleration)
Theory: Simplified Analytical
Model
* Hydraulic head: Water level differential between the sides of the dam. The level of head determines the power generating potential of the dam
Source: Kolkman

- Peak Tidal Flow Velocity = 1 m/s
- Water Depth = 25 m
- % Turbine Area = 10%
0
5,000
10,000
15,000
20,000
25,000
30,000
35,000
1 11 21 31 41 51 61
Dam Length (km)
Peak Power for a Square T Dam vs Dam Length
Peak
Power
(MW)
Power Generation for T Dam
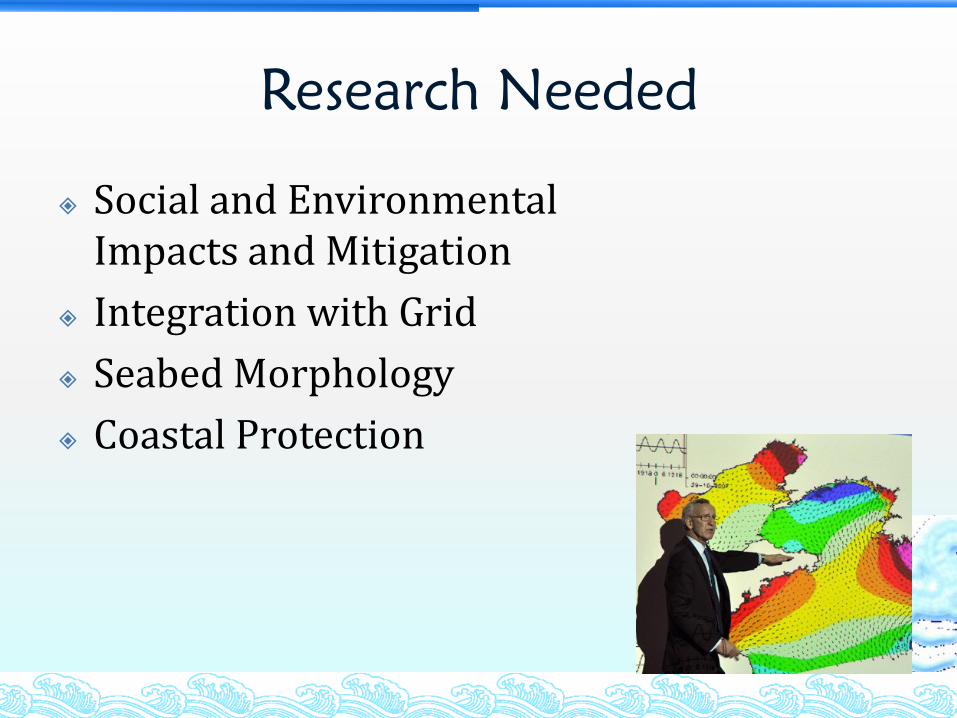
Research Needed
Social and Environmental Impacts and Mitigation
Integration with Grid
Seabed Morphology
Coastal Protection
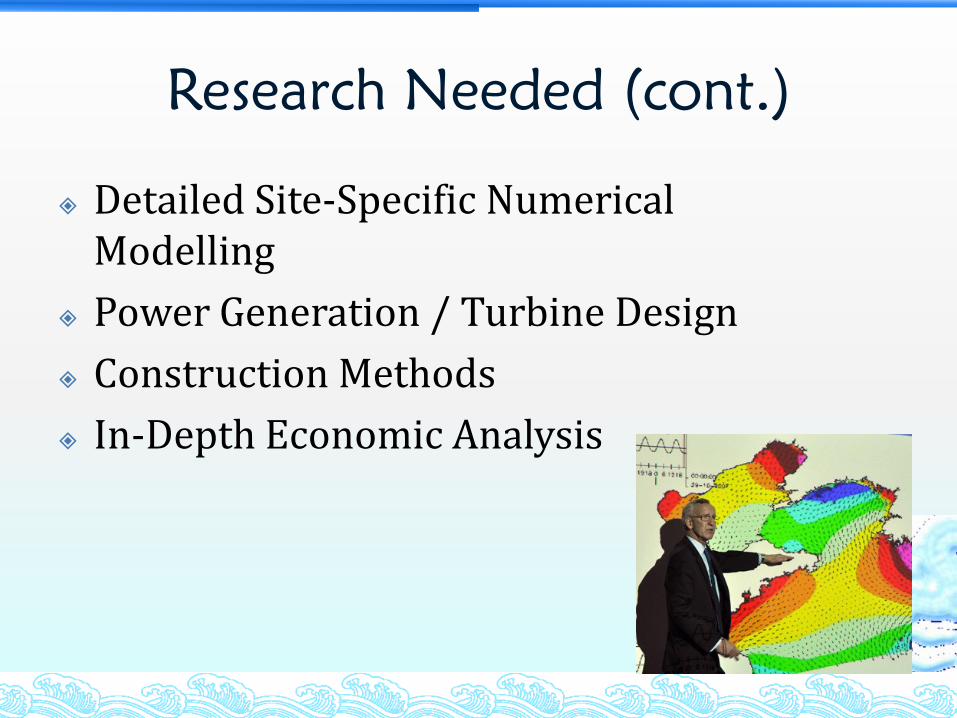
Research Needed (cont.)
Detailed Site-Specific Numerical Modelling
Power Generation / Turbine Design
Construction Methods
In-Depth Economic Analysis
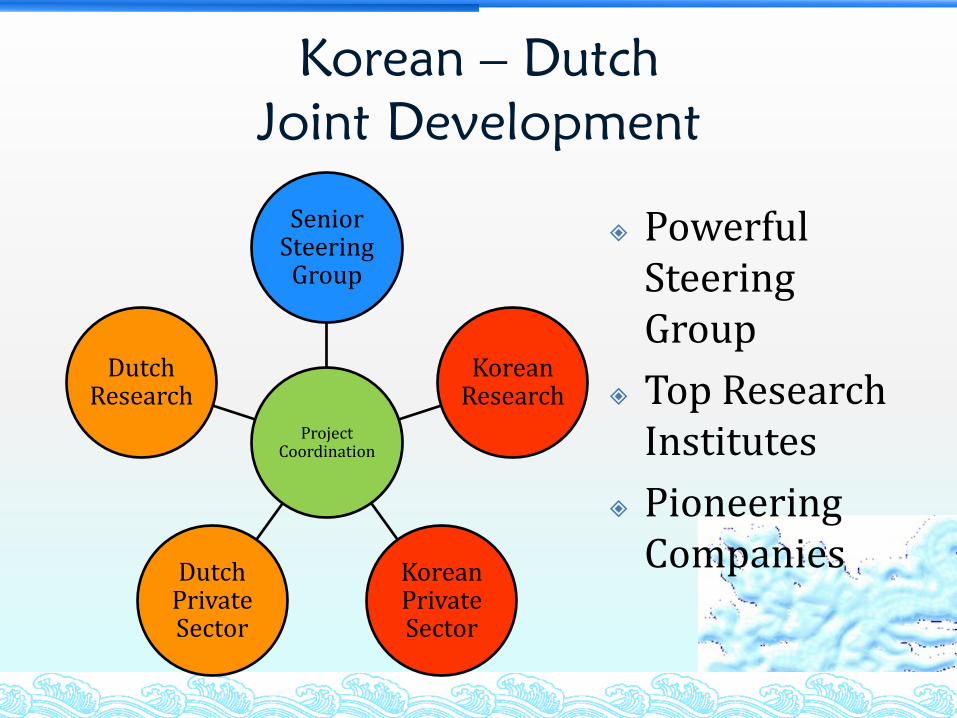
Korean – Dutch
Joint Development
Project Coordination
Senior Steering
Group
Korean Research
Korean Private Sector
Dutch Private Sector
Dutch Research
Powerful SteeringGroup
Top Research Institutes
Pioneering Companies
Korean IP
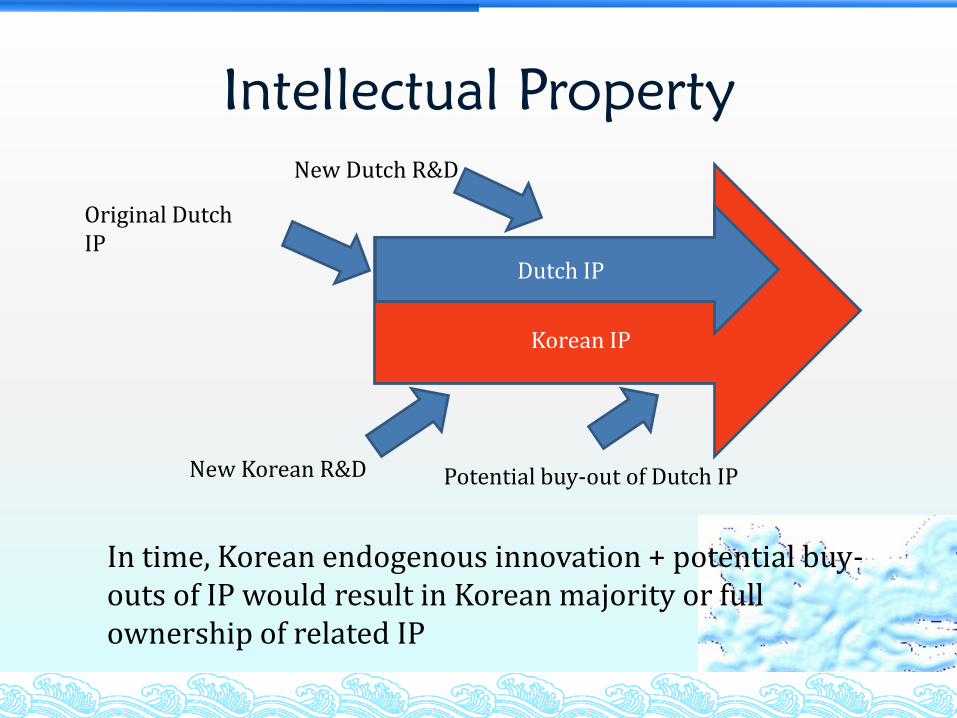
Intellectual Property
In time, Korean endogenous innovation + potential buy-outs of IP would result in Korean majority or full ownership of related IP
Dutch IP
Original Dutch IP
New Korean R&D
New Dutch R&D
Potential buy-out of Dutch IP
23
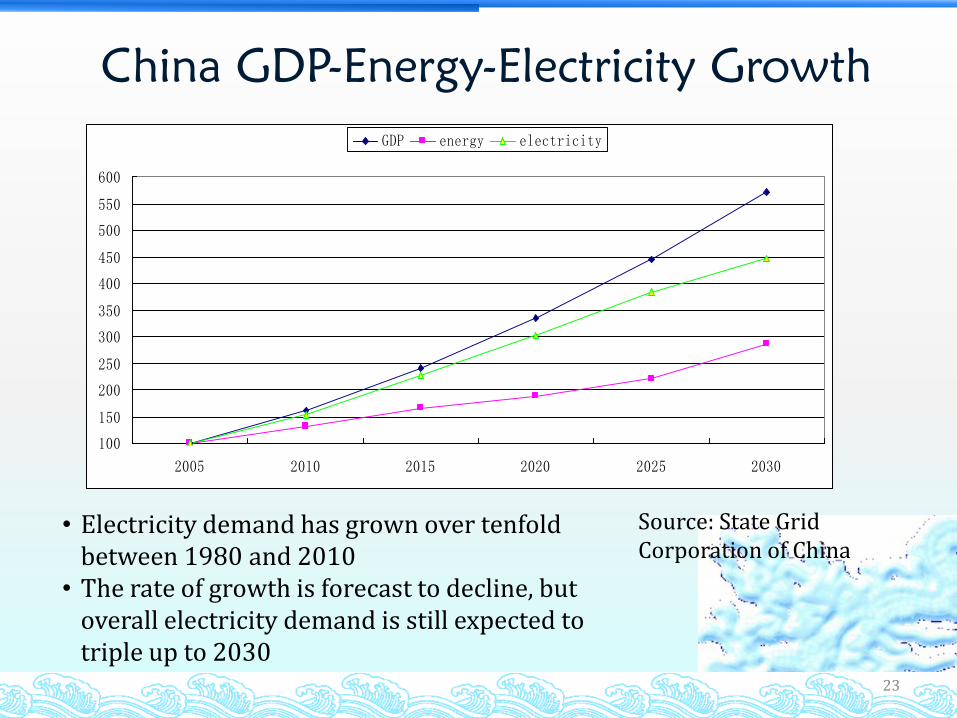
China GDP-Energy-Electricity Growth
100
150
200
250
300
350
400
450
500
550
600
2005 2010 2015 2020 2025 2030
GDP energy electricity
• Electricity demand has grown over tenfold between 1980 and 2010
• The rate of growth is forecast to decline, but overall electricity demand is still expected to triple up to 2030
Source: State Grid Corporation of China

Thank You!
Dimitri de Boer Team Leader EU Programs
United Nations Industrial Development Organization ITPO – [email protected]