Embed Size (px)
Citation preview

Dynamics and Control of Percutaneous Drug Absorption inthe Presence of Epidermal Turnover
LAURENT SIMON, AMIT GOYAL
Otto York Department of Chemical Engineering, New Jersey Institute of Technology, Newark, New Jersey 07029
Received 25 October 2007; revised 31 December 2007; accepted 6 March 2008
Published online 14 May 2008 in Wiley InterScience (www.interscience.wiley.com). DOI 10.1002/jps.21408
Corresponde5263; Fax: 973-
Journal of Pharm
� 2008 Wiley-Liss
ABSTRACT: The integration of epidermal turnover into the study of transdermal drug-delivery kinetics is addressed in light of classical control theory. A mathematicalrepresentation of the process, which includes Fickian diffusion and advection, wasformulated in the frequency domain. This transformation facilitated a detailed analysisof the system dynamics and revealed the intricate relationships among a medicamenttransient absorption through the skin, the epidermal turnover rate, its physicochemicalproperties and the amount of drugs in a reservoir. The process, represented by trans-cendental transfer functions, was reduced to a second-order system with dead-time byminimizing the squared magnitude of the complex error between the original andsimplified models. Clinically relevant parameters, such as the time to reach steady-state flux or drug concentration in the skin layers, are readily available from the low-order models. The time it takes to deliver a specified dose of drug to a particular depth inthe skin is a function of the penetration depth and the diffusion coefficients of the drugmolecules in the stratum corneum and the viable epidermis. An optimum administrationprotocol was developed for the transdermal delivery of chemicals when epidermalturnover is likely to affect their absorption into the systemic circulation. � 2008
Wiley-Liss, Inc. and the American Pharmacists Association J Pharm Sci 98:187–204, 2009
Keywords: percutaneous; mathematica
l model; diffusion; drug transport; simula-tions; transdermal drug delivery; desquamation; epidermal turnover; process controltheory; drug administration protocolINTRODUCTION
Drugs are delivered to specific sites of the body viathe enteral (i.e., the gastrointestinal tract) and theparenteral routes (e.g., inhalation, intravenous,percutaneous). New therapies, such as the use ofimplants in tumors, show the efficacy of usingcontrolled-release technologies, over conventionalformulations, to combat disease by providing aprecise dosage to the target site. The controlleddelivery of substances through the skin alsoprovides a direct access to local tissues wherethe drug is administered at a therapeutic concen-
nce to: Laurent Simon (Telephone: 973-596-596-8436; E-mail: [email protected])
aceutical Sciences, Vol. 98, 187–204 (2009)
, Inc. and the American Pharmacists Association
JOURNAL OF P
tration.1 Even though there are notable advan-tages of employing transdermal drug-deliverysystems (e.g., improved patient compliance andavoidance of the gastrointestinal tract), thetransport of medicaments through the skinremains a process severely hindered by desqua-mation, enzymatic degradation, partitioning andthe slow diffusion of molecules through theformidable stratum corneum (SC) barrier.Through experimentation and detailed mathema-tical modeling, current understanding of theeffects of cutaneous metabolism,2–4 drug partitionand diffusion coefficients in the skin,5–7 has vastlyimproved. It is now possible to test differenttherapeutic strategies and dosage regimens forthe treatment of several pathological conditions.However, design through simulation becomesa more difficult task when desquamation is
HARMACEUTICAL SCIENCES, VOL. 98, NO. 1, JANUARY 2009 187

188 SIMON AND GOYAL
significant because its effect on dermal absorptionis not fully addressed by many aspects of thecurrent modeling framework (i.e., mathematicaldescriptions and solution methods). As a result,the development of optimum administrationstrategies rarely considers the epidermal turn-over in conjunction with the delivery rate.Building on the work of Reddy et al.,8 thiscontribution provides a dynamic analysis of thedesquamation process using classical controltools. The advantages of this approach are: (1) areduced model for easy implementation intospreadsheet applications, (2) the development ofa technique that monitors the distribution of thedrug, (3) estimation of the time necessary to reachboth steady-state flux and drug concentrations inthe different skin layers, (4) an optimum protocolto achieve a desired delivery rate to the site ofaction with minimum delay.
Desquamation is a phenomenon in which newcells, that grow at the base end of the epidermis,migrate towards the outer layer of the stratumcorneum to replace dead cells.8 The time requiredto complete one cycle is called the epidermalturnover time.
Epidermal desquamation partially protects theintegrity of the stratum corneum and helps tomaintain iron balance.9 In addition to thisfunction and more relevant to the absorption ofchemical through the skin, Roberts et al.10 for-mulated a compartmental model in which theyincorporated a rate constant that accounts for thecontinuous removal of drug from the stratumcorneum by desquamation. This effect on thestratum corneum reservoir is more pronounced inthe case of diseased skin following applications ofa topical medicament.10 The ability to assess theinfluence of desquamation on the elimination oftopically applied solutes is important for researchin dermatology where the duration of action of theactive ingredient is of considerable interest.10
Desquamation has a direct consequence on thefraction of pesticides, such as carbaryl, chlorpyr-ifos and cypermethrin, absorbed through theskin.10 This process also carries important im-plications for controlled-release technologiesbecause dissolved molecules are carried by themotion of these cells, making the therapeuticagent unavailable for delivery to the systemiccirculation.
Several studies have documented stratumcorneum desquamation and increased epidermalturnover rate. Desquamation is inhomogeneous inold skin where the epidermal turnover time is
JOURNAL OF PHARMACEUTICAL SCIENCES, VOL. 98, NO. 1, JANUARY 2009
enhanced.11 Long et al.12 examined the levels ofceramides and steryl-sulfates both from normaland desquamated skin. Cholesteryl sulfate wassignificantly less in the latter condition. In thecase of patients suffering from diabetes mellitus,studies revealed certain cutaneous alterations,such as skin elasticity, and a degree of desquama-tion different from what is normally observed innondiabetic individuals.13 Skin protectors, suchas DERMOFILM1, are often used to reducedesquamation.14 Permeation enhancers have alsobeen employed to improve transdermal drugdelivery by disrupting the stratum corneum anddesquamated SC flakes.15 However, in spite ofthese reports, no published data have addressedthe use of model-based process-control strategiesto sustain and optimize transdermal drug deliveryin the presence of a fast epidermal turnover rate(i.e., relative to diffusion through the stratumcorneum).
Mathematical modeling and simulation haveplayed an important role in the identification ofmembrane/matrix properties and key transportmechanisms that control release kinetics. Higuchi16
helped to explain the release of solid drugs fromhomogeneous monolithic systems. Based, to alarge extent, on his analysis, it became evidentthat, unless the matrix geometry is speciallydesigned, zero-order release from these deviceswas not possible. Crank17 proposed closed-formsolutions for a number of systems and experi-mental conditions. His approach included steadyand nonsteady state analyses. Guy and Had-graft18 outlined analytical approaches to estimatethe contributions of the device and the skin ondrug delivery. Goyal et al.19 used orthogonalcollocation and regression techniques to under-stand enhanced transport of caffeine throughexcised human skin.
Recent efforts have been devoted to applyingmodern control theories, traditionally used todetermine optimal dose and administration sche-dules in compartmental systems,20 to transdermaldelivery problems. In a simulation study, dynamicprogramming techniques were implemented toaccurately control the release of testosterone bymanipulating the temperature gradient across asilicone membrane.21 The desired steady-stateflux was reached in a relatively short time. Foradditional examples on the applications of optimalcontrol theory to release devices, see Refs. 21–23.
This work focuses on the dynamics and optimalcontrol of transdermal drug-delivery in systems,such as transport of highly lipophilic or large
DOI 10.1002/jps

DYNAMICS AND CONTROL OF PERCUTANEOUS DRUG ABSORPTION 189
molecular weight chemicals,8 where epidermalturnover plays a significant role on the releasekinetics. Auton et al.24 described a model fordesquamation that did not include viable epider-mis turnover. Reddy et al.8 later explained theeffects of both stratum corneum and viableepidermal turnover. However, their contributiononly provides closed-form solutions for the steady-state analysis and for the case where only thestratum corneum poses a formidable barrier tothe permeation of chemical through the skin.The present work is divided into four sections:(1) mathematical description and analysis inthe frequency domain, (2) strategy to derive areduced-order model, (3) optimal control of thesystem, (4) results and discussions.
MATHEMATICAL MODEL AND FREQUENCYDOMAIN ANALYSIS
The concentration of drug in the stratum corneum(Fig. 1) is described by the following equation:
@c1
@t¼ D1
@2c1
@x2þ u1
@c1
@x; �a < x < 0 (1)
where the first and second terms on the right handside of Eq. (1) accounts for Fickian diffusion andadvection, respectively. The latter process is dueto skin desquamation. Cells in the stratumcorneum travel at a velocity u1 in a directionopposite to that of the medicament.
A similar equation is written for the viable skin:
@c2
@t¼ D2
@2c2
@x2þ u2
@c2
@x; 0 < x < b (2)
Figure 1. (a) Schematic of vehicle and skin layers,the interface between stratum corneum and viableepidermis is chosen as the origin. (b) Variables Z1 toZ9 represent dimensionless depths.
DOI 10.1002/jps JOUR
The diffusion coefficient of the drug in the viableepidermis is D2; u2 is the velocity of the cells in thislayer. The present work assumes two homoge-neous layers with effective diffusion coefficients.Such assumption should be validated, experimen-tally, by comparing a heterogeneous model with aconstant diffusion/partition coefficient represen-tation. Details of a procedure to quantify thedegree of heterogeneity are outlined in Anissimovand Roberts.25
The layers are assumed to be initially drug free.Boundary conditions are:
c1ð0; tÞ ¼K1=v
K2=vc2ð0; tÞ (3)
c1ð�a; tÞ ¼ f ðtÞK1=vc0v (4)
and
c2ðb; tÞ ¼ 0 (5)
where Eq. (3) is the equilibrium partition relationapplied at the stratum corneum/viable epidermisinterface. Eq. (4) is the boundary condition at thevehicle/stratum corneum interface and f(t) repre-sents the input (forcing function) to the system.Eq. (5) is the perfect sink condition. It shouldbe noted that, contrary to Reddy et al.,8 theconcentration of drug in the vehicle is allowed tochange with time in this contribution.
Assuming continuity of flux at the stratumcorneum/viable epidermis interface, the followingequation applies:
D1@c1
@xþ u1c1
����x¼0
¼ D2@c2
@xþ u2c2
����x¼0
(6)
The flux at the viable epidermis/dermis inter-face is a key variable in the design of controlled-release devices:
j ¼ �D2@c2
@x
� �����c2ðx¼b;tÞ
(7)
In clinical settings or during drug formulation,particular attention is paid to the release kineticsand the steady-state permeation rate, jss, toensure that patients obtain the prescribed dosagein a predetermined manner. Theoretically, theoptimization problem may consist of findingdiffusion and vehicle/skin partition coefficientsfor achieving a desired flux. However, in practice,excipients are added to the active drug substanceto influence its affinity for the skin and enhanceits transport through the various layers.
NAL OF PHARMACEUTICAL SCIENCES, VOL. 98, NO. 1, JANUARY 2009

190 SIMON AND GOYAL
The original system is written in terms ofdimensionless variables in order to account forthe relative contributions of model parameters onthe release kinetics. This approach promotes theexchange of information among laboratories andmakes it easy to extrapolate research findings tonew applications.
The following dimensionless variables areintroduced:
z ¼ x
a; t ¼ D1t
a2; C1 ¼ c1
K1=vc0v
;
C2 ¼ c2
K2=vc0v
; J ¼ j
ðD1c0vK1=v=aÞ
(8)
The concentrations in the Laplace domain,C1ðz; sÞ and C2ðz; sÞ, take the form (See theAppendix):
C1ðz; sÞ ¼ GC1ðz; sÞFðsÞ;
C2ðz; sÞ ¼ GC2ðz; sÞFðsÞ
(9)
where FðsÞ is the Laplace transform of f(t). Thefunctions, G
C1ðz; sÞ and G
C2ðz; sÞ, are:
GC1ðz; sÞ ¼
zC1ðz; sÞzðsÞ ; G
C2ðz; sÞ ¼
zC2ðz; sÞzðsÞ (10)
with zC1ðz; sÞ, zC2
ðz; sÞ, and z(s) defined by:
zC1ðz; sÞ ¼
e�1=2ðzþ1Þv1sin hjffiffiffiffiffiffiffiffiffiffiffiffiffiv2
2þ4sc
p2c
� ��ffiffiffiffiffiffiffiffiffiffiffiffiffiffiffiffi
v21 þ 4s
qcos h 1
2 zffiffiffiffiffiffiffiffiffiffiffiffiffiffiffiffiv2
1 þ 4sq� �
þ sin h 12 z
ffiffiffiffiffiffiffiffiffiffiffiffiffiffiffiffiv2
1 þ 4sq� �
ðv2K2;1 � v1Þ
�cos hjffiffiffiffiffiffiffiffiffiffiffiffiffiv2
2þ4sc
p2c
� �sin h 1
2 zffiffiffiffiffiffiffiffiffiffiffiffiffiffiffiffiv2
1 þ 4sq� � ffiffiffiffiffiffiffiffiffiffiffiffiffiffiffiffiffiffiffiffi
v22 þ 4sc
qK2;1
0B@
1CA
8>>>>><>>>>>:
(11)
zC2ðz; sÞ ¼ e�ðcv1þzv2Þ=2csin h
ðj� zÞffiffiffiffiffiffiffiffiffiffiffiffiffiffiffiffiffiffiffiffiv2
2 þ 4scq2c
0@
1A ffiffiffiffiffiffiffiffiffiffiffiffiffiffiffiffi
v21 þ 4s
q(12)
and
zðsÞ ¼cos h
jffiffiffiffiffiffiffiffiffiffiffiffiffiv2
2þ4sc
p2c
� �sin h 1
2
ffiffiffiffiffiffiffiffiffiffiffiffiffiffiffiffiv2
1 þ 4sq� � ffiffiffiffiffiffiffiffiffiffiffiffiffiffiffiffiffiffiffiffi
v22 þ 4sc
qK2;1 þ sin h
jffiffiffiffiffiffiffiffiffiffiffiffiffiv2
2þ4sc
p2c
� ��ffiffiffiffiffiffiffiffiffiffiffiffiffiffiffiffi
v21 þ 4s
qcos h 1
2
ffiffiffiffiffiffiffiffiffiffiffiffiffiffiffiffiv2
1 þ 4sq� �
þ sin h 12
ffiffiffiffiffiffiffiffiffiffiffiffiffiffiffiffiv2
1 þ 4sq� �
ðv1 � v2K2;1Þ� �
8><>: (13)
respectively.Similarly, the normalized flux can be expressed
as:
JðsÞ ¼ GJðsÞFðsÞ; G
JðsÞ ¼ zJðsÞ
zðsÞ (14)
JOURNAL OF PHARMACEUTICAL SCIENCES, VOL. 98, NO. 1, JANUARY 2009
with
zJðsÞ ¼K2;1e�ðcv1þjv2Þ=2c
2
ffiffiffiffiffiffiffiffiffiffiffiffiffiffiffiffiv2
1 þ 4sq ffiffiffiffiffiffiffiffiffiffiffiffiffiffiffiffiffiffiffiffi
v22 þ 4sc
q(15)
The functions GC1ðz; sÞ, G
C2ðz; sÞ, and G
JðsÞ are
called transfer (or admittance) functions. Theyare employed, in this application, to describethe dynamic behavior of the delivery system interms of changes in the vehicle drug concentra-tion. For drug delivery applications, diffusionthrough the viable epidermis is usually rapidcompared to drug transport through the stratumcorneum. As a result, a quasi steady-statemodel should be sufficient in the viable epidermis.Such an approximation would lead to simplertransfer characteristics without significant loss inaccuracy.
Since a Laplace transform method was notapplied in Reddy et al.8 to solve the problemdefined by Eqs. (1–4), it is difficult to compareC1ðz; sÞ, C2ðz; sÞ, and JðsÞ with published results.However, by using the final value theorem, thesteady-state flux and drug concentrations inboth layers are derived and compared withexpressions given in Reddy et al.8 for a unit stepchange in the input variable (i.e., FðsÞ ¼ 1=s).Details are provided in the Appendix. The
steady-state properties can also be obtainedby setting the time derivatives to zero. Aplot showing the effect of desquamation onthe normalized steady-state flux Jss=Jssðv1 ¼v2 ¼ 0Þ was also generated for comparison(Fig. 2). The parameter values used were hve¼ 10,
DOI 10.1002/jps

Figure 2. Normalized total steady-state flux as a function of tt,1/tlag,1 and B. Theplotted value is normalized by the flux that would occur when u1¼u2¼ 0 (no epidermalturnover).
DYNAMICS AND CONTROL OF PERCUTANEOUS DRUG ABSORPTION 191
G¼ 100, and g¼ 0.5. The results agree with thesimulations in Reddy et al.8
A REDUCED-ORDER MODEL FOR THEDRUG-DELIVERY SYSTEM
The development of reduced-order modelingstrategies is an active research area in the processcontrol community. The basic idea is to capturethe dynamics of complex processes by designingsimple systems that are computationally lessexpensive to simulate and control. For lineartime-invariant systems, represented by transcen-dental transfer functions, this concept can beapplied to derive rational functions that are moreamenable to analytical inversion techniques andcontrol schemes. As a result, reduced-ordermethods become powerful tools for investigatingthe dynamic behavior of processes ranging fromsolid oxide fuel cells26 to signal transductionpathways.27
Since percutaneous drug absorption with epi-dermal turnover, as described in this work andReddy et al.,8 is essentially a linear time-invariantprocess, modeled by nonrational transfer func-tions, we seek to approximate the original system(G
C1ðz; sÞ, G
C2ðz; sÞ, and G
JðsÞ) with low-order
functions ( ~GC1ðz; sÞ, ~G
C2ðz; sÞ, and ~G
JðsÞ). Some
of the advantages of this approach, in the contextof drug delivery, are: (1) therapeutically relevant
DOI 10.1002/jps JOUR
parameters, such as the time it takes to reach asteady-state flux, are readily identified; (2) drugadministration protocols are evaluated quickly;(3) the fate of the medicament in the skin layers isclosely monitored.
The parameters of ~GJðsÞ, ~G
C1ðz; sÞ, and
~GC2ðz; sÞ were estimated by fitting these functions
to simulated frequency response data. In practice,experimental frequency response information iscollected from an industrial process using specifictechniques such as direct sinusoidal forcing andpulse testing.28 The result is later analyzed usingBode or Nyquist plots where the Ultimate PeriodicResponse (UPR) of the process to pure sine waveinputs is displayed over a range of frequency.29
The UPR is represented by two parameters: theamplitude ratio (AR) and the phase angle. Theamplitude ratio of a transfer function G(s) isdefined as jGðj$Þj where j j denotes the magnitudeof a complex function and s ¼ j$ with $ being thefrequency.
A numerical technique is employed to estimatethe parameters of ~G
JðsÞ that best approximate
GJðsÞ, over a range of frequencies. First, simu-
lated data are generated using a set of dis-crete frequency and transfer function pairs½$i; ~G
Jðj$iÞ. The squared magnitude of the
complex error is minimized:28
} ¼Xi¼1
j"ðj$iÞj2 (16)
NAL OF PHARMACEUTICAL SCIENCES, VOL. 98, NO. 1, JANUARY 2009

192 SIMON AND GOYAL
where
"ðj$iÞ ¼ GJðj$iÞ � ~G
Jðj$iÞ (17)
In this work, ~GJðsÞ takes the following form:
~GJðsÞ ¼
Xn
i¼1
Aie�st0
s þ pi(18)
The poles and time delay are �pi and t0,respectively. The values of pi and t0 are obtainedafter minimizing the objective function:
} ¼Xi¼1
GJðj$iÞ �
Xn
k¼1
Ake�st0
s þ pk
����������2
(19)
JðsÞ can then be easily inverted to yield asolution in the time domain. The time to reach asteady-state flux can be estimated from the poles.The parameter t0 describes the time it takes todetect the presence of the drug as measured by itsconcentration or flux. Also, FðsÞ, which is repre-sentative of the drug loading and administrationprotocols, can be modulated and its effects on therelease rate investigated. A similar approach canbe implemented to analyze changes in the stratumcorneum and viable epidermis drug concentra-tions (i.e., C1 and C2, respectively) at specificlocations zi.
OPTIMAL CONTROL OF THE PROCESS
Dynamic programming30 is implemented to deter-mine initial concentrations of drugs in the vehicle,for a fixed number of applications and timeintervals, necessary to keep the transdermal fluxas close as possible to a target value:
Minf ðt1Þ;...;f ðtmÞ
Ztf
0
jJðtÞ � Jsetjdt (20)
The function value f(ti) is the initial concentra-tion of the drug in the vehicle at theith application; m is the number of applications;tf is the simulation time; Jset is the target value ofthe flux. The optimization technique yields a set ofinitial concentrations (i.e., the loading dose for aknown vehicle volume) to be administered atspecific intervals.
JOURNAL OF PHARMACEUTICAL SCIENCES, VOL. 98, NO. 1, JANUARY 2009
RESULTS AND DISCUSSIONS
A Second-Order Model for the TransdermalDrug-Delivery System
Second-Order Plus Time-Delay (SOPTD) transferfunctions were derived from the original dermalabsorption model. Parameter values, that arerepresentative of normal human skin,8 were usedin the simulation. This study is applicable to ahost of drugs ranging from low (B¼ 0.01) to high(B¼ 1) permeability in the stratum corneumrelative to the viable epidermis. These conditionsare equivalent to a decrease in the affinity of themedicament for the viable epidermis (K2,1¼ 0.1–0.001) with other factors remaining constant(see Eq. A.26). The transdermal flux and drugconcentration profiles, at different penetrationdepths, were monitored (Tab. 1 for Figs. 3–8).Frequency responses of the original model G
C1,
GC2
, and GJ
were computed at various $i values(from 0.01 to 10 with an increment of 0.5). Theestimated transfer functions ( ~G
C1, ~G
C2, and ~G
J)
were fitted by implementing Eq. (19) in Mathe-matica 6.0 (Wolfram Research, Inc., Champaign,IL). To compare the results, responses to a unitstep change in the input variable (i.e., FðsÞ ¼ 1=s)were calculated. The numerical inversion of theLaplace transforms for the original system wascarried out using the package ‘‘FixedTalbotNu-mericalLaplaceInversion.m’’.31
Figures 3a (K2,1¼ 0.1) and 6 (K2,1¼ 0.001)describe the flux dynamics for a unit step changein the input f(t). Similarly, Figures 4, 5 (K2,1¼ 0.1)and 7, 8 (K2,1¼ 0.001) show drug concentrationprofiles in the stratum corneum and viableepidermis following the same change in f(t). Thedifferent layers are represented by Zi (seeFig. 1b to estimate the depth from the skinsurface). The reduced-order models represent thedrug release with desquamation process accu-rately as indicated by the indistinguishable solid(original model) and dashed lines (reduced-ordermodel). To illustrate the method, the amplituderatio of the flux transfer function jG
Jðj$Þj is
plotted as a function of the frequency $ (Fig. 3b).The reduced-order model ( ~G
Jðj$Þ: solid line) fits
the data generated from GJðj$Þ very well (*).
Since physicochemical properties are likely tovary, the robustness of the model reduction wasanalyzed by allowing the parameters to change byas much as 10% of their original values (&).Excellent agreement with the nominal model wasachieved.
DOI 10.1002/jps

c v1 v2 K2/1 j tf
Input parameters (Refer to Figs. 3–5)
10000 0.6 3 0.1 10 1
Table 1. List of Input Parameters Used for Simulation and Corresponding Output Flux, Concentrations and TimeConstants at Various Skin Depth for K2,1¼ 0.1 (i.e., B¼ 0.01) and K2,1¼ 0.001 (i.e., B¼ 1)
Delay Time td tc
Observedtres: tdþ 4 tc
SteadyState Values
Flux (J) 0.04082 0.10183 0.44815 0.72014C1 at Z
Stratum corneum Z2 0.00485 0.10238 0.41435 0.69350Z3 0.01516 0.10239 0.42472 0.42969Z4 0.02641 0.10207 0.43470 0.20263
Interface Z5 0.04036 0.10184 0.44772 0.00721C2 at Z
Viable epidermis Z6 0.04229 0.10182 0.44956 0.00541Z7 0.04361 0.10180 0.45082 0.00360Z8 0.04546 0.10175 0.45245 0.00180
c v1 v2 K2/1 j tf
Input parameters (Refer to Figs. 3–5)
10000 0.6 3 0.1 10 1
Delay Time td tc
Observedtres: tdþ 4 tc
SteadyState Values
Flux (J) 0.04573 0.21822 0.91863 0.31289C1 at Z
Stratum corneum Z2 0.00275 0.21821 0.87559 0.78804Z3 0.02165 0.21927 0.89874 0.60562Z4 0.02330 0.21897 0.89916 0.44860
Interface Z5 0.04408 0.21823 0.91699 0.31336C2 at Z
Viable epidermis Z6 0.04880 0.21823 0.91770 0.23493Z7 0.04530 0.21822 0.91821 0.15656Z8 0.04562 0.21822 0.91852 0.07825
DYNAMICS AND CONTROL OF PERCUTANEOUS DRUG ABSORPTION 193
There are several advantages to deriving asimplified model of the system. Since the processis now represented by a sum of first-order transferfunctions plus a time delay (Eq. 18), the timedomain flux and concentration profiles are easilyobtained by using Laplace transform tables (orroutines available in Mathematica1). The inver-sion of the original system, represented byEqs. (9–15), requires the use of more elaborateprocedures (implemented in add-on inverseLaplace transform packages, such as ‘‘FixedTal-botNumericalLaplaceInversion.m’’).31 In additionto the fact that the former solution method lendsitself readily to spreadsheet applications, there isa more compelling reason for deriving a simple
DOI 10.1002/jps JOUR
model from a process control standpoint. Acontroller can be tuned, using well-establishedclassical or modern control techniques, to build adelivery device that meets preset design andperformance specifications. Controller design andanalysis are much more challenging when dealingwith the original system. Such arguments, oftenraised in the chemical process-control community,are relevant for controlled-release applications,especially for the delivery of drugs with a narrowtherapeutic range.
The transfer function representation alsoallows the introduction of parameters useful foran accurate description of transdermal drugdelivery. The delay (td), response time (4� tc),
NAL OF PHARMACEUTICAL SCIENCES, VOL. 98, NO. 1, JANUARY 2009
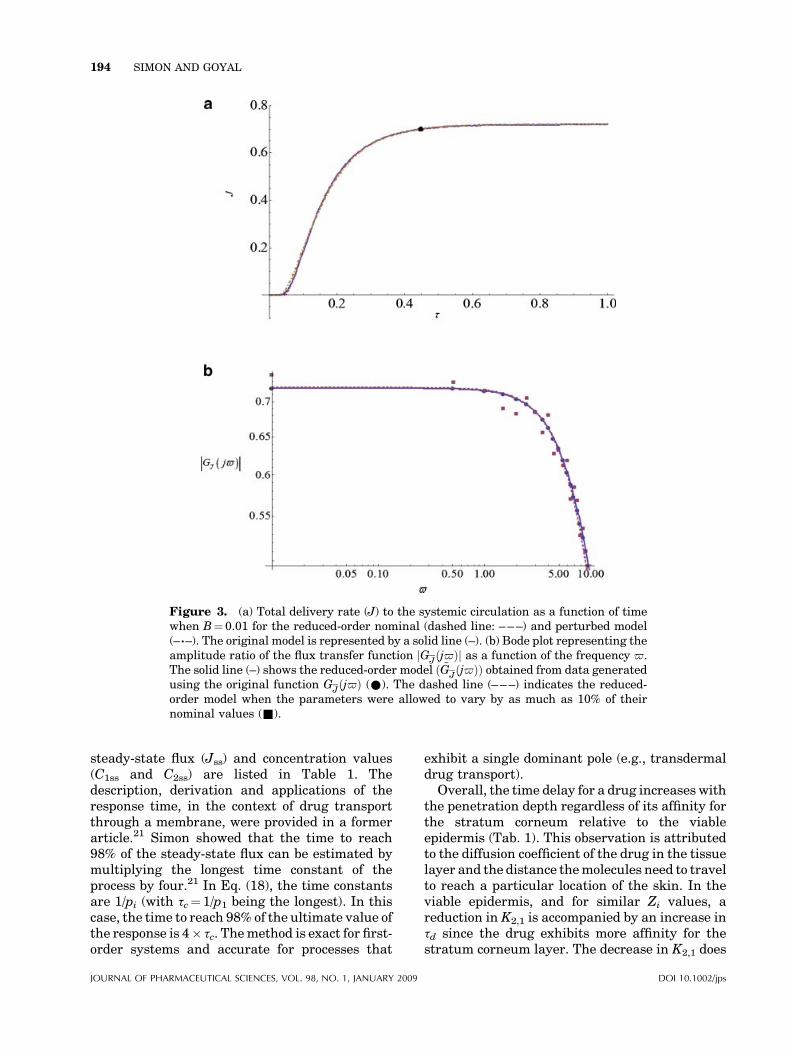
Figure 3. (a) Total delivery rate (J) to the systemic circulation as a function of timewhen B¼ 0.01 for the reduced-order nominal (dashed line: – – –) and perturbed model(–�–). The original model is represented by a solid line (–). (b) Bode plot representing theamplitude ratio of the flux transfer function jG
Jðj$Þj as a function of the frequency $.
The solid line (–) shows the reduced-order model ð ~GJðj$ÞÞ obtained from data generated
using the original function GJðj$Þ (*). The dashed line (– – –) indicates the reduced-
order model when the parameters were allowed to vary by as much as 10% of theirnominal values (&).
194 SIMON AND GOYAL
steady-state flux (Jss) and concentration values(C1ss and C2ss) are listed in Table 1. Thedescription, derivation and applications of theresponse time, in the context of drug transportthrough a membrane, were provided in a formerarticle.21 Simon showed that the time to reach98% of the steady-state flux can be estimated bymultiplying the longest time constant of theprocess by four.21 In Eq. (18), the time constantsare 1/pi (with tc¼ 1/p1 being the longest). In thiscase, the time to reach 98% of the ultimate value ofthe response is 4� tc. The method is exact for first-order systems and accurate for processes that
JOURNAL OF PHARMACEUTICAL SCIENCES, VOL. 98, NO. 1, JANUARY 2009
exhibit a single dominant pole (e.g., transdermaldrug transport).
Overall, the time delay for a drug increases withthe penetration depth regardless of its affinity forthe stratum corneum relative to the viableepidermis (Tab. 1). This observation is attributedto the diffusion coefficient of the drug in the tissuelayer and the distance the molecules need to travelto reach a particular location of the skin. In theviable epidermis, and for similar Zi values, areduction in K2,1 is accompanied by an increase intd since the drug exhibits more affinity for thestratum corneum layer. The decrease in K2,1 does
DOI 10.1002/jps

Figure 4. Drug concentration (C1) in the stratum corneum as a function of time atvarious depths (Z2 to interface Z5) for B¼ 0.01.
DYNAMICS AND CONTROL OF PERCUTANEOUS DRUG ABSORPTION 195
not seem to affect the time delay consistently inthe stratum corneum. This result may be due tothe competitive effects of the diffusion anddesquamation processes or the optimizationprocedure. Analysis of the response time, providedin a later section, may provide a better insight intothese observations.
When comparing the time for the drug mole-cules to traverse a specific layer, it takes the drug0.044 unit time to cross the stratum corneum asopposed to slightly more than 0.0051 unit time(i.e., time to travel from the interface Z5 to Z8) to
Figure 5. Drug concentration (C2) in viabledepths (from interface Z5 to Z8) for B¼ 0.01.
DOI 10.1002/jps JOUR
cross the viable epidermis for K2,1¼ 0.1 (Tab. 1).Since the viable epidermis is 10 times the size ofthe stratum corneum (i.e., j¼ 10), the relativelyshort time spent in the viable epidermis can onlybe explained in terms of the very high diffusiondrug coefficient in this tissue layer (c¼ 10,000).When K2,1¼ 0.001, a similar trend is observed:0.040 in the stratum corneum versus 0.0015 unittime to reach Z8 from Z5.
Based on the physical process, the time delay forthe flux was expected to be greater than the time ittakes the drug to be detected at Z8 (see Tab. 1).
epidermis as a function of time at various
NAL OF PHARMACEUTICAL SCIENCES, VOL. 98, NO. 1, JANUARY 2009

Figure 6. Total delivery rate (J) to the systemic circulation as a function of time forB¼ 1.
196 SIMON AND GOYAL
The results reported (flux: 0.041 unit time vs.concentration at Z8: 0.045 unit time) couldpossibly be attributed to the optimization scheme.Also, estimation of the time delay may beinfluenced (or buffered) by the presence of otherpoles in the transfer function. A more physicallyrealistic result was obtained when K2,1¼ 0.0001(flux: 0.04634 unit time vs. concentration at Z8:0.0426 unit time; graph not shown).
The response time when K2,1¼ 0.1 for the drugconcentration is the same (4� tc� 0.408 unittime) for all the depths in the stratum corneumand viable epidermis. This means that the
Figure 7. Drug concentration (C1) in stratumdepths (Z2 to interface Z5) for B¼ 1.
JOURNAL OF PHARMACEUTICAL SCIENCES, VOL. 98, NO. 1, JANUARY 2009
increase in the observed response time (i.e., whenthe time delay is added), is simply due to theincrease in td (dots in Figs. 3a and 4). A similarobservation is made when K2,1¼ 0.001. In thiscase, the response time is approximately 0.873unit time, with the exception of Z3 and Z4 (Figs. 7and 8). When comparing drugs with differentaffinities for the viable epidermis relative to thestratum corneum, the response time is higher atall Zi levels for a decrease in K2,1. The sameobservation is made for the flux (Figs. 3a and 6).These results may help to shed light on theinconsistency obtained when studying the effects
corneum as a function of time at various
DOI 10.1002/jps

Figure 8. Drug concentration (C2) in viable epidermis as a function of time at variousdepths (from interface Z5 to Z8) for B¼ 1.
DYNAMICS AND CONTROL OF PERCUTANEOUS DRUG ABSORPTION 197
of K2,1 on the time delay in the drug concentrationat different layers of the stratum corneum. Incertain cases, the optimization procedure may notfully capture the true contributions of the timedelay and the poles on the overall system inderiving the lower-order model. As a result, somecharacteristics of the transient response, primar-ily attributable to the poles, are reflected in thetime-delay estimation.
The steady-state concentrations and fluxesdecrease with the distance from the skin surfacefor a constant K2,1. These results can be explainedon physical ground or by analysis of the steady-state expressions given in the Appendix. Theconcentration decreases across the skin, as pre-dicted by Fick’s first law, but shows a nonlinearbehavior because of the presence of the desqua-mation process which tends to compete withtransport by diffusion. A lower K2,1 valueincreases the drug concentration at a particulardepth (Tab. 1). The drug tends to remain in theviable epidermis. The steady-state flux is less inthe case of a relatively low K2,1 as can bedemonstrated by the flux expressions in theAppendix (Eqs. A.26 and A.27) for the case ofv1¼v2¼ 0. Additional studies show that epider-mal turnover reduces the steady-state fluxwhether the stratum corneum or viable epidermiscontrols the rate of dermal penetration (Fig. 9).The ratio u1/u2(¼v1/v2¼a/b� tt,2/tt,1¼ 0.2) wascalculated using the parameter values in Reddy
DOI 10.1002/jps JOUR
et al.8 The relative contribution of epidermalturnover in the stratum corneum to that of theviable epidermis can be investigated by varyingv1/v2. An increase in the ratio (or an increase in u1
relative to u2) is accompanied by a decrease in thesteady-state flux (Eq. A.20; graph not shown).
Optimal Control of the Process
Modeling and simulation, central concepts inchemical engineering, are used in order to under-stand the impact of particular actions (inputs) on aprocessing system. The models are often builtfrom physical principles (e.g., mass, momentumand heat transfer) that result in differentialequations from which transfer functions can bewritten in the case of linear-time invariant (LTI)systems. The impetus to understand the transientbehavior of the process, or how it responds tochanges in input variables, often comes from theneed to design a control mechanism prior tobuilding the system. Since the modified transferfunctions attempt to describe a more complexphenomenon, which includes diffusion and des-quamation, input ( f) and output (J) data areplotted in Figure 10 to show that such lower-ordermodels do capture the true dynamics of theoriginal process even for random step changesin f(t) (Fig. 10b). The case of K2,1¼ 0.001 was usedand only the flux was simulated for the study.
NAL OF PHARMACEUTICAL SCIENCES, VOL. 98, NO. 1, JANUARY 2009

Figure 9. Total delivery rate (J) as a function of B when $1 ¼ $2 ¼ 0 and for cases inwhich $1 6¼ 0, $2 6¼ 0.
198 SIMON AND GOYAL
A few important points are worth stating aboutFigure 10. The simulation was run from 0 to 6 timeunits. A function was written for FðsÞ so thatthe step size is randomized at every time unit.The expression for the flux of the original systemin the Laplace domain is given by Eq. (14). It wasnot possible to invert the product G
JðsÞFðsÞ to
obtain the flux in the time domain. Consequently,the convolution theorem for Laplace transformswas used:
JðtÞ ¼Z t
0
GJðtÞf ðt � tÞdt (21)
where the GJðtÞ was estimated using ‘‘FixedTal-botNumericalLaplaceInversion.m’’. The Mathe-matica1 routine ‘‘NIntegrate’’, estimates thenumerical integral at some discrete-time samples.The result is shown by the dots in Figure 10a. Thesolid line was obtained by taking the inverseLaplace transform of:
JðsÞ ¼ ~GJðsÞFðsÞ (22)
where the second-order transfer function ~GJðsÞ is
defined by Eq. (18). The calculation of theanalytical flux from Eq. (22) is 6,000 times fasterthan the numerical flux estimated from Eq. (21) at120 points in the interval from 0 to 6 unit times.Another reason for studying how the drug releasechanges with f(t) is the need to design complexdelivery profiles. In cases where patients developdrug tolerance, the dosing regimen will need to be
JOURNAL OF PHARMACEUTICAL SCIENCES, VOL. 98, NO. 1, JANUARY 2009
adjusted. Prediction of an adequate administra-tion protocol is difficult even when desquamationis neglected. The proposed framework allowsresearchers to simulate the effects of dose anddrug scheduling on the amount of medicamentthat is delivered to the bloodstream even in thepresence of epidermal turnover.
It is desirable in clinical settings and for thedevelopment of controlled-release devices todetermine the load necessary to meet a desiredflux. For K2,1¼ 0.001, the profile shown inFigure 3, is reproduced in Figure 11a (solid line)for comparison with a dynamically optimizedprotocol. The unit step change is shown inFigure 11b (solid line). Using the minimizationprocedure outlined, Eq. (20) was implementedafter constraining the input step changes from 0 to2. The simulation lasts 1 unit time and the stepchanges can be done at the beginning of theadministration and every 0.2 time interval. Thedesired flux is maintained at 0.72, which isthe result of a unit step change maintained forthe duration of the administration ðFðsÞ ¼ 1=sÞ.With the dynamic optimization, the flux reachesthe desired release rate faster with a slightovershoot (Fig. 11a: dashed line). The dotted lineis the flux profile when the optimized input, shownin Figure 11b by the dashed line, is implementedon the original system. This methodology makes itpossible to reduce the time it takes to reach atherapeutic level in the blood and is desirable forpatients who seek immediate relief. It may alsoprovide an alternate method to increase the
DOI 10.1002/jps

Figure 10. Second-order model input-output plots: (a) Total flux versus time (output),dotted line represents solution to the original model, solid line shows solution to thesecond-order model. (b) Input forcing function ( f) versus time (input).
DYNAMICS AND CONTROL OF PERCUTANEOUS DRUG ABSORPTION 199
transdermal delivery rate of local anesthetics.Instead of administering short- and long-actingdrugs after surgery, a single drug can beadministered in such a way to control chronicand breakthrough pain.
CONCLUSIONS
Desquamation may significantly decrease the rateat which some drugs are absorbed into thesystemic circulation. A detailed mathematicalmodel of the process and a solution in the Laplacedomain were provided to allow researchers toinvestigate the impact of epidermal turnover on
DOI 10.1002/jps JOUR
the release kinetics. A set of transcendentaltransfer functions, reflecting the relationshipbetween the loading dose and the concentrationprofile at specific locations of the skin layer, wasderived. For the purpose of simulation andcontrol, the system in the frequency domain wasfurther reduced to a second-order model whichaccurately captured the dynamics of the originalprocess. Similar observation was made for theabsorption rate. The results show that the overallresponse time is a function of the travelingdistance of molecules applied to the skin surface,the diffusion coefficients in the skin layers and thedrug’s relative affinity for the viable epidermis.Complex delivery profiles and optimum dosage
NAL OF PHARMACEUTICAL SCIENCES, VOL. 98, NO. 1, JANUARY 2009

Figure 11. Optimal control to achieve a desired flux. (a) Output: flux (J) versus time(t), solid line represents the flux if unit step change is made, dotted line represents flux ifthe preset drug concentration is maintained using the optimized control. (b) Input:Forcing function ( f) or dose regimen versus time (t), solid line represents unit stepchange, dashed line represents optimized drug dose to be administered to achieve theflux shown in Figure 10a by dotted line.
200 SIMON AND GOYAL
regimens were simulated in a time efficientmanner. The findings are promising for users oftransdermal patches.
NOMENCLATURE
a t
JOURNAL
hickness of the stratum corneum (m)
b t hickness of the viable epidermis (m)OF PHARMACEUTICAL SCIENCES, VOL. 98, NO. 1, JANUARY 2009
B r
atio of permeability coefficients of thedrug in the stratum corneum to the viableepidermis from the same vehicle—Thisquantity is defined by Reddy et al.8B¼P1,v/P2,v¼K1/vD1=a/K2/vD2=b
c1 d rug concentration in the stratum cor-neum (mol/m3)
c2 d rug concentration in the viable epidermis(mol/m3)
DOI 10.1002/jps

DYNAMICS AND CONTROL OF PERCUTANEOUS DRUG ABSORPTION 201
c0v i
DOI 10.10
nitial drug concentration in the vehicle(mol/m3)
C1 d
imensionless drug concentration inthe stratum corneum defined by C1 ¼c1=K1=vc0v
C2 d
imensionless drug concentration in theviable epidermis defined by C2 ¼ c2=K2=vc0v
D1 d
rug diffusivity in the stratum corneum(m2/s)D2 d
rug diffusivity in the viable epidermis(m2/s)f f
orcing function or input to the deliverysystemG r
atio of lag times of the drug throughstratum corneum and through the viableepidermis—This quantity is defined byReddy et al.8 G¼ tlag,1/tlag,2¼ (a2/6D1)/(b2/6D2)j d
rug permeation flux at the viable epider-mis/dermis interface (mol/s m3)Jset t
arget value for the flux (mol/s m3) Jss s teady-state drug permeation flux J (mol/s m3)
K1/v e quilibrium partition coefficient of thedrug between the stratum corneum andthe vehicle
K2/v e
quilibrium partition coefficient of thedrug between the viable epidermis andthe vehicleK2,1 p
arameter defined by K2,1¼ 1/(B)(G)(hve) K2/1 r atio of K2/v to K1/vm n
umber of applications for a patch P1,v p ermeability of the drug from the vehicleto the stratum corneum defined by Reddyet al.8 K1/vD1/a
P2,v p
ermeability of the drug from the vehicleto the viable epidermis defined by Reddyet al.8 K2/vD2/bt d
imensionless time defined by t¼D1t/a2td d
imensionless delay time tres d imensionless total response time t t ime variable (s) tlag,1 l ag time of the drug traversing the stratumcorneum (s)—This quantity is defined byReddy et al.8 tlag,1¼a2/6D1
tlag,2 l
ag time of the drug through the viableepidermis (s)—This quantity is defined byReddy et al.8 tlag,2¼ b2/6D2tt,1 t
urnover time of cells in the stratumcorneum (s)—This quantity is defined byReddy et al.8 tt,1¼a/u1tt,2 t
urnover time of cells in the viableepidermis (s)—This quantity is definedby Reddy et al.8 tt,2¼ b/u202/jps JOUR
tf t
NAL OF PH
he final simulation time (s)
u1 v elocity of the cells in the stratum corneum(m/s)
u2 v elocity of the cells in the viable epidermis(m/s)
x d istance variable (m) z d imensionless distance variable defined byz¼ x/a
Zi d esignation for the measurement of depthof the various skin layers; starting fromexposed skin surface Z1 to the end of viableepidermis Z9
Greek Letters
t d
imensionless time v1 p arameter defined by v1¼u1a/D1v2 p
arameter defined by v2¼u2a/D1c r
atio of the drug diffusivity in the viableepidermis stratum corneum to its diffusivityin the stratum corneumj r
atio of b to a g r atio of tt,1 to tt,28
h d
imensionless distance variable defined byReddy et al.8 z¼ b/aAPPENDIX
Derivation of C1ðz; sÞ and C2ðz; sÞ
Using dimensionless variables, Eqs. (1) and (2)become:
@C1
@t¼ @2C1
@z2þ v1
@C1
@z; �1 < z < 0 (A.1)
and
@C2
@t¼ c
@2C2
@z2þ v2
@C2
@z; 0 < z < j (A.2)
with v1¼u1a/D1, v2¼u2a/D1, j¼ b/a, and c¼D2/D1.
The normalized boundary conditions are:
C1½0; t ¼ C2½0; t (A.3)
C1½�1; t ¼ f ðtÞ (A.4)
@C1
@zþ v1C1
� �����z¼0
¼ cK2;1@C2
@zþ v2K2;1C2
� �����z¼0
(A.5)
ARMACEUTICAL SCIENCES, VOL. 98, NO. 1, JANUARY 2009

202 SIMON AND GOYAL
and
C2ðj; tÞ ¼ 0 (A.6)
with K2,1¼K2/v/K1/v.A normalized flux takes the form:
J ¼ �cK2;1@C2
@z
� �����C2ðz¼j;tÞ
(A.7)
Eq. (A.7) is related to the de-normalized flux by:
J¼�cK2;1
@C2@z
� ����C2ðz¼j;tÞ
¼ � D2D1
K2=v
K1=v
aK2=vc0
v
@c2@x
� ����c2ðx¼b;tÞ
¼ j 1D1
K2=v
K1=v
aK2=vc0
v
� �8><>:
(A.8)
or
J ¼ j
ðD1c0vK1=v=aÞ (A.9)
Simulations conducted in the dimensionlessconstruct may help to explain, for example, therelative influence of drug diffusivities (c) in thestratum corneum and the viable epidermis on theoverall release kinetics.
Laplace transforms are applied to the normal-ized equations. The system becomes:
d2C1
dz2þ v1
dC1
dz� sC1 ¼ 0; �1 < z < 0 (A.10)
cd2C2
dz2þ v2
dC2
dz� sC2 ¼ 0; 0 < z < j (A.11)
with boundary conditions:
C1ð0; sÞ ¼ C2ð0; sÞ (A.12)
C1ð�1; sÞ ¼ FðsÞ (A.13)
dC1
dzþ v1C1
!�����z¼0
¼ cK2;1dC2
dzþ v2K2;1C2
!�����z¼0
(A.14)
C2ðj; sÞ ¼ 0 (A.15)
C1ssðxÞK1=vc0
v
¼eða�xÞu1=D1ððebu2=D2 � 1ÞK1=vu
eau1=D1ððebu2=D2 � 1ÞK1=vu1
and
C2ssðxÞK1=vc0
v
¼ðeðaþb�xÞu2=D2 �
eau1=D1ððebu2=D2 � 1ÞK1=vu1
JOURNAL OF PHARMACEUTICAL SCIENCES, VOL. 98, NO. 1, JANUARY 2009
The solutions to Eqs. (A.10) and (A.11) are:
C1ðz; sÞ ¼ k1e1=2ð�v1�ffiffiffiffiffiffiffiffiffiffi4sþv2
1
pÞz
þ k2e1=2ð�v1þffiffiffiffiffiffiffiffiffiffi4sþv2
1
pÞz (A.16)
and
C2ðz; sÞ ¼ k3e1=2cð�v2�ffiffiffiffiffiffiffiffiffiffiffiffiffi4csþv2
2
pÞz
þ k4e1=2cð�v2þffiffiffiffiffiffiffiffiffiffiffiffiffi4csþv2
2
pÞz (A.17)
with k1, k2, k3, and k4 computed by applyingthe boundary conditions, defined by Eqs. (A.12–A.15).
Comparison of Steady-State Flux andConcentrations With Literature Results
It can be shown that the steady-state concentra-tion and flux values for a unit step change in theinput (i.e., FðsÞ ¼ 1=s) are:
C1ssðzÞ ¼ lims!0
½sC1ðz; sÞ ¼ limt!1
½C1ðz; tÞ
¼ e�zv1ðð�1 þ ejv2=cÞv1�ð�1 þ ezv1Þv2K2;1Þev1ð�1 þ ejv2=cÞv1þð�1 þ ev1Þv2K2;1
(A.18)
C2ssðzÞ ¼ lims!0
½sC2ðz; sÞ ¼ limt!1
½C2ðz; tÞ
¼ ðeðj�zÞv2=c � 1Þv1
ev1ððejv2=c � 1Þv1 þ v2K2;1Þ � v2K2;1
(A.19)
and
Jss ¼ lims!0
½sJðsÞ ¼ limt!1
½JðtÞ
¼ K2;1v1v2
½ev1ðejv2=c � 1Þv1 þ ðev1 � 1Þv2K2;1(A.20)
To compare the steady-state concentrationresults with those obtained in Reddy et al.,8 thereference coordinate is first changed from 0 toaþ b (z¼ (x–a)/a). The de-normalized concentra-tions are:
1 þ K2=vu2Þ � K2=vu2
þ K2=vu2Þ � K2=vu2(A.21)
1ÞK1=vu1
þ K2=vu2Þ � K2=vu2
(A.22)
DOI 10.1002/jps

DYNAMICS AND CONTROL OF PERCUTANEOUS DRUG ABSORPTION 203
Eqs. (A.4) and (A.5) are similar to those reportedin Reddy et al.8
C1ssðxÞK1=vc0
v
¼ e�ð6tlag;1=tt;1Þðx=aÞðg=BG þ eðg=GÞð6tlag;1=tt;1Þ � 1Þ � ðg=BGÞe�ð6tlag;1=tt;1Þ
g=BGð1 � e�ð6tlag;1=tt;1ÞÞ þ eðg=GÞð6tlag;1=tt;1Þ � 1(A.23)
C2ssðxÞK1=vc0
v
¼ e½ðg=hGÞð6tlag;1=tt;1Þð1þh�ðx=aÞÞ � 1
g=BGðe6tlag;1=tt;1 � 1Þ þ e6tlag;1=tt;1ðeððg=GÞð6tlag;1=tt;1ÞÞ � 1Þ(A.24)
where
tlag;1 ¼ a2
6D1; tlag;2 ¼ b2
6D2; g ¼ tt;1
tt;2; B ¼ P1;v
P2;v¼ K1=vD1=a
K2=vD2=b
G ¼ tlag;1
tlag;2¼ a2=6D1
b2=6D2; tt;1 ¼ a
u1; tt;2 ¼ b
u2; h ¼ b
a ;K2;1 ¼ K2=v
K1=v
8<: (A.25)
The dimensionless parameters in this work arerelated to the parameters in Reddy et al.8 by:
c ¼ Gh2ve; v1 ¼ 6tlag;1
tt;1; v2 ¼ 6tlag;1
tt;1ðgÞðhÞ; K2;1 ¼ 1
ðBÞðGÞðhveÞ; j ¼ hve (A.26)
To compare the flux expression in this con-tribution to the results of Reddy et al.8 when thereis no epidermal turnover (v1¼v2¼v¼ 0), Eq.(A.20) and L’Hospital rule are used:
limv!0
ðjssÞ ¼D1K1=vc0
vcK2;1
aðjþcK2;1Þ ¼ P1;vc0vcK2;1
ðjþcK2;1Þ
¼ P1;vc0vc
ðBGh2veþcÞ ¼
Gh2veP1;vc0
v
ðBGh2veþGh2
veÞ¼ P1;vc0
v
Bþ1
8<:
(A.27)
REFERENCES
1. Stanos SP. 2007. Topical agents for the manage-ment of musculoskeletal pain. J Pain SymptomManage 33:342–355.
2. Lee AJ, King RJ, Rogers TG. 1996. A multiple-pathway model for the diffusion of drugs in skin.J Math Appl Med Biol 13:127–150.
3. Bando H, Sahashi M, Takagi T, Yamashita F,Takakura Y, Hashida M. 1996. Analysis of in vitroskin penetration of acyclovir prodrugs based on adiffusion model with a metabolic process. Int JPharm 135:91–102.
4. Bando H, Mohri S, Yamashita F, Takakura Y,Hashida M. 1997. Effects of skin metabolism onpercutaneous penetration of lipophilic drugs. JPharmaceut Sci 86:759–761.
DOI 10.1002/jps JOUR
5. Fernandes M, Simon L, Loney NW. 2005. Math-ematical modeling of transdermal drug-deliverysystems: Analysis and applications. J Membr Sci256:184–192.
6. Bunge AL. 1998. Release rates from topical formu-lations containing drugs in suspension. J ControlRelease 52:141–148.
7. Kalia YN, Guy RH. 2001. Modeling transdermaldrug release. Adv Drug Del Rev 48:159–172.
8. Reddy MB, Guy RH, Bunge AL. 2000. Does epider-mial turnover reduce percutaneous penetration?Pharm Res 17:1414–1419.
9. Milstone LM. 2004. Epidermal desquamation. JDermatol Sci 36:131–140.
10. Roberts MS, Cross SE, Anissimov YG. 2002. Factorsaffecting the formation of a skin reservoir for topi-cally applied solutes. Skin Pharmacol Physiol 17:3–16.
11. Schmid D, Belser E, Liechti C, Zuelli F. 2006. Skinrejuvenation with a biomimetic peptide designed topromote desquamation. SOFW-Journal 132: 2–6.
12. Long SA, Wertz PW, Strauss JS, Downing DT.1985. Human stratum corneum polar lipids anddesquamation. Arch Dermatol Res 277:284–287.
13. Seok YH, Hyun BS, Hwan OC. 2002. Quantitativemeasurement of desquamation and skin elasticityin diabetic patients. Skin Res Technol 8:250–254.
14. See A, Wright S, Denham JW. 1998. A pilot study ofdermofilm in acute radiation-induced desquama-tive skin reactions. Clin Oncol (R Coll Radiol)10:182–185.
NAL OF PHARMACEUTICAL SCIENCES, VOL. 98, NO. 1, JANUARY 2009

204 SIMON AND GOYAL
15. Zhang CF, Yang ZL, Zhang CF, Luo JB. 2006.Effects of enantiomer and isomer permeationenhancers on transdermal delivery of ligustrazinehydrochloride. Pharm Dev Technol 11:417–424.
16. Higuchi T. 1963. Mechanisms of sustained actionmedication: theoretical analysis of the rate ofrelease of solid drugs dispersed in solid matrices.J Pharm Sci 52:1145–1149.
17. Crank J. 1975. The mathematics of diffusion. 2ndedition. Oxford, England: Oxford University Press.pp. 11–103.
18. Guy RH, Hadgraft J. 1992. Rate control in trans-dermal delivery? Int J Pharm 82:R1–R6.
19. Goyal A, Mandapuram S, Michniak B, Simon L.2007. Application of orthogonal collocation andregression techniques for recovering parametersof a two-pathway transdermal drug-delivery model.Comput Chem Eng 31:107–120.
20. Pedreira CE, Vila VB. 1991. Optimal schedule forcancer chemotherapy. Math Program 52:11–17.
21. Simon L. 2007. Analysis of heat-aided membrane-controlled drug release from a process controlperspective. Int J Heat Mass Transfer 50:2425–2433.
22. Lu X, Ramirez F, Anseth K. 1998. Modeling andoptimization of drug release from laminated poly-mer matrix devices. AIChE J 44:1689–1696.
23. Blatt M, Schittkowski K. 2000. Optimal control ofone-dimensional partial differential algebraic equa-tions with applications. Ann Oper Res 98:45–64.
JOURNAL OF PHARMACEUTICAL SCIENCES, VOL. 98, NO. 1, JANUARY 2009
24. Auton TR, Westhead DR, Woolen BH, Scott RC,Wilks MF. 1994. A physiologically based mathema-tical model of dermal absorption in man. Hum ExpToxicol 13:51–60.
25. Anissimov YG, Roberts MS. 2004. Diffusionmodeling of percutaneous absorption kinetics: 3.Variable diffusion and partition coefficients, conse-quences for stratum corneum depth profiles anddesorption kinetics. J Pharm Sci 93:470–487.
26. Damm DL, Fedorov AG. 2006. Reduced-order tran-sient thermal modeling for SOFC heating andcooling. J Power Sources 159:956–967.
27. Maurya MR, Katare SR, Patkar PR, Rundell AE,Venkatasubramanian V. 2006. A systematic frame-work for the design of reduced-order models forsignal transduction pathways from a control theo-retic perspective. Comput Chem Eng 30:437–452.
28. Seborg DE, Edgar TF, Mellichamp DA. 1989.Process dynamics and control (Wiley Series in Che-mical Engineering). New York City: John Wiley &Sons. pp. 339–353.
29. Ogunnaike BA, Ray WH. 1994. Process dynamics,modeling, and control (Topics in Chemical Engi-neering). USA: Oxford University Press. pp. 139–167.
30. Bryson AE. 1999. Dynamic optimization. MenloPark: Addison Wesley Longman Inc. pp. 45–197.
31. Abate J, Valko PP. 2004. Multi-precision laplacetransform inversion. Int J Numer Meth Eng 60:979–993.
DOI 10.1002/jps