Embed Size (px)
Citation preview

P70-137
Issued January 2014
Household Economic Studies
Dynamics of Economic Well-Being: Poverty, 2009–2011
By Ashley N. Edwards
INTRODUCTION
This report presents data on poverty based on infor-mation collected in the Survey of Income and Program Participation (SIPP). The report describes patterns of poverty using measures with different time horizons and provides a dynamic view of the duration of poverty spells and the frequency of transitions into and out of poverty. It further examines how poverty dynamics vary across demographic groups. The report focuses on data collected in the 2008 Panel of the SIPP over the period of January 2009 to December 2011 and, where appropriate, makes comparisons to data collected for January 2005 to December 2007 in the 2004 SIPP Panel. See Text Box 1 for a detailed discussion of data sources and reference periods covered in this report.
The SIPP allows policy makers, academic researchers, and the general public to paint a more detailed portrait of poverty than the one provided by the official annual poverty estimate. The official annual poverty rate, based on the Current Population Survey Annual Social and Economic Supplement (CPS ASEC), captures a snapshot of well-being at a single time period. Once a year, the CPS ASEC measures the percentage of people whose annual family money income falls below their official poverty threshold but does not address how poverty varies across shorter or longer time periods or how an individual’s poverty status may change over time.1 Compared with the official annual poverty rate, longitudinal research finds poverty rates vary by the
1 See Source of Data on page 14 for a discussion of the differences in annual poverty rates across the SIPP and CPS ASEC.
time period examined—a small fraction of people are in poverty for more than 1 year, while a larger percentage of people experience poverty for shorter time periods.2
The SIPP interviews a representative sample of U.S. households every 4 months. The population represented (the population universe) is the civilian noninstitutionalized population of the United States. Core content of the SIPP identifies demographic characteristics, labor force participation, government program participation, and various income sources for members of sampled households.
Poverty statistics presented in this report adhere to the standards specified by the Office of Management and Budget’s Statistical Policy Directive 14. The Census Bureau uses a set of money income thresholds that vary by family size and composition to determine
2 Examples of previous longitudinal studies on poverty include: Robin J. Anderson, “Dynamics of Economic Well-Being: Poverty, 2004–2006,” Current Population Reports, Series P70-123, U.S. Census Bureau, Washington, DC, 2011. Stephanie R. Cellini, Signe-Mary McKernan, and Caroline Ratcliffe, “The Dynamics of Poverty in the United States: A Review of Data, Methods, and Findings,” Journal of Policy Analysis and Management 27 (2008), pp. 577–605. John Iceland, “Dynamics of Economic Well-Being: Poverty, 1996–1999,” Current Population Reports, Series P70-91, U.S. Census Bureau, Washington, DC, 2003. Mary Naifeh, “Dynamics of Economic Well-Being, Poverty, 1993–94: Trap Door? Revolving Door? Or Both?,” Current Population Reports, Series P70-63, U.S. Census Bureau, Washington, DC, 1998. Signe-Mary McKernan and Caroline Ratcliffe, “Transition Events in the Dynamics of Poverty, Urban Institute Research Report,” 2002, <www.urban.org/url .cfm?ID=410575>. Mary Jo Bane and David Ellwood, “Slipping Into and Out of Poverty: The Dynamics of Spells,” Journal of Human Resources 21 (1986), pp. 1–23. Ann Huff Stevens, “The Dynamics of Poverty Spells: Updating Bane and Ellwood,” AEA Papers and Proceedings 84 (1994), pp. 34–37. Ann Huff Stevens, “Climbing Out of Poverty, Falling Back In: Measuring the Persistence of Poverty Over Multiple Spells,” Journal of Human Resources 34 (1999), pp. 557–88.
U.S. Department of Commerce Economics and Statistics Administration
U.S. CENSUS BUREAU
2 U.S. Census Bureau
who is in poverty. If a family’s total income is less than that family’s threshold, then that family and every individual in it are consid-ered to be in poverty. The poverty thresholds do not vary geographi-cally. They are updated annually to reflect changes in the cost of living using the Consumer Price Index (CPI-U).3
Since SIPP respondents are inter-viewed throughout the year and asked about their income for the previous 4 months individually, each month’s poverty status is determined by comparing monthly income to the appropriate monthly poverty threshold. Monthly thresh-olds are calculated by multiply-ing the base-year annual poverty thresholds by an inflation factor relevant to the reference month and then dividing the calculated annual threshold by 12.
This report discusses poverty rate estimates for different time peri-ods, measures the length of time people remain poor, and follows the movement of people into and out of poverty. The poverty mea-sures discussed include monthly, annual, episodic, and chronic pov-erty rates. To capture changes in poverty status over time, the report examines poverty entry rates, pov-erty exit rates, and the duration of poverty spells. See Text Box 2 for a more detailed description of each measure used in this report.
3 For additional information on how the Census Bureau measures poverty see <www.census.gov/hhes/www/poverty /about/overview/measure.html>.
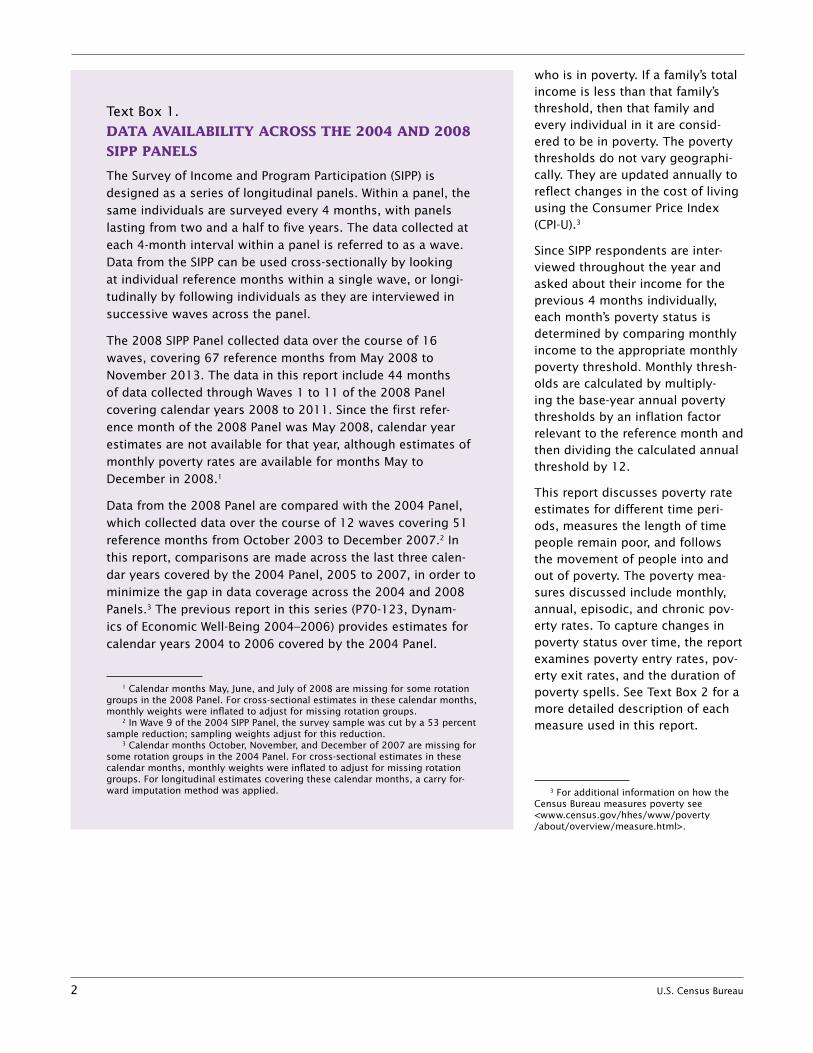
Text Box 1.
DATA AVAILABILITY ACROSS THE 2004 AND 2008
SIPP PANELS
The Survey of Income and Program Participation (SIPP) is designed as a series of longitudinal panels. Within a panel, the same individuals are surveyed every 4 months, with panels lasting from two and a half to five years. The data collected at each 4-month interval within a panel is referred to as a wave. Data from the SIPP can be used cross-sectionally by looking at individual reference months within a single wave, or longi-tudinally by following individuals as they are interviewed in successive waves across the panel.
The 2008 SIPP Panel collected data over the course of 16 waves, covering 67 reference months from May 2008 to November 2013. The data in this report include 44 months of data collected through Waves 1 to 11 of the 2008 Panel covering calendar years 2008 to 2011. Since the first refer-ence month of the 2008 Panel was May 2008, calendar year estimates are not available for that year, although estimates of monthly poverty rates are available for months May to December in 2008.1
Data from the 2008 Panel are compared with the 2004 Panel, which collected data over the course of 12 waves covering 51 reference months from October 2003 to December 2007.2 In this report, comparisons are made across the last three calen-dar years covered by the 2004 Panel, 2005 to 2007, in order to minimize the gap in data coverage across the 2004 and 2008 Panels.3 The previous report in this series (P70-123, Dynam-ics of Economic Well-Being 2004–2006) provides estimates for calendar years 2004 to 2006 covered by the 2004 Panel.
1 Calendar months May, June, and July of 2008 are missing for some rotation groups in the 2008 Panel. For cross-sectional estimates in these calendar months, monthly weights were inflated to adjust for missing rotation groups.
2 In Wave 9 of the 2004 SIPP Panel, the survey sample was cut by a 53 percent sample reduction; sampling weights adjust for this reduction.
3 Calendar months October, November, and December of 2007 are missing for some rotation groups in the 2004 Panel. For cross-sectional estimates in these calendar months, monthly weights were inflated to adjust for missing rotation groups. For longitudinal estimates covering these calendar months, a carry for-ward imputation method was applied.

U.S. Census Bureau 3
HIGHLIGHTS
• Overthe36-monthperiodfromJanuary 2009 to December 2011, 31.6 percent of the U.S. population was in poverty for at least 2 months, an increase from 27.1 percent over the period of 2005 to 2007.4
4 The estimates in this report (which may be shown in text, figures, or tables) are based on responses from a sample of the population and may differ from the actual values because of sampling variability or other factors. As a result, apparent differences between the estimates for two or more groups may not be statistically significant. All comparative state-ments have undergone statistical testing and are significant at the 90 percent confidence level unless otherwise noted.
• Thepercentageofpeopleinpoverty all 36 months from 2009 to 2011 was 3.5 percent, an increase from 3.0 percent over the period of 2005 to 2007.
• By2011,5.4percentofpeoplewho were not in poverty in 2009 had entered poverty.
• Ofindividualsinpovertyin2009, 12.6 million (35.4 per-cent) were not in poverty in 2011, but approximately half of those who exited poverty continued to have income less
than 150 percent of their pov-erty threshold.
• Forindividualsexperiencingapoverty spell lasting 2 or more consecutive months from 2009 to 2011, an estimated 44.0 percent of poverty spells ended within 4 months, while 15.2 percent of spells lasted more than 2 years.
• From2009to2011,themedian length of a given poverty spell was 6.6 months, up from a median length of 5.7 months over the period of 2005 to 2007.
Text Box 2. POVERTY MEASURES USED IN THIS REPORT
Monthly Poverty RatePercent in poverty in a given month using monthly income and a monthly threshold.
Episodic Poverty Rate Percent in poverty for 2 or more consecutive months.
Chronic Poverty Rate
Percent in poverty every month of a given reference period. Chronic pov-erty over an annual period includes individuals who have been in poverty for all 12 months, while chronic poverty over the panel refers to individu-als in poverty all 36 months of the 3-year period.
Annual Poverty RatePercent in poverty in a calendar year. Each individual’s annual poverty sta-tus is calculated by comparing the sum of monthly family income over the year to the sum of monthly poverty thresholds for the year.1
Length of Poverty Spell
Number of months in poverty. The minimum spell length is 2 months and spells are separated by 2 or more months of not being in poverty. Individu-als can have more than one spell. Spells underway in the first interview month of the panel are excluded.
Poverty EntryBased on annual poverty measures, people who were not in poverty in the first year of the panel but in poverty in a subsequent year.
Poverty ExitBased on annual poverty measures, people who were in poverty in the first year of the panel but not in poverty in a subsequent year.
1 The annual poverty rate estimates in the SIPP differ from official poverty estimates based on the CPS ASEC. See Source of Data on page 14 for a discussion of the differences in annual poverty rates across the SIPP and CPS ASEC.

4 U.S. Census Bureau
RESULTS
Poverty Rate Comparisons: 2005 to 2007 vs. 2009 to 2011
Figure 1 reports episodic poverty rates, annual poverty rates, and chronic poverty rates from the 2004 and 2008 Panels. This report uses SIPP data from the 2004 Panel covering January 2005 to December 2007, a period of eco-nomic expansion that ended in December 2007.5 The 2008 SIPP Panel captures the last 6 months of the economic recession (January to
5 Recessions are defined by the National Bureau of Economic Research (NBER). A trough occurred in November 2001, a peak in December 2007, and another trough in June 2009. For more information see <www.nber.org/cycles/cyclesmain.html>.
June 2009) and 30 months of the subsequent economic expansion.
Over the period of the 2004 SIPP Panel, the 2005 annual poverty rate of 10.9 percent was not statistically different from the 2006 annual pov-erty rate of 10.4 percent. However, the annual poverty rate rose 0.9 percentage points from 2006 to 2007, to a rate of 11.3 percent in 2007.6 Comparing estimates across the 2004 and 2008 SIPP Panels, annual poverty rates increased from 11.3 percent in 2007 to 13.2 percent in 2009. Individuals aged 65 and over were the only demo-graphic group shown in Tables A-1 and A-2 to experience a decrease
6 The 2005 annual poverty rate of 10.9 percent was not statistically different from the 2007 annual poverty rate of 11.3 percent.
in annual poverty rates from 2007 to 2009.7, 8 Over the course of the 2008 Panel, the overall annual poverty rate was unchanged from calendar years 2009 to 2010, and from 2010 to 2011. However, the 2011 annual poverty rate of 14.0 percent was higher than the 2009 annual poverty rate of 13.2 percent.
From January 2009 to December 2011, the percentage of people
7 The 2009 annual poverty rate for Blacks (24.2 percent) and individuals in male-householder families (14.9 percent) were not statistically different from 2007 annual poverty rates.
8 Cross-panel comparisons of poverty measures for people 65 and over should be done with caution due to changes in the collection and processing of social security income. See Limitations on page 15 for details of this change.
27.1
31.6
20.319.4 19.2
23.0 23.2 23.6
10.9 10.411.3
13.2 13.6 14.0
6.0 6.27.2 7.3
8.1 8.3
3.03.5
0
5
10
15
20
25
30
35
2005 2006 2007 2008 2009 2010 2011
-
- -
Figure 1.Selected Poverty Rates: 2005 to 2011
* Since the first reference month of the 2008 Panel was May 2008, calendar year estimates are not available for 2008.
Note: Panel and yearly estimates are based on different samples. The 3-year panel estimates include only respondents in the panel for 36 months whereas calendar year estimates include respondents in sample for 12 months. The numbers of respondents in each sample are as follows: 25,371 in the 2004 3-year panel, 48,937 in the 2008 3-year panel, 76,953 in 2005, 34,372 in 2006, 34,489 in 2007, 73,695 in 2009, 67,452 in 2010, and 62,841 in 2011. Calendar months October, November, and December of 2007 are missing for some rotation groups in the 2004 Panel. For longitudinal estimates covering these calendar months, a carry forward imputation method was applied.
Source: U.S. Census Bureau, Survey of Income and Program Participation, 2004 and 2008 Panel. For information on confidentiality protection and sampling and nonsampling error, see <www.census.gov/sipp/source.html>.
Episodic, panel
Recession
Chronic, panel
Episodic, calendar year
Annual poverty*
Chronic, calendar year
Percent

U.S. Census Bureau 5
experiencing a poverty spell (e.g., poor for at least 2 months) was 31.6 percent, up 4.5 percentage points from the rate of 27.1 per-cent over 2005 to 2007. Individuals aged 65 and over and individuals in female-householder families were the only demographic groups shown in Tables A-3 and A-4 who did not experience an increase in episodic poverty rates in the 2008 Panel.9, 10
Similarly, the percentage of peo-ple in poverty for all 36 months increased to 3.5 percent over the period of 2009 to 2011 (Table A-6) compared to 3.0 percent over 2005 to 2007 (Table A-5). Individuals
9 Female householders refer to female householders, no husband present; male householders refer to male householders, no wife present.
10 The episodic poverty rate for the elderly and people in female-householder families in the 2004 Panel was not statistically different from rates in the 2008 Panel. The 2004 Panel episodic poverty rates can be found in Table A-3.
aged 65 and older were the only demographic group to experience a decrease in their chronic pov-erty rate (from 3.3 percent to 2.3 percent).11
Monthly Poverty Rates: January 2005 to December 2011
Figure 2 summarizes monthly and annual poverty rates from the 2004 and 2008 Panels and illustrates that monthly poverty rates exceeded annual poverty rates for each month in both the 2004 and 2008 Panels. Monthly poverty rates, like episodic poverty rates, are higher than annual poverty rates because people are more likely to experi-ence short-term income short-falls than longer-term deficits. A
11 There was no significant difference in 2004 and 2008 Panel chronic poverty rates for Blacks, Hispanics, non-Hispanics, individu-als in female-householder families, individu-als in male-householder families, or unrelated individuals.
family could be in poverty for a few months (based on monthly poverty thresholds and monthly family income) but have an annual income higher than their corresponding annual poverty threshold. From the last month of the 2004 Panel (December 2007) to the first month of the 2008 Panel (May 2008), the monthly poverty rate increased by 3.5 percentage points, from 13.2 percent in December 2007 to 16.7 percent in May 2008.12
12 The increase in monthly poverty rates across the last month of the 2004 Panel (December 2007) and first month of the 2008 Panel (May 2008) may be due to both real changes in the economy as well as the SIPP survey design. Discontinuity in pov-erty rates across successive SIPP panels is well documented, characterized by Wave 1 poverty rates that are generally at least two percentage points higher than the poverty rate in the final wave of the preceding panel, with appreciable reductions in poverty rates from Wave 1 to Wave 2. (Czajka, Mabli, and Cody, 2008).
-
- -
13.9 13.2
16.6
10.9
13.2
10.411.3
13.6 14.0
16.7
0
5
10
15
20
2005 2007 20082006 2009 2010 2011
-
Figure 2.Monthly and Annual Poverty Rates: 2005 to 2011
* Since the first reference month of the 2008 Panel was May 2008, calendar year estimates are not available for 2008.
Note: Monthly and yearly estimates are based on different samples. Monthly estimates include all respondents in the sample for that month whereas calendar year estimates include only respondents in sample for all 12 months. Calendar months October, November, and December of 2007 as well as May, June, and July of 2008 are missing for some rotation groups in the 2004 and 2008 Panels. For cross-sectional estimates in these calendar months, monthly weights were inflated to adjust for missing rotation groups. For longitudinal estimates covering these calendar months, a carry forward imputation method was applied.
Source: U.S. Census Bureau, Survey of Income and Program Participation, 2004 and 2008 Panel. For information on confidentiality protection and sampling and nonsampling error, see www.census.gov/sipp/source.html.
Recession
Annual poverty*
Monthly poverty
Percent

6 U.S. Census Bureau
Episodic Poverty Rates, 2008 Panel by Selected Characteristics
Over the 36 months from 2009 to 2011, 31.6 percent of individuals experienced a poverty spell lasting 2 or more months, an increase of 4.5 percentage points over the epi-sodic poverty rate of 27.1 percent from 2005 to 2007 (Tables A-3 and A-4 in the Appendix).
Non-Hispanic Whites had a lower episodic poverty rate (25.4 percent) than Blacks and Hispanics, while Blacks had a lower episodic poverty
rate (45.3 percent) than Hispanics (49.6 percent).13 (See Figure 3.)
13 Federal surveys, including the SIPP 2008 Panel, give respondents the option of reporting more than one race. These data can be shown in two ways: (1) as mutually exclusive from other race groups, which may be denoted by “alone” or (2) not mutually exclusive with other race groups, denoted by “alone or in combination with other race groups.” The figures, tables, and text in this report show race using the first method. Because Hispanics may be of any race, data for Hispanics are not mutually exclusive with race. Data users should exercise cau-tion when interpreting aggregate results for these groups because they consist of many distinct subgroups that differ in socioeco-nomic characteristics, culture, and recency of immigration.
The episodic poverty rate for children under 18 years old (40.6 percent) was higher than the epi-sodic poverty rates for adults. In turn, adults 65 years and over had a lower episodic poverty rate (15.7 percent) than adults 18 to 64 years old (31.0 percent).
The episodic poverty rate for people in female-householder fami-lies (53.1 percent) exceeded the episodic poverty rates for people in other types of families. People in married-couple families had the lowest episodic poverty rate (23.6
All people, chronic
White
White, non-Hispanic
Black
Hispanic
Non-Hispanic
Under 18 years
18 to 64 years
65 years and over
Married -couple families
Female -householder families
Male -householder families
Unrelated individuals
All people, episodic
0 10 20 30 40 50 60
Figure 3.Chronic and Episodic Poverty by Selected Characteristics: 2009 to 2011
Note: Federal surveys, including the SIPP 2008 Panel, give respondents the option of reporting more than one race. These data can beshown in two ways: (1) as mutually exclusive from other race groups, which may be denoted by "alone" or (2) not mutually exclusive with other race groups, denoted by "alone or in combination with other race groups." This figure shows race using the first method. Because Hispanics may be of any race, data for Hispanics are not mutually exclusive with race. Female householders refer to female householders, no husband present; male householders refer to male householders, no wife present.
Source: U.S. Census Bureau, Survey of Income and Program Participation, 2008 Panel. For information on confidentiality protection andsampling and nonsampling error, see <www.census.gov/sipp/source.html>.
Not statistically different from the total populationChronic Poverty Episodic Poverty
Percent

U.S. Census Bureau 7
percent) across all family types. The episodic poverty rate for unre-lated individuals (40.6 percent) was not statistically different from the episodic poverty rate for people in male-householder families.
Calendar Year Episodic Poverty Rates, 2009 to 2011 by Selected Characteristics
In order to evaluate year-to-year changes in economic conditions, it is also useful to compare how many individuals experienced a poverty spell over the course of a calendar year (calendar year epi-sodic poverty rates). We find that calendar year measures of episodic poverty are lower than estimates over the course of the entire panel. Approximately 23.0 percent of people were in poverty 2 or more months within the 2009 calendar year, not statistically different from 2010 or 2011 episodic poverty rates. The only demographic groups in Table A-4 to experience significant changes in calendar year episodic poverty rates over the course of the 2008 Panel were non-Hispanics and adults aged 18 to 64. The 12-month episodic poverty rate for non-Hispanics increased from 20.1 percent in 2009 to 20.8 percent in 2011, while the rate for adults aged 18 to 64 increased from 22.0 percent in 2009 to 22.8 percent in 2011 (Table A-4 in the Appendix).
The annual episodic poverty rate increased by 3.9 percentage points from 2007 to 2009 (from 19.2 to 23.0 percent). Individuals aged 65 and over were the only demo-graphic group listed in Tables A-3 and A-4 who did not experience an increase in their episodic poverty rate from 2007 to 2009.
Chronic Poverty Rates, 2008 Panel by Selected Characteristics
Over the 36 months from 2009 to 2011, 3.5 percent of individuals were in poverty every month, an increase of 0.5 percentage points over the chronic poverty rate of 3.0 percent from 2005 to 2007 (Tables A-5 and A-6 in the Appendix).
As with episodic poverty rates, between 2009 to 2011, children had a higher chronic poverty rate (5.9 percent) than adults and the chronic poverty rate for non-Hispanic Whites (2.0 percent) was lower than the chronic poverty rates for Hispanics and Blacks. Additionally, the chronic poverty rate for adults aged 18 to 64 (2.8 percent) was higher than the rate for adults 65 years and over (2.3 percent). However, unlike the trend with episodic poverty, Blacks had a higher chronic poverty rate (8.6 percent) than Hispanics (6.4 percent).
By family type, chronic poverty rates exhibited a pattern similar to episodic poverty rates. The chronic poverty rate for people in female-householder families (10.1 percent) was higher than the chronic pov-erty rates for people in other types of families, while people in married-couple families had the lowest chronic poverty rate (1.4 percent). (See Figure 3.)
Calendar Year Chronic Poverty Rates, 2009 to 2011 by Selected Characteristics
Unlike episodic poverty rates, chronic poverty rates measured over a calendar year are higher than chronic poverty rates mea-sured over the entire 3-year panel. When measuring chronic poverty over a calendar year period, 7.3 percent of individuals were in pov-erty each month of 2009, increas-ing to 8.1 percent in 2010, with
2011 chronic poverty rates not statistically different from 2010.
The 2009 chronic poverty rate of 7.3 percent was not statistically different from the 2007 chronic poverty rate. Non-Hispanic Whites experienced increases in their chronic poverty rate from 2007 to 2009, from 4.1 percent to 4.7 per-cent, while individuals aged 65 and over experienced a decline in their chronic poverty rate from 2007 to 2009, from 5.9 percent to 3.9 per-cent. No other demographic groups listed in Tables A-5 and A-6 expe-rienced significant changes across their 2007 and 2009 calendar year chronic poverty measures.
Poverty Entries and Exits
Tables A-8 and A-10 summarize poverty entries and exits from 2009 to 2010 and from 2009 to 2011. From 2009 to 2011, the number of people who exited pov-erty (12.6 million) was not statisti-cally different from the number of people who entered poverty.14 Of people not poor in 2009, 5.4 percent were poor in 2011 (Table A-8). Of people in poverty in 2009, 35.4 percent were not poor in 2011 (Table A-10).15
While this data show consider-able movement into and out of poverty, some individuals moving out of poverty continue to have family income near poverty. Of the
14 More people entered poverty over the period of 2009 to 2011 (13.5 million) than entered poverty from 2005 to 2007 (10.2 million). More people also exited poverty over the period of 2009 to 2011 (12.6 mil-lion) than over the period of 2005 to 2007 (9.4 million). The 2004 Panel poverty exits are available from Table A-9 and 2004 Panel entries are from Table A-7.
15 Entry rates use the people not in poverty in 2009 as the base (247.5 million people) and exit rates use people in poverty in 2009 as the base (35.6 million people). Even if the number of people who entered poverty were the same as the number of people who exited poverty, entry rates would be smaller than exit rates because the base, or the denominator, for poverty entry rates was much larger than the base for exit rates.

8 U.S. Census Bureau
12.6 million people who exited poverty between 2009 and 2011, approximately half (6.2 million) had income below 150 percent of their poverty threshold. In addi-tion to the 13.5 million people who entered poverty between 2009 and 2011, another 11.9 million people had income decline from above 150 percent of their poverty threshold in 2009 to a level between 100 and 150 percent of their poverty thresh-old in 2011. (Tables A-11 and A-12 in the Appendix show the income to poverty ratio for 2009 compared with 2010 and 2011, respectively.)
Poverty Entries by Selected Characteristics
Non-Hispanic Whites had a lower poverty entry rate (3.9 percent) between 2009 and 2011 than Blacks or Hispanics, while Blacks had a lower entry rate than Hispanics (8.9 percent and 10.7 percent, respectively). Children had a higher poverty entry rate (7.1 percent) than adults; while adults aged 18 to 64 had a higher entry rate (5.3 percent) than those aged 65 and over (3.1 percent). People in female-householder families also had a higher poverty entry rate (10.0 percent) than those in married-couple families (4.0 per-cent) 16 (Table A-8 in the Appendix).
The 2009 to 2011 poverty entry rate of 5.4 percent was higher than the entry rate of 4.2 percent over the period of 2005 to 2007 (Tables A-7 and A-8 in the Appendix).
16 The poverty entry rate for people in male-householder families was not statisti-cally different from the poverty entry rate of people in female-householder families.
Figure 4.Poverty Entries and Exits: 2009 to 2011
Note: Entry rates use the people not in poverty in 2009 as the base (247.5 million people) and exit rates use people in poverty in 2009 as the base (35.6 million people). Even if the number of people who entered poverty were the same as the number of people who exited poverty, entry rates would be smaller than exit rates because the base, or the denominator, for poverty entry rates was much larger than the base for exit rates.
Source: U.S. Census Bureau, Survey of Income and Program Participation, 2008 Panel. For information on confidentiality protection and sampling and nonsampling error, see <www.census.gov/sipp/source.html>.
0 10 20 30 40
Not poor in 2011
Not poor in 2010
Poor in 2011
Poor in 2010
Not
poo
r in
2009
Poor
in 2
009
Percent
4.1EntriesExits
5.4
26.9
35.4
Figure 5.Poverty Entry Rates: People Not in Poverty in 2009 but in Poverty in 2011 by Selected Characteristics
Note: Federal surveys, including the SIPP 2008 Panel, give respondents the option of reporting more than one race. These data can be shown in two ways: (1) as mutually exclusive from other race groups, which may be denoted by "alone" or (2) not mutually exclusive with other race groups, denoted by "alone or in combination with other race groups." This figure shows race using the first method. Because Hispanics may be of any race, data for Hispanics are not mutually exclusive with race. Female householders refer to female householders, no husband present; male householders refer to male householders, no wife present.
Source: U.S. Census Bureau, Survey of Income and Program Participation, 2008 Panel. For information on confidentiality protection and sampling and nonsampling error, see <www.census.gov/sipp/source.html>.
0 2 4 6 8 10 12
Unrelated individualsMale-householder families
Female-householder familiesMarried-couple families
65 years and over18 to 64 years
Under 18 years
Non-HispanicHispanic
BlackWhite, non-Hispanic
White
All people
Percent
5.4
5.03.9
8.9
10.7
4.6
7.15.3
3.1
4.010.0
8.67.3

U.S. Census Bureau 9
Poverty Exits by Selected Characteristics
Consistent with their lower poverty entry rate, non-Hispanic Whites had a higher poverty exit rate (40.7 percent) than Blacks from 2009 to 2011. However, unlike entry rates, Hispanics had a higher poverty exit rate than Blacks (35.8 and 22.7 percent, respectively), and there was no statistical difference in the poverty exit rate between non-Hispanic Whites and Hispanics. Children had a lower poverty exit rate (29.6 percent) than adults aged 18 to 64 (39.7 percent) but there was no statistical difference in exit rates for children and adults aged 65 and over. People in female-householder families had a lower exit rate (25.2 percent) than people in married-couple families (44.3 percent)17 (Table A-10 in the Appendix).
The 2009 to 2011 poverty exit rate of 35.4 percent was not sta-tistically different from the 2005 to 2007 poverty exit rate. Addi-tionally, poverty exit rates across 2005 to 2007 and 2009 to 2011 did not significantly change for any of the demographic groups shown in Tables A-9 and A-10.
Net Change in Poverty Entries and Exits by Selected Characteristics
Between 2009 and 2011, there was no significant difference in
17 The exit rate for people in married- couple families (44.3 percent) was not statis-tically different from the exit rate for people in male-householder families.
the number of people who exited or entered poverty over the 3-year period. However, there were some significant differences by demo-graphic groups, with approximately 561,000 more Blacks, 337,000 more elderly, 1.1 million more indi-viduals in married-couple families, and 280,000 more individuals in male-householder families enter-ing poverty than exiting poverty
over the 2009 to 2011 period. Among other demographic groups, the number of people who exited poverty was not significantly dif-ferent from the number of people who entered poverty from 2009 to 2011. (Estimates of the number of people entering poverty are in Table A-8 while estimates of the number of people exiting poverty are in Table A-10.)
Figure 6.Poverty Exit Rates: People in Poverty in 2009 but Not in Poverty in 2011 by Selected Characteristics
Note: Federal surveys, including the SIPP 2008 Panel, give respondents the option of reporting more than one race. These data can be shown in two ways: (1) as mutually exclusive from other race groups, which may be denoted by "alone" or (2) not mutually exclusive with other race groups, denoted by "alone or in combination with other race groups." This figure shows race using the first method. Because Hispanics may be of any race, data for Hispanics are not mutually exclusive with race. Female householders refer to female householders, no husband present; male householders refer to male householders, no wife present.
Source: U.S. Census Bureau, Survey of Income and Program Participation, 2008 Panel. For information on confidentiality protection and sampling and nonsampling error, see <www.census.gov/sipp/source.html>.
0 10 20 30 40 50
Unrelated individualsMale-householder families
Female-householder familiesMarried-couple families
65 years and over18 to 64 years
Under 18 years
Non-HispanicHispanic
BlackWhite, non-Hispanic
White
All people
Percent
35.4
39.140.7
22.7
35.835.3
29.639.7
31.5
44.325.2
37.636.9
10 U.S. Census Bureau
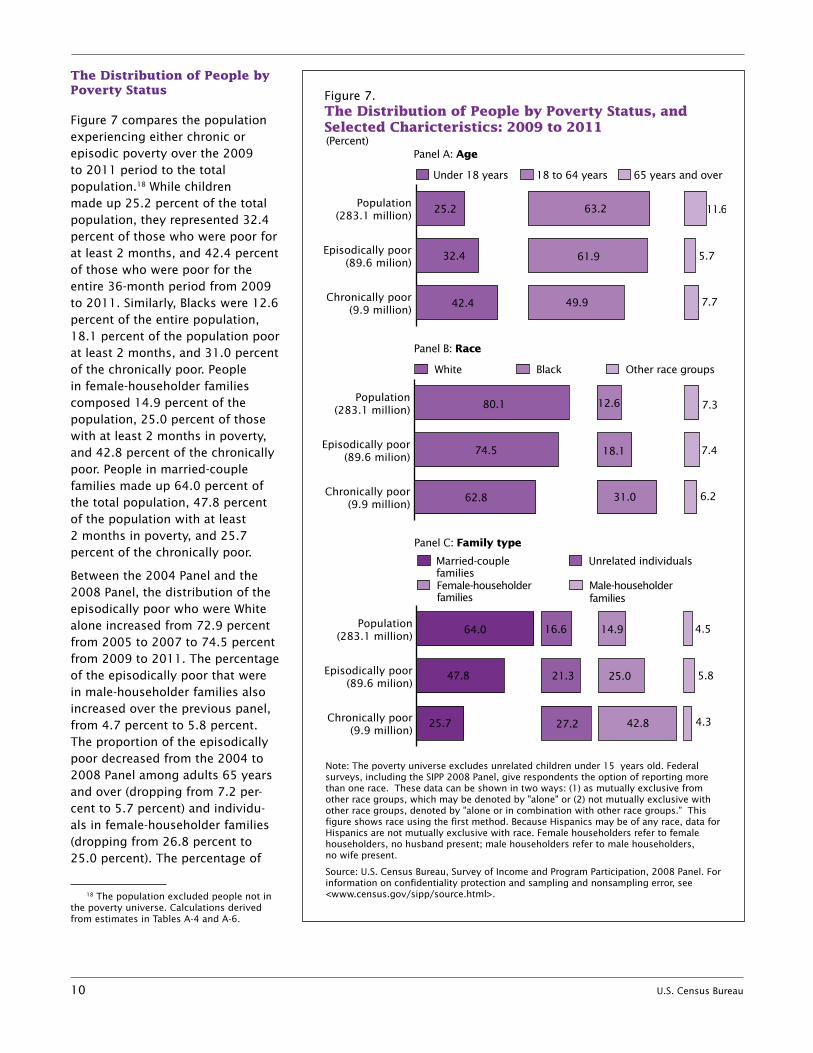
The Distribution of People by Poverty Status
Figure 7 compares the population experiencing either chronic or episodic poverty over the 2009 to 2011 period to the total population.18 While children made up 25.2 percent of the total population, they represented 32.4 percent of those who were poor for at least 2 months, and 42.4 percent of those who were poor for the entire 36-month period from 2009 to 2011. Similarly, Blacks were 12.6 percent of the entire population, 18.1 percent of the population poor at least 2 months, and 31.0 percent of the chronically poor. People in female-householder families composed 14.9 percent of the population, 25.0 percent of those with at least 2 months in poverty, and 42.8 percent of the chronically poor. People in married-couple families made up 64.0 percent of the total population, 47.8 percent of the population with at least 2 months in poverty, and 25.7 percent of the chronically poor.
Between the 2004 Panel and the 2008 Panel, the distribution of the episodically poor who were White alone increased from 72.9 percent from 2005 to 2007 to 74.5 percent from 2009 to 2011. The percentage of the episodically poor that were in male-householder families also increased over the previous panel, from 4.7 percent to 5.8 percent. The proportion of the episodically poor decreased from the 2004 to 2008 Panel among adults 65 years and over (dropping from 7.2 per-cent to 5.7 percent) and individu-als in female-householder families (dropping from 26.8 percent to 25.0 percent). The percentage of
18 The population excluded people not in the poverty universe. Calculations derived from estimates in Tables A-4 and A-6.
Figure 7.The Distribution of People by Poverty Status, and Selected Charicteristics: 2009 to 2011
Note: The poverty universe excludes unrelated children under 15 years old. Federal surveys, including the SIPP 2008 Panel, give respondents the option of reporting more than one race. These data can be shown in two ways: (1) as mutually exclusive from other race groups, which may be denoted by "alone" or (2) not mutually exclusive with other race groups, denoted by "alone or in combination with other race groups." This figure shows race using the first method. Because Hispanics may be of any race, data for Hispanics are not mutually exclusive with race. Female householders refer to female householders, no husband present; male householders refer to male householders, no wife present.
Source: U.S. Census Bureau, Survey of Income and Program Participation, 2008 Panel. Forinformation on confidentiality protection and sampling and nonsampling error, see <www.census.gov/sipp/source.html>.
Under 18 years
(Percent)Panel A: Age
18 to 64 years 65 years and over
Chronically poor (9.9 million)
Episodically poor (89.6 milion)
Population (283.1 million)
25.2
32.4 61.9
49.9 7.7
5.7
11.663.2
42.4
White
Panel B: Race
Black Other race groups
Chronically poor (9.9 million)
Episodically poor (89.6 milion)
Population (283.1 million) 80.1
74.5 18.1
31.0 6.2
7.4
7.312.6
62.8
Married-couple families
Panel C: Family type
Unrelated individuals
Female-householder families
Male-householder families
Chronically poor (9.9 million)
Episodically poor (89.6 milion)
Population (283.1 million)
64.0
47.8 21.3
27.2 42.8
25.0
14.9 4.5
5.8
4.3
16.6
25.7
U.S. Census Bureau 11
the chronically poor who were White, non-Hispanic increased from the 2004 to 2008 Panel, from 33.1 to 38.3 percent, while the percent-age of the chronically poor who were adults 65 years and over fell from 12.5 percent in 2005 to 2007 to 7.7 percent in 2009 to 2011.19 (Estimates of the popula-tion experiencing episodic poverty are available in Tables A-3 and A-4 while estimates of the population experiencing chronic poverty are in Tables A-5 and A-6.)
The Percentage of People in Poverty in January and February 2009 Who Were Poor All 36 Months from 2009 to 2011
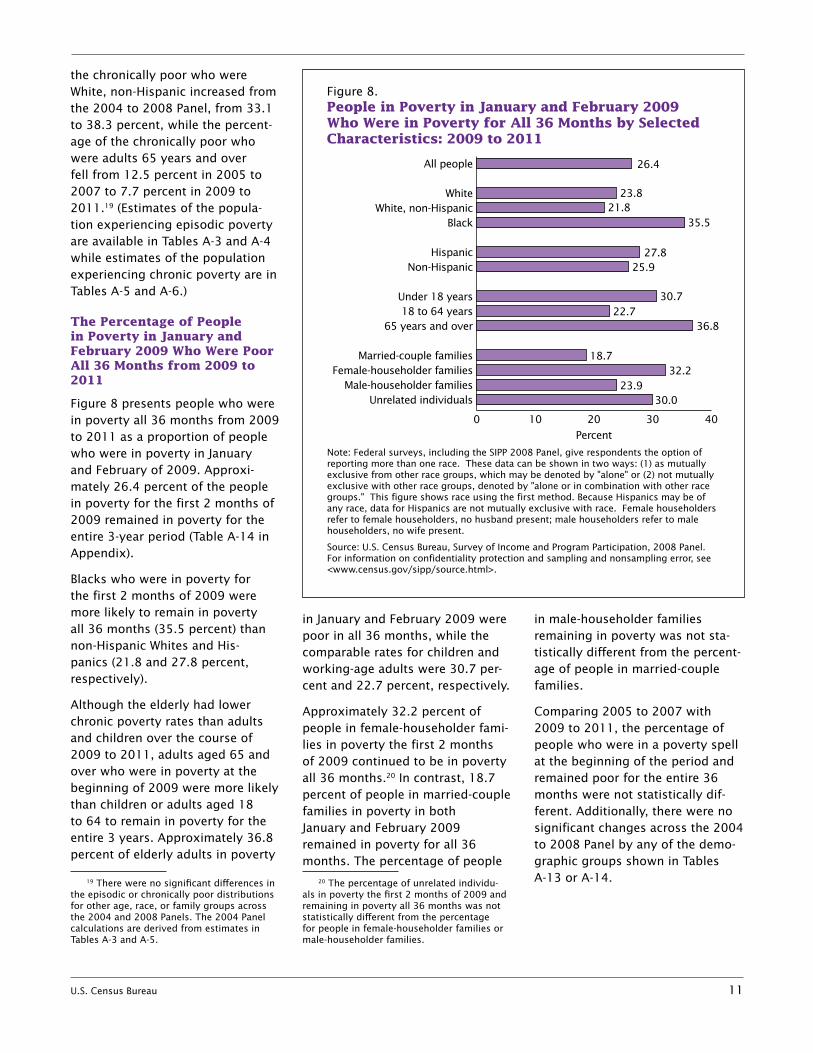
Figure 8 presents people who were in poverty all 36 months from 2009 to 2011 as a proportion of people who were in poverty in January and February of 2009. Approxi-mately 26.4 percent of the people in poverty for the first 2 months of 2009 remained in poverty for the entire 3-year period (Table A-14 in Appendix).
Blacks who were in poverty for the first 2 months of 2009 were more likely to remain in poverty all 36 months (35.5 percent) than non-Hispanic Whites and His-panics (21.8 and 27.8 percent, respectively).
Although the elderly had lower chronic poverty rates than adults and children over the course of 2009 to 2011, adults aged 65 and over who were in poverty at the beginning of 2009 were more likely than children or adults aged 18 to 64 to remain in poverty for the entire 3 years. Approximately 36.8 percent of elderly adults in poverty
19 There were no significant differences in the episodic or chronically poor distributions for other age, race, or family groups across the 2004 and 2008 Panels. The 2004 Panel calculations are derived from estimates in Tables A-3 and A-5.
in January and February 2009 were poor in all 36 months, while the comparable rates for children and working-age adults were 30.7 per-cent and 22.7 percent, respectively.
Approximately 32.2 percent of people in female-householder fami-lies in poverty the first 2 months of 2009 continued to be in poverty all 36 months.20 In contrast, 18.7 percent of people in married-couple families in poverty in both January and February 2009 remained in poverty for all 36 months. The percentage of people
20 The percentage of unrelated individu-als in poverty the first 2 months of 2009 and remaining in poverty all 36 months was not statistically different from the percentage for people in female-householder families or male-householder families.
in male-householder families remaining in poverty was not sta-tistically different from the percent-age of people in married-couple families.
Comparing 2005 to 2007 with 2009 to 2011, the percentage of people who were in a poverty spell at the beginning of the period and remained poor for the entire 36 months were not statistically dif-ferent. Additionally, there were no significant changes across the 2004 to 2008 Panel by any of the demo-graphic groups shown in Tables A-13 or A-14.
Figure 8.People in Poverty in January and February 2009 Who Were in Poverty for All 36 Months by Selected Characteristics: 2009 to 2011
Note: Federal surveys, including the SIPP 2008 Panel, give respondents the option of reporting more than one race. These data can be shown in two ways: (1) as mutually exclusive from other race groups, which may be denoted by "alone" or (2) not mutually exclusive with other race groups, denoted by "alone or in combination with other race groups." This figure shows race using the first method. Because Hispanics may be of any race, data for Hispanics are not mutually exclusive with race. Female householders refer to female householders, no husband present; male householders refer to male householders, no wife present.
Source: U.S. Census Bureau, Survey of Income and Program Participation, 2008 Panel. For information on confidentiality protection and sampling and nonsampling error, see <www.census.gov/sipp/source.html>.
0 10 20 30 40
Unrelated individualsMale-householder families
Female-householder familiesMarried-couple families
65 years and over18 to 64 years
Under 18 years
Non-HispanicHispanic
BlackWhite, non-Hispanic
White
All people
Percent
26.4
23.821.8
35.5
27.825.9
30.722.7
36.8
18.732.2
23.930.0
12 U.S. Census Bureau
Duration and Median Length of Poverty Spells
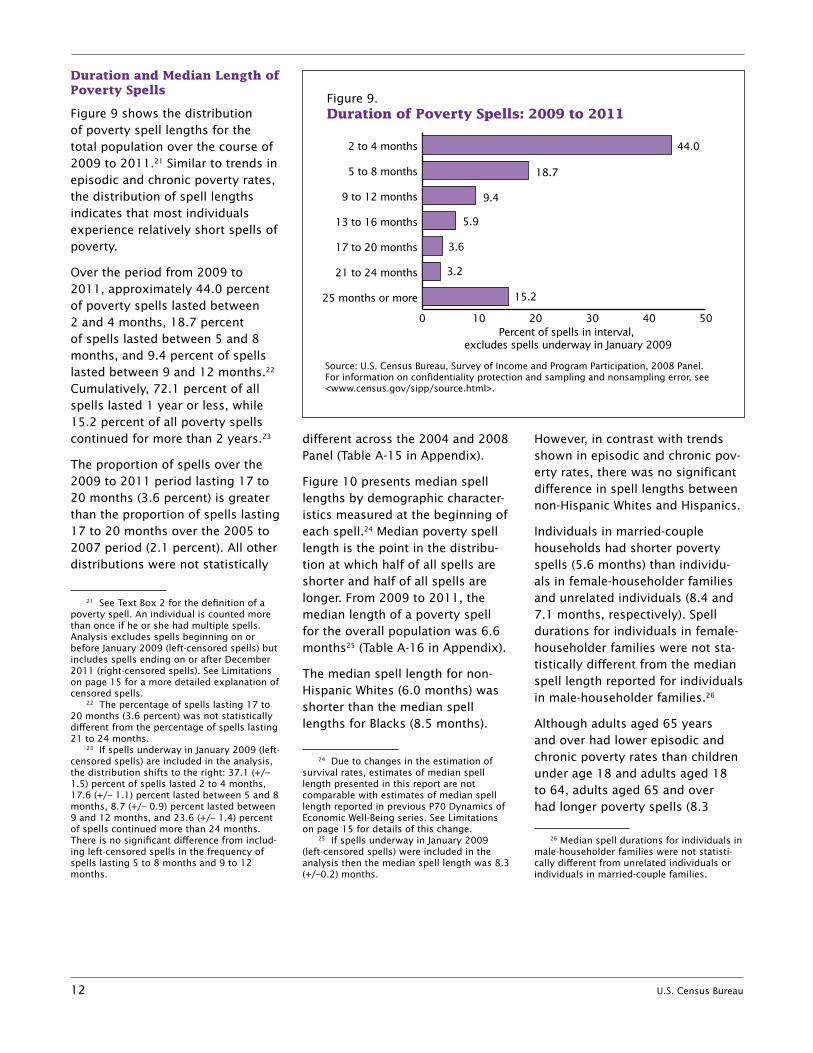
Figure 9 shows the distribution of poverty spell lengths for the total population over the course of 2009 to 2011.21 Similar to trends in episodic and chronic poverty rates, the distribution of spell lengths indicates that most individuals experience relatively short spells of poverty.
Over the period from 2009 to 2011, approximately 44.0 percent of poverty spells lasted between 2 and 4 months, 18.7 percent of spells lasted between 5 and 8 months, and 9.4 percent of spells lasted between 9 and 12 months.22 Cumulatively, 72.1 percent of all spells lasted 1 year or less, while 15.2 percent of all poverty spells continued for more than 2 years.23
The proportion of spells over the 2009 to 2011 period lasting 17 to 20 months (3.6 percent) is greater than the proportion of spells lasting 17 to 20 months over the 2005 to 2007 period (2.1 percent). All other distributions were not statistically
21 See Text Box 2 for the definition of a poverty spell. An individual is counted more than once if he or she had multiple spells. Analysis excludes spells beginning on or before January 2009 (left-censored spells) but includes spells ending on or after December 2011 (right-censored spells). See Limitations on page 15 for a more detailed explanation of censored spells.
22 The percentage of spells lasting 17 to 20 months (3.6 percent) was not statistically different from the percentage of spells lasting 21 to 24 months.
23 If spells underway in January 2009 (left-censored spells) are included in the analysis, the distribution shifts to the right: 37.1 (+/– 1.5) percent of spells lasted 2 to 4 months, 17.6 (+/– 1.1) percent lasted between 5 and 8 months, 8.7 (+/– 0.9) percent lasted between 9 and 12 months, and 23.6 (+/– 1.4) percent of spells continued more than 24 months. There is no significant difference from includ-ing left-censored spells in the frequency of spells lasting 5 to 8 months and 9 to 12 months.
different across the 2004 and 2008 Panel (Table A-15 in Appendix).
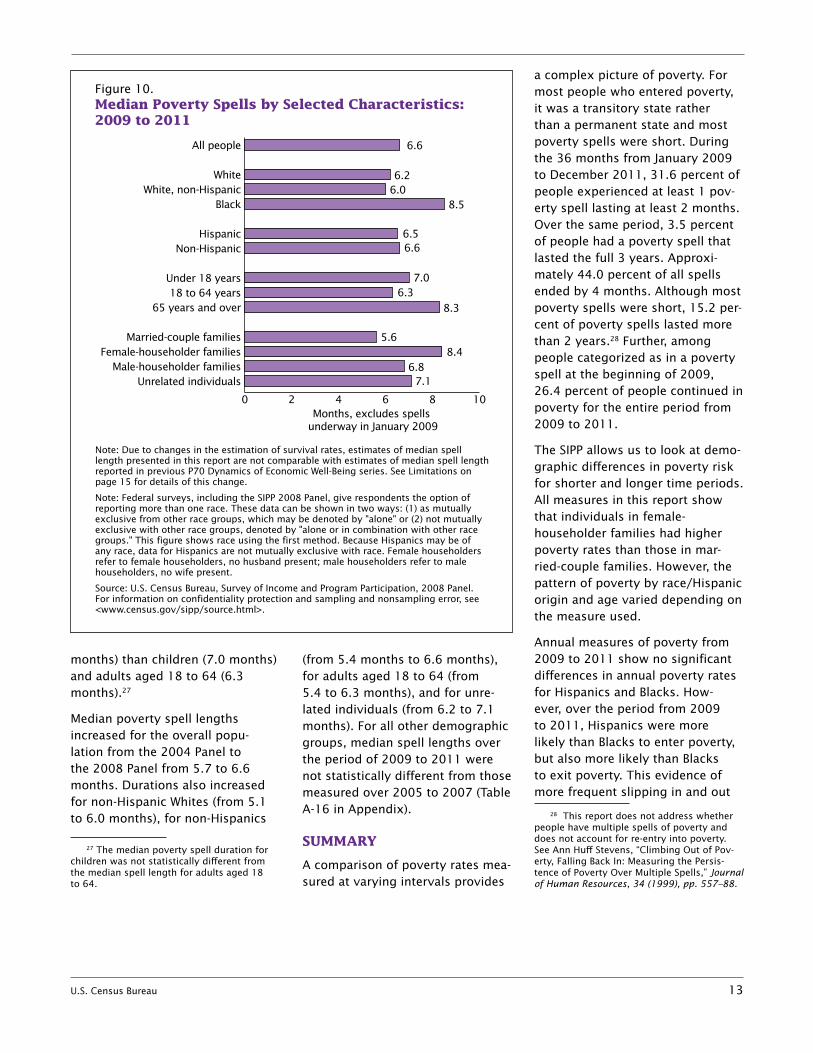
Figure 10 presents median spell lengths by demographic character-istics measured at the beginning of each spell.24 Median poverty spell length is the point in the distribu-tion at which half of all spells are shorter and half of all spells are longer. From 2009 to 2011, the median length of a poverty spell for the overall population was 6.6 months25 (Table A-16 in Appendix).
The median spell length for non-Hispanic Whites (6.0 months) was shorter than the median spell lengths for Blacks (8.5 months).
24 Due to changes in the estimation of survival rates, estimates of median spell length presented in this report are not comparable with estimates of median spell length reported in previous P70 Dynamics of Economic Well-Being series. See Limitations on page 15 for details of this change.
25 If spells underway in January 2009 (left-censored spells) were included in the analysis then the median spell length was 8.3 (+/–0.2) months.
However, in contrast with trends shown in episodic and chronic pov-erty rates, there was no significant difference in spell lengths between non-Hispanic Whites and Hispanics.
Individuals in married-couple households had shorter poverty spells (5.6 months) than individu-als in female-householder families and unrelated individuals (8.4 and 7.1 months, respectively). Spell durations for individuals in female-householder families were not sta-tistically different from the median spell length reported for individuals in male-householder families.26
Although adults aged 65 years and over had lower episodic and chronic poverty rates than children under age 18 and adults aged 18 to 64, adults aged 65 and over had longer poverty spells (8.3
26 Median spell durations for individuals in male-householder families were not statisti-cally different from unrelated individuals or individuals in married-couple families.
Figure 9.Duration of Poverty Spells: 2009 to 2011
Source: U.S. Census Bureau, Survey of Income and Program Participation, 2008 Panel. For information on confidentiality protection and sampling and nonsampling error, see <www.census.gov/sipp/source.html>.
Percent of spells in interval, excludes spells underway in January 2009
18.7
44.0
9.4
5.9
3.6
3.2
15.2
0 10 20 30 40 50
25 months or more
21 to 24 months
17 to 20 months
13 to 16 months
9 to 12 months
5 to 8 months
2 to 4 months
U.S. Census Bureau 13
months) than children (7.0 months) and adults aged 18 to 64 (6.3 months).27
Median poverty spell lengths increased for the overall popu-lation from the 2004 Panel to the 2008 Panel from 5.7 to 6.6 months. Durations also increased for non-Hispanic Whites (from 5.1 to 6.0 months), for non-Hispanics
27 The median poverty spell duration for children was not statistically different from the median spell length for adults aged 18 to 64.
(from 5.4 months to 6.6 months), for adults aged 18 to 64 (from 5.4 to 6.3 months), and for unre-lated individuals (from 6.2 to 7.1 months). For all other demographic groups, median spell lengths over the period of 2009 to 2011 were not statistically different from those measured over 2005 to 2007 (Table A-16 in Appendix).
SUMMARY
A comparison of poverty rates mea-sured at varying intervals provides
a complex picture of poverty. For most people who entered poverty, it was a transitory state rather than a permanent state and most poverty spells were short. During the 36 months from January 2009 to December 2011, 31.6 percent of people experienced at least 1 pov-erty spell lasting at least 2 months. Over the same period, 3.5 percent of people had a poverty spell that lasted the full 3 years. Approxi-mately 44.0 percent of all spells ended by 4 months. Although most poverty spells were short, 15.2 per-cent of poverty spells lasted more than 2 years.28 Further, among people categorized as in a poverty spell at the beginning of 2009, 26.4 percent of people continued in poverty for the entire period from 2009 to 2011.
The SIPP allows us to look at demo-graphic differences in poverty risk for shorter and longer time periods. All measures in this report show that individuals in female- householder families had higher poverty rates than those in mar-ried-couple families. However, the pattern of poverty by race/Hispanic origin and age varied depending on the measure used.
Annual measures of poverty from 2009 to 2011 show no significant differences in annual poverty rates for Hispanics and Blacks. How-ever, over the period from 2009 to 2011, Hispanics were more likely than Blacks to enter poverty, but also more likely than Blacks to exit poverty. This evidence of more frequent slipping in and out
28 This report does not address whether people have multiple spells of poverty and does not account for re-entry into poverty. See Ann Huff Stevens, “Climbing Out of Pov-erty, Falling Back In: Measuring the Persis-tence of Poverty Over Multiple Spells,” Journal of Human Resources, 34 (1999), pp. 557–88.
Figure 10.Median Poverty Spells by Selected Characteristics: 2009 to 2011
Note: Due to changes in the estimation of survival rates, estimates of median spell length presented in this report are not comparable with estimates of median spell length reported in previous P70 Dynamics of Economic Well-Being series. See Limitations on page 15 for details of this change.
Note: Federal surveys, including the SIPP 2008 Panel, give respondents the option of reporting more than one race. These data can be shown in two ways: (1) as mutually exclusive from other race groups, which may be denoted by "alone" or (2) not mutually exclusive with other race groups, denoted by "alone or in combination with other race groups." This figure shows race using the first method. Because Hispanics may be of any race, data for Hispanics are not mutually exclusive with race. Female householders refer to female householders, no husband present; male householders refer to male householders, no wife present.
Source: U.S. Census Bureau, Survey of Income and Program Participation, 2008 Panel. For information on confidentiality protection and sampling and nonsampling error, see <www.census.gov/sipp/source.html>.
0 2 4 6 8 10
Unrelated individualsMale-householder families
Female-householder familiesMarried-couple families
65 years and over18 to 64 years
Under 18 years
Non-HispanicHispanic
BlackWhite, non-Hispanic
White
All people
Months, excludes spells underway in January 2009
6.6
6.26.0
8.5
6.56.6
7.06.3
8.3
5.68.4
6.87.1

14 U.S. Census Bureau
of poverty for Hispanics over the period of 2009 to 2011 is also illustrated by their higher episodic poverty rate in comparison with other race and ethnicity groups.
While CPS ASEC annual poverty rates have generally shown a decline in elderly poverty rates since the 1960s, the SIPP data provide a more complex picture of the dynamics of poverty for adults 65 years and over. 29 Similar to the findings from the CPS ASEC, adults 65 years and over in the 2008 SIPP Panel were less likely than children or adults aged 18 to 64 to be in poverty when measured using annual, episodic, or chronic measures. However, the 2008 SIPP Panel illustrates that once the elderly entered poverty, their pov-erty exit rates were not statistically different than those for children, and their median spell durations of 8.3 months were longer than median spell lengths for both chil-dren and working-age adults.
SIPP data from the 2004 Panel paint a picture of poverty for a period which coincided with the economic expansion that started in November 2001 and ended in December 2007. From 2005 to 2007, the episodic poverty rate declined from 20.3 percent in 2005 to 19.2 percent in 2007 and annual poverty rates in 2006 and 2007 were not statistically different from their 2005 value of 10.9 percent.30 However, the expansion period of 2005 to 2007 did show increases in calendar year chronic poverty
29 The CPS annual poverty rate for adults 65 and over declined from 28.5 percent in 1966 to 8.7 percent in 2011. From Carmen DeNavas-Walt, Bernadette D. Proctor, and Jessica C. Smith, “Income, Poverty and Health Insurance Coverage in the United States: 2011,” Current Population Reports: Series P60-243, U.S. Census Bureau, Washington, DC: U.S. Government Printing Office.
30 The 2007 annual poverty rate of 11.3 percent was higher than the 2006 annual poverty rate of 10.4 percent.
rates, increasing from 6.0 percent in 2005 to 7.2 percent in 2007.
Data captured in the 2008 SIPP Panel covers the last 6 month of the most recent economic recession and 30 months of the subsequent economic expansion. The annual poverty rate increased from 11.3 percent in 2007 to 13.2 percent in 2009, and rose over the course of the 2008 Panel to a rate of 14.0 percent in 2011.31 Chronic poverty similarly increased over the course of the two panels, from a rate of 3.0 percent from 2005 to 2007 to 3.5 percent from 2009 to 2011. The episodic poverty rate also increased across panels, from 27.1 percent over the period of 2005 to 2007 to a rate of 31.6 percent over the period of 2009 to 2011. A higher percentage of individu-als entered poverty during the 2008 Panel (5.4 percent) compared with the 2004 Panel (4.2 percent), although there was no difference in the percent of individuals who exited poverty between the two panels. Similarly, our comparison of spell characteristics in the two pan-els shows that the median length of poverty spells increased from 5.7 months in the 2004 Panel to 6.6 months in the 2008 Panel.
SOURCE OF DATA
The population represented (the population universe) in the 2004 and 2008 Survey of Income and Program Participation (SIPP) Panels is the civilian noninstitutionalized population living in the United States. The SIPP is a longitudinal survey conducted at 4-month intervals. The data in this report reference January 2005 through December 2007 and January 2009 through December 2011. For the 2004 SIPP Panel, approximately
31 The 2010 annual poverty rate of 13.6 percent was not statistically different from the 2009 rate of 13.2 percent or the 2011 rate of 14.0 percent.
62,700 housing units were in sample for the first wave. Of the 51,400 eligible units, 43,700 were interviewed.32 For the 2008 SIPP Panel, approximately 65,500 hous-ing units were in sample for the first wave. Of the 52,000 eligible units, 42,000 were interviewed.33 The institutionalized population, which is excluded from the popula-tion universe, is composed primar-ily of the population in correctional institutions and nursing homes (98.1 percent of the 4.0 million institutionalized people in the 2010 Census).34
DIFFERENCES ACROSS THE SIPP AND CPS ASEC
The annual poverty rate estimates in the SIPP differ from official pov-erty estimates based on the CPS ASEC. In general, SIPP estimates of annual poverty are lower than official poverty estimates calculated using the CPS ASEC.
In the CPS ASEC, poverty status is based on responses to income questions referring to the previous calendar year and poverty thresh-olds are based on family composi-tion in the interview month (February, March, or April). In the SIPP, family composition and pov-erty thresholds may vary during the reference period and income data is collected at shorter intervals, therefore reducing the potential for respondent recall error. In addition to collecting income data at shorter intervals, the SIPP was designed to provide more comprehensive reporting of income sources, such as transfer programs, that may be
32 Source and Accuracy Statement for SIPP 2004 Panel Wave 1 to Wave 12 (core) Public Use Files. <www.census.gov/sipp/sourceac /S&A04_W1toW12(S&A-9).pdf>.
33 Source and Accuracy Statement for SIPP 2008 Panel: Wave 1 to Wave 11 (core) Public Use Files. <www.census.gov/sipp /sourceac/S&A08_W1toW11(S&A-16).pdf>.
34 Group Quarters Population by Sex, Age, and Type of Group Quarters: 2010. 2010 Census Summary File 1, QT-P13.

U.S. Census Bureau 15
received on an irregular or part-year basis.
Additionally, the CPS reporting unit is the person, but the sample covers housing units; whoever happens to be living at the address at the time of the interview is in sample. When residents of a CPS housing unit move, they are not followed as in the SIPP; instead, the new housing residents become sample members.35
ACCURACY OF ESTIMATES
Statistics from surveys are subject to sampling and nonsampling error. All comparisons presented in this report have taken sampling error into account and are significant at the 90 percent confidence level unless otherwise noted. This means the 90 percent confidence inter-val for the difference between the estimates being compared does not include zero. Nonsampling errors in surveys may be attributed to a variety of sources, such as how the survey is designed, how respon-dents interpret questions, how able and willing respondents are to provide correct answers, and how accurately the answers are coded and classified. The Census Bureau employs quality control procedures
35 For additional information on how the SIPP compares to the CPS ASEC, see “Comparison of SIPP with Other Surveys,” <www.census.gov/sipp/vs.html>, accessed November 2011. John L. Czajka and Gabrielle Denmead, “Income Data for Policy Analysis: A Comparative Assessment of Eight Sur-veys,” Washington, DC: Mathematica Policy Research, December 2008. Kathleen Short, Martina Shea, David Johnson, and Thesia I. Garner, “Poverty-Measurement Research Using the Consumer Expenditure Survey and the Survey of Income and Program Participa-tion,” American Economic Review, Vol. 88, May 1998, pp. 352–356. John Coder and Lydia Scoon-Rogers, “Evaluating the Qual-ity of Income Data Collected in the Annual Supplement to the March Current Population Survey and the Survey of Income and Program Participation,” SIPP Working Paper 215, July 1996. Roberton Williams, “Measuring Poverty with the SIPP and CPS,” SIPP Working Paper 45, June 1988.
throughout the production process, including the overall design of surveys, the wording of questions, review of the work of interview-ers and coders, and the statistical review of reports, to minimize these errors. The SIPP weighting procedure uses ratio estimation, whereby sample estimates are adjusted to independent estimates of the national population by age, race, sex, and Hispanic origin. This weighting partially corrects for bias due to undercoverage, but biases may still be present when people who are missed by the survey differ from those interviewed in ways other than age, race, sex, and Hispanic origin. How this weighting procedure affects other variables in the survey is not precisely known. All of these considerations affect comparisons across different sur-veys or data sources.
For further information on statisti-cal standards and the computation and use of standard errors, go to <www.census.gov/sipp/sourceac /S&A08_W1toW11(S&A-16).pdf> (2008 Panel) and <www.census .gov/sipp/sourceac/S&A04 _W1toW12(S&A-9).pdf> (2004 Panel) or contact Ashley M. Westra of the Census Bureau’s Demographic Statistical Methods Division at <ashley.m.westra @census.gov>. For more infor-mation about the content of the report, contact Ashley N. Edwards of the Poverty Statistics Branch, at <[email protected]> or 301-763-2458. Additional informa-tion on the SIPP can be found at the following Web sites: <www.census .gov/sipp/> (main SIPP Web site), <www.census.gov/sipp/workpapr /wp230.pdf > (SIPP Quality Profile), and <www.census.gov/sipp /usrguide.html> (SIPP Users’ Guide).
LIMITATIONS
Nonsampling Errors
All surveys have potential sampling and nonsampling error. Addition-ally, longitudinal surveys may have both seam and attrition biases. Seam bias occurs when respon-dents report the same status of monthly variables within waves. If seam bias is present then monthly variables are more likely to change during on-seam months (months of different waves) than off-seam months (months within the same wave). Attrition bias may occur if respondents leaving the survey are systematically different from those who stay in the survey. The house-hold weighted sample loss rate in the 2008 SIPP Panel was 19.2 percent in Wave 1 and 42.7 percent in Wave 11.36 The Census Bureau uses a combination of weighting and imputation methods to reduce the bias of nonresponse on three levels (household, person, and item nonresponse levels) in the SIPP. The effectiveness of those proce-dures remains a matter of ongoing research.37
Replicate Weights
This report is the first in the P70 Dynamics of Economic Well-Being series where standard errors and confidence intervals were calcu-lated using the Successive Differ-ence Replication (SRD) method
36 Source and Accuracy Statement for the SIPP 2008 Panel: Wave 1 to Wave 11 (core) Public Use Files. <www.census.gov /sipp/sourceac/S&A08_W1toW11(S&A-16) .pdf>.
37 U.S. Census Bureau, Survey of Income and Program Participation User’s Guide, update, pp. 6-2–6-5, 2008, <www.census .gov/sipp/usrguide/chap6rev2008.pdf>.

16 U.S. Census Bureau
documented by Fay and Train (1995).38 This method involves the computation of a set of replicate weights which account for the complex survey design of the SIPP and provides more accurate vari-ance estimates.39 This report uses the SRD method for all estimates from the 2004 and 2008 Panel; therefore, confidence intervals for estimates from the 2004 Panel will vary from those previously pub-lished in P70-123, “Dynamics of Economic Well-Being 2004–2006.”
Previous reports in the P70 Dynamics of Economic Well-Being series calculated standard error estimates using a Generalized Variance Function (GVF) approach. Under this approach, generalized variance parameters were used in formulas provided in the source and accuracy statement to estimate standard errors.
Longitudinal Editing and Longitudinal Analysis
This report measures monthly, annual, and 3-year poverty rates over the period from January 2005 to December 2007 and January 2009 to December 2011. For each time period, analyses include only respondents with a valid weight and who are within the poverty universe for the entirety of a given reference period.40 The poverty uni-verse excludes unrelated children 14 years old or younger.
This report has certain sample restrictions and makes certain
38 See Robert E. Fay and George F. Train. “Aspects of Survey and Model-Based Postcen-sal Estimation of Income and Poverty Charac-teristics for States and Counties,” Proceedings of the Section on Government Statistics, American Statistical Association, Alexandria, VA 1995, pp. 154–159.
39 See Kirk M. Wolter, (1985), Introduction to Variance Estimation. New York: Springer-Verlag.
40 For more details see the Source and Accuracy Statements: <www.census.gov/sipp/sourceac /S&A08_W1toW11(S&A-16).pdf> and <www.census.gov/sipp/sourceac /S&A08_PLA_W1toW8(S&A-15).pdf>.
assumptions about the stability of demographic characteristics within a SIPP Panel. In both the 2004 and 2008 Panel, reported demographic characteristics were used, even if they varied from initial reports. A small number of observations had varying sex, race, and Hispanic- origin characteristics across the panel. Of those individuals in the poverty universe with a valid interview status for all 36 months of the reference period, less than 1 percent of all observations had race, sex, or Hispanic-origin reports that varied across waves in either the 2004 or 2008 Panel. Using weighted estimates in the 2008 Panel, 2.4 million people had race vary by wave; about 597,000 people had sex vary by wave; and 1.4 million people had Hispanic origin vary by wave. Estimates in this report hold demographic char-acteristics constant to the value reported at the beginning of the relevant time period.
Censoring and Spell Analysis
Text Box 2 describes the defini-tion of poverty spells used in this report. Poverty spells may be left or right-censored. An individual’s poverty spell may be in progress before January 2009 (left-censored) or in progress in December 2011 (right-censored). This analysis used the life table method in the SAS software to include right-censored spells in the estimates of median spell lengths and the duration of poverty spells. The life table method assumes right-censored spells are censored at the midpoint of each interval and the effec-tive sample size of each interval includes only half of the right-censored spells included in the interval. The analysis in this report excludes left-censored spells, since the start time for these spells can-not be determined and few statisti-cal programs and methods have
been developed to correct for left censoring. 41 Approximately 28.4 percent of poverty spells were left-censored over the 2009 to 2011 period, while 29.5 percent of spells occurring over the period of 2005 to 2007 were left-censored. By excluding left-censored spells, systematic bias may be introduced into the median spell and duration analyses.42
The conditional probability of exiting a spell in a month is calculated as
The conditional probability of exiting a spell in a month is calculated as
=
where is the number of poverty spells ending in in month and is the number of spells that
were in progress at the beginning of month minus half of the spells that were right censored in
the month. The survival rate in month is then calculated as
=∏
where is equal to the probability of a poverty spell lasting to month or beyond. Previous
reports in the P70 Dynamics of Economic Well-Being Series defined the survivor rate as
=∏
Where was equal to the probability of a poverty spell lasting longer than month . This
change in the calculation and interpretation of survival rates alters the calculation of median
poverty spell length, defined as
such that is greater than or equal to 50 percent and is less than 50 percent. This
change in the calculation of survival rate can be interpreted as calculating median spell length
including the first month in poverty, while previous estimates of median spell length in the P70
Dynamics of Economic Well-Being series were calculated after a spell had already lasted one
month. Given these differences, estimates of median spell length presented in this report are not
comparable with estimates of median spell length reported in previous P70 Dynamics of
Economic Well-Being series. This change does not impact estimates of the frequencies of spell
durations, which are calculated consistent with previous reports in the P70 Dynamics of
Economic Well-Being series.
where dt is the number of poverty spells ending in month t and Tt is the number of spells that were in progress at the beginning of month t minus half of the spells that were right censored in the month. The survival rate in month t is then calculated as
The conditional probability of exiting a spell in a month is calculated as
=
where is the number of poverty spells ending in in month and is the number of spells that
were in progress at the beginning of month minus half of the spells that were right censored in
the month. The survival rate in month is then calculated as
=∏
where is equal to the probability of a poverty spell lasting to month or beyond. Previous
reports in the P70 Dynamics of Economic Well-Being Series defined the survivor rate as
=∏
Where was equal to the probability of a poverty spell lasting longer than month . This
change in the calculation and interpretation of survival rates alters the calculation of median
poverty spell length, defined as
such that is greater than or equal to 50 percent and is less than 50 percent. This
change in the calculation of survival rate can be interpreted as calculating median spell length
including the first month in poverty, while previous estimates of median spell length in the P70
Dynamics of Economic Well-Being series were calculated after a spell had already lasted one
month. Given these differences, estimates of median spell length presented in this report are not
comparable with estimates of median spell length reported in previous P70 Dynamics of
Economic Well-Being series. This change does not impact estimates of the frequencies of spell
durations, which are calculated consistent with previous reports in the P70 Dynamics of
Economic Well-Being series.
where is equal to the probabil-ity of a poverty spell lasting to month t or beyond. Previous reports in the P70 Dynamics of Economic Well-Being series defined the survivor rate as
The conditional probability of exiting a spell in a month is calculated as
=
where is the number of poverty spells ending in in month and is the number of spells that
were in progress at the beginning of month minus half of the spells that were right censored in
the month. The survival rate in month is then calculated as
=∏
where is equal to the probability of a poverty spell lasting to month or beyond. Previous
reports in the P70 Dynamics of Economic Well-Being Series defined the survivor rate as
=∏
Where was equal to the probability of a poverty spell lasting longer than month . This
change in the calculation and interpretation of survival rates alters the calculation of median
poverty spell length, defined as
such that is greater than or equal to 50 percent and is less than 50 percent. This
change in the calculation of survival rate can be interpreted as calculating median spell length
including the first month in poverty, while previous estimates of median spell length in the P70
Dynamics of Economic Well-Being series were calculated after a spell had already lasted one
month. Given these differences, estimates of median spell length presented in this report are not
comparable with estimates of median spell length reported in previous P70 Dynamics of
Economic Well-Being series. This change does not impact estimates of the frequencies of spell
durations, which are calculated consistent with previous reports in the P70 Dynamics of
Economic Well-Being series.
where was equal to the prob-ability of a poverty spell lasting longer than month t. This change in the calculation and interpretation of
41 See Paul D Allison, Survival Analysis Using the SAS System: A Practical Guide, Cary, NC: SAS Inc, 1995, pp. 292.
42 A variety of papers discuss how left censoring may bias duration analysis and suggest potential corrections. Guang Guo, “Event History Analysis and Left-Truncated Data,” in P. Marsden (Ed.), Sociological Meth-odology, Vol. 23, San Francisco: Jossey-Bass, 1993, pp. 217–242. David W. Hosmer and Stanley Lemeshow, Applied Survival Analysis: Regression Modeling of Time to Event Data, New York: Wiley, 1999. John Iceland, “The Dynamics of Poverty Spells and Issues of Left Censoring,” PCS Research Report Series: No. 97-378, 1997.
The conditional probability of exiting a spell in a month is calculated as
=
where is the number of poverty spells ending in in month and is the number of spells that
were in progress at the beginning of month minus half of the spells that were right censored in
the month. The survival rate in month is then calculated as
=∏
where is equal to the probability of a poverty spell lasting to month or beyond. Previous
reports in the P70 Dynamics of Economic Well-Being Series defined the survivor rate as
=∏
Where was equal to the probability of a poverty spell lasting longer than month . This
change in the calculation and interpretation of survival rates alters the calculation of median
poverty spell length, defined as
such that is greater than or equal to 50 percent and is less than 50 percent. This
change in the calculation of survival rate can be interpreted as calculating median spell length
including the first month in poverty, while previous estimates of median spell length in the P70
Dynamics of Economic Well-Being series were calculated after a spell had already lasted one
month. Given these differences, estimates of median spell length presented in this report are not
comparable with estimates of median spell length reported in previous P70 Dynamics of
Economic Well-Being series. This change does not impact estimates of the frequencies of spell
durations, which are calculated consistent with previous reports in the P70 Dynamics of
Economic Well-Being series.

U.S. Census Bureau 17
survival rates alters the calculation of median poverty spell length, defined as
The conditional probability of exiting a spell in a month is calculated as
=
where is the number of poverty spells ending in in month and is the number of spells that
were in progress at the beginning of month minus half of the spells that were right censored in
the month. The survival rate in month is then calculated as
=∏
where is equal to the probability of a poverty spell lasting to month or beyond. Previous
reports in the P70 Dynamics of Economic Well-Being Series defined the survivor rate as
=∏
Where was equal to the probability of a poverty spell lasting longer than month . This
change in the calculation and interpretation of survival rates alters the calculation of median
poverty spell length, defined as
such that is greater than or equal to 50 percent and is less than 50 percent. This
change in the calculation of survival rate can be interpreted as calculating median spell length
including the first month in poverty, while previous estimates of median spell length in the P70
Dynamics of Economic Well-Being series were calculated after a spell had already lasted one
month. Given these differences, estimates of median spell length presented in this report are not
comparable with estimates of median spell length reported in previous P70 Dynamics of
Economic Well-Being series. This change does not impact estimates of the frequencies of spell
durations, which are calculated consistent with previous reports in the P70 Dynamics of
Economic Well-Being series.
such that S(t) is greater than or equal to 50 percent and S(t+1) is less than 50 percent. This change in the calculation of survival rate can be interpreted as calculating median spell length including the first month in poverty, while previous estimates of median spell length in the P70 Dynamics of Economic Well-Being series were calculated after a spell had already lasted one month. Given these differences, estimates of median spell length presented in this report are not comparable with estimates of median spell length reported in previous P70 Dynamics of Eco-nomic Well-Being series. This change does not impact estimates of the frequencies of spell dura-tions, which are calculated consis-tently with previous reports in the
P70 Dynamics of Economic Well-Being series.
Changes in the Reporting and Processing of Social Security Income in the 2004 Panel
The U.S. Census Bureau changed the way it collected and edited social security income between the 2001 and 2004 SIPP Panels. In the 2004 Panel, the instrument was supposed to collect Medicare Part B premium amounts so that they could be added to net social security income to calculate gross social security income. However, there were errors in both the instru-ment and the processing of social security data in the 2004 Panel.
In order to correct for the instru-ment errors, the social security data were re-edited to randomly assign a fixed Medicare Part B premium amount to respondents in the universe (65 years and over or disabled). The allocation rule was implemented for each wave independent of the prior wave response. This resulted in some
individuals being allocated a Part B premium in one wave but not nec-essarily being allocated a premium amount in subsequent waves. Over the duration of the 2004 SIPP Panel, monthly social security amounts for some individuals, families, and households may fluctuate by the fixed dollar amount of the Medicare Part B premium.43
SUGGESTED CITATION
Edwards, Ashley N., “Dynamics of Economic Well-Being: Poverty, 2009–2011,” Current Population Reports, P70-137, U.S. Census Bureau, Washington, DC, 2014.
43 From SIPP 2004 Panel General Income User Note 10, <www.census.gov/sipp /core_content/core_notes/2004General _Income.html>.

18 U.S. Census Bureau
APPEN
DIX
Table
A-1
.A
nn
ual
Povert
y b
y S
ele
cte
d C
hara
cte
risti
cs: 2
00
5 t
o 2
00
7(N
um
ber
s in
thousa
nds)
Cha
ract
eris
tic
2005
120
061
2007
1
Tota
l
In p
over
ty u
sing
ann
ual i
ncom
e an
d th
resh
old
Tota
l
In p
over
ty u
sing
ann
ual i
ncom
e an
d th
resh
old
Tota
l
In p
over
ty u
sing
ann
ual i
ncom
e an
d th
resh
old
Num
ber
90
perc
ent
C.I.
2 (±
)P
erce
nt
90
perc
ent
C.I.
2 (±
)N
umbe
r
90
perc
ent
C.I.
2 (±
)P
erce
nt
90
perc
ent
C.I.
2 (±
)N
umbe
r
90
perc
ent
C.I.
2 (±
)P
erce
nt
90
perc
ent
C.I.
2 (±
)
All
peo
ple
. . .
. . . .
. . . .
. . . .
285,
073
30,9
4996
410
.90 .
328
7,29
929
,941
1,37
010
.40 .
529
1,82
633
,036
1,65
011
.30 .
6
Rac
e an
d H
isp
anic
Ori
gin
Whi
te3 .
....
....
....
....
....
....
229,
484
20,4
1786
98.
90.
423
1,21
019
,798
1,10
68.
60.
523
4,01
222
,077
1,33
99.
40.
6
Whi
te, n
on-H
ispa
nic4
...
....
....
.19
2,26
413
,100
622
6.8
0.3
192,
755
12,3
3082
26.
40.
419
3,66
213
,421
902
6.9
0.5
Bla
ck3 .
....
....
....
....
....
....
.35
,751
8,08
445
722
.61.
335
,828
7,56
068
221
.11.
936
,635
8,19
867
522
.41.
8
His
pani
c4 ..
....
....
....
....
....
.40
,269
7,84
155
419
.51.
441
,733
7,99
770
119
.21.
743
,701
9,13
994
720
.92.
2N
on-H
ispa
nic
....
....
....
....
....
244,
804
23,1
0876
19.
40.
324
5,56
621
,944
1,14
78.
90.
524
8,12
423
,898
1,25
99.
60.
5
Ag
eU
nder
18
year
s .
....
....
....
....
.72
,432
12,0
1149
816
.60.
772
,373
11,5
7571
516
.01.
072
,686
12,5
9784
117
.31.
218
to 6
4 ye
ars
....
....
....
....
...
179,
194
16,6
3758
19.
30.
318
1,29
815
,965
742
8.8
0.4
184,
466
17,8
6191
69.
70.
565
yea
rs a
nd o
ver
....
....
....
....
33,4
472,
300
165
6.9
0.5
33,6
282,
401
234
7.1
0.7
34,6
752,
578
251
7.4
0.7
Fam
ily S
tatu
sIn
mar
ried-
coup
le fa
mili
es .
....
....
.18
4,69
49,
886
751
5.4
0.4
186,
228
9,56
097
15.
10.
518
9,25
210
,915
1,07
75.
80.
6In
fam
ilies
with
a fe
mal
e ho
useh
olde
r, no
hus
band
pre
sent
. . .
. . .
. . .
. . .
. .42
,804
12,2
3566
028
.61.
442
,781
11,6
4478
927
.21.
743
,010
12,1
701,
002
28.3
2.1
In fa
mili
es w
ith a
mal
e ho
useh
olde
r, no
wife
pre
sent
...
....
....
....
..11
,981
1,39
822
911
.71.
811
,849
1,18
227
210
.02.
211
,995
1,75
034
714
.62.
8U
nrel
ated
indi
vidu
als
....
....
....
..45
,594
7,42
933
316
.30.
746
,442
7,55
546
016
.31.
047
,568
8,20
150
917
.21.
1
1 P
anel
and
yea
rly e
stim
ates
are
bas
ed o
n di
ffere
nt s
ampl
es.
The
3-y
ear
pane
l est
imat
es in
clud
e on
ly r
espo
nden
ts in
the
pane
l for
36
mon
ths
whe
reas
cal
enda
r ye
ar e
stim
ates
incl
ude
resp
onde
nts
in s
ampl
e fo
r 12
mon
ths.
The
num
bers
of r
espo
nden
ts in
eac
h sa
mpl
e ar
e as
follo
ws:
25,
371
in th
e 3-
year
pan
el, 7
6,95
3 in
200
5, 3
4,37
2 in
200
6, a
nd 3
4,48
9 in
200
7. In
Wav
e 9
of th
e 20
04 S
IPP
Pan
el, t
he s
urve
y sa
mpl
e w
as c
ut
by a
53
perc
ent s
ampl
e re
duct
ion;
sam
plin
g w
eigh
ts a
djus
t for
this
red
uctio
n. C
alen
dar
mon
ths
Oct
ober
, Nov
embe
r, an
d D
ecem
ber
of 2
007
are
mis
sing
for
som
e ro
tatio
n gr
oups
in th
e 20
04 P
anel
. For
long
itudi
nal
estim
ates
cov
erin
g th
ese
cale
ndar
mon
ths,
a c
arry
forw
ard
impu
tatio
n m
etho
d w
as a
pplie
d. T
his
repo
rt u
ses
the
Suc
cess
ive
Diff
eren
ce R
eplic
atio
n m
etho
d fo
r al
l est
imat
es fr
om th
e 20
04 a
nd 2
008
Pan
el; t
here
fore
, co
nfide
nce
inte
rval
s fo
r es
timat
es fr
om th
e 20
04 P
anel
will
var
y fr
om th
ose
prev
ious
ly p
ublis
hed
in P
70-1
23, “
Dyn
amic
s of
Eco
nom
ic W
ell-B
eing
200
4–20
06.”
2 A
90
perc
ent c
onfid
ence
inte
rval
(C
.I.)
is a
mea
sure
of a
n es
timat
e’s
varia
bilit
y. T
he la
rger
the
confi
denc
e in
terv
al in
rel
atio
n to
the
size
of t
he e
stim
ate,
the
less
rel
iabl
e th
e es
timat
e.
3 F
eder
al s
urve
ys, i
nclu
ding
the
SIP
P 2
004
and
2008
Pan
el, g
ive
resp
onde
nts
the
optio
n of
rep
ortin
g m
ore
than
one
rac
e. T
hese
dat
a ca
n be
sho
wn
in tw
o w
ays:
(1)
as
mut
ually
exc
lusi
ve fr
om o
ther
rac
e gr
oups
, w
hich
may
be
deno
ted
by “
alon
e” o
r (2
) no
t mut
ually
exc
lusi
ve w
ith o
ther
rac
e gr
oups
, den
oted
by
“alo
ne o
r in
com
bina
tion
with
oth
er r
ace
grou
ps.”
The
figu
res,
tabl
es, a
nd te
xt in
this
rep
ort s
how
rac
e us
ing
the
first
m
etho
d.4
His
pani
cs m
ay b
e an
y ra
ce, d
ata
in th
is r
epor
t for
His
pani
cs o
verla
p da
ta fo
r ra
cial
gro
ups.
Dat
a us
ers
shou
ld e
xerc
ise
caut
ion
whe
n in
terp
retin
g ag
greg
ate
resu
lts fo
r th
ese
grou
ps b
ecau
se th
ey c
onsi
st o
f man
y di
stin
ct s
ubgr
oups
that
diff
er in
soc
ioec
onom
ic c
hara
cter
istic
s, c
ultu
re, a
nd r
ecen
cy o
f im
mig
ratio
n.S
ourc
e: U
.S. C
ensu
s B
urea
u, S
urve
y of
Inco
me
and
Pro
gram
Par
ticip
atio
n, 2
004
Pan
el. F
or in
form
atio
n on
con
fiden
tialit
y pr
otec
tion
and
sam
plin
g an
d no
nsam
plin
g er
ror,
see
<w
ww
.cen
sus.
gov/
sipp
/sou
rce.
htm
l>.

U.S. Census Bureau 19
Table
A-2
.A
nn
ual
Povert
y b
y S
ele
cte
d C
hara
cte
risti
cs: 2
00
9 t
o 2
01
1(N
um
ber
s in
thousa
nds)
Cha
ract
eris
tic
2009
120
101
2011
1
Tota
l
In p
over
ty u
sing
ann
ual i
ncom
e an
d th
resh
old
Tota
l
In p
over
ty u
sing
ann
ual i
ncom
e an
d th
resh
old
Tota
l
In p
over
ty u
sing
ann
ual i
ncom
e an
d th
resh
old
Num
ber
90
perc
ent
C.I.
2 (±
)P
erce
nt
90
perc
ent
C.I.
2 (±
)N
umbe
r
90
perc
ent
C.I.
2 (±
)P
erce
nt
90
perc
ent
C.I.
2 (±
)N
umbe
r
90
perc
ent
C.I.
2 (±
)P
erce
nt
90
perc
ent
C.I.
2 (±
)
All
peo
ple
. . .
. . . .
. . . .
. .29
4,34
538
,796
1,16
813
.20 .
429
7,53
140
,559
1,31
513
.60 .
429
9,90
942
,028
1,38
814
.00 .
5
Rac
e an
d H
isp
anic
Ori
gin
Whi
te3 .
....
....
....
....
....
..23
5,38
626
,829
979
11.4
0.4
237,
150
27,4
661,
086
11.6
0.5
238,
411
28,4
141,
205
11.9
0.5
W
hite
, non
-His
pani
c4 .
....
....
.19
3,81
017
,126
772
8.8
0.4
194,
507
17,5
2780
19.
00.
419
4,46
418
,144
868
9.3
0.4
Bla
ck3 .
....
....
....
....
....
...
37,1
608,
992
549
24.2
1.5
37,7
659,
721
577
25.7
1.5
38,2
4310
,072
622
26.3
1.6
His
pani
c4 ..
....
....
....
....
...
45,6
6811
,042
668
24.2
1.4
47,0
8811
,393
698
24.2
1.5
48,4
5311
,747
793
24.2
1.6
Non
-His
pani
c ..
....
....
....
....
248,
676
27,7
541,
013
11.2
0.4
250,
443
29,1
661,
072
11.6
0.4
251,
456
30,2
801,
097
12.0
0.4
Ag
eU
nder
18
year
s .
....
....
....
...
72,8
3914
,712
611
20.2
0.8
73,4
3015
,430
640
21.0
0.9
73,4
2715
,559
657
21.2
0.9
18 to
64
year
s ..
....
....
....
...
185,
279
21,9
1466
311
.80.
418
7,25
122
,874
773
12.2
0.4
188,
552
23,8
8387
812
.70.
565
yea
rs a
nd o
ver
....
....
....
..36
,227
2,17
018
96.
00.
536
,850
2,25
519
16.
10.
537
,931
2,58
619
76.
80.
5
Fam
ily S
tatu
sIn
mar
ried-
coup
le fa
mili
es .
....
...
185,
951
13,3
6681
87.
20.
418
8,22
614
,097
918
7.5
0.5
189,
070
14,9
9995
27.
90.
5In
fam
ilies
with
a fe
mal
e ho
use-
hold
er, n
o hu
sban
d pr
esen
t ...
...
44,5
5513
,938
705
31.3
1.5
45,0
6414
,344
738
31.8
1.6
45,9
6414
,812
785
32.2
1.5
In fa
mili
es w
ith a
mal
e ho
useh
olde
r, no
wife
pre
sent
...
....
....
....
13,7
642,
056
290
14.9
2.0
14,1
862,
277
298
16.0
2.0
14,3
952,
291
314
15.9
2.0
Unr
elat
ed in
divi
dual
s ..
....
....
..50
,075
9,43
634
318
.80.
750
,055
9,84
240
119
.70.
850
,480
9,92
542
919
.70.
8
1 P
anel
and
yea
rly e
stim
ates
are
bas
ed o
n di
ffere
nt s
ampl
es.
The
3-y
ear
pane
l est
imat
es in
clud
e on
ly r
espo
nden
ts in
the
pane
l for
36
mon
ths
whe
reas
cal
enda
r ye
ar e
stim
ates
incl
ude
resp
onde
nts
in s
ampl
e fo
r 12
mon
ths.
The
num
bers
of r
espo
nden
ts in
eac
h sa
mpl
e ar
e as
follo
ws:
48,
937
in th
e 3-
year
pan
el, 7
3,69
5 in
200
9, 6
7,45
2 in
201
0, a
nd 6
2,84
1 in
201
1.
2 A
90
perc
ent c
onfid
ence
inte
rval
(C
.I.)
is a
mea
sure
of a
n es
timat
e’s
varia
bilit
y. T
he la
rger
the
confi
denc
e in
terv
al in
rel
atio
n to
the
size
of t
he e
stim
ate,
the
less
rel
iabl
e th
e es
timat
e.
3 F
eder
al s
urve
ys, i
nclu
ding
the
SIP
P 2
004
and
2008
Pan
el, g
ive
resp
onde
nts
the
optio
n of
rep
ortin
g m
ore
than
one
rac
e. T
hese
dat
a ca
n be
sho
wn
in tw
o w
ays:
(1)
as
mut
ually
exc
lusi
ve fr
om o
ther
rac
e gr
oups
, w
hich
may
be
deno
ted
by “
alon
e” o
r (2
) no
t mut
ually
exc
lusi
ve w
ith o
ther
rac
e gr
oups
, den
oted
by
“alo
ne o
r in
com
bina
tion
with
oth
er r
ace
grou
ps.”
The
figu
res,
tabl
es, a
nd te
xt in
this
rep
ort s
how
rac
e us
ing
the
first
m
etho
d.4
His
pani
cs m
ay b
e an
y ra
ce, d
ata
in th
is r
epor
t for
His
pani
cs o
verla
p da
ta fo
r ra
cial
gro
ups.
Dat
a us
ers
shou
ld e
xerc
ise
caut
ion
whe
n in
terp
retin
g ag
greg
ate
resu
lts fo
r th
ese
grou
ps b
ecau
se th
ey c
onsi
st o
f man
y di
stin
ct s
ubgr
oups
that
diff
er in
soc
ioec
onom
ic c
hara
cter
istic
s, c
ultu
re, a
nd r
ecen
cy o
f im
mig
ratio
n.S
ourc
e: U
.S. C
ensu
s B
urea
u, S
urve
y of
Inco
me
and
Pro
gram
Par
ticip
atio
n, 2
008
Pan
el. F
or in
form
atio
n on
con
fiden
tialit
y pr
otec
tion
and
sam
plin
g an
d no
nsam
plin
g er
ror,
see
<w
ww
.cen
sus.
gov/
sipp
/sou
rce.
htm
l>.

20 U.S. Census Bureau
Table
A-3
.Peop
le i
n P
overt
y 2
or
More
Mon
ths b
y S
ele
cte
d C
hara
cte
risti
cs: 2
00
5 t
o 2
00
7(N
um
ber
s in
thousa
nds)
Cha
ract
eris
tic
3-ye
ar p
anel
(20
05 to
200
7)1
2005
120
061
2007
1
Tota
l
Peo
ple
in p
over
ty 2
or
mor
e m
onth
s
Tota
l
Peo
ple
in p
over
ty 2
or
mor
e m
onth
s
Tota
l
Peo
ple
in p
over
ty 2
or
mor
e m
onth
s
Tota
l
Peo
ple
in p
over
ty 2
or
mor
e m
onth
s
Num
-be
r
90
per-
cent
C
.I.2
(±)
Per
-ce
nt
90
per-
cent
C
.I.2
(±)
Num
-be
r
90
per-
cent
C
.I.2
(±)
Per
-ce
nt
90
per-
cent
C
.I.2
(±)
Num
-be
r
90
per-
cent
C
.I.2
(±)
Per
-ce
nt
90
per-
cent
C
.I.2
(±)
Num
-be
r
90
per-
cent
C
.I.2
(±)
Per
-ce
nt
90
per-
cent
C
.I.2
(±)
All
peo
ple
. . .
. . . .
266,
942
72,3
042,
030
27 .1
0 .7
285,
073
57,7
811,
272
20 .3
0 .4
287,
299
55,8
241,
771
19 .4
0 .6
291,
826
55,8
861,
836
19 .2
0 .6
Rac
e an
d H
isp
anic
Ori
gin
Whi
te3 .
....
....
....
....
215,
709
52,6
981,
802
24.4
0.8
229,
484
41,1
971,
093
18.0
0.5
231,
210
39,4
791,
490
17.1
0.6
234,
012
39,3
341,
561
16.8
0.7
W
hite
, non
-His
pani
c4 .
...
183,
379
38,4
511,
705
21.0
0.9
192,
264
29,1
8288
015
.20.
519
2,75
527
,142
1,23
114
.10.
619
3,66
226
,170
1,15
013
.50.
6B
lack
3 ...
....
....
....
...
33,2
3113
,962
867
42.0
2.6
35,7
5112
,027
563
33.6
1.6
35,8
2811
,883
794
33.2
2.2
36,6
3511
,720
820
32.0
2.2
His
pani
c4 ..
....
....
....
.34
,968
15,3
1293
143
.82.
640
,269
13,0
7563
632
.51.
641
,733
13,3
4690
132
.02.
243
,701
14,0
101,
007
32.1
2.3
Non
-His
pani
c ..
....
....
..23
1,97
356
,992
1,88
624
.60.
824
4,80
444
,705
1,06
218
.30.
424
5,56
642
,478
1,58
017
.30.
624
8,12
441
,876
1,49
816
.90.
6
Ag
eU
nder
18
year
s .
....
....
.66
,497
23,0
661,
012
34.7
1.4
72,4
3219
,973
623
27.6
0.9
72,3
7319
,211
874
26.5
1.2
72,6
8619
,556
890
26.9
1.2
18 to
64
year
s ..
....
....
.16
9,75
844
,060
1,30
426
.00.
717
9,19
434
,003
767
19.0
0.4
181,
298
32,6
881,
057
18.0
0.6
184,
466
32,4
601,
165
17.6
0.6
65 y
ears
and
ove
r ..
....
..30
,686
5,17
738
416
.91.
233
,447
3,80
522
011
.40.
733
,628
3,92
630
411
.70.
934
,675
3,86
926
611
.20.
8
Fam
ily S
tatu
sIn
mar
ried-
coup
le fa
mili
es .
.17
8,46
734
,384
1,76
719
.31.
018
4,69
424
,339
1,03
813
.20.
618
6,22
822
,847
1,29
312
.30.
718
9,25
222
,750
1,39
412
.00.
7In
fam
ilies
with
a fe
mal
e ho
useh
olde
r, no
hus
band
pr
esen
t ..
....
....
....
.38
,212
19,3
551,
042
50.7
2.3
42,8
0417
,584
761
41.1
1.4
42,7
8117
,478
981
40.9
1.9
43,0
1017
,185
1,02
940
.02.
1In
fam
ilies
with
a m
ale
hous
ehol
der,
no w
ife
pres
ent
....
....
....
...
9,79
93,
417
482
34.9
4.3
11,9
812,
906
321
24.3
2.5
11,8
492,
544
386
21.5
3.0
11,9
952,
937
439
24.5
3.4
Unr
elat
ed in
divi
dual
s ..
....
40,4
6415
,147
670
37.4
1.5
45,5
9412
,952
416
28.4
0.9
46,4
4212
,955
587
27.9
1.2
47,5
6813
,013
607
27.4
1.2
1 P
anel
and
yea
rly e
stim
ates
are
bas
ed o
n di
ffere
nt s
ampl
es.
The
3-y
ear
pane
l est
imat
es in
clud
e on
ly r
espo
nden
ts in
the
pane
l for
36
mon
ths
whe
reas
cal
enda
r ye
ar e
stim
ates
incl
ude
resp
onde
nts
in s
ampl
e fo
r 12
mon
ths.
The
num
bers
of r
espo
nden
ts in
eac
h sa
mpl
e ar
e as
follo
ws:
25,
371
in th
e 3-
year
pan
el, 7
6,95
3 in
200
5, 3
4,37
2 in
200
6, a
nd 3
4,48
9 in
200
7. In
Wav
e 9
of th
e 20
04 S
IPP
Pan
el, t
he s
urve
y sa
mpl
e w
as
cut b
y a
53 p
erce
nt s
ampl
e re
duct
ion;
sam
plin
g w
eigh
ts a
djus
t for
this
red
uctio
n. C
alen
dar
mon
ths
Oct
ober
, Nov
embe
r, an
d D
ecem
ber
of 2
007
are
mis
sing
for
som
e ro
tatio
n gr
oups
in th
e 20
04 P
anel
. For
long
itudi
nal
estim
ates
cov
erin
g th
ese
cale
ndar
mon
ths,
a c
arry
forw
ard
impu
tatio
n m
etho
d w
as a
pplie
d. T
his
repo
rt u
ses
the
Suc
cess
ive
Diff
eren
ce R
eplic
atio
n m
etho
d fo
r al
l est
imat
es fr
om th
e 20
04 a
nd 2
008
Pan
el; t
here
fore
, co
nfide
nce
inte
rval
s fo
r es
timat
es fr
om th
e 20
04 P
anel
will
var
y fr
om th
ose
prev
ious
ly p
ublis
hed
in P
70-1
23, “
Dyn
amic
s of
Eco
nom
ic W
ell-B
eing
200
4–20
06.”
2 A
90
perc
ent c
onfid
ence
inte
rval
(C
.I.)
is a
mea
sure
of a
n es
timat
e’s
varia
bilit
y. T
he la
rger
the
confi
denc
e in
terv
al in
rel
atio
n to
the
size
of t
he e
stim
ate,
the
less
rel
iabl
e th
e es
timat
e.
3 F
eder
al s
urve
ys, i
nclu
ding
the
SIP
P 2
004
and
2008
Pan
el, g
ive
resp
onde
nts
the
optio
n of
rep
ortin
g m
ore
than
one
rac
e. T
hese
dat
a ca
n be
sho
wn
in tw
o w
ays:
(1)
as
mut
ually
exc
lusi
ve fr
om o
ther
rac
e gr
oups
, w
hich
may
be
deno
ted
by “
alon
e” o
r (2
) no
t mut
ually
exc
lusi
ve w
ith o
ther
rac
e gr
oups
, den
oted
by
“alo
ne o
r in
com
bina
tion
with
oth
er r
ace
grou
ps.”
The
figu
res,
tabl
es, a
nd te
xt in
this
rep
ort s
how
rac
e us
ing
the
first
m
etho
d.4
His
pani
cs m
ay b
e an
y ra
ce, d
ata
in th
is r
epor
t for
His
pani
cs o
verla
p da
ta fo
r ra
cial
gro
ups.
Dat
a us
ers
shou
ld e
xerc
ise
caut
ion
whe
n in
terp
retin
g ag
greg
ate
resu
lts fo
r th
ese
grou
ps b
ecau
se th
ey c
onsi
st o
f man
y di
stin
ct s
ubgr
oups
that
diff
er in
soc
ioec
onom
ic c
hara
cter
istic
s, c
ultu
re, a
nd r
ecen
cy o
f im
mig
ratio
n.S
ourc
e: U
.S. C
ensu
s B
urea
u, S
urve
y of
Inco
me
and
Pro
gram
Par
ticip
atio
n, 2
004
Pan
el. F
or in
form
atio
n on
con
fiden
tialit
y pr
otec
tion
and
sam
plin
g an
d no
nsam
plin
g er
ror,
see
<w
ww
.cen
sus.
gov/
sipp
/sou
rce.
htm
l>.

U.S. Census Bureau 21
Table
A-4
.Peop
le i
n P
overt
y 2
or
More
Mon
ths b
y S
ele
cte
d C
hara
cte
risti
cs: 2
00
9 t
o 2
01
1(N
um
ber
s in
thousa
nds)
Cha
ract
eris
tic
3-ye
ar p
anel
(20
09 to
201
1)1
2009
120
101
2011
1
Tota
l
Peo
ple
in p
over
ty 2
or
mor
e m
onth
s
Tota
l
Peo
ple
in p
over
ty 2
or
mor
e m
onth
s
Tota
l
Peo
ple
in p
over
ty 2
or
mor
e m
onth
s
Tota
l
Peo
ple
in p
over
ty 2
or
mor
e m
onth
s
Num
-be
r
90
per-
cent
C
.I.2
(±)
Per
-ce
nt
90
per-
cent
C
.I.2
(±)
Num
-be
r
90
per-
cent
C
.I.2
(±)
Per
-ce
nt
90
per-
cent
C
.I.2
(±)
Num
-be
r
90
per-
cent
C
.I.2
(±)
Per
-ce
nt
90
per-
cent
C
.I.2
(±)
Num
-be
r
90
per-
cent
C
.I.2
(±)
Per
-ce
nt
90
per-
cent
C
.I.2
(±)
All
peo
ple
. . .
. . . .
283,
065
89,5
551,
809
31 .6
0 .6
294,
345
67,7
631,
330
23 .0
0 .4
297,
531
69,0
721,
549
23 .2
0 .5
299,
909
70,8
621,
621
23 .6
0 .5
Rac
e an
d H
isp
anic
Ori
gin
Whi
te3 .
....
....
....
....
226,
611
66,6
971,
670
29.4
0.7
235,
386
49,3
201,
181
21.0
0.5
237,
150
49,8
141,
381
21.0
0.6
238,
411
51,1
521,
336
21.5
0.6
W
hite
, non
-His
pani
c4 .
...
187,
449
47,5
871,
372
25.4
0.7
193,
810
33,4
8397
117
.30.
519
4,50
733
,902
1,07
117
.40.
619
4,46
434
,625
1,09
617
.80.
6B
lack
3 ...
....
....
....
...
35,7
1816
,182
732
45.3
2.0
37,1
6013
,262
564
35.7
1.5
37,7
6513
,585
648
36.0
1.7
38,2
4313
,837
674
36.2
1.7
His
pani
c4 ..
....
....
....
.42
,786
21,2
1086
649
.61.
945
,668
17,8
1880
639
.01.
747
,088
17,9
4188
538
.11.
848
,453
18,5
4082
338
.31.
7N
on-H
ispa
nic
....
....
....
240,
279
68,3
451,
590
28.4
0.7
248,
676
49,9
451,
171
20.1
0.5
250,
443
51,1
311,
226
20.4
0.5
251,
456
52,3
221,
379
20.8
0.5
Ag
eU
nder
18
year
s .
....
....
.71
,350
28,9
7480
540
.61.
172
,839
23,0
5465
831
.70.
973
,430
23,5
6371
132
.11.
073
,427
23,7
1475
732
.31.
018
to 6
4 ye
ars
....
....
...
178,
961
55,4
391,
224
31.0
0.7
185,
279
40,8
3886
222
.00.
518
7,25
141
,730
990
22.3
0.5
188,
552
42,9
751,
046
22.8
0.6
65 y
ears
and
ove
r ..
....
..32
,753
5,14
228
915
.70.
936
,227
3,87
120
810
.70.
636
,850
3,77
923
010
.30.
637
,931
4,17
324
511
.00.
6
Fam
ily S
tatu
sIn
mar
ried-
coup
le fa
mili
es .
.18
1,11
242
,824
1,43
123
.60.
818
5,95
128
,511
1,03
815
.30.
518
8,22
629
,168
1,20
015
.50.
618
9,07
030
,508
1,20
416
.10.
6In
fam
ilies
with
a fe
mal
e ho
useh
olde
r, no
hus
band
pr
esen
t ..
....
....
....
.42
,183
22,4
0083
453
.11.
844
,555
19,4
0867
743
.61.
445
,064
20,1
0479
544
.61.
745
,964
20,3
3982
844
.31.
6In
fam
ilies
with
a m
ale
hous
ehol
der,
no w
ife
pre
sent
...
....
....
....
12,7
625,
232
491
41.0
3.0
13,7
644,
167
392
30.3
2.4
14,1
863,
988
357
28.1
2.3
14,3
954,
108
413
28.5
2.5
Unr
elat
ed in
divi
dual
s ..
....
47,0
0719
,099
587
40.6
1.2
50,0
7515
,677
398
31.3
0.8
50,0
5515
,812
450
31.6
0.8
50,4
8015
,906
444
31.5
0.9
1 P
anel
and
yea
rly e
stim
ates
are
bas
ed o
n di
ffere
nt s
ampl
es.
The
3-y
ear
pane
l est
imat
es in
clud
e on
ly r
espo
nden
ts in
the
pane
l for
36
mon
ths
whe
reas
cal
enda
r ye
ar e
stim
ates
incl
ude
resp
onde
nts
in s
ampl
e fo
r 12
mon
ths.
The
num
bers
of r
espo
nden
ts in
eac
h sa
mpl
e ar
e as
follo
ws:
48,
937
in th
e 3-
year
pan
el, 7
3,69
5 in
200
9, 6
7,45
2 in
201
0, a
nd 6
2,84
1 in
201
1.2
A 9
0 pe
rcen
t con
fiden
ce in
terv
al (
C.I.
) is
a m
easu
re o
f an
estim
ate’
s va
riabi
lity.
The
larg
er th
e co
nfide
nce
inte
rval
in r
elat
ion
to th
e si
ze o
f the
est
imat
e, th
e le
ss r
elia
ble
the
estim
ate.
3
Fed
eral
sur
veys
, inc
ludi
ng th
e S
IPP
200
4 an
d 20
08 P
anel
, giv
e re
spon
dent
s th
e op
tion
of r
epor
ting
mor
e th
an o
ne r
ace.
The
se d
ata
can
be s
how
n in
two
way
s: (
1) a
s m
utua
lly e
xclu
sive
from
oth
er r
ace
grou
ps,
whi
ch m
ay b
e de
note
d by
“al
one”
or
(2)
not m
utua
lly e
xclu
sive
with
oth
er r
ace
grou
ps, d
enot
ed b
y “a
lone
or
in c
ombi
natio
n w
ith o
ther
rac
e gr
oups
.” T
he fi
gure
s, ta
bles
, and
text
in th
is r
epor
t sho
w r
ace
usin
g th
e fir
st
met
hod.
4 H
ispa
nics
may
be
any
race
, dat
a in
this
rep
ort f
or H
ispa
nics
ove
rlap
data
for
raci
al g
roup
s. D
ata
user
s sh
ould
exe
rcis
e ca
utio
n w
hen
inte
rpre
ting
aggr
egat
e re
sults
for
thes
e gr
oups
bec
ause
they
con
sist
of m
any
dist
inct
sub
grou
ps th
at d
iffer
in s
ocio
econ
omic
cha
ract
eris
tics,
cul
ture
, and
rec
ency
of i
mm
igra
tion.
Sou
rce:
U.S
. Cen
sus
Bur
eau,
Sur
vey
of In
com
e an
d P
rogr
am P
artic
ipat
ion,
200
8 P
anel
. For
info
rmat
ion
on c
onfid
entia
lity
prot
ectio
n an
d sa
mpl
ing
and
nons
ampl
ing
erro
r, se
e <
ww
w.c
ensu
s.go
v/si
pp/s
ourc
e.ht
ml>
.

22 U.S. Census Bureau
Table
A-5
.Peop
le i
n P
overt
y A
ll M
on
ths b
y S
ele
cte
d C
hara
cte
risti
cs: 2
00
5 t
o 2
00
7(N
um
ber
s in
thousa
nds)
Cha
ract
eris
tic
3-ye
ar p
anel
(20
05 to
200
7)1
2005
120
061
2007
1
Tota
l
Peo
ple
in p
over
ty a
ll 36
m
onth
s
Tota
l
Peo
ple
in p
over
ty a
ll 12
m
onth
s
Tota
l
Peo
ple
in p
over
ty a
ll 12
m
onth
s
Tota
l
Peo
ple
in p
over
ty a
ll 12
m
onth
s
Num
-be
r
90
per-
cent
C
.I.2
(±)
Per
-ce
nt
90
per-
cent
C
.I.2
(±)
Num
-be
r
90
per-
cent
C
.I.2
(±)
Per
-ce
nt
90
per-
cent
C
.I.2
(±)
Num
-be
r
90
per-
cent
C
.I.2
(±)
Per
-ce
nt
90
per-
cent
C
.I.2
(±)
Num
-be
r
90
per-
cent
C
.I.2
(±)
Per
-ce
nt
90
per-
cent
C
.I.2
(±)
All
peo
ple
. . .
. . . .
266,
942
8,07
488
23 .
00 .
328
5,07
317
,010
709
6 .0
0 .2
287,
299
17,9
091,
060
6 .2
0 .4
291,
826
20,9
061,
302
7 .2
0 .4
Rac
e an
d H
isp
anic
Ori
gin
Whi
te3 .
....
....
....
....
215,
709
4,60
461
62.
10.
322
9,48
410
,639
627
4.6
0.3
231,
210
11,5
7086
05.
00.
423
4,01
213
,327
1,01
25.
70.
4
Whi
te, n
on-H
ispa
nic4
...
.18
3,37
92,
673
342
1.5
0.2
192,
264
6,73
945
13.
50.
219
2,75
56,
986
597
3.6
0.3
193,
662
8,01
569
04.
10.
4B
lack
3 ...
....
....
....
...
33,2
312,
851
436
8.6
1.3
35,7
514,
947
366
13.8
1.0
35,8
284,
971
522
13.9
1.5
36,6
355,
804
597
15.8
1.6
His
pani
c4 ..
....
....
....
.34
,968
1,96
944
25.
61.
340
,269
4,15
037
310
.30.
941
,733
4,82
459
811
.61.
443
,701
5,57
370
412
.81.
6N
on-H
ispa
nic
....
....
....
231,
973
6,10
466
22.
60.
324
4,80
412
,860
540
5.3
0.2
245,
566
13,0
8585
85.
30.
424
8,12
415
,332
1,04
06.
20.
4
Ag
eU
nder
18
year
s .
....
....
.66
,497
3,25
451
74.
90.
872
,432
6,60
539
19.
10.
572
,373
7,19
560
69.
90.
872
,686
8,01
970
511
.01.
018
to 6
4 ye
ars
...
....
....
169,
758
3,80
842
82.
20.
317
9,19
48,
780
412
4.9
0.2
181,
298
8,97
655
15.
00.
318
4,46
610
,833
720
5.9
0.4
65 y
ears
and
ove
r .
....
...
30,6
861,
012
173
3.3
0.6
33,4
471,
625
133
4.9
0.4
33,6
281,
737
203
5.2
0.6
34,6
752,
053
224
5.9
0.6
Fam
ily S
tatu
sIn
mar
ried-
coup
le fa
mili
es .
.17
8,46
71,
775
496
1.0
0.3
184,
694
4,46
150
92.
40.
318
6,22
84,
767
686
2.6
0.4
189,
252
5,92
779
53.
10.
4In
fam
ilies
with
a fe
mal
e ho
useh
olde
r, no
hus
band
pr
esen
t ..
....
....
....
.38
,212
3,64
156
59.
51.
442
,804
7,23
753
816
.91.
242
,781
7,52
866
617
.61.
543
,010
8,52
087
119
.81.
9In
fam
ilies
with
a m
ale
hous
ehol
der,
no w
ife
pres
ent
....
....
....
...
9,79
926
417
92.
71.
811
,981
730
171
6.1
1.4
11,8
4963
520
05.
41.
611
,995
860
279
7.2
2.3
Unr
elat
ed in
divi
dual
s ..
....
40,4
642,
393
265
5.9
0.7
45,5
944,
581
238
10.0
0.5
46,4
424,
979
387
10.7
0.8
47,5
685,
598
418
11.8
0.9
1 P
anel
and
yea
rly e
stim
ates
are
bas
ed o
n di
ffere
nt s
ampl
es.
The
3-y
ear
pane
l est
imat
es in
clud
e on
ly r
espo
nden
ts in
the
pane
l for
36
mon
ths
whe
reas
cal
enda
r ye
ar e
stim
ates
incl
ude
resp
onde
nts
in s
ampl
e fo
r 12
m
onth
s. T
he n
umbe
rs o
f res
pond
ents
in e
ach
sam
ple
are
as fo
llow
s: 2
5,37
1 in
the
3-ye
ar p
anel
, 76,
953
in 2
005,
34,
372
in 2
006,
and
34,
489
in 2
007.
In W
ave
9 of
the
2004
SIP
P P
anel
, the
sur
vey
sam
ple
was
cut
by
a 53
per
cent
sam
ple
redu
ctio
n; s
ampl
ing
wei
ghts
adj
ust f
or th
is r
educ
tion.
Cal
enda
r m
onth
s O
ctob
er, N
ovem
ber,
and
Dec
embe
r of
200
7 ar
e m
issi
ng fo
r so
me
rota
tion
grou
ps in
the
2004
Pan
el. F
or lo
ngitu
dina
l est
imat
es
cove
ring
thes
e ca
lend
ar m
onth
s, a
car
ry fo
rwar
d im
puta
tion
met
hod
was
app
lied.
Thi
s re
port
use
s th
e S
ucce
ssiv
e D
iffer
ence
Rep
licat
ion
met
hod
for
all e
stim
ates
from
the
2004
and
200
8 P
anel
; the
refo
re, c
onfid
ence
in
terv
als
for
estim
ates
from
the
2004
Pan
el w
ill v
ary
from
thos
e pr
evio
usly
pub
lishe
d in
P70
-123
, “D
ynam
ics
of E
cono
mic
Wel
l-Bei
ng 2
004-
2006
.” 2
A 9
0 pe
rcen
t con
fiden
ce in
terv
al (
C.I.
) is
a m
easu
re o
f an
estim
ate’
s va
riabi
lity.
The
larg
er th
e co
nfide
nce
inte
rval
in r
elat
ion
to th
e si
ze o
f the
est
imat
e, th
e le
ss r
elia
ble
the
estim
ate.
3
Fed
eral
sur
veys
, inc
ludi
ng th
e S
IPP
200
4 an
d 20
08 P
anel
, giv
e re
spon
dent
s th
e op
tion
of r
epor
ting
mor
e th
an o
ne r
ace.
The
se d
ata
can
be s
how
n in
two
way
s: (
1) a
s m
utua
lly e
xclu
sive
from
oth
er r
ace
grou
ps,
whi
ch m
ay b
e de
note
d by
“al
one”
or
(2)
not m
utua
lly e
xclu
sive
with
oth
er r
ace
grou
ps, d
enot
ed b
y “a
lone
or
in c
ombi
natio
n w
ith o
ther
rac
e gr
oups
.” T
he fi
gure
s, ta
bles
, and
text
in th
is r
epor
t sho
w r
ace
usin
g th
e fir
st
met
hod.
4 H
ispa
nics
may
be
any
race
, dat
a in
this
rep
ort f
or H
ispa
nics
ove
rlap
data
for
raci
al g
roup
s. D
ata
user
s sh
ould
exe
rcis
e ca
utio
n w
hen
inte
rpre
ting
aggr
egat
e re
sults
for
thes
e gr
oups
bec
ause
they
con
sist
of m
any
dist
inct
sub
grou
ps th
at d
iffer
in s
ocio
econ
omic
cha
ract
eris
tics,
cul
ture
, and
rec
ency
of i
mm
igra
tion.
Sou
rce:
U.S
. Cen
sus
Bur
eau,
Sur
vey
of In
com
e an
d P
rogr
am P
artic
ipat
ion,
200
4 P
anel
. For
info
rmat
ion
on c
onfid
entia
lity
prot
ectio
n an
d sa
mpl
ing
and
nons
ampl
ing
erro
r, se
e <
ww
w.c
ensu
s.go
v/si
pp/s
ourc
e.ht
ml>
.

U.S. Census Bureau 23
Table
A-6
.Peop
le i
n P
overt
y A
ll M
on
ths b
y S
ele
cte
d C
hara
cte
risti
cs: 2
00
9 t
o 2
01
1(N
um
ber
s in
thousa
nds)
Cha
ract
eris
tic
3-ye
ar p
anel
(20
09 to
201
1)1
2009
120
101
2011
1
Tota
l
Peo
ple
in p
over
ty a
ll 36
m
onth
s
Tota
l
Peo
ple
in p
over
ty a
ll 12
m
onth
s
Tota
l
Peo
ple
in p
over
ty a
ll 12
m
onth
s
Tota
l
Peo
ple
in p
over
ty a
ll 12
m
onth
s
Num
-be
r
90
per-
cent
C
.I.2
(±)
Per
-ce
nt
90
per-
cent
C
.I.2
(±)
Num
-be
r
90
per-
cent
C
.I.2
(±)
Per
-ce
nt
90
per-
cent
C
.I.2
(±)
Num
-be
r
90
per-
cent
C
.I.2
(±)
Per
-ce
nt
90
per-
cent
C
.I.2
(±)
Num
-be
r
90
per-
cent
C
.I.2
(±)
Per
-ce
nt
90
per-
cent
C
.I.2
(±)
All
peo
ple
. . .
. . . .
283,
065
9,92
276
03 .
50 .
329
4,34
521
,351
861
7 .3
0 .3
297,
531
24,0
0197
78 .
10 .
329
9,90
924
,829
1,02
28 .
30 .
3
Rac
e an
d H
isp
anic
Ori
gin
Whi
te3 .
....
....
....
....
226,
611
6,23
562
22.
80.
323
5,38
614
,645
715
6.2
0.3
237,
150
15,6
8478
66.
60.
323
8,41
116
,157
867
6.8
0.4
Whi
te, n
on-H
ispa
nic4 .
....
.18
7,44
93,
796
428
2.0
0.2
193,
810
9,11
754
74.
70.
319
4,50
79,
613
541
4.9
0.3
194,
464
10,0
9663
15.
20.
3B
lack
3 ...
....
....
....
...
35,7
183,
078
461
8.6
1.3
37,1
605,
151
429
13.9
1.1
37,7
656,
212
473
16.4
1.2
38,2
436,
526
546
17.1
1.4
His
pani
c4 ..
....
....
....
.42
,786
2,75
941
86.
41.
045
,668
6,28
952
713
.81.
247
,088
7,11
061
015
.11.
348
,453
6,96
162
914
.41.
3N
on-H
ispa
nic
....
....
....
240,
279
7,16
261
13.
00.
324
8,67
615
,061
717
6.1
0.3
250,
443
16,8
9177
26.
70.
325
1,45
617
,867
857
7.1
0.3
Ag
eU
nder
18
year
s .
....
....
.71
,350
4,21
044
35.
90.
672
,839
8,36
848
511
.50.
773
,430
9,42
451
612
.80.
773
,427
9,46
753
512
.90.
718
to 6
4 ye
ars
....
....
...
178,
961
4,95
040
42.
80.
218
5,27
911
,558
461
6.2
0.2
187,
251
12,9
8555
56.
90.
318
8,55
213
,493
606
7.2
0.3
65 y
ears
and
ove
r ..
....
..32
,753
762
122
2.3
0.4
36,2
271,
424
139
3.9
0.4
36,8
501,
592
147
4.3
0.4
37,9
311,
869
165
4.9
0.4
Fam
ily S
tatu
sIn
mar
ried-
coup
le fa
mili
es .
.18
1,11
22,
546
429
1.4
0.2
185,
951
6,03
552
23.
20.
318
8,22
67,
028
658
3.7
0.3
189,
070
8,01
271
84.
20.
4In
fam
ilies
with
a fe
mal
e ho
useh
olde
r, no
hus
band
pr
esen
t ..
....
....
....
.42
,183
4,24
750
410
.11.
244
,555
8,58
352
119
.31.
145
,064
9,23
064
420
.51.
445
,964
9,27
469
620
.21.
4In
fam
ilies
with
a m
ale
hous
ehol
der,
no w
ife
pres
ent
....
....
....
...
12,7
6243
014
43.
41.
113
,764
905
191
6.6
1.3
14,1
861,
311
220
9.2
1.5
14,3
951,
252
251
8.7
1.7
Unr
elat
ed in
divi
dual
s ..
....
47,0
072,
700
246
5.7
0.5
50,0
755,
828
271
11.6
0.5
50,0
556,
432
315
12.8
0.6
50,4
806,
291
329
12.5
0.6
1 P
anel
and
yea
rly e
stim
ates
are
bas
ed o
n di
ffere
nt s
ampl
es.
The
3-y
ear
pane
l est
imat
es in
clud
e on
ly r
espo
nden
ts in
the
pane
l for
36
mon
ths
whe
reas
cal
enda
r ye
ar e
stim
ates
incl
ude
resp
onde
nts
in s
ampl
e fo
r 12
m
onth
s. T
he n
umbe
rs o
f res
pond
ents
in e
ach
sam
ple
are
as fo
llow
s: 4
8,93
7 in
the
3-ye
ar p
anel
, 73,
695
in 2
009,
67,
452
in 2
010,
and
62,
841
in 2
011.
2 A
90
perc
ent c
onfid
ence
inte
rval
(C
.I.)
is a
mea
sure
of a
n es
timat
e’s
varia
bilit
y. T
he la
rger
the
confi
denc
e in
terv
al in
rel
atio
n to
the
size
of t
he e
stim
ate,
the
less
rel
iabl
e th
e es
timat
e.
3 F
eder
al s
urve
ys, i
nclu
ding
the
SIP
P 2
004
and
2008
Pan
el, g
ive
resp
onde
nts
the
optio
n of
rep
ortin
g m
ore
than
one
rac
e. T
hese
dat
a ca
n be
sho
wn
in tw
o w
ays:
(1)
as
mut
ually
exc
lusi
ve fr
om o
ther
rac
e gr
oups
, w
hich
may
be
deno
ted
by “
alon
e” o
r (2
) no
t mut
ually
exc
lusi
ve w
ith o
ther
rac
e gr
oups
, den
oted
by
“alo
ne o
r in
com
bina
tion
with
oth
er r
ace
grou
ps.”
The
figu
res,
tabl
es, a
nd te
xt in
this
rep
ort s
how
rac
e us
ing
the
first
m
etho
d.4
His
pani
cs m
ay b
e an
y ra
ce, d
ata
in th
is r
epor
t for
His
pani
cs o
verla
p da
ta fo
r ra
cial
gro
ups.
Dat
a us
ers
shou
ld e
xerc
ise
caut
ion
whe
n in
terp
retin
g ag
greg
ate
resu
lts fo
r th
ese
grou
ps b
ecau
se th
ey c
onsi
st o
f man
y di
stin
ct s
ubgr
oups
that
diff
er in
soc
ioec
onom
ic c
hara
cter
istic
s, c
ultu
re, a
nd r
ecen
cy o
f im
mig
ratio
n.S
ourc
e: U
.S. C
ensu
s B
urea
u, S
urve
y of
Inco
me
and
Pro
gram
Par
ticip
atio
n, 2
008
Pan
el. F
or in
form
atio
n on
con
fiden
tialit
y pr
otec
tion
and
sam
plin
g an
d no
nsam
plin
g er
ror,
see
<w
ww
.cen
sus.
gov/
sipp
/sou
rce.
htm
l>.

24 U.S. Census Bureau
Table A-7.Poverty Entries: People Not in Poverty in 2005 by Poverty Status in 2006 and 2007(Numbers in thousands)
CharacteristicNot in
poverty in 20051
In poverty in 20061 In poverty in 20071
Number90 percent
C.I.2 (±) Percent90 percent
C.I.2 (±) Number90 percent
C.I.2 (±) Percent90 percent
C.I.2 (±)
All people . . . . . . . . . . . . . 240,333 6,477 705 2 .7 0 .3 10,205 976 4 .2 0 .4
Race and Hispanic OriginWhite3 . . . . . . . . . . . . . . . . . . . . . . . 198,229 4,705 575 2.4 0.3 7,386 833 3.7 0.4 White, non-Hispanic4 . . . . . . . . . . 172,302 3,370 472 2.0 0.3 5,148 671 3.0 0.4Black3 . . . . . . . . . . . . . . . . . . . . . . . . 26,134 1,164 265 4.5 1.0 1,984 435 7.6 1.6
Hispanic4 . . . . . . . . . . . . . . . . . . . . . 28,271 1,465 318 5.2 1.1 2,365 477 8.4 1.6Non-Hispanic . . . . . . . . . . . . . . . . . . 212,061 5,012 603 2.4 0.3 7,840 829 3.7 0.4
AgeUnder 18 years . . . . . . . . . . . . . . . . 56,395 1,797 320 3.2 0.6 3,280 456 5.8 0.818 to 64 years . . . . . . . . . . . . . . . . . 155,442 4,157 449 2.7 0.3 6,154 575 4.0 0.465 years and over . . . . . . . . . . . . . . 28,496 523 134 1.8 0.5 771 155 2.7 0.5
Family StatusIn married-couple families . . . . . . . . 169,950 2,887 500 1.7 0.3 5,043 726 3.0 0.4In families with a female house-
holder, no husband present . . . . . . 27,550 1,487 326 5.4 1.1 2,373 423 8.6 1.4In families with a male householder,
no wife present . . . . . . . . . . . . . . . 8,932 482 209 5.4 2.3 850 270 9.5 2.9Unrelated individuals . . . . . . . . . . . . 33,900 1,620 232 4.8 0.7 1,939 253 5.7 0.7
1 Uses panel weight. Panel and yearly estimates are based on different samples. The 3-year panel estimates include only respondents in the panel for 36 months whereas calendar year estimates include respondents in sample for 12 months. The numbers of respondents in each sample are as follows: 25,371 in the 3-year panel, 76,953 in 2005, 34,372 in 2006, and 34,489 in 2007. In Wave 9 of the 2004 SIPP Panel, the survey sample was cut by a 53 percent sample reduction; sampling weights adjust for this reduction. Calendar months October, November, and December of 2007 are missing for some rotation groups in the 2004 Panel. For longitudinal estimates covering these calendar months, a carry forward imputation method was applied.
2 A 90 percent confidence interval (C.I.) is a measure of an estimate’s variability. The larger the confidence interval in relation to the size of the estimate, the less reliable the estimate.
3 Federal surveys, including the SIPP 2004 and 2008 Panel, give respondents the option of reporting more than one race. These data can be shown in two ways: (1) as mutually exclusive from other race groups, which may be denoted by “alone” or (2) not mutually exclusive with other race groups, denoted by “alone or in combination with other race groups.” The figures, tables, and text in this report show race using the first method.
4 Hispanics may be any race, data in this report for Hispanics overlap data for racial groups. Data users should exercise caution when interpreting aggregate results for these groups because they consist of many distinct subgroups that differ in socioeconomic characteristics, culture, and recency of immigration.
Source: U.S. Census Bureau, Survey of Income and Program Participation, 2004 Panel. For information on confidentiality protection and sampling and nonsam-pling error, see <www.census.gov/sipp/source.html>.

U.S. Census Bureau 25
Table A-8.Poverty Entries: People Not in Poverty in 2009 by Poverty Status in 2010 and 2011(Numbers in thousands)
Characteristic Not in poverty in
20091
In poverty in 20101 In poverty in 20111
Number90 percent
C.I.2 (±) Percent90 percent
C.I.2 (±) Number90 percent
C.I.2 (±) Percent90 percent
C.I.2 (±)
All people . . . . . . . . . . . . . 247,466 10,095 780 4 .1 0 .3 13,479 845 5 .4 0 .3
Race and Hispanic OriginWhite3 . . . . . . . . . . . . . . . . . . . . . . . 202,065 7,283 631 3.6 0.3 10,030 733 5.0 0.4 White, non-Hispanic4 . . . . . . . . . . 171,561 5,188 463 3.0 0.3 6,765 579 3.9 0.3Black3 . . . . . . . . . . . . . . . . . . . . . . . . 27,459 2,124 362 7.7 1.3 2,436 308 8.9 1.1
Hispanic4 . . . . . . . . . . . . . . . . . . . . . 33,141 2,349 438 7.1 1.3 3,535 466 10.7 1.4Non-Hispanic . . . . . . . . . . . . . . . . . . 214,325 7,745 607 3.6 0.3 9,944 688 4.6 0.3
AgeUnder 18 years . . . . . . . . . . . . . . . . 57,969 3,249 399 5.6 0.7 4,133 417 7.1 0.718 to 64 years . . . . . . . . . . . . . . . . . 158,746 6,210 447 3.9 0.3 8,379 538 5.3 0.365 years and over . . . . . . . . . . . . . . 30,751 635 108 2.1 0.3 967 118 3.1 0.4
Family StatusIn married-couple families . . . . . . . . 168,367 5,134 565 3.0 0.3 6,774 684 4.0 0.4In families with a female house-
holder, no husband present . . . . . . 29,503 2,266 359 7.7 1.2 2,939 391 10.0 1.3In families with a male householder,
no wife present . . . . . . . . . . . . . . . 10,996 733 203 6.7 1.8 945 196 8.6 1.7Unrelated individuals . . . . . . . . . . . . 38,600 1,962 194 5.1 0.5 2,820 248 7.3 0.6
1 Uses panel weight. Panel and yearly estimates are based on different samples. The 3-year panel estimates include only respondents in the panel for 36 months whereas calendar year estimates include respondents in sample for 12 months. The numbers of respondents in each sample are as follows: 48,937 in the 3-year panel, 73,695 in 2009, 67,452 in 2010, and 62,841 in 2011.
2 A 90 percent confidence interval (C.I.) is a measure of an estimate’s variability. The larger the confidence interval in relation to the size of the estimate, the less reliable the estimate.
3 Federal surveys, including the SIPP 2004 and 2008 Panel, give respondents the option of reporting more than one race. These data can be shown in two ways: (1) as mutually exclusive from other race groups, which may be denoted by “alone” or (2) not mutually exclusive with other race groups, denoted by “alone or in combination with other race groups.” The figures, tables, and text in this report show race using the first method.
4 Hispanics may be any race, data in this report for Hispanics overlap data for racial groups. Data users should exercise caution when interpreting aggregate results for these groups because they consist of many distinct subgroups that differ in socioeconomic characteristics, culture, and recency of immigration.
Source: U.S. Census Bureau, Survey of Income and Program Participation, 2008 Panel. For information on confidentiality protection and sampling and nonsam-pling error, see <www.census.gov/sipp/source.html>.

26 U.S. Census Bureau
Table A-9.Poverty Exits: People in Poverty in 2005 by Poverty Status in 2006 and 2007(Numbers in thousands)
Characteristic In poverty in 20051
Not in poverty in 20061 Not in poverty in 20071
Number90 percent
C.I.2 (±) Percent90 percent
C.I.2 (±) Number90 percent
C.I.2 (±) Percent90 percent
C.I.2 (±)
All people . . . . . . . . . . . . . . 26,609 7,800 794 29 .3 2 .6 9,433 1,016 35 .4 3 .2
Race and Hispanic OriginWhite3 . . . . . . . . . . . . . . . . . . . . . . . . 17,479 5,861 692 33.5 3.0 6,708 893 38.4 3.9 White, non-Hispanic4 . . . . . . . . . . . 11,077 4,057 550 36.6 3.8 4,812 708 43.4 4.6Black3 . . . . . . . . . . . . . . . . . . . . . . . . . 7,097 1,354 412 19.1 5.6 1,793 409 25.3 5.0
Hispanic4 . . . . . . . . . . . . . . . . . . . . . . 6,697 1,923 405 28.7 5.0 2,028 470 30.3 6.1Non-Hispanic . . . . . . . . . . . . . . . . . . . 19,912 5,876 695 29.5 3.1 7,404 844 37.2 3.6
AgeUnder 18 years . . . . . . . . . . . . . . . . . 10,102 2,461 359 24.4 3.2 3,092 510 30.6 4.518 to 64 years . . . . . . . . . . . . . . . . . . 14,316 4,799 521 33.5 3.0 5,691 603 39.8 3.365 years and over . . . . . . . . . . . . . . . 2,190 540 128 24.6 4.8 650 131 29.7 4.9
Family StatusIn married-couple families . . . . . . . . . 8,517 3,059 576 35.9 5.1 3,467 691 40.7 5.9In families with a female house-
holder, no husband present . . . . . . . 10,662 2,364 448 22.2 3.9 3,147 511 29.5 4.3In families with a male householder,
no wife present . . . . . . . . . . . . . . . . 867 306 172 35.3 16.2 338 179 39.0 16.5Unrelated individuals . . . . . . . . . . . . . 6,564 2,071 314 31.5 3.5 2,480 342 37.8 3.7
1 Uses panel weight. Panel and yearly estimates are based on different samples. The 3-year panel estimates include only respondents in the panel for 36 months whereas calendar year estimates include respondents in sample for 12 months. The numbers of respondents in each sample are as follows: 25,371 in the 3-year panel, 76,953 in 2005, 34,372 in 2006, and 34,489 in 2007. In Wave 9 of the 2004 SIPP Panel, the survey sample was cut by a 53 percent sample reduction; sampling weights adjust for this reduction. Calendar months October, November, and December of 2007 are missing for some rotation groups in the 2004 Panel. For longitudinal estimates covering these calendar months, a carry forward imputation method was applied.
2 A 90 percent confidence interval (C.I.) is a measure of an estimate’s variability. The larger the confidence interval in relation to the size of the estimate, the less reliable the estimate.
3 Federal surveys, including the SIPP 2004 and 2008 Panel, give respondents the option of reporting more than one race. These data can be shown in two ways: (1) as mutually exclusive from other race groups, which may be denoted by “alone” or (2) not mutually exclusive with other race groups, denoted by “alone or in combination with other race groups.” The figures, tables, and text in this report show race using the first method.
4 Hispanics may be any race, data in this report for Hispanics overlap data for racial groups. Data users should exercise caution when interpreting aggregate results for these groups because they consist of many distinct subgroups that differ in socioeconomic characteristics, culture, and recency of immigration.
Source: U.S. Census Bureau, Survey of Income and Program Participation, 2004 Panel. For information on confidentiality protection and sampling and nonsam-pling error, see <www.census.gov/sipp/source.html>.

U.S. Census Bureau 27
Table A-10.Poverty Exits: People in Poverty in 2009 by Poverty Status in 2010 and 2011(Numbers in thousands)
Characteristic In poverty in 20091
Not in poverty in 20101 Not in poverty in 20111
Number90 percent
C.I.2 (±) Percent90 percent
C.I.2 (±) Number90 percent
C.I.2 (±) Percent90 percent
C.I.2 (±)
All people . . . . . . . . . . . . . . 35,598 9,576 757 26 .9 1 .7 12,613 857 35 .4 1 .9
Race and Hispanic OriginWhite3 . . . . . . . . . . . . . . . . . . . . . . . . 24,546 6,993 677 28.5 2.2 9,601 812 39.1 2.6 White, non-Hispanic4 . . . . . . . . . . . 15,888 5,134 487 32.3 2.5 6,464 578 40.7 2.7Black3 . . . . . . . . . . . . . . . . . . . . . . . . . 8,259 1,570 287 19.0 3.2 1,875 312 22.7 3.3
Hispanic4 . . . . . . . . . . . . . . . . . . . . . . 9,645 2,180 390 22.6 3.5 3,450 517 35.8 4.5Non-Hispanic . . . . . . . . . . . . . . . . . . . 25,954 7,396 589 28.5 1.8 9,163 673 35.3 2.0
AgeUnder 18 years . . . . . . . . . . . . . . . . . 13,381 2,936 376 21.9 2.5 3,960 414 29.6 2.518 to 64 years . . . . . . . . . . . . . . . . . . 20,215 6,162 455 30.5 1.9 8,023 536 39.7 2.065 years and over . . . . . . . . . . . . . . . 2,002 478 105 23.9 4.4 630 106 31.5 4.1
Family StatusIn married-couple families . . . . . . . . . 12,745 4,245 540 33.3 3.4 5,652 680 44.3 4.0In families with a female householder,
no husband present. . . . . . . . . . . . . 12,680 2,614 427 20.6 3.0 3,193 434 25.2 2.8In families with a male householder,
no wife present . . . . . . . . . . . . . . . . 1,766 448 128 25.4 6.4 665 182 37.6 7.7Unrelated individuals . . . . . . . . . . . . . 8,407 2,270 209 27.0 2.2 3,103 287 36.9 2.8
1 Uses panel weight. Panel and yearly estimates are based on different samples. The 3-year panel estimates include only respondents in the panel for 36 months whereas calendar year estimates include respondents in sample for 12 months. The numbers of respondents in each sample are as follows: 48,937 in the 3-year panel, 73,695 in 2009, 67,452 in 2010, and 62,841 in 2011.
2 A 90 percent confidence interval (C.I.) is a measure of an estimate’s variability. The larger the confidence interval in relation to the size of the estimate, the less reliable the estimate.
3 Federal surveys, including the SIPP 2004 and 2008 Panel, give respondents the option of reporting more than one race. These data can be shown in two ways: (1) as mutually exclusive from other race groups, which may be denoted by “alone” or (2) not mutually exclusive with other race groups, denoted by “alone or in combination with other race groups.” The figures, tables, and text in this report show race using the first method.
4 Hispanics may be any race, data in this report for Hispanics overlap data for racial groups. Data users should exercise caution when interpreting aggregate results for these groups because they consist of many distinct subgroups that differ in socioeconomic characteristics, culture, and recency of immigration.
Source: U.S. Census Bureau, Survey of Income and Program Participation, 2008 Panel. For information on confidentiality protection and sampling and nonsam-pling error, see <www.census.gov/sipp/source.html>.

28 U.S. Census Bureau
Table A-11.Poverty Entries and Exits: 2009 Income-to-Poverty Ratio by 2010 Income-to-Poverty Ratio(Numbers in thousands)
2009 income-to-poverty threshold1
2010 income-to-poverty threshold1
Total
Less than 100 percent of the poverty
threshold
100 percent or more of the poverty threshold
Number90 percent
C.I.2 (±)
100 to 150 percent of the poverty threshold
More than 150 percent of the poverty
threshold
Number90 percent
C.I.2 (±) Number90 percent
C.I.2 (±) Number90 percent
C.I.2 (±)
Total . . . . . . . . . . . . . . . 283,065 36,117 1,262 246,948 1,369 29,449 1,331 217,499 1,661Less than 100 percent of the
poverty thresholds . . . . . . . . . . . 35,598 26,022 1,100 9,576 757 5,880 643 3,697 410100 percent or more of the
poverty threshold . . . . . . . . . . . 247,466 10,095 780 237,372 1,471 23,569 1,090 213,802 1,699100 to 150 percent of the
poverty threshold . . . . . . . . . . . 27,700 5,657 576 22,043 1,131 14,186 905 7,857 618More than 150 percent of the
poverty threshold . . . . . . . . . . . . 219,766 4,438 467 215,329 1,717 9,383 699 205,945 1,768
1 Uses panel weight. Panel and yearly estimates are based on different samples. The 3-year panel estimates include only respondents in the panel for 36 months whereas calendar year estimates include respondents in sample for 12 months. The numbers of respondents in each sample are as follows: 48,937 in the 3-year panel, 73,695 in 2009, 67,452 in 2010, and 62,841 in 2011.
2 A 90 percent confidence interval (C.I.) is a measure of an estimate’s variability. The larger the confidence interval in relation to the size of the estimate, the less reliable the estimate.
Source: U.S. Census Bureau, Survey of Income and Program Participation, 2008 Panel. For information on confidentiality protection and sampling and nonsam-pling error, see <www.census.gov/sipp/source.html>.
Table A-12.Poverty Entries and Exits: 2009 Income-to-Poverty Ratio by 2011 Income-to-Poverty Ratio(Numbers in thousands)
2009 income-to-poverty threshold1
2011 income-to-poverty threshold1
Total
Less than 100 percent of the poverty
threshold
100 percent or more of the poverty threshold
Number90 percent
C.I.2 (±)
100 to 150 percent of the poverty threshold
More than 150 percent of the poverty
threshold
Number90 percent
C.I.2 (±) Number90 percent
C.I.2 (±) Number90 percent
C.I.2 (±)
Total . . . . . . . . . . . . . . . 283,065 36,465 1,332 246,600 1,400 29,678 1,170 216,922 1,680Less than 100 percent of the
poverty thresholds . . . . . . . . . . . 35,598 22,986 1,053 12,613 857 6,248 588 6,365 561100 percent or more of the
poverty threshold . . . . . . . . . . . . 247,466 13,479 845 233,987 1,491 23,430 1,022 210,557 1,696100 to 150 percent of the
poverty threshold . . . . . . . . . . . . 27,700 6,432 644 21,268 1,061 11,501 692 9,767 780More than 150 percent of the
poverty threshold . . . . . . . . . . . . 219,766 7,047 605 212,719 1,721 11,929 755 200,790 1,763
1 Uses panel weight. Panel and yearly estimates are based on different samples. The 3-year panel estimates include only respondents in the panel for 36 months whereas calendar year estimates include respondents in sample for 12 months. The numbers of respondents in each sample are as follows: 48,937 in the 3-year panel, 73,695 in 2009, 67,452 in 2010, and 62,841 in 2011.
2 A 90 percent confidence interval (C.I.) is a measure of an estimate’s variability. The larger the confidence interval in relation to the size of the estimate, the less reliable the estimate.
Source: U.S. Census Bureau, Survey of Income and Program Participation, 2008 Panel. For information on confidentiality protection and sampling and nonsam-pling error, see <www.census.gov/sipp/source.html>.

U.S. Census Bureau 29
Table A-13.People in Poverty All 36 Months as a Percentage of Those in Poverty the First 2 Months by Selected Characteristics: 2005 to 2007(Numbers in thousands)
Characteristic
People in poverty in January and February 20051
Total People in poverty all 36 months, 2005 to 2007
Number90 percent
C.I.2 (±) Number90 percent
C.I.2 (±) Percent90 percent
C.I.2 (±)
All people . . . . . . . . . . . . . . . . . . . . . . . . . . . . 30,780 1,403 8,074 882 26 .2 2 .5
Race and Hispanic OriginWhite3 . . . . . . . . . . . . . . . . . . . . . . . . . . . . . . . . . . . . . . 20,829 1,242 4,604 616 22.1 2.7 White, non-Hispanic4 . . . . . . . . . . . . . . . . . . . . . . . . . 14,074 995 2,673 342 19.0 2.5Black3 . . . . . . . . . . . . . . . . . . . . . . . . . . . . . . . . . . . . . . . 7,608 808 2,851 436 37.5 4.7
Hispanic4 . . . . . . . . . . . . . . . . . . . . . . . . . . . . . . . . . . . . 7,112 740 1,969 442 27.7 5.3Non-Hispanic . . . . . . . . . . . . . . . . . . . . . . . . . . . . . . . . . 23,668 1,252 6,104 662 25.8 2.5
AgeUnder 18 years . . . . . . . . . . . . . . . . . . . . . . . . . . . . . . . 11,106 736 3,254 517 29.3 4.018 to 64 years . . . . . . . . . . . . . . . . . . . . . . . . . . . . . . . . 17,234 834 3,808 428 22.1 2.365 years and over . . . . . . . . . . . . . . . . . . . . . . . . . . . . . 2,439 261 1,012 173 41.5 5.4
Family StatusIn married-couple families . . . . . . . . . . . . . . . . . . . . . . . 11,097 1,027 1,775 496 16.0 3.8In families with a female householder, no husband
present . . . . . . . . . . . . . . . . . . . . . . . . . . . . . . . . . . . . 10,863 899 3,641 565 33.5 4.5In families with a male householder, no wife present . . 1,299 327 264 179 20.3 12.3Unrelated individuals . . . . . . . . . . . . . . . . . . . . . . . . . . . 7,521 510 2,393 265 31.8 3.1
1 Uses panel weight. Panel and yearly estimates are based on different samples. The 3-year panel estimates include only respondents in the panel for 36 months whereas calendar year estimates include respondents in sample for 12 months. The numbers of respondents in each sample are as follows: 25,371 in the 3-year panel, 76,953 in 2005, 34,372 in 2006, and 34,489 in 2007. In Wave 9 of the 2004 SIPP Panel, the survey sample was cut by a 53 percent sample reduction; sampling weights adjust for this reduction. Calendar months October, November, and December of 2007 are missing for some rotation groups in the 2004 Panel. For longitudinal estimates covering these calendar months, a carry forward imputation method was applied.
2 A 90 percent confidence interval (C.I.) is a measure of an estimate’s variability. The larger the confidence interval in relation to the size of the estimate, the less reliable the estimate.
3 Federal surveys, including the SIPP 2004 and 2008 Panel, give respondents the option of reporting more than one race. These data can be shown in two ways: (1) as mutually exclusive from other race groups, which may be denoted by “alone” or (2) not mutually exclusive with other race groups, denoted by “alone or in combination with other race groups.” The figures, tables, and text in this report show race using the first method.
4 Hispanics may be any race, data in this report for Hispanics overlap data for racial groups. Data users should exercise caution when interpreting aggregate results for these groups because they consist of many distinct subgroups that differ in socioeconomic characteristics, culture, and recency of immigration.
Source: U.S. Census Bureau, Survey of Income and Program Participation, 2004 Panel. For information on confidentiality protection and sampling and nonsam-pling error, see <www.census.gov/sipp/source.html>.

30 U.S. Census Bureau
Table A-14.People in Poverty All 36 Months as a Percentage of Those in Poverty the First 2 Months by Selected Characteristics: 2009 to 2011(Numbers in thousands)
Characteristic
People in poverty in January and February 20091
Total People in poverty all 36 months, 2009 to 2011
Number90 percent
C.I.2 (±) Number90 percent
C.I.2 (±) Percent90 percent
C.I.2 (±)
All people . . . . . . . . . . . . . . . . . . . . . . . . . . . . 37,588 1,374 9,922 760 26 .4 1 .7
Race and Hispanic OriginWhite3 . . . . . . . . . . . . . . . . . . . . . . . . . . . . . . . . . . . . . . 26,222 1,160 6,235 622 23.8 2.0 White, non-Hispanic4 . . . . . . . . . . . . . . . . . . . . . . . . . 17,399 911 3,796 428 21.8 2.1Black3 . . . . . . . . . . . . . . . . . . . . . . . . . . . . . . . . . . . . . . . 8,684 655 3,078 461 35.5 4.3
Hispanic4 . . . . . . . . . . . . . . . . . . . . . . . . . . . . . . . . . . . . 9,936 691 2,759 418 27.8 3.7Non-Hispanic . . . . . . . . . . . . . . . . . . . . . . . . . . . . . . . . . 27,653 1,188 7,162 611 25.9 1.8
AgeUnder 18 years . . . . . . . . . . . . . . . . . . . . . . . . . . . . . . . 13,728 708 4,210 443 30.7 2.718 to 64 years . . . . . . . . . . . . . . . . . . . . . . . . . . . . . . . . 21,790 836 4,950 404 22.7 1.565 years and over . . . . . . . . . . . . . . . . . . . . . . . . . . . . . 2,071 192 762 122 36.8 4.4
Family StatusIn married-couple families . . . . . . . . . . . . . . . . . . . . . . . 13,591 879 2,546 429 18.7 2.8In families with a female householder, no husband
present . . . . . . . . . . . . . . . . . . . . . . . . . . . . . . . . . . . . 13,192 791 4,247 504 32.2 3.3In families with a male householder, no wife present . . 1,801 282 430 144 23.9 6.9Unrelated individuals . . . . . . . . . . . . . . . . . . . . . . . . . . . 9,004 469 2,700 246 30.0 2.2
1 Uses panel weight. Panel and yearly estimates are based on different samples. The 3-year panel estimates include only respondents in the panel for 36 months whereas calendar year estimates include respondents in sample for 12 months. The numbers of respondents in each sample are as follows: 48,937 in the 3-year panel, 73,695 in 2009, 67,452 in 2010, and 62,841 in 2011.
2 A 90 percent confidence interval (C.I.) is a measure of an estimate’s variability. The larger the confidence interval in relation to the size of the estimate, the less reliable the estimate.
3 Federal surveys, including the SIPP 2004 and 2008 Panel, give respondents the option of reporting more than one race. These data can be shown in two ways: (1) as mutually exclusive from other race groups, which may be denoted by “alone” or (2) not mutually exclusive with other race groups, denoted by “alone or in combination with other race groups.” The figures, tables, and text in this report show race using the first method.
4 Hispanics may be any race, data in this report for Hispanics overlap data for racial groups. Data users should exercise caution when interpreting aggregate results for these groups because they consist of many distinct subgroups that differ in socioeconomic characteristics, culture, and recency of immigration.
Source: U.S. Census Bureau, Survey of Income and Program Participation, 2008 Panel. For information on confidentiality protection and sampling and nonsam-pling error, see <www.census.gov/sipp/source.html>.

U.S. Census Bureau 31
Table A-15.The Duration of Poverty Spells Across 2005 to 2007 and 2009 to 2011
Spell characteristic2005 to 20071
(Excludes spells underway in January 2005)2009 to 2011
(Excludes spells underway in January 2009)
Estimate 90 percent C.I.2 (±) Estimate 90 percent C.I.2 (±)
Percent of spells in interval2 to 4 months . . . . . . . . . . . . . . . . . . . . 47.0 2.5 44.0 1.65 to 8 months . . . . . . . . . . . . . . . . . . . . 18.0 2.0 18.7 1.39 to 12 months . . . . . . . . . . . . . . . . . . . 9.1 1.5 9.4 1.013 to 16 months . . . . . . . . . . . . . . . . . . 4.6 1.2 5.9 1.017 to 20 months . . . . . . . . . . . . . . . . . . 2.1 0.9 3.6 0.821 to 24 months . . . . . . . . . . . . . . . . . 1.9 1.1 3.2 0.925 or more months . . . . . . . . . . . . . . . 17.4 2.1 15.2 1.4
Median spell length (in months)3 . . . . 5.7 0.6 6.6 0.5
1 Calendar months October, November, and December of 2007 are missing for some rotation groups in the 2004 Panel. For longitudinal estimates covering these calendar months, a carry forward imputation method was applied.
2 A 90 percent confidence interval (C.I.) is a measure of an estimate’s variability. The larger the confidence interval in relation to the size of the estimate, the less reliable the estimate.
3 Due to changes in the estimation of survival rates, estimates of median spell length presented in this report are not comparable with estimates of median spell length reported in previous P70 Dynamics of Economic Well-Being series. See Limitations on page 15 for details of this change.
Source: U.S. Census Bureau, Survey of Income and Program Participation, 2004 and 2008 Panel. For information on confidentiality protection and sampling and nonsampling error, see <www.census.gov/sipp/source.html>.

32 U.S. Census Bureau
Table A-16.Median Length of Poverty Spells by Selected Characteristics: 2005 to 2007 and 2009 to 2011(In months)
Characteristic
2005 to 20071 (Excluding spells underway in January
2005)
2009 to 2011 (Excluding spells underway in January
2009)
Median spell length (months)2 90 percent C.I.3 (±)
Median spell length (months)2 90 percent C.I.3 (±)
All people . . . . . . . . . . . . . . . . . . . . . . . . . . . . 5 .7 0 .6 6 .6 0 .5
Race and Hispanic OriginWhite4 . . . . . . . . . . . . . . . . . . . . . . . . . . . . . . . . . . . . . . 5.6 0.6 6.2 0.5 White, non-Hispanic5 . . . . . . . . . . . . . . . . . . . . . . . . . 5.1 0.5 6.0 0.6Black4 . . . . . . . . . . . . . . . . . . . . . . . . . . . . . . . . . . . . . . . 6.6 2.0 8.5 0.5
Hispanic5 . . . . . . . . . . . . . . . . . . . . . . . . . . . . . . . . . . . . 7.0 1.7 6.5 0.8Non-Hispanic . . . . . . . . . . . . . . . . . . . . . . . . . . . . . . . . . 5.4 0.6 6.6 0.6
AgeUnder 18 years . . . . . . . . . . . . . . . . . . . . . . . . . . . . . . . 6.0 1.3 7.0 0.918 to 64 years . . . . . . . . . . . . . . . . . . . . . . . . . . . . . . . . 5.4 0.5 6.3 0.565 years and over . . . . . . . . . . . . . . . . . . . . . . . . . . . . . 8.2 0.6 8.3 0.3
Family StatusIn married-couple families . . . . . . . . . . . . . . . . . . . . . . . 4.9 0.3 5.6 0.7In families with a female householder, no husband
present . . . . . . . . . . . . . . . . . . . . . . . . . . . . . . . . . . . . 7.3 1.3 8.4 0.4In families with a male householder, no wife present . . 5.8 3.0 6.8 2.9Unrelated individuals . . . . . . . . . . . . . . . . . . . . . . . . . . . 6.2 0.8 7.1 1.0
1 Calendar months October, November, and December of 2007 are missing for some rotation groups in the 2004 Panel. For longitudinal estimates covering these calendar months, a carry forward imputation method was applied.
2 Due to changes in the estimation of survival rates, estimates of median spell length presented in this report are not comparable with estimates of median spell length reported in previous P70 Dynamics of Economic Well-Being series. See Limitations on page 15 for details of this change.
3 A 90 percent confidence interval (C.I.) is a measure of an estimate’s variability. The larger the confidence interval in relation to the size of the estimate, the less reliable the estimate.
4 Federal surveys, including the SIPP 2004 and 2008 Panel, give respondents the option of reporting more than one race. These data can be shown in two ways: (1) as mutually exclusive from other race groups, which may be denoted by “alone” or (2) not mutually exclusive with other race groups, denoted by “alone or in combination with other race groups.” The figures, tables, and text in this report show race using the first method.
5 Hispanics may be any race, data in this report for Hispanics overlap data for racial groups. Data users should exercise caution when interpreting aggregate results for these groups because they consist of many distinct subgroups that differ in socioeconomic characteristics, culture, and recency of immigration.
Source: U.S. Census Bureau, Survey of Income and Program Participation, 2004 and 2008 Panel. For information on confidentiality protection and sampling and nonsampling error, see <www.census.gov/sipp/source.html>.