Embed Size (px)
Citation preview

What is Chronic Poverty?
The distinguishing feature of chronic poverty is extended duration in absolute poverty.
Therefore, chronically poor people always, or usually, live below a poverty line, which is normally defined in terms of a money indicator (e.g. consumption, income, etc.), but could also be defined in terms of wider or subjective aspects of deprivation.
This is different from the transitorily poor, who move in and out of poverty, or only occasionally fall below the poverty line.
www.chronicpoverty.org
The research for this Background Paper was made possible by funding from the United States Agency for International Development (USAID) (via BASIS Collaborative Research Support Program at the University of Wisconsin-Madison)
Background Paper for the Chronic Poverty Report 2008-09 Poverty, Poverty Reduction and Poverty Dynamics in Vietnam Nguyen Thang Le Dang Trung Vu Hoang Dat Nguyen Thu Phuong July 2006

Poverty, Poverty Reduction and Poverty Dynamics in Vietnam
2
Table of Contents Summary ........................................................................................................................................ 4
1. Introduction................................................................................................................................ 7
2. Poverty And Poverty Reduction In Vietnam 1993-2004: Achievements And Challenges...................................................................................................................................... 8
2.1. ACHIEVEMENTS ...................................................................................................................... 8 2.2. KEY DETERMINANTS OF THE SUCCESSFUL POVERTY REDUCTION STORY............................... 10 2.3. MAJOR CHALLENGES ........................................................................................................... 14
2.3.1. Rural-Urban Disparities In Poverty And Poverty Reduction ....................................... 14 2.3.2. Regional Disparities In Poverty And Poverty Reduction............................................. 15 2.3.3. Ethnicity Disparities In Poverty And Poverty Reduction ............................................. 16 2.3.4. Increasing Issue Of Vulnerability ................................................................................ 17
3. Poverty Dynamics: A Brief Review Of Academic Literature ............................................... 17
4. Poverty Dynamics In Vietnam 2002-2004: Findings From Analysis Of Panel Dataset 2002-2004...................................................................................................................................... 19
4.1. A DESCRIPTIVE ANALYSIS OF POVERTY TRANSITION ............................................................. 20 4.2. ECONOMETRIC ANALYSIS OF POVERTY DYNAMICS: ............................................................... 25
5. Conclusions ............................................................................................................................. 32
References ................................................................................................................................... 33
Appendix 1. Growth Elasticity Of Poverty Reduction.............................................................. 36
Appendix 2. Technical Notes On Selected Variables Used In The Econometric Analysis .. 37
Appendix 3. Determinants Of Poverty Dynamics: The Whole Rural Vietnam....................... 40
Appendix 4. Determinants Of Movement Out Of Poverty (2002-2004): Analysis Disaggregated By Ethnicity........................................................................................................ 42
Appendix 5. Determinants Of Movement Into Poverty (2002-2004): Analysis Disaggregated By Ethnicity........................................................................................................ 44
Appendix 6. Seven Regions In Vietnam .................................................................................... 46

Poverty, Poverty Reduction and Poverty Dynamics in Vietnam
3
Tables
Table 1: Poverty Rates 1993-2004 (%) ........................................................................................... 9 Table 2. Social Indicators 1993-2004 (%) .................................................................................... 10 Table 3: Accumulative Growth of GDP per capita (%) .................................................................. 11 Table 4. Export Growth of Key Labour Intensive Export-Oriented Sectors (%) ............................ 12 Table 5. Employment by Selected Fast Growing Industries (number of workers) ........................ 13 Table 6. Poverty measures of rural and urban areas (%) ............................................................. 14 Table 7. Poverty Rate by Region................................................................................................... 15 Table 8. Regional Shares of Poverty in 2004 (%) ......................................................................... 15 Table 9. Poverty Measures by Ethnicity (%) ................................................................................. 16 Table 10. Urban and Rural Poverty Dynamics 2002-2004........................................................... 19 Table 11. Socio-Economic Characteristics and Poverty Dynamics .............................................. 21 Table 12. Determining Factors of Movement Out of Poverty during 2002-2004.......................... 26 Table 13. Determining Factors of Movement into Poverty (2002-2004) ....................................... 30
Figures Figure 1: Frequency Distribution of Per Capita Expenditure 1993-2004......................................... 9

Poverty, Poverty Reduction and Poverty Dynamics in Vietnam
4
Summary The two household surveys VHLSS 02 and VHLSS 04 reveal that Vietnam has
achieved remarkable success in poverty reduction during the period of 2002-2004. The consumption-based poverty rate has come down from 28.9% in 2002 to only 19.5% in 2004, thus showing a drop by 9.4 percentage points over the two years.
The poverty gap measure further indicates that the average depth of poverty, for 2004, has decreased, by 2.2 percentage points. Other non-income measures and social indicators have also shown significant improvements.
The Gini index, which measures relative inequality, was stable at 0.37 during the 2002-2004 period.
However, these aggregate numbers have masked significant variation in progress in poverty reduction across different segments of the society. There are considerable differences in the multiple dimensions of poverty between rural and urban population, between different regions, and particularly between the Kinh-Hoa group and ethnic minorities. Vulnerability has become an increasingly important issue.
Together with overall poverty reduction, the percentage of chronically poor households has dropped substantially, from 28.7% for the 1993-1998 period to 16.47% for the 2002-2004 period, i.e. by more than 12 percentage points. However, the progress has been uneven across different segments of the populations. There are also differences across population groups in movements in and out of poverty.
The rural population constitutes the largest proportion of those persons in chronic poverty, 95.42% (against a rural population share of 79.25%). With regards to regional differences, there have been quite discernible changes in the spatial distribution of chronically poor people. The Red River Delta’s share of national chronic poverty dropped quickly, whilst the share of North Central Coast and particularly Central Highlands increased substantially. As a result, the spatial distribution of chronic poverty during the 2002-2004 period is such that Northern Uplands has the largest proportion of chronically poor households in Vietnam, immediately followed by North Central Coast and then by Central Highlands. The progress in reducing chronic poverty also varies across the Kinh-Hoa and ethnic minorities. The percentage of ethnic minorities in total chronic poverty increased to reach 42.70%, which is very high as they only constitute 11% of total population.
With regards to households that managed to escape from poverty during the 2002-2004 period, the Mekong River Delta showed the best performance, constituting 20.5% (as against its population share of 9.74%) while South Central Coast appears to have performed weakly, constituting only 13.12% (as against its population share of 21.86%). Other regions’ shares of total households escaping
Poverty, Poverty Reduction and Poverty Dynamics in Vietnam
5
poverty are more or less in line with their respective population shares. For households that moved in or out of poverty, both their shares of ethnic minorities are slightly higher than their respective population shares and comparable to one another.
In terms of other characteristics, as compared to the three other groups (i.e. moving out of poverty, moving into poverty and being non-poor at both the beginning and end of the period in consideration), chronically poor households tend to have larger household size, have heads with lower levels of educational attainment, and are more likely to work in agriculture. The shift in occupation of household head for all the four groups reflected the overall shift in the economy towards fewer people being engaged in agriculture and more people working in non-agricultural sectors. Chronically poor persons also have more limited access to some types of infrastructure, such as electricity, clean water, and road, but have comparable access to others (post offices, markets, lower and upper schools, health care units and village extension service centres).
Determinants of poverty dynamics in the 2002-2004 period are the main focus of this study. Similar to the 1993-1998 period, for which panel dataset is also available, being a member of the Kinh-Hoa group, living in South East and Mekong River Delta each raise a poor household’s chance of escaping from poverty Disaggregated analysis (by ethnicity), which is not available in earlier studies for the 1993-1998 period, reveals that living in Red River Delta or South Central Coast only raises the probability of moving out poverty for rural households of the Kinh-Hoa group, and interestingly, living in North Uplands or Central Highlands only helps poor rural households from ethnic minorities (not the rural Kinh-Hoa, nor the rural Vietnam as the whole).
Similarly to the 1993-1998 period, educational attainment of the household head at the lower secondary school or technical/university level raises the probability of the household’s move out of poverty.
Similarly to the 1993-1998 period, the larger scale of coffee production increases a household’s chance of escaping poverty. Findings for the 2002-2004 period only suggest that (i) greater scales of production of pig, poultry and aquaculture, and the higher level of use of insecticides increase rural Kinh-Hoa households’ chances of escaping poverty; and (ii) greater scales of rice only helps rural households from ethnic minorities.
Current values of productive assets are found to be a robust factor in raising poor rural households’ chances of escaping poverty. Access to electricity at the household level and to upper secondary school and health centres at the village level is found to have raised the chances of escaping poverty for rural Kinh-Hoa households only. Access to permanent roads and lower secondary school is found to have contributed to increasing the probability of rural ethnic minority household’s
Poverty, Poverty Reduction and Poverty Dynamics in Vietnam
6
move out of poverty. For these findings, no comparison with the 1993-1998 can be made, given different definitions of these variables in our own and earlier studies.
Factors that lower rural households’ chances of moving out of poverty are: (i) number of children between 0 and 18 years of age, for rural Kinh Hoa households; (ii) household head’s engagement in non-agricultural, non-service production, for those living in South Central Coast; (iii) level of use of insecticides; and (iv) living in a village with both a market and upper secondary school, for rural household from ethnic minorities. If the factors for the Kinh Hoa group are quite intuitive, the findings for ethnic minorities are not easily understood (in some cases, counter-intuitive) without additional information, which is still absent and could be researched.
Factors that increase the probability of non-poor rural households moving into
poverty include: (i) the number of children between 0 and 18 years of age for both the Kinh-Hoa and ethnic minorities; (ii) the number of old adults, for the Kinh-Hoa group only; and (iii) female head, payment for insecticides and having upper secondary school in the village, for rural households from ethnic minorities. Again, it is not easy to find explanations for factors for ethnic minorities’ descent into poverty without additional information.
Factors that decrease the probability of non-poor rural households falling into poverty include: (i) scales of rice and pig production, for both Kinh-Hoa and ethnic minorities; (ii) living in the South-East; age of head; head with primary school education; education; head’s spouse having primary, upper secondary school or technical/university level educational attainment, for the Kinh-Hoa group only; and (iii) scale of coffee production; the presence of permanent road or lower secondary school in the village, for those living in Mekong River Delta.
Acknowledgements The research for this Background Paper was made possible by funding from the United States Agency for International Development (USAID) (via BASIS Collaborative Research Support Program at the University of Wisconsin-Madison). Authors Nguyen Thang: Director, Center for Analysis and Forecasting (CAF) – Vietnamese Academy of Social Sciences (VASS) Le Dang Trung, Vu Hoang Dat, Nguyen Thu Phuong, Researchers, Center for Analysis and Forecasting (CAF), No1 Lieu Giai Street, Hanoi, Vietnam

Poverty, Poverty Reduction and Poverty Dynamics in Vietnam
7
1. Introduction This report is the Vietnam background paper for the Chronic Poverty Report 2008. This background paper will analyse how key markets (labour, commodity, finance and housing) can work for (and against) poor people, including chronically poor people, with special reference to the roles of agricultural growth, infrastructure and urban development in helping poor people move out of poverty and in preventing non-poor people fall into poverty. This paper will further make relevant policy recommendations. This task has involved two activities: (i) an extensive review of the relevant literature and information sources with special focus on the period of 2002-2004; and (ii) analysis of the panel dataset constructed from household surveys for 2002 and 2004 (VHLSS 02 and VHLSS 04). These two activities are closely related: the results of the former have been used to guide the latter, particularly for identifying the best methodologies and model specifications feasible within the data availability. The latter in turn has given special attention to identifying factors explaining why some people are able to participate in economic growth, and thereby escape from, or not fall into, poverty, and why others are not, or are less able. Although the focus of our analysis has been the recent period of 2002-2004, comparison with previous period of 1993-1998 (for which panel data is available for similar analysis, as exemplified in numerous studies) has been made to a maximum extent possible. Together, they provide quite a good picture of what has enabled poor people to escape from poverty and what has prevented non-poor people from falling into chronic poverty, for the period 1993 to 2004. This paper is structured as follows: this short introduction is followed by a section which reviews Vietnam’s key achievements and challenges in recent years. The next section provides a brief review of the studies investigating poverty dynamics in Vietnam and elsewhere. A fourth section provides quantitative analysis of panel data, for 2002 to 2004, followed by a concluding section. The report also contains appendixes.

Poverty, Poverty Reduction and Poverty Dynamics in Vietnam
8
2. Poverty and Poverty Reduction in Vietnam 1993-2004: Achievements and Challenges
Analysis of the four household survey datasets (1993, 1998, 2002 and 2004) by various authors have revealed Vietnam’s impressive achievements in poverty reduction over the 11-year period 1993-2004, and also the challenges that Vietnam is facing in sustaining its current rate of poverty reduction. The achievements and challenges are summarised below, along with guidance for subsequent analyses of poverty dynamics in Vietnam.
2.1. Achievements
Vietnam exhibited remarkable success in poverty reduction for 1993-2004, as illustrated by the four household surveys. Vietnam’s consumption-based poverty rate has come down from 58.1% in 1993 to only 19.5% in 2004, thus showing a drop of almost 39 percentage points over the eleven years. The poverty rate in 2004 was only one third of that in 1993, which is exceptional if benchmarked against the major UN Millennium Development Goal of halving extreme poverty over the longer period of 1990-2015. Most recently, Vietnam has halved poverty over a much shorter, six-year, period of 1998-2004, from a reasonably low base rate of 37.4%. In absolute terms, some twenty-four million people were lifted out of poverty over the eleven year period of 1993-2004; with approximately half of them escaping from poverty during the 1993-1998 five-year sub-period, and another half during the 1998-2004 six-year sub-period.
Vietnam’s success in poverty reduction is also evident from
Figure 1, which illustrates that the curve of distribution of per capita expenditure has consistently moved rightwards, in favour of increasingly high proportions of people with greater purchasing power, since 1993. During the two-year period 2002-2004, which is the main focus of subsequent econometric analysis, real per capita income

Poverty, Poverty Reduction and Poverty Dynamics in Vietnam
9
grew by 21%. In particular, the bottom and near bottom quintiles have real per capita income growth of 20% and 22% respectively1 (World Bank, 2006: 15).
Table 1: Poverty Rates 1993-2004 (%) 1993 1998 2002 2004Poverty rate
58.1 37.4 28.9 19.5
Poverty gap
18.5 9.5 6.9 4.7
Source: GSO, various years
Figure 1: Frequency Distribution of Per Capita Expenditure 1993-2004 (Monetary values are in January 1993 prices)
poverty line
0
2
4
6
8
10
0 1000 2000 3000 4000 5000
thousand VND
percent
Y1993 Y1998 Y2002 Y2004
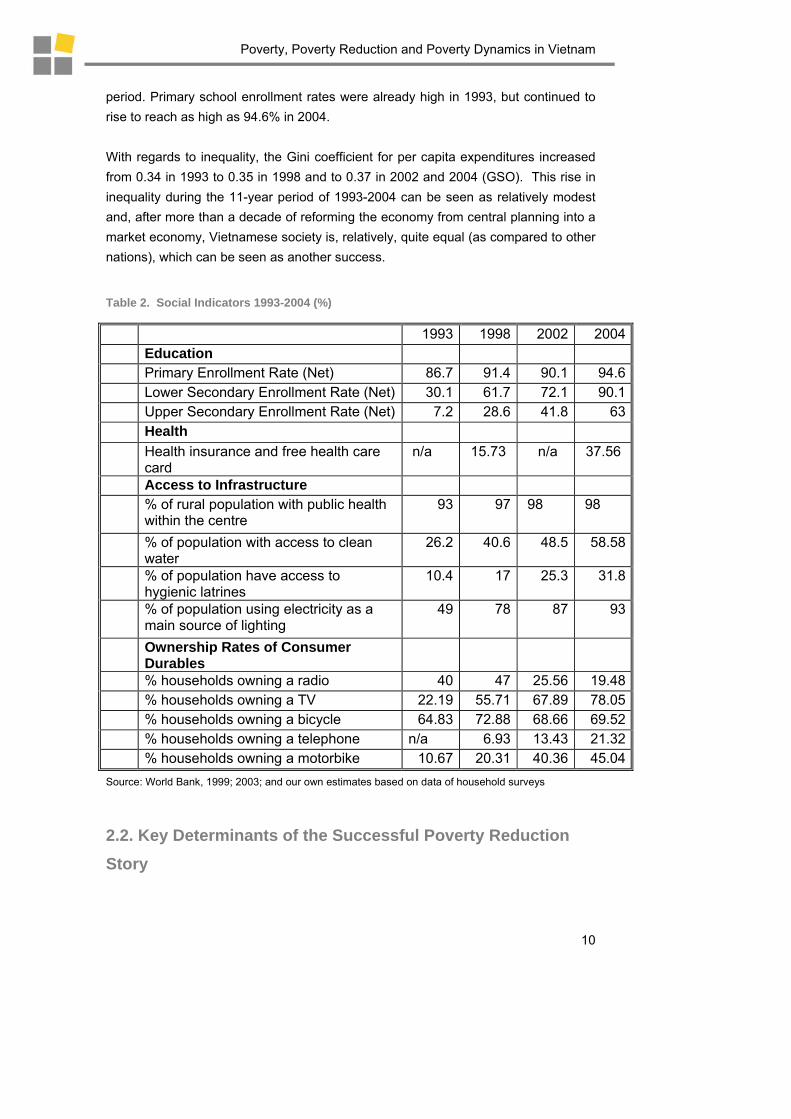
Together with improvements in living standards, as measured by household expenditure, non-income indicators reflecting social aspects of people’s well-being have also shown significant improvements over the period 1993-2004 (see Table 2). With regards to education, net enrollment rates have increased for all levels. Most notably, the enrollment rate for upper secondary school has gone up dramatically, from 7.2% in 1993 to 63% in 2004 - almost nine times. The rate for lower secondary school has also shown significant improvements, having tripled over this 11-year
1 The growth rates for the other three quintiles (middle, near top and top) are 25%, 25% and 18% respectively.
Poverty, Poverty Reduction and Poverty Dynamics in Vietnam
10
period. Primary school enrollment rates were already high in 1993, but continued to rise to reach as high as 94.6% in 2004. With regards to inequality, the Gini coefficient for per capita expenditures increased from 0.34 in 1993 to 0.35 in 1998 and to 0.37 in 2002 and 2004 (GSO). This rise in inequality during the 11-year period of 1993-2004 can be seen as relatively modest and, after more than a decade of reforming the economy from central planning into a market economy, Vietnamese society is, relatively, quite equal (as compared to other nations), which can be seen as another success.
Table 2. Social Indicators 1993-2004 (%) 1993 1998 2002 2004 Education Primary Enrollment Rate (Net) 86.7 91.4 90.1 94.6 Lower Secondary Enrollment Rate (Net) 30.1 61.7 72.1 90.1 Upper Secondary Enrollment Rate (Net) 7.2 28.6 41.8 63 Health Health insurance and free health care
card n/a 15.73 n/a 37.56
Access to Infrastructure % of rural population with public health
within the centre 93 97 98 98
% of population with access to clean water
26.2 40.6 48.5 58.58
% of population have access to hygienic latrines
10.4 17 25.3 31.8
% of population using electricity as a main source of lighting
49 78 87 93
Ownership Rates of Consumer Durables
% households owning a radio 40 47 25.56 19.48 % households owning a TV 22.19 55.71 67.89 78.05 % households owning a bicycle 64.83 72.88 68.66 69.52 % households owning a telephone n/a 6.93 13.43 21.32 % households owning a motorbike 10.67 20.31 40.36 45.04 Source: World Bank, 1999; 2003; and our own estimates based on data of household surveys
2.2. Key Determinants of the Successful Poverty Reduction Story
Poverty, Poverty Reduction and Poverty Dynamics in Vietnam
11
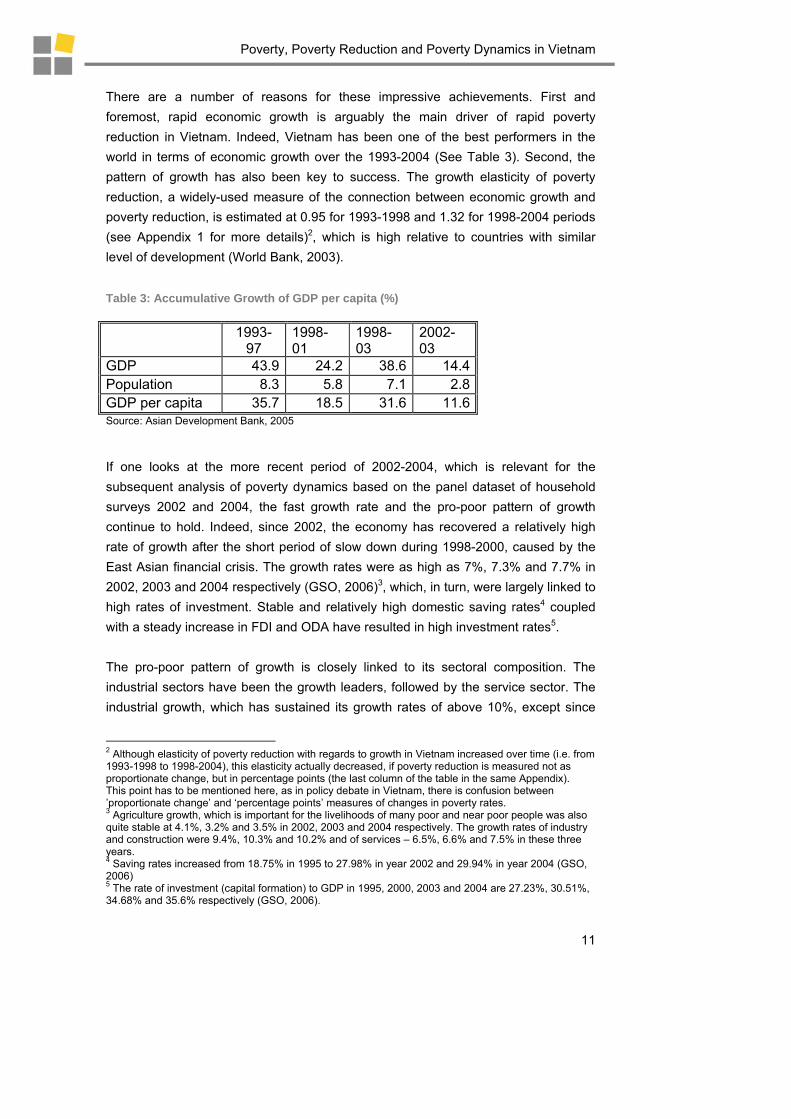
There are a number of reasons for these impressive achievements. First and foremost, rapid economic growth is arguably the main driver of rapid poverty reduction in Vietnam. Indeed, Vietnam has been one of the best performers in the world in terms of economic growth over the 1993-2004 (See Table 3). Second, the pattern of growth has also been key to success. The growth elasticity of poverty reduction, a widely-used measure of the connection between economic growth and poverty reduction, is estimated at 0.95 for 1993-1998 and 1.32 for 1998-2004 periods (see Appendix 1 for more details)2, which is high relative to countries with similar level of development (World Bank, 2003).
Table 3: Accumulative Growth of GDP per capita (%)
1993-97
1998-01
1998-03
2002-03
GDP 43.9 24.2 38.6 14.4Population 8.3 5.8 7.1 2.8GDP per capita 35.7 18.5 31.6 11.6Source: Asian Development Bank, 2005
If one looks at the more recent period of 2002-2004, which is relevant for the subsequent analysis of poverty dynamics based on the panel dataset of household surveys 2002 and 2004, the fast growth rate and the pro-poor pattern of growth continue to hold. Indeed, since 2002, the economy has recovered a relatively high rate of growth after the short period of slow down during 1998-2000, caused by the East Asian financial crisis. The growth rates were as high as 7%, 7.3% and 7.7% in 2002, 2003 and 2004 respectively (GSO, 2006)3, which, in turn, were largely linked to high rates of investment. Stable and relatively high domestic saving rates4 coupled with a steady increase in FDI and ODA have resulted in high investment rates5. The pro-poor pattern of growth is closely linked to its sectoral composition. The industrial sectors have been the growth leaders, followed by the service sector. The industrial growth, which has sustained its growth rates of above 10%, except since
2 Although elasticity of poverty reduction with regards to growth in Vietnam increased over time (i.e. from 1993-1998 to 1998-2004), this elasticity actually decreased, if poverty reduction is measured not as proportionate change, but in percentage points (the last column of the table in the same Appendix). This point has to be mentioned here, as in policy debate in Vietnam, there is confusion between ’proportionate change’ and ‘percentage points’ measures of changes in poverty rates. 3 Agriculture growth, which is important for the livelihoods of many poor and near poor people was also quite stable at 4.1%, 3.2% and 3.5% in 2002, 2003 and 2004 respectively. The growth rates of industry and construction were 9.4%, 10.3% and 10.2% and of services – 6.5%, 6.6% and 7.5% in these three years. 4 Saving rates increased from 18.75% in 1995 to 27.98% in year 2002 and 29.94% in year 2004 (GSO, 2006) 5 The rate of investment (capital formation) to GDP in 1995, 2000, 2003 and 2004 are 27.23%, 30.51%, 34.68% and 35.6% respectively (GSO, 2006).

Poverty, Poverty Reduction and Poverty Dynamics in Vietnam
12
2002, has been a key factor for the increase in the income of the labor force recently. Directly, industrial growth creates employment with reasonable wages. Indirectly, the labour absorption of the industrial sector increases production assets per worker in the agricultural sector and consequently reduces the severity of underemployment in the rural areas.6 The growth of the service sector, which includes numerous low value but labour-intensive sub-sectors, has arguably made a contribution to employment generation. The agricultural sector, which employs many rural poor people, has maintained its a stable growth pace of 3 to 4%. Within the agricultural sector, since 2002, the share of the fisheries sector has been increasing from 18.4% in 2003 to 19.5% in 2004 (MPI and IMF, 2006), apparently due to increasing seafood exports to the US. In terms of employment, during the period 2001-2004, 4.027 million jobs have been created in the industrial and service sectors, thus raising the percentage of those employed in non-agricultural sectors from 35% in 2000 to 41% in 2004. The private non-agriculture sector, which absorbs most unskilled labour, has been growing fast - by 35% during 2000-2003 (GSO, 2006)7. Expansion of labour-intensive export-oriented sectors, such as garments, footwear, seafood, electronics and seafood, has also been quite impressive (Table 4). These positive changes have clearly created a favourable environment for job creation (Table 5) and thereby poverty reduction.
Table 4. Export Growth of Key Labour Intensive Export-Oriented Sectors (%)
Industry 2000 2001 2002 2003 2004
Footwear 6.10 7.86 18.13 20.55 19.07 Textile and Garment 8.34 4.41 38.30 32.10 21.52 Seafood 51.86 22.85 11.31 8.79 9.17
6 Working time utilisation rates in the rural areas increased from 74% in 2000 to 75% in 2002 and 79% in 2004 (GSO, 2006). However, it should be note that the indirect impact of labor absorption of the industrial sector is not the only explanation for the increase in utilization rates of working time in rural areas as increases in non-farm activities also contributed. 7 The large expansion, thanks to the greater participation of the private sector, in of light industries, which are typically labor intensive has resulted in significant employment generation. The number of jobs in the sector increased from 753,049 in 2000 to 1,262,207 in 2002 and 1,521,142 in 2003 and the sector recently accounted for 47% of total job creation in the economy in the period 2000-2003 (GSO, 2004; 2005).

Poverty, Poverty Reduction and Poverty Dynamics in Vietnam
13
Table 5. Employment by Selected Fast Growing Industries (number of workers)
Sector 2000 2001 2002 2003
Food processing and beverage 267924 295912 345000 377765
Textile 122759 138376 152293 165438
Garment 231948 253613 356395 436342
Source: GSO, 2004; 2005
Favourable prices of agricultural products may also be an important determinant of the poverty reduction success. After a substantial decline during the period from 1999 to 2001, the agricultural producer price index increased relative to the industrial producer price index, from 2002 to2004. This, coupled with the stable growth of agriculture, has apparently contributed to the increased incomes of farmers. In particular, the recovery of international and domestic prices of rice and coffee, since 2002 (World Bank, 2005: 5), is believed to have contributed to acceleration of poverty reduction in Vietnam, for the period 2002-2004 (World Bank, 2005: 14). Rapid development of infrastructure, reflected in Table 2, is widely believed to have made a considerable contribution to poverty reduction in Vietnam (World Bank, 2005: 14; CRP, 2003: 14). The contribution of various types of infrastructure to people’s ability to escape from poverty was confirmed by a series of participatory poverty assessments conducted in the middle of 2003 (ActionAid and ADB, 2003: 13; ActionAid and UNDP, 2003: 16). Additionally, poor infrastructure is recognised as a major cause of the high rate of poverty in rural and remote isolated localities (Vietnam Solutions, 2003: 21-22). The Government of Vietnam, as supported by the donor community, has been providing substantial resources for the electrification of villages, the development of roads to isolated communes, and the building of rural schools and clinics. Other determining factors of the success in poverty reduction during 1993-2004 include: the relatively pro-poor nature of budget transfers (World Bank, 2005: 14); increasing migration to fast-growing urban areas (particularly for getting jobs in fast-growing sectors, such as textile and garment), with associated increased remittances and positive impacts on people’s livelihoods (JICA and Institute of Sociology, 2003: 70; World Bank, 2003: 110; Nguyen Thang, 2005: 24-25); and poverty-targeting programmes, such as Hunger Eradication and the Poverty Reduction Programme and the area-based Programme 135, which targets mountainous and ethnic minority-populated regions (ActionAid and UNDP: 13; Action Aid and ADB: 13). Further factors include: access to credit (JICA and Institute of Sociology, 2003: 38); having
Poverty, Poverty Reduction and Poverty Dynamics in Vietnam
14
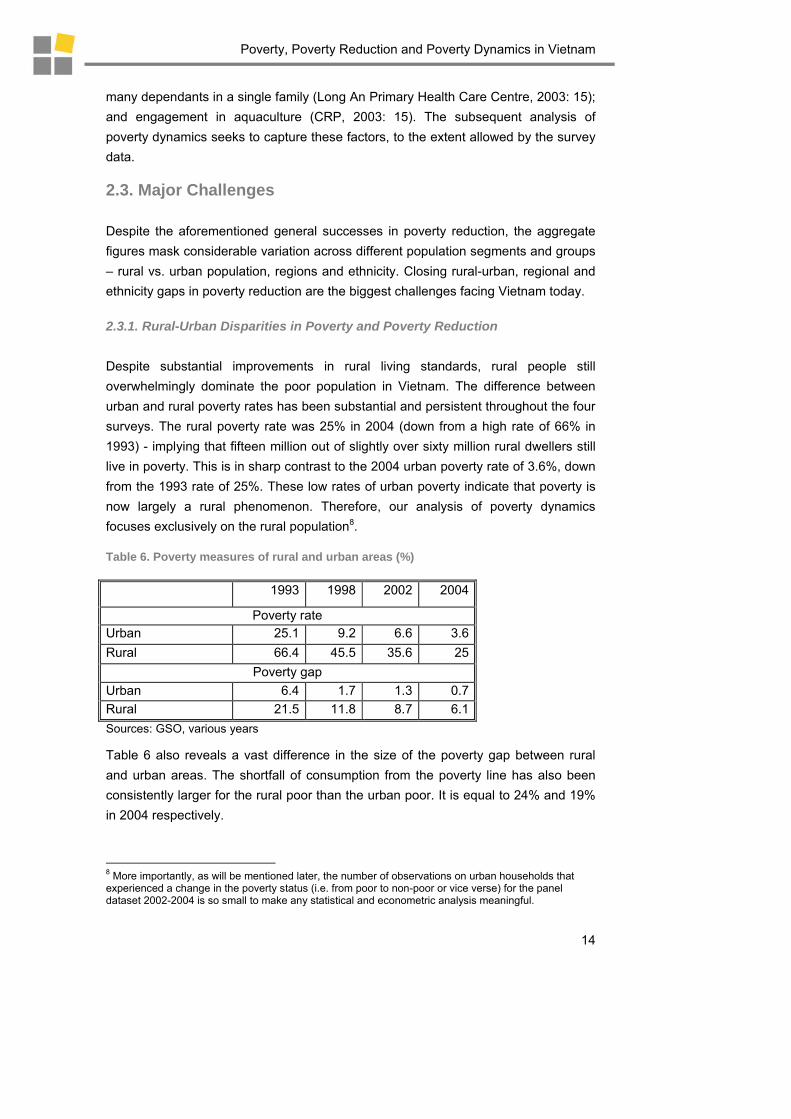
many dependants in a single family (Long An Primary Health Care Centre, 2003: 15); and engagement in aquaculture (CRP, 2003: 15). The subsequent analysis of poverty dynamics seeks to capture these factors, to the extent allowed by the survey data. 2.3. Major Challenges Despite the aforementioned general successes in poverty reduction, the aggregate figures mask considerable variation across different population segments and groups – rural vs. urban population, regions and ethnicity. Closing rural-urban, regional and ethnicity gaps in poverty reduction are the biggest challenges facing Vietnam today. 2.3.1. Rural-Urban Disparities in Poverty and Poverty Reduction Despite substantial improvements in rural living standards, rural people still overwhelmingly dominate the poor population in Vietnam. The difference between urban and rural poverty rates has been substantial and persistent throughout the four surveys. The rural poverty rate was 25% in 2004 (down from a high rate of 66% in 1993) - implying that fifteen million out of slightly over sixty million rural dwellers still live in poverty. This is in sharp contrast to the 2004 urban poverty rate of 3.6%, down from the 1993 rate of 25%. These low rates of urban poverty indicate that poverty is now largely a rural phenomenon. Therefore, our analysis of poverty dynamics focuses exclusively on the rural population8.
Table 6. Poverty measures of rural and urban areas (%) 1993 1998 2002 2004
Poverty rate Urban 25.1 9.2 6.6 3.6Rural 66.4 45.5 35.6 25
Poverty gap Urban 6.4 1.7 1.3 0.7Rural 21.5 11.8 8.7 6.1Sources: GSO, various years
Table 6 also reveals a vast difference in the size of the poverty gap between rural and urban areas. The shortfall of consumption from the poverty line has also been consistently larger for the rural poor than the urban poor. It is equal to 24% and 19% in 2004 respectively.
8 More importantly, as will be mentioned later, the number of observations on urban households that experienced a change in the poverty status (i.e. from poor to non-poor or vice verse) for the panel dataset 2002-2004 is so small to make any statistical and econometric analysis meaningful.
Poverty, Poverty Reduction and Poverty Dynamics in Vietnam
15
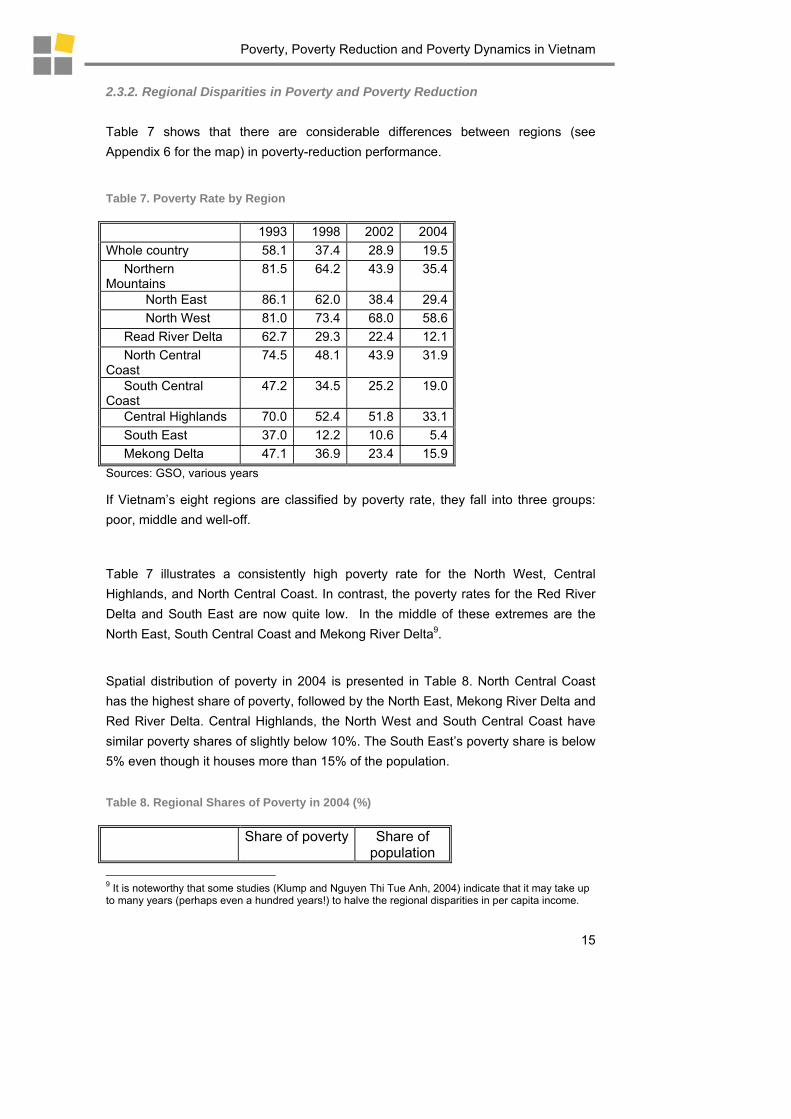
2.3.2. Regional Disparities in Poverty and Poverty Reduction Table 7 shows that there are considerable differences between regions (see Appendix 6 for the map) in poverty-reduction performance. Table 7. Poverty Rate by Region 1993 1998 2002 2004Whole country 58.1 37.4 28.9 19.5 Northern Mountains
81.5 64.2 43.9 35.4
North East 86.1 62.0 38.4 29.4 North West 81.0 73.4 68.0 58.6 Read River Delta 62.7 29.3 22.4 12.1 North Central Coast
74.5 48.1 43.9 31.9
South Central Coast
47.2 34.5 25.2 19.0
Central Highlands 70.0 52.4 51.8 33.1 South East 37.0 12.2 10.6 5.4 Mekong Delta 47.1 36.9 23.4 15.9Sources: GSO, various years
If Vietnam’s eight regions are classified by poverty rate, they fall into three groups: poor, middle and well-off.
Table 7 illustrates a consistently high poverty rate for the North West, Central Highlands, and North Central Coast. In contrast, the poverty rates for the Red River Delta and South East are now quite low. In the middle of these extremes are the North East, South Central Coast and Mekong River Delta9.
Spatial distribution of poverty in 2004 is presented in Table 8. North Central Coast has the highest share of poverty, followed by the North East, Mekong River Delta and Red River Delta. Central Highlands, the North West and South Central Coast have similar poverty shares of slightly below 10%. The South East’s poverty share is below 5% even though it houses more than 15% of the population.
Table 8. Regional Shares of Poverty in 2004 (%) Share of poverty Share of
population 9 It is noteworthy that some studies (Klump and Nguyen Thi Tue Anh, 2004) indicate that it may take up to many years (perhaps even a hundred years!) to halve the regional disparities in per capita income.

Poverty, Poverty Reduction and Poverty Dynamics in Vietnam
16
Northern Mountains 26.1 14.4North East 17.2 11.4North West 8.9 3.0
Red River Delta 13.6 21.8North Central Coast 21.1 12.9South Central Coast 8.3 8.6Central Highlands 9.6 5.7South East 4.4 15.9Mekong Delta River 17.0 20.9
Source: GSO, 2005 2.3.3. Ethnicity Disparities in Poverty and Poverty Reduction One of the biggest policy concerns in Vietnam today is that ethnic minorities do not participate in, and benefit adequately from, the growth process, which may jeopardise the sustainability of development. According to VHLSS04 data, there are slightly over ten million of non-Kinh, non-Chinese ethnic people in Vietnam; they only account for 12.6% of the total population, but 39.3% of the poor population. Table 9. Poverty Measures by Ethnicity (%) 1993 1998 2002 2004
Poverty rate Kinh & Chinese
53.9 31.1 23.1 13.5
Other ethnic minority groups
86.4 75.2 69.3 60.7
Poverty gap Kinh & Chinese
16 7.1 4.7 2.6
Other ethnic minority groups
34.7 24.2 22.8 19.2
Source: GSO, various years
Although poverty reduction for ethnic minorities is evident (by 25 percentage points over the period 1993-2004), it has been much slower than the pace for the Kinh-Hoa (Chinese) group10. As a consequence, the absolute difference in poverty rate between the Kinh-Hoa and ethnic minorities has been increasing, from 32.5 percentage points in 1993 to 47.2 percentage points in 2004. In 2004, the poverty rate for ethnic minorities was 61%, which is approximately 4.5 times poverty rate for the Kinh and Hoa. In absolute terms, there are now as many as 6.2 million people
10 The progress in poverty reduction in 2002-2004 period for ethnic minority groups is also more limited than for the Kinh-Hoa, although the absolute level of poverty rate for the latter is much lower.
Poverty, Poverty Reduction and Poverty Dynamics in Vietnam
17
from ethnic minorities who are poor, while this number of the Kinh and Hoa is 9.5 million . The poverty gap was also closed more rapidly by the Kinh-Hoa group than by ethnic minorities. On average, a poor person from Kinh-Hoa group is VND 395 thousand (or about 20%) short of the poverty line, while these figures for an average poor person from ethnic minorities are VND 665 thousand and 33% respectively. Importantly, ethnic minorities also fare less well than the Kinh-Hoa group in terms of social indicators, as revealed by the household surveys. With regards to infrastructure, while the gaps in access to electricity show signs of reducing substantially (92% of the Kinh and Hoa and 48% of ethnic minority households in 2002, compared to 54% and 7% respectively in 1993), they are still large and even widening with regards access to clean water and sanitation. In particular, in 2002, of people from ethnic minorities, only 4% have access to sanitation and only 13% have access to clean water, as opposed to respectively 28% and 53% for the Kinh-Hoa group. These figures for 1993 are 1% and 5% for ethnic minorities and 12% and 29% for the Kinh- Hoa. 2.3.4. Vulnerability
Figure 1 indicates that in 2002 there were a considerable number of near-poor households. In the context of the recent intensification of Vietnam’s integration into the world economy, trade/external shocks may affect changes in poverty status of those near-poor households. PPAs conducted in Central Highlands confirmed the high vulnerability of coffee growers (Action Aid and ADB 2003: 19).
3. Poverty Dynamics: A Brief Review of Academic Literature Whilst the previous section sought to identify key policy issues relating to poverty dynamics in Vietnam, this section seeks to provide methodological guidance, as well as further guidance on possible policy issues. Importantly, findings of Vietnam-

Poverty, Poverty Reduction and Poverty Dynamics in Vietnam
18
focused studies, based on the 1993-1998 panel dataset, will, where possible, be used for comparison with the results of our analysis, based on the 2002-2004 panel dataset. The standard approach to an analysis of poverty dynamics is to apply multinomial (or binomial) logistic regressions to panel datasets, in order to understand the determinants of poverty dynamics (for details of studies using this method see the extensive list in the references section at the end of this report). Numerous authors have applied this method to the panel dataset constructed from Vietnam’s household surveys of 1993 and 1998. Glewwe et al (2002),Justino and Litchfeld (2003a; 2003b) and Nimi et al (2003) all use various modifications of this standard model to investigate why some poor households managed to escape from poverty and others could not, and why some non-poor households fell into poverty. While the poverty dynamic matrix is presented for both rural and urban households in some of these studies, the small size of the urban panel does not permit independent estimation (Nimi et al, 2003: 26). In terms of methodology, in contrast to Glewwe et al (2002) and Nimi et al (2003), Justino and Litchfeld (2003b) attempted to use the change variables, which causes some concerns among researchers about the endogeneity problem. In terms of findings, although the authors applied slightly different models, there are a number of results that are quite robust across all studies. The common determining factors for poverty dynamics in Vietnam during 1993-1998 include (i) location as classified into 7 regions; (ii) ethnicity as classified into the Kinh-Hoa and other ethnic minority groups; (iii) education of household’s head; (iv) household head’s type of employment; (v) household demographic characteristics; and (vi) access to infrastructure. By including additional reform-related variables, Nimi et al (2003) and Justino and Litchfeld (2003b) also found that the degree of engagement in fast-growing sectors, such as coffee, rice, seafood, and the level of use of fertiliser also helped explain poverty dynamics in 1993-1998. Nimi et al (2003) found that the degree of engagement in export (measured by ratio of households working in export) were additional determinants of change in poverty status. They classified them as trade-related determinants of poverty dynamics. The findings of these studies were also used to guide the following econometric analysis of determinants of poverty dynamics in Vietnam for the 2002-2004 period. Comparison between those and new results will be made where extent possible.

Poverty, Poverty Reduction and Poverty Dynamics in Vietnam
19
4. Poverty Dynamics in Vietnam 2002-2004: Findings from Analysis of Panel Dataset 2002-2004 Our analysis of poverty dynamics for the 2002-2004 period builds on previous studies of Vietnam analysing the 1993-1998 period, for which panel dataset is also available. As in those studies, no separate regressions to study urban poverty dynamics are possible because there are insufficient numbers of observations of poor urban households from the panel dataset 2002-2004 (Table 10)11. Given the significant differences in characteristics of urban and rural poor households, only the rural sub-set of the panel sample is used for econometric analysis. For the purpose of facilitating comparison with earlier studies, our multinomial logistic regressions started with a similar set of variables as found in Justino and Litchfeld (2003b), which can be seen as an extended version of Glewwe et al (2002). Table 10. Urban and Rural Poverty Dynamics 2002-2004 Urban Rural Total Poor;Poor: Number of observations
21 556 577
In percentage 2.44 17.67 14.4 Poor;Non-poor: Number of observations
34 452 486
In percentage 3.94 14.37 12.13 Non-poor;Poor: Number of observations
15 182 197
In percentage11 1.74 5.79 4.92 Non-poor;Non-poor: Number of observations
792 1,956 2,748
In percentage 91.88 62.17 68.56 Total number of observations 862 3,146 4,008
In percentage 100 100 100 However, a few modifications will be introduced to better answer questions relevant to the overall chronic poverty study. Specifically, to better capture the impact of agricultural growth on poverty dynamics, agricultural production is more disaggregated than in earlier studies. For studying the role of urban growth on rural 11 In the Table, there are only 45 observations on urban poor households in 2002, of which 21 are poor in both years and 34 poor in 2002 and non-poor in 2004.

Poverty, Poverty Reduction and Poverty Dynamics in Vietnam
20
poverty dynamics, a separate variable for domestic remittances is included, as the literature review exercise has found migration and associated remittances as an important channel linking these two. Importantly, given the significant and increasing rate of divergence in poverty-reduction rates, and presumably determinants, for the Kinh-Hoa and ethnic minorities, separate regressions will be carried out for the rural Kinh- Hoa and rural ethnic minorities groups, in addition to a more general analysis of rural Vietnam. These additional regressions aim to shed greater light on determinants at a more disaggregated level. 4.1. A Descriptive Analysis of Poverty Transition Selected socioeconomic characteristics in association with poverty dynamics derived from the panel dataset 2002-2004 are presented in Table 11. A technical note in Appendix 2 elaborates on how some variables are constructed from household survey data. Before discussing the indicators in the table, there are a number of points that need to be made explicit. First, in calculations of aggregate indicators for 2002 on the basis of the panel data 2002-2004, we use household and individual sampling weights for the whole 2002 sample. This is different from Justino and Litchfied (2003b: 20), who used unweighted averages. Although there is no documentation on how the panel was drawn from the sampling frame, and it is thereby unclear what sampling weights should be used to make the panel representative of the whole population, our tests have shown that using the 2002 sampling weights provide better estimates of poverty incidence at both aggregate and disaggregated levels (i.e. disaggregation by regions, rural vs. urban areas, ethnicity etc.) than simple averages (i.e. they are closer to their counterparts for the whole sample than the unweighted estimates). Second, indicators on access to infrastructures for 1993 period in the table are deliberately left blank. The reason is that the 1993 (and the 1998) questionnaire asks for information at the commune level, while the 2002 questionnaire asks for village-level, thus making those data incomparable.

Poverty, Poverty Reduction and Poverty Dynamics in Vietnam
21
Table 11. Socio-Economic Characteristics and Poverty Dynamics Poor in both
years
Poor in 2002 & Non-poor in 2004
Non-poor in 2002 & Poor in 2004
Non-poor in both years
2002-2004
1993-1998
2002-2004
1993-1998
2002-2004
1993-1998
2002-2004
1993-1998
All Vietnam 16.47 28.7 12.99 27.4 4.06 4.8 66.48 39.11. Urban vs. Rural 1.1. Urban 4.58 5.64 6.09 27.08 1.2. Rural 95.42 94.36 93.91 72.92 2. Geographic characteristics (%)
2.1. Northern Uplands 25.28 26.20 14.90 15.90 19.41 15.10 12.23 8.602.2. Red River Delta 10.67 21.00 19.28 30.50 15.17 19.50 22.33 22.302.3. North Central Coast 24.27 18.90 18.87 17.70 14.17 12.20 11.23 8.802.4. South Central Coast 6.72 10.20 8.15 9.70 13.12 9.60 10.09 14.302.5. Central Highlands 16.29 4.00 11.05 2.60 6.32 1.50 4.01 2.002.6. South East 1.78 3.10 7.27 9.70 7.66 5.40 15.98 18.602.7. Mekong River Delta 15.00 16.60 20.50 13.90 24.14 36.60 24.13 25.203. Ethnic group 3.1. Kinh-Hoa 57.30 71.80 82.80 91.80 85.00 85.90 95.20 96.43.2. Ethnic Minorities 42.70 28.20 17.20 8.20 15.00 14.10 4.80 3.64. Demographic characteristics
4.1. Head is female (%) 11.60 18.90 14.00 24.10 20.60 26.30 21.20 32.44.2. Household size 5.24 5.40 4.96 5.10 4.35 4.50 4.27 4.5Notes: (i) all characteristics (e.g. demographic, education, occupation etc.) are for the starting year (i.e. 1993 for the 1993-1998 period and 2002 for the 2002-2004 period) (ii) Figures for 2002-2004 are the authors’ calculations from the Vietnam Household Living Standards Surveys 2002 and 2004 (iii) Figures for 1993-1998 on geographic characteristics, ethnic groups and occupation of household head are from Table 4 in Glewee et al (2002). (iv) Figures for 1993-1998 on human capital characteristics (education) are calculated on the basis of Table 2 in Justino and Litchfied (2003b).

Poverty, Poverty Reduction and Poverty Dynamics in Vietnam
22
Socio-economic Characteristics and Poverty Dynamics (continued) 5. Human capital characteristics
5.1. None 50.27 47.89 34.76 35.01 43.10 42.85 25.69 34.95.2. Head: primary school 27.15 23.40 26.38 24.57 21.21 29.40 22.76 24.85.3. Head: lower secondary school
18.74 22.83 33.04 30.16 26.75 22.01 28.71 21.1
5.4. Head: upper secondary school
3.79 2.44 3.54 3.44 6.49 2.06 10.04 5.9
5.5. Head: Technical/university
0.06 3.44 2.28 6.82 2.46 3.68 12.80 13.4
6. Head's occupation (%)
6.1. Agriculture 72.09 81.00 62.81 72.80 61.36 72.70 39.31 46.76.2. White-collar 3.21 0.90 6.18 3.20 7.25 3.40 14.19 9.46.3. Sales 3.17 2.20 5.98 4.90 4.30 4.90 12.61 14.86.4. Production 10.74 5.80 12.79 9.60 15.72 7.30 18.66 13.3 6.5. Head's employment: not working
10.80 10.20 12.24 9.50 11.38 11.70 15.23 15.8
7. Access to infrastructures
7.1. Main source of lighting is electricity
66.48 82.64 85.23 94.20
7.2. Having access to clean water
19.89 24.99 30.61 55.37
7.3. Village has permanent road
33.05 37.31 41.54 36.98
7.4. Village has a post office
34.01 34.61 35.52 33.32
7.5. Village has a market 44.60 43.57 45.97 42.31 7.6. Village has a lower school
29.92 25.77 30.43 25.92
7.7. Village has an upper school
6.19 5.01 6.52 4.04
7.8. Village has a health centre
97.90 98.40 99.24 97.98
7.9. Village has an extension centre
26.98 27.19 31.20 25.91
Poverty, Poverty Reduction and Poverty Dynamics in Vietnam
23

Poverty, Poverty Reduction and Poverty Dynamics in Vietnam
24
Table 11 shows that the percentage of chronically poor people has dropped substantially, from 28.7% during the 1993-1998 period to 16.47% for the 2002-2004 period, i.e. by more than 12 percentage points. However, the progress has been uneven across different segments of the populations. There are also differences across population groups in movements in and out of poverty. With regards to the rural-urban disparity, similar to the picture of overall poverty, the rural population has the dominant share of chronic poverty – 95.42% (against rural population share of 79.25%). With regards to regional differences, there have been some quite discernible changes in the spatial distribution of chronically poor people. The Red River Delta exhibited the fastest drop in the share of national chronic poverty, while the share of North Central Coast and particularly Central Highlands increased substantially. The spatial distribution of chronic poverty during the 2002-2004 is such that Northern Uplands has the largest proportion of chronically poor people in Vietnam, immediately followed by North Central Coast and then by Central Highlands. The South East’s share is negligible, while that of South Central Coast is quite small. With regards households that managed to escape from poverty, the Mekong River Delta showed the best performance, some 20.5% (as against its 9.74% share of total population) while South Central Coast appears to have performed weakly with a share of only 13.12% (as against its 21.86% population share). Shares of other regions in total households escaping poverty are more or less in line with their respective population shares12. The progress in reducing chronic poverty also varies across the Kinh Hoa and ethnic minorities. The share of ethnic minorities in total chronic poverty increased to reach 42.70%, which is very high as they only constitute 11% of total population. With regards households that moved in or out of poverty, both these shares of ethnic minorities are slightly higher than their respective population shares and comparable to one another. In terms of other characteristics, as compared to the three other groups (i.e. moving out of poverty, moving into poverty and being non-poor at both the beginning and end of the period in consideration), chronically poor households tend to have larger household size, with lower levels of education attainment of the head, and more likely to work in agriculture. The shift in occupation of household head for all the four groups reflected the overall shift in the economy towards fewer people being engaged in agriculture and more people working in non-agriculture sectors.
12 South East is an exception in this respect, sharing in 7.66% of total poverty escaping households and 14.49% of total population. However, the poverty incidence in South East is already low at 10.6% against 28.9% for the whole Vietnam in 2002.
Poverty, Poverty Reduction and Poverty Dynamics in Vietnam
25
As compared to the other three groups, chronically poor persons also have more limited access to some types of infrastructure, such as electricity, clean water, and roads, but have comparable access others (post offices, markets, primary and secondary schools, health care units and village extension service centres). 4.2. Econometric Analysis of Poverty Dynamics:
As mentioned earlier, the standard methodology of multinomial logistic regressions has been used to study poverty dynamics during the period 2002-2004. A brief discussion of this methodology can be found in Glewwe et al (2002) and Justino Litchfield (2003b). Detailed results of our econometric analysis can be found in Appendix 3 (poverty dynamics for the whole rural Vietnam), Appendix 4 (analysis disaggregated by ethnicity for movements out of poverty), and Appendix 5 (analysis disaggregated by ethnicity for movements into poverty). The estimates presented in these appendixes are already corrected for heteroscedasticity, which is common in household survey data using White’s adjusted heteroscadasticity-consistent variances (Deaton, 1997). The determining factors of poverty dynamics for 2002-2004, which were found to be statistically significant, are summarised in Table 12 and Table 13 below. The first section of Table 12 illustrates factors that increase the probability of households that were poor in 2002 becoming non-poor in 2004. The first factor is ethnicity: being a member of the Kinh-Hoa group raises the likelihood of an escape from poverty. This result was expected, given an earlier discussion in sub-section 2.2.3, and is consistent with earlier studies of Glewee et al (2002), Justino and Litchfield (2003a; 2003b), and Nimi et al (2003). This reconfirmed the persistent under-performance of poverty reduction for ethnic minorities since 1993. The second set of factors is linked to geographical location. During 2002-2004, living in South East and Mekong River Delta made a rural household, which was poor in 2002, more likely to escape from poverty. This is robust for both the Kinh-Hoa group and ethnic minorities and similar to the 1993-1998 period, as confirmed by all the above-mentioned studies. Living in Red River Delta and South Central Coast only raises probability of moving out poverty for rural household of the Kinh-Hoa group. As this group dominates the whole sample (3,446 out of 4,008 observations in the entire sample), the pooled regressions also show (possibly wrongly) that this is true for the whole rural Vietnam. For the earlier period 1993-1998, Glewee et al (2002) and Nimii et al (2003) find that living in Red River Delta raises probability of escaping poverty, while Justino and Litchfield (2003b) do not. No studies find that living in South Central Coast, rather than North Central Coast, makes poor rural household more

Poverty, Poverty Reduction and Poverty Dynamics in Vietnam
26
likely to get out of poverty. The most interesting finding may be related to North Uplands and Central Highlands; living in either of these two regions only increases the likely escape for poor rural households from ethnic minorities (not the rural Kinh Hoa, nor the rural Vietnam as the whole). Earlier studies for the 1993-1998 period, which run pooled regressions did not find variables for the rural North Uplands statistically significant. Glewee et al (2002) and Nimii et al (2003) found variables for the rural Central Highlands significant (Justino and Litchfiled, 2003b, – not).
Table 12. Determining Factors of Movement Out of Poverty during 2002-2004
Rural Vietnam
Rural Kinh
Rural Ethnic
Minorities 1 Variables that increase probability of
escaping poverty
Ethnicity (reference group – ethnic minorities) √ n/a n/a Geographic characteristics (reference group -
North Central Coast)
Northern Uplands √ Red River Delta √ √ South Central Coast √ √ Central Highlands √ √ South East √ √ √ Mekong River Delta √ √ √ Human capital characteristics (reference group
– no education)
Head: lower secondary school √ √ √ Head: Technical/university √ Head's Occupation (reference group: head’s
engagement in agriculture)
Head's employment: white-collar √ √ Head's employment: sales √ Farm activities/ External shocks Payments for insecticides √ Rice volumes in 000 VND √ √ Coffee volumes in 000 VND √ √ Values of pigs produced in last 12 months √ √ Values of poultry produced in last 12 months √ √ Values of aquaculture produced √ √ Assets Current values of productive assets √ √ √ Infrastructure/Community characteristics Main source of household’s lighting is
electricity √ √
Village has permanent road √ Village has a lower secondary school √ Village has an upper secondary school √
Comment [a1]: Does this mean, ‘however Justino et al did not’?

Poverty, Poverty Reduction and Poverty Dynamics in Vietnam
27
Village has a health centre √ Village has an extension centre √ 2 Variables that decrease probability of
escaping poverty
Geographic characteristics (reference group - North Central Coast)
South Central Coast √ Demographic characteristics Number of children 0-18 √ √ Head's occupation (reference group: head’s
engagement in agriculture)
Head's employment: production √ Farm activities/External shocks Payment for insecticides √ Infrastructures Village has a market
√
Village has an upper secondary school √
The third set of factors is linked to the human capital characteristics of households. Households with heads that have completed lower secondary school are more likely to get out of poverty, and this result is robust across two types of households and also consistent with earlier studies for 1993-1998, such as Justino and Litchfield (2003b) and Nimii et al (2003)13. Technical/university level of household head’s education is found to be statistically significant at the 10% level for the whole rural sample 2002-2004, but not for each of the two groups. This may be due to the limited freedom of the estimation, given the limited number of households with head’s having this level of educational attainment (339 for the Kinh-Hoa group and 31 for ethnic minorities). Pooling them together may have helped to reach the ’critical mass‘ of observations. For 1993-1998, this variable was found to be statistically significant,(Justino and Litchfield, 2003b; Nimii et al, 2003). Results on the fourth set of factors – occupation of household head – show a few surprises. Types of occupation of household head do not affect movement out of poverty for poor rural Kinh-Hoa households. However, for poor rural households from ethnic minorities, they would have had a better chance of moving out of poverty if in 2002 the household head was white-collar worker or was engaged in sales and services14. For 1993-1998, this finding, on the role of white-collar employment in helping rural households get out of poverty, is robust, while findings on other types of
13 Glewee et al (2002) however used the number of schooling years as an explanatory variable, which was found to be statistically significant. 14 The latter result however should be interpreted with care, as there are only 17 observations with this characteristic (out of 562 observations on households from ethnic minorities).

Poverty, Poverty Reduction and Poverty Dynamics in Vietnam
28
employment are not (i.e. significant in some models in some studies and insignificant in the others). The fifth set of factors – farm activities/external shocks – vary depending on what ethnicity group households belong to. It should be noted that although these variables are measured in monetary terms, they can be interpreted as volumes or scales of respective productive activities in the base year of 2002, as we can normalise prices for 2002 to unity. Under a restrictive assumption of fixed savings ((Niimi et al, 2003: 26-27), these variables can be interpreted to capture the price effects on poverty dynamics (in this case, changes in prices of agricultural inputs and outputs), or alternatively, price-induced growth of agricultural incomes on changes in poverty status. Table 12 shows that greater involvement in coffee production, pig and poultry farming, and aquaculture all raised the chances of rural Kinh-Hoa households escape out of poverty, possibly thanks to the favourable prices of these products in the 2002-2004 period, while scale of rice production only helped rural households from ethnic minorities. The findings for 1993-1998 on the impact of coffee production for rural households in general were similar (Justino and Litchfield, 2003b: 20; Niimi et al, 2003: 32). The payment (proxied for the level of use) of insecticides is found to raise chance of poor rural Kinh-Hoa households to escape poverty15. These all have confirmed the importance of growth of various sources of agricultural incomes for movement out of poverty for poor rural households, particularly for those from the Kinh-Hoa group. Current values of productive assets are found to be a robust factor in raising poor rural households’ chances of escaping poverty. With regards to the last set of factors – access to infrastructure at community and household levels – the findings also differ for different ethnicity groups. Access to electricity at the household level and to upper secondary school and health centre at the village level is only found to have raised the chances of escaping poverty for rural Kinh-Hoa households. Access to permanent roads and lower secondary school is found to have contributed to increasing the probability of rural ethnic minority households’ move out of poverty. For 1993-1998, a household’s likelihood of escaping poverty was found to be increased by having access to electricity (Justino and Litchfield, 2003b; Niimi et al, 2003) and road (Niimi et al, 2003), but our results may not be fully comparable with these because of different definitions of access to infrastructure in the 1993 and 2002 questionnaires. In the former, access is measured at the commune level while in the
15 As our models control for the use of fertiliser, which is not statistically significant, the finding on insecticides may be a bit surprising, given its tiny share in total agricultural production cost. However, this variable may proxy for non-fertiliser inputs which are correlated with insecticides, and therefore they (more precisely, their price effects) as a whole are important for poverty dynamics of poor rural Kinh-Hoa household.
Poverty, Poverty Reduction and Poverty Dynamics in Vietnam
29
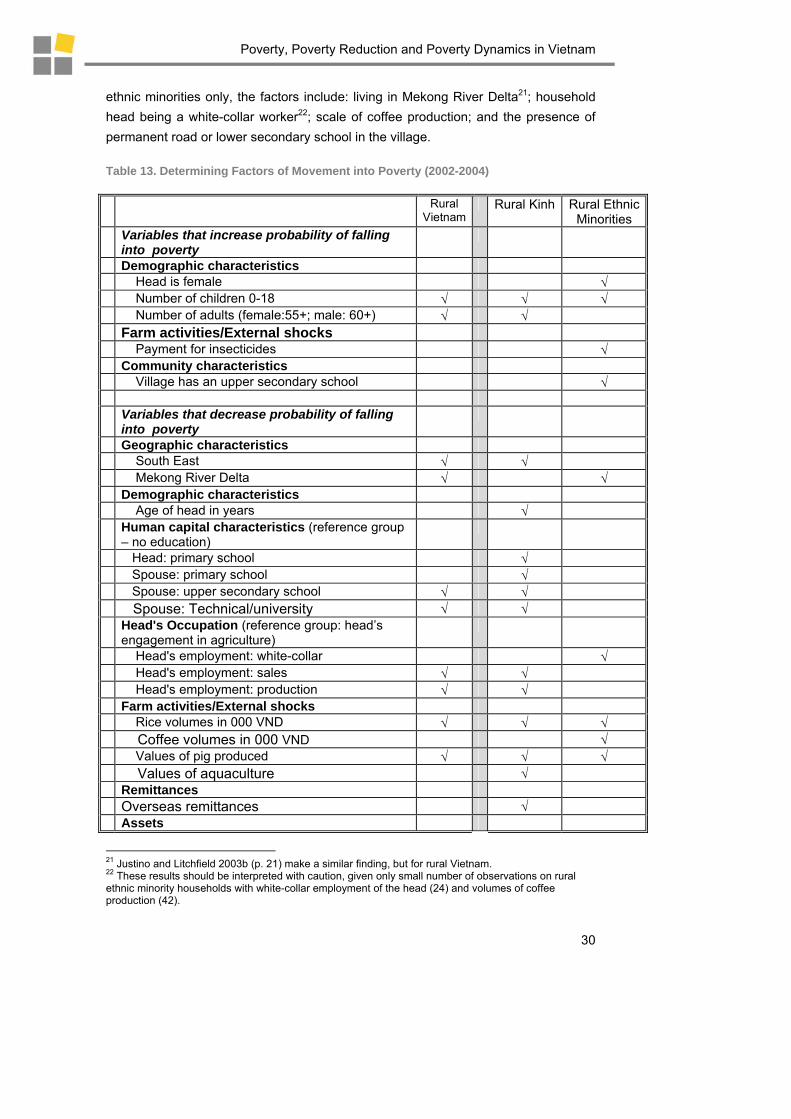
latter it is measured at the village level – this reflects the improvement in infrastructure in Vietnam and therefore need to monitor it at a lower level. Factors that lower the chances of rural households moving out of poverty are: (i) the number of children between 0 and 18 years of age16 for poor rural Kinh Hoa households; (ii) household head’s engagement in non-agricultural, non-services production, for those living in South Central Coast;; (iii) level of insecticide use; and (iv) for rural households from ethnic minorities, living in a village with both a market and upper secondary school .Although the findings for the Kinh-Hoa group are quite intuitive, the findings for ethnic minorities are less easily understood (and, in some cases, counter-intuitive) without additional information, which is still absent and could be researched, given the present importance of issues related to poverty amongst ethnic minorities in Vietnam at present. Table 13 provides a list of factors determining the movement into poverty for non-poor rural households in Vietnam. The only factor common to both Kinh-Hoa and ethnic minorities, in this regard, is a higher number of children between 0 and 18 years of age – this number comprises part of the dependency ratio17. The number of elderly people (another component of the dependency ratio) only raises the probability of falling into poverty for rural households from the Kinh-Hoa group, while female head, payment for insecticides and having upper secondary school in the village are factors for rural household from ethnic minorities. Again, it is not easy to find explanations for the factors relevant to ethnic minorities without additional information. In terms of factors lowering the probability of non-poor rural households falling into poverty, the scale of rice and pig production is a factor common to both the Kinh-Hoa and ethnic minorities. Factors only relevant to the Kinh-Hoa group include: living in the South-East18; age of head; head with primary school education19; spouse having educational attainment at either primary or upper secondary school or technical/university level; household’s head being engaged in sales or production; scale of aquaculture; size of overseas remittances; and access to electricity20. For
16 Once household size is controlled in our model, this variable can proxy for the dependency ratio. We have tried various upper thresholds instead of 18 (e.g. 10, 12 and 15) to capture child labour, but the results are robust. 17 For 1993-1998, high dependency ratio also raises probability of falling into poverty (Justino and Litchfield, 2003: 20) 18 This is similar to what was found for rural or all Vietnam during 1993-1998 period (Glewee et al, 2002: 15; Justino and Litchfield, 2003b: 21, Niimi et al, 2003: 30) 19 Similar to finding for rural Vietnam during 1993-1998 in Justino and Litchfield, 2003b: 21 (but not in the other studies) 20 Similar to finding for rural or all Vietnam during 1993-1998 in Justino and Litchfield 2003b: 21 and Niimi et al, 2003: 30 (but not in Glewee et al, 2002)
Poverty, Poverty Reduction and Poverty Dynamics in Vietnam
30
ethnic minorities only, the factors include: living in Mekong River Delta21; household head being a white-collar worker22; scale of coffee production; and the presence of permanent road or lower secondary school in the village. Table 13. Determining Factors of Movement into Poverty (2002-2004) Rural
Vietnam Rural Kinh Rural Ethnic
Minorities Variables that increase probability of falling
into poverty
Demographic characteristics Head is female √ Number of children 0-18 √ √ √ Number of adults (female:55+; male: 60+) √ √ Farm activities/External shocks Payment for insecticides √ Community characteristics Village has an upper secondary school √ Variables that decrease probability of falling
into poverty
Geographic characteristics South East √ √ Mekong River Delta √ √ Demographic characteristics Age of head in years √ Human capital characteristics (reference group
– no education)
Head: primary school √ Spouse: primary school √ Spouse: upper secondary school √ √ Spouse: Technical/university √ √ Head's Occupation (reference group: head’s
engagement in agriculture)
Head's employment: white-collar √ Head's employment: sales √ √ Head's employment: production √ √ Farm activities/External shocks Rice volumes in 000 VND √ √ √ Coffee volumes in 000 VND √ Values of pig produced √ √ √ Values of aquaculture √ Remittances Overseas remittances √ Assets
21 Justino and Litchfield 2003b (p. 21) make a similar finding, but for rural Vietnam. 22 These results should be interpreted with caution, given only small number of observations on rural ethnic minority households with white-collar employment of the head (24) and volumes of coffee production (42).

Poverty, Poverty Reduction and Poverty Dynamics in Vietnam
31
Current values of productive assets √ Infrastructures Main source of lighting is electricity √ √ Village has permanent road √ Village has a market √ Village has a lower secondary school √

Poverty, Poverty Reduction and Poverty Dynamics in Vietnam
32
5. Conclusion Vietnam has achieved remarkable success in poverty reduction, as shown by general rates of poverty for 1993-2004 and 2002-2004 in particular. However, these aggregate numbers mask significant variation in progress in poverty reduction for different segments of the society. There are considerable differences in poverty, in its multiple dimensions, between rural and urban populations, between different regions, and particularly between the Kinh-Hoa group and ethnic minorities. Together with overall poverty reduction, the percentage of chronically poor people has dropped substantially. However, again this progress has been uneven across different segments of the populations. There are also differences across population groups for movements in and out of poverty. As a result of these changes, poverty, in general, and chronic poverty, in particular, in Vietnam, at present, is rural, and, if taking a deeper look, overwhelmingly a phenomenon afflicting ethnic minorities. Further econometric analysis has found that determinants of poverty dynamics vary quite substantially between rural households from the Kinh-Hoa group and ethnic minorities. This suggests that future policy interventions should be designed in a manner sensitive to ethnicity. As agricultural growth has been found to be an important factor in increasing rural households’ chances of escaping poverty (particularly for those from the Kinh-Hoa ethnic majority group), policies that help to sustain stable and relatively high growth rates of agricultural incomes are key to sustaining fast poverty reduction. In light of the volatility of the international markets of agricultural products, insurance instruments for agricultural producers should be strengthened. Continued public investments in rural infrastructures, both hard and soft, would also clearly help, although they may have differentiated impacts on Kinh-Hoa and ethnic minorities, which should be taken into account when designing targeted programmes.

Poverty, Poverty Reduction and Poverty Dynamics in Vietnam
33
References
Action Aid&ADB. 2003. DakLak: A Participatory Poverty and Governance Assessment (PPGA). Hanoi, August 2003.
Action Aid&UNDP. 2003. Ha Giang: Participatory Poverty Assessment. Hanoi, August 2003.
Centre for Rural Progress. 2003. Ninh Thuan: Participatory Poverty Assessment. Hanoi, July-August 2003.
Crandall, Mindy S., and Bruce A. Weber. 2004. Local Social and Economic Conditions, Spatial Concentration of Poverty, and Poverty Dynamics. American Journal of Agricultural Economics 86, No. 5, pp. 1276-1281.
Deaton, Angus. 1997. The Analysis of Household Surveys: A Microeconometric Approach to Development Policy. John Hopkins University Press.
Fields, Gary S.; Paul L. Cichello; Samuel Freije; Marta menendez; and David Newhouse. 2003. Household Income Dynamics: A Four-Country Story. The Journal of Development Studies, Vol.40, No.2, December 2003, pp.30–54. Frank Cass, London.
Finnie, Ross, and Arthur Sweetman. 2003. Poverty Dynamics: Empirical Evidence for Canada. Canadian Journal of Economics Vol. 36, No. 2, pp 291-325.
Glewwe, Paul, Michele Gragnolati, and Hassan Zaman. 2002. Who Gained from Vietnam’s Boom in the 1990s?. Economic Development and Cultural Change, 50(4), 773-92.
GSO. 2004. The Real Situation of Enterprises Though the Results of Surveys Conducted in 2001, 2002, 2003, Statistics Publishing House, Hanoi
GSO. 2005. The Real Situation of Enterprises Though the Results of Surveys Conducted in 2002, 2003, 2004, Statistics Publishing House, Hanoi
GSO. 2006. Vietnam Statistical Yearbook 2004, Statistics Publishing House, Hanoi
Herrera, Javier. 2001. Poverty Dynamics in Peru, 1997-1999. Working paper DT/2001-09. DIAL, Paris. Processed.
Herrera, Javier, and Francois Roubaud. 2005. Urban Poverty Dynamics in Peru and Madagascar, 1997-99: A Panel Data Analysis. International Planning Studies, Vol. 10, No. 1, 21–48.

Poverty, Poverty Reduction and Poverty Dynamics in Vietnam
34
IMF. 2006. Vietnam: Poverty Reduction Strategy Paper-Annual Progress Report. IMF Country Report No. 06/70
Japan International Cooperation Agency (JICA) & Institute of Sociology. 2003. Participatory Poverty Assessment in Nghe An Province. Hanoi, July-August 2003.
Justino, Patricia and Julie Litchfeld. 2003a. Welfare in Vietnam during the 1990s: poverty, inequality and poverty dynamics. PRUS Working Paper No.8, University of Sussex.
Justino, Patricia and Julia Litchfeld. 2003b. Poverty Dynamics in Rural Vietnam: Winners and Losers during Reform. Working Paper, Poverty Research Unit, University of Sussex.
Klump Rainer and Nguyen Thi Tue Anh. 2004. Patterns of Provincial Growth in Vietnam, 1995-2000: Empirical Analysis and Policy Recommendations.
Long An Primary Health Care Centre. 2003. Mekong Delta Participatory Poverty Assessment. July – August 2003.
MPI and UNDP. 2005. Phat trien khu vuc dich vu o Vietnam: Chia khoa cho tang truong ben vung (Development of Service Sector in Vietnam: the Key for Sustainable Growth). Available at [www.undp.org.vn/undp/docs/2005/service/ssdv/pdf]
Nguyen Thang. 2005. Policies and Rural Poverty: A Vietnam Case Study on Using Poverty Predictor Model for Participatory Policy Evaluation. Hanoi, November 2005.
Nimi, Yoko, Puja Vasudeva-Dutta and Allan Winters. 2003. Trade Liberalization and Poverty Dynamics in Vietnam. PRUS Working Paper No. 17. University of Sussex.
Litchfield, Julie; Neil McCulloch; and L. Allan Winters. 2003. Agricultural Trade Liberalization and Poverty Dynamics in Three Developing Countries. American Journal of Agricultural Economics 85, No. 5, pp. 1285-1291.
Vietnam Solutions. 2003. Regional Poverty and Governance Assessment Report (for Central Coast and Highlands Region). Hanoi, October 2003.
Vietnamese Academy of Social Sciences. 2006. Poverty Update Report 2006. Draft. Hanoi. 2006
World Bank. 1999. Vietnam Development Report 2000: Attacking Poverty. Hanoi. 1999.
World Bank. 2003. Vietnam Development Report 2004: Poverty. Hanoi. 2003

Poverty, Poverty Reduction and Poverty Dynamics in Vietnam
35
World Bank. 2005. Taking Stock. December 2005
World Bank. 2006. Taking Stock. June 2006

Poverty, Poverty Reduction and Poverty Dynamics in Vietnam
36
Appendix 1. Growth Elasticity of Poverty Reduction The total growth-elasticity of poverty, �, may be defined as the relative change in the poverty headcount between two periods for a one percent growth in mean income (assuming that the poverty line remains constant in real terms).
where H is the headcount index and μ is the mean income. (Source: World Bank’s website on Growth, Poverty and Inequality)
Population (thousand)
Poverty Incidence
GDP (million)
GDP per capita (million)
Elasticity with regards to growth
Decrease in PERCENTAGE POINTS associated with 1-percent increase in growth of GDP per capita
1993 69,645 58.1% 164043 2.36 1998 75,456 37.4% 244596 3.24 1993-1998 0.95 0.55 2002 79,727 28.9% 313247 3.93 1998-2002 1.07 0.40 2004 82,032 19.5% 362092 4.41 1998-2004 1.32 0.49 1993-2004 0.76 0.44 2002-2004 2.63 0.76 Source: GSO
Poverty, Poverty Reduction and Poverty Dynamics in Vietnam
37
Appendix 2. Technical Notes on Selected Variables Used in the Econometric Analysis 1. Education level
Education level is measured in terms of the highest official degree that an individual
obtained. Accordingly, the education level is categorized into 5 levels: 1) no degree,
2) primary school, 3) lower secondary school, 4) upper secondary school, and 5)
above upper secondary school, including vocational and technical training schools
and universities. In the regressions, the base level of education is no degree.
2. Head’s occupation
The occupation of the head is classified into 5 groups: i) white-collar’, ii) sales, iii)
agriculture, iv) production, and v) others and unemployed. White-collar includes
leaders in all fields and all levels, top-level professionals in all fields, elementary
professionals, white-collar technical personnel, skilled workers in agriculture,
sylviculture, and aquaculture, and people working in the military forces. Sales consist
of personal services, security protection and sales, and sale and service unskilled
workers. Agriculture only includes unskilled workers in agriculture, sylviculture, and
aquaculture. Production consists of skilled handy-craftsmen and other relating skilled
manual workers, assemblers and machine operators, and unskilled workers in
mining, construction, manufacturing, and transportation industry and other unskilled
workers.
In the regressions, the reference group for employment is agriculture.
3. Farm activities.
There are several variables which are used to represent the farm activities. The main
variables are payments for fertilisers and for preventing insecticides and rice
productivities. Fertilisers include all the kinds of chemical and organic fertilizers used
by the households in the agricultural production process. Payments for fertilisers and
insecticides are measured in terms of VND million that the household paid during the
last twelve months. Rice productivity as a proxy for the level of technology is
measured by the ratio of total output of rice production in kilograms to the area in
squared meters that the household cultivated
4. External shocks

Poverty, Poverty Reduction and Poverty Dynamics in Vietnam
38
We use the monetary values of rice, coffee, fruit, pigs, poultry, aquaculture and the
number of household members working in textile and garment, footwear and seafood
sectors as proxies for external shocks23 (through price effect as explained in the main
text) that might have affected households, given the relatively strong growth of these
sectors during the 2002-2004 period. The monetary values used for most of the
above mentioned variables reflect the production values that the households
generated during the last twelve months and they are expressed in the number of
VND million. Caution should be made with regards to the variable of the number of
members working in the growing sectors; since the overwhelming majority of
factories in these sectors are located closer to ports, this variable is not relevant for
households whose members cannot participate as migrant workers working away
from home for more than 6 months and therefore such households are not recorded
in the survey.
5. Household’s assets
To measure households’ assets, we use four indicators. First, a dummy variable
which takes the value of one if the household has land that they can use for a long
time and zero if not. Second, we use the current values of productive assets.
Productive assets mean the asset items that the household can use in their
productive activities. These do not include assets that are used in daily life, such as
televisions, radios, and air-conditioners. The other two asset indicators are two
dummies, which ask if the household has electricity as the main lighting source and if
they have access to clean water24.
6. Access to credit markets.
The data on the loan amounts that the household borrowed during the last twelve
months or the out-standing loan amounts in 2002 and 2004 VHLSS is very poor, in
the sense that there are too many missing values in the section of credit access. We
therefore try to measure the households’ access to credit markets by using
information from in other sections. Accordingly, the household is said to have access
to credit markets if it has at least one of the following conditions: i) reported positive
loan amount25, ii) reported that they paid for interest rates in the agricultural activities,
iii) reported that they paid for interest rates in the livestock activities, iv) reported that
they paid for interest rates in the agriculture service activities, v) reported that they
23 External to households 24 Clean water includes private tap water, public tap water, water in tank, bottle which the household bought, filtered spring water, rain water, and water pumped from deep drill wells. 25 Loan that the household borrowed during the last twelve months or outstanding loan

Poverty, Poverty Reduction and Poverty Dynamics in Vietnam
39
paid for interest rates in the forestry activities, vi) reported that they paid for interest
rates in the aquacultural activities, or vii) reported that they paid for interest rates in
the non-farm activities.
7. Remittances
Remittances, which have been becoming an increasingly important source of income
include the money that the household received from various domestic sources
(domestic remittances) and overseas sources (overseas remittances) during the last
twelve months. These two monetary indicators are measured in terms of VND million.
This variable can be considered as a proxy (imperfect) for the importance of
migration for changing poverty status of households.
8. Community characteristics
We look at the several aspects of community-level characteristics. It is worth noting
that in 2002 VHLSS, we are not able to measure the community characteristics at the
commune level, since the questionnaires provide the information at the village level.
We are interested in seeing if the village, where the household is living, has (i) paved,
cement or tar roads26, (ii) a post office, (iii) a market (daily market and periodic
market), (iv) lower secondary school, (v) upper secondary school, and vi) an
agriculture extension center.
Overall note: All the monetary variables are expressed in January 2002 prices.
26 Note that we also tried including grave road in the road definition but the regression results did not change

Poverty, Poverty Reduction and Poverty Dynamics in Vietnam
40
Appendix 3. Determinants of Poverty Dynamics: the Whole Rural Vietnam
Base outcome - (poor02; poor04); comparison outcome - (poor02; non-poor04
Base outcome - (non-poor02; non-poor04); comparison outcome - (non-poor02; poor04)
RRR RRR Ethnicity (1:Kinh or Hoa; 0: Otherwise) 2.19*** 0.65
Geographic characteristics (Reference group - North Central Coast)
1 - Northern Uplands 1.58 0.68 2 - Red River Delta 1.86** 0.81 3 - South Central Coast 2.07** 0.61 4 - Central Highlands 2.83*** 0.62 5 - South East 7.56*** 0.30*** 6 - Mekong River Delta 2.87*** 0.45** Demographic characteristics 8 - Head is female in 2002 1.35 1.35 9 - Age of head in years in 2002 1.07 0.93 10 - Head's age squared in 2002 1.00* 1 11 - Number of children 0-18 in 2002 0.79** 1.73*** 12 - Number of adults (female:55+; male: 60+) in 2002 0.91 1.68** 13 - Household size 0.93 Human capital characteristics 0.9 14 - Head: primary school in 2002 1.35 0.71 15 - Head: lower secondary school in 2002 2.51*** 0.73 16 - Head: upper secondary school in 2002 1.39 0.62 17 - Head: Technical/university in 2002 8.33* 0.33 18 - Spouse: primary school in 2002 0.92 0.65 19 - Spouse: lower secondary school in 2002 0.73 0.67 20 - Spouse: upper secondary school in 2002 0.61 0.18** 21 - Spouse: Technical/university in 2002 1.51 0.01** Head's occupation 22 - Head's employment: white-collar in 2002 1.91* 0.7 23 - Head's employment: sales in 2002 1.38 0.30** 24 - Head's employment: production in 2002 1.12 0.51** 25 - Head's employment: not working in 2002 1.16 0.69 Farm activities 26 - Payments for fertilisers in 2002 0.86 0.89 27 - Payments for insecticides in 2002 0.81 1.53 28 - Rice productivity in 2002 0.50 1.28 External shocks 38 - Rice volumes in 000 VND in 2002 1.10** 0.89*** 39 - Coffee volumes in 000 VND in 2002 1.06** 0.96 40 - Fruit volumes in 000 VND in 2002 1.00** 1

Poverty, Poverty Reduction and Poverty Dynamics in Vietnam
41
41 - Values of pig produced last 12 months in 2002 1.18*** 0.92*
42 - Values of feathered animals produced last 12 months in 2002 1.43* 0.96
43 - Values of aquaculture produced in 2002 1.09*** 0.96
44 - # of people working in growing sector (textile and garment, footwear, seafood) in 2002 0.85 1.02
Assets 45 - HH had long-term land in 2002 1.12 1.33 46 - Current values of productive assets in 2002 1.03** 0.98** 47 - Main source of lighting is electricity in 2002 1.78*** 0.54** 48 - Having access to clean water 1.08 0.77 Credit markets 49 - HH had access to credit in 2002 0.99 0.99 Remittances 50 - Domestic remittances in 2002 1.17 1.01 51 - Overseas remittances in 2002 1.11 0.23 Community characteristics 52 - Village has permanent road in 2002 1.09 0.88 54 - Village has a post office in 2002 0.89 1.21 55 - Village has a market in 2002 0.82 0.82 56 - Village has a lower secondary school in 2002 1.01 0.76 58 - Village has an upper secondary school in 2002 1.13 1.39 60 - Village has a health centre in 2002 1.5 0.94 61 - Village has an extension centre in 2002 1.01 1.13 Observations 2585 2585

Poverty, Poverty Reduction and Poverty Dynamics in Vietnam
42
Appendix 4. Determinants of Movement Out of Poverty (2002-2004): Analysis Disaggregated by Ethnicity The base outcome is (poor02; poor04) - The comparison outcome is (poor02; non-poor04)
Kinh Hoa
Ethnic Minorities
RRR RRR Geographic characteristics (Reference group - North Central Coast) 1 - Northern Uplands 0.78 3.86 2 - Red River Delta 1.85* 1.57 3 - South Central Coast 2.45** 0.01*** 4 - Central Highlands 1.94 8.45** 5 - South East 12.87*** 65.72*** 6 - Mekong River Delta 2.50** 20.14** Demographic characteristics 8 - Head is female in 2002 1.38 2.15 9 - Age of head in years in 2002 1.07 1.06 10 - Head's age squared in 2002 1.00* 1 11 - Number of children 0-18 in 2002 0.77* 0.81 12 - Number of adults (female:55+; male: 60+) in 2002 1.01 0.8 13 - Household size 0.96 0.8 Human capital characteristics 14 - Head: primary school in 2002 1.39 1.38 15 - Head: lower secondary school in 2002 2.50*** 3.49** 16 - Head: upper secondary school in 2002 1.47 2.39 17 - Head: Technical/university in 2002 2.75 7.93 18 - Spouse: primary school in 2002 0.94 0.98 19 - Spouse: lower secondary school in 2002 0.67 1.21 20 - Spouse: upper secondary school in 2002 0.67 0.2 21 - Spouse: Technical/university in 2002 1.21 0.9 Head's occupation 22 - Head's employment: white-collar in 2002 1.29 4.64** 23 - Head's employment: sales in 2002 1.02 7.77* 24 - Head's employment: production in 2002 1.07 0.01*** 25 - Head's employment: not working in 2002 0.98 2.35 Farm activities 26 - Payments for fertilisers in 2002 0.82 1.07 27 - Payments for insecticides in 2002 3.95** 0.01*** 28 - Rice productivity in 2002 0.96 0.33 External shocks 38 - Rice volumes in 000 VND in 2002 1 1.36*** 39 - Coffee volumes in 000 VND in 2002 1.10*** 0.97 40 - Fruit volumes in 000 VND in 2002 1.00* 1.00** 41 - Values of pig produced last 12 months in 2002 1.17** 1.16 42 - Values of feathered animals produced last 12 months in 2002 1.85*** 0.74 43 - Values of aquaculture produced in 2002 1.06** 1.44 44 - # of people working in growing sector (textile and garment, footwear and seafood) in 2002 0.84 0.01*** Assets 45 - HH had long-term land in 2002 0.73 9.59 46 - Current values of productive assets in 2002 1.03* 1.05*** 47 - Main source of lighting is electricity in 2002 2.14*** 1.22 48 - Having access to clean water 1.24 0.6 Credit markets 49 - HH had access to credit in 2002 1.13 0.67
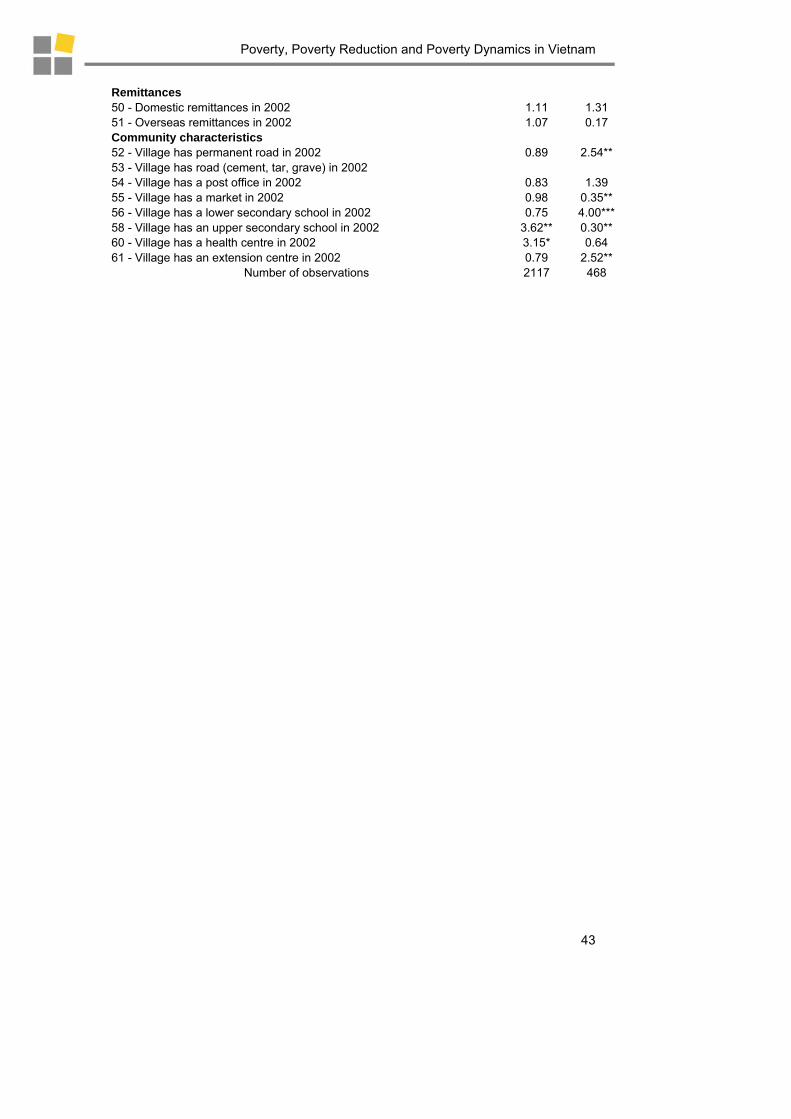
Poverty, Poverty Reduction and Poverty Dynamics in Vietnam
43
Remittances 50 - Domestic remittances in 2002 1.11 1.31 51 - Overseas remittances in 2002 1.07 0.17 Community characteristics 52 - Village has permanent road in 2002 0.89 2.54** 53 - Village has road (cement, tar, grave) in 2002 54 - Village has a post office in 2002 0.83 1.39 55 - Village has a market in 2002 0.98 0.35** 56 - Village has a lower secondary school in 2002 0.75 4.00*** 58 - Village has an upper secondary school in 2002 3.62** 0.30** 60 - Village has a health centre in 2002 3.15* 0.64 61 - Village has an extension centre in 2002 0.79 2.52**
Number of observations 2117 468
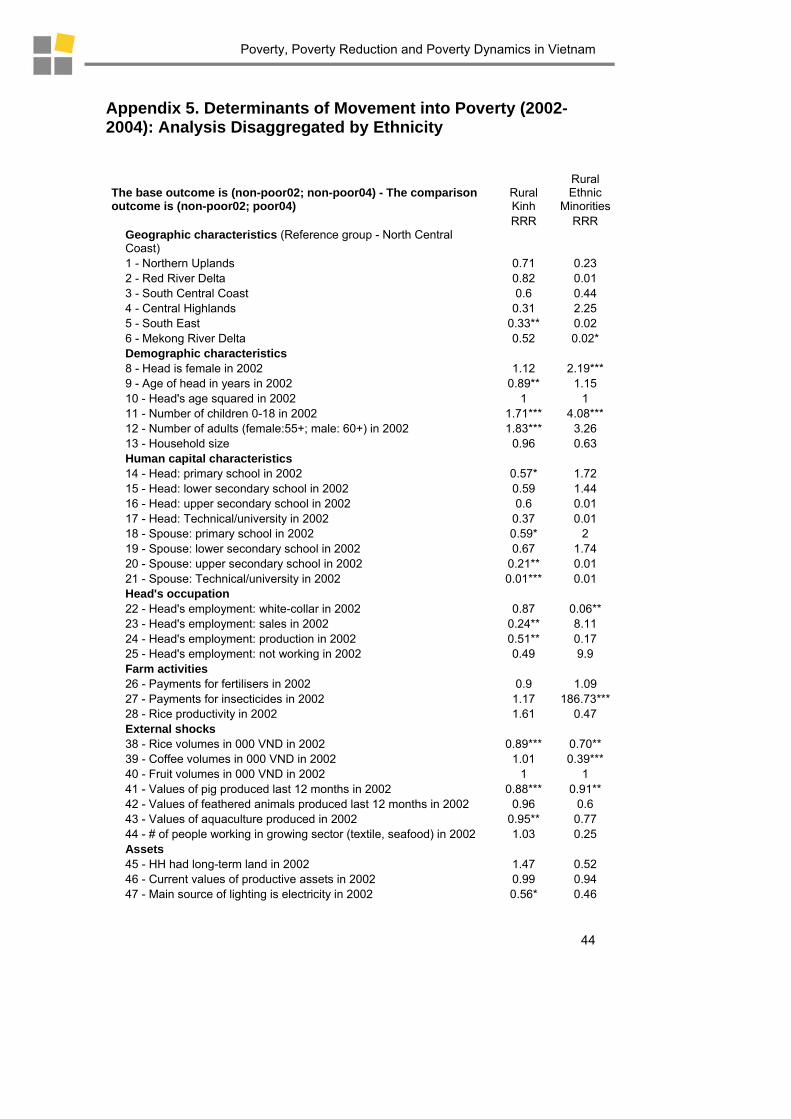
Poverty, Poverty Reduction and Poverty Dynamics in Vietnam
44
Appendix 5. Determinants of Movement into Poverty (2002-2004): Analysis Disaggregated by Ethnicity
The base outcome is (non-poor02; non-poor04) - The comparison outcome is (non-poor02; poor04)
Rural Kinh
Rural Ethnic
Minorities RRR RRR
Geographic characteristics (Reference group - North Central Coast)
1 - Northern Uplands 0.71 0.23 2 - Red River Delta 0.82 0.01 3 - South Central Coast 0.6 0.44 4 - Central Highlands 0.31 2.25 5 - South East 0.33** 0.02 6 - Mekong River Delta 0.52 0.02* Demographic characteristics 8 - Head is female in 2002 1.12 2.19*** 9 - Age of head in years in 2002 0.89** 1.15 10 - Head's age squared in 2002 1 1 11 - Number of children 0-18 in 2002 1.71*** 4.08*** 12 - Number of adults (female:55+; male: 60+) in 2002 1.83*** 3.26 13 - Household size 0.96 0.63 Human capital characteristics 14 - Head: primary school in 2002 0.57* 1.72 15 - Head: lower secondary school in 2002 0.59 1.44 16 - Head: upper secondary school in 2002 0.6 0.01 17 - Head: Technical/university in 2002 0.37 0.01 18 - Spouse: primary school in 2002 0.59* 2 19 - Spouse: lower secondary school in 2002 0.67 1.74 20 - Spouse: upper secondary school in 2002 0.21** 0.01 21 - Spouse: Technical/university in 2002 0.01*** 0.01 Head's occupation 22 - Head's employment: white-collar in 2002 0.87 0.06** 23 - Head's employment: sales in 2002 0.24** 8.11 24 - Head's employment: production in 2002 0.51** 0.17 25 - Head's employment: not working in 2002 0.49 9.9 Farm activities 26 - Payments for fertilisers in 2002 0.9 1.09 27 - Payments for insecticides in 2002 1.17 186.73*** 28 - Rice productivity in 2002 1.61 0.47 External shocks 38 - Rice volumes in 000 VND in 2002 0.89*** 0.70** 39 - Coffee volumes in 000 VND in 2002 1.01 0.39*** 40 - Fruit volumes in 000 VND in 2002 1 1 41 - Values of pig produced last 12 months in 2002 0.88*** 0.91** 42 - Values of feathered animals produced last 12 months in 2002 0.96 0.6 43 - Values of aquaculture produced in 2002 0.95** 0.77 44 - # of people working in growing sector (textile, seafood) in 2002 1.03 0.25 Assets 45 - HH had long-term land in 2002 1.47 0.52 46 - Current values of productive assets in 2002 0.99 0.94 47 - Main source of lighting is electricity in 2002 0.56* 0.46

Poverty, Poverty Reduction and Poverty Dynamics in Vietnam
45
48 - Having access to clean water 0.81 1.24 Credit markets 49 - HH had access to credit in 2002 0.85 1.24 Remittances 50 - Domestic remittances in 2002 1.01 0.71 51 - Overseas remittances in 2002 0.26* 0.02 Community characteristics 52 - Village has permanent road in 2002 1.03 0.17** 54 - Village has a post office in 2002 1.39 0.27 55 - Village has a market in 2002 0.66* 3.55 56 - Village has a lower secondary school in 2002 0.91 0.02*** 58 - Village has an upper secondary school in 2002 1.16 153.67*** 60 - Village has a health centre in 2002 2.01 0.46 61 - Village has an extension centre in 2002 1.04 2.16 Observations 2117 468
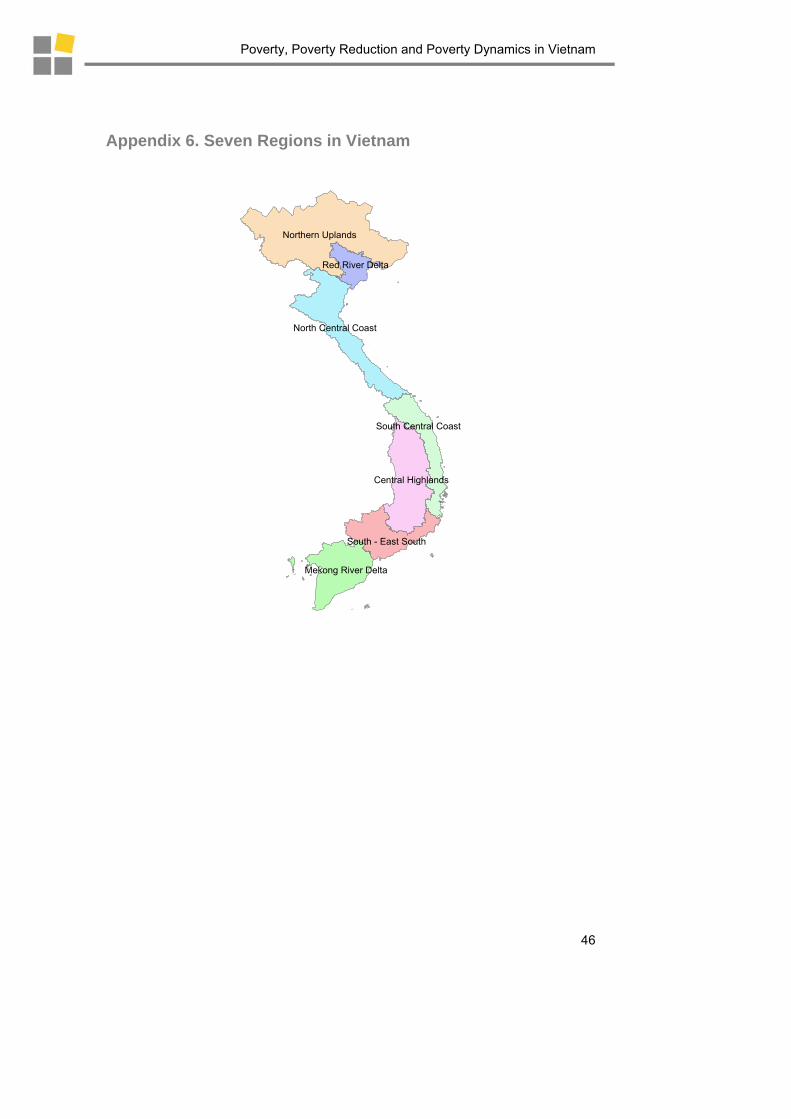
Poverty, Poverty Reduction and Poverty Dynamics in Vietnam
46
Appendix 6. Seven Regions in Vietnam
Northern Uplands
Central Highlands
North Central Coast
Mekong River Delta
South - East South
South Central Coast
Red River Delta