Embed Size (px)
Citation preview
1
DYNAMICS OF FOOD PRICE INFLATION IN EASTERN
ETHIOPIA: A MESO-MACRO MODELING
Abebe Ambachew1
, Arega Shumetie1
, Jemal Mohammed1
and
Mebratu Leake2
Abstract
High inflationary pressure especially in food price has been a top agenda in many
developing countries since the last decade as it has been hindering their socio-
economic development. Though Ethiopia is achieving an encouraging economic
growth in recent years, the occurrence of galloping inflation mainly since 2005 is
retarding its progress and causing high welfare loss. The very step to struggle this
problem is documenting the real causes of inflation. So far, there are only few
attempts to document the macroeconomic determinants of general inflation in
Ethiopia. Specially, empirical works on meso level price dynamics and focus on
certain items are scant. This study is, therefore, designed to assess the macro-meso
derivers of food price dynamics in Dire Dawa administration and Harari regional
state based on qualitative data collected through key informant interview and
quantitative monthly data from January, 2001 to September 2012. A result from
Vector Error Correction Model (VECM) revealed that, in the long run, money
supply, real income and international food and oil price hikes increase domestic
food inflation while rise in exchange rate (depreciation or devaluation) was found
to decrease inflation. Inflation expectation, smuggling, rise in world oil price and
exchange rate are also documented to impact food price inflation of the study area
in the short run. Pursuing conservative monetary policy, promoting
competitiveness in the market and reducing the cost of making business would
help to mitigate the galloping inflation in the study area.
Key words: Price Dynamics, Inflation, Error Correction Model, Smuggling
JEL Classification: E31, E37, C32
1
Authors are lecturers at Department of Economics, Haramaya University. 2
The author is lecturer at Department of Accounting and Finance, Haramaya University. Any inquiry can
be forwarded to the principal investigator at [email protected]
Acknowledgement
We are grateful for the Ethiopian Economics Association and the International Centre for Growth for
their financial support to undertake this study.
Abebe, Arega, Jemal and Mebratu: Dynamics of food price inflation…
2
1. Introduction
The rapid rises and volatility of food prices, now days, are at the top agenda of the
international community. The people of developing countries, particularly, are highly
exposed to food insecurity as they are financially incapable to afford basic food crops.
Yonas and Mans (2012) indicated that the high food price inflation has been the most
adverse economic shock that has continued to adversely affect the Ethiopian economy
where significant proportion of households had to adjust food consumption in
response.
Arguments continued as to what caused the recent global food price hike. Generally,
several factors such as increase in aggregate demand, shortage of supply, environmental
calamities, population increase, diversion of agricultural products usage for non-food
purpose, rapid economic growth (mainly in emerging economies), market structure and
investment (traders‘ speculation, market barriers to new entrants, unfair competition,
etc), an alarming increase of oil price, etc are claimed for the skyrocketing prices.
However, FAO (2008) rejects the claim that emerging economies have been a reason
for the food price explosion, since domestic production in countries like China and
India has been growing correspondingly during the same period. Rather, the use of
agricultural products, in particular maize, wheat, vegetable and oil, for purposes other
than food such as feedstock and bio-fuel production has been the most important
factor behind the rise of global food. Thus, as stated by Marco et al (2011), lack of
clarity as to what exactly causes such a spike in price is still a challenge to reinforce
sound policies in the course of taking corrective actions. Hence, a further study to
identify the real causes of food inflation is still essential.
In Ethiopia, inflation was not a concern until 2002/03 (Alemeayehu and Kibrom,
2011), but afterwards began to increase at an alarming rate. Similar trend is also
observed in food price inflation. For instance, the annual average food inflation rate
between July 2011 and June 2012 was 36.9% and in October 2012 compared to
October 2011 was 30.4% (CSA, 2012).
Several factors have been claimed for the soaring food inflation in Ethiopia. Jema and
Fekadu (2012) argue that monetary developments are seminal factors for high food
inflation in Ethiopia. World Bank (2007) and IMF (2008) argue that excess aggregate
demand generated by expansionary monetary policy were key driving factors, calling for
forceful policy tightening. EDRI (2007), on the other hand, pinpointed internal and
Ethiopian Journal of Economics, Vol XXI No 2, October 2012
3
external factors such as international commodity price increase, enticing economic
performance, increase in money supply and injection of cash into the rural economy,
behavioural changes in farmers, and increased local purchases by institutions and
agricultural cooperatives are accountable for the recent inflation. Ahmed (2007) has
also put the increase in aggregate demand as a preceding reason for food inflation due
to high demand for food. Agricultural production dependency on erratic rainfall
(Alemayehu and Kibrom, 2011), alarming increase in demand, poor harvest, higher
fertilizer, transportation costs; and world oil price hiking (Loening et al, 2009), are also
mentioned as major causes for food price inflation. However, there is no agreement
between academicians, researchers and the government on the real factors responsible
to the hiking price of food items in the nation.
Food inflation has been soaring throughout the country and the regional distribution of
food inflation took the same pattern as the general inflation (Alemayehu and Kibrom,
2011; John et al, 2009). Eastern Ethiopia is one of the food insecure parts of the
country sharing similar food inflation phenomena. As official reports of the NBE
indicate, Dire Dawa Administration and Harari regional state experienced highest
inflation rates and high price instability between 2008 and 2010. The average annual
food inflation rate, as reported by the NBE in 2008/09, was 47.3% and 57.3% for Dire-
Dawa and Harari regional state, respectively. This indicates that the area is vulnerable
to high food price inflation. This area is the inlet and outlet of many exports and
imports of the country and dominantly consumer of imported and packed items. To
continue the envisaged economic growth, searching for the real causes of inflation is a
first step one has to do in order to propose an outright solution to the problem.
In these debatable sphere of reasoning, studying the causes of food price dynamics at
meso level, a rarely studied panorama, is very important. The purpose of this study is,
therefore, to identify the macro-meso factors causing the food price inflation and
volatility in Eastern Ethiopia, particularly in Harari Regional State and Dire-Dawa
Administration. To be able to describe the dynamics of prices for major food items
across time, four food categories, namely, cereals, pulses, fruits and vegetables, and
bread and other prepared foods are considered. However, in modeling the food
inflation of the selected regions, it is not only prices of these items but the general food
price index is taken in to account. The study area is an area where smuggled products
and imported packed foods are highly marketed and consumed and Khat is
predominantly produced and commercialized.
Abebe, Arega, Jemal and Mebratu: Dynamics of food price inflation…
4
The official trade has been unattractive in the area especially to small-scale traders
found in the border areas due to structural and policy related problems. The
requirements of this type of trade are beyond the reach of small-scale traders (the main
actors in the area). These factors led the people in the area to stick to alternative
markets, i.e., unofficial cross-border trade. This is undertaken beyond the government's
control and thus freed from considerable size of costs. As a result, the study area is
well known in its practice of illegal trade so that dozens of smuggled products are
supplied to Dire Dawa and Harar markets. Some studies estimate the volume of this
trade to be far greater than the recorded trade (Maruye 1992). The main food items
that are supplied in this channel and destined to the eastern region are rice, edible oil,
spaghetti, sugar, and wheat flour (Tegegne and Alemayehu, 2002). This tends to
increases the domestic food supply and expected to trim down the food price in the
area.
The impact of such special attributes of the region on food inflation is explored using
the meso-macro modeling where the Vector Error Correction Model and monthly data
ranging from January, 2001 to September, 2012, were employed and the long-run and
the short run food price drivers are identified.
2. Objectives of the study
Based on the context of the research problems, the study is meant to address the
following objectives.
To investigate the dynamics of food price in a disaggregated category overtime.
To analyze the nature of the grain market in the study area
To model the meso-macro determinants of food price inflation
To examine the effect of smuggling on food price.
3. Theoretical View on the Determinants of Inflation
Most of the theories developed to explain causes of inflation in a macroeconomics
context are on the basis of the aggregate demand (demand pull) and cost-push theories
(Ball and Doyle, 1969).
The demand-pull theory states that inflation results from a rise in aggregate demand.
Accordingly, factors that influence demand-pull inflation including increases in money
Ethiopian Journal of Economics, Vol XXI No 2, October 2012
5
supply, government spending and the price level in the rest of the world are expected to
have similar effect on inflation.
On the other hand, under the cost-push theory, inflation is seen as the result of
decreases in aggregate supply which may be due to an appreciation in wages or the
price of raw materials. Such increases lead to higher production costs, hence the term
‗cost-push‘ inflation. Keynesians believe inflation is a result of income disturbances and
shocks to the economy, like oil price increases, while the Monetarists believe that
inflation occurs because of excess demand and inappropriate monetary responses to
economic situations i.e ‗too much money chasing too few goods‘.
In addition, structural factors such as weather conditions, policies aimed at protecting
certain industries or just trading policies, may also influence the rate of inflation. If
there‘s a hurricane, which damages food supply and infrastructure, then, prices of
goods and services will definitely shoot up. Also, in protecting certain industries,
cheaper goods and services may not be allowed into the country, which results in higher
prices for certain goods and services. This shows that inflation may be a consequence
of weather conditions and trading or protection policies. Frisch (1977) devised another
approach to understanding the inflationary process under the Structuralist model of
imported inflation. This model shows that a country‘s dependence on external markets
may bring about inflation, since heavy reliance on external variables is expected to
motivate upward pressure on domestic prices. Laryea and Sumaila (2001) also argued
similarly that price of tradable goods is determined in the world market and depends
on foreign prices and on the exchange rate. Further, the Scandinavian model
developed by Branson and Myhrman (1976) adds unemployment rate and expected
inflation to the determinants of inflation. Formal theoretical models for showing
interaction among inflation and its determinants in the context of developing countries
can be seen in Laryea and Sumaila (2001).
4. Methodology
4.1 Nature and Source of Data
The study mainly utilized secondary data obtained from the CSA, NBE, IMF and
World Bank. A monthly time series data ranging from the January 2001 to September
2012 were employed. In order to investigate the dynamics of food price in
disaggregated category overtime, four main food categories, namely, cereals, pulses,
fruits and vegetables, and bread and other prepared foods were selected. For
Abebe, Arega, Jemal and Mebratu: Dynamics of food price inflation…
6
quantitative analysis, secondary data on different variables obtained from different
sources was used. These variables include Domestic Consumer Food Price Index
(DFCPI), Money Supply (M2), exchange rate (EXR), World Food Consumer Price
Index (WFCPI), Gross Domestic Product (GDP), World Oil Price (WOP), and meso
level variables including expected inflation (EXP), smuggling (SMUG) and non-food
domestic consumer price index (NFDCPI). The datasets for DFCPI, NFDCPI, raw
data to compute SMUG and EXP are obtained from the central Statistical Agency
(CSA) of Ethiopia, the datasets for M2 and EXR are obtained from the National Bank
of Ethiopia (NBE), annual GDP data which was used to compute the monthly one is
obtained from the World development indicators (WDI), and the datasets for WFCPI
and WOP are obtained from the International Monetary Fund (IMF).
The unusual variable that we hypothesize to affect food price in this study is smuggling.
This variable was approximated by the imported cooking oil price difference between
the study area and Oromia, which is analogous to the case of black market exchange
rate premium measure of Barro (1996). Price differences of imported items in two
areas can be taken as a good proxy for smuggling as long as transportation and other
transactional costs are proved to be similar. The formal suppliers of imported oil to
Harari-Dire Dawa region include legal importers based in Addis Ababa, as well as Dire
Dawa and Harar. Following the closure of the Ethiopian rail way since almost the last
decade, the principal formal route of import of Ethiopia has been the major highway
running from Addis Ababa through Oromia and Afar regions to Djibouti. Finally it will
be unloaded at the dry port of Mojo or Semera. Thus, we assume the vehicular
transportation cost from Addis Ababa to Harar/Dire Dawa and from Addis Ababa to
different parts of Oromia regional state is on average equivalent. Given this equivalence
in distance between Oromia and Harar/Dire Dawa from Addis Ababa (particularly
Mojo dry port) where imported items are unloaded and under the assumption of
similar supply of the domestically produced oil (the substitute product), any price
difference on imported cooking oil can be attributed to existence of smuggling.
Because if this item were not imported directly from Djibouti port to Dire Dawa and
Harar by contraband traders and reduce legal import-related costs, there would no
reason that, on average, the price of this imported item is different in the study area as
compared to its counterpart Oromia. It is, therefore, based on such reasonable
assumption that the average price of imported cooking oil in Oromia region is used as
a reference price for the computation of the aforementioned proxy of smuggling in the
study area.
Ethiopian Journal of Economics, Vol XXI No 2, October 2012
7
The other data considered in the study and used as a proxy for demand and/or market
size is GDP. Most of the data owners or sources generating GDP dataset of countries
report on annual basis and thus monthly and quarterly data of such macro variables are
hardly available. As the rest of our data were constructed in months, to get more
observation and reliable model estimates, converting the annual GDP data into its
monthly counterparts is necessary. There are some recently introduced techniques of
computing monthly GDP. For instance, the Macroeconomic Advisers‘ index of
Monthly GDP (MGDP) introduced by the United States Bureau of Economic Analysis
is the well known one (BEA, 2008). Moreover, monthly GDP can also be estimated
using the general Kalman filter Framework (Cuche & Hess, 2000). Most researchers
also make use of parabolic rule of numeric integration which is used by Goldstein and
Khan (1976) and Eviews software package. Nevertheless, the available techniques
require monthly data on most of the components of the officially reported GDP and
other macroeconomic series, which are hardly available for Ethiopia. On the top of all,
these methods are also more appropriate in an economy where output is less sensitive
for seasonality. For instance, in developed countries where agriculture (the sector less
affected by seasonality) has a negligible share in national output, applying these
methods may be appropriate.
However, none of these methods are applicable for Ethiopia. This is because of the
fact that, over our study period, near to half of the Ethiopian GDP has been
contributed by agriculture. As indicated in Alemayehu et al (2011) about 96.9% of the
total crop is produced in Meher season, September to February, showing that the
sector is clearly season dependent. Such a nature of the Ethiopian GDP data conveys a
clear message that using any method generating monthly or quarterly series which fails
to take seasonality into account leads to misleading results. None of the previous
attempts of generating the quarterly or monthly GDP data is successful in capturing
seasonality.
In this study, we have developed a new method to estimate monthly GDP data from
the annual GDP series which captures the issue of seasonality in agricultural
production. The technique we followed is explained as follows. Generally, the
Ethiopian GDP is composed of agriculture, industry and service sectors. Unlike in
agriculture, nature of production in the other two sectors is not season sensitive. We
reasonably assume same distribution of output of service and industrial sector across
months in a given year. Given that most of the agricultural practices are rain-fed,
however, it is severely affected by season and thus level of output in this sector is
Abebe, Arega, Jemal and Mebratu: Dynamics of food price inflation…
8
expected to significantly differ from month to month. Crop production currently
accounts about 72% and 30% of agricultural GDP and the total GDP, respectively
(MoFED, 2012). It is for this component of agricultural output that we made
adjustment for seasonal variation. Whereas, like that of industry and service sectors,
similar distribution was assumed for animal rearing and fishery since production in
these activities are not that much season sensitive.
Therefore, crop production is season sensitive component of GDP and reasonable
allocation of its monetary value across months alleviate the problem of seasonality. To
this end, we have computed the crop sub-sector‘s share of total annual GDP for each
year from MoFED data. All types of cereals, pulses and oil seeds were considered in
constituting the total value of crop sub-sector3
. The GDP share of all crops was further
disaggregated into individual crop type so that the GDP share of each crop type for
each year was easily known. Ignoring the production in Belg season, the crop
component of GDP, in each year, should be attributed to months of the Meher season
(September to February). However, there is no data showing level or value of
agricultural production for each month separately; nor assumption of equal level of
production in each of these months and dividing the total value for six is appropriate.
In this study, we utilize the concept of crop calendar to allocate production across
months4
. The crop calendar of Ethiopia for all types of cereals, pulses and oil seeds
was taken from USDA (2003). This calendar tells the month, on average, during which
each crop is harvested. After knowing the GDP share of each crop and the month
during which they are harvested, the total value of crops (crop component of GDP) has
been distributed over the six months accordingly. For instance, if harvesting season for
maize is in the month of December, the entire value of GDP attributed by maize is
allocated for December. On the other hand, total value of GDP attributed by sectors
that are less sensitive for seasonality are equally distributed for the 12 months in a given
year. This procedure enable us generate a more reliable monthly GDP data from the
annual ones and the harvesting seasons like December and January were found to have
more monthly value than the slack periods, as expected.
The proxy for expected inflation used in this study is derived from the actual inflation
using Autoregressive Integrated Moving Average (ARIMA) method following Junttila
(2001) and Meylar, et al., (1998). In this approach, expected inflation is estimated as
3
Here, the value of tubers is ignored because of their negligible share of GDP. 4
Crop calendar specifies the period (in months) during which different activities (sowing, harvesting etc) of
producing a given crop is performed
Ethiopian Journal of Economics, Vol XXI No 2, October 2012
9
the fitted value in the regression of actual inflation on lags of its own and the error term.
In this study, ARIMA(3,1,3) was used to generate the data on inflation expectations.
All of the variables, except smuggling (SMUG) and expected inflation (EXP), are used
in natural logarithmic forms to capture non-linearity in relationships and reduce the
problem of heteroskedasticity. Smuggling and expected inflation are used in level forms
because they have some negative observations which results in missing values, and thus
loss of information, if they are used in logarithmic forms.
In addition, primary data were collected to acquire additional micro level information
on qualitative aspects of price dynamics and market performance such as market
structure, behavior of major market actors, the pattern and level of competition, the
mechanisms of price setting, communication and interdependence among the different
actors, smuggling, transportation and storage availability and costs, availability of market
information and degree of marketing risk, administrative and legal efficacy and costs,
among others. These primary data were collected from key informants including
consumer cooperatives, suppliers, retailers, and government officials of trade and
industry bureau.
4.2 Methods of Data Analysis
Both qualitative and quantitative data analysis techniques were used. Specifically, time-
series (trend and seasonality) and econometric techniques were utilized to address the
stated objectives.
The time series analysis helps to understand the temporal variation of food price. Time
series data has four components, namely, trend (T), Seasonality (S), cyclical (C) and
irregular (I) components (Washington et.al. 2010). The first two components can be
modeled to understand their nature while the later two cannot be modeled as they do
not exhibited specific pattern. In this study, both seasonality and trend analyses were
made to understand the annual and quarterly fluctuations, respectively, of the price of
the aforementioned food commodity bundles. Ratio to moving average method was
used for seasonality analysis. The trend analysis of prices was made based on
deseasonalized data.
Abebe, Arega, Jemal and Mebratu: Dynamics of food price inflation…
10
Econometric Model
This model is employed to identify the derivers of food price inflation in the study
area. Both macro and meso level factors are incorporated in the econometric model.
Coupling macro level variables with meso ones are not unusual in modeling meso level
prices (see Andrade and Marios, 2011, and Galati et al, 2011 for macro-meso
framework in modeling inflation). These demand and supply side variables are
hypothesized as important derivers of price and they can be put in equation form to
determine aggregate food price inflation (DFPCI) as:
(1)
Where is the stochastic term, are the model parameters and the subscript t
stands for time.
Following Johansen (1988) and Johansen and Juselius (1990), assuming the variables
mentioned above are endogenous and using matrix notation denoted by vector Zt, the
vector autoregressive model (VAR) of order p can be written as
It can be reformulated in a vector error correction model (VECM) as follows
(2’)
Where ri = (I – A1 – A2 – ….. – Ap) (I = 1, 2, .., P-1) and Π = – ( I – A1 – A2 – ….. – Ak)
from which the speed of adjustment to equilibrium coefficients and the long run
coefficient matrix or the co-integrating vector will be identified. In the empirical
estimation, Equation (2‘) can be augmented to include the deterministic term (time
trend and/or intercept) and the appropriate lag length will be selected using Akaike
Information Criterion (AIC), Schwarz Criterion (SC) and others.
When we become specific and taking our variable of interest in mind, all the variables
in the above VAR model, except smuggling (SMUG) and expected inflation (EXP)
which are integrated of order zero or I(0), are found to be I(1). Hence, the appropriate
modeling approach to identify the long run and short run determinants of domestic
Ethiopian Journal of Economics, Vol XXI No 2, October 2012
11
food price inflation is vector error correction model (VECM). The specification of our
VEC model that considers the existence of mixed order of integration of variables can
be specified as follows5
:
- - -
- - - -
- - - - -
- - - - -
(3)
Where γ is the error correction parameter which measures the speed of adjustment
towards long-run equilibrium in each period, βi are coefficients of the long run
relationship in the system and Dt is a vector of deterministic variables such as constant
and trend. This quantitative analysis coupled with the qualitative assessments or
justification is believed to foster to a good understanding of the causes of inflation in the
study areas.
5 Results and Discussion
5.1 Marketing System and Price Determination in Harar and Dire-Dawa
There are, currently, about 120 and 252 retailers of food items in Harar and Dire-
Dawa markets, respectively. The retail market in the region is highly competitive that
retailers are price takers and entry is easy due to low initial capital requirement and
absence of market barriers. Retailing price is determined by ‗cost-plus‘ basis, adding
mark-up on the total purchasing cost (purchase price, transportation and other
transactional costs, etc) commonly employed by all retailers. Few retailers with relatively
higher capital and marketing essence purchase crops from the source areas of central
and northern Ethiopia (particularly, Shoa, Arsi and Gojam), and keep buffer stock for
future sale. However, most of the traders of food items both in Dire Dawa and Harar
towns receive supplies mainly from wholesalers that are based in the aforementioned
surplus producing areas of the country. Prices charged by retailers move simultaneously
due to the quick flow of information in the retail market.
5
Justification for this is provided in section 4.3.1 along with the unit root test.
Abebe, Arega, Jemal and Mebratu: Dynamics of food price inflation…
12
Based on observations and surveys conducted in the markets, the number of
suppliers/wholesalers is so small that they have significant monopoly power in
determining price. Information from key informants upholds the increased
responsiveness of farmers to market changes contributed for the upward pressure in
food under a situation of high food demand-supply gap. Administrative inefficiencies of
public offices (such as regional trade and licensing bureaus) escalate cost of making
business and contributed for price hike. What is more, price change is happened due
to seasonal variation of production in and around the study area.
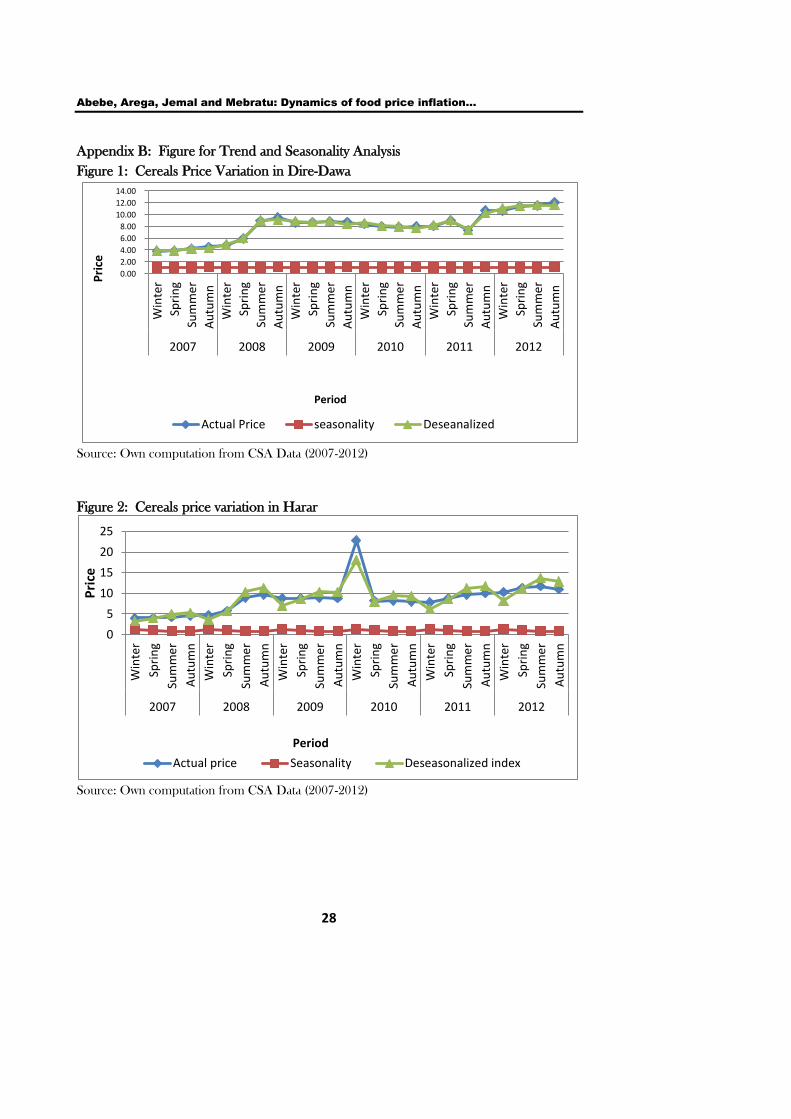
5.2 Seasonality and Trend Analysis of Prices
5.2.1 Seasonality Analysis of Crop Prices
In this section, we discuss the seasonal variation of the prices of four categories of food
items, namely cereals, pulses, bread and other prepared food items and vegetables and
fruits, based on computed moving weighted average prices. Thus, in order to diagnose
the seasonal variation in price, ratio to moving average method of seasonality analysis
was employed and actual and deseasonalized prices are also discussed as follows.
Cereals take the lion‘s share of the consumption bundle of households. Sorghum and
maize are the dominant cereals produced in Hararghe area while the rest are mainly
supplied from other surplus producing areas. The weighted average price of cereals in
the study area over the study period was found to be volatile with a general increasing
trend, which is similar to the national trend.
The seasonality index of cereals in winter season shows an increment by 26% than the
typical quarter price level of 100, but decline in autumn and summer seasons in Harari.
This may be associated with less cereal production practices and different consumption
preferences of the community. During autumn and spring, there is rainfall but erratic
and farmers produce vegetables supported by the common practice of irrigation. This
enables them to reduce their dependence only on cereals, which in turn, relatively
reduces the price of cereals due to decrease in demand (see Appendix B, Figure 2).
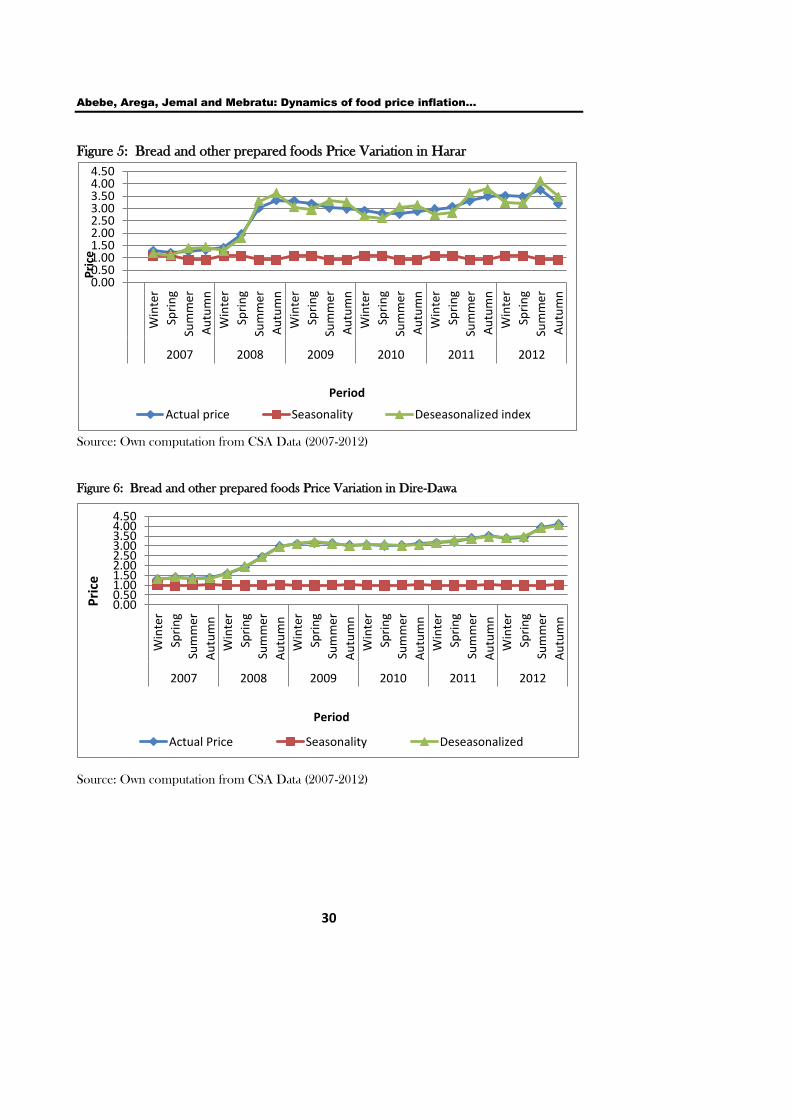
Similar trend was also found in the seasonality analysis of bread and other prepared
foods category (see Appendix B, Figure 5). It should be noted, however, that the
overall consumption pattern of Harar is difficult to understand and an independent
study on consumer behavior and consumption pattern might be essential.
Ethiopian Journal of Economics, Vol XXI No 2, October 2012
13
In Dire-Dawa, cereals become expensive particularly during summer and the beginning
of autumn (see Appendix B, Figure 1). During these seasons, based on the information
obtained from key informants, Djibouti is very hot and people temporarily migrate
from Djibouti to Dire-Dawa to escape the hot period. This scenario raises demand for
food and other items putting upward pressure on price.
In winter and spring, price of bread and other prepared foods gets higher (see
Appendix B, Figure 6). One possible reason, based on survey findings, for this is that
the population in Dire-Dawa tends to consume prepared food items like bread, pasta
and macaroni in winter and spring since other durable food types are spoiled by the hot
weather of the season.
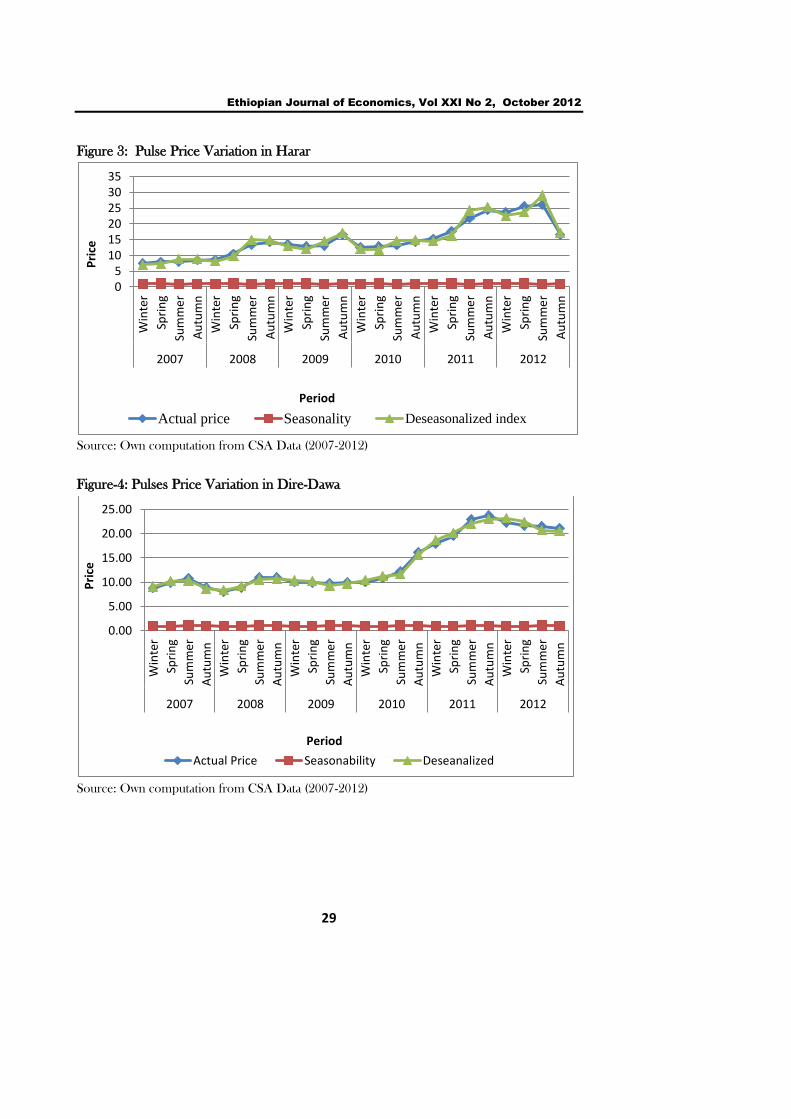
Pulses, the other food items considered in this study, are not widely produced in the
study area. Hence, like cereals, pulses traded in these markets areas are supplied from
the surplus producing parts of the country. The graphical representations of pulses are
depicted in Figure 3 and 4 of Appendix B. Similar to the price variation of cereals,
price of pulses vary but at lower rate. In Dire-Dawa, the prices for pulses varied by 4%
and 3% in summer and autumn, respectively, above the typical average quarter price
level and approximately with the same rate below the price level during winter and
spring.
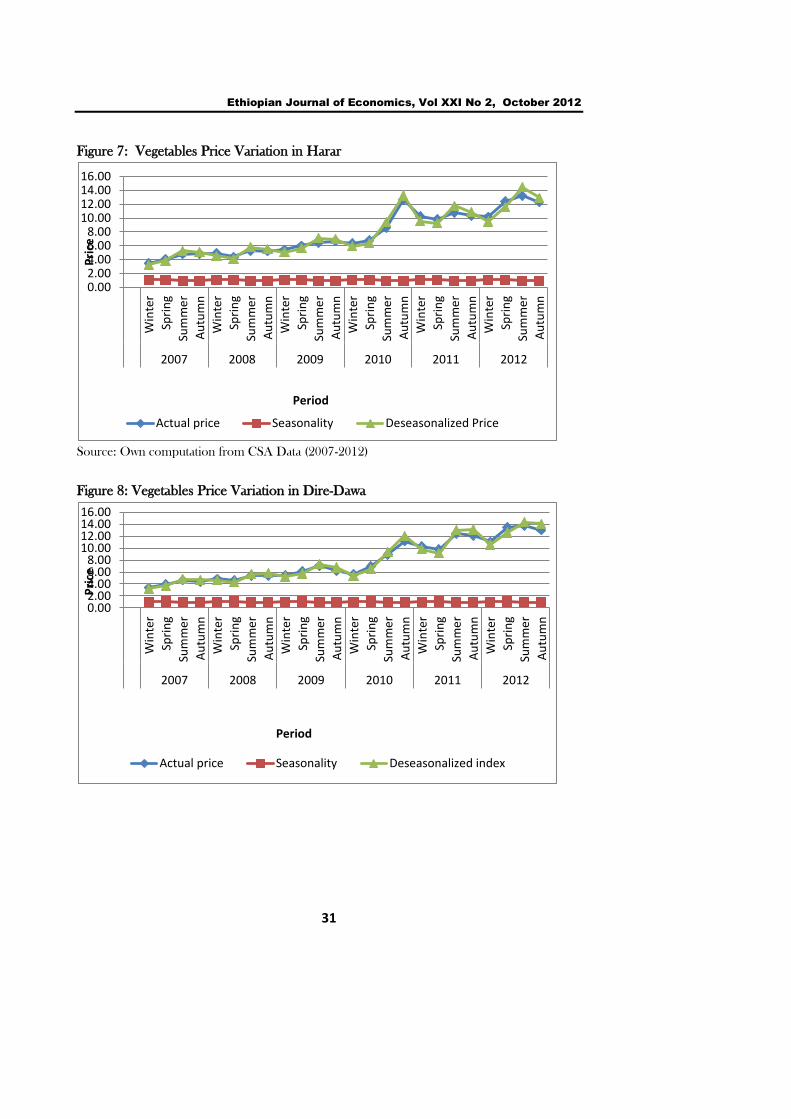
Finally, Appendix B Figure 7 and 8 reveal the price patterns of vegetables and fruits in
the study area. Vegetables and fruits are produced in the eastern part of Ethiopia and
supplied to the local markets and to the neighboring countries including Djibouti and
Somali land. In this area, the supply of vegetables is relatively high even during spring
and autumn due to a strong tradition of rain water harvesting and underground water
utilization, thus irrigation, by farmers. Though there is perpetual supply, there was
moderate seasonal variation in the price of vegetables and fruits, revealed higher in
winter and lower in autumn.
Generally, the variation of prices from season to season was found to be low where as
price levels, for almost all food categories, remained high over the study period. Since
the end of 2007 and more particularly in 2008, price of food items alarmingly spoke.
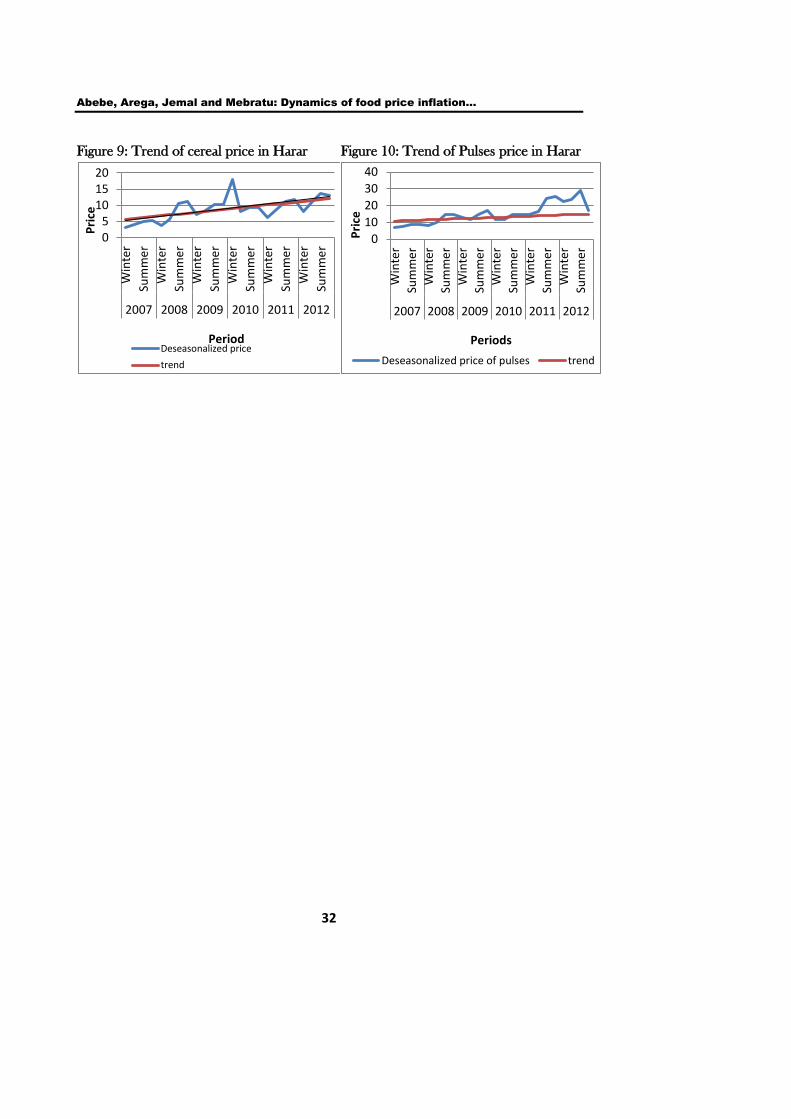
5.2.2 Trend Analysis
Abebe, Arega, Jemal and Mebratu: Dynamics of food price inflation…
14
Trend analysis, a tool to determine the movements of prices overtime, is used to see
the trend of sample food prices in the area over the study period. As the trends of the
selected categories can be understood from the graphs presented for seasonality
analysis, showing separate graphs for all food categories is not necessary. As a result,
only two figures (Figure 9 and 10 in Appendix B) are presented to Harar cereal and
pulses data to exemplify increasing trends of prices.
The actual and deseasonalized price of cereals fluctuated over the study period due to
cyclical factors. The functional trend line of the price change with time is Y=4.85+0.32t
and this enables to project price changes in future t period in the area. Similar to the
price of cereals, the price of pulses showed an increasing trend with the actual and
deseasonalized price fluctuating around the increasing trend line and sometimes,
especially in 2012, going up from the trend line. The function of the pulses price trend
line was found to be Yt = 5.23+ 0.82t again showing the increasing trend over time.
5.3 The Econometric Result
5.3.1
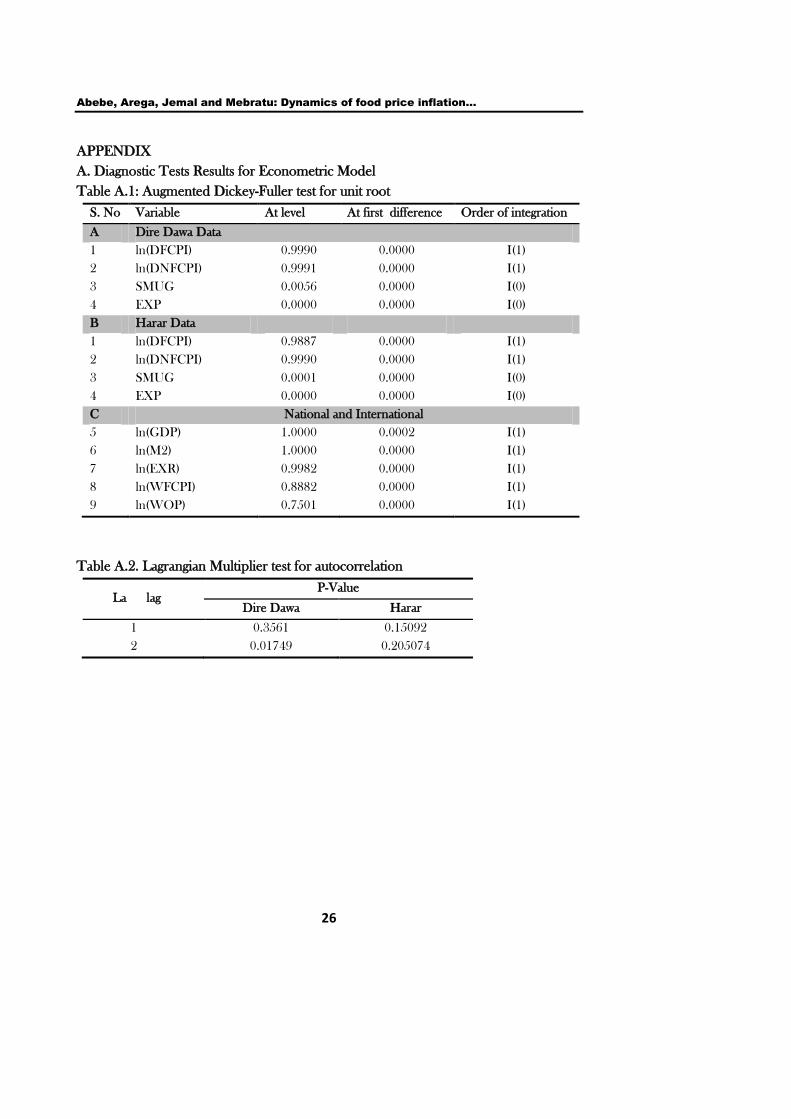
5.3.2 Stationary Test /Unit Root Test
We have carried out unit root test for each variable using Augmented Dickey-Fuller
(ADF) test for unit-root null versus a stationary alternative. The test result revealed that
(Appendix A, Table A.1) for both Dire Dawa and Harar, all variables except smuggling
and expected inflation were not stationary at level. After differencing the non-stationary
series, however, the null of unit root were well rejected at conventional level of
significance. Thus, smuggling and expected inflation are integrated of order zero, I(0),
while all other variables used in the model are integrated of order one, I(1). The result
suggests that the food price inflation, our variable of interest, exhibit a stochastic trend
or non-stationary drift, rather than mean-reversion to a fixed long-run level, over the
sample period. The cointegration analysis attempts to explain these long-run trend
developments by identifying long-run determinants, or I(1) explanatory variables, which
share a common variable trend, i.e., cointegrate, with food price inflation. Based on the
corresponding cointegration estimates, fluctuations in food price can then be
decomposed into trend (permanent) and cyclical (transitory) components, depending
on the time series behavior and its fundamental determinants.
In the unit root test the fact that variables other than smuggling and inflation
expectation appear to be I(1) indicating that they are possible candidates helping to
explain the (stochastic) trend in a given endogeneous variable. This mean that the long
Ethiopian Journal of Economics, Vol XXI No 2, October 2012
15
run cointegration equations will only consist of variables which are I(1). Smuggling and
inflation expectation (I(0) variables), however, appear to be stationary so that
(transitory) changes in these variables are likely to have only a short-run impact on the
explained variable. Thus, these variables should only be introduced in the short run
equation of domestic food price inflation. And differences in the long-run level of such
variables should be reflected in the constant terms of the cointegrating equations,
representing level rather than trend implications. The construction of our VECM
specified in Equation (3) is based on this argument.
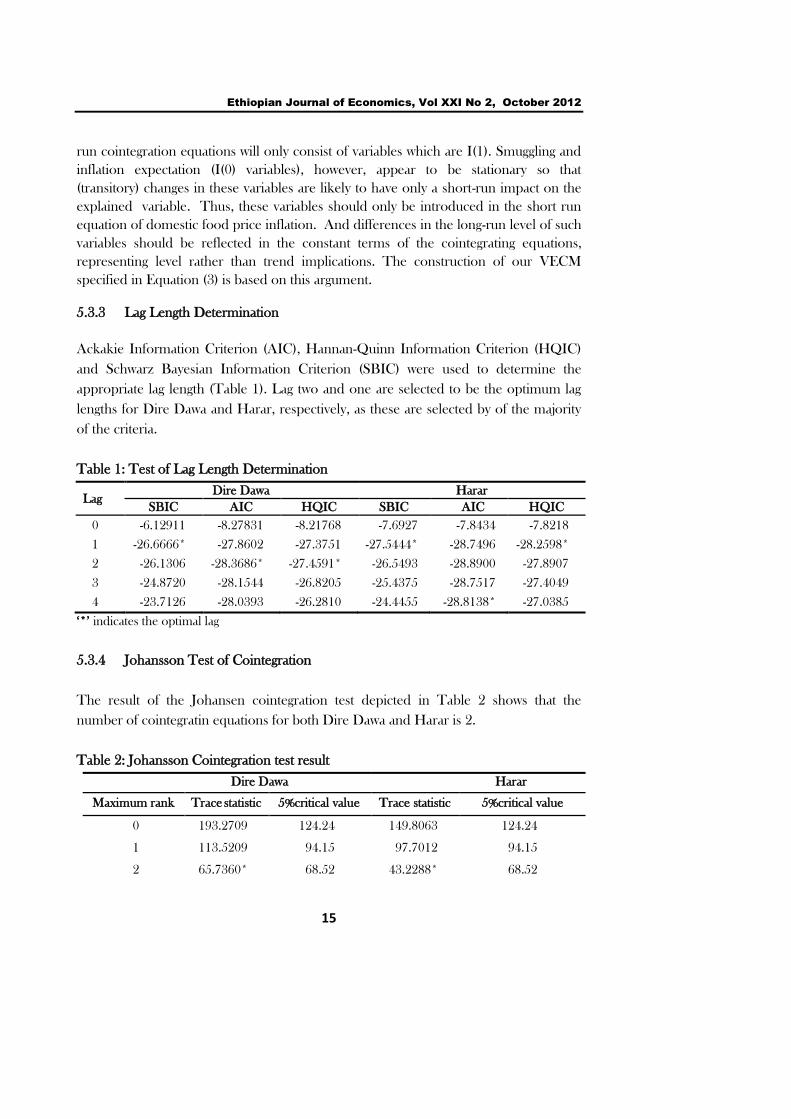
5.3.3 Lag Length Determination
Ackakie Information Criterion (AIC), Hannan-Quinn Information Criterion (HQIC)
and Schwarz Bayesian Information Criterion (SBIC) were used to determine the
appropriate lag length (Table 1). Lag two and one are selected to be the optimum lag
lengths for Dire Dawa and Harar, respectively, as these are selected by of the majority
of the criteria.
Table 1: Test of Lag Length Determination
Lag Dire Dawa Harar
SBIC AIC HQIC SBIC AIC HQIC
0 -6.12911 -8.27831 -8.21768 -7.6927 -7.8434 -7.8218
1 -26.6666* -27.8602 -27.3751 -27.5444* -28.7496 -28.2598*
2 -26.1306 -28.3686* -27.4591* -26.5493 -28.8900 -27.8907
3 -24.8720 -28.1544 -26.8205 -25.4375 -28.7517 -27.4049
4 -23.7126 -28.0393 -26.2810 -24.4455 -28.8138* -27.0385
‗*‘ indicates the optimal lag
5.3.4 Johansson Test of Cointegration
The result of the Johansen cointegration test depicted in Table 2 shows that the
number of cointegratin equations for both Dire Dawa and Harar is 2.
Table 2: Johansson Cointegration test result
Dire Dawa Harar
Maximum rank Trace statistic 5%critical value Trace statistic 5%critical value
0 193.2709 124.24 149.8063 124.24
1 113.5209 94.15 97.7012 94.15
2 65.7360* 68.52 43.2288* 68.52
Abebe, Arega, Jemal and Mebratu: Dynamics of food price inflation…
16
3 39.7895 47.21 23.4283 47.21
4 22.8401 29.68 10.1341 29.68
* Indicates the rank of the cointegrating matrix
5.3.5 Estimation of the Vector Error Correction Model (VECM)
Macroeconomic theory is mainly based on long-run equilibrium relations and
economic theory rarely tells us anything about short-run dynamics. If variables are non-
stationary but cointegrated, it is possible that the parameters of long-run relations are
estimated (super) consistently without considering the short-run dynamics. In order to
estimate long-run equilibrium relations consistently, we no longer need the complete
and fully specified model. It is sufficient to know which (non-stationary) variables are
elements of these relations (Kirchgässner and Wolters, 2007).
In our pre-estimation diagnostic effort, we have shown that variables are cointegrated.
From Granger (1983) and Engle and Granger (1987), if a set of variables are
cointegrated, then there exists a valid error-correction representation of the data. This
VECM in our case is specified in Equation (3) from which we can estimate the long run
and short run determinants of food price.
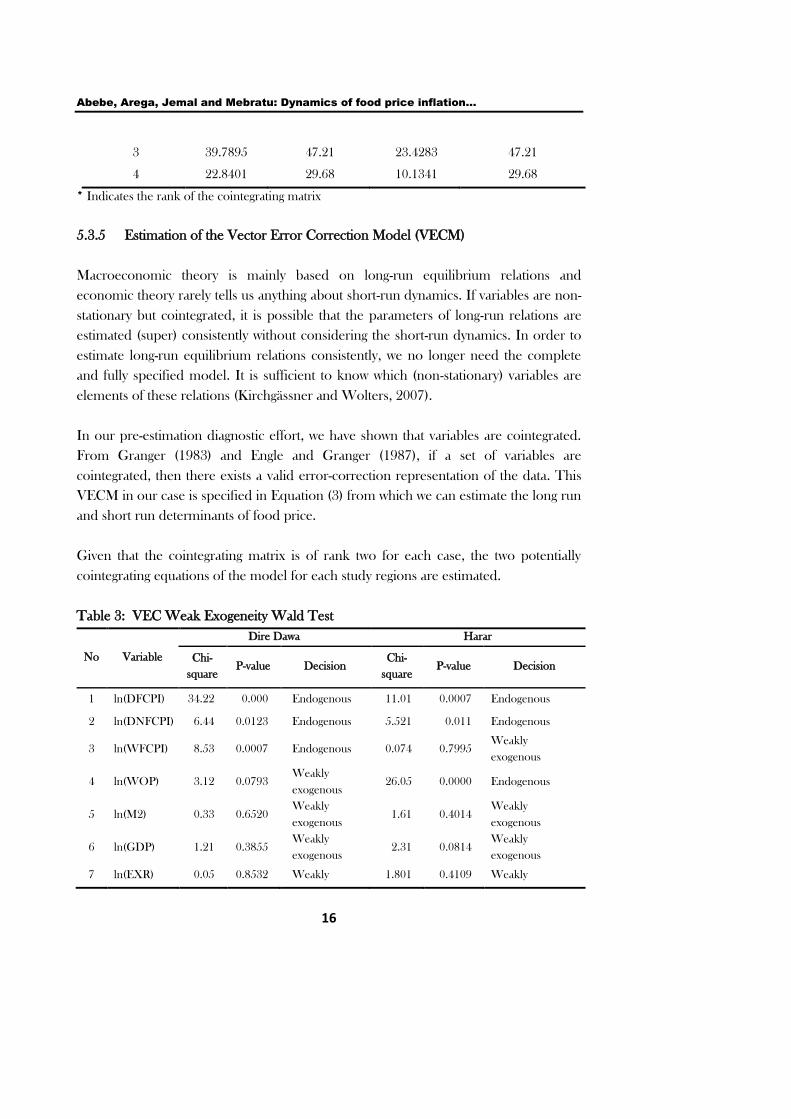
Given that the cointegrating matrix is of rank two for each case, the two potentially
cointegrating equations of the model for each study regions are estimated.
Table 3: VEC Weak Exogeneity Wald Test
No Variable
Dire Dawa Harar
Chi-
square P-value Decision
Chi-
square P-value Decision
1 ln(DFCPI) 34.22 0.000 Endogenous 11.01 0.0007 Endogenous
2 ln(DNFCPI) 6.44 0.0123 Endogenous 5.521 0.011 Endogenous
3 ln(WFCPI) 8.53 0.0007 Endogenous 0.074 0.7995 Weakly
exogenous
4 ln(WOP) 3.12 0.0793 Weakly
exogenous 26.05 0.0000 Endogenous
5 ln(M2) 0.33 0.6520 Weakly
exogenous 1.61 0.4014
Weakly
exogenous
6 ln(GDP) 1.21 0.3855 Weakly
exogenous 2.31 0.0814
Weakly
exogenous
7 ln(EXR) 0.05 0.8532 Weakly 1.801 0.4109 Weakly
Ethiopian Journal of Economics, Vol XXI No 2, October 2012
17
exogenous exogenous
In order to support the theory by statistical test in the effort of identifying the
exogenous and endogenous variables and make the necessary restriction and
normalization, weak exogeniety test was carried out. The test examines the null that the
variable is weakly exogenous against the alternative of not weakly exogeneous and the
test result is presented in Table 3. The test result suggested that ln(DFCPI),
ln(DNFCPI) and ln(WFCPI) (for Dire Dawa) and ln(WOP)(for Harar) are
endogenous while others were found to be weakly exogenous. Even if the statistical test
reveals that world oil and world food prices are endogeneous, it is unlikely to be true
practically and thus the exogeniety restriction was imposed. Therefore, the two
cointegrating equations suggested by the rank test are associated to domestic food
prices and domestic non-food prices. In estimating the two long run equations for each
case, restrictions were imposed and the cointegrating matrix could be identified. In the
cointegrated equation where it was normalized for our variable of interest, ln(DFCPI),
the long-run drivers of domestic food price inflation were identified. Though there is
also another long run equation for the other endogenous variable(non food inflation)
estimated simultaneously and it is possible to derive its respective short run dynamics,
we did not report and discuss this since we are rather interested only on explaining long
run and short run drivers of domestic food price inflation. So, the long run equation of
our variable of interest, food price inflation, for Dire Dawa and Harar are:
(4)
(5)
Where, * and ** show 1% and 5% level of significance and the subscripts d and h
stands for Dire Dawa and Harar, respectively.
In the two long run models presented in Equation (4) and (5), only statistically
significant regressors are reported. The presence of a cointegrating relationship implies
that there exists an error-correction model that describes the short-run dynamics
consistently with the long-run relationship (Johansen, 1988). Given evidence about the
long-run equilibrium relationship between integrated variables, the short-run dynamics
is captured by the lags of the differenced variables and an equilibrium correcting term.
As a result, the rest part of the model specified in Equation (3) was fit and the short run
Abebe, Arega, Jemal and Mebratu: Dynamics of food price inflation…
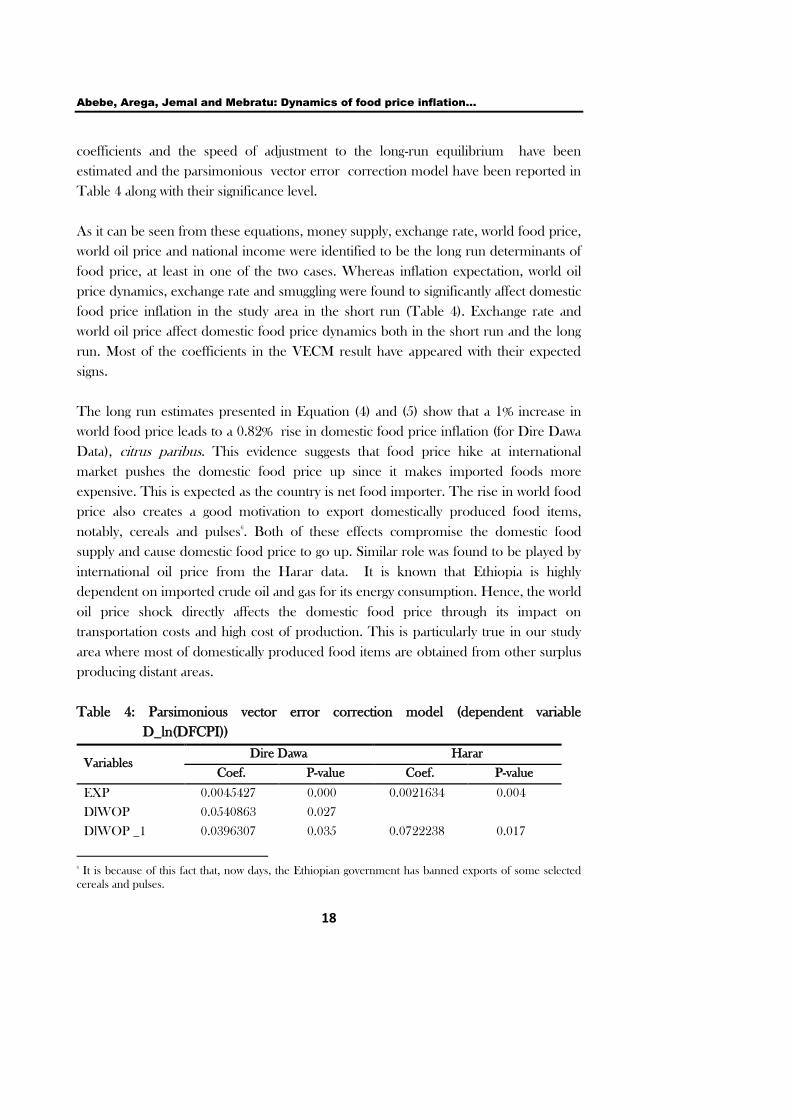
18
coefficients and the speed of adjustment to the long-run equilibrium have been
estimated and the parsimonious vector error correction model have been reported in
Table 4 along with their significance level.
As it can be seen from these equations, money supply, exchange rate, world food price,
world oil price and national income were identified to be the long run determinants of
food price, at least in one of the two cases. Whereas inflation expectation, world oil
price dynamics, exchange rate and smuggling were found to significantly affect domestic
food price inflation in the study area in the short run (Table 4). Exchange rate and
world oil price affect domestic food price dynamics both in the short run and the long
run. Most of the coefficients in the VECM result have appeared with their expected
signs.
The long run estimates presented in Equation (4) and (5) show that a 1% increase in
world food price leads to a 0.82% rise in domestic food price inflation (for Dire Dawa
Data), citrus paribus. This evidence suggests that food price hike at international
market pushes the domestic food price up since it makes imported foods more
expensive. This is expected as the country is net food importer. The rise in world food
price also creates a good motivation to export domestically produced food items,
notably, cereals and pulses6
. Both of these effects compromise the domestic food
supply and cause domestic food price to go up. Similar role was found to be played by
international oil price from the Harar data. It is known that Ethiopia is highly
dependent on imported crude oil and gas for its energy consumption. Hence, the world
oil price shock directly affects the domestic food price through its impact on
transportation costs and high cost of production. This is particularly true in our study
area where most of domestically produced food items are obtained from other surplus
producing distant areas.
Table 4: Parsimonious vector error correction model (dependent variable
D_ln(DFCPI))
6
It is because of this fact that, now days, the Ethiopian government has banned exports of some selected
cereals and pulses.
Variables Dire Dawa Harar
Coef. P-value Coef. P-value
EXP 0.0045427 0.000 0.0021634 0.004
DlWOP 0.0540863 0.027
DlWOP _1 0.0396307 0.035 0.0722238 0.017
Ethiopian Journal of Economics, Vol XXI No 2, October 2012
19
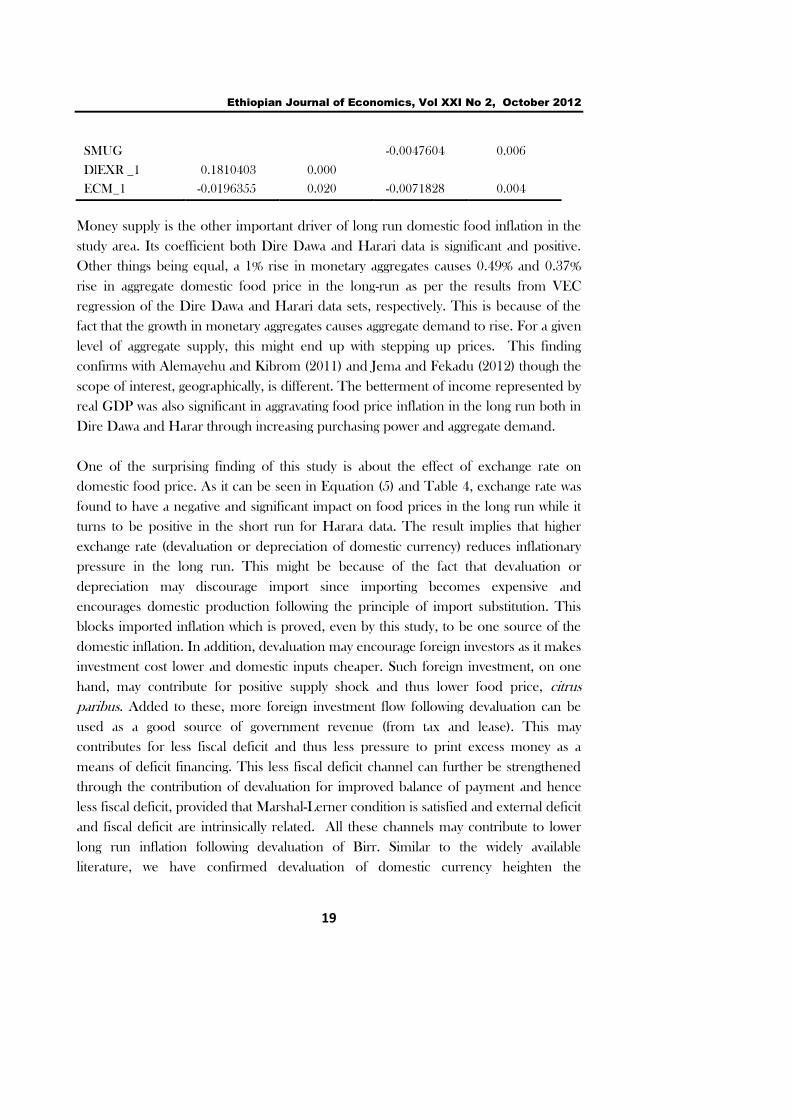
Money supply is the other important driver of long run domestic food inflation in the
study area. Its coefficient both Dire Dawa and Harari data is significant and positive.
Other things being equal, a 1% rise in monetary aggregates causes 0.49% and 0.37%
rise in aggregate domestic food price in the long-run as per the results from VEC
regression of the Dire Dawa and Harari data sets, respectively. This is because of the
fact that the growth in monetary aggregates causes aggregate demand to rise. For a given
level of aggregate supply, this might end up with stepping up prices. This finding
confirms with Alemayehu and Kibrom (2011) and Jema and Fekadu (2012) though the
scope of interest, geographically, is different. The betterment of income represented by
real GDP was also significant in aggravating food price inflation in the long run both in
Dire Dawa and Harar through increasing purchasing power and aggregate demand.
One of the surprising finding of this study is about the effect of exchange rate on
domestic food price. As it can be seen in Equation (5) and Table 4, exchange rate was
found to have a negative and significant impact on food prices in the long run while it
turns to be positive in the short run for Harara data. The result implies that higher
exchange rate (devaluation or depreciation of domestic currency) reduces inflationary
pressure in the long run. This might be because of the fact that devaluation or
depreciation may discourage import since importing becomes expensive and
encourages domestic production following the principle of import substitution. This
blocks imported inflation which is proved, even by this study, to be one source of the
domestic inflation. In addition, devaluation may encourage foreign investors as it makes
investment cost lower and domestic inputs cheaper. Such foreign investment, on one
hand, may contribute for positive supply shock and thus lower food price, citrus
paribus. Added to these, more foreign investment flow following devaluation can be
used as a good source of government revenue (from tax and lease). This may
contributes for less fiscal deficit and thus less pressure to print excess money as a
means of deficit financing. This less fiscal deficit channel can further be strengthened
through the contribution of devaluation for improved balance of payment and hence
less fiscal deficit, provided that Marshal-Lerner condition is satisfied and external deficit
and fiscal deficit are intrinsically related. All these channels may contribute to lower
long run inflation following devaluation of Birr. Similar to the widely available
literature, we have confirmed devaluation of domestic currency heighten the
SMUG
-0.0047604 0.006
DlEXR _1 0.1810403 0.000
ECM_1 -0.0196355 0.020 -0.0071828 0.004
Abebe, Arega, Jemal and Mebratu: Dynamics of food price inflation…
20
inflationary pressure, evidence from Dire Dawa data (Table 4). This might be because
of its impact in making import expensive and increase cost of production.
Since our study area has a unique feature of widespread smuggled products, especially in
consumption items, we were also interested in exploring whether having such feature has
any relation with domestic food price movements. To this effect, we have constructed a
proxy variable for smuggling as it is described in the methodology section. The short run
part of the estimated model for Harar data suggests that smuggling practices plays an
important role in cooling down the heat of food price inflation.
There are some plausible explanations of the inverse relationship between price level
and smuggling. One possible explanation is that price in Ethiopia is relatively larger
than its international parity price precipitating pressure for import. Dire Dawa
Administration and Harari regional state are among the major places in Ethiopia where
smuggling is practiced owing to their location near to the Gulf of Aden-the major
gateway of commodities to Ethiopia. The import augments domestic supply, improves
competitiveness and, thus, puts downward pressure on domestic price. Another
possible explanation is the high cost of making business in Ethiopia. According to
World Bank (2012), Ethiopia is ranked 111th
out of 183 countries in ease of doing
business in 2012. Hence, the financial as well as non financial cost of doing business in
Ethiopia is quiet high and might significantly hamper the motive to engage in formal
business. This motivates actors to involve in practices of smuggling whenever the option
is available. The same source in the same year ranked Ethiopia 157th
in easiness of
trading across borders. Therefore, trading across the borders of Ethiopia is very
difficult justifying high cost of engaging in formal international trade and high level of
smuggling activity in parts of the country which are close to coastlines like Dire Dawa
and Harar. Five different types of taxes namely: customs duty, excise tax, VAT, sur tax
and withholding tax are levied on most of imports into Ethiopia which are calculated
sequentially (Negarit Gazeta, 2009).
Therefore, in the area where no smuggling is undertaken, traders and/or producers
have to pass through all the formal procedures to supply consumption items. This
involves higher transaction costs as compared to those areas where suppliers do
business without bearing the cost of being formal and legal. The effect of such high
transaction costs will finally be reflected on selling prices of items. This may be one
reason why existence of smuggling plays a stabilizing role in the study area. The
smuggling-inflation nexus coveys a message that making the market more competitive
Ethiopian Journal of Economics, Vol XXI No 2, October 2012
21
(through easing the formal way of doing business) and reducing cost of supply (reducing
import tax and tariff for imported items, for instance) may be among the remedies for
current galloping inflation. The coefficient of smuggling from the Dire Dawa data,
though negative as expected, is statistically insignificant. This might be due to the
significant fall in smuggling practice of the town following the termination of the Ethio-
Djibouti rail transport. On the other hand, smuggling in Harar town has continued to
be practiced due to its proximity to Somaliland.
The other evidence supported by this study is the positive and significant relationship
between current prices and future expectation. As it can be seen in Table 4, higher
expectation about future prices creates upward pressure on current actual prices in the
short run, which is in line with the theory. Finally, the error correction term in the short
run model (Table 4) was found to be negative and significant, as expected. The
coefficient of the error correction term is interpreted as the speed of adjustment
towards the long term equilibrium. The negative sign of this coefficient implies that the
food price adjusts/converges to its long run equilibrium with a relatively higher speed in
Dire Dawa and slower in Harar.
The robustness of all these findings have been checked by different post estimation
diagnostic tests in addition to the pre-estimation tests discussed before. The lagrangean
multiplier (LM) test of autocorrelation was conducted against the null of no serial
correlation. The test result reported in Appendix A, Table A.2, shows that the error
terms are not serially correlated since P-value at any lag order is greater than 0.05.
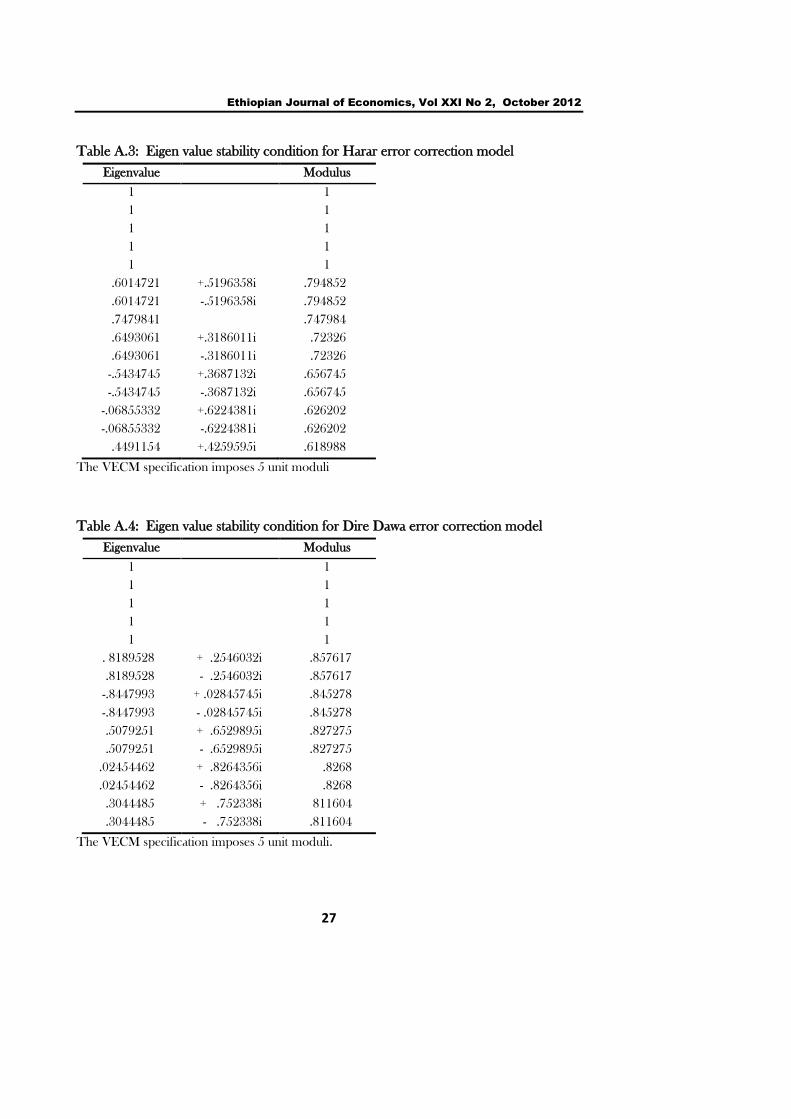
Again, inference based on VECM requires that the cointegrating equations be
stationary and that the number of cointegrating equations be correctly specified. If a
VECM has K endogenous variables and r cointegrating vectors, there will be K-r unit
moduli in the companion matrix. If any of the remaining moduli are too close to one,
either the cointegrating equations are not stationary or there is another common trend
and the rank specified in the model is too high. This test is called the VEC stability test.
Even if there is no general distribution theory that allows to determine whether an
estimated root is too close to one, our test result depicted in appendix A, Table A.3 and
A.4 shows that the non- moduli are not too close to one and thus the model is stable.
6 Conclusion and Policy Implication
Abebe, Arega, Jemal and Mebratu: Dynamics of food price inflation…
22
The purpose of this study is to investigate the determinants of food price inflation at meso
or regional level. To this effect, the study was carried out on Dire Dawa Administration and
Harari regional state by intermingling meso and macro level variables.
Dire Dawa City Administration and Harari Regional State have experienced high level
of price volatility in the last decade. The volatility of food price in this area exhibits
both trend and seasonal patterns. The result from the VECM model reveals that the
rise in money supply, aggregate demand (GDP), and international food and oil prices
exacerbate the domestic food price in the long-run. Similarly, future price expectation
and world oil price increment aggravate domestic food price in the short-run. On the
contrary, depreciation or devaluation of domestic currency reduces inflation in the long
run. Likewise, existence of smuggling practices stabilizes domestic food prices in the
short run through its role in supplying consumption items at a lower cost and increasing
domestic supply and competitiveness in the market.
In light of the above concluding remarks, some policy implications can be drawn. The
fact that money supply appears to be a seminal factor of food price inflation in the long
run and short run entails the need to pursue tight monetary policy. Moreover, the
significant effect of smuggling on food price determination is an alarm for the
government to smoothen the cross boarder trading system and formal way of doing
business by avoiding unnecessary and superfluous barriers. In this regard, it is essential
to increase domestic supply and induce competitiveness in the market. Moreover, the
government may also consider a careful further devaluation of Ethiopian Birr to attract
foreign investment and promote domestic production.
Finally, future researchers may consider other regions of the country and utilize their
special futures through micro-macro modeling to explain price movements.
Researchers may also reconsider the issue we raised by looking at better measures of
variables like smuggling.
Ethiopian Journal of Economics, Vol XXI No 2, October 2012
23
References
Ahmed, H. (2007). ―Structural Analysis of Price Drivers in Ethiopia‖. Addis Ababa: Ethiopian
Development Research Institute. Processed
Alemayehu S. Taffesse, P. Dorosh and Sinafikeh A. (2011). ―Crop Production in Ethiopia:
Regional Patterns and Trends‖, Development Strategy and Governance Division,
International Food Policy Research Institute, working paper 16, Ethiopia Strategy
Support Program II, Ethiopia
Alemayehu, G. (2008). ‗The Political Economy of Growth in Ethiopia‘, in Benno Ndulu,
Stephen O'Connell, Robert Bates, Paul Collier and Charles Soludo. The Political
Economy of Economic Growth in Africa, 1960-2000. Cambridge: Cambridge
University Press.
Alemeayehu, G and Kibrom, T. (2011). ―The Galloping Inflation in Ethiopia: A Cautionary
Tale for Aspiring ‗Developmental States‘ in Africa‖, Institute of African Economic
Studies, Working Paper Serious No. A01/2011
Andrade, P. and Marios, Z. (2011). ―Global Versus Local Shocks in Micro Price Dynamics,‖
Department of Economics, University of Cyprus, Discussion Paper 10.
Ball, R. J. and Doyle, P. (1969). Inflation: Selected Readings. Harmondsworth, England,
Penguin. Penguin Modern Economics Readings.
Barro, R. J. (1996). ―Democracy and Growth‖. Journal of Economic Growth, 1:1-27, Kluwer
Academic Publishers, Boston
BEA (Bureau of Economic Analysis). (2008). ―Macroeconomic Advisers‘ Measure of Monthly
GDP‖, Macro focus, 3(3).
Branson, W. H. and Myhrman, J. (1976). "Inflation in Open Economies: Supply-Determined
versus Demand-Determined Models", European Economic Review, vol. 7, no. 1, pp.
15-34.
CSA (Central Statistical Authority). (2007). ―The Federal Democratic Republic of Ethiopia
population and housing census report‖, Addis Ababa, Ethiopia.
_______. (2012). ―Crop production statistics 2011/12 at national and regional levels report‖,
Addis Ababa, Ethiopia.
_______. (2012). ―Monthly food prices survey data for Harari regional state and Dire-Dawa
administration (2007-2012) report,‖ Addis Ababa, Ethiopia.
_______. (2012). ―Country and Regional Level Consumer Price Indices, for the month of
October 2012,‖ Addis Ababa, Ethiopia.
Cuche, N. & Hess, M. (2000). ―Estimating Monthly GDP in a General Kalman Filter
Framework: Evidence from Switzerland. Economic & Financial Modeling,‖
Information No. 61 Discussion Paper 83-13, University of California, San Diego.
EDRI (Ethiopian Development Research Institute). (2007). ―Determinants of Inflation in
Ethiopia‖, the Federal Democratic Republic of Ethiopia.
Abebe, Arega, Jemal and Mebratu: Dynamics of food price inflation…
24
Engle, R. F. and Granger, C. W. J. (1987). ―Cointegration and Error Correction:
Representation, Estimation and Testing‖, Econometrica, 55, 251–276.
Federal Negarit Gazeta. (2009 February). ―Proclamation No 622/.2009, customs reclamation,
15(27).
FAO (Food and Agricultural Organization). (2008). ―Integrating the Crop and Food Supply and
the Emergency Food Security Assessments‖, FAO/WFP Crop and Food Security
Assessment Mission to Ethiopia, http://www.fao.org/decrep/010/ah883e/ah883e00.htm
Frisch, H. (1977). "Inflation Theory 1963-1975: A Second Generation Survey", Journal of
Economic Literature, Vol. 15, No. 4, pp. 1289-1317.
Galati, G., Teppa, F. and Alessie, R. (2011). ―Macro and Micro Derivers of House Price
Dynamics: An Application to Dutch Data,‖ De Nederlandsche Bank (DNB) Working
Paper No. 288.
Goldstein, M. and Khan, M. (1976). ―Large Versus Small Price Change and the Demand for
Import, IMF Staff paper, 200-225.
Granger, C. W. J. (1983). ―Co-Integrated Variables and Error-Correcting Models,‖
Unpublished
Hill, R. Carter, William E. Griffiths and Guay C. Lim. (2011). Principles of econometrics. 4th
Edition, Johy Wiley and Sons, Inc.
IMF (International Monetary Fund). (2008). ―Federal Democratic Republic of Ethiopia: 2008
Article IV Consultation Staff Report.‖ IMF Country Report 08/264. Washington DC:
Ivanic, M. and Martin, W. (2008). ―Implications of Higher Global Food Prices for Poverty in
Low-Income Countries,‖ Policy Research Working Paper WPS4594. Washington
DC: The World Bank.
Jema H. and G. Fekadu. (2012). ―Determinants of the Recent Soaring Food Inflation in
Ethiopia‖, Universal Journal of Education and General Studies, Vol. 1(8), pp. 225-233.
Johansen, S. (1988). ―Statistical Analysis of Cointegrating Vectors,‖ Journal of Economic
Dynamics and Control, 12, 231-54.
Johansen, S. and Juselius, K. (1990). ―Maximum Likelihood Estimation and Inferences on
Cointegration with applications to the demand for money,‖ Oxford Bulletin of
Economics and Statistics, 52, 169 – 210.
John, M., Sindu, W. and Paulos, Z. (2009). ―Impact of Soaring Food Price in Ethiopia: Does
Location Matter?‖ IFPRI Discussion Paper 00846
Junttila, J. (2001). ―Testing an augmented Fisher hypothesis for a small open economy: The
case of Finland‖, Journal of Macroeconomics. 23, 4:577-599.
Kirchgässner, Gebhard and Jürgen Wolters. (2007). Introduction to Modern Time Series
Analysis, Springer-Verlag Berlin Heidelberg.
Laryea, A. and Sumaila, U. (2001). ―Determinants of inflation in Tanzania‖, CMI Working
Papers, No. 12.
Loening, L., Durevall, D. and Birru, A. (2009). ―Inflation Dynamics and Food Prices in an
Agricultural Economy: The Case of Ethiopia,‖ Working Paper 347. University of
Gothenburg, Gothenburg, Sweden.
Ethiopian Journal of Economics, Vol XXI No 2, October 2012
25
MoFED (Ministry of Finance and Economic Development). (2012). Brief Note on the 2004
(EFY) National Accounts Estimates series: The major results of the 2004 estimates.
Marco, L., Yavni, B., Karla, B. and Yaneer, B. (2011). ―The Food Crises: A quantitative model
of food prices including speculators and ethanol conversion‖, New England Complex
Systems Institute, USA
Meylar, Aidan, Geoff Kenny and Terry Quinn, 1998, ―Forecasting Irish Inflation Using
ARIMA Models,‖ Munich Personal RePEs Archive (MPRA) Paper No 11359.
NBE (National Bank of Ethiopia). (2008/09). ―Annual Report, Economic Research and
Monetary Policy Directorate‖, National Bank of Ethiopia, Addis Ababa
Maruye A. (1992). "The Refurbishing and Expansion of Trade Networks in the Horn of Africa."
In Beyond Conflict in the Horn: Prospects for Peace, Recovery and Development in
Ethiopia, Somalia and the Sudan, edited by Martin Doornbos et al., 115-16. London:
Institute of Social studies.
Tegegne T. and Alemayehu A. (2002).‖Cross-Border Livestock Trade and Food Security in the
Ethiopia-Djibouti and Ethiopia-Somalia Borderlands‖, OSSREA Development
Research Report Series, no. 4. Addis Ababa.
USDA (United States Department of Agriculture). (2003). ―Crop Calendar of Ethiopia‖,
Production Estimates and Crop Assessment Division, Foreign Agricultural Services.
Washington, S., Karlaftis, M., and Mannering, F. (2010). Statistical and Econometric Methods
for Transportation Data Analysis, 2nd
edition. CRC Press / Routledge, United States of
America,
WB (World Bank). (2007). ―Ethiopia: Explaining Food Price Inflation Policy Note‖,
Washington DC.
_______. (2012). ―Doing Business in Ethiopia‖ Accessed at: www.doingbusiness.org.
Yonas, A., and Mans, S. (2012). ―Household-Level Consumption in Urban Ethiopia: The effect
of a large food price shock,‖ World Development, 40 (1): 146-162
Abebe, Arega, Jemal and Mebratu: Dynamics of food price inflation…
26
APPENDIX
A. Diagnostic Tests Results for Econometric Model
Table A.1: Augmented Dickey-Fuller test for unit root
S. No Variable At level At first difference Order of integration
A Dire Dawa Data
1 ln(DFCPI) 0.9990 0.0000 I(1)
2 ln(DNFCPI) 0.9991 0.0000 I(1)
3 SMUG 0.0056 0.0000 I(0)
4 EXP 0.0000 0.0000 I(0)
B Harar Data
1 ln(DFCPI) 0.9887 0.0000 I(1)
2 ln(DNFCPI) 0.9990 0.0000 I(1)
3 SMUG 0.0001 0.0000 I(0)
4 EXP 0.0000 0.0000 I(0)
C National and International
5 ln(GDP) 1.0000 0.0002 I(1)
6 ln(M2) 1.0000 0.0000 I(1)
7 ln(EXR) 0.9982 0.0000 I(1)
8 ln(WFCPI) 0.8882 0.0000 I(1)
9 ln(WOP) 0.7501 0.0000 I(1)
Table A.2. Lagrangian Multiplier test for autocorrelation
La lag P-Value
Dire Dawa Harar
1 0.3561 0.15092
2 0.01749 0.205074
Ethiopian Journal of Economics, Vol XXI No 2, October 2012
27
Table A.3: Eigen value stability condition for Harar error correction model
Eigenvalue Modulus
1 1
1 1
1 1
1 1
1 1
.6014721 +.5196358i .794852
.6014721 -.5196358i .794852
.7479841 .747984
.6493061 +.3186011i .72326
.6493061 -.3186011i .72326
-.5434745 +.3687132i .656745
-.5434745 -.3687132i .656745
-.06855332 +.6224381i .626202
-.06855332 -.6224381i .626202
.4491154 +.4259595i .618988
The VECM specification imposes 5 unit moduli
Table A.4: Eigen value stability condition for Dire Dawa error correction model
Eigenvalue Modulus
1 1
1 1
1 1
1 1
1 1
. 8189528 + .2546032i .857617
.8189528 - .2546032i .857617
-.8447993 + .02845745i .845278
-.8447993 - .02845745i .845278
.5079251 + .6529895i .827275
.5079251 - .6529895i .827275
.02454462 + .8264356i .8268
.02454462 - .8264356i .8268
.3044485 + .752338i 811604
.3044485 - .752338i .811604
The VECM specification imposes 5 unit moduli.
Abebe, Arega, Jemal and Mebratu: Dynamics of food price inflation…
28
Appendix B: Figure for Trend and Seasonality Analysis
Figure 1: Cereals Price Variation in Dire-Dawa
Source: Own computation from CSA Data (2007-2012)
Figure 2: Cereals price variation in Harar
Source: Own computation from CSA Data (2007-2012)
0.00
2.00
4.00
6.00
8.00
10.00
12.00
14.00
Win
ter
Spri
ng
Sum
me
r
Au
tum
n
Win
ter
Spri
ng
Sum
me
r
Au
tum
n
Win
ter
Spri
ng
Sum
me
r
Au
tum
n
Win
ter
Spri
ng
Sum
me
r
Au
tum
n
Win
ter
Spri
ng
Sum
me
r
Au
tum
n
Win
ter
Spri
ng
Sum
me
r
Au
tum
n
2007 2008 2009 2010 2011 2012
Pri
ce
Period
Actual Price seasonality Deseanalized
0
5
10
15
20
25
Win
ter
Spri
ng
Sum
me
r
Au
tum
n
Win
ter
Spri
ng
Sum
me
r
Au
tum
n
Win
ter
Spri
ng
Sum
me
r
Au
tum
n
Win
ter
Spri
ng
Sum
me
r
Au
tum
n
Win
ter
Spri
ng
Sum
me
r
Au
tum
n
Win
ter
Spri
ng
Sum
me
r
Au
tum
n
2007 2008 2009 2010 2011 2012
Pri
ce
Period
Actual price Seasonality Deseasonalized index
Ethiopian Journal of Economics, Vol XXI No 2, October 2012
29
Figure 3: Pulse Price Variation in Harar
Source: Own computation from CSA Data (2007-2012)
Figure-4: Pulses Price Variation in Dire-Dawa
Source: Own computation from CSA Data (2007-2012)
05
101520253035
Win
ter
Spri
ng
Sum
me
r
Au
tum
n
Win
ter
Spri
ng
Sum
me
r
Au
tum
n
Win
ter
Spri
ng
Sum
me
r
Au
tum
n
Win
ter
Spri
ng
Sum
me
r
Au
tum
n
Win
ter
Spri
ng
Sum
me
r
Au
tum
n
Win
ter
Spri
ng
Sum
me
r
Au
tum
n
2007 2008 2009 2010 2011 2012
Pri
ce
Period
Actual price Seasonality Deseasonalized index
0.00
5.00
10.00
15.00
20.00
25.00
Win
ter
Spri
ng
Sum
me
r
Au
tum
n
Win
ter
Spri
ng
Sum
me
r
Au
tum
n
Win
ter
Spri
ng
Sum
me
r
Au
tum
n
Win
ter
Spri
ng
Sum
me
r
Au
tum
n
Win
ter
Spri
ng
Sum
me
r
Au
tum
n
Win
ter
Spri
ng
Sum
me
r
Au
tum
n
2007 2008 2009 2010 2011 2012
Pri
ce
Period
Actual Price Seasonability Deseanalized
Abebe, Arega, Jemal and Mebratu: Dynamics of food price inflation…
30
0.000.501.001.502.002.503.003.504.004.50
Win
ter
Spri
ng
Sum
me
r
Au
tum
n
Win
ter
Spri
ng
Sum
me
r
Au
tum
n
Win
ter
Spri
ng
Sum
me
r
Au
tum
n
Win
ter
Spri
ng
Sum
me
r
Au
tum
n
Win
ter
Spri
ng
Sum
me
r
Au
tum
n
Win
ter
Spri
ng
Sum
me
r
Au
tum
n
2007 2008 2009 2010 2011 2012
Pri
ce
Period
Actual Price Seasonality Deseasonalized
Figure 5: Bread and other prepared foods Price Variation in Harar
Source: Own computation from CSA Data (2007-2012)
Figure 6: Bread and other prepared foods Price Variation in Dire-Dawa
Source: Own computation from CSA Data (2007-2012)
0.000.501.001.502.002.503.003.504.004.50
Win
ter
Spri
ng
Sum
me
r
Au
tum
n
Win
ter
Spri
ng
Sum
me
r
Au
tum
n
Win
ter
Spri
ng
Sum
me
r
Au
tum
n
Win
ter
Spri
ng
Sum
me
r
Au
tum
n
Win
ter
Spri
ng
Sum
me
r
Au
tum
n
Win
ter
Spri
ng
Sum
me
r
Au
tum
n
2007 2008 2009 2010 2011 2012
Pri
ce
Period
Actual price Seasonality Deseasonalized index
Ethiopian Journal of Economics, Vol XXI No 2, October 2012
31
Figure 7: Vegetables Price Variation in Harar
Source: Own computation from CSA Data (2007-2012)
Figure 8: Vegetables Price Variation in Dire-Dawa
0.002.004.006.008.00
10.0012.0014.0016.00
Win
ter
Spri
ng
Sum
me
r
Au
tum
n
Win
ter
Spri
ng
Sum
me
r
Au
tum
n
Win
ter
Spri
ng
Sum
me
r
Au
tum
n
Win
ter
Spri
ng
Sum
me
r
Au
tum
n
Win
ter
Spri
ng
Sum
me
r
Au
tum
n
Win
ter
Spri
ng
Sum
me
r
Au
tum
n
2007 2008 2009 2010 2011 2012
Pri
ce
Period
Actual price Seasonality Deseasonalized Price
0.002.004.006.008.00
10.0012.0014.0016.00
Win
ter
Spri
ng
Sum
me
r
Au
tum
n
Win
ter
Spri
ng
Sum
me
r
Au
tum
n
Win
ter
Spri
ng
Sum
me
r
Au
tum
n
Win
ter
Spri
ng
Sum
me
r
Au
tum
n
Win
ter
Spri
ng
Sum
me
r
Au
tum
n
Win
ter
Spri
ng
Sum
me
r
Au
tum
n
2007 2008 2009 2010 2011 2012
Pri
ce
Period
Actual price Seasonality Deseasonalized index
Abebe, Arega, Jemal and Mebratu: Dynamics of food price inflation…
32
Figure 9: Trend of cereal price in Harar Figure 10: Trend of Pulses price in Harar
05
101520
Win
ter
Sum
me
r
Win
ter
Sum
me
r
Win
ter
Sum
me
r
Win
ter
Sum
me
r
Win
ter
Sum
me
r
Win
ter
Sum
me
r2007 2008 2009 2010 2011 2012
Pri
ce
Period Deseasonalized price
trend
0
10
20
30
40
Win
ter
Sum
me
r
Win
ter
Sum
me
r
Win
ter
Sum
me
r
Win
ter
Sum
me
r
Win
ter
Sum
me
r
Win
ter
Sum
me
r
2007 2008 2009 2010 2011 2012
Pri
ce
Periods
Deseasonalized price of pulses trend


![[Final] Food Inflation](https://img.pdfslide.net/doc/110x75/577ce47f1a28abf1038e7c0c/final-food-inflation.jpg)