Embed Size (px)
Citation preview
Dynamics of Individual Information about Social Security
Susann Rohwedder, RAND
Kristin J. Kleinjans, University of Aarhus
First draft: April, 2004
This draft: February, 2006
We are grateful for valuable comments and suggestions from Alan Gustman, Steven Haider, Michael Hurd, John Phillips, Arthur Van Soest, and participants of the NBER Summer Institute, 2004. Rohwedder thanks NIA for funding under grant RO3 AG024269. Kleinjans thanks NIA for support under grant 1-T32-AG00244-09. Funding from NIA for data development at the RAND Center for the Study of Aging (Grant P30 AG18215) is gratefully acknowledged. All remaining errors are the responsibility of the authors.
1
Dynamics of Individual Information about Social Security
Susann Rohwedder, RAND
Kristin J. Kleinjans, University of Aarhus
Abstract
Several studies have raised concern about an apparent widespread lack of knowledge about pensions and Social Security, even among people close to retirement. These findings largely rely on cross-sectional analyses, and therefore are likely to overstate the negative consequences of lack of knowledge: they only allow limited inference on whether lack of knowledge is a permanent state or whether knowledge improves over time as an individual approaches retirement.
It is of great importance to understand how big a problem lack of knowledge in this area really is to assess to what extent it is responsible for people making sub-optimal choices and suffer bad outcomes in retirement. Understanding these patterns is also essential to find whether additional financial education could avert such bad outcomes and who might benefit from it most.
This paper adopts a dynamic approach using panel data from the Health and Retirement Study spanning the period from 1992 to 2002. We study the evolution of individuals’ expectations about their Social Security benefits and compare them to subsequent Social Security receipt observed in a later wave. We find that individuals update their expectations resulting in the expectations becoming increasingly accurate on average as respondents approach retirement. Resolved uncertainty about events affecting future Social Security benefits plays an important role in explaining the observed patterns. The fraction of respondents who state that they do not know how much Social Security benefits they will receive decreases as they get closer to claiming these benefits. Comparing subjective expectations about future Social Security benefit amounts with actually received benefits in a later wave we find that the self-reports are reasonably accurate for the vast majority. We investigate the discrepancies further because of their potential to affect the household's savings decision. We find that part of the discrepancies are explained by some respondents claiming at a different date than they anticipated. However, when restricting the analysis to a sample of individuals who began drawing benefits when they had planned to we still find a sizeable fraction (17%) who over or under estimate future Social Security benefits by 20% or more. As expected, groups who have less financial knowledge tend to have less accurate expectations about their Social Security benefits.
Susann Rohwedder Kristin J. Kleinjans
RAND University of Aarhus 1776 Main Street Department of Economics Santa Monica, CA 90407 8000 Aarhus C [email protected] Denmark [email protected]
2
1. Introduction
Several studies have raised concern about respondents’ lack of pension knowledge (Mitchell, 1988;
Gustman and Steinmeier, 1999 & 2001) and low engagement in retirement planning activities
(Lusardi, 2001). This observation is at odds with the simple life-cycle model which assumes
individuals to be forward looking. If people do not have the information required to optimize their
economic decisions over their life-cycle they are bound to make sub-optimal economic choices and
risk reaching retirement with inadequate resources associated with low levels of well-being in old age.
Retirement planning is a very complex process due to its intertemporal nature, the long
planning horizon, and the presence of uncertainty. It consists of two main ingredients: the decision
when to retire and the required level of resources to support one’s living standards into old age; both
components are clearly related. Very little is known about how people arrive at these decisions and
what type of information they take into consideration.
One method of finding evidence about the effectiveness of planning is to assess economic
outcomes. At the population level one can argue that the outcomes give a satisfactory picture given
that adjusted income and poverty rates are about the same among the retired and the working age
population. But there is dispute about this: some say that many individuals are inadequately prepared
for retirement (Bernheim, 1993). Even if adequately prepared such acceptable outcomes do not imply
optimal planning. At the individual level, there is some evidence for bad outcomes and that some
people are not well prepared. However, this could be the result of bad luck in an uncertain
environment (Engen, Gale and Ucello, 1999).
A second method of finding evidence about planning is to observe the planning process in
the working-age population. In trying to understand retirement planning and the information used
therein, the most promising population to study should be those close to retirement, because they
are most likely to have well-formed expectations about retirement. Several studies have used the
3
Health and Retirement Study (HRS), a survey of 51 to 61 year olds, to study the accuracy of
pension information and retirement planning activities (Gustman and Steinmeier, 1999 & 2001,
Lusardi, 2001). The HRS asks respondents about the value of their Social Security entitlements and
their employer pensions. Specifically, the survey first inquires whether the individual expects to
receive any benefits from Social Security and if so, when and how much. Gustman and Steinmeier
(2001) have analyzed these self-reports on Social Security and pension entitlements for their accuracy.
For the HRS data collected in 1992 they find high rates of item non-response on these variables and
also wide-spread large deviations from estimated actual entitlements. For expected Social Security
benefits 48.9% of the individuals in their analytical sample report that they do not know how much to
expect. Among pension holders 41.3 % do not know the value of their plan. Only just over one
fourth of respondents reported a value within 25% of estimated actual Social Security benefits. In the
case of employer pensions Gustman and Steinmeier find that only 15.9% report a value within 25% of
the estimated actual entitlements. The authors conclude: “The knowledge measures suggest that
misinformation, imprecision and lack of information about retirement benefits is the norm.”
These findings of lack of pension knowledge have several caveats and are likely to overstate
its extent for the following three reasons:
First, measurement error is not the same as a lack of knowledge. When measuring lack of
knowledge as the difference between an individual’s expected benefits and his or her actual
entitlements, measurement error in either component will be falsely attributed to lack of knowledge.
Both components are affected by measurement error. In the HRS actual benefit entitlements are not
observed and have to be estimated. The error component of each fitted value is attributed to lack of
knowledge. The self-reports of expected benefits, like any variable in a survey, also contain
measurement error (like recall error), which is not related to lack of knowledge.
Second, item non-response is not a direct indicator of a lack of knowledge. Item non-response
4
can also be due to deficiencies in the survey design (e.g., lack of clarity) or genuine uncertainty about
an event that lies in the future.
Third, all studies on pension knowledge or retirement planning activities that we are aware of
are based on cross-sectional observations. This has several weaknesses. For one, this implies that
indicators of a lack of knowledge for somebody who is eight years from expected retirement are
interpreted in the same way as for somebody who is within a few months of retirement. In 1992,
more than half (53.3 %) of those who do not expect collecting Social Security benefits for at least
another eight years, while only 18.7 % expect claiming within three years or less. Controlling for age
deals with this issue only in a limited way. Moreover, the occurrence of recall error and item non-
response has a stochastic component. A respondent who does not answer the expected benefit
question in one wave or answers it poorly (large error) will be classified as poorly informed in a cross-
sectional study; yet the same respondent may give reasonably accurate answers in prior or subsequent
waves. Panel observations allow distinguishing this type of person from one who responds “don’t
know” or “refuse” in all waves. We cannot find from cross-sectional studies whether lack of
knowledge is a permanent state or whether individuals’ knowledge improves over time. In order to
learn about what information people use in their retirement planning we need to study time-patterns of
their information status.
This paper adopts a dynamic approach to studying Social Security information exploiting the
data collected in all waves of the HRS between 1992 and 2002. In every wave, the financial
respondents were asked whether they or their spouses were currently receiving benefits from Social
Security. If not, the follow-up question was whether they expected to receive any benefits from
Social Security in the future; if so, at what age they anticipated receiving these and how much they
expected them to be.1 On the basis of these variables we study patterns over time in individual
1 If the spouse was not currently receiving any benefits from Social Security the financial respondent answered the same sequence of
5
expectations and relate them to their real outcome equivalent, that is, the reported benefit amount
when the respondent is first observed receiving it. The motivation for choosing these self-reported
amounts as the benchmark rather than a calculated amount based on Social Security records is
twofold. First, Social Security records are not available for all respondents.2 Second, the Social
Security records available for HRS respondents contain only information up to 1991. Therefore, we
adopt the alternative approach of using observations on individuals’ actually received Social Security
benefits as observed in a later wave of the HRS. Individuals who have just claimed Social Security
benefits have just gone through what is likely the most intensive interaction of their life with the
respective system; this interaction is bound to positively impact the accuracy of their reports. Survey
experience lends further support to this approach as respondent reports of regularly received amounts,
like earnings or Social Security checks, have proven to be quite accurate. Hurd, Juster and Smith
(2003) show for currently received Social Security benefits that the self-reports in the HRS are very
accurate, and significantly more accurate than in the Current Population Survey. Second, using
observations on actual receipts we do not have to rely on assumptions about future employment and
earnings to obtain a measure of actual entitlements.
Nevertheless, as with any survey variables, there remains reporting error at the individual level
in the values that we choose as the benchmark. The statistical methods need to take this into account.
Hurd, Juster and Smith (2003) find that the reporting error is symmetrically distributed around the
median which is close to 0.3 This suggests that taking averages across groups of observations is
sufficient in most cases to mitigate the effects of measurement and reporting error.
We restrict our analysis to the case of Social Security benefits. All of the analysis described
can be applied to expected benefits from pension plans as well, but their analysis is more complex due
to the heterogeneity of plan features and difficulties of linking observations of the same plans over
questions for the spouse. 2 Social Security records are available for 66% of all 1992 respondents (Mitchell, Olson, Steinmeier, 2000). 3 It is $57 relative to median annual Social Security income of $9,600.
6
time. Other advantages of restricting the analysis to Social Security benefits are the almost universal
coverage of the program (about 95%); that the rules are the same for everybody and that they have
been stable over the period of observation; and that respondents’ future benefits are only subject to
limited sources of risk (no investment risk, only limited or no earnings risk).
The guiding principle of the empirical analysis is to consider the first available self-report on
received Social Security benefits as the most accurate observation available for each respondent.
Defining the evolution of observations as people approach retirement as trend, we study trends in
individual reports on expected Social Security benefit, and the importance of item non-response, as
well as trends in means and variances by education and other personal characteristics. Furthermore,
we investigate trends in the deviations of expected benefit amounts from actually received amounts
and assess whether these indicate convergence towards the individual’s received benefit amount,
suggesting increases in accuracy in the expectations.
We align the observations with reference to the date of first receipt of Social Security benefits,
which ensures that comparisons are made across individuals with about the same distance from the
date of first benefit receipt. As argued above, this measure does not require the many assumptions
necessary when estimating future entitlements, which themselves could be confounded with lack of
knowledge in the analysis. There are other forms of measurement error that complicate the analysis.
We will present group averages where their effect will be reduced substantially; but they should be
kept in mind in the analysis of individual-level deviations between expected and subsequently
received Social Security benefits.
The descriptive analysis also discusses the role of inflation in respondents’ answers about
expected benefits. The cues in the question wording required them to report expected amounts in
“today’s dollars.” While this survey method provides a conceptually clean interpretation of
respondent reports it may not be the most natural concept for many respondents. If respondents did
follow the survey instructions literally then answers from one wave to the next should change in line
7
with the CPI plus any effects of resolved uncertainty or changes in knowledge. However, we show
that this survey method introduces additional measurement error into the reported amounts because
the concept “in today’s dollars” is too hard for respondents to translate into their answers about
expected benefit amounts. [add table and discussion on this]
This paper contributes to our understanding of retirement planning and information
acquisition. It gives insight into the reliability of self-reports of expected benefits. Prior findings on
the lack of knowledge have led many researchers not to use self-reports and to favor data derived
from Social Security records and from the HRS pension calculator. The resulting studies rely on
selected small samples raising concerns about whether their findings apply to the population at large
and about statistical power due to small sample size. It would be very valuable to have ways of
identifying those individuals in the population who are at greatest risk of reaching retirement with
inadequate resources due to lack of knowledge as it would allow to target efforts of improving
financial education on those who would benefit most.
This research is also relevant to the literature on expectation formation. Even though any
economic model that involves intertemporal decision making needs to specify individuals’
expectations about future events there exists surprisingly little evidence on expectation formation.
The need for economic modeling is traditionally met by filling the gap with assumptions about
individuals’ expectation formation, for example, assuming rational expectations. However, as Manski
(2003) points out this assumption is hard to maintain when in reality individuals have to make
decisions under partial information and he argues that “researchers should aim to replace assumptions
about expectations with data on expectations.” This has rarely been done. An exception is Gan,
Gong, Hurd and McFadden (2003) who use observations on subjective probabilities in a structural
life-cycle model of wealth change. In this research we present empirical evidence on individuals’
expectation formation about their future Social Security benefits and how they change over time.
This paper proceeds as follows. In the next part, we describe the data used. We present cross-
8
sectional evidence on response behavior in Section 3, and analyze the corresponding panel evidence
in Section 4. Section 5 concludes.
2. Data
The Health and Retirement Study (HRS) is a large-scale biennial panel survey of individuals born in
1947 and before. It collects data from four broad domains covering labor market activity, economic
status, health, and family connections. The original HRS cohort who was first interviewed in 1992
included individuals born between 1931-1941 and their spouses. At baseline, in 1992, it surveyed
12,652 individuals in 7,702 households representative of the non-institutionalized population in the
United States. In 1998 the survey was merged with the Study of Assets and Health Dynamics among
the Oldest Old (AHEAD) and new cohorts were added. As a result HRS 2002 interviewed close to
20,000 individuals in about 13,000 households. For most of our analysis, we use the initial HRS
cohort as well as the added cohorts called “Warbabies” and “CODA”. 4
For Social Security benefits the questionnaire sequence is arranged as follows: The financial
respondent of the household is asked whether anybody (self or partner) currently receives benefits
from Social Security. If so, the survey elicits who receives these benefits and the amounts. If the
financial respondent does not currently receive Social Security benefits the next question is:
“Do you expect to receive Social Security benefits at some time in the future?”
If the answer is “YES” then two more questions follow:
� “At what age do you expect to start collecting these benefits?” ( ___ AGE)
� “If you start collecting Social Security benefits then, about how much do you expect the
payments to be in today’s dollars?” ( __ AMOUNT)
4 We use the RAND HRS data, version D, a user-friendly version of the HRS data prepared by the RAND Corporation funded by Social Security, with additional support from the National Institute on Aging.
9
If the spouse does not currently receive any benefits from Social Security the financial
respondent answers the same sequence of questions regarding the spouse’s expected future benefit
receipt. In this case we attach the information about the spouse’s situation to the spouse’s own
respondent-level record in order to have all the individual characteristics of the spouse readily
accessible, while keeping track of who provided the information.
In 2002, several changes occurred. While the question about current social security receipt is
continued to be answered by the financial respondent for herself and the spouse, every respondent
answers the questions about social security expectations. The skip pattern has also been slightly
changed. Those for whom the financial respondent gave a “refuse” or “don’t know” to the question
about current receipt of social security benefits are not asked the expectation questions. This,
however, only affects 50 individuals. In addition, those who did not give an expected claiming age
were not asked the expected amount at that age. The format for item non-response on the amounts
has also changed: in the waves from 1992 to 2000 there was no follow-up if the respondent did not
give a value; in 2002 unfolding brackets were introduced.
[Insert summary about income section.]
3. Response Behavior in Cross-section
Prior studies of these data have focused on cross-sectional analyses of HRS 1992 for two reasons
(Gustman and Steinmeier, various papers; Lusardi, 1999 and 2001): (a) ability to match respondent
answers with Social Security earnings records; (b) HRS 1992 included numerous questions about
retirement planning which were not repeated in subsequent waves.5 As noted before, however, cross-
sectional studies cannot identify a number of important features of the data. Therefore, we start out
5 An exception are some questions in an experimental module in HRS 2000 administered to a sub-sample of the HRS population.
10
by showing that even at a fairly descriptive level using the information available from all waves
allows us to learn important basic facts about respondents’ expectations about Social Security and
their evolution over time.
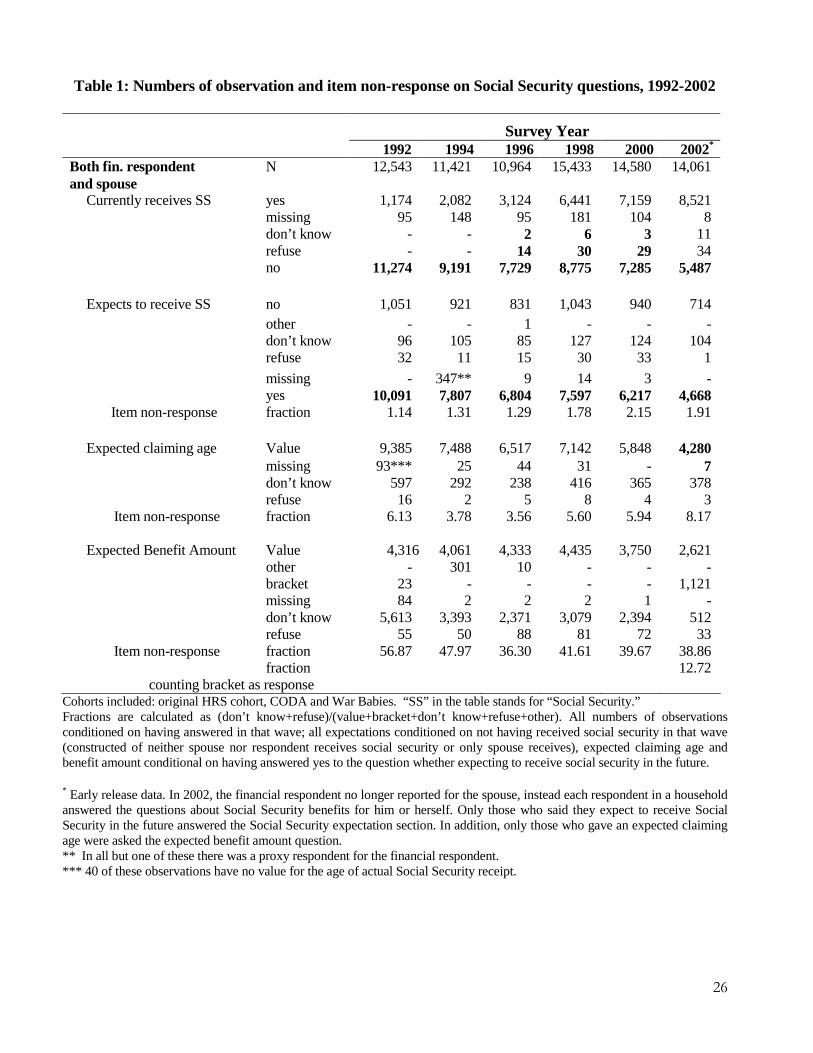
Table 1 presents the number of observations and rates of item non-response on the Social
Security questions in the raw data observed in HRS waves one through six (1992 through 2002). The
various (horizontal) panels represent the single steps of the question sequence. The first thing to note
is the large sample size available for analysis. Every financial respondent in the survey is asked these
questions, and the only routing applied to the expectations questions on Social Security filters out
those who say that they already receive Social Security benefits. From the latter we obtain
observations on actually received Social Security benefits.
Second, note the very low rates of item non-response on all questions, except for the expected
benefit amounts: respondents seem to have virtually no ambiguity about whether they currently
receive Social Security, and the fraction giving a “don’t know” or “refuse” on whether they expect
any benefits in the future is below 2.2% in all waves. Even when asked about expected claiming age,
response rates range between 91.8 and 96.4 percent. These response rates compare favorably to
response rates on questions that refer to the present, such as questions about income and wealth. It is
remarkable that such a large fraction of the population gives a point estimate of their anticipated
claiming age. A number of people may well have a range of possible claiming ages in mind, but the
question about a point estimate might lead many to give a “don’t know” to this question; yet, the vast
majority seems to be certain enough about the event to offer a view about when they will claim. This
is in contrast to the finding that in 1992 about one third of the HRS cohort state that they have hardly
at all thought about retirement (Lusardi, 2001).
The bottom panel in Table 1 shows the response behavior on the question about expected benefit
amounts. Note that these responses are conditional on not currently receiving Social Security and
expecting such benefits in the future. Here item non-response rates are substantially higher than in the
11
previous questions. We find that in 1992 about 57 percent do not report a value for expected Social
Security benefits; these are virtually all “don’t know” responses. It is this evidence that has attracted
attention in prior work. However, considering the evidence from subsequent waves these item non-
response rates decline over time to just under 40 percent in 2002 suggesting that as the sample
population grows older a larger fraction reports an actual value. The response rates to the unfolding
brackets that were introduced in 2002 also show that response rates increase substantially if
respondents are given the possibility to give ranges instead of a point estimate: non-response rates
drop from 39% to 13% if bracketed responses are counted as a response.
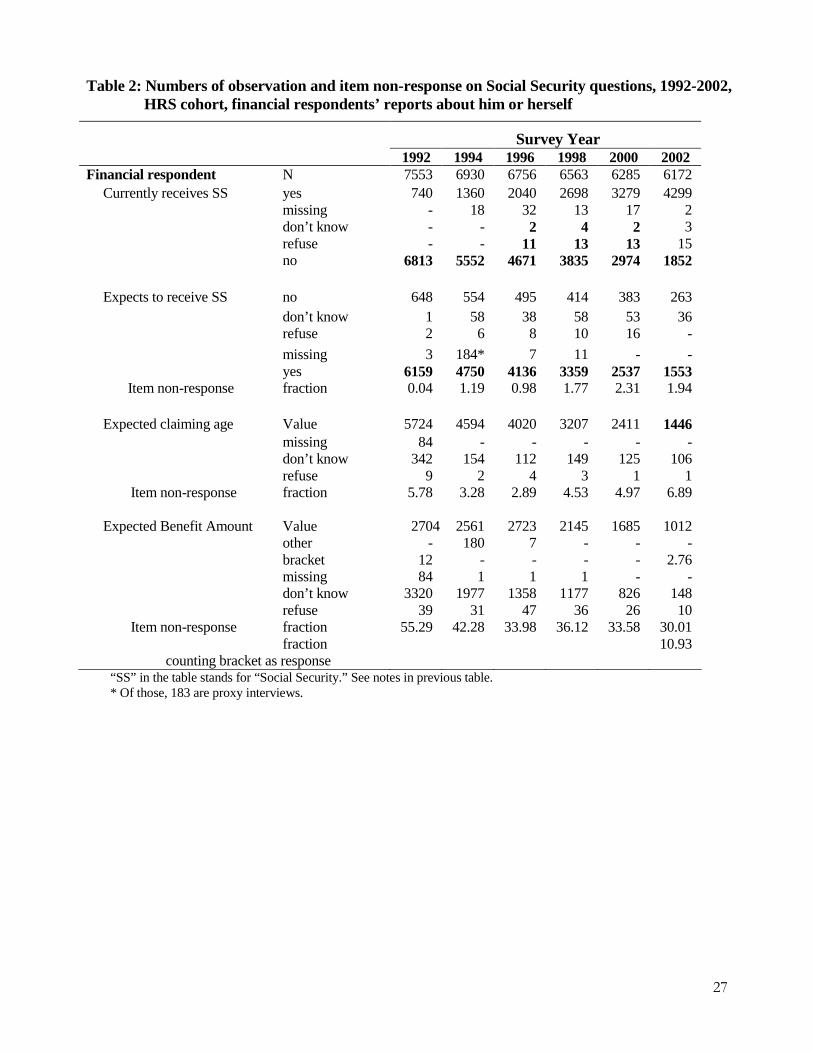
The patterns in Table 1 are confirmed in Table 2, where the sample is restricted to the original
HRS cohort (i.e. dropping the cohorts added in 1998) and to the financial respondents’ own reports in
order to eliminate confounding factors. As one would expect, response rates are somewhat higher on
financial respondents’ own reports; it ought to be easier for a respondent to report about his or her
own situation rather than about the situation of the spouse.
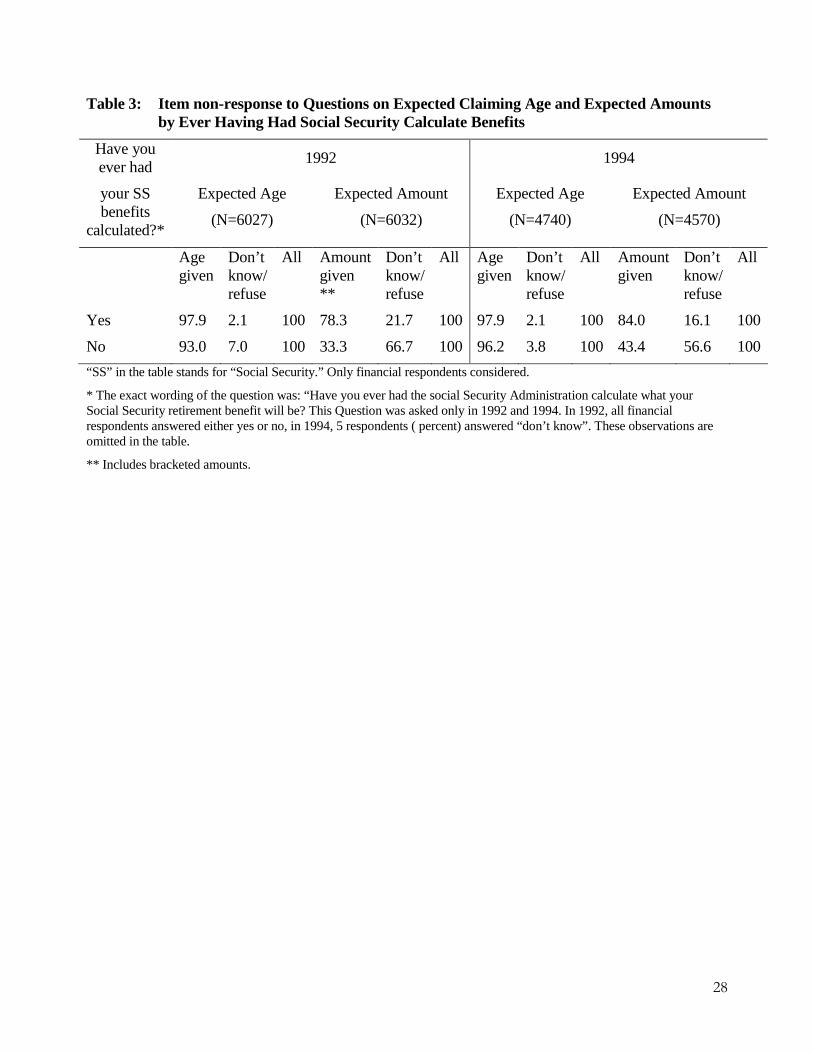
Response rates are also higher for those respondents who have had the Social Security
Administration calculate future benefits. This question was asked in 1992 and 1994, and we show the
item non-response rates to this question for financial respondents in Table 3. As is to be expected,
respondents who ever had requested the calculation have lower non-response rates to the questions
about expected claiming age and expected benefit amount. The effect on the latter is especially strong:
in 1992; item-non-response was three times higher for those who had not requested the calculation,
and item-response rates were over 78% in both years. There are bound to be two effects at play:
firstly, the effect of acquiring the information that makes it easier to answer the questions about future
benefit amounts; and secondly, the selection effect. Those who request Social Security to calculate
their benefits are different from the rest of the sample, representing disproportionally those who
search out information and engage in more active planning.
In 1992 the sample consisted of the original HRS cohort, i.e. a representative sample of the
12
U.S. population aged 51 to 61 and their spouses. This implies that all age-eligible respondents of the
sample at that time were below the Social Security early retirement age. As the sample ages and
people start claiming Social Security we only observe expectations for those who have not yet started
to receive Social Security introducing selection effects. In what follows we present the cross-
sectional evidence on response status by individual characteristics for HRS 1992.
3.1 Response Behavior: Expectations about future Social Security benefit receipt
Roughly 95 percent of the older U.S. population receives Social Security benefits. In cross-section
(Table 1 and Table 2) between 9 and 13 percent report that they do not expect to receive any Social
Security benefits in the future. Following these respondents over time we find that a number of them
end up receiving Social Security in a later wave. There are several ways of interpreting this
phenomenon.
a) Some respondents may not yet qualify for Social Security and believe that the chances that
they will ever qualify are low;
b) Respondents may interpret the question about whether they expect Social Security benefits in
the future as whether they will qualify on their own records, and later we observe them
receiving Social Security, but these benefits stem from the spouse’s records;
c) Lack of knowledge.
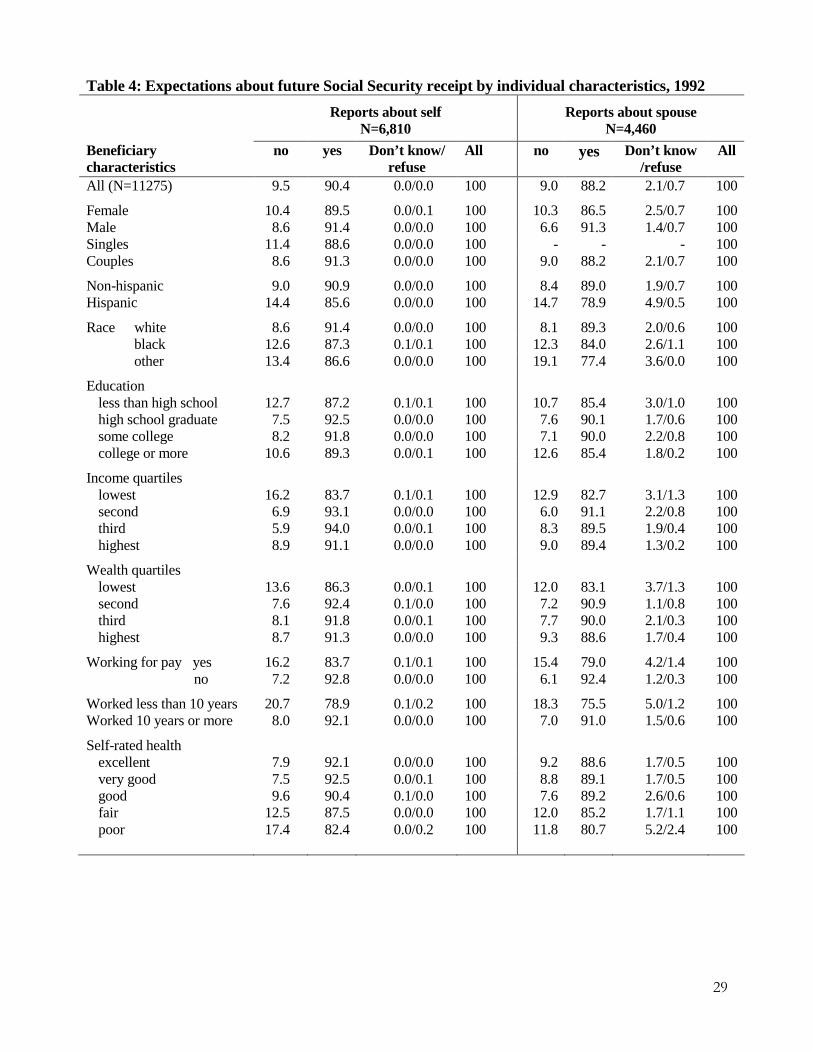
Table 4 presents expectations about future Social Security receipt by individual characteristics for
HRS 1992. Several interesting patterns emerge suggesting that the respondent’s eligibility for Social
Security is an important factor: based on self-reported employment histories we find that respondents
who have worked less than ten years in total at the time of interview are much more likely not to
expect Social Security benefits in the future. For example, among financial respondents reporting
about their own situation 20.7 percent of those who worked less than ten years do not expect future
13
Social Security benefits while only 8.0 percent of those who worked more than ten years do not
expect Social Security benefits in the future. Other individual characteristics that are associated with
a larger fraction of respondents not expecting Social Security benefits are being female, single, non-
white (African American, Hispanic, or other ethnicities); as well as having low income or low wealth.
Note also the gradient in self-reported health status: those in excellent and very good health are more
likely to expect Social Security benefits in the future than those in fair or poor health.
3.2 Response Behavior: Expectations about future Social Security benefit amounts
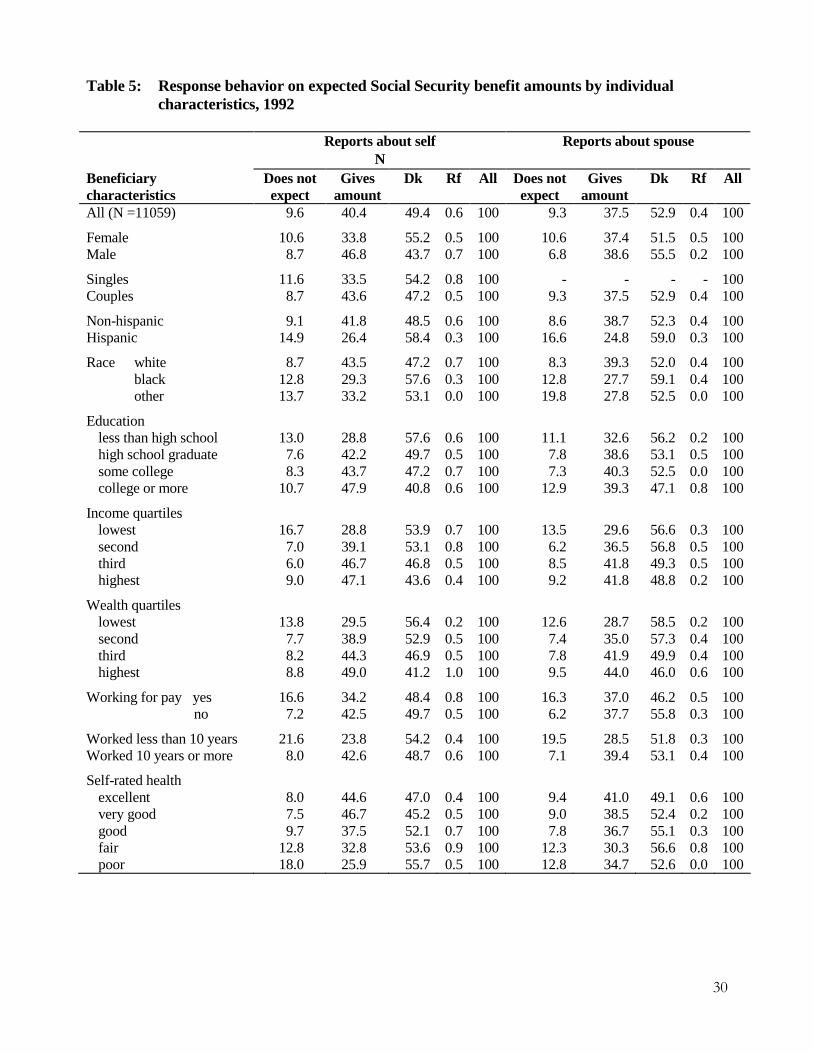
Table 5 turns to response behavior on expected Social Security benefit amounts. It
distinguishes four categories for both the reports on the financial respondents’ own situation and the
reports on the spouse’s situation: first, those who stated earlier in the question sequence that they do
not expect to receive any Social Security benefits in the future which we interpret as giving us the
value zero for expected benefit amounts; second, respondents who report an amount for expected
Social Security benefits; third, the “don’t know” responses, and finally the cases that “refuse” giving
an expected amount. When the financial respondent reports about her own situation the response
rates are higher than when the financial respondent is asked to make statements about the spouse’s
expected benefits; this is intuitive along the lines that anybody should find it easier to give
information about ones own expectations than about the expectations of someone else, even if it is the
spouse. This pattern is true for the entire sample in Table 5 and also within individual characteristics.6
The response rates by individual characteristics show patterns familiar to those found for
reports on other (financial) assets: response rates are lower for females, singles, non-whites (African
American and other ethnicities), Hispanics, and low educated, as well as for those with low income,
low wealth, and in poor health. In addition, those not working for pay at the time of interview and
6 There are only three exceptions to this in Table 5 where spouses work for pay, where the spouse is in poor health, and where the financial respondent is in the lowest education category (less then high school). The first one also holds up in multivariate analysis (Table 10). We discuss its interpretation in the context of the multivariate analysis below.
14
those who have not yet completed 10 years of work are less likely to report an expected amount for
Social Security benefits.
4. Response Behavior in Panel
Recall the caveat we noted earlier that non-response rates are overstated in cross-section, and the
downward trend in item non-response rates over time in Tables 1 and 2. Further study of response
patterns in panel confirms that the accuracy of respondent reports increases as they approach claiming
their benefits.
4.1 Panel: Expectations about Future Social Security Receipt
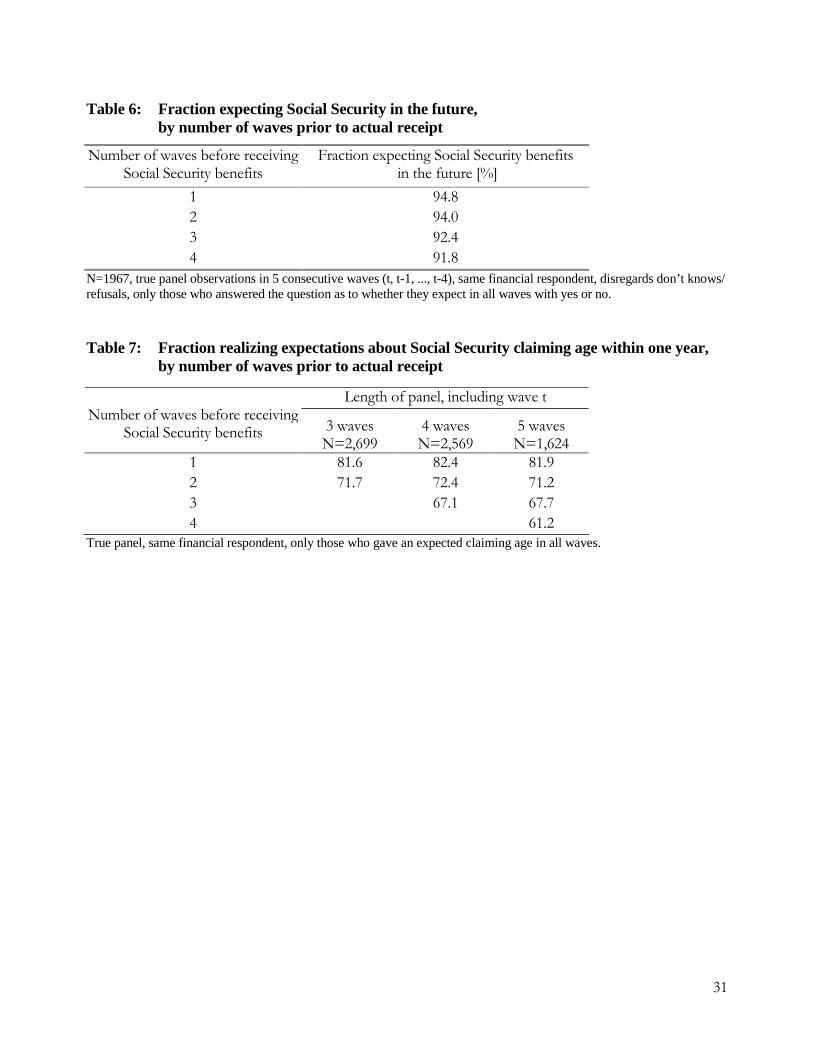
Considering expectations about future Social Security benefits in the panel dimension we
find that the fraction not expecting Social Security benefits in the future decreases as respondents
approach the actual event. Table 6 is based on the sub-sample of respondents for whom we observe
the transition from not receiving Social Security benefits to receiving Social Security benefits during
the HRS survey period. We show true panel observations for five consecutive waves. Let wave t be
the wave at which an individual is first observed receiving Social Security in the HRS. The table
reports the fraction expecting Social Security in the future by the number of waves prior wave t. One
wave before first observed actual receipt, 94.8 percent say they anticipate receiving Social Security
benefits at some future time. In other words, 5.2 percent say they do not expect these benefits in the
future even though we observe them receiving these in the next wave. The size of this group
increases with the distance from first observed actual receipt. Four waves prior to wave t about 8
percent report that they do not expect to receive Social Security benefits in the future. This number is
lower than the levels we found in cross-section. The overall pattern in Table 6 suggests that the
subjective expectations about future Social Security receipt become more accurate on average as
individuals approach the time of first observed actual receipt (wave t). A possible explanation is that
uncertainties about individuals’ eligibility for Social Security benefits get resolved over time. This
15
interpretation is consistent with the evidence in Table 4 which showed an important association
between not expecting Social Security benefits in the future and characteristics that point towards
higher risk of not being eligible for Social Security benefits.
Note that the average fractions of respondents expecting Social Security benefits in Table
6 mask the transitions between expecting and not expecting Social Security benefits across waves:
those expecting benefits in t-1 are not necessarily the same respondents as those who expect benefits
in t-2. In fact, 6.7 percent change their expectations between the waves t-1 and t-2 from either
expecting to not expecting benefits in the future or vice versa, a number that increases the further
away individuals are from claiming (not shown in the table). This provides further support for the
interpretation that some fraction of the population faces considerable uncertainty about future Social
Security benefit receipt: for these people it is hard to answer a yes/no-question about their future
Social Security benefit receipt leading to the observed fluctuation in answers over time. This is
consistent with the findings in Dominitz, Manski and Heinz (2003) who investigate individuals’
expectations about eligibility for future Social Security benefits using data from the Survey of
Economic Expectations: eliciting subjective probabilities about eligibility for Social Security rather
than yes/no-answers they obtain a median probability of eligibility of 0.70 at age 50 and 0.90 at age
60.
One phenomenon yet to explain is that even one wave before actual receipt of Social
Security benefits about 5 percent of the sample still claim not to expect any Social Security benefits in
the future. One possible explanation is that some respondents interpret the question to relate to Social
Security benefits based on their own earnings records, however, the actual benefit could be a spouse’s
benefit.7
7 In further in analysis we will investigate whether we can provide evidence that would substantiate this conjecture. For these respondents who state that they do not expect any Social Security benefits in the future we could check their work histories to find whether they are not eligible for benefits in their own rights. We would also have to check for those with entitlements in their own rights how their entitlements compare approximately to their spouse’s entitlements and whether the spouse’s might be higher leading
16
4.2 Panel: Expected Claiming Age
We showed earlier that rates of item nonresponse on the expected claiming age are very low. For a
large fraction of the sample we observe the date at which the individual actually claims Social
Security benefits. For these respondents we can compare the expected claiming age reported in an
earlier wave with the observed actual outcome. Table 7 shows the fraction of expected claiming ages
reported in an earlier wave (t-1, t-2, ...) that lies within about a year of actual receipt. Considering
true panel observations of different lengths organized by the actual claiming date we find that people
update their expectations about the claiming age. This leads on average to more accurate expectations:
out of the expectations stated one wave before actual receipt around 82 percent are within a year of
the actual claiming age. Comparisons with expectations stated two waves before actual claiming
show that about 71 percent of expectations are within a year of the actual event; at three waves before
wave t the fraction is close to 68 percent, and about 61 percent at t-4. Because expected benefit
amounts are reported conditional on the expected claiming age, we will need to take this updating of
the expected claiming ages into account when analyzing expected benefit amounts below.
Taking as an example the four wave true panel sample, we can learn more about the
individuals and their possible reasons for having an expected claiming age that differs by more than
one year from actual claiming age. Concentrating on comparing the expectations at one wave before
first claiming is observed, we find - as is to be expected - that the vast majority claim earlier than
anticipated (343 out of 364 individuals). Of those, 77 percent expected to claim at age 65 and claimed
at ages 61, 62 or 63. Almost half of them (49.3 percent of 343) changed their labor force status
compared to the last wave to partly or completely retired. We also find that for those whose spouse’s
health is observed, 37% reported either a worsening of self-assessed own or spousal health as
to the perception that they will receive the higher spouse benefit. This analysis we leave for future work.
17
compared to the last wave.
4.3 Panel: Expected Social Security Benefit Amounts
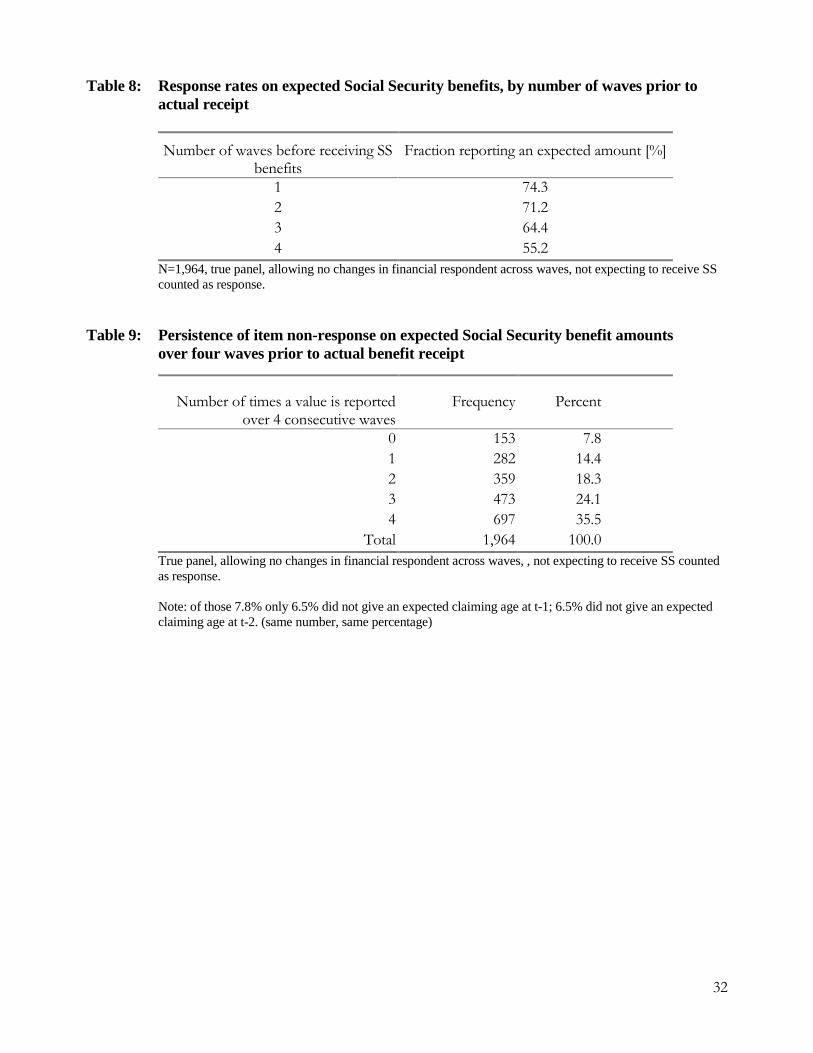
Table 8 presents response rates on expected amounts by distance from first reported
receipt. Again we observe that response rates among respondents who are just one wave from first
reported actual Social Security benefit receipt are about 74 percent and that they decrease with
increasing distance from claiming: 71.2 percent at t-2, 64.4 percent at t-3, and 55.2 percent at t-4.
This reduction in item non-response could be due to resolved uncertainty, or increased planning as
people approach retirement and become more focused on retirement planning when figuring out a
more accurate estimate of the expected benefit amount becomes more relevant.
Cross-sectional analysis lends itself to the interpretation that 56 percent of the population
do not know what their Social Security benefits might be. The above time trends contradict this
interpretation, but may still leave open the possibility that about 25 percent of the population never
find out until their first Social Security check. For this population (at least) there would be hardly any
scope for revising saving or retirement decisions. In a dynamic setting we can address the question of
what fraction of non-respondents in any particular wave never gives a value for the expected benefit
amount. Table 9 summarizes the persistence of item non-response on this survey question for a true
panel going back four waves from t, the date of actual claiming. We find that only 7.8 percent never
report a value for the expected benefit amount. There are several possible explanations for this
persistence: these people may feel uncomfortable with reporting inaccurate point estimates;8 or they
may face greater uncertainty than others; or they are a population that has difficulties dealing with
financial matters and that might benefit from targeted policy measures supporting them in their
financial planning.
8 Note that in 2002, unfolding brackets were introduced. This reduces the non-response rate to the expected benefit amount from 39% to
13% (see Table 1).
18
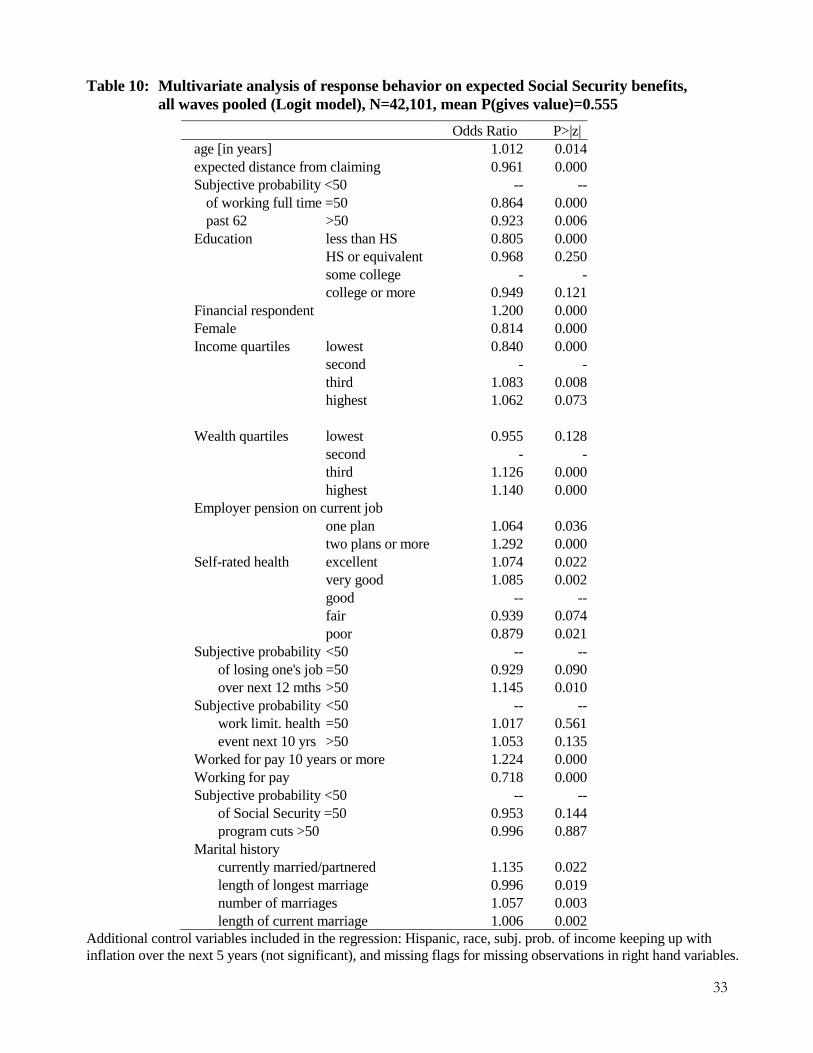
To find whether these patterns hold in multivariate analysis and the magnitude of the
marginal effects associated with specific characteristics we model the probability of reporting an
amount (left hand variable=1) using the Logit model. For this purpose we pool the observations on
expected amounts from all waves resulting in multiple observations for respondents. For example, a
respondent who participated in the survey in all six waves and has not yet started receiving Social
Security benefits would contribute up to six observations depending on whether or not she states
expecting future benefits in every wave. This way we obtain 42,101 observations on the response
behavior to the questions on expected benefit amounts. This excludes observations where there is
ambiguity on whether and when exactly Social Security benefit receipt has started. The list of
explanatory variables includes time invariant characteristics like gender, race, and education; and time
variant characteristics like marital status, income and wealth quartiles,9 whether the person works for
pay, whether she has worked for at least 10 years in total, and self-rated health. We further control for
the expected distance from claiming Social Security benefits to allow for the possibility that response
behavior differs across people who are within just a few years of claiming and those who are not
planning on claiming for several more years.
Table 10 reports the estimates of the odds ratios and the associated P-values.10 Variables
capturing different aspects of the distance from claiming benefits are strongly significant confirming
our earlier observations. The older a person the more likely she is to report an expected amount (1.2
percent more likely for every year of age). Based on the difference between the actual and the
expected claiming age we computed the expected distance from claiming. The further away the
9 Income and wealth quartiles are defined by marital status (single/couple) on the analytical sample. 10 The standard errors are not corrected for the effects of multiple observations on the same individual, because repeated observations on
the same individual are not always reported by the same individual (change in who is the financial respondent across waves); furthermore, there are additional correlations within waves due to the financial respondent also providing the information for the spouse. In view of the large sample size used in the estimation it is unlikely that the standard errors would change in a way that would alter the conclusions in any way. To substantiate this claim we restricted the estimation sample to financial respondents’ reports about their own situation which eliminates the correlations within waves and allows the correction of the standard errors for multiple observations by controlling for clustering. This correction does not affect the point estimates of the coefficients, only the levels of statistical significance. The results with and without correction of the standard errors are closely comparable. The results reported in Table 7 are based on a sample that is about 50% larger therefore warranting our claim.
19
respondent believes she is from claiming the less likely she is to report a value (about 4 percent less
likely for an increase of the expected distance by one year). Expectations about future Social
Security benefit amounts depend on individuals’ expectations about other future events, especially
their future labor force participation. To gauge the importance of uncertainty about this particular
outcome we included information on the individual’s probability of working beyond age 62 (denoted
P62 hereafter). Other studies have found P62 to be a powerful predictor of actual retirement behavior
(Hurd, 1999). On the other hand this variable contains an important fraction of a focal response of 50
percent. Lillard and Willis (2001) argue that such answers reflect high levels of uncertainty among
respondents. Therefore, we enter an indicator variable for the individual reporting P62 being equal to
50 percent and an indicator variable for reporting P62 to be higher than 50 percent. (The excluded
category is P62<50 percent.) Respondents who give a P62 of 50 are 20 percent less likely to give a
value than those who give a low value for P62; and they are even less likely to give a value than those
with a high value for P62. This is in line with the interpretation that P62=50 are focal answers that
reflect high levels of uncertainty on the side of the respondent.
The controls that capture knowledge show the expected effects: the lowest education
group (less than high school) is 20 percent less likely to report an expected amount than the reference
group “some college.” Financial respondents are 20 percent more likely to respond when reporting on
their own expectations rather than their spouse’s expectations. The gradients in income and wealth
and self-rated health earlier observed in cross-section are confirmed: respondents in the lowest income
quartiles are 16 percent less likely to report a value than those in the second income quartile (the
excluded category); those in the third and fourth income quartiles are 8 and 6 (significant only at 10 %
level) percent more likely to report a value, respectively. The magnitude of the effect for wealth
shows somewhat more pronounced patterns than income at the higher end of the distribution: the
likelihood to report a value is increased by 13 and 14 percentage points for the third and fourth
quartile respectively, compared to the second quartile. There is a clear gradient by self-rated health:
20
those in poor health, who also face the greatest uncertainty about their future work life, are
substantially less (12 percent) likely to report a value than those in good health, whereas those in
excellent health are 7 percent more likely to report a value. One would think that having met the
eligibility conditions for Social Security benefits of working (and contributing) for at least 10 years
would reduce an individual’s uncertainty about future Social Security benefits substantially. The
estimates lend support to this suggesting that these individuals are 22.4 percent more likely to report a
value. We have included controls for other types of uncertainty, like the probability of losing one’s
job over the next 12 months, the probability of a work limiting health event over the next 10 years and
the probability of future cuts to the Social Security program. Only the subjective probability of losing
one’s job shows significant patterns. Interestingly, those expressing high risk of losing their job are
substantially more likely to report an expected benefit amount. A possible interpretation is that for
them it is important to know what they might get from Social Security if they had to make a choice
between finding a new job and starting to claim Social Security.
Marital status and marital history seem to be important as well. Couples are 14 percent
more likely to respond. This could be due to the fact that in a couple there is always another
respondent in reserve to assume the duties of the financial respondent. In addition the length of the
longest marriage, the total number of marriages and the length of the current marriage show
significant effects as well. These effects need further study. It might be that, for example, individuals
who went through divorce (higher number of total marriages) assessed their Social Security
entitlements as part of the process and therefore are (5 percentage points) more likely to report an
expected benefit value.
4.4 Expectations about Social Security Benefit Amounts in Panel
Analyzing expected benefit amounts and comparing them to actual amounts received gives insight
into the accuracy of individuals’ expectations. By arranging observations by distance from actual
21
receipt we can further investigate whether the subjective expectations become more accurate as
respondents approach the actual event.
It is worth noting that the question wording introduces measurement error connected with
the treatment of inflation. The survey asks respondents for the expected amounts in “today’s dollars.”
While this provides a conceptually clean strategy to the researcher for interpreting the reported
amounts and how to make them comparable across waves (adjust for inflation), it places the burden
on respondents to perform a non-trivial exercise on top of their head. The degree of difficulty of this
exercise increases with the distance from the expected claiming date. If respondents are not good at
performing this exercise then the observed patterns in expected Social Security benefits over time are
a compound of changes in expectations and changes in the severity of the bias induced by the
attempted inflation adjustment.
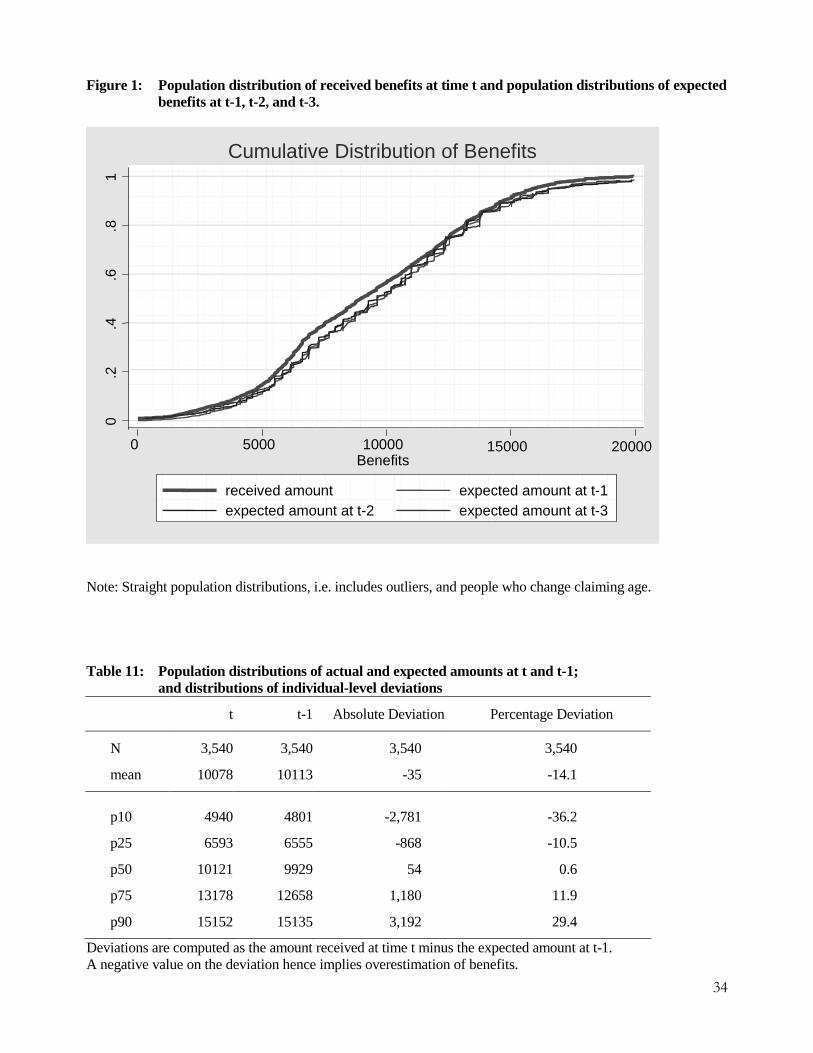
As a first assessment of the accuracy of expectations of future Social Security benefits we
compare the population distributions of realized benefits and expected benefits at time t-1, t-2 and t-3.
These include expectations of individuals who may have changed their expected claiming age over
time. To the extent that this results from a mixture of positive and negative shocks these should
average out at the population level. The distributions are shown in Figure 1. Expectations over time
and realizations are astoundingly close to each other, showing just slight evidence of over estimation
in the expectations. Also the shape of the distribution and the associated amounts (in 2002 dollars) is
very sensible. Mean and median benefits (also by gender) compare very closely to those published by
Social Security.
Clearly, this exercise masks to what extent an individual at the 90th percentile in t-2 might
in fact be at the 40th percentile in t-1 and at the 5th percentile at t. Therefore we present summary
statistics of the population distributions alongside summary statistics of individual-level deviations in
Table 11. The first two columns give the numbers for various percentiles displayed in Figure 1.
Computing the individual-level deviations by taking the actually received amount at time t minus the
22
expected amount at time t-1, columns three and four give the resulting summary statistics. A negative
amount reflects overestimation, that is that the expected amount exceeded the subsequently received
amount. At the median the expectations are virtually spot on. Considering that at the 25th and the 75th
percentile the expectations are within about 11 percent of the actual we conclude that for the vast
majority of the population Social Security benefit receipt is not associated with much of a surprise.
Note that this population still includes those who did not begin claiming at the age they expected. In
fact, by definition, studying the differences between expectations and realizations between t and t-1
the deviations from the expected claiming age can largely only go in one direction which is claiming
earlier than anticipated.11,12 This might explain some of the observed overestimation of actual
benefits on average. However, issues of inflation and how respondents figure that into their responses
might be just as important an explanation. To purge the observed deviations from the effect of
changes in the timing of claiming benefits and to assess the magnitude of early claiming we split the
sample into those who claimed about at the anticipated time (plus or minus one year) and those
individuals who claimed earlier than planned. For t-1 about 80% claimed as anticipated and about
11% of the sample claimed earlier than anticipated; the remainder claimed just slightly later than a
year later than anticipated. Table 12 shows the distributions of the percent deviations for t-1, t-2 and
t-3.
First focusing on respondents who claimed as anticipated the distribution looks quite
similar to the one in Table 11 for t-1, only suggesting slightly smaller deviations, in particular less
overestimation, as would be expected. Even when going further back in time with respect to actual
benefit receipt the deviations are still bounded by –14% and +20% at the 25th and 75th percentile,
respectively. Much larger deviations are, of course, found for the sample that claimed earlier than
anticipated. Note, however, that this group represents a much smaller fraction of the sample. An
11 We allow for deviations from the expected claiming age of plus or minus one year. 12 To study both, earlier and postponed claiming jointly we would need to consider longer time spells, like t and t-4.
23
important question to ask is what causes early claiming. If it is largely driven by adverse shocks then
these deviations would not reflect lack of retirement planning. To shed light into this issue we model
the probability of claiming earlier than anticipated at time t-1 as a function of individual
characteristics measured at time t-1.
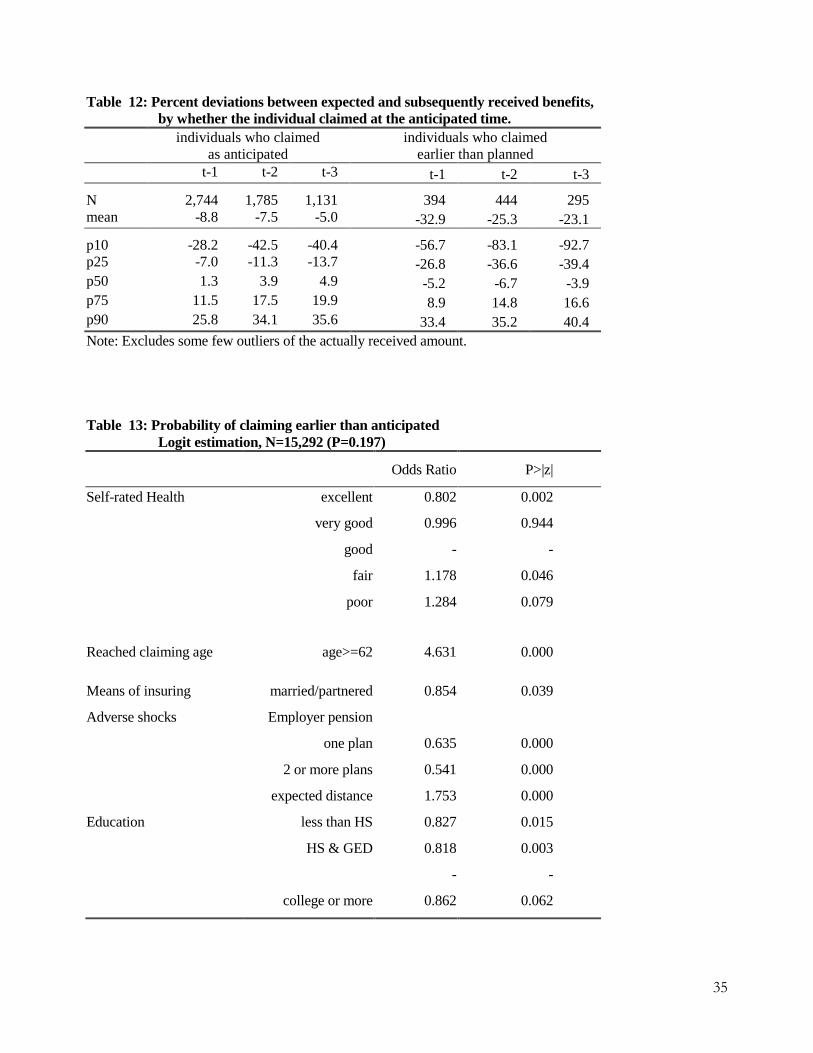
The logit estimation is presented in Table 13.13 The effects are estimated controlling for
the expected distance from claiming and for eligibility for claiming benefits at t-1. We find a very
strong gradient for self-rated health. According to McClellan (1998) self-rated health is a strong
predictor for the onset of a bad health event. This is in line with our findings: those in excellent
health compared to those in good health at t-1 are 20 percent less likely to claim Social Security
earlier than anticipated. Those in poor health on the other side are 28 percent more likely to claim
earlier than anticipated. Controls that capture the means of insuring against adverse shocks show the
expected patterns: married or partnered individuals may be able to rely on the partner’s income and
therefore might not need to claim Social Security early. They are estimated to be 15 percent less
likely to claim early compared to singles. Similarly, individuals with pension provisions from
employers are substantially less likely to claim early. We conclude that adverse health shocks are an
important driving force behind early claiming of Social Security benefits.
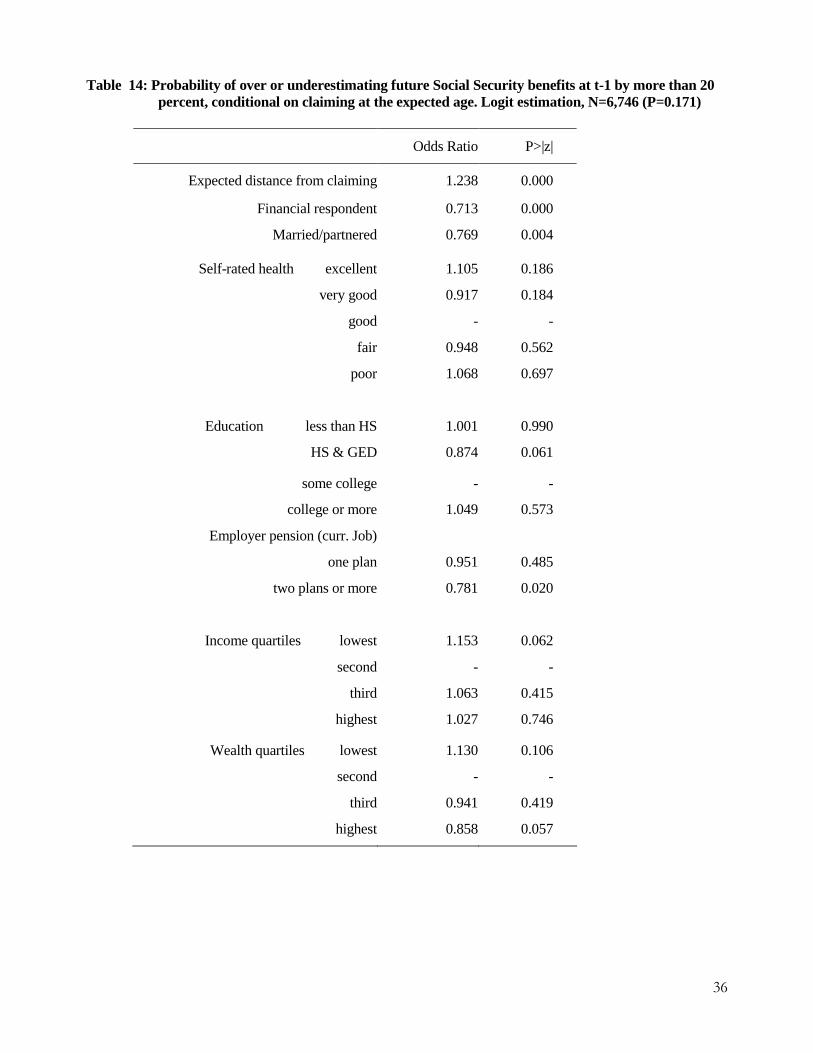
Finally, we would like to know the characteristics of those respondents who substantially over or
under estimate their Social Security benefits even in the absence of revisions of their claiming age.
For that purpose we model the probability of over or under estimating expected Social Security
benefits by 20 percent or more (see Table 14). Having the financial respondent report for him or
herself, and also being married or partnered, which provides a choice in the survey interview who
reports the value, reduces the relative risk of large deviations between expected and realized amounts
13 The sample is much larger than in Table 12, because we no longer restrict the sample to a 4-wave panel.
24
by a lot. Economic resources play an important role, too: being in the lowest income quartile
increases the relative risk; being in the highest wealth quartile reduces the risk of misperceptions
about future benefits. Individuals with two or more employer pensions are 22 percent less likely than
those without employer pensions to misreport their future benefits. This might be either an expression
of another dimension of socioeconomic status or possibly reflect that these individuals have
necessarily been prompted more frequently in their lives with pension and Social Security related
issues.
5. Conclusions
HRS has accumulated a large wealth of data on expectations about Social Security with repeated
observations over time. Studies based on cross-sectional comparisons with Social Security earnings
records have presented these data as being dominated by lack of knowledge on the part of respondents
and with little or no predictive power for actual outcomes. We show that conducting analyses on less
restrictive samples, taking into account the panel dimension and accounting for differences in the
expected distance from the actual event are crucial in studying these expectations. We show that
adopting this approach brings out many consistent patterns. As a result we argue that various
relationships previously studied (especially the link to retirement decisions) deserve revisiting in a
dynamic context. Furthermore, the variation that we show in a largely descriptive analysis suggests
that there are many research questions that have yet to be investigated, like the determinants of
expectations, and the determinants of changes in expectations over time, possibly leading to structural
models of expectation formation, and more broadly studying the retirement planning process itself.
We have shown that it is important when using and interpreting these data to control carefully for the
distance from claiming Social Security (expected or actual depending on the analysis) and to take into
account uncertainty that individuals face.
25
At the population level we find that expectations are very consistent with realizations. There
is a fair amount of updating in the timing of expected claiming of benefits leading to deviations for
previously observed expectations. Our study of early claiming behavior shows that health shocks are
an important driving force underlying this observation. However, when restricting the analysis to a
sample of individuals who began drawing benefits when they had planned to we still find a sizeable
fraction (17%) who over or under estimate future Social Security benefits by 20% or more. As
expected, groups who have less financial knowledge tend to have less accurate expectations about
their Social Security benefits.
26
Table 1: Numbers of observation and item non-response on Social Security questions, 1992-2002
Survey Year 1992 1994 1996 1998 2000 2002*
Both fin. respondent N and spouse
12,543 11,421 10,964 15,433 14,580 14,061
Currently receives SS yes 1,174 2,082 3,124 6,441 7,159 8,521 missing 95 148 95 181 104 8 don’t know - - 2 6 3 11 refuse - - 14 30 29 34 no 11,274 9,191 7,729 8,775 7,285 5,487 Expects to receive SS no 1,051 921 831 1,043 940 714 other - - 1 - - - don’t know 96 105 85 127 124 104 refuse 32 11 15 30 33 1
missing - 347** 9 14 3 - yes 10,091 7,807 6,804 7,597 6,217 4,668 Item non-response fraction 1.14 1.31 1.29 1.78 2.15 1.91 Expected claiming age Value 9,385 7,488 6,517 7,142 5,848 4,280 missing 93*** 25 44 31 - 7 don’t know 597 292 238 416 365 378 refuse 16 2 5 8 4 3
Item non-response fraction 6.13 3.78 3.56 5.60 5.94 8.17 Expected Benefit Amount Value 4,316 4,061 4,333 4,435 3,750 2,621 other - 301 10 - - - bracket 23 - - - - 1,121 missing 84 2 2 2 1 - don’t know 5,613 3,393 2,371 3,079 2,394 512 refuse 55 50 88 81 72 33
Item non-response fraction fraction counting bracket as response
56.87 47.97 36.30 41.61 39.67 38.86 12.72
Cohorts included: original HRS cohort, CODA and War Babies. “SS” in the table stands for “Social Security.” Fractions are calculated as (don’t know+refuse)/(value+bracket+don’t know+refuse+other). All numbers of observations conditioned on having answered in that wave; all expectations conditioned on not having received social security in that wave (constructed of neither spouse nor respondent receives social security or only spouse receives), expected claiming age and benefit amount conditional on having answered yes to the question whether expecting to receive social security in the future. * Early release data. In 2002, the financial respondent no longer reported for the spouse, instead each respondent in a household answered the questions about Social Security benefits for him or herself. Only those who said they expect to receive Social Security in the future answered the Social Security expectation section. In addition, only those who gave an expected claiming age were asked the expected benefit amount question. ** In all but one of these there was a proxy respondent for the financial respondent. *** 40 of these observations have no value for the age of actual Social Security receipt.
27
Table 2: Numbers of observation and item non-response on Social Security questions, 1992-2002, HRS cohort, financial respondents’ reports about him or herself
Survey Year 1992 1994 1996 1998 2000 2002 Financial respondent N 7553 6930 6756 6563 6285 6172
Currently receives SS yes 740 1360 2040 2698 3279 4299 missing - 18 32 13 17 2 don’t know - - 2 4 2 3 refuse - - 11 13 13 15 no 6813 5552 4671 3835 2974 1852 Expects to receive SS no 648 554 495 414 383 263 don’t know 1 58 38 58 53 36 refuse 2 6 8 10 16 -
missing 3 184* 7 11 - - yes 6159 4750 4136 3359 2537 1553 Item non-response fraction 0.04 1.19 0.98 1.77 2.31 1.94 Expected claiming age Value 5724 4594 4020 3207 2411 1446 missing 84 - - - - - don’t know 342 154 112 149 125 106 refuse 9 2 4 3 1 1
Item non-response fraction 5.78 3.28 2.89 4.53 4.97 6.89 Expected Benefit Amount Value 2704 2561 2723 2145 1685 1012 other - 180 7 - - - bracket 12 - - - - 2.76 missing 84 1 1 1 - - don’t know 3320 1977 1358 1177 826 148 refuse 39 31 47 36 26 10
Item non-response fraction fraction counting bracket as response
55.29 42.28 33.98 36.12 33.58 30.01 10.93
“SS” in the table stands for “Social Security.” See notes in previous table. * Of those, 183 are proxy interviews.
28
Table 3: Item non-response to Questions on Expected Claiming Age and Expected Amounts by Ever Having Had Social Security Calculate Benefits
Have you ever had
1992 1994
your SS benefits
calculated?*
Expected Age
(N=6027)
Expected Amount
(N=6032)
Expected Age
(N=4740)
Expected Amount
(N=4570)
Age given
Don’t know/ refuse
All Amount given **
Don’t know/ refuse
All Age given
Don’t know/ refuse
All Amount given
Don’t know/ refuse
All
Yes 97.9 2.1 100 78.3 21.7 100 97.9 2.1 100 84.0 16.1 100
No 93.0 7.0 100 33.3 66.7 100 96.2 3.8 100 43.4 56.6 100
“SS” in the table stands for “Social Security.” Only financial respondents considered.
* The exact wording of the question was: “Have you ever had the social Security Administration calculate what your Social Security retirement benefit will be? This Question was asked only in 1992 and 1994. In 1992, all financial respondents answered either yes or no, in 1994, 5 respondents ( percent) answered “don’t know”. These observations are omitted in the table.
** Includes bracketed amounts.
29
Table 4: Expectations about future Social Security receipt by individual characteristics, 1992 Reports about self
N=6,810 Reports about spouse
N=4,460
Beneficiary characteristics
no yes Don’t know/ refuse
All no yes Don’t know /refuse
All
All (N=11275) 9.5 90.4 0.0/0.0 100 9.0 88.2 2.1/0.7 100
Female 10.4 89.5 0.0/0.1 100 10.3 86.5 2.5/0.7 100 Male 8.6 91.4 0.0/0.0 100 6.6 91.3 1.4/0.7 100 Singles 11.4 88.6 0.0/0.0 100 - - - 100 Couples 8.6 91.3 0.0/0.0 100 9.0 88.2 2.1/0.7 100
Non-hispanic 9.0 90.9 0.0/0.0 100 8.4 89.0 1.9/0.7 100 Hispanic 14.4 85.6 0.0/0.0 100 14.7 78.9 4.9/0.5 100
Race white 8.6 91.4 0.0/0.0 100 8.1 89.3 2.0/0.6 100 black 12.6 87.3 0.1/0.1 100 12.3 84.0 2.6/1.1 100 other 13.4 86.6 0.0/0.0 100 19.1 77.4 3.6/0.0 100
Education
less than high school 12.7 87.2 0.1/0.1 100 10.7 85.4 3.0/1.0 100 high school graduate 7.5 92.5 0.0/0.0 100 7.6 90.1 1.7/0.6 100 some college 8.2 91.8 0.0/0.0 100 7.1 90.0 2.2/0.8 100 college or more 10.6 89.3 0.0/0.1 100 12.6 85.4 1.8/0.2 100
Income quartiles lowest 16.2 83.7 0.1/0.1 100 12.9 82.7 3.1/1.3 100 second 6.9 93.1 0.0/0.0 100 6.0 91.1 2.2/0.8 100 third 5.9 94.0 0.0/0.1 100 8.3 89.5 1.9/0.4 100 highest 8.9 91.1 0.0/0.0 100 9.0 89.4 1.3/0.2 100
Wealth quartiles
lowest 13.6 86.3 0.0/0.1 100 12.0 83.1 3.7/1.3 100 second 7.6 92.4 0.1/0.0 100 7.2 90.9 1.1/0.8 100 third 8.1 91.8 0.0/0.1 100 7.7 90.0 2.1/0.3 100 highest 8.7 91.3 0.0/0.0 100 9.3 88.6 1.7/0.4 100
Working for pay yes 16.2 83.7 0.1/0.1 100 15.4 79.0 4.2/1.4 100 no 7.2 92.8 0.0/0.0 100 6.1 92.4 1.2/0.3 100
Worked less than 10 years 20.7 78.9 0.1/0.2 100 18.3 75.5 5.0/1.2 100 Worked 10 years or more 8.0 92.1 0.0/0.0 100 7.0 91.0 1.5/0.6 100
Self-rated health
excellent 7.9 92.1 0.0/0.0 100 9.2 88.6 1.7/0.5 100 very good 7.5 92.5 0.0/0.1 100 8.8 89.1 1.7/0.5 100 good 9.6 90.4 0.1/0.0 100 7.6 89.2 2.6/0.6 100 fair 12.5 87.5 0.0/0.0 100 12.0 85.2 1.7/1.1 100 poor 17.4 82.4 0.0/0.2 100 11.8 80.7 5.2/2.4 100
30
Table 5: Response behavior on expected Social Security benefit amounts by individual characteristics, 1992 Reports about self
N Reports about spouse
Beneficiary characteristics
Does not expect
Gives amount
Dk Rf All Does not expect
Gives amount
Dk Rf All
All (N =11059) 9.6 40.4 49.4 0.6 100 9.3 37.5 52.9 0.4 100
Female 10.6 33.8 55.2 0.5 100 10.6 37.4 51.5 0.5 100 Male 8.7 46.8 43.7 0.7 100 6.8 38.6 55.5 0.2 100
Singles 11.6 33.5 54.2 0.8 100 - - - - 100 Couples 8.7 43.6 47.2 0.5 100 9.3 37.5 52.9 0.4 100
Non-hispanic 9.1 41.8 48.5 0.6 100 8.6 38.7 52.3 0.4 100 Hispanic 14.9 26.4 58.4 0.3 100 16.6 24.8 59.0 0.3 100
Race white 8.7 43.5 47.2 0.7 100 8.3 39.3 52.0 0.4 100 black 12.8 29.3 57.6 0.3 100 12.8 27.7 59.1 0.4 100 other 13.7 33.2 53.1 0.0 100 19.8 27.8 52.5 0.0 100
Education
less than high school 13.0 28.8 57.6 0.6 100 11.1 32.6 56.2 0.2 100 high school graduate 7.6 42.2 49.7 0.5 100 7.8 38.6 53.1 0.5 100 some college 8.3 43.7 47.2 0.7 100 7.3 40.3 52.5 0.0 100 college or more 10.7 47.9 40.8 0.6 100 12.9 39.3 47.1 0.8 100
Income quartiles
lowest 16.7 28.8 53.9 0.7 100 13.5 29.6 56.6 0.3 100 second 7.0 39.1 53.1 0.8 100 6.2 36.5 56.8 0.5 100 third 6.0 46.7 46.8 0.5 100 8.5 41.8 49.3 0.5 100 highest 9.0 47.1 43.6 0.4 100 9.2 41.8 48.8 0.2 100
Wealth quartiles
lowest 13.8 29.5 56.4 0.2 100 12.6 28.7 58.5 0.2 100 second 7.7 38.9 52.9 0.5 100 7.4 35.0 57.3 0.4 100 third 8.2 44.3 46.9 0.5 100 7.8 41.9 49.9 0.4 100 highest 8.8 49.0 41.2 1.0 100 9.5 44.0 46.0 0.6 100
Working for pay yes 16.6 34.2 48.4 0.8 100 16.3 37.0 46.2 0.5 100 no 7.2 42.5 49.7 0.5 100 6.2 37.7 55.8 0.3 100
Worked less than 10 years 21.6 23.8 54.2 0.4 100 19.5 28.5 51.8 0.3 100 Worked 10 years or more 8.0 42.6 48.7 0.6 100 7.1 39.4 53.1 0.4 100
Self-rated health
excellent 8.0 44.6 47.0 0.4 100 9.4 41.0 49.1 0.6 100 very good 7.5 46.7 45.2 0.5 100 9.0 38.5 52.4 0.2 100 good 9.7 37.5 52.1 0.7 100 7.8 36.7 55.1 0.3 100 fair 12.8 32.8 53.6 0.9 100 12.3 30.3 56.6 0.8 100 poor 18.0 25.9 55.7 0.5 100 12.8 34.7 52.6 0.0 100
31
Table 6: Fraction expecting Social Security in the future, by number of waves prior to actual receipt
Number of waves before receiving Social Security benefits
Fraction expecting Social Security benefits in the future [%]
1 94.8
2 94.0
3 92.4
4 91.8
N=1967, true panel observations in 5 consecutive waves (t, t-1, ..., t-4), same financial respondent, disregards don’t knows/ refusals, only those who answered the question as to whether they expect in all waves with yes or no. Table 7: Fraction realizing expectations about Social Security claiming age within one year,
by number of waves prior to actual receipt
Length of panel, including wave t Number of waves before receiving
Social Security benefits 3 waves N=2,699
4 waves N=2,569
5 waves N=1,624
1 81.6 82.4 81.9
2 71.7 72.4 71.2
3 67.1 67.7
4 61.2
True panel, same financial respondent, only those who gave an expected claiming age in all waves.
32
Table 8: Response rates on expected Social Security benefits, by number of waves prior to actual receipt
Number of waves before receiving SS benefits
Fraction reporting an expected amount [%]
1 74.3
2 71.2
3 64.4
4 55.2
N=1,964, true panel, allowing no changes in financial respondent across waves, not expecting to receive SS counted as response.
Table 9: Persistence of item non-response on expected Social Security benefit amounts over four waves prior to actual benefit receipt
Number of times a value is reported over 4 consecutive waves
Frequency Percent
0 153 7.8
1 282 14.4
2 359 18.3
3 473 24.1
4 697 35.5
Total 1,964 100.0
True panel, allowing no changes in financial respondent across waves, , not expecting to receive SS counted as response. Note: of those 7.8% only 6.5% did not give an expected claiming age at t-1; 6.5% did not give an expected claiming age at t-2. (same number, same percentage)
33
Table 10: Multivariate analysis of response behavior on expected Social Security benefits, all waves pooled (Logit model), N=42,101, mean P(gives value)=0.555
Odds Ratio P>|z| age [in years] 1.012 0.014 expected distance from claiming 0.961 0.000 Subjective probability <50 -- --
of working full time =50 0.864 0.000 past 62 >50 0.923 0.006
Education less than HS 0.805 0.000 HS or equivalent 0.968 0.250 some college - - college or more 0.949 0.121
Financial respondent 1.200 0.000 Female 0.814 0.000 Income quartiles lowest 0.840 0.000
second - - third 1.083 0.008 highest 1.062 0.073
Wealth quartiles lowest 0.955 0.128 second - - third 1.126 0.000 highest 1.140 0.000
Employer pension on current job one plan 1.064 0.036 two plans or more 1.292 0.000
Self-rated health excellent 1.074 0.022 very good 1.085 0.002 good -- -- fair 0.939 0.074 poor 0.879 0.021
Subjective probability <50 -- -- of losing one's job =50 0.929 0.090 over next 12 mths >50 1.145 0.010
Subjective probability <50 -- -- work limit. health =50 1.017 0.561 event next 10 yrs >50 1.053 0.135
Worked for pay 10 years or more 1.224 0.000 Working for pay 0.718 0.000 Subjective probability <50 -- --
of Social Security =50 0.953 0.144 program cuts >50 0.996 0.887
Marital history currently married/partnered 1.135 0.022 length of longest marriage 0.996 0.019 number of marriages 1.057 0.003 length of current marriage 1.006 0.002
Additional control variables included in the regression: Hispanic, race, subj. prob. of income keeping up with inflation over the next 5 years (not significant), and missing flags for missing observations in right hand variables.
34
Figure 1: Population distribution of received benefits at time t and population distributions of expected benefits at t-1, t-2, and t-3.
Note: Straight population distributions, i.e. includes outliers, and people who change claiming age. Table 11: Population distributions of actual and expected amounts at t and t-1; and distributions of individual-level deviations
t t-1 Absolute Deviation Percentage Deviation
N 3,540 3,540 3,540 3,540
mean 10078 10113 -35 -14.1
p10 4940 4801 -2,781 -36.2
p25 6593 6555 -868 -10.5
p50 10121 9929 54 0.6
p75 13178 12658 1,180 11.9
p90 15152 15135 3,192 29.4
Deviations are computed as the amount received at time t minus the expected amount at t-1. A negative value on the deviation hence implies overestimation of benefits.
0.2
.4.6
.81
0 5000 10000 15000 20000Benefits
received amount expected amount at t-1expected amount at t-2 expected amount at t-3
Cumulative Distribution of Benefits
35
Table 12: Percent deviations between expected and subsequently received benefits, by whether the individual claimed at the anticipated time.
individuals who claimed as anticipated
individuals who claimed earlier than planned
t-1 t-2 t-3 t-1 t-2 t-3
N 2,744 1,785 1,131 394 444 295 mean -8.8 -7.5 -5.0 -32.9 -25.3 -23.1
p10 -28.2 -42.5 -40.4 -56.7 -83.1 -92.7 p25 -7.0 -11.3 -13.7 -26.8 -36.6 -39.4 p50 1.3 3.9 4.9 -5.2 -6.7 -3.9 p75 11.5 17.5 19.9 8.9 14.8 16.6 p90 25.8 34.1 35.6 33.4 35.2 40.4 Note: Excludes some few outliers of the actually received amount. Table 13: Probability of claiming earlier than anticipated Logit estimation, N=15,292 (P=0.197)
Odds Ratio P>|z|
Self-rated Health excellent 0.802 0.002
very good 0.996 0.944
good - -
fair 1.178 0.046
poor 1.284 0.079
Reached claiming age age>=62 4.631 0.000
Means of insuring married/partnered 0.854 0.039
Adverse shocks Employer pension
one plan 0.635 0.000
2 or more plans 0.541 0.000
expected distance 1.753 0.000
Education less than HS 0.827 0.015
HS & GED 0.818 0.003
- -
college or more 0.862 0.062
36
Table 14: Probability of over or underestimating future Social Security benefits at t-1 by more than 20 percent, conditional on claiming at the expected age. Logit estimation, N=6,746 (P=0.171)
Odds Ratio P>|z|
Expected distance from claiming 1.238 0.000
Financial respondent 0.713 0.000
Married/partnered 0.769 0.004
Self-rated health excellent 1.105 0.186
very good 0.917 0.184
good - -
fair 0.948 0.562
poor 1.068 0.697
Education less than HS 1.001 0.990
HS & GED 0.874 0.061
some college - -
college or more 1.049 0.573
Employer pension (curr. Job)
one plan 0.951 0.485
two plans or more 0.781 0.020
Income quartiles lowest 1.153 0.062
second - -
third 1.063 0.415
highest 1.027 0.746
Wealth quartiles lowest 1.130 0.106
second - -
third 0.941 0.419
highest 0.858 0.057
37
References
Benítez-Silva, Hugo and Debra S. Dwyer (2003), “What to expect when you are expecting rationality:
Testing rational expectations using micro data.” Mimeo (April).
Bernheim, B. Douglas (1993), “Is the Baby-Boom Generation Adequately Prepared for Retirement?”
New York: Merill Lynch.
Dominitz, Jeff, Charles F. Manski and Jordan Heinz (2003), “Will Social Security be there for you?:
How Americans perceive their benefits,” NBER Working Paper 9798.
Engen, Eric, William Gale and Cori Uccello (1999), “The Adequacy of Household Saving,”
Brookings Papers on Economic Activity, (2), pp. 65-165.
Gustman, Alan and Steinmeier, Thomas (2001), “Imperfect Knowledge, Retirement and Saving,”
NBER Working Paper No. 8406.
Gustman, Alan and Steinmeier, Thomas (1999), “What People Don’t Know About Their Pensions
And Social Security,” in William G. Gale, John B. Shoven, and Mark J. Warshawsky, eds.,
Public Policies and Private Pensions, forthcoming. Washington, D.C., Brookings Institution.
Hurd, Michael (1999), “Labor Market Transitions in the HRS: Effects of the Subjective Probability of
Retirement and of Pension Eligibility”, in James P. Smith and Robert J. Willis (eds.), Wealth,
Work and Health, University of Michigan Press, 267-290.
Hurd, Michael D., F. Thomas Juster, and James P. Smith (2003), “Enhancing the Quality of Data on
Income: Recent Developments in Survey Methodology,” Journal of Human Resources, 38(3),
758-772.
Lillard, Lee A. and Robert J. Willis (2001), “Cognition and wealth: the importance of probabilistic
thinking”, Michigan Retirement Research Center discussion paper 2001-007, University of
Michigan, Ann Arbor.
Lusardi, Annamaria (2001), “Explaining Why So Many Households Do Not Save,” CRR Working
paper WP 2001-05.
Lusardi, Annamaria (1999), “Information, Expectations, and Savings for Retirement,” in: Henry J.
Aaron, ed., Behavioral Dimensions of Retirement Economics. Washington, D. C., Brookings
Institution and Russell Sage Foundation, 81-115.
38
Manski, Charles. (2003), “Inference on Expectations and Decisions”, Department of Economics,
Northwestern University, manuscript.
McClellan, Mark (1998), “Health Events, Health Insurance and Labor Supply: Evidence from the
Health and Retirement Survey,” in D. Wise, Ed., Frontiers in the Economics of Aging, 1998,
Chicago: University of Chicago Press, pp. 301-346.
Mitchell, Olivia S. (1988), “Worker Knowledge of Pension Provisions,” Journal of Labor Economics,
vol. 6, no. 1, 21-39.
Mitchell, Olivia S., Jan Olson, and Thomas L. Steinmeier (2000), “Social Security Earnings and
Projected Benefits”, in Forecasting Retirement Needs and Retirement Wealth, eds. Olivia S.
Mitchell, P. Brett Hammond, and Anna M. Rappaport. Philadelphia, PA: University of
Pennsylvania Press, 327-359.
Ofstedal, Mary Beth, Gwenith G. Fisher and A. Regula Herzog (2005), “Documentation of Cognitive
Functioning Measures in the Health and Retirement Study,” HRS/AHEAD Documentation
Report DR-006, March 2005.