Embed Size (px)
Citation preview

Department of Economics
Florida International University
Working Paper 2123
November 2021
11200 SW 8th Street, Miami, Florida 33199
https://economics.fiu.edu/
Dynamics of Managerial Power and CEO
Compensation in the Course of Corporate
Distress: Evidence from 1992 to 2019
Sheng Guo
Qiang Kang
Oscar A. Mitnik
Dynamics of Managerial Power and CEO Compensation in the
Course of Corporate Distress: Evidence from 1992 to 2019 ∗
Sheng Guo†
Florida International UniversityQiang Kang‡
Florida International University
Oscar A. Mitnik§
Inter-American Development Bank
Abstract
We study the dynamics of two governance constructs, managerial influence over the boardof directors and chief executive officer (CEO) compensation, in firms undergoing distress during1992–2019. Data show a clear trend that governance improves over time, which confoundsthe inference about the effects of distress on governance. Controlling for the secular changeswith a bias-corrected matching estimator, we find that distressed firms reduce managerialboard appointments and CEO pay, intensify managerial incentive alignment, and increaseCEO turnover. The bulk of CEO compensation changes in distressed firms derives from theperformance-related part of compensation, consistent with the “shareholder value” view of CEOcompensation.
JEL Classification: G33, G34, J33, J44, M50Keywords: Corporate distress, managerial influence, CEO compensation, CEO turnover, bias-corrected matching estimator
∗We appreciate comments and suggestions from Utpal Bhattacharya (executive editor), an anonymous referee,Gennaro Bernile, Aya Chacar, Hulya Eraslan, Eliezer Fich, Yaniv Grinstein, Wei Jiang, David Kelly, MohamedMekhaimer, Robert Mooradian, Tom Sanders, and seminar participants at University of Miami, University of Texasat Dallas, Florida International University, North American Summer Meeting of the Econometric Society, AmericanFinance Association Annual Meeting, and Financial Management Association European Meeting. We thank LynnM. LoPucki for providing us the Bankruptcy Research Database. We also thank Caitlin Hughes and Chao Xie forable research assistance. The opinions expressed in this paper are those of the authors and do not necessarily reflectthe views of the Inter-American Development Bank (IDB), its Board of Directors, or the countries they represent.Mitnik completed most of the work on this paper prior to joining the IDB. All errors remain our own responsibility.†Department of Economics, Florida International University, 11200 SW 8th Street, Miami, FL 33199. Phone:
(305)348-2735. Fax: (305)348-1524. E-mail: [email protected].‡Corresponding author. Department of Finance, Florida International University, 11200 SW 8th Street, Miami,
FL 33199. Phone: (305)348-4379. Fax: (305)348-4245. E-mail: [email protected].§IDB, 1300 New York Avenue, N.W. Washington, D.C. 20577. Email: [email protected].

Dynamics of Managerial Power and CEO Compensation in the Course of
Corporate Distress: Evidence from 1992 to 2019
Abstract
We study the dynamics of two governance constructs, managerial influence over the board
of directors and chief executive officer (CEO) compensation, in firms undergoing distress during
1992–2019. Data show a clear trend that governance improves over time, which confounds
the inference about the effects of distress on governance. Controlling for the secular changes
with a bias-corrected matching estimator, we find that distressed firms reduce managerial
board appointments and CEO pay, intensify managerial incentive alignment, and increase
CEO turnover. The bulk of CEO compensation changes in distressed firms derives from the
performance-related part of compensation, consistent with the “shareholder value” view of CEO
compensation.
JEL Classification: G33, G34, J33, J44, M50
Keywords: Corporate distress, managerial influence, CEO compensation, CEO turnover, bias-
corrected matching estimators
1 Introduction
As much anecdotal evidence shows, corporate distress inflicts substantial costs on firms and brings
about all-around changes in corporate structure and decision making. Addressing poorly designed
incentives and ineffective monitoring of managers is key to the revival of distressed firms. How
these changes evolve and interact with each other during the distress process, however, is relatively
understudied (see, e.g., the surveys of Hotchkiss, et al. (2008) and Senbet and Wang (2012)). Earlier
works on this front include Gilson (1989, 1990) and Gilson and Vetsuypens (1993) that are based
on data from the 1980s. Given the dramatic evolution in governance mechanisms, capital markets,
as well as regulatory reforms in the past few decades, it is of natural interest to revisit this topic
for the recent era.1
This paper examines the dynamics of two governance constructs, namely, managerial influence
over the board of directors and CEO compensation, in the course of corporate distress from 1992
to 2019. As Figure 1 of this paper shows, there is a strong time trend in governance variables:
governance has generally improved over time, especially since the early 2000s. For example, the
average value of Corporate Governance Score, the standardized governance index as defined in
Section 2, starts at -0.62 in 1995 and steadily rises to -0.05 in 2000, 0.10 in 2005, and 0.30 in 2010,
and climbs further to 0.46 in 2016. The existence of a time trend in governance can confound
a study of the effects of corporate distress. If the trend is not appropriately controlled for, the
estimated effects of corporate distress on governance may largely reflect the effects of the time
trend, leading to biased inference. This may not be a severe concern for a study of a short time
span. However, it is a particularly serious concern in a study over a long horizon like ours. Indeed,
Table 3 and Section 4.2.1 of the paper showcase this point.
A matching estimator helps address this concern. A generic matching estimator comprises two
inherent empirical procedures: first constructing a suitable control group to the group perceived
to be affected by the event (the so-called “treated” group) based on certain observed pre-event
characteristics, then calculating the average differences in outcome variables of interest between
1Several recent major regulatory changes related to executive compensation in the U.S. are: the Sarbanes–OxleyAct (SOX) of 2002 that overhauled corporate governance, the Securities and Exchange Commission’s (SEC) 2006mandate to increase disclosure of compensation, the say-on-pay clause in the Dodd–Frank Act of 2010, and the SEC’s2013 mandate to disclose the ratio of CEO pay to median employee pay.
1
the treated group and the control group as the estimated effects of the event. Therefore, if an
outcome variable has a time trend, an adequate control group identified in the first procedure
can pick up the trend; by taking the difference between the treated group and the control group
in the second procedure, a matching estimator filters out the effect of the trend and properly
estimates the event’s effect on the outcome variable. Besides controlling for the effects of time
trends, a matching estimator also helps address the issue that firms going into distress may differ
fundamentally from non-distressed firms. In this paper, we employ Abadie and Imbens’ (2011)
bias-corrected matching estimator to identify a suitable control group from non-distressed firms and
conduct matching estimations of the effects of distress on governance. Our study thus represents a
significant improvement in methodology over previous studies on this topic.2
We define corporate distress as the event in which a company either goes through chapter
11 bankruptcy or shows three consecutive years of extremely poor performance along with high
likelihood of bankruptcy as measured by stock returns and various accounting ratios. We find that
corporate distress has significant effects on managerial influence over the board, CEO compensation,
and CEO turnover. Relative to non-distressed firms that are comparable in a variety of economic,
financial, and governance measures, firms under corporate distress reduce managerial appointments
to the board, intensify managerial incentive alignment, cut CEO pay, and increase CEO turnover.
The effects of corporate distress vary across section and over time. Initially poorly-governed firms
experience more significant reductions in managerial power and CEO compensation than otherwise
upon and after the advent of distress. We also find that managerial incentive alignment strengthens
after firms fall into distress, particularly in the pre-2004 subperiod. Moreover, the changes in
managerial influence and the changes in CEO compensation do not occur in lockstep during the
process of corporate distress: firms reduce CEO compensation before corporate distress but adjust
managerial board appointments only after falling into distress.
2Section 3 and Appendix give details of this bias-corrected matching estimator. Using an appropriately constructedcontrol group in executive compensation studies is of great importance that goes beyond the case of corporate distress.For example, Albuquerque (2009) shows evidence on the use of relative performance evaluation in CEO compensationif peers are composed of similar industry-size firms, affirming that a misspecified peer group is responsible for priormixed evidence. Conyon, Core, and Guay (2011) find that adjusting for risk, the level of US CEO pay is not largerthan that of UK CEOs and the apparent higher US CEO pay is cut by half if compared to a matched sample ofnon-UK European CEOs. Faulkender and Yang (2010) and Bizjak, Lemmon, and Nguyen (2011) find evidence thatcompanies strategically construct compensation peer groups to inflate CEO pay and justify their CEO compensation.Albuquerque, DeFranco, and Verdi (2013) counter that the choice of highly paid peers represents a reward forunobserved CEO talent in CEO compensation.
2
We conduct analyses to gain insights into what forces are likely responsible for the dynamics of
CEO compensation during the process of corporate distress. Based on model parameters estimated
for non-distressed firms, we decompose CEO compensation for distressed firms into two parts: one
related to firm performance (expected compensation) and the other not (unexpected compensation).
Assuming that performance is related to compensation in the same way for distressed and non-
distressed firms, the effects of distress on unexpected compensation are much weaker than those
on total compensation or expected compensation. This result suggests that a significant portion of
the effects of distress on compensation are related to changes in firm performance.
Our paper adds to the under-studied empirical literature on executive compensation for
distressed firms. Gilson and Vetsuypens (1993) and Henderson (2007) examine executive
compensation in distressed firms during 1981-1987 and 1992-2003, respectively. Recent works in
this area include Eckbo, Thorburn, and Wang (2016) and Goyal and Wang (2017), who respectively
investigate CEO compensation changes and the use of key employee retention and incentive plans
in bankrupt firms over the 1996-2007 period. These four studies compare executive pay before and
after distress among distressed firms only. Our study extends the sample period to 2019, and more
importantly, contrasts the changes in executive pay before and after distress for the treated firms
with the changes for an appropriately chosen control group. Our results in Table 3 clearly show
that, compared to the matching estimator that selects and enlists an adequate control group to
filter out the effects of the time trend, focusing only on the distressed firms tends to considerably
overstate the effects of corporate distress.3
Our study also contributes to the literature on the relation between corporate governance,
especially the role of the board in monitoring/disciplining CEOs, and firm performance. Prior
papers have largely concentrated on the effects of the board-centric governance structure on firm
performance without paying particular attention to the case of distressed firms (e.g., Coughlan and
Schmidt (1985), Hermalin and Weisbach (1991), Core, Holthausen, and Larcker (1999), Gompers,
Ishii, and Metrick (2003), and Bebchuk, Cohen, and Ferrell (2009)). We investigate the other
3We thank the referee for suggesting this analysis. The importance of controlling for the time trend is alsohighlighted by the difference in the unreported findings on outside replacement CEOs’ compensation. We find thatoutside replacement CEOs in the distressed firms are paid significantly higher than inside replacement CEOs, a resultsimilar to the one reported by Gilson and Vetsuypens (1993). However, they are actually not paid significantly higher,and oftentimes lower instead, relative to the outside replacement CEOs in non-distressed firms.
3

direction of this relation, i.e., the impact of firm performance on corporate governance, in the
context of corporate distress. In particular, declines in CEO compensation occur before changes in
board compositions, suggesting that the reshuffling of the board occurs in a progressive way and is
most likely not the driver of compensation changes in distressed firms.
Our paper is indirectly related to the ongoing debate on the forces underlying executive
compensation. We find that a significant portion of CEO compensation is tied to firm performance
over the course of corporate distress. The results are largely consistent with the “shareholder
value” view of CEO pay (see, e.g., the surveys by Edmans and Gabaix (2009, 2016), as well as the
references therein). Our analysis shows much weaker evidence that corporate distress has impacts
on the portion of compensation unrelated to firm performance, which otherwise could lend support
to the “rent extraction” view of CEO pay (e.g., Bertrand and Mullainathan (2001) and Bebchuk
and Fried (2004)). It is thus necessary to exercise caution in interpreting our results, given that the
decomposition of compensation is based on a standard, albeit quite simplistic, parametric model
to characterize the relation between pay and performance.
Two caveats are in order. First, it is very difficult to gather data, especially the CEO
compensation data, once a firm goes into distress. Most distressed companies stop filing regular
proxy and 10k statements, so collecting executive pay data from monthly 8-K filings or bankruptcy
court dockets can be very difficult and time consuming. Thus, any study in this area, including
ours, has to deal with the challenge of working with small samples.4 Our main findings stand
out statistically significant even with these small samples. Second, our compensation data is
based on the S&P 1500 sample of firms. Standard & Poor’s, which collects the data, actively
screens and deletes distressed companies from the sample. As a result, the troubled firms we
ultimately include in our study may represent the least-distressed ones in the universe of distressed
companies, potentially creating a survivorship bias. Given that non-surviving firms usually
experience larger declines in managerial power than surviving firms, our analysis likely provides
conservative estimates of the effects of corporate distress.
The paper proceeds as follows. Section 2 describes the data, variables, and the sample for
4Gilson and Vetsuypens (1993), and Henderson (2007) use samples of only 77 and 76 firms, respectively. Bernstein(2006), in a study of CEO turnover in distressed firms, compares 79 bankrupt firms with 1,288 firms “suffering frompoor financial circumstances”. In contrast, we study 297 distressed firms and select their comparison group from apool of 2,259 non-distressed firms.
4

our study. Section 3 discusses the empirical strategy. Section 4 presents the effects of corporate
distress on managerial influence over the board, CEO compensation, and CEO turnover. Section 5
concludes.
2 Data and Sample Construction
Data for this study come from several sources. The Standard and Poor’s (S&P) ExecuComp
database reports annual compensation flows as well as information related to changes in the value
of stock and stock option holdings for the five highest paid executives, including the CEO, for each
firm appearing in the S&P500 Index, S&P MidCap 400 Index, and the S&P SmallCap 600 Index.
The database also contains information about these executives’ positions in the board: serving as
board directors, sitting in the board’s compensation committee, and holding the dual titles of CEO
and board chairperson. Firms’ annual accounting data come from S&P’s Compustat database.
We obtain stock return data from the Center for Research in Security Prices (CRSP) Monthly
Stock File. We take bankruptcy filing information from Professor Lynn LoPucki’s Bankruptcy
Research Database (BRD). Throughout our empirical analysis, we measure all monetary values in
2018 constant dollars, and we adjust nominal stock returns by the Consumer Price Index (CPI)
from the Bureau of Labor Statistics to obtain real returns.
2.1 Variables
Three sets of variables are key to this empirical study. The first set is the measure of corporate
distress with which we classify firms into distressed firms and non-distressed firms. The distressed
firms in our sample consist of two (in some cases overlapping) groups. One group is formed by
the firms that have filed for Chapter 11 bankruptcy and are covered in the BRD. The other
group is identified based on a combination of the past three-year cumulative stock returns and
Ohlson’s (1980) O-scores.5 Specifically, at each year-end and from the universe of all Compustat
5To calculate the past three-year cumulative stock returns, we require at least 18 months of valid data within thethree-year period. Ohlson’s (1980) O-score is a widely used measure for a firm’s financial status, and it is obtainedfrom a probabilistic prediction of bankruptcy with a set of financial ratios including the logarithm value of totalassets, the ratio of total liabilities to total assets, the ratio of working capital to total assets, the ratio of currentliabilities to current assets, the ratio of net income to total assets, the ratio of funds from operation to total liabilities,the growth rate in net income, the dummy for total liabilities exceeding total assets, and the dummy for negative netincome for the last two years. Typically, the higher is the value of the O-score, the more likely is the firm to fall intodistress and go bankrupt.
5

firms having non-missing information for both the O-scores and the prior three-year stock returns,
we rank firms into percentiles based separately on their O-scores and three-year cumulative returns;
we exclude financial firms (SIC between 6000 and 6999) from the rankings. We then classify firms
as distressed if the following two conditions are satisfied simultaneously : their O-scores are in the
top quintile of the O-score distribution and their past three-year cumulative returns are in the
bottom quintile of the cumulative return distribution.6
The second set of key variables comprises three groups of outcome variables: managerial
influence over the board of directors, CEO compensation, and CEO turnover. Managerial influence
over the board pertains to their affiliations with the board, that is, whether the CEO serves as the
board chair (CEO Duality, equal to one if true and zero otherwise), whether at least one executive
serves as a board director (Inside Directors, equal to one if true and zero otherwise), and whether at
least one executive serves in the compensation committee (Executives in Compensation Committee,
equal to one if true and zero otherwise). In similar spirits to Bertrand and Mullainathan (2001),
we construct the Corporate Governance Score as an average of the following three standardized
variables: CEO Duality, number of executives serving as board directors, and number of executives
serving in the compensation committee, each demeaned and divided by its standard deviation
for standardization. We multiply Corporate Governance Score by minus one so that a higher
Corporate Governance Score corresponds to better governance or, equivalently, weaker managerial
influence over the board.7 Corporate Governance Score measures the influence managers exercise
on the board via their board appointments. It also implicitly measures board composition changes
because a change in executive affiliations with the board translates into a reshuffling of the board.
We define two levels of CEO compensation. Total Current Compensation is the sum of salary
and bonus. Total Direct Compensation is the sum of Total Current Compensation, the value
of restricted stock grants, the Black-Scholes value of stock option grants, other annual short-term
compensation, payouts from long-term incentive plans, and all other long-term compensation. Most
6We also identify distressed firms with alternative combinations of those percentile cutoffs such as the top decileon O-scores and the bottom decile on cumulative stock returns; the results under those alternative classifications arequalitatively similar.
7There are two popular corporate governance measures in the literature, namely, Gompers, Ishii, andMetrick’s (2003) G-index and Bebchuk, Cohen, and Ferrell’s (2009) E-index. These two indexes are only availableevery two to three years and are quite persistent across years. It is not feasible to use those indexes in our studybecause a large proportion of our sample firms are not covered by these two indices.
6

of our discussions focus on Total Direct Compensation as it measures the total estimated pay the
board has awarded the CEO that year, reflecting the board’s annual decision. In addition, we
define a dummy variable, CEOTURN, to indicate the CEO turnover status — it equals one if a
CEO replacement occurs within that year and zero otherwise.
The third set of variables consists of the covariates we use to directly match distressed firms
with non-distressed firms. To identify the impact of corporate distress we resort to the Abadie
and Imbens’ (2011) bias-corrected matching estimator. The matching covariates include various
measures of a firm’s fundamentals and financial health, measures of CEO compensation, measures
of managerial influence over the board, industry dummies, and year dummies. Except for the year
dummies all the other matching covariates are evaluated three years prior to the onset of corporate
distress. We match on those variables so that distressed firms and control firms are similar in t=-3
in the following aspects: industry affiliation, likelihood of falling into distress, CEO compensation
structure, board composition, and board monitoring of managers. See Table 2 for details of the
matching covariates.
2.2 Sample Construction
We choose an analysis window spanning from two years before distress through three years after
distress, a total of six years, to discern the evolution of outcome variables during the course of
corporate distress. We normalize the year of distress occurrence as t=0. Accordingly, we have t<0
and t>0 respectively for the pre- and post-distress periods. We conduct matching based on the
matching covariates three years prior to corporate distress (i.e, t=–3). Our data cover the period
from 1992 to 2019. As a result, the years for t=0 in our analysis are from 1995 to 2016.
The treatment in our study is defined as the “event” that a firm falls into corporate distress.
Because a firm can become distressed more than once over time, we restrict the treatment to be
the first time that a firm becomes distressed. In very few cases we include a second spell in distress
for the same firm if and only if at least seven years have passed since the firm encountered the first
episode of corporate distress.
We construct a control group to estimate the effect of financial distress. The control
group consists of those non-distressed firms that are statistically similar to the treated firms in
7

observable characteristics before the episode of corporate distress. This allows us to determine the
counterfactual, i.e., what the outcome variables of the distressed firms would have been if they
had not suffered corporate distress. In order to maintain a clean potential pool of controls for the
treated group, we exclude from the pool any solvent firm which has ever been distressed before.
Further, we apply the following two criteria to select firms into our analysis sample: 1) Firms
do not have missing information for either the matching covariates in the matching year (i.e, three
years before the treatment); and 2) firms have at most one missing variable in all compensation
variables in the pre-treatment window (i.e., from two years before treatment to the treatment year)
and at most one missing variable in all compensation variables in the post-treatment window (i.e.,
from one year after the treatment to three years after the treatment). As a result, our analysis
sample contains 297 firms that were ever in corporate distress and 24,645 firm-year observations
for 2,259 firms that have never been in corporate distress during the 1995-2016 period.8
Table 1 breaks down the distribution of the analysis sample across years. To avoid introducing
serial correlation in the estimation, we assign each potential control firm to only one particular
year. We defer the detailed explanation of the year assignments to Section 3.3.
3 Empirical Strategy
We start this section with a discussion of the motivation for our empirical strategy. We then explain
in details the empirical strategy adopted.
3.1 Motivation: Time Trends in Outcome Variables
In a long-run study like this one, if an outcome variable exhibits a time trend and if the trend is not
properly controlled for in the analysis, the ensuing inference about the effect of corporate distress
on this outcome variable may be distorted. Such results may mostly capture the time trend rather
8Among the 297 distressed firms, 47 of them ever filed for Chapter 11 protection (i.e., covered in BRD) and theother 250 firms did not. The small number of BRD observations in our sample is due to that the majority of theBRD firms are not covered in the ExecuComp database. Moreover, among those BRD firms covered in ExecuComp,quite a few do not satisfy the two selection criteria to be included in our analysis sample. We also separately replicateour matching estimations over the two subgroups of distressed firms, i.e., those filed for Chapter 11 protections andthose had poor performance but did not file for the protection. Not surprisingly, due to the small sample size, thematching estimates for the subgroup of Chapter 11 firms largely lack statistical significance. Nevertheless, the resultsfor the two subgroups of firms are qualitatively similar to the main results for the whole sample as presented in thepaper. To conserve space, detailed results for the two subgroups are available upon request.
8
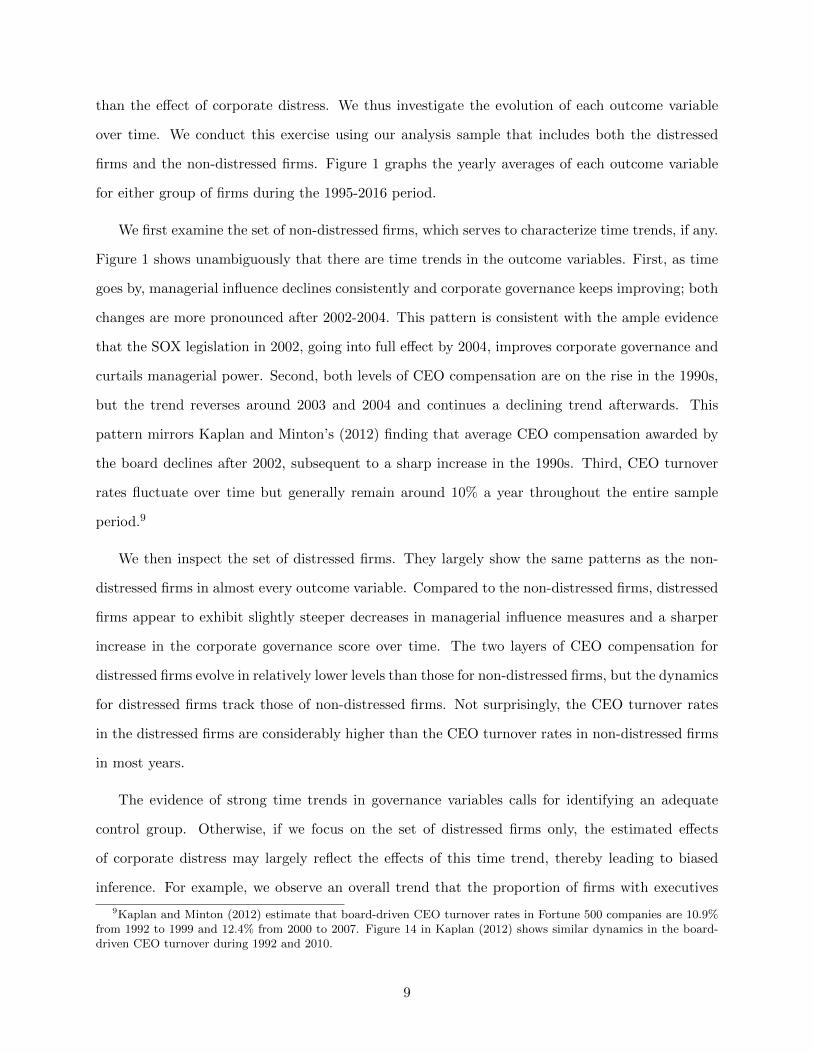
than the effect of corporate distress. We thus investigate the evolution of each outcome variable
over time. We conduct this exercise using our analysis sample that includes both the distressed
firms and the non-distressed firms. Figure 1 graphs the yearly averages of each outcome variable
for either group of firms during the 1995-2016 period.
We first examine the set of non-distressed firms, which serves to characterize time trends, if any.
Figure 1 shows unambiguously that there are time trends in the outcome variables. First, as time
goes by, managerial influence declines consistently and corporate governance keeps improving; both
changes are more pronounced after 2002-2004. This pattern is consistent with the ample evidence
that the SOX legislation in 2002, going into full effect by 2004, improves corporate governance and
curtails managerial power. Second, both levels of CEO compensation are on the rise in the 1990s,
but the trend reverses around 2003 and 2004 and continues a declining trend afterwards. This
pattern mirrors Kaplan and Minton’s (2012) finding that average CEO compensation awarded by
the board declines after 2002, subsequent to a sharp increase in the 1990s. Third, CEO turnover
rates fluctuate over time but generally remain around 10% a year throughout the entire sample
period.9
We then inspect the set of distressed firms. They largely show the same patterns as the non-
distressed firms in almost every outcome variable. Compared to the non-distressed firms, distressed
firms appear to exhibit slightly steeper decreases in managerial influence measures and a sharper
increase in the corporate governance score over time. The two layers of CEO compensation for
distressed firms evolve in relatively lower levels than those for non-distressed firms, but the dynamics
for distressed firms track those of non-distressed firms. Not surprisingly, the CEO turnover rates
in the distressed firms are considerably higher than the CEO turnover rates in non-distressed firms
in most years.
The evidence of strong time trends in governance variables calls for identifying an adequate
control group. Otherwise, if we focus on the set of distressed firms only, the estimated effects
of corporate distress may largely reflect the effects of this time trend, thereby leading to biased
inference. For example, we observe an overall trend that the proportion of firms with executives
9Kaplan and Minton (2012) estimate that board-driven CEO turnover rates in Fortune 500 companies are 10.9%from 1992 to 1999 and 12.4% from 2000 to 2007. Figure 14 in Kaplan (2012) shows similar dynamics in the board-driven CEO turnover during 1992 and 2010.
9
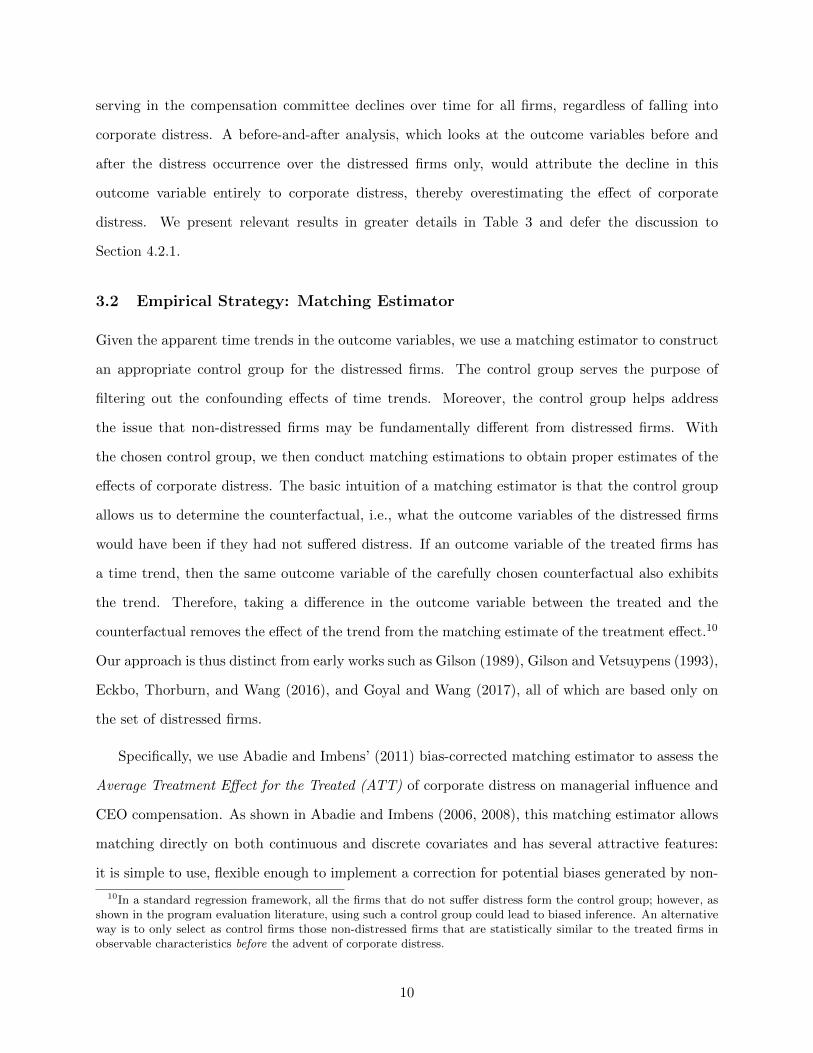
serving in the compensation committee declines over time for all firms, regardless of falling into
corporate distress. A before-and-after analysis, which looks at the outcome variables before and
after the distress occurrence over the distressed firms only, would attribute the decline in this
outcome variable entirely to corporate distress, thereby overestimating the effect of corporate
distress. We present relevant results in greater details in Table 3 and defer the discussion to
Section 4.2.1.
3.2 Empirical Strategy: Matching Estimator
Given the apparent time trends in the outcome variables, we use a matching estimator to construct
an appropriate control group for the distressed firms. The control group serves the purpose of
filtering out the confounding effects of time trends. Moreover, the control group helps address
the issue that non-distressed firms may be fundamentally different from distressed firms. With
the chosen control group, we then conduct matching estimations to obtain proper estimates of the
effects of corporate distress. The basic intuition of a matching estimator is that the control group
allows us to determine the counterfactual, i.e., what the outcome variables of the distressed firms
would have been if they had not suffered distress. If an outcome variable of the treated firms has
a time trend, then the same outcome variable of the carefully chosen counterfactual also exhibits
the trend. Therefore, taking a difference in the outcome variable between the treated and the
counterfactual removes the effect of the trend from the matching estimate of the treatment effect.10
Our approach is thus distinct from early works such as Gilson (1989), Gilson and Vetsuypens (1993),
Eckbo, Thorburn, and Wang (2016), and Goyal and Wang (2017), all of which are based only on
the set of distressed firms.
Specifically, we use Abadie and Imbens’ (2011) bias-corrected matching estimator to assess the
Average Treatment Effect for the Treated (ATT) of corporate distress on managerial influence and
CEO compensation. As shown in Abadie and Imbens (2006, 2008), this matching estimator allows
matching directly on both continuous and discrete covariates and has several attractive features:
it is simple to use, flexible enough to implement a correction for potential biases generated by non-
10In a standard regression framework, all the firms that do not suffer distress form the control group; however, asshown in the program evaluation literature, using such a control group could lead to biased inference. An alternativeway is to only select as control firms those non-distressed firms that are statistically similar to the treated firms inobservable characteristics before the advent of corporate distress.
10

exact matching on (mostly) continuous variables, and possesses a well defined asymptotic variance.11
More importantly, compared to other matching estimators such as propensity score matching, this
estimator is better suited and has more desirable properties in a case like the one under study —
when the number of treated observations is small relative to the number of control observations,
estimating a propensity score model with the usual logit or probit method can generate undesirable
results. Appendix gives further details of this matching estimator.
Even after the matching on observed covariates, there may exist unobserved heterogeneity
that distinguishes the treated from the actual controls. Per Smith and Todd (2005), we apply
a difference-in-differences (DID) type of matching estimator by subtracting from each outcome
variable its corresponding value in t=–3 to remove time-invariant unobserved heterogeneity.
3.3 Determining Event Years for (Potential) Controls
One practical challenge in a matching estimator is to determine event years for the control firms
as the timing of events is only available for the treated firms, i.e., the firms that ever went into
corporate distress, but is not available for the potential controls, i.e., the firms that never did so in
our analysis period.
We adopt a strategy, essentially applying the matching estimator twice, to assign each of these
non-distressed firms to the year in which they could be the best possible match for a treated
firm in that year. Specifically, in the first round, for each year we take all the distressed firms in
that particular year, match them against all the non-distressed firms, and calculate the Euclidean
distance between each treated firm and each non-distressed firm. Then for each non-distressed
firm, we rank these distances across all possible years and pick out the treated firm with which
the particular non-distressed firm has the smallest distance. Thus, the particular year in which
that treated firm went into distress becomes the best possible year which we can assign to the non-
distressed firm. After the assignment of “distress” year in this way, we use the non-distressed firm
as a potential control in that year only. These non-distressed firms are merely potential controls
because not all of them are used in the subsequent actual matching estimation. In the next round,
11The analytical solution of the asymptotic variance saves much computing time that would otherwise ariseby bootstrapping estimation. Moreover, Abadie and Imbens (2008) show that bootstrapping fails for matchingestimators.
11

given that we have assigned each non-distressed firm to one and only one year, we pool together
observations from all the years and use the matching estimator again to find the best M matches
for each treated firm in each year. Per Abadie and Imbens’ (2011) simulation analysis, we set M
to four.12
Note also that, without further restrictions, time t=0 refers to different calendar years for the
treated and the controls in a matched pair. For example, a control firm in a “good” year for the
overall market could be matched with a treated firm going into distress in a “bad” year for the
overall market. We thus include the treatment years as matching covariates in the second round
of matching to ensure that the treated firms and the controls are compared in the same calendar
period.
4 Matching Estimation Results: Effects of Corporate Distress
In this section, we apply Abadie and Imbens’ (2011) bias-corrected matching estimator to assess the
effect of corporate distress on outcome variables of interest. We first discuss the matching quality
to ensure that we construct an appropriate control group. We then analyze in detail the effects of
corporate distress on managerial influence over the board, CEO compensation, and CEO turnover.
4.1 Assessment of Matching Quality
It is standard in the causal inference literature to show balancing in the covariates used for
matching, which is also a useful way to justify that the matching works (Rubin, 2008; Imbens and
Wooldridge, 2009). Table 2, Panel A presents the summary statistics of the matching covariates for
the treated and the (potential) controls before and after the matching, whereas matching is done
at t=–3.13
12The choice of the number of matches involves the standard bias-variance tradeoff (Imbens and Rubin, 2015). Ingeneral, lower values of M help reduce potential bias associated with non-exact matching, and higher values of M helpimprove estimation precision. In this application, our results are not highly affected by using alternative values of M .We estimate our main results with M values varying from 1 to 6. The results are qualitatively similar and largelyconsistent across the different values of M . While as expected the estimation precision, thus statistical significance,is somewhat affected by the choice of M = 1, the overall story does not change. Also, the estimated standard errorstend to be minimized at M = 4, echoing Abadie and Imbens’ (2011) simulation analysis. These additional resultsare not reported in the paper to conserve space and are available upon request.
13For compensation variables, we observe outliers that could potentially affect the results, so we drop theobservations with the lowest and highest values for the treated and the controls separately. We obtain similarresults with different “trimming” rules.
12
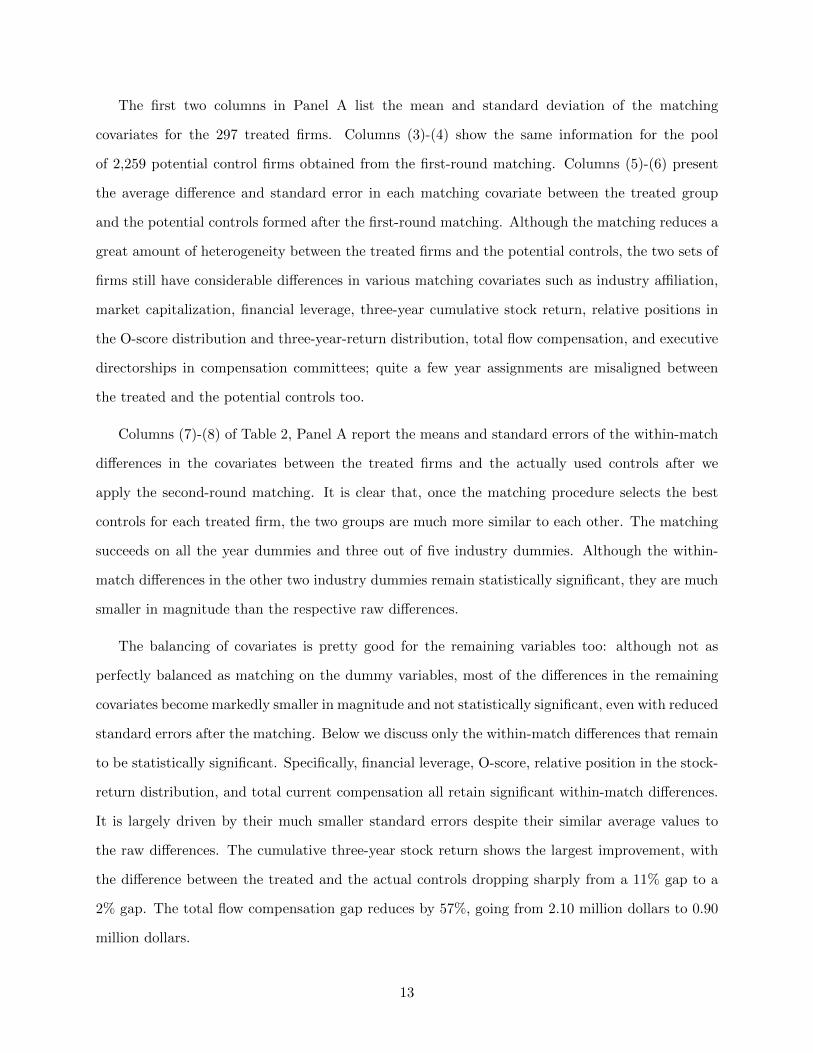
The first two columns in Panel A list the mean and standard deviation of the matching
covariates for the 297 treated firms. Columns (3)-(4) show the same information for the pool
of 2,259 potential control firms obtained from the first-round matching. Columns (5)-(6) present
the average difference and standard error in each matching covariate between the treated group
and the potential controls formed after the first-round matching. Although the matching reduces a
great amount of heterogeneity between the treated firms and the potential controls, the two sets of
firms still have considerable differences in various matching covariates such as industry affiliation,
market capitalization, financial leverage, three-year cumulative stock return, relative positions in
the O-score distribution and three-year-return distribution, total flow compensation, and executive
directorships in compensation committees; quite a few year assignments are misaligned between
the treated and the potential controls too.
Columns (7)-(8) of Table 2, Panel A report the means and standard errors of the within-match
differences in the covariates between the treated firms and the actually used controls after we
apply the second-round matching. It is clear that, once the matching procedure selects the best
controls for each treated firm, the two groups are much more similar to each other. The matching
succeeds on all the year dummies and three out of five industry dummies. Although the within-
match differences in the other two industry dummies remain statistically significant, they are much
smaller in magnitude than the respective raw differences.
The balancing of covariates is pretty good for the remaining variables too: although not as
perfectly balanced as matching on the dummy variables, most of the differences in the remaining
covariates become markedly smaller in magnitude and not statistically significant, even with reduced
standard errors after the matching. Below we discuss only the within-match differences that remain
to be statistically significant. Specifically, financial leverage, O-score, relative position in the stock-
return distribution, and total current compensation all retain significant within-match differences.
It is largely driven by their much smaller standard errors despite their similar average values to
the raw differences. The cumulative three-year stock return shows the largest improvement, with
the difference between the treated and the actual controls dropping sharply from a 11% gap to a
2% gap. The total flow compensation gap reduces by 57%, going from 2.10 million dollars to 0.90
million dollars.
13

As further evidence of the quality of the matching, we also report in Table 2, Panel B the
summary information of some covariates that are not used by the matching procedure before and
after the matching for the treated and the (potential) controls. Such non-matched covariates span
various dimensions of firm fundamentals and market performance: alternative measures of firm
size (total assets, total sales, and number of employees), growth (market-to-book asset ratio),
profitability (profit margin, return on equity, return on assets), financial health (cashflow-to-asset
ratio, book leverage ratio, Altman’s (1968) z-score, credit ratings, investment-grade ratings) and
stock performance (one-year stock return, one-year stock return volatility, and share turnover).
As Panel B clearly shows, the raw differences in those non-matched covariates are quite large and
almost all strongly significant, but after we apply the second-round matching, the gaps in these
characteristics are all significantly reduced in size and most of the differences become statistically
insignificant.
To sum up, the matching has decent quality overall and works well in balancing differences in
observed characteristics, regardless of being used in the matching procedure, between the distressed
firms and the comparable non-distressed firms. The fact that the level and composition of CEO
compensation as well as the managerial board affiliations are matched suggests that the treated
and the controls are similar not only in their characteristics and financial situations but also in
their compensation policies and managerial power at t=–3. Moreover, we expect that the bias
adjustment step of our matching estimator helps to eliminate most of the bias that may arise from
non-exact matching.
4.2 Effects of Distress on Managerial Influence and CEO Compensation
4.2.1 Full-sample Results: With versus Without Matching
Table 3, Panel A reports the DID matching estimation results, with robust standard errors listed
in parentheses. The sample period is from 1992 to 2019, with corporate distress occurring during
1995-2016.
In the pre-treatment years (i.e., t<0), the effects of corporate distress on CEO Duality, Inside
Directors, Executives in Compensation Committee, and Corporate Governance Score are virtually
nil; the effects on Total Current Compensation and Total Direct Compensation are highly significant
14

and negative in both t=–2 and t=–1. The results suggest that CEO compensation changes precede
board composition changes even before firms fall into distress. The treatment effects on the outcome
variables are mostly significant in the treatment year (i.e., t=0): 8% less of CEOs serve as the board
chairs, 4% fewer of executives sit on the board’s compensation committee; Corporate Governance
Score increases in value; both Total Current Compensation and Total Direct Compensation shrink.
After firms fall into corporate distress (t>0), the treatment effects on outcome variables
generally remain to be strong and significant. The estimates on measures of managerial affiliations
with the board are all negative and quite a few are statistically significant, especially for CEO
Duality. The corporate governance index gains in value significantly, and CEO compensation
diminishes significantly. For example, in the year immediately after the distress (i.e, t=+1), the
proportion of CEOs holding the board’s chairmanship decreases by 11 percentage points, and the
proportions of executives sitting in the board’s compensation committee decrease by 4 percentage
points; the corporate governance index value rises by 0.19; total cash compensation falls by 0.33
million dollars, and total estimated pay shrinks by 3.02 million dollars. In the three years after the
onset of distress (i.e, t=+3), CEO Duality and Executives in Compensation Committee respectively
decrease by 13 and 2 percentage points, Corporate Governance Score value increases by 0.13; Total
Current Compensation and Total Direct Compensation reduce by 0.41 and 2.10 million dollars,
respectively.14
Figure 1 features a clear time trend in the outcome variables over the full sample period. The
time trend confounds the study and, if not appropriately controlled for, can lead to biased inference.
For comparison, we also conduct estimations without matching, i.e., using the set of distressed firms
only. Specifically, to be compatible with the matching estimation, for each event period we regress
each outcome variable, differenced with respect to its corresponding values in t=–3, against the set
of matching covariates in t=–3 as used in the matching estimation.
Table 3, Panel B presents the estimated margins of such regressions. Although similar in
dynamics, almost all the estimated effects of corporate distress on the outcome variables in Panel
14We also use the logarithm of CEO compensation as outcome variables. With this log specification, ourmatching estimations give the difference-in-differences estimates of percentage changes in CEO compensation overtime. Specifically, for t=-2, t=-1, t=0, t=1, t=2, and t=3, the estimated percentage changes in Total CurrentCompensation are respectively -10%, -7%, -20%, -16%, -20%, and -27%, and the estimated percentage changes inTotal Direct Compensation are respectively -13%, -12%, -38%, -44%, -51%, and -42%. We thank the referee forsuggesting this specification.
15
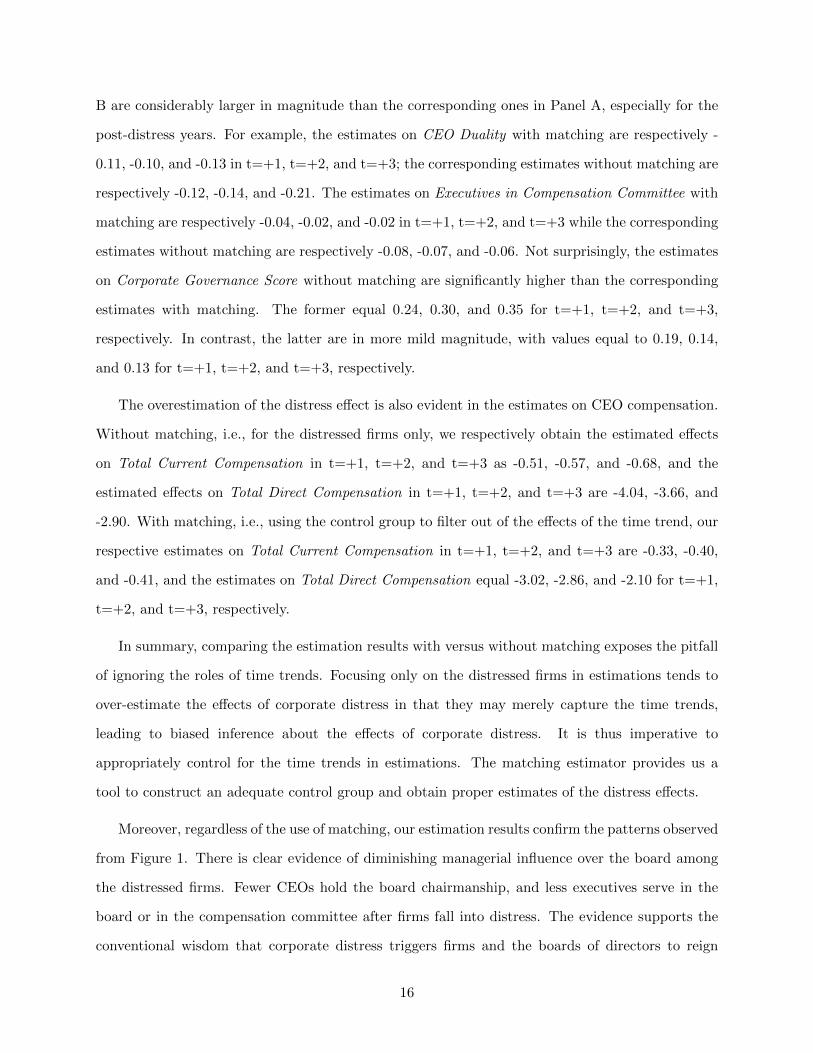
B are considerably larger in magnitude than the corresponding ones in Panel A, especially for the
post-distress years. For example, the estimates on CEO Duality with matching are respectively -
0.11, -0.10, and -0.13 in t=+1, t=+2, and t=+3; the corresponding estimates without matching are
respectively -0.12, -0.14, and -0.21. The estimates on Executives in Compensation Committee with
matching are respectively -0.04, -0.02, and -0.02 in t=+1, t=+2, and t=+3 while the corresponding
estimates without matching are respectively -0.08, -0.07, and -0.06. Not surprisingly, the estimates
on Corporate Governance Score without matching are significantly higher than the corresponding
estimates with matching. The former equal 0.24, 0.30, and 0.35 for t=+1, t=+2, and t=+3,
respectively. In contrast, the latter are in more mild magnitude, with values equal to 0.19, 0.14,
and 0.13 for t=+1, t=+2, and t=+3, respectively.
The overestimation of the distress effect is also evident in the estimates on CEO compensation.
Without matching, i.e., for the distressed firms only, we respectively obtain the estimated effects
on Total Current Compensation in t=+1, t=+2, and t=+3 as -0.51, -0.57, and -0.68, and the
estimated effects on Total Direct Compensation in t=+1, t=+2, and t=+3 are -4.04, -3.66, and
-2.90. With matching, i.e., using the control group to filter out of the effects of the time trend, our
respective estimates on Total Current Compensation in t=+1, t=+2, and t=+3 are -0.33, -0.40,
and -0.41, and the estimates on Total Direct Compensation equal -3.02, -2.86, and -2.10 for t=+1,
t=+2, and t=+3, respectively.
In summary, comparing the estimation results with versus without matching exposes the pitfall
of ignoring the roles of time trends. Focusing only on the distressed firms in estimations tends to
over-estimate the effects of corporate distress in that they may merely capture the time trends,
leading to biased inference about the effects of corporate distress. It is thus imperative to
appropriately control for the time trends in estimations. The matching estimator provides us a
tool to construct an adequate control group and obtain proper estimates of the distress effects.
Moreover, regardless of the use of matching, our estimation results confirm the patterns observed
from Figure 1. There is clear evidence of diminishing managerial influence over the board among
the distressed firms. Fewer CEOs hold the board chairmanship, and less executives serve in the
board or in the compensation committee after firms fall into distress. The evidence supports the
conventional wisdom that corporate distress triggers firms and the boards of directors to reign
16

in the CEO’s and other executives’ power. Naturally, the corporate governance of affected firms
improves. The estimation results also show that corporate distress significantly reduces the level
of CEO compensation. This evidence corroborates the finding of Gilson and Vetsuypens (1993)
who examine the 1980s data over the set of distressed firms only and report significant declines
in CEO compensation upon or after the distress occurrence. Moreover, given that the bulk of
CEO compensation is equity-based pay, the results suggest that corporate distress has a materially
negative effect on CEO stock-based compensation. (Our unreported results bear this out.) In
addition, the matching estimates provide evidence that reduced CEO compensation precedes board
composition changes into corporate distress.
4.2.2 Cross-sectional Results: High- versus Low-Influence Firms
To examine whether the treatment effects of corporate distress exhibit cross-sectional variations,
we separate the firms into two groups based on their Corporate Governance Score values in t=–3,
i.e., three years before the hit of corporate distress. Note that, by construction the score is inversely
related to managerial influence via managerial affiliations with the board. Consequently, we form a
poorly-governed group, i.e., firms with high managerial influence, if a firm’s Corporate Governance
Score is below the median level in t=–3; we classify the other firms into a well-governed group, i.e.,
firms with low managerial influence.
Table 4, Panels A and B report the DID matching estimates of the treatment effects of corporate
distress on managerial influence and CEO compensation for the low-Score subsample and the high-
Score subsample, respectively. Two sets of results emerge in Panel A for the poorly-governed
subsample. First, corporate governance improves in the distressed firms upon and after they fall
into corporate distress. The estimated treatment effects on Corporate Governance Score are all
positive and significant in the window t≥ 0. The estimated effects on CEO Duality are all negative
and significant for t≥ 0. Second, upon or after the advent of corporate distress, CEO compensation,
Total Current Compensation and Total Direct Compensation alike, declines significantly. Panel B
presents similar but markedly weaker results for the group of firms with initially good governance,
i.e., low managerial influence at t=–3.
We draw several inferences from comparing the results of Panel A and Panel B. First, although
17
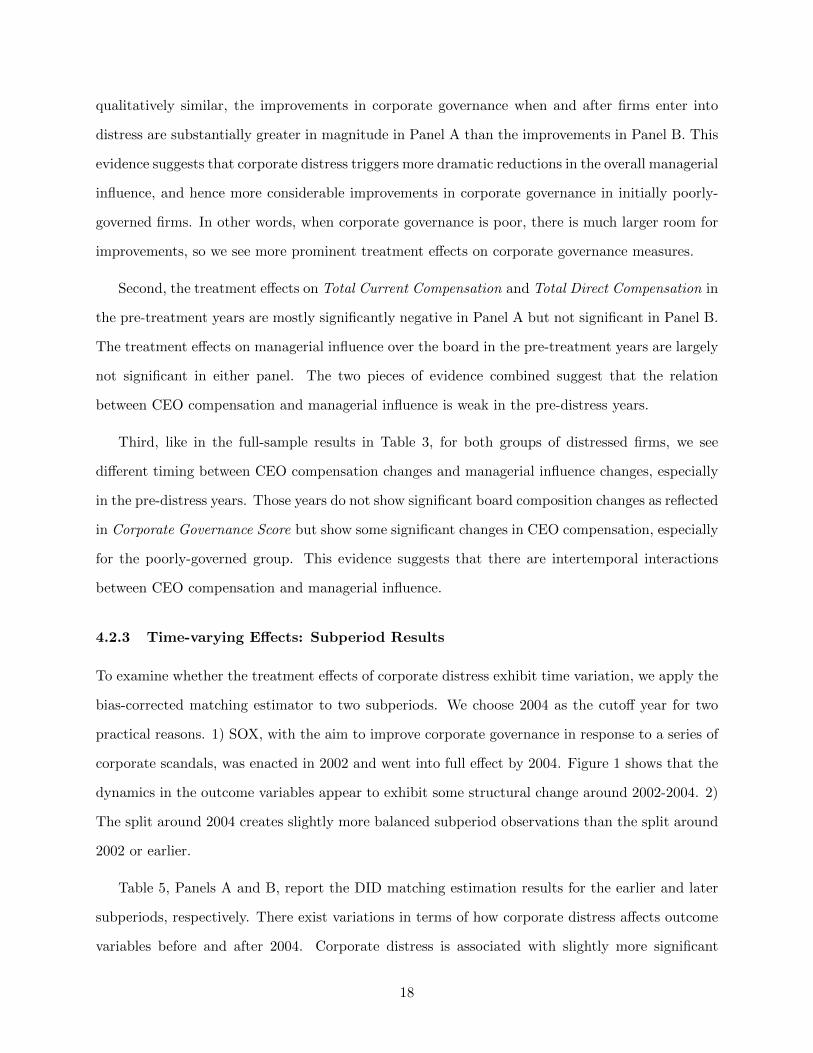
qualitatively similar, the improvements in corporate governance when and after firms enter into
distress are substantially greater in magnitude in Panel A than the improvements in Panel B. This
evidence suggests that corporate distress triggers more dramatic reductions in the overall managerial
influence, and hence more considerable improvements in corporate governance in initially poorly-
governed firms. In other words, when corporate governance is poor, there is much larger room for
improvements, so we see more prominent treatment effects on corporate governance measures.
Second, the treatment effects on Total Current Compensation and Total Direct Compensation in
the pre-treatment years are mostly significantly negative in Panel A but not significant in Panel B.
The treatment effects on managerial influence over the board in the pre-treatment years are largely
not significant in either panel. The two pieces of evidence combined suggest that the relation
between CEO compensation and managerial influence is weak in the pre-distress years.
Third, like in the full-sample results in Table 3, for both groups of distressed firms, we see
different timing between CEO compensation changes and managerial influence changes, especially
in the pre-distress years. Those years do not show significant board composition changes as reflected
in Corporate Governance Score but show some significant changes in CEO compensation, especially
for the poorly-governed group. This evidence suggests that there are intertemporal interactions
between CEO compensation and managerial influence.
4.2.3 Time-varying Effects: Subperiod Results
To examine whether the treatment effects of corporate distress exhibit time variation, we apply the
bias-corrected matching estimator to two subperiods. We choose 2004 as the cutoff year for two
practical reasons. 1) SOX, with the aim to improve corporate governance in response to a series of
corporate scandals, was enacted in 2002 and went into full effect by 2004. Figure 1 shows that the
dynamics in the outcome variables appear to exhibit some structural change around 2002-2004. 2)
The split around 2004 creates slightly more balanced subperiod observations than the split around
2002 or earlier.
Table 5, Panels A and B, report the DID matching estimation results for the earlier and later
subperiods, respectively. There exist variations in terms of how corporate distress affects outcome
variables before and after 2004. Corporate distress is associated with slightly more significant
18

board composition changes and governance improvements in the later subperiod than in the earlier
subperiod. To the contrary, the reduction in CEO compensation related to corporate distress is
more pronounced in the earlier subperiod.
To offer further evidence on the time-varying effects of corporate distress, we follow the
literature and estimate pay-for-performance sensitivity (PPS) as a proxy for managerial incentive
alignment (e.g. Jensen and Murphy, 1990; Murphy, 2000). Specifically, we run a panel regression,
controlling for both firm-fixed effects and year-fixed effects, of CEO compensation on performance
and its interactions with various dummy variables measuring distress status, event periods and
calendar years over the set of distressed firms and their controls.15 Table 6 reports the panel
regression results, with Columns (1), (2) and (3) corresponding to the whole period, the pre-2004
subperiod and the post-2004 subperiod, respectively. The coefficient on the triple interaction term,
performance×postdistress×distressfirm, gives the DID estimate of the effect of distress on the
sensitivity of CEO flow compensation (Total Direct Compensation here) to firm performance. The
PPS coefficient estimate is 0.39 and significant at the 5% level in the full sample (Column (1)). This
result, obtained with a DID regression, is qualitatively similar to Gilson and Vetsuypens’ (1993)
finding that the PPS for distressed firms increases after distress.
There exists significant time variation in the effects of corporate distress on PPS. The PPS
coefficient estimate is 1.02 and significant at the 5% level in the pre-2004 subperiod (Column (2)),
and it is 0.29 but not statistically significant in the post-2004 subperiod (Column (3)). In
Column (4), we use a slightly different model specification that introduces a post-2004 dummy
variable and interact it with the other control variables of the model. In this specification, the
same triple interaction term gives the DID estimate of the distress effect on PPS in the pre-2004
subperiod, while the quadruple interaction term, i.e., the triple interaction term times the post-
2004 dummy, gives the DID estimate of the incremental distress effect on PPS in the post-2004
subperiod relative to the pre-2004 subperiod. The two coefficient estimates are respectively 0.90,
significant at the 1% level (standard error=0.32), and -0.88, significant at the 10% level (standard
15In our panel regressions, the dependent variables are the flow compensation measures rather than the changesin CEO wealth as often used in the literature. We use flow compensation in the regressions in order to maintainconsistency with our discussions in the paper and to show the dynamics of CEO compensation (relative to corporategovernance) over time. Using changes in CEO wealth as the dependent variable yields qualitatively similar results.We also obtain qualitatively similar results if we follow Core and Guay’s (1999) approach to estimate the pay-for-performance sensitivity.
19
error=0.47). The result in Column (4) echoes the subperiod results in Columns (2) and (3): the
effects of corporate distress on PPS is significant in the pre-2004 subperiod but not significantly
different from zero in the post-2004 subperiod. Overall, the results in Table 6 are consistent with the
evidence in Table 5 on seemingly greater reductions in CEO compensation in the pre-2004 subperiod
than in the post-2004 subperiod. The bifurcating significance of the PPS estimates across the two
subperiods may pertain to the following economic force — the regulatory reforms in the early 2000s
improve corporate governance and better align managerial incentives, likely reducing the space for
post-distress improvements in managerial incentive after 2004.
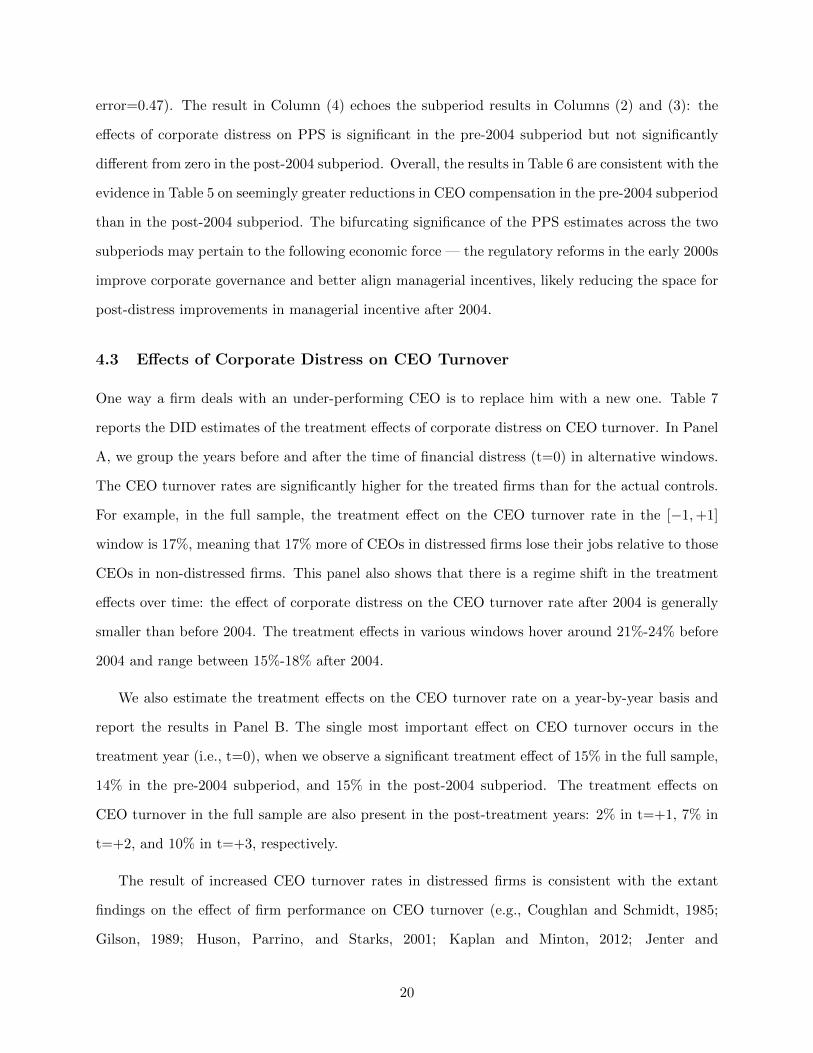
4.3 Effects of Corporate Distress on CEO Turnover
One way a firm deals with an under-performing CEO is to replace him with a new one. Table 7
reports the DID estimates of the treatment effects of corporate distress on CEO turnover. In Panel
A, we group the years before and after the time of financial distress (t=0) in alternative windows.
The CEO turnover rates are significantly higher for the treated firms than for the actual controls.
For example, in the full sample, the treatment effect on the CEO turnover rate in the [−1,+1]
window is 17%, meaning that 17% more of CEOs in distressed firms lose their jobs relative to those
CEOs in non-distressed firms. This panel also shows that there is a regime shift in the treatment
effects over time: the effect of corporate distress on the CEO turnover rate after 2004 is generally
smaller than before 2004. The treatment effects in various windows hover around 21%-24% before
2004 and range between 15%-18% after 2004.
We also estimate the treatment effects on the CEO turnover rate on a year-by-year basis and
report the results in Panel B. The single most important effect on CEO turnover occurs in the
treatment year (i.e., t=0), when we observe a significant treatment effect of 15% in the full sample,
14% in the pre-2004 subperiod, and 15% in the post-2004 subperiod. The treatment effects on
CEO turnover in the full sample are also present in the post-treatment years: 2% in t=+1, 7% in
t=+2, and 10% in t=+3, respectively.
The result of increased CEO turnover rates in distressed firms is consistent with the extant
findings on the effect of firm performance on CEO turnover (e.g., Coughlan and Schmidt, 1985;
Gilson, 1989; Huson, Parrino, and Starks, 2001; Kaplan and Minton, 2012; Jenter and
20

Kanaan, 2015). This result also mirrors our above evidence that managerial influences decline
after firms become distressed. The more likely a CEO is to lose his job, the less influence he is to
exert over the board.
4.4 Effects of Distress on Performance-related and Performance-unrelated CEO
Compensation
Following prior studies (e.g., Jensen and Murphy, 1990; Bertrand and Mullainathan, 2001), we
decompose CEO compensation into two parts, one related to performance and the other not related
to performance. Specifically, using only non-distressed firms we regress each measure of CEO
compensation, Total Current Compensation and Total Direct Compensation, against the following
four firm performance measures: ROA, one-year stock return, log value of market capitalization, and
log value of total assets, as well as industry dummies and year dummies. We then use the obtained
parameter estimates to calculate the predicted values and residuals of the respective compensation
for both distressed and non-distressed firms.16 For distressed firms, the expected compensation
characterizes performance-related compensation if the model parameters linking compensation to
performance are the same for distressed and non-distressed firms; the unexpected compensation
comprises two portions: one due to potential model misspecification and the other truly unrelated
to performance, i.e., the “abnormal” compensation. We thus interpret the regression residuals
for the distressed firms only as a coarse proxy for the abnormal compensation. We respectively
estimate the ATT effects of distress on the two parts of compensation. Table 8 reports the results,
with Panel A for expected compensation and Panel B for unexpected compensation.
Panel A contrasts the expected compensation of distressed firms with the expected compensation
of control firms for the full sample as well as its two subperiods. As can be seen clearly, corporate
distress significantly reduces expected compensation in all the event years, irrespective of the periods
we choose to analyze. In Panel B, we compare the unexpected compensation of the distressed firms
with the unexpected compensation of the control firms. Overall, the results show that corporate
16We tried alternative specifications for compensation decompositions. For example, to address the potentialconcern that size could be a proxy for managerial power, we do not include market capitalization or total assetsin the regression. We also produce two dollar measures of firm performance, respectively by multiplying marketcapitalization with one-year stock return and total assets with ROA, and regress each level of compensation with thetwo dollar performance measures to obtain regression residuals. The results obtained using alternative compensationdecompositions in the analysis are similar to the ones presented in this section.
21

distress does not affect much unexpected compensation. Almost all of the estimated treatment
effects from t=–1 to t=+3 are not significantly different from zero in the full sample. The only
exception is: the estimated effect on unexpected Total Current Compensation in t=0 is positive
and significant at the 1% level. The subperiod results are largely similar to the full-sample results.
In summary, the results in Panels A and B suggest that corporate distress reduces performance-
related compensation but not residual compensation. With the caveat that the compensation
decomposition is based on a standard, albeit quite simplistic, parametric model for non-distressed
firms and may not be completely appropriate for distressed firms, we take our results as indicating
that the majority of the effects of corporate distress on CEO pay is driven by performance-related
compensation.
5 Conclusions
In this paper we study the dynamics of two constructs of corporate governance, managerial power
and CEO compensation, over the course of corporate distress during the 1992-2019 period. Data
show an apparent trend that governance improves over time, which confounds and biases the long-
run study of effects of corporate distress on governance if the trend is not properly controlled for.
To address this concern, we apply a bias-corrected matching estimator to identify an appropriate
control group for filtering out the effects of the trend and to estimate the true effects of corporate
distress on managerial influence over the board, CEO compensation, and CEO turnover.
Corporate distress has material consequences on corporate governance and CEO compensation.
Upon and after the onset of corporate distress, affected firms substantially reduce managerial
appointments to the board, intensify managerial incentive alignment, cut CEO compensation, and
increase CEO turnover. As a result, corporate governance improves. The effects of corporate
distress on governance vary across section and over time. In particular, initially poorly-governed
affected firms experience more significant reductions in managerial power and CEO compensation
than initially well-governed firms. We also find evidence that managerial incentive alignments
tighten after firms fall into distress, particularly in the pre-2004 subperiod.
Our results suggest that the bulk of the effects of corporate distress on CEO compensation
22

derives from the part of compensation tied to firm performance, consistent with the “shareholder
view” of CEO compensation. Moreover, firms reduce CEO compensation before corporate distress
but adjust managerial board appointments only after becoming distressed. These results suggest
that the CEO compensation changes are not entirely driven by the board structure changes. Other
forces are at work during the course of corporate distress. A thorough understanding of those forces
warrants further research.
23

Appendix: Matching Estimator — Some Technical Details
Following the usual notation in the program evaluation literature, let Yi(0) and Yi(1) denote
the potential outcomes of unit i under control and treatment status respectively, for i = 1, .., N .
For each unit i we observe the treatment received Ti for Ti ∈ {0, 1} and the outcome for each
treatment, Yi = Yi(0) if Ti = 0 and Yi = Yi(1) if Ti = 1, as well as a vector of pre-treatment
variables or covariates Xi. There are N0 control units and N1 treated units, N = N0 +N1. We are
interested in estimating the Average Treatment Effect for the Treated (ATT)
τ t = E[Yi(1)− Yi(0)|Ti = 1].
The main identifying assumption necessary to estimate the above ATT is known as
unconfoundedness or the Conditional Independence Assumption (CIA). It assumes that
(Yi(1), Yi(0)) ⊥ Ti|Xi. This implies that after controlling for observable characteristics the potential
outcomes are independent of the treatment status. Actually, following Abadie and Imbens (2006,
2011) only a weaker version of the CIA is needed for estimating the ATT by matching; we only
need Yi(0) ⊥ Ti|Xi, that is, Ti is independent of Yi(0) conditional on Xi.17 The intuition is that,
after we control for all potential confounders Xi we can assume that the treatment is as good as a
randomized treatment.
Abadie and Imbens (2006, 2011) consider the case of matching with replacement, allowing each
unit to be used as a match more than once. This procedure has the advantage of improving the
average match quality with respect to the case of matching without replacement, but implies that
special attention must be paid to the number of times a unit is used as a match. Following Abadie
and Imbens’ (2006) notation, let jm(i) be the index of the m-th match to unit i (i.e. jm(i) is the
m-th closest unit to unit i in terms of the covariate values, measured by the Euclidean distance
between the two vectors). Let JM (i) = {j1(i), ..., jM (i)} denote the set of indices for the first M
matches for unit i, and let KM (i) denote the number of times unit i is used as a match if M
matches are done per unit, KM (i) = ΣNl=11{i ∈ JM (l)}, where 1{·} is the indicator function. Now,
17In addition to the CIA, we need to satisfy an overlap condition and other regularity conditions. See Abadie andImbens (2006, 2011) for details.
24

for i = 1, ..., N , define the imputed potential outcome under the control status as
Yi(0) =
{Yi if Ti = 01M
∑j∈JM (i)
Yj if Ti = 1.
Then, Abadie and Imbens (2006) write the matching estimator for the ATT that uses M
matches per unit with replacement as
τm,tM =
1
N1
∑j∈JM (i)
(Yi − Yi(0))
=1
N1
∑Ti=1
(Ti − (1− Ti)
KM (i)
M
)Yi.
This is called the simple matching estimator. Abadie and Imbens (2006) show that this estimator
is not N1/2-consistent in general, because it includes a conditional bias term that may be of order
larger than N−1/2, unless the matching variables include at most one continuous variable. An
attractive property of this estimator is that the estimator for the asymptotic variance proposed by
Abadie and Imbens does not rely on bootstrapping (contrary to other matching methods).
Abadie and Imbens (2011) propose a bias-corrected matching estimator where the difference
within the matches is regression-adjusted for the difference in covariate values:
Yi(0) =
{Yi if Ti = 01M
∑j∈JM (i)
(Yj + µ0(Xi)− µ0(Xj) if Ti = 1.
where µ0 is a consistent estimator of µ0 = E[Y (t)|X = x]. The bias-corrected matching estimator
that uses M matches per unit with replacement is then
τ bcm,tM =
1
N1
∑j∈JM (i)
(Yi − Yi(0)).
Contrary to the simple matching estimator, Abadie and Imbens (2011) show that this bias-
corrected matching estimator is N1/2-consistent and asymptotically normal. In this paper we use
the bias-corrected matching estimator, in light of the desirable properties described by Abadie and
Imbens (2011). We carry out our estimation using the Stata command nnmatch which is discussed
in details in Abadie et al. (2004).
25

References
[1] Abadie, Alberto, David Drukker, Jane Leber Herr, and Guido W. Imbens, 2004. Implementing
matching estimators for average treatment effects in Stata. Stata Journal 4(3): 290-311.
[2] Abadie, Alberto, and Guido W. Imbens, 2006. Large sample properties of matching estimators
for average treatment effects. Econometrica 74(1), 235-267.
[3] Abadie, Alberto, and Guido W. Imbens, 2008. On the failure of the bootstrap for matching
estimators. Econometrica 76(6), 1537-1557.
[4] Abadie, Alberto, and Guido W. Imbens, 2011. Bias-corrected matching estimators for average
treatment effects. Journal of Business and Economic Statistics 29(1), 1-11.
[5] Albuquerque, Ana, 2009. Peer firms in relative performance evaluation. Journal of Accounting
and Economics 48, 69–89.
[6] Albuquerque, Ana, Gus DeFranco, and Rodrigo S. Verdi, 2013. Peer choice in CEO
compensation. Journal of Financial Economics 108, 160–181.
[7] Altman, Edward I., 1968. Financial ratios, discriminate analysis, and the prediction of
corporate rate bankruptcy. Journal of Finance 23, 589-609.
[8] Bebchuk, Lucian A., Alma Cohen, and Allen Ferrell, 2009. What matters in corporate
governance? Review of Financial Studies 22(2), 783-827.
[9] Bebchuk, Lucian, and Jesse Fried, 2004. Pay Without Performance: The Unfulfilled Promise
of Executive Compensation. Harvard University Press. Cambridge, MA.
[10] Bernstein, Ethan S, 2006. All’s fair in love, war & bankruptcy? Corporate governance
implications of CEO turnover in corporate distress. Stanford Journal of Law, Business &
Finance 11(2), 299–325.
[11] Bertrand, Marian, and Sendhil Mullainathan, 2001. Are CEOs rewarded for luck? The ones
without principals do. Quarterly Journal of Economics 116, 901–932.
26

[12] Bizjak, John, Michael Lemmon, and Thanh Nguyen, 2011. Are all CEOs above average? An
empirical analysis of compensation peer groups and pay design. Journal of Financial Economics
100, 538–555.
[13] Conyon, Martin J., John E. Core, and Wayne R. Guay, 2011. Are US CEOs paid more than
UK CEOs? Inferences from risk-adjusted pay. Review of Financial Studies 24, 402–438.
[14] Core, John E., and Wayne R. Guay, 1999. The use of equity grants to manage optimal equity
incentive levels. Journal of Accounting and Economics 28, 151–184.
[15] Core, John E., Robert W. Holthausen, and David F. Larcker, 1999. Corporate governance,
CEO compensation, and firm performance. Journal of Financial Economics 51, 371–406.
[16] Coughlan, A., and R Schmidt, 1985. Executive compensation, management turnover, and firm
performance: An empirical investigation. Journal of Accounting and Economics 7,43–66.
[17] Eckbo, B. Espen, Karin S. Thorburn, and Wei Wang, 2016. How costly is corporate bankruptcy
for the CEO? Journal of Financial Economics 121(1), 210–229.
[18] Edmans, Alex, and Xavier Gabaix, 2009. Is CEO pay really inefficient? A survey of new
optimal contracting theories. European Financial Management 15, 486–496.
[19] Edmans, Alex, and Xavier Gabaix, 2016. Executive compensation: A modern primer. Journal
of Economic Literature 54(4), 1232–1287.
[20] Faulkender, Michael, and Jun Yang, 2010. Inside the black box: The role and composition of
compensation peer groups. Journal of Financial Economics 96, 257-270.
[21] Gilson, Stuart C., 1989. Management turnover and financial distress. Journal of Financial
Economics 25, 241–262.
[22] Gilson, Suart C., 1990. Bankruptcy, boards, banks, and blockholders. Journal of Financial
Economics 27, 355–387.
[23] Gilson, Stuart C., and Michael R. Vetsuypens, 1993. CEO compensation in financially
distressed firms: An empirical analysis. Journal of Finance 48, 425–458.
27

[24] Gompers, Paul A., Joy L. Ishii, Andrew Metrick, 2003. Corporate finance and equity prices.
Quarterly Journal of Economics 118(1), 107–155.
[25] Goyal, Vidhan K., and Wei Wang, 2017. Provision of Management Incentives in Bankrupt
Firms. Journal of Law, Finance, and Accounting 2(1), 87–123.
[26] Henderson, M. Todd, 2007. Paying CEOs in bankruptcy: Executive compensation when agency
costs are low. Northwestern University Law Review 101(4), 1543–1618.
[27] Hermalin Benjamin E., and Michael S. Weisbach, 1991. The effects of board composition and
direct incentives on firm performance. Financial Management 20, 101–112.
[28] Hotchkiss, Edith, Kose John, Robert Mooradian, and Karin Thorburn, 2008. Bankruptcy and
the Resolution of corporate distress. In B. Espen Eckbo (Ed.), Handbook of Corporate Finance:
Empirical Corporate Finance, Vol 2, Ch. 14. Elsevier/North Holland.
[29] Huson, Mark R., Robert Parrino, and Laura T. Starks, 2001. Internal monitoring mechanisms
and CEO turnover: A long term perspective. Journal of Finance 56, 2265–2297.
[30] Imbens, Guido W., and Donald B. Rubin, 2015. Causal Inference for Statistics, Social, and
Biomedical Sciences: An Introduction. Cambridge University Press.
[31] Imbens, Guido W., and Jeffrey M. Wooldridge, 2009. Recent developments in the econometrics
of program evaluation. Journal of Economic Literature 47(1), 5–86.
[32] Jensen, Michael, and Kevin J. Murphy, 1990. Performance pay and top-management incentives.
Journal of Political Economy 98, 225–262.
[33] Jenter, Dirk, and Fadi Kanaan, 2015. CEO turnover and relative performance evaluation.
Journal of Finance 70(5), 2155–2183.
[34] Kaplan, Steven N., 2012. Executive compensation and corporate governance in the U.S.:
Perceptions, facts, and challenges. NBER Working Paper No. 18395.
[35] Kaplan, Steven N., and Bernadette Minton, 2012. How has CEO turnover changed?
International Review of Finance 12, 57–87.
28
[36] Murphy, Kevin J., 2000. Executive Compensation, in: Orley Ashenfelter and David Card,
(eds), Handbook of Labor Economics, Vol. 3, North Holland. Amsterdam, pp.2485–2563.
[37] Ohlson, James A., 1980. Financial ratios and the probabilistic prediction of bankruptcy.
Journal of Accounting Research 18, 109–131.
[38] Rubin, Donald B., 2008. For objective causal inference, design trumps analysis. Annals of
Applied Statistics 2, 808–840.
[39] Senbet, Lemma W., and Tracy Y. Wang, 2012. Corporate Financial Distress and Bankruptcy:
A Survey. Foundations and Trends in Finance 5(4), 243–335.
[40] Smith, Jeffrey A., and Petra E. Todd, 2005. Does matching overcome LaLonde’s critique of
nonexperimental estimators? Journal of Econometrics 125(1-2), 305–353.
29

Table 1: Number of Observations across Years
This table reports the number of observations for distressed firms and non-distressed firms across years. We
require a firm included in the analysis sample to have no missing information in the matching covariates in
period -3, at most one missing variable among all compensation variables in periods –2 to 0, and at most
one missing variable in all compensation variables in periods +1 to +3, where period 0 refers to the year
in which a firm falls into distress. See Table 2 for details of the matching covariates and the compensation
variables. The sample period is 1992-2019 and period 0 spans from 1995 through 2016.
Fiscal Year Distressed Firms Non-distressed Firms
1995 10 8141996 9 9901997 2 9521998 9 9341999 8 9842000 6 1,0902001 11 1,1482002 23 1,1282003 25 1,1012004 13 1,1022005 16 1,0652006 6 1,0912007 12 1,0682008 20 1,0422009 18 1,1042010 14 1,3562011 17 1,3372012 24 1,3222013 14 1,2942014 10 1,2612015 22 1,2362016 8 1,226
Total 297 24,645
30

Table 2: Balancing: Matching Covariates and Non-Matched Covariates
This table shows balancing of the matching covariates (in Panel A) and some non-matched covariates (in Panel B) in period -3, where the benchmark
period 0 refers to the year when a firm falls into distress. The sample period spans from 1992 to 2019, with corporate distress occurring in 1995-2016.
Matching covariates include dummies for each fiscal year of distress, dummies for each Fama-French 5-industry classification, firm size measured
by natural logarithm of market capitalization, size dummy that equals one if market capitalization is in the 70th percentile and zero otherwise,
leverage measured by total debt-to-asset ratio, Ohlson’s (1980) O-score, past three-year cumulative stock returns, O-score dummy that equals one
if the O-score is in the 80th percentile and zero otherwise, stock return dummy that equals one if the three-year cumulative return is in the 20th
percentile and zero otherwise, total current compensation (equal to the sum of salary and bonus), total direct compensation (equal to the sum of total
current compensation, value of restricted stock grants, Black-Scholes value of stock option grants, other annual short-term compensation, payouts from
long-term incentive plans, and all other long-term compensation), and three dummy variables measuring managerial service in the board: Executive
in Compensation Committee, Insider Directors, and CEO-Chair Duality. Both Total Current Compensation and Total Direct Compensation are
quoted in millions of 2018 constant dollars. Non-matched covariates include natural logarithm of total assets, natural logarithm of total sales, and
natural logarithm of number of employees, market-to-book asset ratio (market value of equity plus book value of assets minus the sum of book value
of common equity and deferred taxes, scaled by book value of assets), profit margin (income before extraordinary items divided by total sales), return
on equity (income before extraordinary items divided by total stockholders’ equity), return on assets (income before extraordinary items divided by
total assets), cashflow-to-asset ratio (operating activities net cash flow divided by total assets), book leverage ratio (the sum of long-term debts and
short-term debts divided by total assets), Altman’s (1968) z-score (a lower value corresponding to more severe financial distress), a company’s S&P
credit ratings (with the ratings of “AAA”, “AA+” converted to the values of 1, 2, and so on), Dummy for investment-grade rating (equal to one if
a company receives a rating of “BBB-” or better, and zero otherwise), one-year stock return and one-year stock return volatility (respectively the
cumulative stock return and the stock return volatility in the past one year), and share turnover (the number of common shares traded divided by the
number of common shares outstanding). Columns (1)-(2) and Columns (3)-(4) respectively summarize the covariates for the treated and the potential
controls. Columns (5)-(6) present the raw difference in the covariates between the treated and potential controls, and Columns (7)-(8) report the
within-match difference in the covariates between the treated and actual controls. “S.D.” and “S.E.” stand for standard deviation and standard error,
respectively. We apply Abadie and Imbens’ (2011) matching estimator to identify the actual controls. *, ** and *** denote significance at 10%, 5%
and 1%, respectively.
Treated Potential Controls Raw Difference Within-Match DifferenceMean S.D. Mean S.D. Mean S.E. Mean S.E.
Variables (1) (2) (3) (4) (5) (6) (7) (8)
Panel A. Matching CovariatesFiscal Year 1995 0.04 0.19 0.06 0.24 -0.02 0.01 0.00 0.00Fiscal Year 1996 0.03 0.17 0.08 0.26 -0.05** 0.01 0.00 0.00Fiscal Year 1997 0.01 0.08 0.03 0.16 -0.02** 0.01 0.00 0.00Fiscal Year 1998 0.03 0.18 0.02 0.15 0.01 0.01 0.00 0.00Fiscal Year 1999 0.03 0.17 0.05 0.21 -0.02 0.01 0.00 0.00Fiscal Year 2000 0.02 0.13 0.02 0.13 0.00 0.01 0.00 0.00Fiscal Year 2001 0.04 0.19 0.10 0.29 -0.06** 0.01 0.00 0.00Fiscal Year 2002 0.08 0.27 0.06 0.24 0.02 0.02 0.00 0.00Fiscal Year 2003 0.09 0.29 0.07 0.25 0.02 0.02 0.00 0.00Fiscal Year 2004 0.05 0.21 0.04 0.21 0.00 0.01 0.00 0.00
31

Treated Potential Controls Raw Difference Within-Match DifferenceMean S.D. Mean S.D. Mean S.E. Mean S.E.
Variables (1) (2) (3) (4) (5) (6) (7) (8)
Fiscal Year 2005 0.06 0.23 0.02 0.14 0.04** 0.01 0.00 0.00Fiscal Year 2006 0.02 0.15 0.01 0.11 0.01 0.01 0.00 0.00Fiscal Year 2007 0.04 0.20 0.02 0.12 0.03* 0.01 0.00 0.00Fiscal Year 2008 0.07 0.25 0.03 0.18 0.04* 0.02 0.00 0.00Fiscal Year 2009 0.06 0.23 0.04 0.19 0.02 0.01 0.00 0.00Fiscal Year 2010 0.05 0.21 0.09 0.29 -0.05** 0.01 0.00 0.00Fiscal Year 2011 0.05 0.22 0.07 0.25 -0.02 0.01 0.00 0.00Fiscal Year 2012 0.08 0.26 0.03 0.17 0.04** 0.02 0.00 0.00Fiscal Year 2013 0.04 0.20 0.02 0.14 0.02 0.01 0.00 0.00Fiscal Year 2014 0.03 0.16 0.05 0.22 -0.03* 0.01 0.00 0.00Fiscal Year 2015 0.08 0.27 0.03 0.16 0.05** 0.02 0.00 0.00Fiscal Year 2016 0.03 0.17 0.08 0.27 -0.05** 0.01 0.00 0.00Dummy SIC = 1 – Consumer Industries/Services 0.19 0.39 0.19 0.39 0.00 0.02 0.00 0.00Dummy SIC = 2 – Manufacturing, Energy & Utilities 0.23 0.42 0.23 0.42 0.00 0.03 -0.01 0.00Dummy SIC = 3 – Business Equipment, Telecomm & TV 0.32 0.47 0.18 0.39 0.13** 0.03 -0.01* 0.00Dummy SIC = 4 – Healthcare, Medical Equp & Drugs 0.11 0.32 0.07 0.26 0.04* 0.02 0.01** 0.00Dummy SIC = 5 – Other Industries 0.16 0.37 0.33 0.47 -0.17** 0.02 0.00 0.00Log of Market Capitalization 7.22 1.35 7.47 1.48 -0.25** 0.09 -0.08 0.04Dummy for Large Market Cap (70th percentile) 0.19 0.40 0.25 0.43 -0.06* 0.03 -0.01 0.01Total Liabilities/Total Assets 0.51 0.27 0.55 0.25 -0.03* 0.02 0.02 0.01O-Score -2.07 3.21 -2.33 2.31 0.26 0.20 0.21** 0.08Cumulative Stock Return over [-5, -3] 0.26 0.83 0.15 0.38 0.11** 0.05 0.02** 0.01Dummy for Top Quintile O-Score Distribution 0.08 0.28 0.02 0.14 0.06** 0.02 0.00 0.00Dummy for Bottom Quintile 3-year Stock Return Distribution 0.08 0.28 0.04 0.19 0.05** 0.02 0.04** 0.01Total Current Compensation ($M) 1.47 2.14 1.27 1.21 0.20 0.13 0.18** 0.06Total Direct Compensation ($M) 6.44 13.35 4.34 5.88 2.10** 0.81 0.90** 0.24Dummy for Executive(s) in the Compensation Committee 0.06 0.23 0.07 0.26 -0.02* 0.01 0.01 0.01Dummy for Insider Director(s) 0.99 0.10 0.98 0.15 0.01 0.01 0.01 0.01Dummy for CEO-Chair Duality 0.40 0.49 0.42 0.49 -0.02 0.03 0.01 0.02
Panel B. Non-Matched CovariatesLog of Total Assets 7.01 1.55 7.59 1.74 -0.58*** 0.10 0.15* 0.07Log of Total Sales 6.70 1.86 7.11 1.60 -0.42*** 0.12 0.06 0.07Log of Number of Employees 0.95 1.88 1.18 1.73 -0.23* 0.12 -0.02 0.08Market-to-Book Asset Ratio 3.13 5.19 2.02 1.75 1.11*** 0.31 -0.16* 0.07Profit Margin -4.11 47.05 0.05 0.41 -4.16 2.82 0.41 0.36Return on Equity 0.15 1.97 0.13 0.88 0.02 0.12 -0.01 0.01Return on Asset 0.01 0.17 0.05 0.09 -0.04*** 0.01 -0.01** 0.00Cashflow-to-Asset Ratio 0.06 0.16 0.10 0.09 -0.04*** 0.01 -0.01** 0.00Book Leverage Ratio 0.24 0.22 0.22 0.20 0.02** 0.01 -0.01 0.01Z-Score -10.86 34.18 -4.98 8.03 -5.88*** 2.05 1.72** 0.59Credit Rating 12.15 2.56 8.88 3.18 3.27*** 0.25 -0.17 0.32Dummy for Investment-Grade Rating 0.25 0.43 0.71 0.45 -0.46*** 0.04 -0.01 0.05One-year Stock Return 0.56 1.69 0.17 0.59 0.40*** 0.10 -0.08* 0.04One-year Stock Return Volatility 0.54 0.21 0.39 0.18 0.16*** 0.01 0.00 0.01Share Turnover 3.26 2.94 1.82 1.78 1.44*** 0.18 0.06 0.08
32

Table 3: Effects of Corporate Distress on Managerial Influence and CEO Compensation: Withand Without Control Group
This table reports the estimated effects of corporate distress on managerial influence and CEO compensation
during the 1992-2019 period, whereas corporate distress occurred in 1995-2016. Panel A contains both treated
and control firms and presents the difference-in-differences estimates of the average treatment effect for the
treated (ATT) of corporate distress on managerial influence over the board and CEO compensation for each
event period. We use Abadie and Imbens’ (2011) bias-corrected matching estimator to select control firms
and conduct estimations. Event periods are measured relative to period 0, the year of distress occurrence.
Panel B includes treated firms only and lists the margins of the following model estimated for each period
t = −2,−1, ...,+3: yi,t = αt + Xi,−3βt + ui,t, where X represents a set of control variables whose t = −3
observations are used as matching covariates of the matching estimator and each y is differenced with respect
to its corresponding value in period –3. Managerial influence measures include whether the CEO serves as
the board chair (CEO Duality ; equal to one if true and zero otherwise), whether at least one executive serves
as a board director (Inside Directors; equal to one if true and zero otherwise), and whether at least one
executive serves in the compensation committee of the board (Executives in Compensation Committee; equal
to one if true and zero otherwise). Corporate Governance Score is average of the following three standardized
variables: CEO Duality, number of executives serving as board directors, and number of executives serving in
the compensation committee, each demeaned and divided by its standard deviation. We multiply Corporate
Governance Score by minus one so that a higher Corporate Governance Score value corresponds to better
governance. CEO compensations, in 2018 constant dollars, include total current compensation (Total
Current Compensation; equal to the sum of salary and bonus) and total direct compensation (Total Direct
Compensation; equal to the sum of Total Current Compensation, value of restricted stock grants, Black-
Scholes value of stock option grants, other annual short-term compensation, payouts from long-term incentive
plans, and all other long-term compensation). Robust standard errors are reported in parentheses. *, **
and *** denote significance at 10%, 5% and 1%, respectively.
Panel A. Matching Estimator: Sample of Treated and Control FirmsPeriod –2 –1 0 +1 +2 +3CEO Duality 0.00 -0.01 -0.08** -0.11*** -0.10*** -0.13***
(0.03) (0.03) (0.04) (0.04) (0.04) (0.04)Inside Directors -0.01 -0.01 -0.01 -0.01 -0.01 -0.01
(0.01) (0.01) (0.01) (0.01) (0.01) (0.01)Executives in Compensation Committee -0.01 -0.02* -0.04** -0.04** -0.02 -0.02
(0.01) (0.01) (0.02) (0.02) (0.01) (0.02)Corporate Governance Score 0.03 0.02 0.11* 0.19*** 0.14** 0.13**
(0.04) (0.05) (0.06) (0.06) (0.06) (0.07)Total Current Compensation -0.24*** -0.27*** -0.41*** -0.33*** -0.40*** -0.41***
(0.07) (0.10) (0.09) (0.11) (0.11) (0.12)Total Direct Compensation -2.07** -1.87*** -2.81*** -3.02*** -2.86*** -2.10***
(0.83) (0.71) (0.88) (0.73) (0.71) (0.76)Number of Observations 2,537 2,536 2,534 2,533 2,534 2,195
Panel B. Margins: Sample of Treated Firms OnlyPeriod –2 –1 0 +1 +2 +3CEO Duality -0.02 -0.02 -0.06 -0.12*** -0.14*** -0.21***
(0.03) (0.04) (0.05) (0.04) (0.05) (0.05)Inside Directors -0.00 0.00 0.01 0.00 -0.00 -0.03*
(0.01) (0.01) (0.00) (0.01) (0.01) (0.02)Executives in Compensation Committee -0.03 -0.04* -0.07*** -0.08*** -0.07*** -0.06***
(0.02) (0.02) (0.02) (0.02) (0.02) (0.02)Corporate Governance Score 0.07 0.01 0.11* 0.24*** 0.30*** 0.35***
(0.04) (0.05) (0.07) (0.06) (0.06) (0.07)Total Current Compensation -0.27* -0.53** -0.73*** -0.51*** -0.57*** -0.68***
(0.15) (0.21) (0.18) (0.17) (0.18) (0.19)Total Direct Compensation -0.10 -1.20 -2.74*** -4.04*** -3.66*** -2.90***
(2.40) (1.05) (0.99) (0.98) (0.95) (1.08)Number of Observations 277 276 277 275 277 261
33

Table 4: Average Treatment Effect for the Treated (ATT) of Corporate Distress on ManagerialInfluence and CEO Compensation: High- versus Low-Influence Firms
This table respectively reports the difference-in-differences estimates of the average treatment effect for the
treated (ATT) of corporate distress on managerial influence over the board and CEO compensation for
the high-influence firms (Panel A) and low-influence firms (Panel B), using Abadie and Imbens’ (2011)
bias-corrected matching estimator. Event periods are measured relative to period 0, the year of distress
occurrence. Managerial influence measures include whether the CEO serves as the board chair (CEO
Duality ; equal to one if true and zero otherwise), whether at least one executive serves as a board director
(Inside Directors; equal to one if true and zero otherwise), and whether at least one executive serves in
the compensation committee of the board (Executives in Compensation Committee; equal to one if true
and zero otherwise). Corporate Governance Score is average of the following three standardized variables:
CEO Duality, number of executives serving as board directors, and number of executives serving in the
compensation committee, each demeaned and divided by its standard deviation for standardization. We
multiply Corporate Governance Score by minus one so that a higher Corporate Governance Score value
corresponds to better governance. CEO compensations, in 2018 constant dollars, include total current
compensation (Total Current Compensation; equal to the sum of salary and bonus) and total direct
compensation (Total Direct Compensation; equal to the sum of Total Current Compensation, value of
restricted stock grants, Black-Scholes value of stock option grants, other annual short-term compensation,
payouts from long-term incentive plans, and all other long-term compensation). High-influence (low-
influence) firms are those that have their Corporate Governance Score values below (above) the median
value in t=–3. Robust standard errors are reported in parentheses. *, ** and *** denote significance at
10%, 5% and 1%, respectively.
Panel A. Firms with High Managerial Influence (or Low Corporate Governance Score) in Period -3
Period –2 –1 0 +1 +2 +3
CEO Duality 0.03 -0.02 -0.12** -0.15*** -0.16*** -0.24***(0.03) (0.05) (0.06) (0.06) (0.06) (0.07)
Inside Directors 0.01** 0.00 0.00 0.00 0.00 -0.04*(0.00) (0.00) (0.00) (0.01) (0.01) (0.02)
Executives in Compensation Committee -0.01 -0.04 -0.06* -0.04 -0.04 -0.05*(0.02) (0.02) (0.03) (0.03) (0.03) (0.03)
Corporate Governance Score 0.00 -0.01 0.17** 0.21*** 0.21** 0.29***(0.06) (0.07) (0.08) (0.08) (0.09) (0.09)
Total Current Compensation -0.31** -0.26 -0.55*** -0.53*** -0.48*** -0.55***(0.15) (0.17) (0.14) (0.16) (0.17) (0.20)
Total Direct Compensation -3.50** -1.91* -3.35** -3.52*** -3.10*** -3.24***(1.59) (1.02) (1.44) (1.09) (1.01) (1.12)
Number of Observations 1,357 1,358 1,358 1,356 1,356 1,195
Panel B. Firms with Low Managerial Influence (or High Corporate Governance Score) in Period -3
Period –2 –1 0 +1 +2 +3
CEO Duality -0.03 -0.03 -0.08** -0.10*** -0.08** -0.06(0.03) (0.04) (0.04) (0.04) (0.04) (0.04)
Inside Directors -0.02 -0.02 -0.02 -0.01 -0.01 0.03(0.02) (0.02) (0.02) (0.02) (0.02) (0.02)
Executives in Compensation Committee 0.00 0.00 -0.01 -0.01*** 0.00 0.01(0.01) (0.01) (0.01) (0.00) (0.00) (0.01)
Corporate Governance Score 0.04 0.07 0.10* 0.18*** 0.14** 0.07(0.05) (0.06) (0.06) (0.05) (0.05) (0.06)
Total Current Compensation -0.04 0.17 -0.24** -0.07 -0.21* -0.19(0.07) (0.20) (0.10) (0.13) (0.11) (0.13)
Total Direct Compensation 4.29* -0.65 -0.96 -1.31* -2.95*** -0.41(2.32) (0.87) (0.79) (0.79) (0.80) (0.91)
Number of Observations 1,170 1,168 1,166 1,167 1,168 991
34

Table 5: Average Treatment Effect for the Treated (ATT) of Corporate Distress on ManagerialInfluence and CEO Compensation: Subperiod Results
This table respectively reports the difference-in-differences estimates of the average treatment effect for
the treated (ATT) of corporate distress on managerial influence over the board and CEO compensation
for the pre-2004 subperiod (Panel A) and the post-2004 subperiod (Panel B), using Abadie and Imbens’
(2011) bias-corrected matching estimator. Event periods are measured relative to period 0, the year of
distress occurrence. Managerial influence measures include whether the CEO serves as the board chair
(CEO Duality ; equal to one if true and zero otherwise), whether at least one executive serves as a board
director (Inside Directors; equal to one if true and zero otherwise), and whether at least one executive serves
in the compensation committee of the board (Executives in Compensation Committee; equal to one if true
and zero otherwise). Corporate Governance Score is average of the following three standardized variables:
CEO Duality, number of executives serving as board directors, and number of executives serving in the
compensation committee, each demeaned and divided by its standard deviation for standardization. We
multiply Corporate Governance Score by minus one so that a higher Corporate Governance Score value
corresponds to better governance. CEO compensations, in 2018 constant dollars, include total current
compensation (Total Current Compensation; equal to the sum of salary and bonus) and total direct
compensation (Total Direct Compensation; equal to the sum of Total Current Compensation, value of
restricted stock grants, Black-Scholes value of stock option grants, other annual short-term compensation,
payouts from long-term incentive plans, and all other long-term compensation). Robust standard errors are
reported in parentheses. *, ** and *** denote significance at 10%, 5% and 1%, respectively.
Panel A. Pre-2004 SubperiodPeriod –2 –1 0 +1 +2 +3
CEO Duality 0.01 0.02 -0.07 -0.04 -0.11* -0.16**(0.04) (0.05) (0.06) (0.06) (0.06) (0.07)
Inside Directors 0.00 0.00 0.00 0.01 0.00 0.00(0.01) (0.01) (0.01) (0.01) (0.01) (0.01)
Executives in Compensation Committee -0.04 -0.05* -0.09** -0.09** -0.05 -0.06(0.03) (0.03) (0.04) (0.04) (0.04) (0.05)
Corporate Governance Score -0.02 -0.05 0.12 0.18* 0.12 0.17(0.07) (0.09) (0.12) (0.11) (0.12) (0.13)
Total Current Compensation -0.39*** -0.30* -0.80*** -0.78*** -0.83*** -0.64***(0.13) (0.17) (0.13) (0.15) (0.15) (0.18)
Total Direct Compensation -5.14*** -2.28 -3.09 -4.34*** -3.70** -2.86(1.96) (1.43) (1.91) (1.50) (1.47) (1.84)
Number of Observations 1,273 1,273 1,272 1,270 1,271 1,019
Panel B. Post-2004 SubperiodPeriod –2 –1 0 +1 +2 +3
CEO Duality 0.00 -0.02 -0.09* -0.15*** -0.09* -0.09*(0.03) (0.04) (0.05) (0.05) (0.05) (0.06)
Inside Directors -0.02 -0.02 -0.02 -0.02 -0.01 -0.03(0.01) (0.02) (0.01) (0.02) (0.01) (0.02)
Executives in Compensation Committee 0.01 0.01*** 0.00 0.00 0.00 -0.01(0.01) (0.00) (0.00) (0.00) (0.00) (0.01)
Corporate Governance Score 0.07 0.06 0.12** 0.20*** 0.16** 0.15**(0.05) (0.05) (0.06) (0.06) (0.07) (0.08)
Total Current Compensation -0.13 -0.18 -0.15 -0.02 -0.06 -0.21(0.09) (0.14) (0.14) (0.15) (0.14) (0.17)
Total Direct Compensation -0.71* -1.34*** -2.13*** -2.15*** -2.39*** -2.09***(0.42) (0.48) (0.48) (0.47) (0.46) (0.55)
Number of Observations 1,254 1,253 1,252 1,253 1,253 1,167
35

Table 6: Sensitivity of CEO (Flow) Compensation to Firm Performance for Distressed andNon-distressed Firms
This table presents the fixed-effect regression results of CEO (flow) compensation on firm performance and
its interactions with various calendar and distress-related period indicators among distressed firms and their
controls in our sample. Firm performance (Performance, in millions of dollars) is defined as a firm’s market
capitalization at last year-end times its annual stock return for this year. CEO compensations, in 2018
constant dollars, include total current compensation (Total Current Compensation; equal to the sum of salary
and bonus) and total direct compensation (Total Direct Compensation; equal to the sum of Total Current
Compensation, value of restricted stock grants, Black-Scholes value of stock option grants, other annual
short-term compensation, payouts from long-term incentive plans, and all other long-term compensation).
For brevity the regression results for Total Current Compensation are not reported. Distressfirm is a dummy
variable that equals one for firms that ever fell into distress, and zero otherwise. Postdistress is a dummy
variable that equals one if event period t > 0 and zero otherwise, whereas period 0 is the year of distress
occurrence. Post2004 is a dummy variable that equals one for years after 2004 and zero otherwise. All the
regressions control for both firm-fixed effects and year-fixed effects. Robust standard errors as reported in
parentheses adjust for firm-level clustering. *, ** and *** denote significance at 10%, 5% and 1%, respectively.
Full Sample Pre-2004 Post-2004 Full Sample
Performance 0.07*** 0.07*** 0.05*** 0.07***(0.01) (0.01) (0.01) (0.01)
Performance × Postdistress -0.04** 0.09*** 0.01 0.09***(0.02) (0.03) (0.02) (0.02)
Performance× Distressfirm 0.05** 0.03 0.19 0.04*(0.02) (0.04) (0.14) (0.02)
Performance× Postdistress× Distressfirm 0.39** 1.02** 0.29 0.90***(0.18) (0.46) (0.19) (0.32)
Postdistress× Distressfirm -2,063.81*** -2,081.16* -1,455.43*** -2,013.38***(402.10) (1,108.88) (274.91) (775.70)
Postdistress -415.84 -1,468.49** 30.97 -1,101.41***(266.51) (573.29) (182.88) (366.91)
Performance× Post2004 -0.05*(0.03)
Performance × Postdistress× Post2004 -0.15***(0.04)
Performance× Distressfirm× Post2004 0.19(0.29)
Performance× Postdistress× Distressfirm× Post2004 -0.88*(0.47)
Distressfirm× Post2004 -1,508.88*(833.60)
Postdistress× Post2004 1,091.69**(482.62)
Postdistress× Distressfirm× Post2004 442.32(945.93)
Post2004 9,090.39***(1,439.42)
Constant 315.58 1,229.66 5,568.87*** 63.93(822.78) (1,028.03) (196.97) (829.66)
Firm-fixed Effects Yes Yes Yes YesYear-fixed Effects Yes Yes Yes YesNumber of Observations 21,793 9,056 12,737 21,793Overall-R2 0.018 0.040 0.026 0.019
36

Table 7: Average Treatment Effect for the Treated (ATT) of Corporate Distress on CEOTurnover Rates
This table reports the difference-in-differences estimates of the average treatment effect for the treated
(ATT) of financial distress on CEO turnover rates, using Abadie and Imbens’ (2011) bias-corrected matching
estimator. Event periods are measured relative to period 0, the year of distress occurrence. Panel A and
Panel B contain results by various multi-year windows and year-by-year, respectively. Robust standard
errors are reported in parentheses. *, ** and *** denote significance at 10%, 5% and 1%, respectively.
Panel A. CEO Turnover Rates by Multi-Year WindowsPeriod [-1,+1] [-1,+2] [-1,+3] [-2,+2] [-2,+3] [-3,+3]
Full Sample
CEO Turnover Rate 0.17*** 0.18*** 0.20*** 0.19*** 0.20*** 0.19***(0.04) (0.04) (0.04) (0.04) (0.04) (0.04)
Number of Observations 2,528 2,528 2,528 2,528 2,528 2,528
Pre-2004 Subperiod
CEO Turnover Rate 0.16*** 0.21*** 0.23*** 0.23*** 0.24*** 0.24***(0.06) (0.06) (0.06) (0.06) (0.06) (0.05)
Number of Observations 1,273 1,273 1,273 1,273 1,273 1,273
Post-2004 Subperiod
CEO Turnover Rate 0.18*** 0.15*** 0.17*** 0.15*** 0.16*** 0.16***(0.05) (0.05) (0.05) (0.05) (0.05) (0.05)
Number of Observations 1,255 1,255 1,255 1,255 1,255 1,255
Panel B. CEO Turnover Rates Year-by-YearPeriod -2 -1 0 +1 +2 +3
Full Sample
CEO Turnover Rate 0.01 0.05* 0.15*** 0.02 0.07*** 0.10***(0.03) (0.03) (0.03) (0.03) (0.02) (0.03)
Number of Observations 2,526 2,525 2,523 2,512 2,520 2,174
Pre-2004 Subperiod
CEO Turnover Rate 0.02 0.01 0.14*** 0.06 0.12*** 0.12***(0.04) (0.04) (0.04) (0.05) (0.04) (0.04)
Number of Observations 1,272 1,273 1,272 1,267 1,269 1,010
Post-2004 Subperiod
CEO Turnover Rate 0.01 0.06* 0.15*** 0.01 0.03 0.08***(0.03) (0.04) (0.04) (0.03) (0.03) (0.03)
Number of Observations 1,254 1,252 1,251 1,245 1,251 1,164
37

Table 8: Average Treatment Effect for the Treated (ATT) of Corporate Distress on DifferentParts of CEO Compensation
Panels A and B of this table report the difference-in-differences matching estimates of the average
treatment effects for the treated (ATT) of corporate distress on predicted compensation and residual
compensation, respectively. For each level of CEO compensation, Total Current Compensation and Total
Direct Compensation, we regress it against the following four firm performance measures: return on assets
(ROA), one-year stock return, natural logarithm of market capitalization, and natural logarithm of total
assets, as well as industry dummies and year dummies, over the set of control firms to obtain parameter
estimates, then we apply the parameter estimates to both the controls and the distressed firms to calculate
predicted values and residuals. We name their respective predicted values as Expected Total Current
Compensation and Expected Total Direct Compensation, and their respective residuals as Unexpected Total
Current Compensation and Unexpected Total Direct Compensation. Total Current Compensation is the
sum of salary and bonus; Total Direct Compensation is the sum of Total Current Compensation, value of
restricted stock grants, Black-Scholes value of stock option grants, other annual short-term compensation,
payouts from long-term incentive plans, and all other long-term compensation. Event periods are defined
relative to Period 0, the year of distress occurrence. Robust standard errors are reported in parentheses. *,
** and *** denote significance at 10%, 5% and 1%, respectively.
Panel A. Estimates on Predicted CompensationPeriod -2 -1 0 +1 +2 +3
Full SampleExpected Total Current Compensation -0.16*** -0.29*** -0.66*** -0.46*** -0.53*** -0.58***
(0.03) (0.03) (0.03) (0.03) (0.03) (0.04)Expected Total Direct Compensation -1.11*** -1.75*** -3.59*** -2.29*** -2.84*** -3.06***
(0.17) (0.17) (0.19) (0.21) (0.20) (0.24)Number of Observations 2,535 2,534 2,531 2,519 2,525 2,182
Pre-2004 SubperiodExpected Total Current Compensation -0.18*** -0.37*** -0.70*** -0.52*** -0.59*** -0.72***
(0.06) (0.06) (0.06) (0.07) (0.07) (0.08)Expected Total Direct Compensation -1.43*** -2.25*** -3.99*** -2.77*** -3.32*** -4.00***
(0.38) (0.40) (0.38) (0.42) (0.40) (0.48)Number of Observations 1,278 1,279 1,278 1,271 1,272 1,016
Post-2004 SubperiodExpected Total Current Compensation -0.12*** -0.23*** -0.64*** -0.43*** -0.50*** -0.52***
(0.02) (0.02) (0.04) (0.04) (0.04) (0.05)Expected Total Direct Compensation -0.77*** -1.34*** -3.35*** -2.04*** -2.53*** -2.61***
(0.10) (0.11) (0.20) (0.23) (0.22) (0.28)Number of Observations 1,257 1,255 1,253 1,248 1,253 1,166
Panel B. Estimates on Residual CompensationPeriod -2 -1 0 +1 +2 +3
Full SampleUnexpected Total Current Compensation -0.08 0.02 0.26*** 0.12 0.14 0.17
(0.07) (0.10) (0.09) (0.11) (0.11) (0.12)Unexpected Total Direct Compensation -0.97 -0.14 0.88 -0.76 0.00 0.95
(0.85) (0.71) (0.89) (0.71) (0.69) (0.74)Number of Observations 2,535 2,534 2,531 2,519 2,525 2,182
Pre-2004 SubperiodUnexpected Total Current Compensation -0.20* 0.07 -0.09 -0.27* -0.23 0.07
(0.12) (0.16) (0.13) (0.15) (0.14) (0.17)Unexpected Total Direct Compensation -3.73* -0.09 0.87 -1.65 -0.36 1.17
(2.03) (1.45) (1.94) (1.45) (1.43) (1.73)Number of Observations 1,278 1,279 1,278 1,271 1,272 1,016
Post-2004 SubperiodUnexpected Total Current Compensation -0.01 0.04 0.49*** 0.40*** 0.43*** 0.31*
(0.09) (0.14) (0.14) (0.15) (0.14) (0.17)Unexpected Total Direct Compensation 0.06 -0.03 1.22** -0.11 0.14 0.52
(0.42) (0.49) (0.51) (0.48) (0.48) (0.57)Number of Observations 1,257 1,255 1,253 1,248 1,253 1,166
38

Figure 1: Evolution of Outcome Variables over Calendar Years: Treated versus PotentialControls
This figure plots the means of outcome variables measuring managerial influence over the board and CEO
compensation over the calendar years. Firms are grouped by their treatment status. See Table 3 for
definitions of the outcome variables. The sample period is 1992-2019, and the year of distress occurrence is
from 1995 through 2016.
CEO Duality (in proportions) CEO Turover (in proportions)
Inside Directors (in proportions)
Executives in Compensation Committee (in proportions)
Corporate Governance Score (in standardized units)
Total Current Compensation (in $millions)
Total Direct Compensation (in $millions)
The means of variables by treatment status over calendar years. See Table 3 for detailed defintions of these variables.
0.1
0.3
0.5
0.7
1995 1998 2001 2004 2007 2010 2013 2016Distressed Non‐distressed
0.95
0.96
0.97
0.98
0.99
1
1995 1998 2001 2004 2007 2010 2013 2016
Distressed Non‐distressed
0
0.05
0.1
0.15
0.2
1995 1998 2001 2004 2007 2010 2013 2016Distressed Non‐distressed
‐1
‐0.5
0
0.5
1
1995 1998 2001 2004 2007 2010 2013 2016Distressed Non‐distressed
0.5
1.5
2.5
3.5
1995 1998 2001 2004 2007 2010 2013 2016Distressed Non‐distressed
0
2
4
6
8
10
1995 1998 2001 2004 2007 2010 2013 2016Distressed Non‐distressed
0
0.1
0.2
0.3
1995 1998 2001 2004 2007 2010 2013 2016Distressed Non‐distressed
39