Embed Size (px)
Citation preview

Alma Mater Studiorum – Università di Bologna
Dottorato Di Ricerca In Economia – Ciclo XXIV
Settore Concorsuale di afferenza: 13/A4
Settore Scientifico disciplinare: SECS-P/06
Essays On CEO Compensation: New Evidence On The Managerial-Power
Vs. Optimal Contracting Debate
Presentata da: Giuliano Bianchi
Coordinatore Dottorato: Prof. Giacomo Calzolari Relatore: Prof. Hartmut Lehmann
Esame finale anno 2013

ii
Acknowledgements
I sincerely extend my heartfelt gratitude to everyone who helped me complete this
dissertation. I am particularly grateful to my supervisor Professor Richard Freeman for sharing
many Sunday afternoons with me going over my research. He taught me the scientific method of
doing research, and more important, he successfully shared with me his unwavering passion and
enthusiasm for research.
I am likewise thankful to my supervisor Professor Hartmut Lehmann for his invaluable
comments and suggestions.
I also thank my colleague and friend Michele for the insightful and intellectually
challenging discussions.
Finally, I wish to thank my family for their unceasing support. Thank you to my wife Ingrid
Johana for her unconditional love and understanding. Thank you as well to my father Roberto for
his good example and for his pieces of advice “when the game became harder” (in a PhD degree,
things inevitably become harder). I likewise extend my thanks to my brother Alessio, who always
finds a way to cheer me up and make my educational journey seem less daunting, as well as my
sister Federica for constantly reminding me that the game cannot be any harder than the day we
stood in front of a barometer in France that read “storm,” but our father “disagreed” vehemently
with the reading. This “barometer experience” taught me a priceless lesson: we can always disagree
with science, but it would be better if we do so with an umbrella. Finally, I am grateful to my
mother, Myrna, for all the love and unending assistance that helped me accomplish my research.
This dissertation is entirely dedicated to her!

iii
Abstract
This dissertation analyzes the impact of an indicator of the likely future change in a firms’
stock price – market analysts’ expectations of share prices – on executive compensation. It
examines how well the estimated effects of analysts expectations of share prices on compensation
fit with two competing views of the determination of executive compensation: the arm’s length
bargaining model, which assumes that pay results from bargaining between the executives and a
board of directors that seeks to maximize shareholders’ interests, and the managerial power model,
which assumes that the board and top executives seek to maximize managers’ compensation within
the constraint imposed by social costs and market penalties (Bebchuk et al. 2005). I focus on the
pay of CEOs as the CEO is the most visible and important executive in a firm.
The first chapter documents the pattern of CEO pay from fiscal year 1996 to 2010. It uses
the Execucomp data set of executive compensation reported on corporate financial statements,
which is the most widely used data set for studies of executive pay and the Thomson-Reuters
Insider Filing Data Feed (IFDF) on stock options and other derivatives paid to executives that firms
report to the Security Exchange Commission. These two data sets complement one another. The
Execucomp data set contains detailed information on cash compensation but only limited
information on options and derivatives. The IFDF data contains the details of options but no
information on salaries. I show that the number of options reported in the two datasets is highly
correlated (except in 2006 when Execucomp changed the mode of reporting options), which
justifies my combining them into a single data set. I find that CEO pay rose by $2.7 million
between 1996 and 2010, with most of the increase taking the form of greater stock-based
compensation. I find a huge growth in stock options from 1996 to 2001 when the stock market had
its dot.com boom. I also document that the percentage of options that were paid on a regular
scheduled basis (“scheduled options”) increased by almost 25% between 1997 and 2010 while the

iv
practice of backdating options, which was common in the 1990s, disappeared.
The second chapter analyzes the Institutional Broker Estimate System (IBES) Detail History
Price Target data file, a dataset that contains analysts’ price targets for firms. This data has not
previously been examined in terms of its relation to executive compensation. The price target data is
an indicator of the likely future change in a firms' stock price. I show that the number of price target
announcements issued by analysts is positively associated with company share price’s volatility and
that price targets are broadly predictive of changes in the value of the stocks. I also find that when
analysts announce positive (negative) expectations of future stock price, share prices change in the
same direction in the short run, which indicates that investors incorporate analysts’ information in
their assessment of firms. Given that the price target announcements are useful information about
share prices, it is reasonable to expect that executives and boards will use them to help determine
executive compensation. A positive price target should make stock options more valuable to an
executive whereas a negative target makes salary compensation more valuable.
The third chapter analyzes the impact of price targets from the IBES Detail Price History
Target database on executive compensation. I find that analysts' price targets alter the composition
of executive pay between cash-based compensation and stock-based compensation. When analysts
forecast a rise in the share price for a firm, the compensation package tilts toward stock-based
compensation. When analysts forecast a fall in the share price, the compensation package tilts
toward cash-based compensation. This pattern is more readily explicable by the managerial power
model than the arm’s length bargaining model of the determination of executive compensation.
Consistent with the managerial power interpretation, the effect of analysts’ price targets on the
compensation package is stronger in companies that have weaker corporate governance.
The fourth chapter explores the impact of the introduction of the Sarbanes-Oxley Act (SOX)
in 2002 and the Security and Exchange Commission's implementation of the Act in 2006 on the
options granting process. I show that the introduction of SOX and its implementation educed and

v
eventually eliminated the practice of backdating options (giving options at time t but dating them at
some earlier time when the share price was lower). But it is also associated with greater “spring
loading” of option grants around analysts’ price targets announcements (timing the granting options
so that executives receive options after bad price announcements or before good price
announcements). An increased proportion of options were granted around the time of analysts’ price
targets announcements from 1996 to 2010 while the number of options granted independently of the
announcements fell. I argue that an ideal contracting board and a rent-seeking managerial power
board will use the information in the future expected share price differently in setting executive pay.
The shift from backdating to spring loading after enactment of SOX and the relation between
options and the analysts price targets are more readily explicable by the managerial power model
than the arm’s length bargaining model.

vi
Table of Contents
Acknowledgements ...................................................................................................................................... ii Abstract ........................................................................................................................................................ iii Table of Contents ........................................................................................................................................ vi General Introduction .................................................................................................................................. 1
Figure 1: Evolution of the Gini Index by countries from 1970 to 2004. ............................................................................ 1 Chapter One: New Evidence on CEOs’ Compensation ...................................................................... 5 1. Introduction ....................................................................................................................................................... 6
Table 1.1: Articles on CEO compensation in Pro-Quest Data-Base. ................................................................................. 8 2. Execucomp data files .................................................................................................................................... 10
Figure 1.1: Pay in columns. ............................................................................................................................................................. 10 Table 1.2: Average year-to-year changes for same companies in total compensation in thousands of dollars. . 12 Figure 1.2: Pay in columns. ............................................................................................................................................................. 14
3. Thomson-‐Reuters Financial Insider Filling Database ...................................................................... 14 Table 1.3: Characteristics of options granted, 1996-2010. .................................................................................................... 16 Table 1.4: Stock options vesting period and maturity. ........................................................................................................... 18
4. Linking Execucomp and IFDF .................................................................................................................... 18 Table 1.5: Granting days per year. ................................................................................................................................................ 19 Figure 1.3: Total number of stock options granted to CEOs reported by IFDF and Execucomp by fiscal year. 22 Table 1.6: Correlation between the number of options granted to CEOs estimated from IFDF and reported by Execucomp. ........................................................................................................................................................................................... 23
5. Conclusion ....................................................................................................................................................... 23 Appendix 1.A: Some details on constructing the dataset ..................................................................... 25
1.A.1 Thomson Financial Insider Filling Database ................................................................................................... 25 Table 1.7: The accounting procedure. The sample extracted from IFDF. ....................................................................... 26 Table 1.8: Scheduled options according to different scenarios. ......................................................................................... 28
1.A.2 Compustat .................................................................................................................................................................... 28 Chapter Two: Price Targets Accuracy and Timing: Evidence from IBES's Price Targets Data Set ................................................................................................................................................................. 31 1. Introduction .................................................................................................................................................... 31 2. Background ..................................................................................................................................................... 31 3. Data and analysis .......................................................................................................................................... 34
Table 2.1: Analysts’ horizons. ........................................................................................................................................................ 35 Table 2.2: Summary statistics by years. ...................................................................................................................................... 36 Table 2.3: Typical broker firm and analyst. ............................................................................................................................... 38 Table 2.4: Typical analyzed company. ........................................................................................................................................ 39 Table 2.5: Announcements per company and year: summary statistics. .......................................................................... 40 Figure 2.1: Announcements per company and calendar year. ............................................................................................. 41 Table 2.6: Multivariate analysis of the effects of share price volatility on the number of announcements per firms in IBES datasets from 1999 to 2010. Estimates are reported. *, **, *** indicate significance at 10%, 5% and 1% levels respectively. The t-statistic are reported in parentheses. ........................................................................... 41
4. Key issues in using price target data in analyzing stock options .................................................. 42 4.1 Is there information in analysts’ price targets? ............................................................................... 42
Table 2.7: Testing analysts' forecast. Estimates are reported. *, **, *** indicate significance at 10%, 5% and 1% levels respectively. The t-statistic are reported in parentheses. ................................................................................... 44 Table 2.8: Testing price targets' effect on share price. Estimates are reported. *, **, *** indicate significance at 10%, 5% and 1% levels respectively. The t-statistic are reported in parentheses. ........................................................ 46 Table 2.9: Scheduled price target’s announcements. .............................................................................................................. 48
6. Conclusion ....................................................................................................................................................... 49 Appendix 2.A: Price targets accuracy: two different models .............................................................. 50
Table 2.10: Testing analysts' forecast. Estimates are reported. *, **, *** indicate significance at 10%, 5% and 1% levels respectively. The t-statistic are reported in parentheses. ................................................................................... 50 Table 2.11: Testing analysts' forecast. Estimates are reported. *, **, *** indicate significance at 10%, 5% and

vii
1% levels respectively. The t-statistic are reported in parentheses. ................................................................................... 51 Chapter Three: The Effect of Price Targets on the Composition of CEO Pay ........................... 52 1. Introduction .................................................................................................................................................... 52 2. Background ..................................................................................................................................................... 53 3. Data ................................................................................................................................................................... 56 4. Trade-‐off between cash-‐based compensation and stock-‐based compensation ...................... 57
Table 3.1: Multivariate analysis of substitution between cash-based compensation and stock-based compensation for CEOs for the period from 1999 to 2010. Estimates are reported. *, **, *** indicate significance at 10%, 5% and 1% levels respectively. The t-statistic are reported in parentheses. .......................... 60
4.1 Price targets and Non-‐equity incentives and LTIP .......................................................................... 61 Table 3.2: Multivariate analysis of the effects of price targets on non-equity incentive for the period from 2006 to 2010. Estimates are reported. *, **, *** indicate significance at 10%, 5% and 1% levels respectively. The t-statistic are reported in parentheses. ............................................................................................................................................. 65
5. Corporate governance structure ............................................................................................................. 66 Table 3.3: Substitution between cash-based compensation and stock–based compensation for CEOs for the period from 1999 to 2010 by CEO subgroups. Estimates are reported. *, **, *** indicate significance at 10%, 5% and 1% levels respectively. The t-statistic are reported in parentheses. ................................................................... 68
8. Discussion ........................................................................................................................................................ 68 Appendix 3.A: Scheduled vs. unscheduled options ................................................................................ 71
Table 3.4: Distribution of options around price targets announcements. ......................................................................... 72 Table 3.5: Multivariate analysis of the effects of price targets on options from1999 to 2010. Estimates are reported. *, **, *** indicate significance at 10%, 5% and 1% levels respectively. The t-statistic are reported in parentheses. ........................................................................................................................................................................................... 74
Appendix 3.B: Dot.com companies .............................................................................................................. 74 Table 3.6: Multivariate analysis of the effects of price targets on Execucomp firms and on Execucomp firms excluded dot.com companies from 1999 to 2010. Estimates are reported. *, **, *** indicate significance at 10%, 5% and 1% levels respectively. The t-statistic are reported in parentheses. ........................................................ 76
Chapter Four: Stock Options: the End of Backdating ..................................................................... 79 1. Introduction .................................................................................................................................................... 79 2. Data and methodology ................................................................................................................................ 82
Table 4.1: Stock options granted before/after or independently from price targets announcements. ..................... 84 3. Backdating ....................................................................................................................................................... 85
3.1 Multivariate analysis .................................................................................................................................................... 85 Table 4.2: Multivariate analysis of the effects of law on timing strategy of granting options from 1999 to 2010. Estimates are reported. *, **, *** indicate significance at 10%, 5% and 1% levels respectively. The t-statistic are reported in parentheses. ............................................................................................................................................................. 88
4. Backdating, price targets and the law .................................................................................................... 89 4.1 Managerial dominated board vs. arms-length bargaining board ................................................................... 89
Table 4.3: Different strategy adopted by both ideal and rent-seeking board before and after the introduction of the SOX according to different price targets scenarios (positive vs. negative). ............................................................. 92 Table 4.4: t-tests. ................................................................................................................................................................................. 93
4. Conclusion ....................................................................................................................................................... 93 Appendix 4.A ....................................................................................................................................................... 95
Table 4.6: Multivariate analysis of the effects of law on timing strategy of granting options from 1999 to 2010. Estimates are reported. *, **, *** indicate significance at 10%, 5% and 1% levels respectively. The t-statistic are reported in parentheses. ............................................................................................................................................................. 95
Conclusion .................................................................................................................................................. 96 Terminology ............................................................................................................................................. 100 A. Stock options glossary ............................................................................................................................... 100 B. Execucomp terminology ........................................................................................................................... 101

1
General Introduction
Since at least the 1980s inequality of income in the US has been high and rising (see
figure 1). Part of the increase is associated with a huge jump in the ratio of top executive
compensation to the compensation of ordinary workers. At this regard, Schlozman et al. (2005)
found that Americans consider certain jobs, such as CEOs, overpaid. Lazonick (2010) argues
that the ballooning compensation of executives is the main cause behind the increase in
inequality in U.S. The way CEOs are paid has attracted the attention of the press as well as the
one of the academic literature, becoming one of the hot topics in the last years.
Figure 1: Evolution of the Gini Index by countries from 1970 to 2004.
Academic views about CEO and other high level executive compensation fit into two
groups. On one side, some researchers believe that the inequality arising from top executive
compensation package is efficient. Independent boards of directors set incentive schemes
USA
UKITA
CHEFRAGER
JPN
CAN
2530
3540
45G
ini I
ndex
1970 1980 1990 2000 2010year
Canada FranceGermany ItalyJapan SwitzerlandUnited Kingdom United States

2
(bonuses and stock-based compensation such as stock options) for executives to align
managements’ interest to those of the shareholders, which ultimately maximizes shareholder’s
interests. On the other side, some analysts argue that managers use private information to
structure compensation for their benefit at the expense of shareholders. Management appoints
persons to the board of directors who are likely to weigh management heavily in setting
compensation so that rather than solving principal-agent problems, incentive schemes are part
of the agency problem itself.
Bebchuk et al., (2003) explore how the two models influence top executive
compensation. They argue that the observed pay structure is most likely a compromise between
market forces, which mitigates managerial rent-seeking, and managerial-power that favors top
executive compensation. Murphy (2002) questions the ability of both the arm’s length
bargaining model and the managerial power model to fit the observed pattern of executive pay.
He shows that both models can explain the rise in CEO’s compensation under different
assumptions but highlights inconsistencies between the evidence and the managerial power
model, such as the coincidence of increased CEO pay and greater board independence; the
attractive compensation packages awarded outsiders to join top management. He favors a
“perceived-cost view” – that assumes that risk adverse executives cannot hedge the risk of
options (which implies that the Black-Scholes formula overvalues them1 and that company's
underestimate the cost of granting options to executives, which yields conclusion similar to
those offered by the managerial power model but with different policy implications (Murphy,
2002; Hall et al., 2003). Reviewing empirical studies, Frydman et al. (2010) conclude, “both
managerial-power and competitive market forces are important determinants of CEO pay” but
leave open the question of their relative importance.
1 The Black Scholes formula commonly used to evaluate the stock options value assumes that the holder can sell the options or hedge the risk. Executives, however, cannot diversify their portfolio fully invested in the company and thus their options are overvalued.

3
My dissertation contributes to the existing debate over which model better explains
CEOs compensation and ultimately contributes to understanding the part of the rise in
inequality in U.S. associated with increased executive pay. Specifically, my thesis examines
how the two main models of the determination of executive pay – the arm’s length bargaining
model and the managerial power model- account for estimated relations between expected
share prices and compensation. I analyze the impact of an indicator of the likely future change
in a firms' stock price on executive compensation. The indicator is the expectations that market
analysts give for the firms' share price in the next year as reported by the Institutional Broker
Estimate System in its Detail Price History Target data base. The share price that analysts
expect for a firm in the future has not, to my knowledge been previously analyzed in studies of
executive compensation. I show that the way in which it affects the composition of executive
compensation provides insights into the determinants of executive pay.
The thesis has four chapters.
Chapter one documents the changes in the ways in which firms compensated CEOs
from fiscal year 1996 to 2010, as given in the widely used Execucomp data set that obtains
information on executive compensation from corporate financial statements and as given in the
less widely used Thomson-Reuters Insider Filing Data Feed (IFDF) on stock options and other
derivatives paid to CEOs that firms report to the Security Exchange Commission.
Chapter two analyzes the Institutional Broker Estimate System (IBES) Detail History
Price Target data file, a unique, comprehensive and richly detailed data set that portrays
analysts’ price targets, an indicator of the likely future change in a firms' stock price. Focusing
on US firms only, I show that the number of price targets announcements issued by analysts is
positively associated with company share price’s volatility and that price targets are
informative about future share prices and that positive (negative) announcements are followed
by an increase (decrease) in share price shortly afterward, which implies that investors
incorporate analysts’ information and adjust share prices according to announcements.

4
Chapter three analyzes the impact of price targets, as reported by the Institutional
Broker Estimate System in its Detail Price History Target data base, on executive
compensation. I find that analysts' price targets alter the composition of executive pay between
cash-based compensation and stock-based compensation. When analysts forecast a rise in the
share price for a firm, its compensation package tilts toward stock-based compensation. When
analysts forecast a fall in the share price, the compensation package tilts toward cash-based
compensation. This pattern is more readily explicable by the managerial power model than the
arm’s length bargaining model. Consistent with this interpretation, the trade-off is stronger in
companies that have weaker corporate governance.
Chapter four explores the impact of the Sarbanes-Oxley Act in 2002 and the Security
and Exchange Commission's implementation of the law in 2006 on the options granting
process. I show that the new law essentially eliminated backdated options but led firms to
substitute spring loading options by timing them strategically around analysts’ price targets
announcements (forward-looking strategy). I test which model (length-arm bargaining model
vs. the managerial power model) fit most the results and I found that the evidence is more
readily explained by a rent-seeking model.

5
Chapter One: New Evidence on CEOs’ Compensation
Over the last decades, the magnitude and mode of compensation of CEOs in the US has
changed greatly. In this chapter I document the changed way in which firms compensated
CEOs from fiscal year 1996 to 2010. I combine data from the Execucomp data set2 that obtains
information on executive compensation from corporate financial statements with data from the
Thomson-Reuters Insider Filing Data Feed (IFDF)3 on stock options and other derivatives paid
to CEOs that firms report to the Security Exchange Commission. Execucomp is the most
widely used data set in the literature on executive compensation. It contains information on all
components of executive pay but has only limited information on options. The IFDF has
complete information on the details of options but not information on salary or other forms of
compensation. To see whether the two data sets are sufficiently comparable to be melded into a
single data set for analysis, I compare the one variable that they both report - the number of
stock options/derivatives granted to CEOs. There are some differences between the number of
options reported in the two datasets but they are sufficiently highly correlated to support my
combining them for some analysis.
Before presenting the data I review briefly the debates over the determination of
executive pay and, in particular, the role of stock-based pay as a mode of aligning the
incentives of executives with the interests of shareholders that guides my analysis of the
changes in compensation over time.
2 Execucomp collects top executive compensation detailed information directly from company's annual proxy statement (DEF 14A SEC). 3 The Insider Filing Data Feed (IFDF) reports U.S. insider activities filled on Form 3, 4, 5, or 144. Table II capture official grant date, the exercise date, the expiring date and the exercise price of any insider's derivative grants.

6
1. Introduction
Proponents of the principal-agent model of pay have stressed the ways in which a board
of directors can institute incentive schemes to reduce the agency costs from separation of
ownership and control and improve shareholder value. Ideally, such compensation systems
align executives’ interests to those of shareholders (Jensen et al., 1976; Fama et al., 1983;
Eisenhardt, 1989; Dalton et al., 2007). Consistent with such arguments, firms increased stock-
based compensation considerably in the last decades.
A board that seeks to motivate executives with different forms of pay should equate the
marginal cost to the firm of additional option or stock or other form of compensation to the
extra benefits from inducing executives to make decisions in the shareholders' interests.
Adherents of the view that executive compensation has a substantial positive impact on
economic performance of firms believe that performance depends critically on managerial
skills, and that boards negotiate stock-based compensation to create incentives for a manager to
raise the share price, which they take as the best measure of the long term value of a firm. More
able or skilled managers are more likely to accept stock-based compensation than less skilled
managers.
Critics of executive compensation argue that because executives influence membership
on a board that boards make decisions about compensation that benefit executives at the
expense of shareholders, and/or that executives find ways to game whatever incentive system
the board sets to enrich themselves. Bebchuk et al, (2005) notes that the increase in equity-
based compensation “has not been accompanied by a substitution effect, i.e. a reduction in non-
equity compensation”, which suggests that the stock-based incentive system may simply be a
new mode for executives to enrich themselves. But without evidence on the true marginal value
of an executive it is also possible that their value increased over time and that firms increased
equity-based compensation in line with increased value. The US system of basing executive

7
options on the share price of a firm rather than on the share price of the firm relative to that of
competitive firms or to the stock market broadly is also suggestive of a system run for the
benefit of executives. Under the US system, management can profit from fortuitous increases in
the firm's share price -good luck- that have nothing to do with their effort (Bertrand et al.,
2001), by general inflation in share prices, or by using their inside information to time the
receipt of options in ways that would most benefit them.
Summarizing the debate, Bebchuk et al. (2003, 2004) divide adherents and critics of
executive compensation into two opposing camps. On the one side are adherents to “the arm’s
length bargaining model” that posits that boards of directors try to maximize shareholders’
interests subject to the constraint set by executives’ supply behavior -paying the amount and
nature of compensation that is necessary for potential executives to accept a job and to spend
their time and effort finding ways to increase the value of shares. The package is the result of
arm’s length transaction between the board seeking the best deal for shareholders and
executives selling their skills. On the other side is the “managerial-power” model, which
assumes that the board seeks to maximize managers’ compensation within the constraints
imposed by social costs and market penalties. Under the managerial power model the board of
directors seeks the most favorable compensation for executives under the threat of market
penalties and social costs that rise when it adopts excessively favorable arrangements for
executives (Bebchuk et al., 2005).
Bebchuk et al. (2005) find that both models help explain the increase in top executives’
compensation. In their recent review of the executive compensation literature Frydman et al.
(2010) reach a similar conclusion: “both managerial-power and competitive market forces are
important determinants of CEO pay, but that neither approach is fully consistent with the
available evidence.”
The increases in executive pay, public concerns over that pay, and the existing of two
competing schools of thought have made executive compensation a hot area among academic
8
researchers. I typed the keywords “CEO compensation” in Pro-Quest Central, a database of
periodical content featuring scholarly journal, trade publications, newspaper, magazines and
other reports and found 315 scholarly articles in 1996. Ten years later the number of article
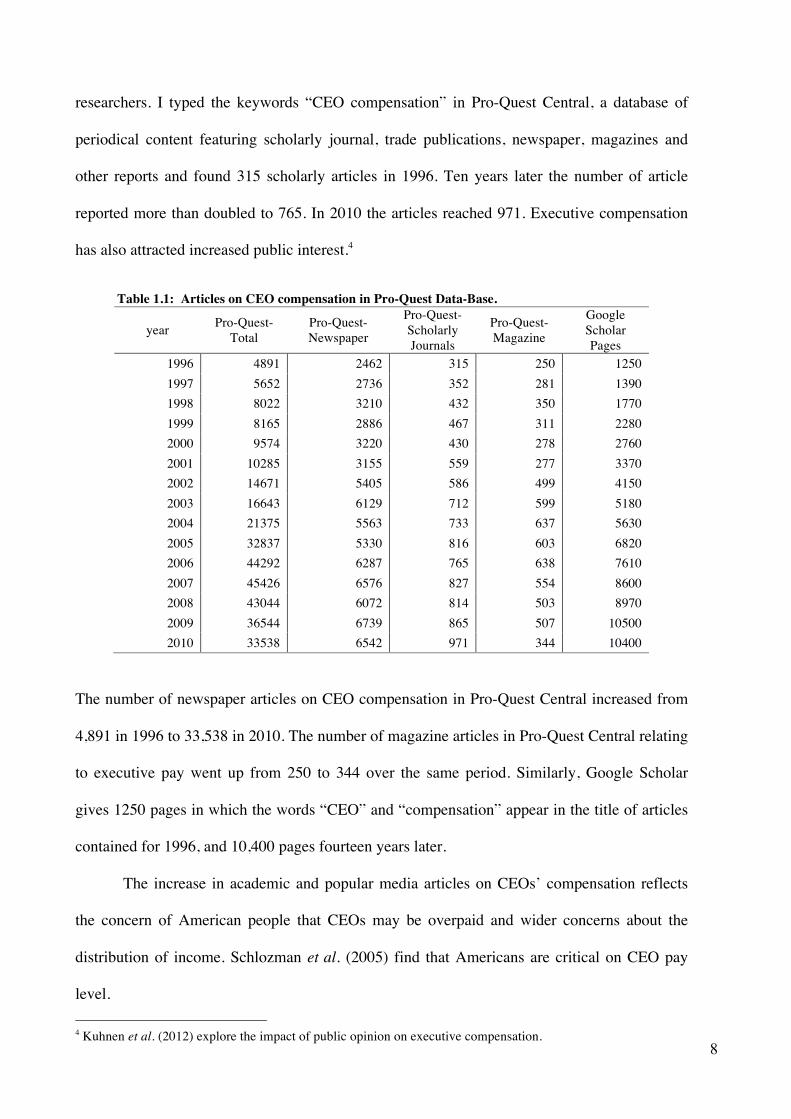
reported more than doubled to 765. In 2010 the articles reached 971. Executive compensation
has also attracted increased public interest.4
Table 1.1: Articles on CEO compensation in Pro-Quest Data-Base.
year Pro-Quest-Total
Pro-Quest- Newspaper
Pro-Quest-Scholarly Journals
Pro-Quest- Magazine
Google Scholar Pages
1996 4891 2462 315 250 1250 1997 5652 2736 352 281 1390 1998 8022 3210 432 350 1770 1999 8165 2886 467 311 2280 2000 9574 3220 430 278 2760 2001 10285 3155 559 277 3370 2002 14671 5405 586 499 4150 2003 16643 6129 712 599 5180 2004 21375 5563 733 637 5630 2005 32837 5330 816 603 6820 2006 44292 6287 765 638 7610 2007 45426 6576 827 554 8600 2008 43044 6072 814 503 8970 2009 36544 6739 865 507 10500 2010 33538 6542 971 344 10400
The number of newspaper articles on CEO compensation in Pro-Quest Central increased from
4,891 in 1996 to 33,538 in 2010. The number of magazine articles in Pro-Quest Central relating
to executive pay went up from 250 to 344 over the same period. Similarly, Google Scholar
gives 1250 pages in which the words “CEO” and “compensation” appear in the title of articles
contained for 1996, and 10,400 pages fourteen years later.
The increase in academic and popular media articles on CEOs’ compensation reflects
the concern of American people that CEOs may be overpaid and wider concerns about the
distribution of income. Schlozman et al. (2005) find that Americans are critical on CEO pay
level. 4 Kuhnen et al. (2012) explore the impact of public opinion on executive compensation.

9
The academic research and public concern motivate my documenting in this chapter the
changes in CEO compensation during the 1996-2010 period. My analysis of the data shows that
CEO pay rose during the dot-com bubble to reach a maximum in nominal term in 2000, after
which it decreased until 2004 and then began increasing again. The components of
compensation also changed in this period. There was a huge increase in the share of executive
compensation that took the form of stock-based compensation. Stock options increased to
become the largest single component of compensation in 2000/2001. The vast majority of
options granted to CEO were at the money with the vesting period centered around one to three
years. The practice of backdating options – in which firms give an option at time t but report
that it was given in t-1, when the price of shares was much lower, proliferated in the 1990s,
then fell after the 2002 Sarbanes-Oxley Act strengthened reporting requirements. Backdating
disappeared when the SEC strengthened the reporting rules so that backdating became nearly
impossible to carry out. The data also show a substantial drop in the use of options in the late
2000s, with compensation shifting to restricted stock grants and to non-equity incentives,
possibly as an alternative to stock options, for aligning the interests of executives and share-
holders (arm’s length bargaining model) or as an alternative way to enrich executives
(managerial power model).
I describe next the sources of data that I use to measure the changing level and
composition of executive pay and note the strengths and weaknesses of the data.
To construct my dataset for analyzing executive compensation I use three different
sources of data. First, I obtained data on the components of top executive compensation, like
salary, bonuses, restricted stock and value of stock options granted from the Execucomp files of
Compustat. This is the most widely used source of data on top executive compensation in
academic studies. But because it does not provide much detail on the stock options that have
become such an important part of executive compensation, I went to a second less widely used
data set: the Thomson Financial Insider Filling (IFDF) database that provide detailed

10
information regarding stock options granted to CEOs, such as grant date, exercise price,
expiration date, number of derivatives and the number of shares granted to insiders from 1996
to 2011. Finally, to evaluate options and to measure whether they are backdated or otherwise
granted in ways that benefit executives independent of the incentive effects, I obtained firms’
daily stock price from Center for Research in Stock Price (CRPS).
2. Execucomp data files
Standard & Poor's Executive Compensation data set (Execucomp) collects top
executive compensation data from company's annual proxy statement (DEF 14A SEC) for the
S&P 1500 companies and others. I use the data for fiscal year 1996 through fiscal year 2010. In
addition, I have obtained data about the firms from Compustat.
Figure 1.1: Pay in columns.
Figure 1.1 shows the amount of nominal dollars in each component of compensation for
CEOs in the Execucomp files. The figure stacks the data for each form of pay, and thus
provides a picture of both the level and composition of CEO pay from fiscal year 1996 to 2010.
02,
000
4,00
06,
000
8,00
0
1996 1997 1998 1999 2000 2001 2002 2003 2004 2005 2006 2007 2008 2009 2010
Mea
n CE
Os
Pay
($00
0s)
Salary BonusOptions StockLTIP DeferredOthers Non-Equity Incentive

11
The top of each bar measures the average level of total compensation. The different elements
show the average level of each component: salary, bonus, stock options, shares, long term
incentive payout, deferred compensation, non-equity incentive plan and other forms of
compensation. Total CEO compensation increased from a bit more than $3 million in 1996 to
$5.7 in 2010. The increase was very large from 1996 to 2000 during the dot.com boom. Total
compensation reached a maximum in 2000, and then declined through 2004 after which it
started to rise again. However, nominal compensation in 2010 was still lower than in 2000.
The increase in executive compensation over the entire period took the form mainly of
an increase in stock-based compensation. In 1996 stock-based compensation constituted 55%
of total compensation (calculated as the sum of salary, bonus, options, stock, LTIP, deferred
compensation, non-equity and others compensation). In 2000 stock-based compensation was
nearly 74%. Most of the increase in stock-based compensation took the form of increased stock
options so that by 2000 stock options constituted approximately 67% of total compensation.
Thereafter, stock-based compensation shifted from options to restricted stock grants. In 2010,
stock grants constituted about 35% of total compensation. Salaries, by contrast, increased more
modestly – from $550,000 in 1996 to $822,000 in 2010. The salary share of total compensation
fell from 18% of total compensation to 14% of total compensation.
Because the Execucomp sample of firms changes over time, it is possible that the
averages in figure 1.1 are distorted, at least in terms of firms' experiences, by the changing
composition of the sample. To see how salaries of an unchanged sample of firms changed over
the period, I took firms which appeared in consecutive years of Execucomp and calculated the
yearly change in total compensation year by year. For instance, if a firm in Execucomp
reported total CEO compensation of $992,722 in 1997 and total CEO compensation of
$1,176,401 in 1998, I computed the difference between the two years. I averaged the
differences across all the firms that had data on compensation in both years. Table 1.2 below
gives the average of the differences in thousands of dollars.

12
Table 1.2: Average year-to-year changes for same companies in total compensation in thousands of dollars. year Change for fixed sample
over previous year Cumulative Change
1996-1997 794
1998 834 1628
1999 799 2427
2000 1794 4221
2001 -566 3655
2002 -1139 2516
2003 -354 2162
2004 648 2810
2005 239 3049
2006 127 3176
2007 15 3191
2008 -168 3023
2009 -563 2460
2010 950 3410
The cumulative sum of all the changes in the line for 2010, $3,410, estimates the change
in average pay for the sample of firms that were unchanged in each year. This number exceeds
a change in average executive compensation from 1996 to 2010 for the sample of firms that
reported in 1996 and 2010 of 2.7 million. The higher estimated change from year to year
presumably suggests that firms appearing in consecutive years are reasonably successful and
thus more likely to have steadier increases in pay than the sample of firms whose identify
changes from year to year. But the overall pattern of change mimics closely the changes shown
in figure 1.1. Since the cumulative sum in table 1.2 peaks in 2000, this calculation confirms the
finding that total compensation reached a maximum in 2000.
There is an important change in the Execucomp data in 2006, when FAS123R changed
the reporting rules for company reports of stock options. Before 2006, Execucomp provides its
own fair award value estimates of the monetary worth of stock options granted using a non-
standard Black-Scholes formula. After 2006 companies had to report the estimated fair value of
the stock options granted in the proxy statement, and Execucomp decided to drop its method in

13
favor of the company reports. The SEC allows companies to use different methods of
evaluating options, including the Black-Scholes and the binomial options pricing model. The
result is that the data from 1966 to 2005 value stock options granted on the basis of
Execucomp's analysis, whereas the data from 2006 to 2010 value stock options granted on the
basis of the evaluations by each company.
The reason Execucomp used a non-standard Black-Scholes formula to value stock
options and the SEC allows firms to use their own methods of evaluation is that the Black-
Scholes formula is designed for European Options, which can be exercised only at the expiry
date, whereas almost all options traded in America are American Options, which can be
exercised any time up to the expiration date (Bodie et al., 2001).5 Since holders of the options
have greater leeway over when to exercise them they generally tend to have higher value than
the Black-Scholes formula. Indeed, empirical analysis shows that the Black-Scholes formula
tends to undervalue options deeply in the money but overvalue call options deeply underwater
(Bodie et al., 2001). Geske et al. (1984) give evidence that this result is due to the fact that
Black-Scholes model does not take into account the opportunity to exercise American options
earlier than European ones. Regarding the letter point, Compustat computes the Black-Scholes
value of the options by using 70% of the stated life. For instance, if the time to maturity is 10
years, Compustat reduces it to 7 years. Whaley (1982) shows that more complicated models do
better than Black-Scholes by taking into account early exercise. However, Bodie et al. (2001)
stress that many empirical studies show that Black-Scholes is a fair approximation of traded
options actual prices.
There is a further change in the SEC's compensation disclosure rules adopted in 2006
that affects the data. Before 2006, there was a distinction between short-term incentive pay and
long-term incentive pay (LTIP). In 2006 the SEC introduced a new terminology to isolate
5 Also, most options granted to CEOs can be exercised only after a certain period of time (vesting period) as shown in table 1.4. They are referred as “Bermudian” Options since they are a hybrid between American Options and European Options (Rubinstein, 1995).

14
executive incentive compensation paid in cash: non-equity incentive. The new category
encloses incentives awarded in cash that are earned if management meets certain performance
criteria. Prior to this, firms reported all short-term incentive paid in cash as part of the bonus
component of CEO compensation. Thus the new terminology shifted of cash compensation
previously reported under the label “bonus” to the new label “non-equity incentive”. Hence,
thereafter 2006, “bonus” defines cash earned by officers who met criteria that were not
disclosed, while it no longer reports LTIP.
Figure 1.2: Pay in columns.
Figure 1.2 illustrates the evolution of CEO compensation with the modes of
compensation regrouped for consistency over time by putting bonuses, long-term incentive
payout and non-equity incentive under a single label. This shows that incentives paid in cash
increased from 23% to 27% from 1996 to 2010.
3. Thomson-Reuters Financial Insider Filling Database
As noted, Execucomp does not provide details on the growing proportion of pay that is
02,
000
4,00
06,
000
8,00
0
1996 1997 1998 1999 2000 2001 2002 2003 2004 2005 2006 2007 2008 2009 2010
Mea
n CE
Os
Pay
($00
0s)
Salary Non-Equity Incentive & BonusOptions StockDeferred Others

15
stock-performance based. It has only limited evidence on the share options that became so
important in the late 1990s through the mid 2000s. To obtain detailed data on options granted
to executives I turn to the Thomson-Reuters data set, and in particular to Insider Filing Data
Feed (IFDF) Table II. From this table I obtain the official grant date, the exercise date, the
expiry date and the exercise price of insider's grants, which allows me to infer if the options
were scheduled (given at regular intervals from year to year) or unscheduled (given at irregular
times); were backdated; and if the options were granted at the money, out of the money, or in
the money. IFDF also provides the vesting period and the maturity period. In the data appendix
1.A I give detail of the methodology adopted to construct my dataset.
I focus on transaction involving CEOs for the fiscal year from 1996 to 2010. Table 1.3
summarizes statistics for CEO receipt of options from the IFDF Table II. The first three
columns show the fiscal year of the transaction, the number of firms in the data, and the
number of derivatives granted. The remaining columns show the characteristics of the options
granted in terms of the percentages that fit into different categories. Column 4 shows that
options are generally granted at the money but that the proportion granted at the money has
increased from 77% of all options in 1996 to almost 96% in 2010.
Column 5 reports the percentage of derivatives that I infer were backdated. I give the
full detail of how I estimated the number of backdated options in the appendix. The basic idea
is that whenever firms report an excessively large number of options on days when the share
price is especially low, they are likely to be backdating. If for instance firms can give options
on three days, it is reasonable to expect 1/3rd to be given on each day. If all the options are
given on the day with the lowest share price, that would be a sign of potential backdating. The
column shows a drop in inferred backdating after 2002. The most likely reason for this is the
enactment of the Sarbanes-Oxley Act of 2002, which imposed that companies notify within two
business days a change of ownership of officers’ options. There is another drop in the
percentage backdated in 2006 and 2007. The likely reason for this is that in 2006, the SEC

16
strengthened the 2-day rules in an attempt to further reduce backdating (Bickley et al., 2008).
In my analysis using a window of 41 days, the chance that an option would be granted at the
lowest value period within the option is 1/41 (2.44%). The average “% estimated backdating”
from 2007 to 2010 is 1.96%, which is a bit below though not statistically different from 2.44%,
so I conclude that backdating has essentially ended.
Table 1.3: Characteristics of options granted, 1996-2010.
Year Firms Transaction % At-the-Money
% Estimated Backdated
% Estimated Scheduled
% Estimated Unscheduled
% Unclassified
1996 728 1455 77.25% 6.80% - - - 1997 1272 2958 79.82% 5.14% 15.04% 30.87% 54.09% 1998 1417 3298 82.66% 4.24% 22.38% 38.93% 38.69% 1999 1600 4655 80.45% 5.11% 22.08% 37.79% 40.13% 2000 1774 7310 80.64% 5.43% 21.45% 41.07% 37.48% 2001 1996 16564 88.16% 9.51% 13.02% 45.97% 41.01% 2002 1976 20324 89.52% 4.32% 18.90% 53.53% 27.57% 2003 1987 21303 91.25% 3.12% 20.38% 49.15% 30.47% 2004 2046 23796 93.18% 3.69% 21.45% 48.63% 29.91% 2005 2001 20856 93.28% 3.17% 24.98% 45.57% 29.45% 2006 1805 19680 92.56% 1.57% 24.05% 46.61% 29.34% 2007 1819 21971 87.83% 1.76% 21.66% 44.06% 34.29% 2008 1849 23250 93.38% 2.06% 30.22% 40.17% 29.60% 2009 1765 20208 91.99% 2.07% 35.26% 43.65% 21.09% 2010 1475 15690 95.98% 1.72% 38.82% 38.77% 22.41%
Columns 6-8 give my estimates of the proportion of options that were granted at a
similar time from year to year, which I term “scheduled” options. Their antipode are the
proportion of options whose timing varies a lot from year to year, which I term unscheduled.
In addition, it shows the proportion of options that I cannot assign to either category because I
do not have consecutive year data. Since the coverage of firms increases over time and
becomes more consistent, the percentage unclassified declines from a high in 1997 to smaller
levels thereafter, albeit with year-to-year variation.
17
The key statistics are the proportions of options that I classify as scheduled versus
unscheduled. Between 1997 and 2002 the proportion of options in the unscheduled group
increased relative to the proportion in the scheduled group, while from 2003 to 2010 the
proportion of scheduled options increased relative to the percentage of unscheduled options, so
that in 2010 the proportion of options in the scheduled group becomes roughly the same as the
proportion of options in the unscheduled group. In appendix 1.A I discuss other methods for
differentiating scheduled and unscheduled options, which give similar results.
Since I estimate backdated options are those set at the minimum of a share price valley
backdated options should be disproportionately unscheduled. Computing the percentage
scheduled and unscheduled for options in the estimated backdating group, I find that 42% of
backdated options are unscheduled while only 18% of backdated options are scheduled. On the
contrary, 45% of non-backdated options are unscheduled compared to 25% of non-backdated
options are scheduled.
Table 1.4 gives statistics on the level and change in another feature of executive stock
options - the vesting period before executives can exercise the options. It shows a convergence
of the vesting period of options during the fiscal year from 1996 to 2010. On the one side,
“long term“ options - those with a vesting period of more than five years virtually disappear. In
1996 these options constituted more than 24% of total transactions in 1996. In 2010 they made
up less than 3% of transactions. On the other side, “short term” options, with 0-1 year time
delays before they can be exercised also fall sharply from 21% in 1996 to 8% in 2010. One
year vesting period options held steadily at 30% of total transactions. The big positive change is
in the two and three year vesting period options, whose share of transactions increased from
roughly 8% to 25% in 14 years.
The final column gives the maturity of the options - the period of time over which they
may be exercised once they have been vested. Less than 1/4 of options have a maturity less
than 10 years. On average, stock options have roughly a maturity of 9 years, but the vast

18
majority has a maturity of 10 years. Moreover, the proportion of options with a ten-year-
maturity has changed over time. In 1996 65% had a maturity of ten years, in 2004 this
percentage increased to 84% in 2004 and then dropped back to 66% in 2010.
Table 1.4: Stock options vesting period and maturity.
Year Firms Transaction
Vesting Period in Years
10 Years Maturity
0 1 2 3 4 ≥5
1996 728 1455 21.17% 34.16% 7.70% 8.11% 4.33% 24.54% 64.67% 1997 1272 2958 25.32% 33.30% 9.20% 8.01% 3.65% 20.52% 66.29%
1998 1417 3298 24.38% 32.38% 9.25% 8.73% 5.12% 20.13% 67.43% 1999 1600 4655 16.15% 28.38% 14.48% 13.77% 8.06% 19.16% 74.91%
2000 1774 7310 11.53% 23.87% 19.66% 18.48% 10.74% 15.72% 76.83% 2001 1996 16564 9.22% 23.35% 23.86% 21.15% 12.56% 9.86% 83.76%
2002 1976 20324 10.24% 24.12% 24.87% 22.18% 12.41% 6.17% 83.02% 2003 1987 21303 10.28% 23.91% 25.63% 22.98% 12.64% 4.56% 82.32%
2004 2046 23796 8.52% 23.36% 25.99% 23.76% 13.32% 5.05% 83.97% 2005 2001 20856 9.03% 23.83% 26.29% 24.48% 12.53% 3.83% 78.50%
2006 1805 19680 8.33% 23.58% 26.27% 24.76% 12.94% 4.12% 71.06% 2007 1819 21971 12.70% 22.76% 25.39% 23.44% 11.99% 3.72% 65.91%
2008 1849 23250 8.06% 23.10% 26.87% 25.42% 12.92% 3.63% 69.29% 2009 1765 20208 8.51% 24.59% 26.84% 24.86% 12.03% 3.18% 63.13%
2010 1475 15690 8.01% 24.75% 27.32% 25.21% 12.07% 2.65% 66.18%
On average a firm grants options to CEOs twice a year (1.99 days), with a standard
deviation of 5.33 days. In table 1.5 I report how many distinct days in a year a firm grant
options to CEO. It can be inferred that more than 50% of transaction occur in a single day.
4. Linking Execucomp and IFDF
Execucomp and IFDF differ in the information on stock-based compensation in
important ways that justifies my use of examining both datasets.
The advantage of the IFDF is that it contains detailed information on derivative
transactions by capturing all of the insider activity reported in SEC forms. The detail of the
IFDF data makes it invaluable to any analysis of options. The IFDF reports the number and

19
type of derivatives granted, the transaction date, the date the SEC received the file, when it was
signed by the officers, the name and the role of the officers granted the derivatives (or who
exercised the derivatives), the strike price, the maturity date, the exercise date, the number of
shares underlining each derivative (as well as the number of share adjusted for an eventual
stock split), and the name of the person and firm in the transaction. It also evaluates of the
accuracy of the data reported by the insiders, including in some cases its own estimate of the
transaction date and an indicator that reflects its views of the accuracy of the data. It corrects
the data that it judges inaccurate. All this information is indispensable to determining if the
options were granted at the money, out of the money or in the money, and whether the options
were scheduled, unscheduled or backdated. Finally, the IFDF provides information on
exercised options, forfeited options or other dispositions of options. It is a massive body of data
that illuminates the “world of the derivatives/options”.
Table 1.5: Granting days per year.
year 1 day 2
days 3
days 4
days >5
days 1996 611 192 45 4 57 1997 983 464 111 40 109 1998 1093 498 165 56 57 1999 1266 506 165 60 72 2000 1326 672 228 96 84 2001 1510 710 243 112 146 2002 1553 646 204 88 91 2003 1610 588 144 100 54 2004 1710 534 117 80 160 2005 1664 538 117 84 70 2006 1545 434 93 32 28 2007 1572 394 87 64 32 2008 1576 438 129 36 17 2009 1542 370 69 40 34 2010 1309 290 45 20 11
Execucomp reports all type of compensation at fiscal year frequency (Kuhnen et al.,
2012) for top executives in public US companies, including all S&P 1500 companies, which
constitutes approximately 80% of the total market capitalization in U.S. (Bebchuk et al., 2005).
20
As we have seen this information includes salary, stock options awarded, bonuses, long-term
incentive plan, and restricted stock. The information on stock options is not as detailed as that
reported IFDF and, as noted, changed when FAS123R changed the reporting rules in 2006,
creating a problem of time series inconsistency.
To use both data sets in concert, I have merged them together. This not an easy task due
to the different ways the data are constructed and reported. The IFDF collects information on
every transaction in a company involving insider's stock options and stocks from Form 3,4,5,
and 144. This means that for the same company in a calendar year, I have as many observations
as the transactions occurred for each executive. By contrast, Execucomp data are for fiscal
years. Thus, one has to amalgamate the IFDF data into a yearly basis for any match.
Both data sets give the names of the officers receiving options but they can give
differently the insiders’ name (order, abbreviation, middle name), so that an exact match of
names loses observations due to the differences between Charles M. Jones and C.M. Jones, and
so on. The name disambiguation problem is a well-studied one in the bibliometric literature,
where computer scientists have written extensive codes to match names, based not only on the
name but also on the address and even on the past history of the person. Examples of recent
works that have merged Execucomp with Thomson through officers name are Knewtson (2011)
and Ladika (2012).
For the match, I transform the IFDF data into an annual file for CEOs that I can match
to the Execucomp data on CEOs. I exclude all insiders’ activities in the IFDF relating to
executives who were not a CEO. I focus on officers that are indicated as CEO by Execucomp,
which has a flag for CEO if the officer served as CEO for most of the year. Since Table II
reports all type of derivatives granted to top officers, I define stock options the following
derivatives: Call Option, Options, Non-Qualify Stock Option, Employee Stock Option,
Director's Stock Option and Non-Employee Director Stock Option. I then sum up the number
of derivatives reported in IFDF by company using the company's PERMNO and fiscal year and

21
merge the data with Execucomp. I am able to merge 44% of the information regarding CEO
provided by IFDF with Execucomp.
There is one piece of information in the two data sets that provide me with a potential
measure of the consistency of the data. This is the number of options granted. Both IFDF and
Execucomp report this statistic. If my matches were perfect and the firms reported the same
data on the insider trading file as on the corporate shareholder statements, and there were no
glitches in the reported data, then the number of options granted would be the same in the two
data sets.
But there are potential problems that can create a divergence between them. First,
Execucomp identifies the officer that has the function of CEO for most of the fiscal year.
Therefore, I may under-report information provided by Execucomp if a CEO changed during
the year. Second, in 75 cases the IFDF reported that CEOs were granted options under a
different main role than CEO. For example, an officer reported he was granted options as a
Director under “rolecode1” which is the main role, as a Chairman of the Board as a second role
(rolecode2), as President as rolecode3 and finally as a CEO as rolecode4. For those 75 cases the
Execucomp data and the IFDF data would differ in the number of options a CEO was awarded.
Third, before 2002, SEC allowed officers to report the transaction within 40 days of the
purported date at which it was made.6 This means that some options on the IFDF file might be
assigned to a wrong fiscal year. For instance, a transaction occurred in the months of December
might be assigned to the month of January, and thus to a different fiscal year if the fiscal year
coincide with calendar year, as is often the case.
These problems notwithstanding the number of derivatives reported by IFDF are
strongly correlated with the number of derivatives reported by Execucomp in most years.
6 “Until August 2002, the requirement had only been to file Form 4 with the SEC within ten days after the close of the calendar month in which the transaction had occurred” (Brochet, 2010, p. 420).
22
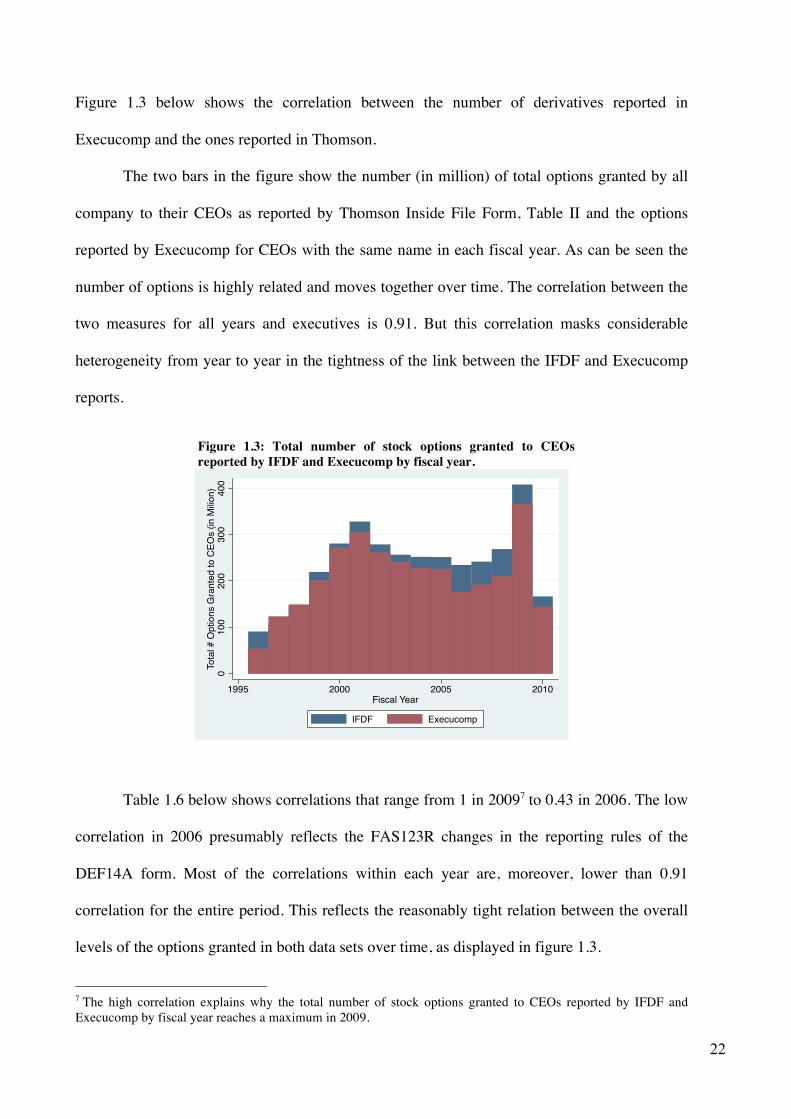
Figure 1.3 below shows the correlation between the number of derivatives reported in
Execucomp and the ones reported in Thomson.
The two bars in the figure show the number (in million) of total options granted by all
company to their CEOs as reported by Thomson Inside File Form, Table II and the options
reported by Execucomp for CEOs with the same name in each fiscal year. As can be seen the
number of options is highly related and moves together over time. The correlation between the
two measures for all years and executives is 0.91. But this correlation masks considerable
heterogeneity from year to year in the tightness of the link between the IFDF and Execucomp
reports.
Figure 1.3: Total number of stock options granted to CEOs reported by IFDF and Execucomp by fiscal year.
Table 1.6 below shows correlations that range from 1 in 20097 to 0.43 in 2006. The low
correlation in 2006 presumably reflects the FAS123R changes in the reporting rules of the
DEF14A form. Most of the correlations within each year are, moreover, lower than 0.91
correlation for the entire period. This reflects the reasonably tight relation between the overall
levels of the options granted in both data sets over time, as displayed in figure 1.3.
7 The high correlation explains why the total number of stock options granted to CEOs reported by IFDF and Execucomp by fiscal year reaches a maximum in 2009.
010
020
030
040
0To
tal #
Opt
ions
Gra
nted
to C
EOs
(in M
ilion)
1995 2000 2005 2010Fiscal Year
IFDF Execucomp

23
In sum, there are inconsistencies between the number of options reported in the two
data sets, but the correlations are sufficiently high except for 2006 when Execucomp changed
their mode of reporting that combining the two data sets should give us a more complete and
picture of the pattern of executive compensation over time than examination of each data set by
itself.
Table 1.6: Correlation between the number of options granted to CEOs estimated from IFDF and reported by Execucomp. Year Corr.
1997 0.86 1998 0.83 1999 0.65 2000 0.87 2001 0.74 2002 0.88 2003 0.88 2004 0.83 2005 0.81 2006 0.43 2007 0.88 2008 0.74 2009 1 2010 0.78
5. Conclusion
This chapter has explored the changes in US CEO compensation from 1996 to 2010
using data from the Execucomp dataset and the IFDF dataset. It has shown that CEO pay rose
by $2.7 millions between 1996 and 2010, but the changes varied greatly over time with the
state of the stock market and economy. Most of the increase in stock-based compensation
during the period from 1996 to 2001 was due to increased grants of stock options, but options
became less popular toward the end of the period in favor of direct grants of stocks, which in

24
2010 constituted almost 35% of total compensation. The chapter has also shown substantial
changes in the composition of options over time. The percentage of scheduled options
increased by almost 25% between 1997 and 2010. Backdated options disappeared.
Cash-based compensation increased more modestly over the period. The chapter
described the methodology by which I matched Execucomp data from company's annual proxy
statement (DEF 14A SEC) with data from the Insider Filing Data Feed on U.S. insider
activities. I found that the number of options reported in the two datasets is highly correlated
(except in 2006 when Execucomp changed the mode of reporting options) to allow me to use
them together to analyze some of the changing patterns in executive compensation, on which
the rest of this thesis focuses.
25
Appendix 1.A: Some details on constructing the dataset
To construct my data set I use three different datasets. Executive compensation data are
taken from Thomson Financial Insider Filling (IFDF) database and Compustat. I obtain detailed
information of firms’ daily stock price from Center for Research in Stock Price (CRPS).
1.A.1 Thomson Financial Insider Filling Database
From IFDF Table II I obtain the official grant date, the exercise date, the data at which
options expire and the exercise price of insiders' grants. I restrict my analysis on transactions
occurred under transaction code A during the period from 1996 to 2011. Transaction code A
reports award transaction pursuant to Rule 16b-3(C).
Table 1.7 gives the details of how I obtained the data for my analysis beginning with
4,006,678 transactions reported in the IFDF file. I use yearly official company's Ticker and
company's CUSIP number to match companies from IFDF database to Center for Research in
Stock Prices databases (CRSP). I drop companies that were not matched with CRSP. I therefore
lose 931,359 transactions. CRSP allows me to assign the PERMNO (permanent security
identification, that is unchanged during the time) for each firm and the closing price for each
transaction. I also exclude non-option derivatives (573,065), so that I consider Call Options,
Options, Non-Qualifying Stock Options, Employee Stock Options, Director's Stock Options
and Non-Employee Director Stock Options. I first retain information for top five executives -
CEO, Chairman of the Board, Chief Operating Officer, General Counsel and President). This
reduces my sample by 2,018,469 transactions.
I lose a small number of transactions due to what appear to be data errors in the sample.
I found some observations where the strike price was not reported by IFDF (4,961); other

26
observations which gave an exercise price before the grant date (952); others which
misreported the maturity (6,218) date or reported the maturity date before the transaction
occurred (52); and one observation reporting the number of derivatives granted less than zero.
This left me with 471,601 grants. I use CRSP/Compustat Merged dataset to infer for each
permanent security identification number (PERMNO) the corresponding variable FYR
(indicating the months on which the fiscal year ends). I am thus able to link the CRSP
permanent security identification number (PERMNO) with the variable FYR provided by
Compustat and allocate the options award reported in Thomson to the right fiscal years from
1996 to 2010. For instance, an option granted in February 2011 would be assigned to fiscal year
2010, if the fiscal year ends in May 2011. For 13,882 (2.94%) transactions I am not able to find
information about FYR, I thus assume that fiscal year coincides with calendar year, since ¾ of
S&P500 companies have a calendar year fiscal year (Execucomp). I drop transactions assigned
to 2011 fiscal year (34,627) or fiscal year 1995 (73). I end up with 436,901 transaction
occurred between fiscal year 1996 and 2010. Eventually, I restrict my analysis on CEOs only,
obtaining 223,318 transactions.
Table 1.7: The accounting procedure. The sample extracted from IFDF.
IFDF Transaction
Transaction A 4006678 No PERMNO information -931359 Derivatives different from Options -573065 Non top five executive -2018469 Top five executive Options Space 483785 Misreported Transactions -12184 Occurred in Fiscal year>2010 -34627 Occurred in Fiscal Year<1996 -73 Non-CEOs -213583 CEOs 223318
To get the grant data for my analysis I then proceeded as follow:

27
• If the reported exercise price is equal to stock closing price inferred from CRSP, the
grant date is equal to the reported one. If not, I checked the previous two days and
selected the grant date that minimized the difference in absolute value between the stock
closing price and the strike price. I defined an option at the money if the exercise price
exactly matched or was within 10% of the closing price listed in CRSP. I estimated that
approximately that 90.72% options are granted at the money, 5.67% is granted out of
money and the remaining are granted in the money.
• I then obtained daily stock price over a window of 41 days (the inferred grant date plus
20 trading days before and after). I defined an option as backdated if the stock closing
price on grant date is the minimum over the 41 days window. I defined an option as
scheduled if it was awarded inside of 2 weeks window of the awarding of options in the
previous year.8 That is, for any company I look if it grants an option one week before or
one week after one-year anniversary to a previous transaction. I defined an option as
unscheduled if it was granted in period of time outside of the 2 weeks window around
the reported transaction date in the previous year. If no options were awarded during the
prior year I defined the option as ''unclassified''. I followed a similar procedure proposed
by Lie (2005) in deciding which options are scheduled. I experimented with different
windows and obtained results comparable to those described next.
To check the robustness of my assignment of options as scheduled and unscheduled, I
experimented with different time windows to see if the choice of window-days affects the
percentage the esteem of scheduled options. I simulated five scenarios with different days
window for identifying scheduled options. In the first scenario, I define an option as scheduled
if it was granted within a window of fourteen days - seven days before and seven days after- of 8 Some options are considered scheduled even if no options were granted the previous calendar year. For example, a company granted no options in 1999. In 2000 the firm granted some options at the begin of January, and some others at the end of December. If the letter ones were granted in a window of two weeks from the award made in January, I consider them as scheduled.
28
one-year anniversary of the previous grant or within fourteen days of a next-year option grant.
The only difference between this definition and the definition in the body of the chapter is that I
consider options as scheduled if they were granted for the first time but were then granted in
the same period in the next year. The second scenario considers options as scheduled if they are
granted within twenty days of one-year anniversary of the previous grant. The third and fourth
scenarios consider options as scheduled if they were granted sixteen or twelve days
respectively of one-year anniversary of previous grants. The last scenario considers options as
scheduled if they were granted in the same month of one-year anniversary of the previous
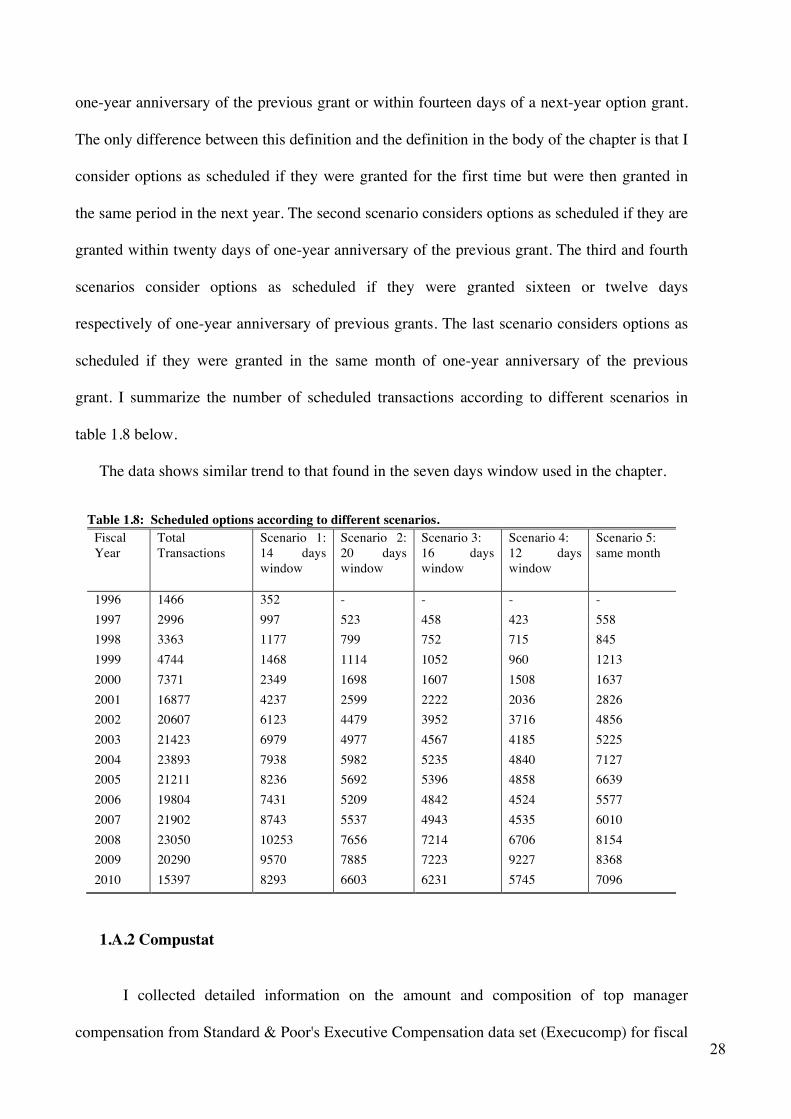
grant. I summarize the number of scheduled transactions according to different scenarios in
table 1.8 below.
The data shows similar trend to that found in the seven days window used in the chapter.
Table 1.8: Scheduled options according to different scenarios. Fiscal Year
Total Transactions
Scenario 1: 14 days window
Scenario 2: 20 days window
Scenario 3: 16 days window
Scenario 4: 12 days window
Scenario 5: same month
1996 1466 352 - - - - 1997 2996 997 523 458 423 558 1998 3363 1177 799 752 715 845 1999 4744 1468 1114 1052 960 1213 2000 7371 2349 1698 1607 1508 1637 2001 16877 4237 2599 2222 2036 2826 2002 20607 6123 4479 3952 3716 4856 2003 21423 6979 4977 4567 4185 5225 2004 23893 7938 5982 5235 4840 7127 2005 21211 8236 5692 5396 4858 6639 2006 19804 7431 5209 4842 4524 5577 2007 21902 8743 5537 4943 4535 6010 2008 23050 10253 7656 7214 6706 8154 2009 20290 9570 7885 7223 9227 8368 2010 15397 8293 6603 6231 5745 7096
1.A.2 Compustat
I collected detailed information on the amount and composition of top manager
compensation from Standard & Poor's Executive Compensation data set (Execucomp) for fiscal

29
year 1996 through fiscal year 2010. Execucomp collects top executive compensation detailed
information directly from company's annual proxy statement (DEF 14A SEC). Most companies
report data on only five executives but some companies voluntarily report more executives. I
conducted my analysis on CEOs only. The variable CEOANN provided by Execucomp
indicates which officer served as CEO for the entire or most of the fiscal year. In 20 cases
Execucomp indicates that two officers served as CEOs for the same firm. I therefore used the
mean of the data on the two officers as the CEO statistics.
In 2006 the FAS123R changed the reporting rules. Under the new rules, companies
have to report the estimated fair value of the stock options granted in the proxy statement.
Execucomp provides its own fair award value estimate for stock options granted before 2006
using a non-standard Black-Scholes formula. In 2006, Execucomp also changed the way total
compensation is calculated. Before 2006, total compensation (TDC1) was calculated as the sum
of salary, bonus, restricted stock granted, stock options, long-term incentive payout and other
forms of compensation. After 2006, total compensation was calculated as the sum of salary,
bonus, stock awarded, stock options, non-equity incentive plan compensation, deferred
compensation earnings reported as compensation and other compensation.
I obtained from Execucomp the following information: the dollar value of salary
(Execucomp variable SALARY in thousands of dollars), bonus (Execucomp variable BONUS
in thousands of dollars), the value of stock options awarded (Execucomp variable
BLK_VALUE until 2006, rename as AWARD_FV thereafter), the value of stock awards
(Execucomp variable RSTKGRANT before 2006, renamed STOCK_AWARD_FV thereafter),
the Long Term Incentive Payout (LTIP), Deferred Compensation Earnings Reported as
Compensation (DEFER_RPT_AS_COMP_TOT, available only after 2006) and All Other Total
(ALLOTHTOT substituted in 2006 by OTHCOMP). I also collect the number of derivatives
granted to each manager (Execucomp variable OPTION_AWARD_NUM).

30
As pointed out in the text, in 2006 FAS123R changed the reporting rules. Specifically,
after 2006 companies have to report the estimated fair value of the stock options granted in the
proxy statement. Different evaluating methods are permitted, including the Black-Scholes and
the binomial options pricing model. Before 2006, Execucomp provides its own fair award value
estimate for stock options granted using a non-standard Black-Scholes formula. Therefore, the
time series include the value of stock options granted estimated by Compustat from 1996 to
2005, and the value of stock options granted evaluated by each company since 2006.

31
Chapter Two: Price Targets Accuracy and Timing: Evidence from IBES's Price Targets
Data Set
1. Introduction
This chapter describes the Institutional Broker Estimate System (IBES) Detailed
History Price Target data file that provides statistics on analysts’ price targets - “the projected
price level forecast by an analyst within a specific time horizon” (Glushkov, 2009, p. 6) - that I
use to analyze the arms-length bargaining and managerial power models in the rest of this
thesis. Because price target data are not analyzed extensively in the financial forecast literature
and have never to my knowledge been used in analyzing executive compensation, I provide a
brief discussion of the variable and existing knowledge of the price target process in section 2.
I give a detailed description of the IBES price target data in section 3. Section 4 analyzes three
issues regarding price targets that are critical to my ensuing analysis of the relation between
price targets and executive compensation: the scheduling of price target announcements over
the year; the extent to which the target prices are positively associated with share prices at the
forecast date; and the extent to which the market treats announcements as new information that
gets embodied quickly into share prices.
2. Background
Stock market analysts give price target forecasts for the share prices of firms several
times a year, so that the price targets provide a flow of information about experts' views of the
future performance of companies that market participants can use in investment decisions and
32
the management and boards can use in setting executive pay.9 But “Compared to EPS10
forecast accuracy studies, the literature on target price is much more recent and substantially
less populated” (Bilinski et al., 2011). Of the approximately 250 papers on financial analyst
forecasting in Ramnath et al.'s 2008 literature review of the top eleven research journals since
1992, I counted only four papers containing the word “price target(s)” or “target price(s)” in the
author’s key points summary, and only two papers with such words in the article
bibliography.11 A likely reason why analysts have not examined price target data is that the
IBES price target data set was not available to academic subscribers until 2009 (Bradshaw et
al., 2012).
Asquith et al. (2005) gives summary statistics on financial analyst reports in 1997-1999
using data from sources of IBES competitors. The statistics show that analyst reports typically
include buy or sell recommendations and earning forecasts, but contain price targets only
72.6% of the time12, and that reason is that analysts tend to avoid issuing price forecast for
unfavorable reports. About 95% of recommendations to hold or buy include price targets while
only 65.8% of recommendations to sell include price targets. Relatively few analysts give price
targets below the share price. They suggest that analysts might use forecasts of price targets to
keep positive relations with the managers on whom they rely for information.
Clement (1999) examines the IBES Detailed History tape for the period 1983 to 1994,
such as the number of analysts, the number of forecasts, the number of brokers and the number
of firms, but could not price targets, which were not available until 1999. Bilinski et al. (2011)
9 To prelude, I argue in chapters 3 and 4 that the target price should affect the composition of executive composition differently if a board sets pay by arms-length bargaining than if CEOs greatly influence the pay-setting process. When the target price is high, an option is worth more to the executive so that an arms-length board could give the executives smaller options or adjust the exercise price for the likely change in value that is independent of the executive doing anything out of the ordinary. By contrast an executive-dominated board would give bigger options to the executive as a means of enriching that persons. 10 EPS stands for earning per share. 11 Three papers use Investext, which stores research reports written by analysts and is provided by Thomson; two use First Call, one of the main competitors along with Zacks, in the population of analysts covered, the variables reported and the time series (Glushkov, 2007) and one also uses Real Time Database. In 2001 Thomson Reuters acquired First Call, merged it with IBES, and then discontinued it (Bilinski et al., 2011). 12 Brav et al. (2003) also finds that only 2/3rds of all analyst reports includes price targets.

33
studied the variation of price target accuracy across 16 countries in the IBES Detailed History
data for the period between 2002 and 2009. They provide detailed descriptive statistics on the
distribution of target prices, firms, brokerage houses, analysts and price target accuracy by
country. The authors found that the US data, which constitutes 55.2% of the entire price targets
sample and 44.8% of the sample firms, dominate the IBES price target data. Australia and
Hong Kong offer the highest proportion of met13 price targets, with 66.1% and 64.3% of price
target met respectively, whereas the US percentage is only 54.7%. The differences are mainly
due to accounting quality disclosure, corporate governance, culture traits and regulations.
Comparing the forecasts of analysts, Bilinski et al. (2011) finds that some analysts have
superior forecasting ability and rejects the notion that price targets are “just for show” as the
popular press claims. Cowen et al. (2006) argue that optimistic reports on dot-com stocks
before the dot.com collapse and the Enron scandal have damaged the reputation of analysts:
“popular explanation for all of those failures is that analysts working for investment banks were
compromised by the hefty bonuses they could earn writing positive reports on investment
banking client, or were pressured to write favorable reports by investment bankers at their
firms” (Cowen et al., 2006, pp.120). Cowen et al. (2006) examine differences in analysts’
optimism in recommendations and forecasts (including price targets) by analysts working for
full-service banks (which financed the research through brokerage and underwriting new
issues); syndicate banks (which sustained the research through fees and trading), brokerage
firms (that financed the research through trade commission and rewarded analysts in base of the
trading volume of the stock) and pure research firms (that sell research itself). They show that
full-service banks employed the highest number of analysts who in turn covered the biggest
number of firms and found that bank analysts issued the less optimistic price target forecasts.
13 The authors use two measures to capture accuracy. The first one is a dummy variable taking the value of the unity if the share price reaches or overcome the price target any time over the 12 months forecast horizons. The second one measure the forecast error, and it is designed as the difference in absolute value between the share price at the end of the 12-months period and the price target divided by price at the forecasted issue date.

34
Of particular relevance to executive compensation, Francis et al. (1993) and Lim (2001)
show that company’s managers can pressure analysts to modify reports by exploiting the
analysts’ dependence on managers for information. In extremum circumstances, firms have
fired analysts writing bad reports about clients on whom the firm depends (Richardson et al,
2004), like Chung Wu, UBS analyst, fired under pressure from Enron for having advised
clients to disinvest from Enron on the night of the August 21, 2002 (Oppel, 2002). Richardson
et al. (2004) show that firms’ managers manipulate analysts’ reports to have optimistic earning
forecasts and to subsequently correct the forecast so they can surpass it. By doing so, managers
can sell the stock on behalf of the firms or for personal accounts after having announced that
they actually had beaten the target and inflating the stock price. McAnally et al. (2008) show
that managers also game the system in the opposite direction, missing targets on purpose before
options grants to benefit from a lower strike price. These forms of behavior play a part in my
chapter 4’ analysis.
3. Data and analysis
The data I use on analysts price targets comes from IBES Detail Adjusted History Price
Target data file for the period from calendar year 1999 to 2011. The IBES file provides
summary measures of the targets from all analysts who make forecasts in a given period and
also gives the underlying price targets of individual analysts. I use the summary measures to
indicate the likely direction of future share prices, which will determine the expected value of
stock options. Given that my CEO compensation data are for US firms, I focus on US firms
only, though the IBES includes price targets for firm around the world.14 I use the adjusted file
14 Thomson-Reuters reports in its discussion of the IBES data: “the reporting currency does not reflect the clear majority of estimate submissions, Thomson Reuters may exercise the option to set the default based on the currency of the majority of estimate submissions. In cases where companies report in multiple currencies,

35
data set (which IBES calls as Normalized) that adjusts value for various corporate actions, like
splits of stocks and that dividend, and that is comparable across currencies.15
The IBES Price Target data file records the following variables: analysts’ price targets
level, analysts’ name, the company he/she works for, company for which he/she issues the
target price, the horizon-period, the day the price target was announced and when became
active in IBES data file, the company currency and whether or not the company is a US firm.16
The price targets are available March 1999 to the present.
Table 2.1: Analysts’ horizons. Horizon Observations Percentage 0 21 0.002% 1 586 0.068% 3 413 0.048% 5 3 0.000% 6 11891 1.388% 7 2 0.000% 8 1 0.000% 9 423 0.049% 10 2 0.000% 11 1 0.000% 12 837905 97.808% 13 1 0.000% 14 1 0.000% 15 14 0.002% 18 3868 0.452% 24 962 0.112% 36 590 0.069% 50 1 0.000% Total 856685 100%
Thomson Reuters will set the default currency based on the majority of estimate submissions.” (I/B/E/S Detail History-User Guide, 2009, p.11). 15 IBES distinguish US firms from international through a dummy variable (USFIRM) that take the value of zero if the firms analyzed is from international file and one if from US file. Canadian firms however might report under both flag. IBES puts an “@” symbol in front of the tickers of international company (with the exception of Canadian). One way to obtain Canadian firms is to filtering USFIRM=0 and look for company whom ticker does not have a “@” in it. However, a different issue is to separate Canadian companies from US file. Since I merge IBES with CRSP, which provides institutional details on the company, the problem disappears. 16 Despite limiting my data to US firms, 983 observations report that the currency at company level is not the USD, while 1,649 observations report that the estimated currency is different from the US dollar. In 358 cases both currency at company level and estimate currency are not in US dollars. However, since the data are taken from price target adjusted file, values should be comparable across various currencies and expressed in USD. I clarified these issues by e-mail with WRDS support.

36
The targets cover different horizons expressed in months, but as Table 2.1 shows 98%
of price targets have a 12-month horizon, so I limit my analysis to those targets.
I use CUSIP and TICKER provided by IBES to infer the PERMNO code on Compustat
and CRSP. I drop 92,090 observations for which was not possible assign a PERMNO.
For every year I count the number of analysts, the firms they work for, the companies
they cover and the number of price targets they issue. In 18.65% of the cases IBES reports
more than one announcement in one day. From CRSP I obtain the share price exactly one year
after the 12-month price target forecast. Among 19,709,601 closing prices reported by CRSP
for the IBES companies, I track 12,879.517 closing prices exactly one year later. However,
some closing prices are issued on Friday or before holidays so I do not have a price exactly one
year later. In these cases, which make up 4,040,619 observations, I take as effective price, the
price reported one year and three days later. I next define a price target as being accurate if the
share price matches or exceeds the effective forecast price if an increase in share price is
forecast) or if the share price falls below the effective share price when the share price is
expected to fall.
Table 2.2: Summary statistics by years.
No. brokers
No. analysts
No. firms
No. price targets
% positive accuracy
% accuracy
1999 156 2381 3231 21865 0.61 10703 0.49 2000 197 2933 3475 31527 0.66 17370 0.55 2001 167 3346 3213 37997 0.69 22949 0.6 2002 180 3271 3173 44788 0.68 24196 0.54 2003 253 2823 3292 48471 0.58 14728 0.3 2004 290 2906 3586 53131 0.62 22684 0.43 2005 295 2937 3789 54823 0.69 25226 0.46 2006 284 2914 3913 58490 0.74 28905 0.49 2007 278 2987 4028 63993 0.78 46753 0.73 2008 281 2962 3836 76863 0.82 54430 0.71 2009 302 2887 3600 77841 0.74 27350 0.35 2010 331 3289 3756 82814 0.81 40653 0.49 2011 316 3412 3829 93212 0.84 - -
Table 2.2 gives the summary statistics of the price target forecasts in my data set.

37
Columns 1-3 show increases in the number of brokers, analysts, and firms that make price
targets. Column 4 shows a 4.26 increase from 1999 to 2010 in the number of price targets in the
data set. Column 5 shows that majority of price targets expect an increase in the share price. In
doing this analysis, I encountered some price targets that seemed implausible. For instance, for
TROY GROUP INC, IBES reported a price target of $4,200,000 in 06/April/2000, when the
price was $22.56.17 Some of these data problems reflect the CRSP stock closing price. CRSP
reports for Berkshire Hathaway a share price of $2,411 in 02/01/2001, which ultimately grew
up to $3,476 in 20/01/2010. The day after, i.e. 21/01/2010, the share price reported by CRSP
was $72.72. A closer look to the dataset reveals that the firm split the shares at 50 to 1 on
January 21. Analysts presumably issued a price target basing the forecast on the share price
without knowledge of an eventual split. Firms buying back share presents a different problem,
as analysts might try to estimate the likelihood of such an event. If analysts do not take into
account a buyback, they will issue what would look like an extremely pessimistic and
inaccurate forecast. For 40 companies, 48 price targets were for a price of zero. When I queried
Thomson-Reuters WRDS support about extremely large or small targets, they suggested that
the most likely explanation of weird observations are data errors on part of Thomson.18 But to
be conservative, rather than defining some price target as implausible ex ante, I keep all
observations.19
Table 2.3 divides some of the statistics in table 2.2 to show the work load of firms and
analysts in producing price targets. A typical broker firm reports price target for 81.98
companies with a standard deviation of 171.19 companies.20 Table 2.3 reveals that, on average
17 For 376 (0.05%) observations, the difference between the price target and the share price at the day of the announcements was $1,000 or more. Similarly, for 44 firms 360 (0.048%) price targets foresee a change in price of 10,000% or more. 18 As suggested by e-mail by the WRDS support. 19 I also conduct the analysis dropping those observations and I find that the results do not change or they get slightly better. 20 The percentage of broker firms that next year cover less companies is 55.10%, while the percentage of them that cover ten or more additional firms is 30%. To calculate the percentage I construct a panel, which reports the total number of different company covered by each broker firm in a year. I then look how many broker companies in a year experienced a decrease in the number of firms they covered in a year.

38
a broker firm employs 13.79 analysts and announces 223.97 price targets per year while an
analyst covers 7.17 companies per year and makes 19.10 price targets per year.
Table 2.3: Typical broker firm and analyst.
Avg. announcements
per Broker firm
Avg. analysts per
broker
Avg. companies covered per
broker
Avg. companies covered by
single analyst
Avg. analysts serving
broker firm
Avg. price targets per
analyst 1999 140.16 19.23 78.62 5.13 1.26 9.18 2000 160.04 20.14 78.33 5.2 1.35 10.75 2001 227.53 28.99 100.06 5.13 1.44 11.36 2002 248.82 23.73 99.34 5.7 1.31 13.69 2003 191.59 12.75 68.79 6.39 1.14 17.17 2004 183.21 11.26 67.76 6.94 1.12 18.28 2005 185.84 11.09 70.4 7.25 1.11 18.67 2006 205.95 11.05 76.82 7.75 1.08 20.07 2007 230.19 11.48 82.91 8.08 1.07 21.42 2008 273.53 11.37 83.84 8.24 1.08 25.95 2009 257.75 10.22 81.51 8.7 1.07 26.96 2010 250.19 11.1 88.14 8.96 1.12 25.18 2011 294.94 12.03 97.03 9.23 1.11 27.32 Tot: 223.97 13.79 81.98 7.17 1.18 19.10
Std.Dev 541.86 26.13 171.19 6.63 0.61 23.77
Table 2.4 records the statistics on price targets in terms of the number of companies
covered by brokers. The first row indicates that 8,917 companies are covered by a single broker
firm for a given year, and that on average one analyst from the firm issued almost two price
targets for that company. Similarly, the second row indicates that 6,467 companies are
monitored by two broker firms which have about 2 analysts who announce 4 price targets per
year, and so on.
The first two columns show a power law relation with many companies covered by
small numbers of brokers and a few companies covered by many brokers. The majority of firms
are covered by 4 of fewer brokers while 456 firms are covered by 19 or 20 brokers. For
example, the large corporation, Oracle Corporation, was covered in 1999 by 19 different
brokers who reported 56 price targets.

39
Table 2.4: Typical analyzed company.
Company coverage Frequency
Avg. Analyst per Broker
firms Avg.
Announcements Avg.
Analysts 1 8917 1.04 1.97 1.04 2 6467 2.09 4.21 2.06 3 5131 3.15 6.7 3.08 4 4418 4.2 9.29 4.11 5 3649 5.26 12.36 5.12 6 2970 6.31 15.16 6.14 7 2423 7.4 18.26 7.18 8 2147 8.47 21.58 8.2 9 1705 9.51 24.61 9.24
10 1373 10.6 27.95 10.24 11 1243 11.7 31.74 11.33 12 1027 12.73 35.2 12.29 13 856 13.85 38.04 13.35 14 736 14.86 41.87 14.32 15 637 15.92 45.28 15.33 16 480 16.97 49.42 16.31 17 468 18.03 53.37 17.35 18 401 19.12 56.02 18.36 19 292 20.27 60.1 19.46 20 248 21.45 63.46 20.6 21 208 22.46 68.59 21.57 22 197 23.71 70.89 22.65 23 128 24.53 73.67 23.57 24 116 25.8 75.89 24.76 25 101 26.97 77.88 25.68 26 72 27.68 84.44 26.39 27 59 29.07 90.51 27.69 28 55 30.36 94.13 29.09 29 37 30.73 89.54 29.43 30 29 32.17 108.34 30.9 31 33 33.64 98.7 32.42 32 22 34.95 107.14 33.45 33 14 35.64 112.57 33.79 34 15 36.8 102.07 34.87 35 7 37.14 118.57 35.57 36 7 38 124.57 36.86 37 3 38 117 36.67 38 7 40.85 133.86 37.86 39 7 42.86 135.29 41.14 40 3 43.33 12867 40.67 41 6 43.83 130 41 43 1 46 108 40 44 1 48 152 43 45 2 48.5 143 45

40
Table 2.4 (continued). 46 1 50 156 48 53 2 59 213.5 55.5
The 19 broker firms had 21 analysts following Oracle, which implies that some firms have
more than one analyst following the company.21 The last column indicates the average number
of analysts analyzing the firms.22 Finally, as the “coverage” of a company (defined as the
number of broker companies that analyses the company) rises, the number of announcements
increases as well but more than proportionally.
Table 2.5 shows that the number of price targets given per company have risen, the
result of both an increase in the number of brokers and firms and also a tendency for analysts to
issue price targets more frequently (and possibly for IBES to have become more inclusive).
Table 2.5: Announcements per company and year: summary statistics.
Year Mean Std. Median 1999 6.77 7.48 4 2000 9.07 10.91 5 2001 11.83 13.64 7 2002 14.12 16.03 8 2003 14.72 16.03 9 2004 14.82 16.45 9 2005 14.47 15.46 9 2006 14.95 15.51 10 2007 15.89 16.36 10 2008 20.77 21.77 12 2009 21.62 23.2 13 2010 22.05 23.54 14 2011 24.34 26.7 14
Figure 2.1 shows the distribution of announcements per company and calendar year.
21 A closer look reveals that the firm Firstalb and Piper had two analysts covering Oracle Corporation in 1999. 22 The number of analysts covering a firm can differ from the number of analyst per firms in the third column because an analyst may switch brokers in a year. For instance, for Noven Pharmaceut two different broker firms report a price target, one in November and one in May but the analyst that conducts the analysis was the same. But analysts do not change company often: on average an analyst serves 1.18 companies with a standard deviation of only 0.61 companies as reported in table 2.3.

41
Figure 2.1: Announcements per company and calendar year.
Why do analysts announce more target prices in some years than in others? One likely
factor in determining the number of target prices in a year is the volatility of the share price.
The more volatile the price, the more reason to update price targets. To see if this expectation
holds in the data, I regressed the number of announcements per firms in a year on stock price
standard deviation obtained from CRSP and company dummies. The results in table 2.6 below
show that analysts issue updated price targets more often when the share price volatility was
higher. The likely explanation is that the more volatile the share price is, the more difficult is to
forecast a price.
Table 2.6: Multivariate analysis of the effects of share price volatility on the number of announcements per firms in IBES datasets from 1999 to 2010. Estimates are reported. *, **, *** indicate significance at 10%, 5% and 1% levels respectively. The t-statistic are reported in parentheses.
(1) (2) (3)
ANNOUNCEMENTS
ANNOUNCEMENTS
ANNOUNCEMENTS
STOCK PRICE STD 0.0200*** 0.0135*** (7.90) (4.77) STOCK PRICE STD_1 0.00745*** (3.69) YEAR DUMMIES yes no yes COMPANY DUMMIES yes yes yes
CONSTANT 4.299*** 15.91*** 26.91*** (19.63) (280.53) (139.80) N 46702 46702 44744
0.0
2.0
4.0
6.0
8.1
Den
sity
0 50 100 150 200 250Distribution of announcements by company and calendar year

42
4. Key issues in using price target data in analyzing stock options
The goal of my analysis is to use the price target data as a new explanatory variable in
analyzing the granting of stock options in executive compensation and to see whether it affects
in options in ways consistent with the arms-length bargaining board model of setting executive
compensation or with the managerial power model. For price targets to affect decisions about
granting executives options, there must be real information in the targets about future share
prices. To see if there is information in the target prices I examine their relation to share prices
in the forecast period. I also examine whether the stock market responds quickly to
announcements as if that investors treat them as informative. For firms to use price targets
when boards award stock options, price target announcements and stock option grants must be
made in similar periods of time.
The analysis in this section shows that there is information in the price targets that helps
predict share prices a year later and that produces changes in market prices shortly after an
announcement, and that the timing of announcements has become scheduled in ways that
boards can use information in deciding on grants of options.
4.1 Is there information in analysts’ price targets?
The question of whether or not forecasts of stock prices are useful indicators of future
share prices has long been an issue of debate in the financial forecast literature. Using new
statistical methods Granger (1992) points out that while there are no general profitable trading
rule there is some forecastability in share prices and gives a critical survey of the methods used
to forecast price. Most models look at previous firms’ performance and use lagged stock prices
for forecasting future prices. Such studies indicate that there is a regular pattern in stock prices.

43
Nevertheless, a number of studies point out that shares that performed badly in the first period
tend to perform well in the second period. Empirical evidence proves that a price reversal
occurs daily, weekly and even monthly. To the extent that price targets are based on “inside
information” that analysts pick up from their research, the targets should add forecastability to
any models based on common knowledge of share prices.
I examine whether the IBES price targets are predictive of future changes in share
prices as follow. I begin with the daily share price reported in CRSP for which IBES provides
price targets. For every day analysts announce a price target, I form a triplet of data - the share
price on the day the forecast was made, the forecast price a year later, and the actual price a
year later (or, when due to timing, that is not available, the share closing price one year and
three days later). A triplet for a particular company would be the price target of $18.00 given
on 06/21/2004; the price on that day, say of $16.95 and the actual share of $18.26 one year
later on 06/21/2005. In 18.65% IBES reports more than one announcement in one day, I thus
use the average. I then compute the daily logarithmic return by taking the difference between
the logarithm of share stock closing price one year later and the logarithms of the actual stock
closing price.23 I define the expected return the difference between the natural logarithm of the
expected share price one year from now and the natural logarithm of the stock closing price.
The null hypotheses for forecastability require that for the fixed effects regression
(2.1):
𝑅!!!,! = 𝛼 + 𝛽𝐸! 𝑅!!!,! + 𝜕𝑦𝑟 ∗+𝜂! + 𝜀!!!,! (2.1)
where the dependent variable is the company i daily stock log-return one year later the day t.
The independent variable is the expectation at the time the prediction is made for the stock
23 I ignore 0.0049% of the dataset that report an average of zero price targets in order to use the log transformation.
β≠0

44
price next year (t+1). 𝜂! is the fixed effect, 𝜀!!!,! is the error term, while yr* represents the year
dummies.
Table 2.7 gives the regression estimates of how analysts’ predictions do.
Table 2.7: Testing analysts' forecast. Estimates are reported. *, **, *** indicate significance at 10%, 5% and 1% levels respectively. The t-statistic are reported in parentheses. (1) (2) (3) 𝑅!!!,! 𝑅!!!,! 𝑅!!!,!
𝐸! 𝑅!!!,! 0.120*** 0.181*** 0.156*** (48.17) (73.78) (65.21) YEAR DUMMIES no yes yes COMPANY DUMMIES yes yes no CONSTANT -0.0756*** -0.207*** -0.175*** (-96.38) (-61.74) (-28.04) N 439250 439250 439250
In general, it is reasonable to rely on analysts’ predictions since in all specifications 𝛽 is
significantly different from zero and positive. Intuitively, when analysts announce an increase
(decrease) in share price, the share price moves in the predicted direction.
The requirement that beta is positive and significantly different from zero is essential
for investors to trust analyst’s reports. A positive beta indicates that when analysts expect an
increase in share price, it actually occurs it. However, more restrictive requirements are needed
to prove the unbiasedness of price target. Indeed, the unbiasedness hypothesis requires jointly
that the constant is zero and the beta coefficient is equal to one in the ordinary least square
regression (Dokko et al., 1989).
In the appendix I test two alternative models to see if it is reasonable for investors to
rely on price targets. I find that beta is positive and significantly different from zero in all two
models, which implies that it is reasonable for investors expect a rise in the future share price
when analysts announce it.
Figure 2.3 illustrates the histogram of the difference between the stock price and the
forecast made one year later, which reflects the accuracy of price targets. On average the
difference is $-37.5. The standard deviation is approximately $9,450 while the median is also
more or less $1.56. However, when I drop 360 observations that forecast a change in the share

45
price of 10,000% or more, I find that the average is positive ($2.69), the standard deviation is
about $191.4649 and the median of $1.55.
Figure 2.3: Difference between the stock price and the forecast made one year earlier.
An alternative test of the information content in analysts’ price target announcements is
to see how the stock market responded to the announcements. Womack (1996) studied the
market reaction to analysts’ recommendations and found that positive recommendations are
associated with positive returns in the three days window around the announcement. Asquith et
al. (2005) also finds that the market reacts in a short period of time to price target
announcement.
Establishing the causality between price target and share price is not straight-forward
since the factors that cause a positive or negative price target announcement are likely to be the
same factors that lead to a rise or a drop of the share price. The key issue, however, is not the
underlying cause for the relation but whether the announcement alters market views and serves
as the “conduit” for the information. Accordingly, I follow the analyses of Womack (1996) and
05
1015
Perc
ent
-50 0 50<-100 >100Difference between the effective stock price and the price target

46
Asquith et al (2005) and examine how the market reacted to a price target announcements in
the IBES data set.
I use a difference in difference approach, regressing the change in share price on the
change in the price target for a particular. That is, I take as my dependent variable the stock
closing price after a new price target announcement minus the share price after the previous
price target announcement and take as my independent variable the difference between the new
price target and the earlier price target.24
Table 2.8: Testing price targets' effect on share price. Estimates are reported. *, **, *** indicate significance at 10%, 5% and 1% levels respectively. The t-statistic are reported in parentheses. (1) (2) (3) (4) 𝑠𝑝!,! 𝑠𝑝!,! ∆𝑠𝑝!,! ∆𝑠𝑝!,! 𝑝𝑡!,! 0.786*** 0.0610*** (1033.30) (135.31) 𝑠𝑝!,!(-3) 0.938*** (1977.05) 𝐸! ∆𝑝𝑡!!!,! 0.0255*** 0.0254*** (24.54) (24.41) ∆𝑠𝑝!!!,!(-15) 0.0183*** (2.97) YEAR DUMMIES yes yes yes yes COMPANY DUMMIES yes yes yes yes
CONSTANT 0.693*** 0.00267** 0.00474*** 0.00473*** (234.62) (2.48) (2.85) (2.84) N 536993 536936 81064 81042
Table 2.8 gives the results of my analysis. In column 1 I regress the log of the share
price at the announcement date on the natural logarithms of the price target.25 Column 2 shows
the results of regressing the natural logarithm of share price on the natural logarithms of price
target and the natural logarithm of the closing share price three days before a new price target is
announced. Column 3 regress the difference of the natural logarithms of the stock closing price
at the announcement of the price target with the natural logarithms of the share price of the
previous stock announcement on the difference of the logarithms of price target with the log of
24 The results hold also assuming that errors are uncorrelated and adopting the following specifications: 𝑙𝑛(𝑠𝑝!,!) = 𝛼 + 𝛽!𝑙𝑛 𝑝𝑡!,! + 𝛽!𝑙𝑛 𝑠𝑝!!!,! + 𝜕𝑦𝑟 ∗ +𝜂! + 𝜀!,! or 𝑙𝑛(𝑠𝑝!,! 𝑠𝑝!!!,!) = 𝛼 + 𝛽!𝑙𝑛
𝑝𝑡!,! 𝑠𝑝!!!,! +𝜕𝑦𝑟 ∗ +𝜂! + 𝜀!,! 25 I obtain similar results by regressing the log of a stock closing price 15 days and 30 days after the announcement respectively on the natural logarithms of a price target.

47
the previous price target. (-15) is defined as the logarithms of the stock closing price at the
announcement date less the logarithms of share closing price 15 days before the announcement.
Intuitively, columns 3 and 4 test if a change in the price target produces a change in the share
price. The results show that as soon as analysts release a price target adding new information to
a previous price target, the market reacts. The coefficient is positive and significantly different
from zero. Therefore, I conclude that a positive price target announcement led to an increase in
the share price.
The next question I ask about the price targets is whether or not they are scheduled over
time in such a way as to be potentially useful in deciding on granting stock options. I define an
announcement as scheduled if the firm has received at least one price target the previous year,
and if the actual announcement was done by the same broker within a 7 days window around
one-year anniversary of the previous announcement.26 The first column of table 2.9 shows how
many scheduled announcements were made each year. Column 2 gives the number of
announcements for which the company has already received at least one price target from the
same broker firm last year. Column 3 reports the percentage of announcements for which the
company has received at least one price target last year by the same broker company that were
also scheduled. As a general trend, the number of scheduled announcements has risen from
almost 16% to 30%.
Bradshaw et al. (2012) show that target price revision is positively associated with price
target accuracy. They define a price target as reviewed if it is issued over one week to six
months after a previous price target. Adopting a similar classification and defining a price
target as reviewed if the same broker company issued it seven days to 180 days after a previous
26 I treat 242 announcements as scheduled even if no announcements were reported the previous calendar year. For example, an analysts issue no announcements in 1999. In 2000 the analyst issues a price target at the begin of January, and another at the end of December. If the latter one was issued in a window of one week from the announcement made in January, I consider it as scheduled.

48
announcement, I find that approximately 70% of price targets are a revision of a previous
announcement and 20.37% of reviewed price targets are scheduled.27
Table 2.9: Scheduled price target’s announcements.
(1) (2) (3)
# scheduled # already
% scheduled
2000 2188 174778 1.25% 2001 3204 20322 15.77% 2002 5500 30078 18.29% 2003 7134 33669 21.19% 2004 9223 38789 23.78% 2005 10106 40984 24.66% 2006 11259 42785 26.32% 2007 13000 48854 26.61% 2008 15292 58448 26.16% 2009 16899 56895 29.70% 2010 19625 62078 31.61% 2011 21162 71241 29.70%
However, as shown, 98% of price target announcements have 12-months horizon. Thus, what it
is considered a revision actually adds extra information. Indeed, if a price target with one-year
horizon is announced in January 2000 and a so called 12-month forecast “revision” is made in
March 2000, the new price target actually add three extra months to the previous forecast. The
new price target announcement might be considered a revision if the horizon is nine months,
since it would refer to the same forecast period previously considered. Because I focus
exclusively on 12-months horizon price target, I do not make a distinction between a price
target announcement and a price target revision. However, it is still true that many
announcements update previous forecasts. The frequency with which price targets are updated
increases the accuracy of a price target, but it might also undermine the credibility of analyst’
price targets.
27 Reviewed price target were roughly 40.04% in 1999, 57,59% in 2000, 58.25 in 2001, 66.32 in 2002, 68.28% in 2003, 70.63% in 2004, 70.16% in 2005, 71.73% in 2007, 75% in 2008, 77.91 in 2009, 72.3% in 2010 and 74.96% in 2011, while the announcements that were reviewed and scheduled at the same time grew from 12.1% in 1999 to 29.56% in 2011.

49
6. Conclusion
This chapter has introduced the IBES History Price Targets data file from 1999 to 2011
- a data set that has been available for academic research beginning in 2009 - which I use to test
the arms-length bargaining and managerial power models of setting the compensation of CEOs.
It shows that 98% of price targets have one-year horizon; that the number of announcements
depends positively on the stock price volatility; that the percentage of scheduled
announcements has risen from 15% in 2001 to almost 30% in 2011; and that price target are
generally accurate and thus that investors can rely on them. The evidence that positive
(negative) announcements are followed shortly thereafter by an increase (decrease) in share
price implies that investors incorporate analysts’ information in valuing firms. Do boards and
CEOs do the same? The next two chapters show that they do and in ways that cast light on the
arms-length bargaining and managerial power models of setting CEO compensation.

50
Appendix 2.A: Price targets accuracy: two different models
In this appendix I adopt two different models to test if the price targets are accurate. I
show that in all two models investors can rely on price targets.
The first model tests whether a shocks in the price targets is followed by a shock in the
share price. In particular, I test if a change in prediction is followed by a change in the share
price. More formally, I test the following model:
∆𝑠𝑝!!!,! = 𝛼 + 𝛽𝐸! ∆𝑝𝑡!!!,! + 𝜕𝑦𝑟 ∗+𝜂! + 𝜀!!!,! (2.2)
where ∆𝑠𝑝!!!,! is the difference of natural logarithms of the effective stock closing price one
year after the first 12-months forecast less the natural logarithms of first effective stock closing
price. 𝐸! ∆𝑝𝑡!!!,! is similarly defined as the difference of natural logarithms of the price target
less the natural logarithms of the previous price target.
Table 2.10: Testing analysts' forecast. Estimates are reported. *, **, *** indicate significance at 10%, 5% and 1% levels respectively. The t-statistic are reported in parentheses. (1) (2) ∆𝑠𝑝!!!,! ∆𝑠𝑝!!!,! 𝐸! ∆𝑝𝑡!!!,! 0.00222** 0.00213** (2.57) (2.47) YEAR DUMMIES yes no COMPANY DUMMIES yes yes CONSTANT -0.00614*** -0.000467*** (-4.66) (-2.67) N 63641 63641
A second approach directly tests the price level. More specifically,
𝑠𝑝!!!,! = 𝛼 + 𝛽𝐸! 𝑝𝑡!!!,! + 𝑠𝑝!,! + 𝜕𝑦𝑟 ∗+𝜂! + 𝜀!!!,! (2.3)
where 𝑠𝑝!!!,! is the natural logarithm of the stock closing price one year after the forecast is
made and 𝐸! 𝑝𝑡!!!,! is the natural logarithm of the price target announced at time t. 𝑠𝑝!,! is the

51
natural logarithm 15 (30) days before the announce was done. Indeed, as the literature pointed
the price target is positively correlated with the share price. Thus, in order to control for
correlation errors I lag the stock closing price, taking the stock closing price 15 (30) days
before the announcement.
Table 2.11: Testing analysts' forecast. Estimates are reported. *, **, *** indicate significance at 10%, 5% and 1% levels respectively. The t-statistic are reported in parentheses. (1) (2) (3) (4) (5) 𝑠𝑝!!!,! 𝑠𝑝!!!,! 𝑠𝑝!!!,! 𝑠𝑝!!!,! 𝑠𝑝!!!,! 𝐸! 𝑝𝑡!!!,! 0.375*** -0.0217*** 0.0528*** 0.102*** 0.349*** (270.00) (-9.75) (24.20) (48.38) (244.52) 𝑠𝑝!,!(0) 0.513*** (221.53) 𝑠𝑝!,!(15) 0.433*** (187.06) 𝑠𝑝!,!(30) 0.381*** (168.77) YEAR DUMMIES
yes yes yes yes no
COMPANY DUMMIES yes yes yes yes yes
CONSTANT 1.942*** 1.521*** 1.542*** 1.556*** 1.972*** (346.41) (269.50) (265.73) (263.51) (420.94) N 439375 439250 439050 437682 439375
Table 2.11 reports the results. Column two shows that the price target coefficient switch
from positive to negative, if I introduce the stock closing price at the announcement day. This is
due to the positive correlation between the share price and the price target at the announcement,
which let the errors be correlated. One way to control it is to lag the stock closing price. In
column three I lag the stock closing price of 15 days while in column four I lag it of 30 days.
Once controlling for the errors correlation, the results show that price targets are positively
associated with effective stock price at the forecasted date and thus investors can rely on
analysts’ forecasts.

52
Chapter Three: The Effect of Price Targets on the Composition of CEO Pay
1. Introduction
In this chapter I analyze the impact of an indicator of the likely future change in a firms'
stock price on executive compensation. The indicator is the expectations that market analysts
give for the firms' share price in the next year as reported by the Institutional Broker Estimate
System in its Detail Price History Target data base, as described in chapter two. The share price
that analysts expect for a firm in the future has not to my knowledge been previously analyzed
in studies of executive compensation. I show that its relation to the composition of executive
compensation provides insights into the determinants of executive pay.
My main finding is that analysts’ forecasts of the share price affect the structure of CEO
compensation. I then examine how well the two main models of the determination of executive
pay - the arm’s length bargaining model, which assumes the board of directors contract top
executives pay to maximize shareholders’ interests; and the managerial power model, which
assumes the board of directors maximizes managers’ compensation within constraints imposed
by social costs and market penalties (Bebchuk et al, 2005), account for estimated relations
between expected share prices and compensation. Reviewing empirical studies, Frydman et al.
(2010) conclude “both managerial-power and competitive market forces are important
determinants of CEO pay” but leave open the question of their relative importance. Extant
analyses of the substitution between cash-based and stock-based pay in executive compensation
have not analyzed the effect of analysts' expected changes in share prices on that substitution
nor sought insight into the arm’s-length bargaining and the managerial power models from
such data.
As described in chapter two, the IBES Detail History Price Target data file reports

53
companies’ price targets from different analysts. Analysts’ announcements are public
information available to the board of directors and to shareholders as opposed to private
information that managers can use to structure compensation for their benefit at the expense of
shareholders. Managers may influence analysts’ recommendations and/or anticipate them but
public information gives them less room to manipulate their compensation than private
information.
I find that analysts' price targets alter the composition of executive pay between cash-
based compensation and stock-based compensation. When analysts forecast a rise in the share
price for a firm, its compensation package tilts toward stock-based compensation. When
analysts forecast a fall in the share price, the compensation package tilts toward cash-based
compensation. This pattern is more readily explicable by the managerial power model than the
arm’s length bargaining model. Consistent with this interpretation, the trade-off is stronger in
companies that have weaker corporate governance.
2. Background
Shareholders hire executives to act in their interest. But managers have information that
shareholders do not have, and they can exploit that information for their benefit. Thus,
managers’ interests are generally not fully aligned with shareholders’ interests. The principal-
agent theory suggests that the agency cost rising from separation of ownership and control can
be mitigated through stock-based compensation that links executive pay to the share price of
the firm, which reflects company performance.
The ideal board model of setting executive compensation posits that the firm's board of
directors bargain at arm's length with executives for a stock-based incentive scheme that ideally
induces management to maximize shareholders wealth. Motivated by the desire to better align

54
compensation and shareholder value, major firms shifted executive pay from cash-based
salaries to stock-based compensation, primarily stock options, from the 1980s to the 2000s. In
the late 2000s, they began to shift stock-based compensation from options to restricted stock
grants.
The managerial power model questions the efficacy of stock-based incentives to solve
the principal agent models and views incentive schemes as part of the agency problem itself. It
argues that boards of directors whose members may be in part chosen by executives and in
which executives serve do not bargain ideally on behalf of shareholders. Bebchuk et al (2003)
explore how the two models influence top executive compensation and direct attention at
aspects of executive pay determination that the arm’s-length bargaining cannot explain. They
argue that the observed pay structure is most likely a compromise between market forces,
which mitigates managerial rent-seeking, and managerial-power that favors top executive
compensation. Analyzing the growth of manager compensation during the period 1993-2003,
Bebchuk et al., (2005) note that equity-based compensation, consisting largely of stock options,
increased considerably without any reduction of cash-based compensation. This raises the
possibility that the complexity of options may have given executives a way to increase their
compensation.
There are measurement and modeling issues in comparing the value of stock options to
salary or other cash-based pay. Hall et al. (2002) have argued that the Black-Scholes formula
traditionally used to value stock option compensation overstates the value of options granted to
executives. The Black-Scholes method assume that the holders of options are risk neutral
inasmuch as they can hedge the risk by short selling and diversifying their portfolio. If
managers cannot hedge the risk because they have to keep their compensation aligned with
firms’ performance, they face a higher risk-related cost for exchanging cash-compensation for
options. Murphy (2002) claims that executives are willing to exchange cash for options but for
a risk premium.

55
On the other side, Bettis et al. (1999) give evidence that executives hedge some options.
There are, moreover, other forms of compensation policy that mitigate the opportunity cost of
holding stock instead of cash. When options go underwater companies often seek to re-align
incentives by granting extra options (makeup grants), or by deleting underwater options and
granting new ones in a “6&1 exchange” no earlier than six months and one day, where the
timing reflects accounting rules. Less common is the practice of repricing options by reducing
the exercise price of existing underwater options. There is a danger that such re-alignment
policies may have adverse effects on incentives since they compensate executives despite poor
performances. To the extent that firms adopt such policies, they reduce the risk of receiving
stock-based compensation instead of cash, which mitigates against the Hall et al critique.28
Balachandran et al. (2004) find that firms are more likely to grant extra options without
changing salaries when the firm performs poorly and existing options go under water.
The shift from cash-based compensation to options is also impacted by the tax
advantages to the firm of paying large amounts as stock options rather than as cash.29 Under
Section 162m of the US tax code a firm can deduct incentive pay to executives over $1 million
as a cost of business but it cannot deduct a salary over $1 million as a cost of business. Since
paying executives in a way that minimizes taxes is in the interest of shareholders, an optimal
board may choose to pay with options even if the options do not truly align management and
shareholder interests. As some executives have gained massively from options even when their
firm is doing poorly, shareholders and the public have become more critical of options.
28 As Zamora (2005) points out some scholars argue that firms adopt such responses as alternative source of financing. Indeed, by replacing cash-based compensation by stock-based, firms may finance other project in the short run. However, Zamora (2005) find evidence that companies do not recur to options grants to alleviate cash flow problem. 29 There are two kinds of options: Non-Qualified stock options and Incentive stock options. The first one, allows firm to deduce them from taxes. However, the employee is taxed on the spread between market and exercise price once he or she exercise them. The advantage for the employee is that there is no holding requirement. On the other hand, Incentive Stock Options confer a better tax treatment to executives but impose the holder to hold onto the stock for a longer period, which raises the risk. Plus, firm cannot deduce the gain as compensation expense. The not holding requirement and the deducibility explains the popularity of Non-Qualified options.

56
Kuhnen et al. (2012) shows that in the recent shift out of stock options to less contentious form
of compensation such as salary is associated with increased press negativity toward options.
In short, there are several factors associated with the allocation of compensation
between cash-based and stock-based pay: shareholder desire to align management interests
with their own; tax advantages of compensation beyond a million dollars, publicity and
shareholder concern over excessive pay, and the risk trade-off to executive of compensation in
options to compensation in cash.
3. Data
My analysis uses the two data sets on executive compensation described in chapter one
and the IBES price target data described in chapter 2 to examine how analysts targets affect the
composition of compensation.
The first data set on executive compensation is Standard & Poor's Executive
Compensation data set (Execucomp) for fiscal year 1999 through fiscal year 2010, as described
in detail in chapter one of this thesis. I focus my analysis on CEOs. I take the following
information from Execucomp: the dollar value of salary (Execucomp variable SALARY in
thousands of dollars), bonus (Execucomp variable BONUS in thousands of dollars), the value
of stock options awarded (Execucomp variable BLK_VALUE until 2006, rename as
AWARD_FV thereafter), the value of stock awards (Execucomp variable RSTKGRANT
before 2006, renamed STOCK_AWARD_FV thereafter), the Long Term Incentive Payout
(LTIP), Deferred Compensation Earnings Reported as Compensation
(DEFER_RPT_AS_COMP_TOT, available only after 2006) and All Other Total
(ALLOTHTOT substituted in 2006 by OTHCOMP). I also collect the number of derivatives
granted to each manager (Execucomp variable OPTION_AWARD_NUM). In 20 cases

57
Execucomp indicates two officers as CEOs for the same firms, which become 9 in the final
data set (once I drop firms for which was not possible assign a PERMNO). I therefore use the
mean.
To obtain detailed information on stock options, I use data from the Thomson-Reuters
Insider Filing Data Feed (IFDF) Table II, as described in chapter one. I obtain the number of
options granted, the official grant date, the exercise date, the expiring date and the exercise
price of options awarded to company’s CEO, which allow inferring the percentage of options
scheduled, unscheduled or backdated. I merge the IFDF and the fiscal year Execucomp data
using the PERMNO code for a firm. The IFDF provides me with information that I use to
estimate the percentage of scheduled, unscheduled and backdated options. I drop firms for
which I could not match the data sets by the PERMNO code.
Finally, I link this compensation data to the price target data obtained from the
Institutional Broker Estimate System (IBES) Detail History Price Target data file. The IBES
data records analysts’ price targets level, analysts’ name, the company he/she works for,
company for which he/she issues the target price, the horizon-period, the day the price target
was announced and when it became active in IBES data file, the company currency and
whether or not the company is a US firm. I limit my analysis to US firms.
4. Trade-off between cash-based compensation and stock-based compensation
The first step in my analysis is to examine whether the board of directors takes into
account price targets when setting CEO pay. The null hypothesis is that the board sets CEO
compensation independently from the likely course of company share price. There are two
alternative scenarios. The first is that the firm shifts CEO pay from cash-based compensation to
stock-based compensation when prices are expected to rise, which makes options more

58
desirable and shifts CEO pay from stock-based compensation to cash-based compensation
when prices are expected to fall, which makes options given at the money less desirable to the
CEO. This strategy benefits executives. The alternative policy would be for the firm to shift
CEO pay away from stock-based compensation when it expects the share price to rise. Since
the options are expected to be more valuable in the future, a smaller number would give the
executive the same value and incentive.
I focus on IFDF companies for which IBES issue price targets and Execucomp reports
compensation details.30 Equation (3.1) defines the empirical model I estimate:
𝐷𝐸𝑃_𝑉𝐴𝑅𝒊,𝒕 =∝ +𝛽!𝐸𝑋𝑃𝑅𝑂𝐹𝐼𝑇!,! + 𝛽!𝑋!,! + 𝛿𝑦𝑟 ∗+𝜆! + 𝜀!,! (3.1)
DEP_VARi,t stands for dependent variable. In this section my dependent variable is the share of
the executive's pay package that takes the form of stock-based compensation, SBC, defined as
the sum of stock options and stock award divided by total compensation as reported by
Execucomp (TDC1). By definition, it is one minus the share of executive pay that is cash-
based.
The explanatory variable of interest in this analysis is the fiscal year average of the
difference between the price target and the stock closing price, which I label EXPROFIT. I
calculate this variable by subtracting from the price target the stock closing price at the
announcement day obtained from CRSP (intrinsic value, using the stock options terminology)
for IFDF companies for which IBES reports price targets in a fiscal year. I then compute the
average difference between the price target and the stock closing price for the fiscal year. I use
the Compustat variable FYR, which measures the months on which a given firm's fiscal year
ends, from Execucomp, to allocate each closing price and price target to the right fiscal years
30 In the appendix I discuss the substitution effect for the entire companies reported by Execucomp datasets for which IBES provides price targets.

59
from 1999 to 2010. If no FYR information is available I assume that fiscal year coincides with
calendar year, since ¾ of S&P500 companies have a calendar year fiscal year (Wharton
Research Data Services, n.d.). The reason I transform the data onto a fiscal year basis is that the
information in Execucomp is on a fiscal year basis.
I also include a vector of measures of the financial and economic characteristics of the
firm:
• RETURN: is the rate of return.
• SALE: is the natural logarithm of the gross sales or of the amount of billing for regular
sales in thousand of dollars.
• CHSR: is the number of shareholders of ordinary shares/common capital (in thousands
dollars).
• EFFICIENCY: is the difference between Tobins Q at time t and Tobins Q at time (t-1).
When EFFICIENCY is low, there should pressure on management to restore it.
• FEMALE: a dummy variable taking the value of one if the CEO is a woman. If more
than two CEOs are reported in a firms it stands for the percentage of female as CEO.
• AVGAGE: indicate the age of the CEO. If more than one CEO is reported in a
company, the item stands for the average age of the officers.
• AT: is the natural logarithm of the current assets in million.
• yr* stands for time dummies for each fiscal year from 1999 to 2010.
• λi is the firm fixed effect.
Table 3.1 summarizes the results of an OLS regression of equation 3.1 in which I
include company fixed effects. The estimated coefficient on the EXPROFIT variable measures
the effect of share price expectancy on CEO stock-based compensation.

60
Table 3.1: Multivariate analysis of substitution between cash-based compensation and stock-based compensation for CEOs for the period from 1999 to 2010. Estimates are reported. *, **, *** indicate significance at 10%, 5% and 1% levels respectively. The t-statistic are reported in parentheses. (1) (2) (3) (4) (5) SBC SBC SBC SBC SBC EXPROFIT 0.000473*** 0.000407** 0.000447*** 0.000454** 0.000433** (2.85) (2.44) (2.71) (2.10) (2.01) SBC_1 0.0339*** 0.0365*** (3.53) (3.71) EXPROFIT_1 -0.00000155 -0.00000488 (-0.01) (-0.02) RETURN -0.0388*** -0.0386*** -0.0386*** -0.0351*** -0.0351*** (-7.15) (-7.11) (-7.11) (-6.00) (-6.00) SALE 0.00321 -0.0277** 0.00270 0.000705 0.000549 (0.41) (-2.54) (0.34) (0.09) (0.07) CSHR 0.00000440 -0.00000870 0.00000944 0.0000166 0.0000215 (0.08) (-0.16) (0.17) (0.29) (0.38) EFFICIENCY 0.00241* 0.00318** 0.00195 -0.000107 -0.000239 (1.69) (2.22) (1.37) (-0.06) (-0.13) FEMALE 0.0349 0.0386 0.0330 0.0335 0.0329 (1.44) (1.59) (1.37) (1.34) (1.32) AVGAGE 0.000801*** 0.000804*** 0.000795*** 0.000721*** 0.000694*** (3.70) (3.71) (3.66) (3.22) (3.10) AT 0.0450*** (4.09) YEAR DUMMIES
yes yes yes yes yes
COMPANY DUMMY
yes yes yes yes yes
CONSTANT 0.395*** 0.286*** 0.383*** 0.418*** 0.403*** (6.78) (4.49) (6.56) (6.91) (6.65) N 11909 11909 11823 11394 11317
The estimates show first that price target matters in compensation. In all of the
calculations, the expected future share price enters with a substantial and significant positive
coefficient. There is a strong trade-off between cash-based compensation (salary, bonus and
“others compensation”) and more risky stock-based forms of reward (stock options and stock
award). The higher the expected profit (measured as the difference between the future price and
the stock closing price) the higher is the share of CEO pay given in stock or stock options.
Some of other regression coefficients also deserve attention. Older CEOs receive a greater
share of pay in stock-based compensation. This might due to the fact that they have more assets
than younger CEOs and thus are less risk-adverse. In the regression that includes measure of
total asset, the variable for sales is significantly positive. This might due to the fact that both

61
sales and assets reflect the size of the firm or that CEOs view a high sales to asset ratio as an
indicator of future share prices.
Could the relation between the analysts' target price relative to the stock closing price at
the time the target price was given and the stock-based share of compensation result from a
reverse causality? Stock options are granted with the purpose of giving the CEO incentives to
undertake policies that raise share price. It is possible that analysts take into account CEOs’
compensation when issuing price targets on the assumption that a greater stock-based share of
compensation does in fact raise the share price a year later. But such an interpretation runs into
two difficulties. First, there is no compelling evidence that greater stock options are associated
with future improvements in share prices. The empirical work shows that options produce a
strong positive contemporaneous relation between share prices and executive compensation,
not that greater options in t are associated with a future increase in share prices from t to t+1.
Second, the analysts would have to know the compensation plans of the firm before they made
their price target, which is highly dubious, as compensation committees are unlikely to divulge
to outsiders their intended pay to their CEO. Third, even if the analysts knew company plans
for regular scheduled options or extrapolated previous option grants, they cannot plausibly
know about company plans unscheduled options that are, by definition, granted at irregular
interval. In the appendix, I show that price targets are positively associated with unscheduled
options but not with scheduled ones, and thus that I can exclude a reverse causality between
price targets and stock-based compensation.
4.1 Price targets and Non-equity incentives and LTIP
A component of CEO’s cash-based compensation that has received little analytic
attention in the executive compensation literature is payments labeled “non-equity incentives”.

62
Non-equity incentives differ from other forms of cash-based compensation because executives
have to meet certain pre-established and disclosed criteria to obtain them. The SEC introduced
the term “non-equity incentives” to define cash incentive awarded if executives meet a
disclosed pre-established target. LTIP are earned if CEO satisfies criteria measured over a time
period longer than one year, typically three to six years (Larcker, 1983). The firm usually
expresses the target in terms of earnings per shares set at the beginning of the award period.
Execucomp reports LTIP until 2006 when it constituted approximately 7% of CEOs’ total
compensation (TDC1). Execucomp did not report when performance goals were established
and thus when price targets could have affected LTIP compensation. Before 2006 Execucomp
defined cash-based compensation beyond salaries as a bonus but in 2006 it added the non-
equity incentive category and limited bonuses to cash compensation given for reaching
undisclosed goals. The result is a discontinuity in the Execucomp data. In 2005 bonuses were
21% of total compensation whereas in 2006 bonuses were less than 10% of total compensation.
But LTIP, bonus, and non-equity incentives constitute on average 27% of CEO’s total
compensation, which suggest that the categories as a group basically reflect the old bonus
category.
The value earned as LTIP and non-equity incentive is disclosed when the executive
satisfies the performance criteria, not when it sets the criterion. This is very different from
stock options, where the firm discloses the options when granted. Price targets might affect
non-equity incentives when the firm sets the criteria for gaining the extra pay for meeting the
criteria. But price targets cannot affect non-equity incentives when the firm reports the
outcomes. To the extent that price targets affect the compensation labeled as non-equity
incentive, it must do so with a lag. Balachandran et al. (2010) report that in most cases, firms
set non-equity incentives annually based upon a single year targets. Therefore, to estimate the
possible impact of price targets on non-equity incentive, I examine the relation between non-
equity incentives and EXPROFIT lagged one year.

63
Even with the lag, there could be a positive simultaneous correlation (but not causality)
between the expected share price and non-equity incentive. For example, suppose that a
company sets a non-equity incentive at time t-s. If at time t the sector is booming, the executive
will likely meet the performance criteria. If analysts issue a high price target for the company
because they expected the boom to continue, we would obtain a positive correlation between
share price and non-equity incentives even though there is no causal relation between them. A
future price target cannot affect the terms of a non-equity incentive that were set a year earlier.
To estimate the impact of price targets on the new variable “non-equity incentive” I
proceeded as follow. First, I defined the dependent variable as the value of non-equity incentive
divided by total compensation. I then lagged the main independent variable EXPROFIT by one
year on the notion that the firm could have taken account of that information in setting the
terms that would determine non-equity pay a year later.
The results in table 3.2 show a positive insignificant relation between price targets and
non-equity incentive in the same period. When I add a measure of the rate of return to reflect
the company’s performance, arguably a better indicator of the likelihood that the executive
would have met the criterion for the non-equity incentive, the magnitude of the estimated
coefficient on EXPROFIT decreases. But the key estimated parameter in the table is the
coefficient linking the lag of EXPROFIT and non-equity incentives. It is significantly negative.
This confirms the table 3.1 finding that firms shift away from cash-based compensation for
CEOs when the share price is expected to rise, even from non-equity incentives. They trade
non-equity incentive for forms of compensation, like stock options, that are more highly
leveraged to increases in share prices.
Why does the firm treat non-equity incentives different from stock-based incentives?
One might argue that CEOs regard non-equity incentives as stock options since they are earned
only if a pre-set criterion is met. The higher the price target is, the higher the probability of
reaching the goal so that the CEO would gain from both non-equity incentives and stock

64
options. However, there is a major difference between options and non-equity incentives. The
intrinsic value of an option depends exclusively on the share price: if the share price is above
the strike price the option is in the money. If the price is below the strike price, the option run
out of the money and cannot be cashed. Non-equity incentives, by contrast, are not exclusively
linked to share price and may indeed relate to other performance goals. If the share price is
expected to fall, a CEO might convince the board to set the criteria for her/his non-equity
incentives based upon goals other than the share price - for instance market share or increases
in sales. Finally, non-equity incentives are tax-attractive for companies. Firms can qualify for
the deduction under the section 162 of tax code as long as they meet a pre-established
performance goal of almost any kind, including a “performance goal need not, however, be
based upon an increase or positive results under a business criterion” (Section 162(m) of the
Internal Revenue Code). If a firm's share price is expected to fall, the firm would set a criteria
for a non-equity incentive to be a smaller drop in the share price than analysts expected.
The results in table 3.2 show a positive insignificant relation between price targets and
non-equity incentive (NON- EQUITY INC) in the same period. When I add a measure of the
rate of return to reflect the company’s performance, arguably a better indicator of the likelihood
that the executive would have met the criterion for the non-equity incentive, the magnitude of
the estimated coefficient on EXPROFIT decreases. But the key estimated parameter in the table
is the coefficient linking the lag of EXPROFIT (EXPROFIT_1) and non-equity incentives. It is
significantly negative. This confirms the table 3.1 finding that firms shift away from cash-based
compensation for CEOs when the share price is expected to rise, even from non-equity
incentives. They trade non-equity incentive for forms of compensation, like stock options, that
are more highly leveraged to increases in share prices.
Why does the firm treat non-equity incentives different from stock-based incentives?
One might argue that CEOs regard non-equity incentives as stock options since they are earned
only if a pre-set criteria is met.
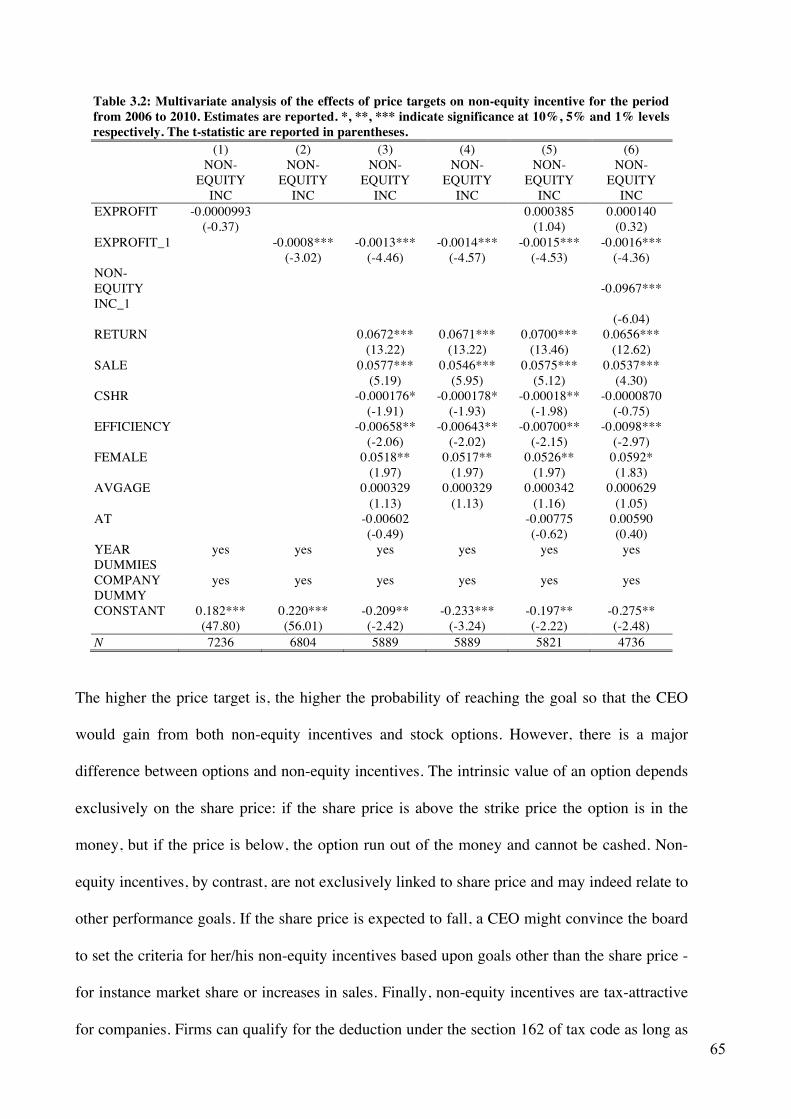
65
Table 3.2: Multivariate analysis of the effects of price targets on non-equity incentive for the period from 2006 to 2010. Estimates are reported. *, **, *** indicate significance at 10%, 5% and 1% levels respectively. The t-statistic are reported in parentheses. (1) (2) (3) (4) (5) (6)
NON-
EQUITY INC
NON- EQUITY
INC
NON- EQUITY
INC
NON- EQUITY
INC
NON- EQUITY
INC
NON- EQUITY
INC EXPROFIT -0.0000993 0.000385 0.000140 (-0.37) (1.04) (0.32) EXPROFIT_1 -0.0008*** -0.0013*** -0.0014*** -0.0015*** -0.0016*** (-3.02) (-4.46) (-4.57) (-4.53) (-4.36) NON- EQUITY INC_1
-0.0967***
(-6.04) RETURN 0.0672*** 0.0671*** 0.0700*** 0.0656*** (13.22) (13.22) (13.46) (12.62) SALE 0.0577*** 0.0546*** 0.0575*** 0.0537*** (5.19) (5.95) (5.12) (4.30) CSHR -0.000176* -0.000178* -0.00018** -0.0000870 (-1.91) (-1.93) (-1.98) (-0.75) EFFICIENCY -0.00658** -0.00643** -0.00700** -0.0098*** (-2.06) (-2.02) (-2.15) (-2.97) FEMALE 0.0518** 0.0517** 0.0526** 0.0592* (1.97) (1.97) (1.97) (1.83) AVGAGE 0.000329 0.000329 0.000342 0.000629 (1.13) (1.13) (1.16) (1.05) AT -0.00602 -0.00775 0.00590 (-0.49) (-0.62) (0.40) YEAR DUMMIES
yes yes yes yes yes yes
COMPANY DUMMY
yes yes yes yes yes yes
CONSTANT 0.182*** 0.220*** -0.209** -0.233*** -0.197** -0.275** (47.80) (56.01) (-2.42) (-3.24) (-2.22) (-2.48) N 7236 6804 5889 5889 5821 4736
The higher the price target is, the higher the probability of reaching the goal so that the CEO
would gain from both non-equity incentives and stock options. However, there is a major
difference between options and non-equity incentives. The intrinsic value of an option depends
exclusively on the share price: if the share price is above the strike price the option is in the
money, but if the price is below, the option run out of the money and cannot be cashed. Non-
equity incentives, by contrast, are not exclusively linked to share price and may indeed relate to
other performance goals. If the share price is expected to fall, a CEO might convince the board
to set the criteria for her/his non-equity incentives based upon goals other than the share price -
for instance market share or increases in sales. Finally, non-equity incentives are tax-attractive
for companies. Firms can qualify for the deduction under the section 162 of tax code as long as

66
they meet a pre-established performance goal of almost any kind. If a firm's share price is
expected to fall, the firm would set a criteria for a non-equity incentive to be a smaller drop in
the share price than analysts expected.
5. Corporate governance structure
The analysis thus far has treated all firms the same, as if the two forces at work in
determining executive compensation - arms-length bargaining by boards vs. managerial rent-
seeking - had the same influence on pay in all firms. Using data on the structure of corporate
governance, I examine next whether firms with stronger or weaker governance evince larger
substitution between cash-compensation and stock-compensation in response to analyst
forecasts of share prices. Companies that act according to the arm’s length bargaining model
are less likely to substitute stock compensation for cash compensation when analysts expect
share prices to fall than companies that act according to managerial power model. CEOs facing
poor corporate governance have more room for rent-seeking than CEOs working for companies
with stronger corporate governance.
As my measure of corporate governance I used data on whether a CEO is or is not a
member of the board of directors. Thus, the CEO who is also member of the board has a
conflictual position inasmuch as she/he has to evaluate her/his performance and can influence
the compensation committee on her/his pay. I create a variable (BOARD) that indicates if the
CEO has served as member of the board of directors during the fiscal year. Execucomp reports
a true/false variable that indicates whether or not the CEO has served as a director. However,
this is not enough to define a CEO as a member of the board. I define a CEO as member of the
board if the CEO title contains the strings: “chmn”, “Chmn”, “chairman” or “Chairman”. In
228 cases Execucomp reports that CEOs have the title of the board but do not indicate whether

67
he/she served as director. I consider someone with those titles as being a member of the board
of directors. In 7,660 cases the CEO served as director but was not indicated as Chairman. I do
not consider them as members of directors.31 If more than one CEO is listed in the same
company for a given fiscal year, I take the sum of CEOs that are members of the board. Almost
78% of the firms report that CEO has been appointed member of the board for at least one
fiscal year. However, the percentage of firms with CEOs on the board of directors has
progressively diminished from 78% in 1996 to roughly 58% in 2010, which still constitutes the
majority.
Using BOARD as an indicator of poor corporate governance, I divide the dataset into
companies that have a CEO member of the board and companies that do not. I then run the
same regressions as in tables 3.1 and 3.2. Table 3.3.1 shows the coefficient and t-statistic on the
EXPROFIT variable using specifications (1) to (4) as in table 3.1 for the two groups of
companies. The estimates show that indeed corporate governance matters. Firms having its
CEO as a member of the board substitute cash-based compensation with stock-based
compensation according to price targets. By contrast, the minority of firms that have stronger
corporate governance do not set CEO compensation according to price targets. Similarly, table
3.3.2 reports the coefficient of one period lag of EXPROFIT (EXPROFIT_1) for specification
(2) to (5) in table 3.2 for both subgroups. The results shows that in both subgroups CEOs shift
away from cash-based compensation when the price target is expected to rise, but the
phenomenon is stronger in companies with weaker corporate governance.
31 Execucomp does not offer variables indicating whether a CEO is or not a member of the board (Wharton Research Data Service, n.d.). According to, WRDS the best way to do it is to look whether the CEO title contains the word “chairman”.

68
Table 3.3: Substitution between cash-based compensation and stock–based compensation for CEOs for the period from 1999 to 2010 by CEO subgroups. Estimates are reported. *, **, *** indicate significance at 10%, 5% and 1% levels respectively. The t-statistic are reported in parentheses. Table 3.3.1 SBC
specification EXPROFIT t-statistics N
CEO non member of the board (1) 0.000264 (1.26) 3820
(2) 0.000201 (0.96) 3820 (3) 0.000285 (1.37) 3787 (4) 0.000174 (0.63) 3648 (5) 0.000193 (0.70) 3619 CEO member of the board (1) 0.000674** (2.22) 8088
(2) 0.000635** (2.09) 8088 (3) 0.000633** (2.09) 8035 (4) 0.000911** (2.35) 7745 (5) 0.000842** (2.17) 7697
Table 3.3.2 Non-equity incentives
specification EXPROFIT_1 t-statistics N
CEO non member of the board (2) -0.000574 (-1.25) 2614
(3) -0.000908* (-1.67) 2259
(4) -0.000912* (-1.70) 2259
(5) -0.000827 (-1.42) 2225
(6) -0.00106 (-1.60) 1864
CEO member of the board (2) -0.000909*** (-2.85) 4189
(3) -0.00155*** (-4.19) 3629
(4) -0.00162*** (-4.41) 3629
(5) -0.00177*** (-4.42) 3595
(6) -0.00184*** (-3.97) 2872
8. Discussion
The findings that firms switch from cash-based compensation to stock-based
compensation of CEOs when analysts expect their share price to rise, and switch from stock-
based compensation to cash-based compensation when analysts expect share prices to fall, and
the stronger pattern in companies with weaker corporate governance can be interpreted under
both the managerial power model and the arm’s length bargaining model. Under the managerial

69
power model, a CEO will always seek ways to increase his or her income. They will try to
exchange cash for stock-based compensation when they expect the share price to rise, whatever
the causes of the rise, and prefer cash compensation when they expect the share price to fall.
Hence, a board dominated by the CEO and management would always substitute cash for
stock-based compensation according to share price targets.
Whether a board of directors acting under the arm’s length bargaining model would
trade-off cash-based compensation and stock-based compensation according to price targets is
less clear-cut. Suppose that the board of directors is fully able to screen CEO’s skills. One
might argue that, being able to determine CEO’s value, the ideal board would simply seek the
most efficient way to reward the CEO either using cash or stock compensation accordingly to
the contingencies, such as the tax law. Switching from cash-based compensation to stock-based
compensation when the share price is expected to rise, the board would save shareholders from
paying some costs. For instance, the board of directors may “inflate” the options’ value and
made it up to a desired amount by using price target information and take advantage of section
162m of tax code for gaining a favorable tax treatment.
But the ideal board would still want to incentivize CEOs by bonding CEO
compensation to share price. The principal-agent arguments still remain: no matters how much
manager’s skills are worth, the board needs to align shareholders’ interests to CEO’s personal
interests. Therefore, the ideal board still needs to determine the right stock-based compensation
that maximizes CEO incentives and promote shareholders’ interests independently from the
cash-based compensation. Under the arm’s length bargaining model, stock-based compensation
is efficiently set to maximize CEOs’ incentives independently from cash-based compensation.
From this perspective an ideal board should not contemplate a trade-off between stock-based
compensation and cash-based compensation.
Those companies lacking strong corporate governance are more likely to shift from
cash-based compensation to stock-based compensation in response to analysts announcing a

70
positive price target for their shares favors the managerial power model explanation of the
substitution effect between cash and stock according to price target. Indeed, the managerial
power model works under the hypothesis that managers can influence the board at their own
advantage. Obviously, a CEO that is also member of the board has more room to guide board’s
decision at her/his own advantage and take advantage of a rise in share price by substituting
cash with stock-based compensation. That the minority of firms that do not admit its CEO as
part of the board set their CEO pay independently from price targets nor shift from cash to
stock when it is most suitable for the CEO implies that the observed behavior reflects the
influence of CEOs on boards. I thus conclude that the substitution effect between cash-based
compensation and stock-based compensation according to the price targets is a strong argument
in favor of the managerial power model as a model that mostly explain CEO compensation. In
the appendix I give also evidence that CEOs are granted extra–unscheduled options when
analysts expect a rise in share price.
In sum, the relation between IBES reports on analysts’ price target announcements and
the stock-based share of executive compensation - increases in the stock-based share of
compensation when analysts expect a rise in share price, and decreases in the stock-based share
of compensation when analysts foresee a drop in company share price are more aligned with
the managerial power model of executive pay than with the arm’s bargaining model.

71
Appendix 3.A: Scheduled vs. unscheduled options
In this appendix I decompose the options granted into those granted at approximately
the same time as the previous that I have called scheduled options and those given at some
other time, which I have called unscheduled options. I estimate the two types of options react to
price targets announcements. Because scheduled stock options are granted with a regular
pattern, while unscheduled options are given at irregular times, it is reasonable to expect a
different relation to price targets announcement. A CEO may seek more options when a
positive price target announcement is released but when there are no options scheduled in the
period, the CEO will have to press the board for unscheduled options. This is likely to be
associated with a management dominated board. An arms-length bargaining board, by contrast,
might bargain with the CEO when setting scheduled options, taking account of recent price
target announcements. The board might seek to give fewer options to save the shareholders
money since each option would have greater value given the announcement while the CEO
would seek for the same reason. As an increasing number of options are scheduled, the key
issue would be the number of derivatives included in the scheduled options package when
analysts expect a rise in share price.32
Table 3.4 reports the distribution of options granted around price target announcements.
To construct the table, I looked to see if any price target announcements were reported seven
days before or seven days after any options transaction in IFDF. If more than one
announcement falls into the 14-days window, I retain only the announcement closest to the
options awarding day. I then take the difference between price target and stock closing price at
the announcement day.
32 One possible explanation I also explored is whether the board schedules options granting around scheduled price target announcements. However, I did not find consistent results.

72
Table 3.4: Distribution of options around price targets announcements.
Negative Independently Positive
# Options Granted (in
Mio) Total Options
1999 4.45% 89.19% 6.36% 385.67 2000 12.19% 71.64% 16.17% 518.32 2001 6.49% 72.97% 20.54% 628.16 2002 7.44% 70.39% 22.17% 553.08 2003 9.17% 69.15% 21.68% 546.18 2004 9.92% 68.94% 21.14% 518.89 2005 8.99% 69.30% 21.72% 489.51 2006 6.47% 61.73% 31.80% 455.88 2007 11.12% 60.93% 27.95% 429.27 2008 5.33% 60.11% 34.56% 511.37 2009 5.78% 45.92% 48.30% 659.23 2010 5.87% 59.15% 34.99% 364.67
Scheduled Options 1999 4.83% 89.66% 5.51% 70.42 2000 26.20% 56.01% 17.79% 94.64 2001 10.87% 64.51% 24.62% 113.15 2002 12.95% 59.69% 27.36% 116.89 2003 12.03% 55.55% 32.43% 113.48 2004 20.18% 52.42% 27.40% 113.14 2005 17.37% 48.82% 33.81% 115.58 2006 11.36% 49.63% 39.02% 100.59 2007 10.84% 46.38% 42.78% 100.82 2008 10.45% 39.21% 50.34% 144.7 2009 11.77% 38.24% 49.99% 172.95 2010 7.74% 42.13% 50.14% 139.82
Unscheduled Options 1999 7.23% 82.18% 10.59% 152.19 2000 8.28% 74.14% 17.58% 231.45 2001 7.12% 68.58% 24.30% 252.74 2002 6.36% 68.20% 25.44% 257.99 2003 9.43% 70.23% 20.34% 263.38 2004 7.30% 71.55% 21.15% 237.46 2005 7.08% 72.76% 20.16% 213.55 2006 5.32% 51.49% 43.19% 195.8 2007 8.29% 63.98% 27.73% 169.88 2008 5.00% 64.85% 30.15% 194.62 2009 5.35% 63.31% 31.35% 215.06 2010 6.54% 59.93% 33.54% 113.26
Finally, I sum the total number of options granted around a positive, or negative price target
announcement as well as those options granted independently from price targets by fiscal year.

73
Table 3.4 shows that the percentage of options granted around positive announcements
has grown substantially, which emphasizes once again how price targets play a growing role in
setting CEO compensation. The percentage of both unscheduled and unscheduled options
granted around positive announcements has also grown even though unscheduled options have
generally decreased since 2001. Only a small percentage of options are granted around negative
price targets announcement.
To study the relation between price targets and scheduled and unscheduled options,
taken separately, I merged IFDF data on the total number of unscheduled options granted in a
fiscal year and on scheduled options with data from Execucomp by fiscal year and companies.
Because Execucomp has so little information on options granted, it is not possible to inferring
from it whether options are scheduled or unscheduled. For consistency with the table 3.1
calculations, I define the amount of scheduled options as the percentage of scheduled option
inferred from IFDF multiplied by the number of options granted to CEO in Execucomp.
Similarly, I estimate the number of non-scheduled options granted by multiplying the total
options in Execucomp by the percentage of options that I estimate are non-scheduled from the
IFDF. Finally, I use equation (3.1) to test whatever price targets affect scheduled or
unscheduled options more. Table 3.5 summarizes the results.
The dependent variable is the number of options granted and not their value. In general,
the number of unscheduled options responds positively to price targets while there is no
significant association between price target and the number of scheduled options. The total
number of options granted (TOT) is also positively associated with price targets in all
specifications. The results also show that previous price targets are negatively associated with
unscheduled options. As shown in chapter 2, price targets are positively related to future share
prices. Thus, the forecasted increase of previous year share price boosted the value of
unscheduled options making them worth more. Besides, even the number of unscheduled
options granted last year is negatively associated with today’s number of unscheduled options.

74
On the contrary, the number of scheduled options granted last year is positively associated with
today’s scheduled options. This might be due to the fact that scheduled options are a fixed
component of CEO pay, and thus might be updated year after year as a sort of length of service
bonus (as it is confirmed by the positive relation with CEO’s age).
Table 3.5: Multivariate analysis of the effects of price targets on options from1999 to 2010. Estimates are reported. *, **, *** indicate significance at 10%, 5% and 1% levels respectively. The t-statistic are reported in parentheses.
(1) (2) (3) (4) (5) (6) TOT SCH UNSCH TOT SCH UNSCH EXPROFIT 1284.5** 91.77 842.8** -368.2 387.1 757.0** (2.48) (0.34) (2.03) (-0.45) (1.60) (2.16) EXPROFIT_1 -1096.9** 1.418 -819.9* -374.7 -180.3 -951.7*** (-2.25) (0.01) (-1.91) (-0.48) (-0.72) (-2.62) TOT_1 -0.805*** (-141.79) SCH_1 0.229*** (14.79) UNSCH_1 -0.0463*** (-2.94) RETURN -41055.7*** -5037.3 -29899.1** (-2.93) (-0.51) (-2.00) SALE -84266.4*** -24541.3 -47249.7 (-3.11) (-1.28) (-1.62) CSHR 742.2*** 124.9 -203.9* (5.41) (1.63) (-1.75) EFFICIENCY 28096.7*** 2441.1 18136.2*** (6.54) (0.89) (4.35) FEMALE -169405.2*** 33864.4 -254362*** (-2.83) (0.79) (-3.89) AVGAGE 300.1 888.1** 598.6 (0.56) (2.37) (1.05) AT 40370.1 32623.5* -12981.4 (1.48) (1.68) (-0.44) YEAR DUMMIES
yes yes yes yes yes yes
COMPANY DUMMY
yes yes yes yes yes yes
CONSTANT 738103.9*** -18984.5 629615.4*** 261507.0*** 143845.8*** 58932.6*** (4.66) (-0.16) (3.55) (7.96) (14.27) (4.04) N 11439 5513 5513 12901 7692 7692
Appendix 3.B: Dot.com companies
In the chapter I use companies that are reported in IBES, Execucomp and IFDF
datasets. IFDF is required to obtain information on stock options, like the amount scheduled or

75
unscheduled options. However, Execucomp includes other firms that do not appear in IFDF
(some of them because do not offer stock-based compensation).
In this appendix I study the substitution between cash-based compensation and stock-
based compensation in the expanded dataset, which includes all firms in Execucomp for which
IBES reports price targets.
As shown by the Venn diagram, in the chapter I focus on firms that result from crossing
all three dataset: IBES, IFDF and Execucomp. Execucomp covers 3,168 companies, and
roughly 87% (2,742) of them are also covered by IBES. Among such companies, IFDF covers
approximately 71% (1,946) of them.
As in text regressions, the expected profit is the yearly company average of the
difference between the price announced and the share price at the announcement days.
The results reported in table 3.6 show that by including all companies in Execucomp for
which IBES provide price target the substitution effect between cash-based compensation and
stock-based compensation disappears.
EXECUCOMP
IFDF
IBES

76
Table 3.6: Multivariate analysis of the effects of price targets on Execucomp firms and on Execucomp firms excluded dot.com companies from 1999 to 2010. Estimates are reported. *, **, *** indicate significance at 10%, 5% and 1% levels respectively. The t-statistic are reported in parentheses.
Execucomp Companies
(1) (2) (3) (4) SBC SBC SBC SBC EXPROFIT 0.0000114 0.0000091 0.00000906 -0.00000725
-0.53 -0.42 -0.42 (-0.33) SBC_1 0.0279*** -3.08 EXPROFIT_1 0.0000688***
-3.18 RETURN -0.0373*** -0.0370*** -0.0370*** -0.0343***
(-7.39) (-7.35) (-7.33) (-6.33) SALE 0.00277 -0.0319*** 0.00235 0.000932
-0.38 (-3.08) -0.32 -0.12 CSHR 0.0000276 0.0000122 0.0000316 0.0000389
-0.5 -0.22 -0.58 -0.7 EFFICIENCY 0.00290** 0.00370*** 0.00247* 0.000707
-2.15 -2.73 -1.83 -0.43 FEMALE 0.0202 0.0246 0.0188 0.0181
-0.87 -1.06 -0.82 -0.76 AVGAGE 0.000811*** 0.000814*** 0.000803*** 0.000747***
-4.06 -4.08 -4.01 -3.62 AT 0.0496*** -4.75 YEAR DUMMIES yes yes yes yes
COMPANY DUMMY yes yes yes yes
CONSTANT 0.404*** 0.277*** 0.396*** 0.409*** -6.99 -4.67 -6.8 -7.27
N 13666 13666 13570 13031

77
Table 3.6 (continued).
Excluded dot.com companies
(5) (6) (7) (8) SBC SBC SBC SBC EXPROFIT 0.000561*** 0.000506*** 0.000534*** 0.000624***
-3.62 -3.26 -3.45 -3.13 SBC_1 0.0252*** -2.67 EXPROFIT_1 -0.0000969
(-0.51) RETURN -0.0380*** -0.0378*** -0.0380*** -0.0397***
(-7.07) (-7.03) (-7.05) (-7.01) SALE -0.0113 -0.0429*** -0.0105 -0.0118
(-1.47) (-3.99) (-1.36) (-1.49) CSHR 0.000018 0.00000461 0.0000219 0.0000295
-0.33 -0.09 -0.41 -0.54 EFFICIENCY 0.000216 0.001 0.0000718 0.00104
-0.1 -0.47 -0.03 -0.47 FEMALE 0.016 0.0185 0.0145 0.0145
-0.66 -0.77 -0.6 -0.59 AVGAGE 0.00100*** 0.00100*** 0.000988*** 0.000901***
-4.96 -4.96 -4.88 -4.31 AT 0.0458*** -4.19 YEAR DUMMIES yes yes yes yes
COMPANY DUMMY yes yes yes yes
CONSTANT 0.476*** 0.366*** 0.460*** 0.486*** -8.37 -5.83 -8.03 -8.21
N 12691 12691 12605 12103
This result appears to be due to companies in the dot.com sector. Excluding those firms,
the evidence shows that price targets are significantly and positively associated with stock-
options compensation.33 Companies in the dot.com sector differ from other companies by two
main aspects. First of all, as Cowen et al. (2006) point out, dot.com companies received
overconfident optimistic price targets in the past, which were proven to be wrong once the
dot.com bubble collapsed. Thus, investors might have lost the confidence in analysts’ price
33 I proceed as follow. I use the 4-digit SIC-codes to assign each firm to one of the 49 industries as defined by French and Fama. I drop companies working in the “Computer Software” sector and finally run the same regression as specified in equation (3.1).

78
targets for such companies.34 Second, many dot.com firms paid their managers with stock
compensation during the “start up” period, since they have liquid issue.35 That is, because of the
nature of the sector that requires comparable high human capital but has relative fewer entrance
barriers, firms financed themselves by paying employees with stocks rather than (non-existent)
cash. In this case, the trade-off between cash and stock cannot be adopted as strategy. Indeed, I
do not find any significant association among price targets and the substitution effect for
dot.com firms.
34 Investors might look suspicious at analysts’ price target in software sector because of the dot.com collapse, despite I find that price targets are actually reliable (using the same procedure enlightened in chapter two). 35 Murphy (2003) uses Execucomp data between 1992 and 2001, finding that firms classified as “new economy” used stock option compensation more intensively than large firms.

79
Chapter Four: Stock Options: the End of Backdating
1. Introduction
Chapter one showed that the use of stock options as a form of compensation increased
in the 1990s to become the largest single component of CEOs compensation in 2000/2001.
According to the principal agent model, the more options the CEO holds, the more she/he is
incentivized to raise the share price above the strike price, which aligns the CEO's incentives
with that of shareholders.
Stock options give the right to buy company stock at a pre-established strike price or
exercise price. In US, stock options are usually granted at the money, so the strike price is the
stock price at the grant date. As the Wall Street Journal (Forelle et al., 2006) pointed out,
granting options in the money (i.e. when the strike price is below the share price) is not illegal
per se but granting options in the money is a cost in term of accounting rules that reduces the
profit and thus must be included into the company books. Also, in most cases the options plans
approved by shareholders explicitly requires that options be set at the money. A violation of
such condition could result in an allegation of security fraud (Forelle et al., 2006).
When options are granted at the money, executives can manipulate the timing of the
grants in order to inflate options’ value. Yermarck (1997) showed that company share price
tended to drop before options granting and increase afterward. Aboody et al. (2000), Chauvin
et al. (2001) argued that these abnormal patterns could be due to a manipulation of information
by officers. For instance, a CEO might withhold good news or release bad news before she/he
is awarded options - a practice known as spring loading. The subsequent fall in the share price
will guarantee to the receiver a lower strike price. Subsequently, a CEO might release positive
information right before exercising her/his options. Although these forms of timing
80
options/manipulating news announcements would be illegal as insider trading if the person was
to purchase or sell shares, it is viewed as legal in the granting or selling of options, though
many regard it as amoral.
Frydman et al. (2010) shows that spring loading alone cannot fully explain the
abnormal return around option grants nor can “luck” (Lie, 2005). Lie (2005) shows that this
abnormal pattern that most likely reason executives have historically made abnormal returns
from options is that the grant date was opportunistically chosen retroactively - a process known
as backdating. Backdating occurs when managers choose retroactively a past date as a grant
date when the share price was particularly low in order to have a favorable strike price.
Specifically, officers that backdate options go backward through the calendar looking for a date
in which the share price was particularly low. Once found, they announce the options as
granted at the money that day. As a result, they are able to obtain an option that looks granted
at the money but de facto is awarded in the money. Lie (2005) and Heron et al. (2007) have
used the abnormally low prices of shares at the dates when firms grant stock options to show
that backdating was frequent in the 1990s.
In 2002 the U.S. Senate introduced the Sarbanes–Oxley Act (SOX) in an attempt of
restore the trust in the market that the Enron and other corporate and accounting scandals had
destroyed along with millions of dollars of shareholder wealth. Among others countermeasures,
the SOX required that firms report to the SEC the options granted to insiders within two
business days, which if followed would have eliminated backdating though not spring loading.
Before August 2002, insiders had to file Form 4 and submit to the SEC “within ten days after
the close of the calendar month in which the transaction had occurred” (Brochet, 2010, p. 420).
In 2006, the SEC implemented the rules to increase the transparency of granting options. They
required that top officers disclose if they are “timing options grants to make them more
lucrative to executives and other employees” (Bickley, 2008, p. 15). Firms had to report to the
SEC the price at the grant days, the grant date, if the strike price was lower than the share price

81
as well as to give reasons for having chosen a particular date as a grant date (Bickley, 2008).
In this chapter I examine the effect of the SOX and its further implementation in 2006
on the extent of backdating of options. I find that it effectively ended this form of giving
options to executives. I then examine the extent to which firms substituted spring loading
strategies by strategically timing their options granting around price targets announcements as
an alternative way to assure that executives profited from options. The evidence shows that
price targets have increasingly played a crucial role in the options granting process. Firms
granted an increased number of options before analysts’ gave positive price target
announcements. The change in the mode of granting options is more consistent with the
managerial power model than the arm’s-length bargaining model of setting executive pay.
Before 2002, an arms-length bargaining board might consider granting backdated options after
a negative price targets announcement to avoid having underwater options that would reduce
the motivation of CEOs and other executives. After 2002, an the ideal board might still grant
options after a pessimistic price target caused by factors beyond the CEO’s control. But a board
dominated by management would behave differently. By definition a managerial power board
always favors a strategy that enriches the CEO. Before 2002, it would backdate options if the
share price were expected to rise while switching to other forms of compensation if the share
price is expected to fall. In 2002, once the SOX took place, such a board would switch from
backdating options to granting options before a positive price target announcement but not
before a negative price target announcement. The empirical evidence shows that boards
behaved according to the managerial strategy model.

82
2. Data and methodology
I obtained the official grant date, the exercise date, the expiry date and the exercise
price of insider's grants from IFDF. That information allows me to estimate the percentage of
options backdated as described in chapter one. I focus on transactions involving CEOs for the
fiscal years 1999 to 2010.
I obtained price target data from IBES, where price target is defined as “the projected
price level forecasted by an analyst within a specific time horizon” (Glushkov, 2009, p. 6).
Price forecasts are available from March 1999. I retained only 12 months horizon forecasts,
which constitute almost 98% of the entire dataset. Chapter 2 of this dissertation gives the
details of the dataset and show that price targets have predictive value about future share prices
and that the market responds to them in the short run, thus viewing them as valid information. I
merge IFDF information with IBES Detail History Price Target file. For every option granted I
determine whether IBES reports a price target announcement seven days before or after the
grant - a 14-day window.36 If more than one announcement was done within this window, I
retain the announcement closest to the grant date. I report the price target announced and the
announcement day. I create a dummy (BEFORE) taking the value of one if a stock option was
granted from one to seven days before a price target announcement and zero if it was granted
after or no price targets were announced in the 14-days window. Similarly, I create a true/false
variable (AFTER) taking the value of one if a stock option was granted zero to seven days after
an announcement, and zero if no announcement was reported within 14-days window or a price
target was announced before. Finally, I create a dummy (AROUND) taking the value of one if
the option was granted seven days after or seven days later or at the announcement date and
zero otherwise.
36 In the appendix I provide evidence for a window of 28 days.

83
Figure 4.1 shows the distance between the announcement date and the grant date (in
days). Fifty per cent of options granted around price targets are awarded before or at the price
target announcement day. Sixty percent of options granted at the announcement day are
unscheduled.
Figure 4.1: Difference between grant date and price target announcement day.
Table 4.1 reports the percentage of options granted before or at the announcement day,
after the announcement day or independently by which I mean outside the window covering the
price target announcement. The number of options granted independently of a price target
announcement decreased significantly in the 2000s through 2009. In 1999 about 90% of
options were granted independently from analysts’ announcements, while in 2009, it dropped to
46%. Though the percentage of options granted independently increased in 2010, the 59% was
still far below the 1999 level. Columns 2 and 3 show that the practice of granting options after
price targets announcement increased particularly sharply. The remaining columns show that
the increase is dominated by grants being given after announcements that foresee a rose in
share price. The options granted before a positive price target announcements doubled from
36% to 63% in ten years, while the options granted after a positive announcements fell from
0.0
5.1
.15
Den
sity
-10 -5 0 5 10Difference between grant date and price target announcement day

84
64% to less than 37%. Similarly, the options granted before a negative announcement
decreased from 65% to 47% from 1999 to 2007.
Table 4.1: Stock options granted before/after or independently from price targets announcements.
Year Total Options Increase in share price
expected (79% of grants)*
Decrease in share price
expected (21% of grants) *
(1) (2) (3) (4) (5) (6) (7)
before after indip. before after before after
1999 5.65% 5.16% 89.19% 35.69% 64.31% 64.88% 35.12%
2000 12.55% 15.80% 71.64% 53.36% 46.64% 58.87% 41.13%
2001 11.24% 15.79% 72.97% 55.41% 44.59% 71.70% 28.30%
2002 10.53% 19.08% 70.39% 65.22% 34.78% 62.73% 37.27%
2003 13.03% 17.82% 69.15% 57.64% 42.36% 58.33% 41.67%
2004 15.43% 15.63% 68.94% 48.92% 51.08% 52.97% 47.03%
2005 13.31% 17.39% 69.30% 58.06% 41.94% 52.91% 47.09%
2006 14.11% 24.16% 61.73% 65.21% 34.79% 52.38% 47.62%
2007 14.84% 24.23% 60.93% 67.88% 32.12% 46.53% 53.47%
2008 14.38% 25.51% 60.11% 63.28% 36.72% 73.44% 26.56%
2009 10.81% 43.27% 45.92% 81.31% 18.69% 72.78% 27.22%
2010 15.12% 25.74% 59.15% 63.11% 36.89% 70.97% 29.03%
*In 0.48% of cases options are granted around an announcement date for which I do not have information on share price at the announcement days.
To isolate the effect of the change in the law on the relation between price target
announcements and granting options, I generated a dummy variable called “SOX” that assumes
the value of 0 if the transaction occurred before 2002 and 1 if it was granted during 2002 or
later. This variable is designed to catch the effect of change in the reporting rules as prescribed
by the new law taking place in 2002. Likewise, I also create a variable defined “SEC” that it
takes the value of the unity if the options were granted after 2006, when the SEC strengthened
the SOX criteria.
85
3. Backdating
This section tests the effect of the change in reporting rules in preventing backdating in
the options granting process, and if this had an unanticipated effect in reinforcing spring
loading. The evidence tells a clear story. Introduction of the SOX in 2002 reduced backdating.
Before 2002 boards frequently backdated options by strategically picking a grant date in the
past on which the share price was particularly low. This backward strategy allowed CEOs
reporting a favorable low strike price, and by so, inflating the option’s value. After 2002, when
the SEC required that insiders report the options they were granted within two days, backdating
disappeared. But firms found another way to “inflate” the value of executives' options by using
analysts price targets, a forward-looking strategy.
3.1 Multivariate analysis
To estimate the effect of the change in the law on firm option-granting behavior, I run
the OLS regression with fixed effects on the following specification:
𝐷𝐸𝑃_𝑉𝐴𝑅𝒊,𝒕 =∝ +𝛽!𝑆𝑂𝑋!,! + 𝛽!𝑆𝐸𝐶!,! + 𝛽!𝑋!,! + 𝛿𝑦𝑟 ∗+𝜆! + 𝜀!,! (4.1)
where DEP_VARi,t stands for dependent variables. The dependent variables are set as follow:
• BD: is a dummy taking the value of one if options granted were backdated and zeros
otherwise. An option is defined as backdated if the share price at the grant date is the
lowest in a window of 40 days. As described in chapter one, I define the transaction
share price (and day) as the one that minimizes in absolute value the distance between
the strike price and the stock closing price at the reported transaction date or within two

86
days before the transaction. This because the SOX required in 2002 that the transaction
be reported to the SEC within two business days.37
• PR: is a continuous variable measuring the probability that an option was backdated or
spring-loaded. To do it, I construct a symmetric window of 20 trading days before and
after the grant. For each of these 40 days I report the share closing price. I then count
how many times the share price at the grant date is actually equal or lower than any
share price reported in the 40 days window.38 For instance, according to the previous
definition, backdated options are those set at the minimum of a share price valley. In
this case the number of time the stock closing price at the grant date is equal or lower
than the stock closing price in the window of 40 days (20 days before and 20 days
later) is 40/40, so 100%. On average I expect that the closing price at the grant date is
50% higher and 50% lower than the share prices of the transactions occurred in the
window of 40 days. This variable is meant to catch all those transactions that are not
necessarily at the minimum of a share price valley but still were granted at favorable
lower share price. For instance, a board might decide to set the options at the second
lowest share price in order to look less suspicious.
It is more difficult to use spring loading to grant stock options at the bottom of
the V share price valley. A share price that is falling might suddenly increase before
falling again (whisk of the tail), so that the CEO/board that intends to spring load might
37 Since in one single day more than one transaction may occur and each transaction may report a different strike price, it might be possible that a grant is assigned to a day (with its relative share price) while another transaction is assigned to a different day. Therefore, it is possible that one or more transactions reported by a company are considered backdated, while others reported by the same company are not considered backdated even if these transactions occur in the same day. For those 368 transactions occurred in 45 companies in 46 days, I retain the daily average of the true/false variable defining a transaction as backdated. The same issue also emerges on the variable PR and therefore I adopt the same methodology by retaining only the daily average. 38 The procedure I adopt is similar but different to the one described by Edelson et al. (2009). Instead of looking whether the stock closing price at the grant is lower or higher than the stock closing price of the symmetric window of trading days around the grant, the authors ranked the stock closing price of a symmetric window around the grant day and test whether the stock price at the grant “has equal probability of receiving any rank within the window” (Edelson et al., 2009, p. 3).

87
grant the options too early or too late and not catch the exact minimum. Nonetheless,
despite the options are not at the lowest share price, the return is still favorable.
• BEFORE: is a dummy taking the value of one if a stock option was granted when a
price target announcement was made or within seven days before, zero otherwise.
• AFTER: is a dummy taking the value of one if a stock option was granted from one to
seven days after a price target announcement and zero otherwise.
• AROUND: is a dummy taking the value of one if the option was granted seven days
after or seven days later or at the announcement date, zero otherwise.
The independent variables are:
• SOX: is a dummy that assumes the value of 0 if the transaction occurred before 2002
and it takes the value of 1 if it was granted during 2002 or later.
• SEC is a dummy that takes the value of the unity if the options were granted after 2006,
when the SEC strengthened the SOX criteria, and zero otherwise.
Xi,t is a vector of observed individual characteristics:
• SALE: is the natural logarithm of the gross sales or of the amount of billing for regular
sales in thousand of dollars.
• AT: is the natural logarithm of the current assets in million.
• CHSR: is the number of shareholders of ordinary/common capital (in thousands
dollars).
• EFFIC: is the difference between Tobins Q at time t and Tobins Q at time (t-1), and it is
meant to catch the need of restoring efficiency.
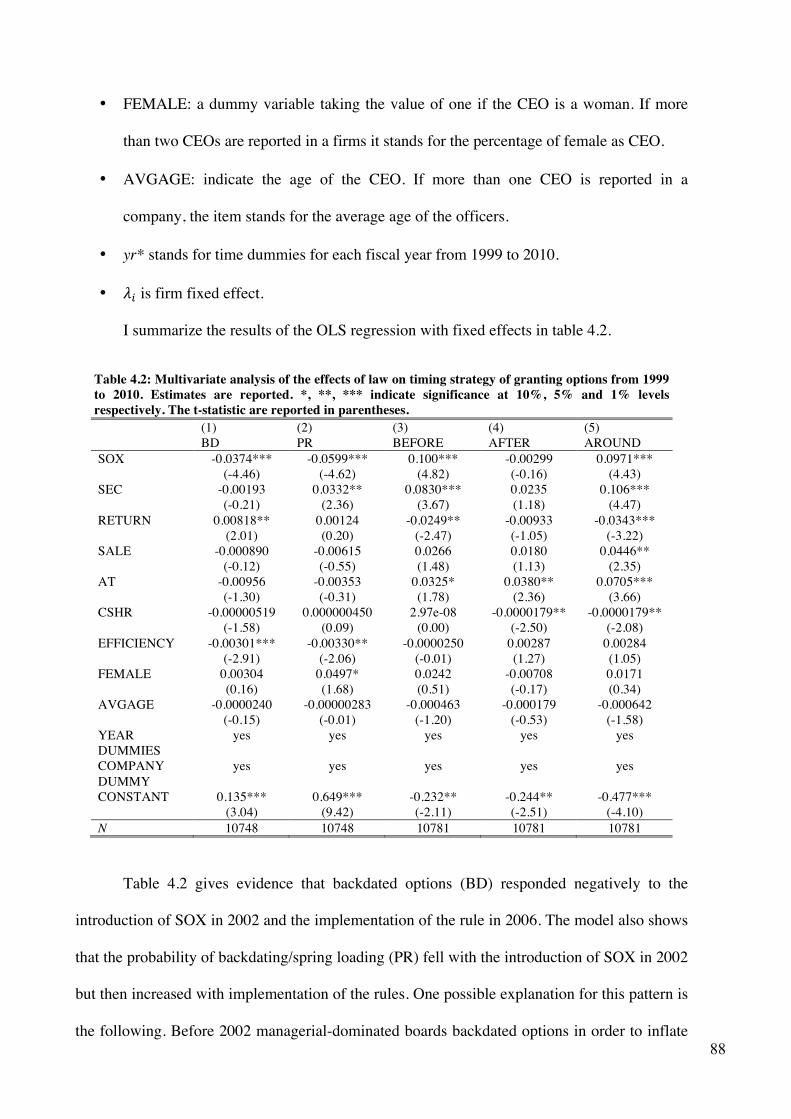
88
• FEMALE: a dummy variable taking the value of one if the CEO is a woman. If more
than two CEOs are reported in a firms it stands for the percentage of female as CEO.
• AVGAGE: indicate the age of the CEO. If more than one CEO is reported in a
company, the item stands for the average age of the officers.
• yr* stands for time dummies for each fiscal year from 1999 to 2010.
• 𝜆! is firm fixed effect.
I summarize the results of the OLS regression with fixed effects in table 4.2.
Table 4.2: Multivariate analysis of the effects of law on timing strategy of granting options from 1999 to 2010. Estimates are reported. *, **, *** indicate significance at 10%, 5% and 1% levels respectively. The t-statistic are reported in parentheses. (1) (2) (3) (4) (5) BD PR BEFORE AFTER AROUND SOX -0.0374*** -0.0599*** 0.100*** -0.00299 0.0971*** (-4.46) (-4.62) (4.82) (-0.16) (4.43) SEC -0.00193 0.0332** 0.0830*** 0.0235 0.106*** (-0.21) (2.36) (3.67) (1.18) (4.47) RETURN 0.00818** 0.00124 -0.0249** -0.00933 -0.0343*** (2.01) (0.20) (-2.47) (-1.05) (-3.22) SALE -0.000890 -0.00615 0.0266 0.0180 0.0446** (-0.12) (-0.55) (1.48) (1.13) (2.35) AT -0.00956 -0.00353 0.0325* 0.0380** 0.0705*** (-1.30) (-0.31) (1.78) (2.36) (3.66) CSHR -0.00000519 0.000000450 2.97e-08 -0.0000179** -0.0000179** (-1.58) (0.09) (0.00) (-2.50) (-2.08) EFFICIENCY -0.00301*** -0.00330** -0.0000250 0.00287 0.00284 (-2.91) (-2.06) (-0.01) (1.27) (1.05) FEMALE 0.00304 0.0497* 0.0242 -0.00708 0.0171 (0.16) (1.68) (0.51) (-0.17) (0.34) AVGAGE -0.0000240 -0.00000283 -0.000463 -0.000179 -0.000642 (-0.15) (-0.01) (-1.20) (-0.53) (-1.58) YEAR DUMMIES
yes yes yes yes yes
COMPANY DUMMY
yes yes yes yes yes
CONSTANT 0.135*** 0.649*** -0.232** -0.244** -0.477*** (3.04) (9.42) (-2.11) (-2.51) (-4.10) N 10748 10748 10781 10781 10781
Table 4.2 gives evidence that backdated options (BD) responded negatively to the
introduction of SOX in 2002 and the implementation of the rule in 2006. The model also shows
that the probability of backdating/spring loading (PR) fell with the introduction of SOX in 2002
but then increased with implementation of the rules. One possible explanation for this pattern is
the following. Before 2002 managerial-dominated boards backdated options in order to inflate
89
the options’ value. The introduction of the law in 2002 effectively reduced the phenomenon but
set CEOs/the boards looking for alternative strategies, such as spring loading. In 2006, the
introduction of a new law did nothing to discourage the already tested practice of spring
loading, so more boards chose this way to enrich their executives. Supporting the interpretation
that the changes reflected the operation of a management-dominated board the changes in 2002
and in 2006 augmented the options granted before a price targets announcements, but did not
affect the practice of granting options after an announcement.
The SOX law thus produced the desired effect of eliminating the backdating
phenomenon but reinforced spring loading strategy. Boards and CEOs shifted from backdating
to the riskier but still lucrative forward-looking spring loading.
4. Backdating, price targets and the law
Backdating is a strategy mainly associated with a managerial power model (which
assumes that the board maximizes CEO pay under social constraints) rather than by an ideal
board (arm’s length bargaining model, which assumes the board of directors contract top
executives pay in order to maximizes shareholders’ interests). Still, it is possible that an arms-
length bargaining board could adopt backdating as a suitable strategy, as this reduces the
riskiness associated with options and thus the risk premium that executives would want for
shifting pay from cash to options.
4.1 Managerial dominated board vs. arms-length bargaining board
A managerial dominated board would always consider backdating as a way to increase
the likelihood that options will profit management. But such a board might decide that when

90
the share price is expected to fall, even backdated options are unlikely to pay off for executives.
A backdated option is in the money at the transaction day but falls in the share price will reduce
its intrinsic value. As argued in chapter three, such a board would likely switch from stock-
based compensation to cash-based compensation. An arm-length bargaining board might
consider granting backdated options if analysts expect a fall in the share price because of
causes beyond CEO control. Granting options in the money when a share price is expected to
fall would keep managers motivated ex post, once the share price actually fell. It is a way of
indexing the strike price to the expected share price and thus providing an incentive to the CEO
to beat that expectation. If the share price is expected to fall by 10% and the board has
backdated the option to a period when share prices were 10% lower, it has effectively
contracted for an appropriate at the money option. If the CEO manages to take actions that
reduce the fall in the price to 5%, he or she will be rewarded by the share price exceeding the
strike price on the backdated award.
Thus, the likely course of the share price determines whether which sort of board will
backdate options. When share prices are expected to increase, the management-dominated
board will backdate while the arms-length bargaining board will not. When share prices are
expected to fall, the arms-length board will use backdating to maintain incentives while the
management-dominated board is more likely to shift compensation to cash.
In 2002, the introduction of the SOX essentially eliminated backdating but allowed
boards to shift toward a more forward-looking strategy, such as spring loading, for options.
Spring loading can also be a desirable strategy in both models of board behavior depending on
the sign of options’ intrinsic value. A board might take advantage of the fact that the market
reacts positively to analyst’s price target announcements. An option granted at the money
before a positive announcement will be most likely in the money soon after, whereas an option
granted before a negative announcement will most likely be out of the money soon afterwards.

91
A management dominated board would consider granting an option before a positive
price target announcement so that the option is in the money after the announcement. It makes
the managers wealthier. Granting options after a negative announcement would produce a
lower strike price soon after the announcement but would risk the share price falling more in
the future, depending on how the market responded to the price target announcement.
An arms-length bargaining board would also look at the price target to infer the likely
value of options and try to set the right options compensation according. An ideal board would
most likely adopt as a dominant strategy granting options after an announcement, so that the
share price (and the strike price) fully reflect the new information and the CEO would neither
be paid for “luck” (in case of a positive announcement) nor for “misfortune” (in case of a
negative announcement) if the stock price curse is beyond his/her control. Table 4.3
summarizes the strategies considered by both models.
To test which models is predominant I proceed as follow. For each company and year, I
compute the total number of backdated options granted before a positive price targets
announcement (𝐵𝑎𝑐𝑘𝑑𝑎𝑡𝑒𝑑!,!) as well as the total number of backdated options granted after a
negative announcement (𝐵𝑎𝑐𝑘𝑑𝑎𝑡𝑒𝑑!,!). I then take the difference between backdated stock
options granted before or at the positive announcement date and backdated stock options
granted after a negative price target announcement. Under the null hypothesis of an ideal arms-
length bargaining board the difference should be negative. The management dominated board
would by contrast produce a positive difference.
From the previous multivariate analysis we know that the introduction of SOX reduced
the backdating phenomenon but increased the spring loading strategy. For testing which model
better explains the spring loading phenomenon, I compute for each company and year the total
number of options granted before or at a positive price target announcement (𝐵𝑒𝑓𝑜𝑟𝑒!) and the
total number of options granted after a positive announcement (𝐴𝑓𝑡𝑒𝑟!). I repeat the procedure
for options granted before (𝐵𝑒𝑓𝑜𝑟𝑒!) or after (𝐴𝑓𝑡𝑒𝑟!) a negative announcement. I test whether

92
the difference between the numbers of options granted before and after a positive (negative)
price announcement is greater or less than zero. The hypothesis of an ideal board predicts that
the number of options granted before a positive price target announcement is less than the
number of options granted after a positive price target announcement. Also, in the case when
analysts expect a drop in the share price, the ideal board would grant options after the
announcement while the management dominated board will consider granting options after the
announcement or granting no options and shifting pay into cash compensation. Thus the ideal
board and the rent-seeking board may choose the same strategy when the share price is
expected to fall. But the ideal arms-length board will grant fewer options after a negative price
target announcement than after a positive price target announcement than a management
dominated board.
Table 4.3: Different strategy adopted by both ideal and rent-seeking board before and after the introduction of the SOX according to different price targets scenarios (positive vs. negative).
Ideal-board of directors Rent-seeking board Expected intrinsic value
Positive Negative Positive Negative
Granting strategy before 2002 or 2006
No backdated options, grant options after announcements.
Backdated options. If the causes beyond the expected drop in share are out of CEO’s control, the board can grant backdated options so once the price drops options are ideally at the money and manager still incentivized. Grant after announcements.
Backdated options and grant options before announcements.
Grant options after or switch to other remuneration forms, e.g. cash-based compensation since the options will be at the money or out of the money once the forecasted dropping trend ends.
Granting strategy after 2002 or 2006
No backdating. Grant after the price target announcement, so the strike price reflects the new information and managers are not rewarded for “luck”.
No backdating. Grant extra options after the price target announcement, so the strike price reflects the new information and managers are not punished for “misfortune” and also incentivized when most needed.
Grant options before the announcements, so they are in the money soon after. No backdating.
Grant options after or switch to other remuneration forms, e.g. cash-based compensation, since the options will be at the money or out of the money once the forecasted dropping trend ends.

93
I summarize in table 4.4 the t-tests.
The empirical evidence rejects for all three scenarios the hypothesis of an ideal board in
favor of the alternative hypothesis of a rent-seeking board. It rejects the hypothesis that CEOs
receive more stock options after a positive announcement (as predicted by an ideal board
model) in favor of the alternative (as predicted by a rent-seeking model) and rejects the
hypothesis that CEOs are awarded more stock options after a negative announcement.
Table 4.4: t-tests.
𝐻!: Ideal
board
𝐻!: Rent-
seeking board
alternative
Obs. Mean Std. Dev. t 𝐻!: mean
> 0
𝐵𝑎𝑐𝑘𝑑𝑎𝑡𝑒𝑑!,!− 𝐵𝑎𝑐𝑘𝑑𝑎𝑡𝑒𝑑!,!
mean ≤0 mean >0 25510 894 33364 4.28 Pr(T > t) =
0.0000
𝐵𝑒𝑓𝑜𝑟𝑒! − 𝐴𝑓𝑡𝑒𝑟! mean ≤0 mean >0 25510 17623 812300 3.47 Pr(T > t) =
0.0003
𝐵𝑒𝑓𝑜𝑟𝑒! − 𝐴𝑓𝑡𝑒𝑟! mean ≤0 mean >0 25510 3362 173512 3.09 Pr(T > t) =
0.0010
4. Conclusion
This chapter explored how the introduction of the Sarbanes-Oxley Act in 2002 and its
further implementation in 2006 affected the supply of options. I show that the change in the law
succeeded in reducing the practice of backdating options but it led some board to substitute the
practice of backdating options with a more forward-looking strategy of granting options around
analysts’ price targets announcements (spring loading). It also showed show that price targets
have become increasingly linked to the granting options process. The number of options
granted independently from analysts’ price targets announcements declined sharply from 1996
to 2010. Among the options granted around price targets announcements 79% were awarded
when analysts expected an increase in the share price and the vast bulk were granted before the
positive announcement. Finally, I discuss the options granting timing strategies that could be

94
adopted by both an ideal board and a rent-seeking board before and after the introduction of the
SOX. I argue that what makes backdated options/spring loaded options a rent-seeking strategy
rather than an ideal strategy is the timing of the grant and the sign of the future expected share
price. I give evidence that the results reject the hypothesis of an ideal board in favor of a rent-
seeking board alternative and I argue that a rent-seeking model rather than an arm-length
bargaining model better explains the emerging evidence.

95
Appendix 4.A
This appendix examines the robustness of my results. Specifically, in the body of the
chapter I considered an option granted before (after) a price targets announcements awarded
within seven days before (after) a price target announcements. In this appendix I show that the
results hold if I expand the window from fourteen to twenty-eight days (fourteen days before,
fourteen days after). Table 4.6 gives the regressions for the expanded window.
Table 4.6: Multivariate analysis of the effects of law on timing strategy of granting options from 1999 to 2010. Estimates are reported. *, **, *** indicate significance at 10%, 5% and 1% levels respectively. The t-statistic are reported in parentheses.
Entire dataset (1) (2) (3) BEFORE AFTER AROUND SOX 0.140*** 0.00430 0.144*** (6.34) (0.21) (7.01) SEC 0.0851*** 0.0165 0.102*** (3.55) (0.75) (4.54) RETURN -0.0285*** -0.0000731 -0.0286*** (-2.66) (-0.01) (-2.86) SALE 0.0102 0.0191 0.0293 (0.53) (1.08) (1.64) AT 0.0403** 0.0254 0.0657*** (2.08) (1.42) (3.63) CSHR 0.0000012 -0.00003*** -0.00003*** (0.14) (-3.33) (-3.15) EFFICIENCY -0.000220 0.00208 0.00186 (-0.08) (0.83) (0.73) FEMALE -0.0317 -0.00923 -0.0409 (-0.63) (-0.20) (-0.87) AVGAGE -0.000334 -0.000228 -0.000563 (-0.82) (-0.61) (-1.48) YEAR DUMMIES
yes yes yes
COMPANY DUMMY
yes yes yes
CONSTANT -0.112 -0.0974 -0.209* (-0.96) (-0.90) (-1.92) N 10781 10781 10781

96
Conclusion
Research on executive compensation is divided between two views or theories of how
boards determine the pay of CEOs and other top managers. One view is that CEO pay is the
result of a contracting process between CEO aiming to maximizing her/his compensation and a
board of directors aiming to maximize shareholders’ interests (arm-length bargaining model,
using the definition of Bechuck et al. 2005). The other view is that management dominates
boards of directors so that the board seeks to maximize managers’ compensation within
constraints imposed by social costs and market penalties (managerial power model, using the
definition of Bechuck et al. 2005). In the first case, the pay is the outcome of the intersection of
market forces. It is optimal in the sense that the extra dollar gained by a CEO is equal to the
marginal contribution of her/his work. In the second case, managers use private information to
structure compensation for their benefit at the expense of shareholders and influence the board
of directors through weaknesses in corporate governance to set their own pay and gain rents at
the expense of shareholders. This line of thinking questions the efficacy of stock-based
incentives to solve the principal agent models and views incentive schemes as part of the
agency problem itself. The rise of inequality is no longer justified by a rise in efficiency.
Bebchuk et al. (2003) argue that the observed pay structure is most likely a compromise
between market forces, which mitigates managerial rent-seeking, and managerial-power that
favors top executive compensation. Reviewing empirical studies, Frydman et al. (2010)
conclude “both managerial-power and competitive market forces are important determinants of
CEO pay” but leave open the question of their relative importance. The first two chapters of
this dissertation add new data for assessing the two hypotheses regarding determination of CEO
pay in the U.S. The analysis in the next two chapters shows that the managerial power model
fits better with the new evidence than the arm’s length bargaining model.

97
In chapter one, I study the changes in US CEO compensation from 1996 to 2010 using
data from the Execucomp dataset and the IFDF dataset. I describe the methodology by which I
matched Execucomp data from company's annual proxy statement (DEF 14A SEC) with data
from the Insider Filing Data Feed on U.S. insider activities. I found that the number of options
reported in the two datasets is highly correlated (except in 2006 when Execucomp changed the
mode of reporting options) to allow to analyze both dataset combined. I show that CEO pay
rose by $2.7 millions between 1996 and 2010. I also show that the changes varied greatly over
time. I find that most of the increase in stock-based compensation from 1996 to 2001 was due
to increased grants of stock options, but that options became less popular toward the end of the
period in favor of direct grants of stocks, which in 2010 constituted almost 28% of total
compensation. Regarding the composition of options over time, I give evidence that the
percentage of scheduled options increased by almost 25% between 1997 and 2010 and that
backdated options disappeared after 2002. Cash-based compensation increased more modestly
over the period.
The second chapter analyzes Institutional Broker Estimate System (IBES) Detail
History Price Target data file, a dataset that records analysts’ price targets for the share prices
of companies, an indicator of the likely future change in a firms' stock price. Focusing on US
firms I show that 98% of price targets have one-year horizon. In 18.65% of the cases a firm
receives more than one price target per day. I also find that the number of price targets
announcements issued by analysts is positively associated with company share price’s volatility
and I give evidence that price target is positively associated with forecasted price, and thus
when analysts expect a rise (fall) in next year share price it is more likely to occur than not.
Lastly, I provide evidence that positive (negative) announcements are followed by an increase
(decrease) in share price, which implies that investors incorporate analysts’ information.
The third chapter analyzes the impact of price targets, as reported by the Institutional
Broker Estimate System in its Detail Price History Target database, on executive compensation.

98
The share price that analysts expect for a firm in the future has not, to my knowledge been
previously analyzed in studies of executive compensation. I find that analysts' price targets alter
the composition of executive pay between cash-based compensation and stock-based
compensation. When analysts forecast a rise in the share price for a firm, its compensation
package tilts toward stock-based compensation. When analysts forecast a fall in the share price,
the compensation package tilts toward cash-based compensation. This pattern is more readily
explicable by the managerial power model than the arm’s length bargaining model. Consistent
with this interpretation, the trade-off is stronger in companies that have weaker corporate
governance.
The fourth chapter explores the impact of the Sarbanes-Oxley Act and its
implementation by the SEC affected the granting of stock options. I find that the change in the
law induced CEOs to substitute the backward-looking practice of backdating with a forward-
looking strategy of spring loading options using price targets. The chapter documents that the
timing of granting options is increasingly linked to price target announcements, with the
number of options granted in periods outside a window around analysts’ price targets
announcements declining sharply from 1996 to 2010. I also discuss the options granting timing
strategies that an ideal board and a rent-seeking board would likely follow before and after the
introduction of the SOX. The timing of granting options and the relation of the grants to
analysts price target announcements and the shifting from back loading to awarding options
around the announcements load fits better with the rent-seeking managerial power model than
the arms-length deal strategy.
To my best knowledge price targets have not been used in studies of executive
compensation. The dissertation shows that they provide insights into the determinants of
executive pay in favor of the rent-seeking model. Clearly, there remains large scope for further
investigation on the relation of CEO pay and price targets. One area that deserves further

99
analysis is the relation between scheduling options around regular price targets announcements
or awarding unscheduled options after surprising price target announcements.

100
Terminology
In this section I provide a brief terminology of the technical terms I used.
A. Stock options glossary
Options are financial contracts that give the right to buy (call option) or sell (put
option) an underlying asset by a specific date (expiration or maturity date) for a
fixed price (exercise or strike price). The right does not constitute an obligation.
The employee stock options (ESO) are call options on the stock of the company.
Typically, the strike price of employees’ call options is set equal to the firm’ share
price at the grant date and the employees have to wait a predefined period of time
before they can exercise those options (vesting period). Usually, the number of
calls options granted in a single transaction coincides with the number of shares
underlined, but an option can underline more or less shares.
Call Options on stock are said to be:
American if they are exercisable at any time. At the money if the exercise price is equal to the share price of the underlying stock. Backdated if the grant date is manipulated so that the company dates the options granted to
employees at earlier period when the share price was lower than the share price at the time the options were actually granted. In U.S. most options are granted at the money, thus backdating allows to report a strike price lower than the company’s share price at the grant date. This procedure makes the options de facto in the money and thus inflates the value of the options granted to executives.
Bermudian if they can be exercised after a predefined period of time has passed (vesting period). These options are hybrid between European Options and American Options (Rubinstein, 1995).
Europeans if the exercise date coincides with the expiration date. In the money if the strike price is lower than the share price of the underlying stock. Out of the money if the strike price is higher than the share price of the underlying stock. Scheduled if they are granted at regular time year by year. Spring-loaded if options are granted before a positive news is released. This procedure inflates the
value of the options since the market reacts to the news pushing the share price up and thus the options’ value as well.
Unscheduled if they are granted at irregular time year by year.

101
B. Execucomp terminology
Execucomp collects top executive compensation detailed information directly from
company's annual proxy statement (DEF 14A SEC). Thus, the change in the SEC's
compensation disclosure rules adopted in 2006 resulted in a discontinuity in the Execucomp
data. Below, I summarize the main implications.
Before 2006 After 2006 Bonus Short-term incentives pay in cash. Defines cash earned by officers
who met criteria that were not disclosed.
Long-Term Incentive LTIP are earned if CEO satisfies criteria measured over a time period longer than one year, typically three to six years (Larcker, 1983). Execucomp reports LTIP until 2006 when the SEC introduced a new terminology to isolate executive incentive compensation paid in cash and no longer require the distinction between short-term incentive and long-term incentive.
No longer reported.
Non-equity incentives Terminology introduced by SEC in 2006 to define cash incentive awarded if executives meet a disclosed pre-established target. The new terminology shifted part of cash compensation previously reported under the label “bonus” and LTIP to the new label “non-equity incentive”.
Stock options value Before 2006, Execucomp provides its own fair award value estimates of the monetary worth of stock options granted using a non-standard Black-Scholes formula.
After 2006 SEC imposes companies to report the estimated fair value of the stock options granted in the proxy statement, and Execucomp decided to drop its method in favor of the company reports. The SEC allows companies to use different methods of evaluating options, including the Black-Scholes and the binomial options pricing model.

102
References
Aboody, D., & Kasznik, R. (2000). CEO stock option awards and the timing of corporate voluntary disclosures. Journal of Accounting and Economics, 29(1), 73-100.
Asquith, P., Mikhail, M. B., & Au, A. S. (2005). Information content of equity analyst reports. Journal of Financial Economics, 75(2), 245-282.
Balachandran, S., Kogut, B., & and Hernal, H. (2010). Did executive compensation encourage extreme risk-taking in financial institutions?. working paper. Columbia University.
Balachandran, S., Carter, M. E., & Lynch, L. J. (2004). Sink or swim? firms' responses to underwater options. Journal of Management Accounting Research, 16, 1-18.
Bebchuk, L. A.,Jesse M. (2003). Executive compensation as an agency problem. Journal of Economic Perspectives, 17(3), 71-92.
Bebchuk, L., & Fried, J. (2004). Pay without performance: The unfulfilled promise of executive compensation Cambridge and London: Harvard University Press.
Bebchuk, L., & Grinstein, Y. (2005). The growth of executive pay. Oxford Review of Economic Policy, 21(2), 283-303.
Bertrand, M., & Mullainathan, S. (2001). Are ceos rewarded for luck? the ones without principals are. Quarterly Journal of Economics, 116(3), 901-932.
Bettis, J. C., Bizjak, J. M., & Lemmon, M. M. (1999). Insider trading in derivative securities: An empirical examination of the use of zero-cost collars and equity swaps by corporate insiders. Working Paper. Yale School of Managment's Esconomics Research Network.
Bickley, J. M., & and Shorter, G. (2008). Stock options: The backdating issue. (No. RL33926). Washington, DC: Congress Research Service.
Bilinski, P., Lyssimachou, D., & and Walker, M. (2011). Target price accuracy: International evidence. Working Paper. University of Manchester.
Bodie, Z., Kane, A., & and Marcus, A. (2001). Investments (Fifth ed.) The McGraw-Hill Companies.
Bradshaw, M. T., Huang, A. G., & and Tan, H. (2012). Analyst target price optimism around the world. Working Paper Boston College, University of Waterloo, University at Buffalo.
Brav, A., & Lehavy, R. (2003). An empirical analysis of analysts' target prices: Short-term informativeness and long-term dynamics. Journal of Finance, 58(5), 1933-1968.
Brochet, F. (2010). Information content of insider trades before and after the sarbanes-oxley act. Accounting Review, 85(2), 419-446.

103
Chauvin, K. W., & Shenoy, C. (2001). Stock price decreases prior to executive stock option grants. Journal of Corporate Finance, 7(1), 53-76.
Clement, M. B. (1999). Analyst forecast accuracy: Do ability, resources, and portfolio complexity matter? Journal of Accounting & Economics, 27(3), 285-303.
Congressional Budget Office (CBO). (2011). Trends in the distribution of household income between 1979 and 2007. The Congress of the United States. doi: http://www.cbo.gov/sites/default/files/cbofiles/attachments/10-25-HouseholdIncome.pdf
Cowen, A., Groysberg, B., & Healy, P. (2006). Which types of analyst firms are more optimistic? Journal of Accounting & Economics, 41(1), 119-146.
Dalton, D. R., Hitt, M. A., Certo, S. T., & and Dalton, C. M. (2007). Chapter 1: The fundamental agency problem and its mitigation. In Walsh, J.F. & Brief, A.P. (Ed.), The academy of management annals (pp. 1-64). New York: Lawrence Erlbaum Associates.
Dokko, Y., & Edelstein, R. H. (1989). How well do economists forecast stock market prices?: A study of the livingston surveys. American Economic Review, 79(4), 865.
Edelson, R., & and Whisenant, S. (2009). A study of companies with abnormally favorable patterns of executive stock option grant timing. Working Paper. University of Houston-C.T. Bauer College of Business, University of Kansas.
Eisenhardt, K. M. (1989). Agency theory: An assessment and review. Academy of Management Review, 14(1), 57-74.
Fama, E. F., & Jensen, M. C. (1983). Separation of ownership and control. Journal of Law & Economics, 26(2), 301-326.
Forelle, C., Bandler, J., & Anders, G. (2006). The perfect payday. (cover story). Wall Street Journal - Eastern Edition, 247(64), A1-A5.
Francis, J., & Philbrick, D. (1993). Analysts' decisions as products of a multi-task environment. ( No. 31).Wiley-Blackwell.
Frydman, C., & Jenter, D. (2010). CEO compensation. Annual Review of Financial Economics, 2(1), 75-102.
Geske, R., & Roll, R. (1984). On valuing american call options with the black-scholes european formula. Journal of Finance, 39(2), 443-455.
Glushkov, D. (2007). Working with analyst data: Overview and empirical issues, data manuals. Wharton Research Data Services.
Glushkov, D. (2009). Overview of IBES on WRDS: Research and data issues, Data manuals. Wharton Research Data Services.

104
Granger, C. W. J. (1992). Forecasting stock market prices: Lessons for forecasters. International Journal of Forecasting, 8(1), 3-13.
Hall, B. J., & Murphy, K. J. (2002). Stock options for undiversified executives. Journal of Accounting & Economics, 33(1), 3-42.
Hall, B. J., & Murphy, K. J. (2003). The trouble with stock options. Journal of Economic Perspectives, 17(3), 49-70.
Heron, R. A., & Lie, E. (2007). Does backdating explain the stock price pattern around executive stock option grants? Journal of Financial Economics, 83(2), 271-295.
Hwang, B., & and Lou, D. (2012). Do analysts manage earnings forecasts to 'confirm' their own recommendations?. Working Paper. Purdue University - Krannert School of Management, London School of Economics & Political Science (LSE).
Jensen, M. C., & Meckling, W. H. (1976). Theory of the firm: Managerial behavior, agency costs and ownership structure. Journal of Financial Economics, 3(4), 305-360.
Jensen, M. C., & Murphy, K. J. (1990). Performance pay and top-management incentives. Journal of Political Economy, 98(2), 225-264.
Knewtson, H. S. (2011). Executive roles and insider trading. (PhD, Washington State University). PhD Dissertation-Washington State University,
Kuhnen, C. M., & Niessen, A. (2012). Public opinion and executive compensation. Management Science, 58(7), 1249-2172.
Ladika, T. (2012). Do firms replenish executives’ incentives after equity sales?. Working Paper. University of Amsterdam.
Larcker, D. F. (1983). The association between performance plan adoption and corporate capital investment. Journal of Accounting & Economics, 5(1), 3-30.
Lazonick, W. (2010). The explosion of executive pay and the erosion of american prosperity. Working Paper.
Lie, E. (2005). On the timing of CEO stock option awards. Management Science, 51(5), 802-812.
Lim, T. (2001). Rationality and analysts' forecast bias. Journal of Finance, 56(1), 369-385.
McAnally, M. L., Srivastava, A., & Weaver, C. D. (2008). Executive stock options, missed earnings targets, and earnings management. Accounting Review, 83(1), 185-216.
Murphy, K. J. (2002). Explaining executive compensation: Managerial power versus the perceived cost of stock options. University of Chicago Law Review, 69(3), 847.

105
Oppel, R. A. (2002, 27-03-2002). The man who paid the price for sizing up enron. The New York Times. doi: http://www.nytimes.com/2002/03/27/business/the-man-who-paid-the-price-for-sizing-up-enron.html;
Page, B. I., & and Lawrence, R. J. (2009). Class war? what americans really think about economic inequality. University of Chicago Press.
Ramnath, S., Rock, S., & Shane, P. (2008). The financial analyst forecasting literature: A taxonomy with suggestions for further research. International Journal of Forecasting, 24(1), 34-75.
Richardson, S., Teoh, S. H., & Wysocki, P. D. (2004). The walk-down to beatable analyst forecasts: The role of equity issuance and insider trading incentives. Contemporary Accounting Research, 21(4), 885-924.
Rubinstein, M. (1995). On the accounting valuation of employee stock options. The Journal of Derivatives, 3(1), 8-24.
Schlozman, K. L., Page, B. I., Verba, S., & Fiorina, M. P. (2005). In Jacobs L. R., Skocpol T., (Eds.), Inequalities of political voice New York: Russell Sage Foundation.
Thomson Reuters. (2009 December). I/BE/S detail history- user guide. Retrieved from: Wharton Research Data Service
Whaley, R. E. (1982). Valuation of american call options on dividend-paying stocks. Journal of Financial Economics, 10(1), 29-58.
Wharton Research Data Services. (n.d.). Modified black-scholes option valuation methodology. Retrieved from: Retrieved from: http://wrds-web.wharton.upenn.edu/wrds/
Wharton Research Data Services. (n.d.). Overview of executive compensation. Retrieved from: http://wrds-web.wharton.upenn.edu/wrds/
Womack, K. L. (1996). Do brokerage analysts' recommendations have investment value? Journal of Finance, 51(1), 137-167.
Yermack, D. (1997). Good timing: CEO stock option awards and company news announcements. Journal of Finance, 52(2), 449-476.
Zamora, V. L. (2005). Determinants of responses to underwater employee stock options: Evidence from traditional repricings, 6&1 exchanges and makeup grants. Working Paper. Seattle University - Albers School of Business and Economics.