Embed Size (px)
Citation preview

DYNAMOMETER TESTS OF AUTOMOBILE TIRES.
By W. L. Holt and P. L. Wormeley.
ABSTRACT.
This paper relates to a continuation of the work described in Technologic Paper
No. 213, Power Losses in Automobile Tires. Power-loss tests have been made on a
large number of tires, and the comparative results are shown for the $%, 4, and 5 inch
sizes, both cord and fabric. An analysis is made of the effect of the different parts of
the tire on the power loss, which shows that the carcass is responsible for the greater
part of the loss. It is pointed out, and some examples are given showing, how dyna-
mometer tests may be used as a help in studying the details of tire design.
CONTENTS.Page.
I. Introduction 559II. Power-loss differences 559
III. Analysis of power losses 563
1. Tread 563
2. Tube 565
3. Carcass 565
4- Size 567
5. Deflection - 569
6. Creep 571
7. Miscellaneous 574IV. Significance of power-loss determinations 575
1. Fuel consumption 575
2
.
Higher temperatures 576
3
.
Uniformity of product 577
4. Internal friction 577V. Conclusions 578
I. INTRODUCTION.
In Technologic Paper No. 213, a description was given of the
method of determining power losses in tires using electrical absorb-
tion dynamometers. General conclusions were drawn as to the
effect on power loss of the different factors which enter into the
operation of tires. A continuation of this work has shown that
there are very marked differences in tires. An effort has been
made to analyze these differences and bring out their significance.
II. POWER-LOSS DIFFERENCES.
With the many variables which enter into the operation of
tires there are numerous ways in which comparisons can be made.
One method of comparison is power loss versus air pressure, as
559
560 Technologic Papers of the Bureau of Standards. [Vol. i7
shown in Figures 2, 3, and 4. All the data are based on a con-
stant speed, no tractive effort, and a normal axle load—the air
pressure being varied and corresponding power losses noted. Theresults given represent tests made on 72 different tires manufac-tured by 35 different companies. They were chosen at randomfrom both small and large manufacturers, and are considered to
be representative of average tires. Figure 2 shows comparisons
of 30X3K tires; Figure 3, 4-inch tires, either 32X4 or 33X4;and Figure 4, 35 X 5 tires.
40 50AIR PRESSURE LBS./lNi:
Fig. 2.
—
Comparison of 30X3.K clincher tires.
Nos. 1 to 18, fabric; Nos. 19 to 27, cord; speed, 25 mph; axle load, 625 pounds.
Aside from two distinct divisions into which cord and fabric
tires fall, it will be noted that there is quite a large variation in
different makes of tires of the same class. From a study of these
curves the following conclusions may be drawn. (These are
based on air pressures, as recommended by the Society of Auto-
motive Engineers.)
(a) The average loss in 30X3^ fabric tires is 0.71 horsepower;
in cord tires, 0.48 horsepower.

Holt 1Wormeley] Dynamometer Tests of Automobile Tires. 56i
(b) The average loss in 4-inch fabric tires is 0.94 horsepower;
in cord tires, 0.67 horsepower.
(c) As an average, the loss in cord tires is approximately 70 per
cent of that in fabrics.
to
1-2
hUJ
>-f"o4
Ca
z
J a
U
0*:
UJ
<n
5a
1"k
*-- \V\\A
5*-2
kV\
V \ \
\,S;
\NSv \ \vK
i\Al \ \\
s
1
||-fcvNsA\112"
7.23ja-^\ \A XAN
IfcH in\ \\i
n«-*f1AN V -z
-25-
% ^A\ 3
\iV NAAV
1
*"^».
-
v1 IA^fe \
2fc-A ^ V^\^ <*^b^\s\
\^fe3^te^
\\ C^^Sc
^ -7-8,9
-10,\X n
I7JS
a"
^ r-\%, 13
NA\ "
::zb'z\]%~zi
1
.S* -2*.2S
-afc
t-
#0 2D 30 *0 5D 60 70 80AIR PRESSURE L.BS/ J/SL
Z
Fig. 3.
—
Comparison of 4-inch tires.
90
Nos. 1 to s, fabric; Nos. 6 to 26, cord; speed, 25 mph; axle load, 885 pounds.
(d) Extreme cases, between the highest fabrics and the lowest
cords, show the cord with only 40 per cent of the loss found in
the fabric.
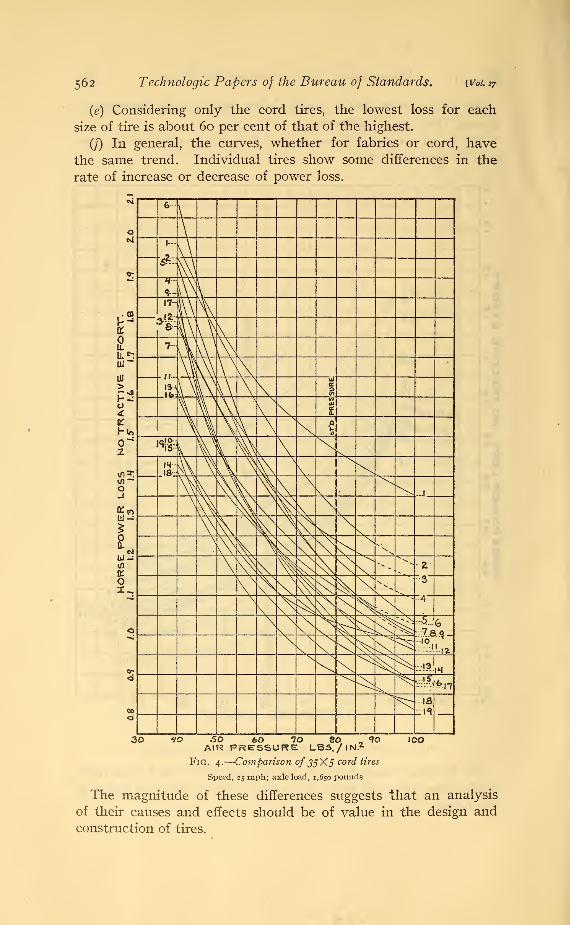
562 Technologic Papers of the Bureau of Standards. [Vol. 17
(e) Considering only the cord tires, the lowest loss for each
size of tire is about 60 per cent of that of the highest.
(/) In general, the curves, whether for fabrics or cord, have
the same trend. Individual tires show some differences in the
rate of increase or decrease of power loss.
30 bo 70 90 , «roAIR PRESSURE LBS./ IN-
Fig. 4.
—
Comparison 0/35X5 cord tires
Speed, 25 mph; axle load, 1,650 pounds
The magnitude of these differences suggests that an analysis
of their causes and effects should be of value in the design and
construction of tires.
Holt IWormeleyJ Dynamometer Tests of Automobile Tires. 563
III. ANALYSIS OF POWER LOSSES.
1. TREAD.
One of the most frequent questions asked when speaking of
the power losses in tires is: "How does the tread design affect
these losses ? " It seems reasonable to expect that a tire which
has a ribbed or smooth tread will offer less resistance to rolling
and show a lower power loss than one with an irregular or " bumpy "
tread. However, in making tests on a large number of tires it
has been found impossible to predict even approximately the
comparative power losses from the character of the treads. This
made it appear that the tread was not the most important factor.
!-«*
?>U.U.CD
*
\
\\'k\;
0* Kz —
>^s* N V.
3- Xm5^, .^
^ *x.^^^ ___-E-
A£ s **= "<.-^
"•iiiT =ii— -ss-.—>vs\ico
>\F
°a.0 3 HAlF\ PF
ssUR
4
E I
O-BSJ?h 8 9 liX>
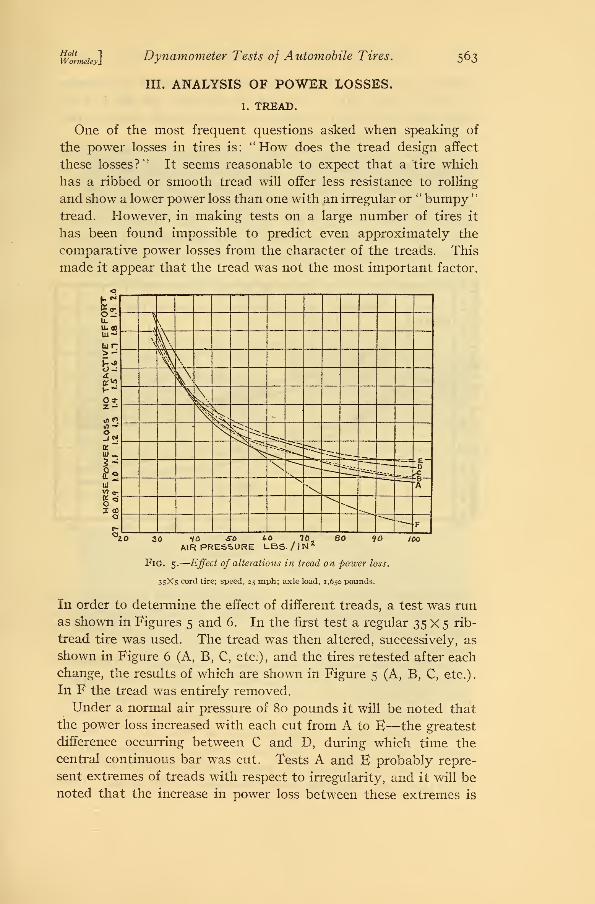
Fig. 5.
—
Effect of alterations in tread on power loss.
35X5 cord tire; speed, 25 mph; axle load, 1,650 pounds.
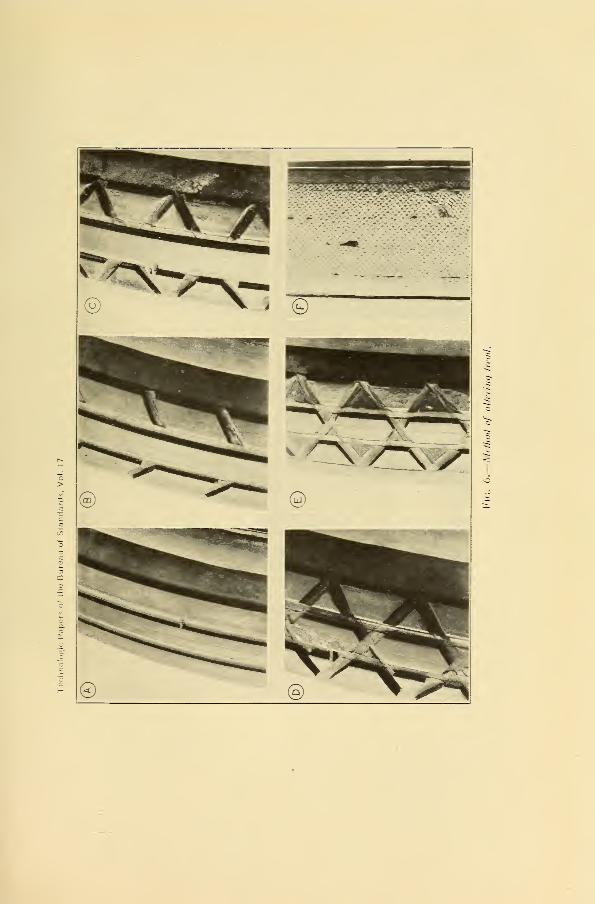
In order to determine the effect of different treads, a test was run
as shown in Figures 5 and 6. In the first test a regular 35 X 5 rib-
tread tire was used. The tread was then altered, successively, as
shown in Figure 6 (A, B, C, etc:), and the tires retested after each
change, the results of which are shown in Figure 5 (A, B, C, etc.).
In F the tread was entirely removed.
Under a normal air pressure of 80 pounds it will be noted that
the power loss increased with each cut from A to E—the greatest
difference occurring between C and D, during which time the
central continuous bar was cut. Tests A and E probably repre-
sent extremes of treads with respect to irregularity, and it will benoted that the increase in power loss between these extremes is
564 Technologic Papers of the Bureau of Standards. [Vol. 17
about 1 1 per cent. With the tread entirely removed the decrease
is about 15 per cent. Under low air pressures the effect of the
alterations in the tread is much less marked ; in fact, under certain
conditions it is entirely lost.
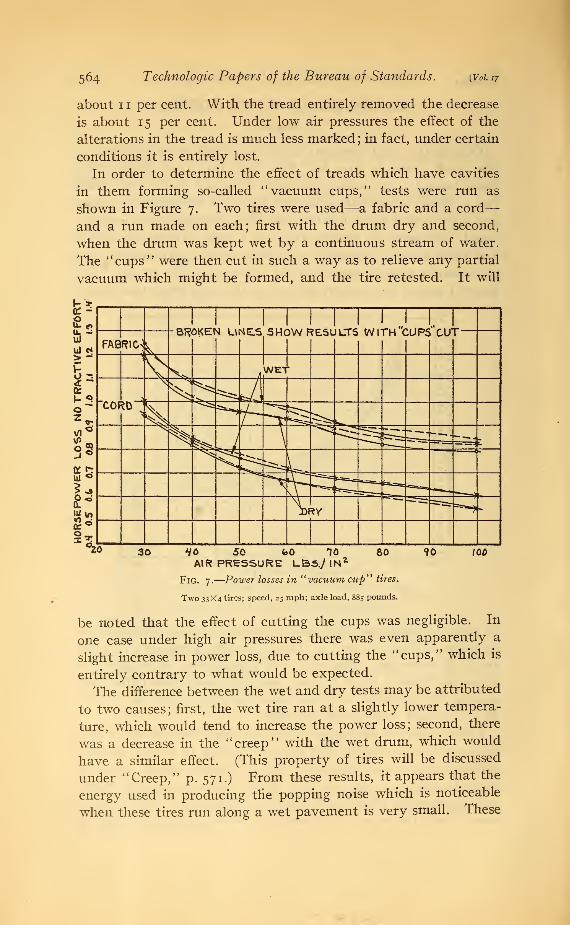
In order to determine the effect of treads which have cavities
in them forming so-called "vacuum cups," tests were run as
shown in Figure 7. Two tires were used—a fabric and a cord
—
and a run made on each; first with the drum dry and second,
when the drum was kept wet by a continuous stream of water.
The "cups" were then cut in such a way as to relieve any partial
vacuum which might be formed, and the tire retested. It will
&
l I I I I II I
I I I. I
BROKEN UNELS SHOW RESULTS WlTH'tUPS* CUT
30 80 90 tooHO 50 to noAIR PRESSURE LBS.7 IN*
Fig. 7.
—
Power losses in "vacuum cup" tires.
Two 33X4 tires; speed, 25 mph; axle load, 885 pounds.
be noted that the effect of cutting the cups was negligible. In
one case under high air pressures there was even apparently a
slight increase in power loss, due to cutting the "cups/' which is
entirely contrary to what would be expected.
The difference between the wet and dry tests may be attributed
to two causes; first, the wet tire ran at a slightly lower tempera-
ture, which would tend to increase the power loss; second, there
was a decrease in the " creep" with the wet drum, which would
have a similar effect. (This property of tires will be discussed
under "Creep," p. 571.) From these results, it appears that the
energy used in producing the popping noise which is noticeable
when these tires run along a wet pavement is very small. These
Technologic Papers of the Bureau of Standards, Vol. 17
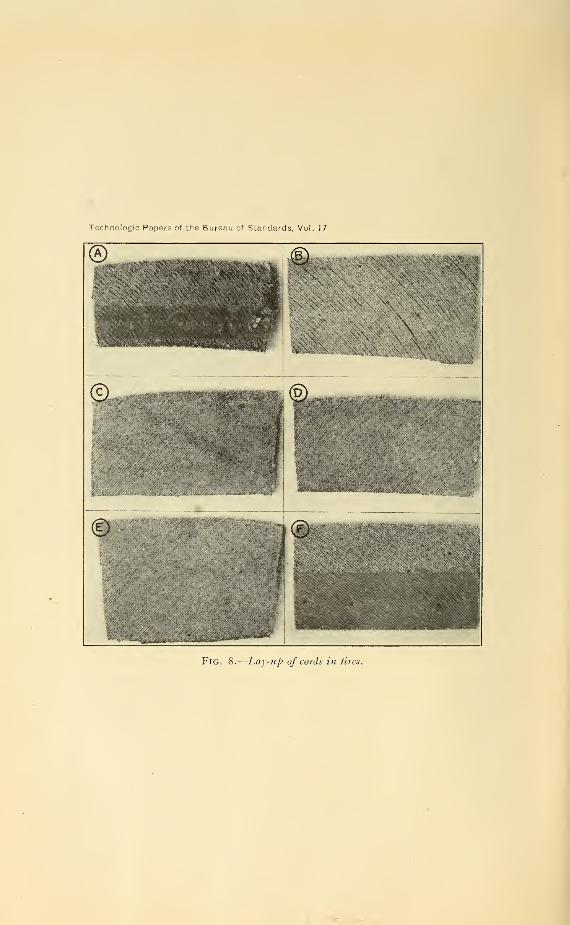
Fig. 8.
—
Lay-up of cords in tires.
Wormeiey] Dynamometer Tests of Automobile Tires. 565
experiments, the results of which are confirmed by general ob-
servations, show that the loss in the tread represents only a small
part of the total loss in the tire.
2. TUBE.
Inasmuch as the tread which is entirely rubber has a small
effect on the power loss compared with the remainder of the tire,
it would be expected that the tube, which is also entirely rubber
and of much smaller volume, would have an even smaller effect.
In order to check this conclusion four tubes were selected as fol-
lows:
(a) A 35 X 5 red tube, weight 4.3 pounds.
(b) A 35X5 red tube, weight 5.2 pounds.
(c) A 35X5 red tube, weight 5.2 pounds.
(d) A 35 X5 heavy compression tube, weight 21.2 pounds.
Power-loss tests were run on a 35 X 5 tire under as nearly iden-
tical conditions as possible, using each tube. When the (d) tube
was used, a slightly higher power loss (2 to 3 per cent) was shown,
but aside from this the results were essentially the same.
The test was then repeated, using in one case a red tube, andin another a gray tube in combination with a so-called puncture-
proof shield. This shield consisted of an endless band of rubber
which was placed between the tube and the tread portion of the
casing. It was about 5 inches wide and one-half inch thick at
the center, tapering to nothing at the edges. In both tests,
using the combination of tube and shield, the results showed a
power loss about 5 per cent higher than when using the tube
alone. This increase was probably caused in large measure bythe poor quality of the rubber compound in the shield. In order
to obtain conclusive information as to just the effect of these
special types of tubes and appliances more exhaustive tests
would be required. However, the facts that tubes of different
makes produce no appreciable effect on the power loss, and that
a large increase in the amount of rubber in the tube, or used in
connection with it, has no very great effect, confirm the conclu-
sions that the losses due to tubes of the standard type are small.
3. CARCASS.
By the process of elimination, the greater part of the power
loss must occur in the carcass of the tire. That such is the case
is brought out by the difference in power losses in cord and fabric
tires where practically the only difference is in the carcass con-
53617°—23 2
566 Technologic Papers of the Bureau of Standards. [Voix?
struction. When run under the same conditions in all the tests
to date we have not found a single cord tire whose power loss
was as great as the lowest power loss found in any fabric tire of
the same size. This is evident from Figures 2 and 3.
It might be thought that the differences in cord or fabric tires
are simply due to unusual features in the design. In some in-
stances such is the case, but unusual features do not prove to be
the only causes of these variations. For instance in Figure 2
tires Nos. 1, 9, and 17 are 5-ply tires, the remainder are 4-ply.
One of these 5-ply tires shows the highest loss, one the lowest,
and the other about average. Tests were run on several makesof tires which were built with a smaller number of plies of heavycord in place of the usual light cord. The power losses varied
from unusually high to unusually low, apparently depending to a
large extent on the cord construction and on whether or not the
cords were well impregnated with rubber. It has been found
that the amount of rubber between the different plies of the car-
cass has a very marked effect. Wherever this thickness is low
the power loss is invariably high.
In an examination of the three tires of each size showing the
lowest losses an unusually uniform lay-up of the cordswas observed.
When compared with a large number of other tires it was quite
evident that from the standpoint of uniform construction there
were none that equaled them. Figure 8 shows the lay-up of
cords in several tires using sections cut from the carcasses. E and
F were taken from the two tires showing the lowest power losses
in Figures 2 and 3. The others were taken from tires showing
higher losses. A is a section of a tire in which the cords are
extremely wavy. In such a tire the strain would probably be
concentrated on one or two plies which would soon give out, and
a blow-out result. The condition of the cords in B is much better,
but it will be seen that they are not very evenly laid. In C
there is just a slight wave in the cords, otherwise they are fairly
uniform. D is a sample of cord construction which is probably
a little better than the average, in fact, almost as uniform as E.
The low power loss in E and F is not due to a lesser number of
cords per inch as evidenced by the fact that both B and F have
about 22 cords per inch while C, D, and E all have about 26
cords per inch. There is no question but that the uniformity of
cord construction, which means uniform distribution of strain in
tires E and F is a factor which makes them stand out far below
the average in power loss.
wwmeiey] Dynamometer Tests of Automobile Tires.
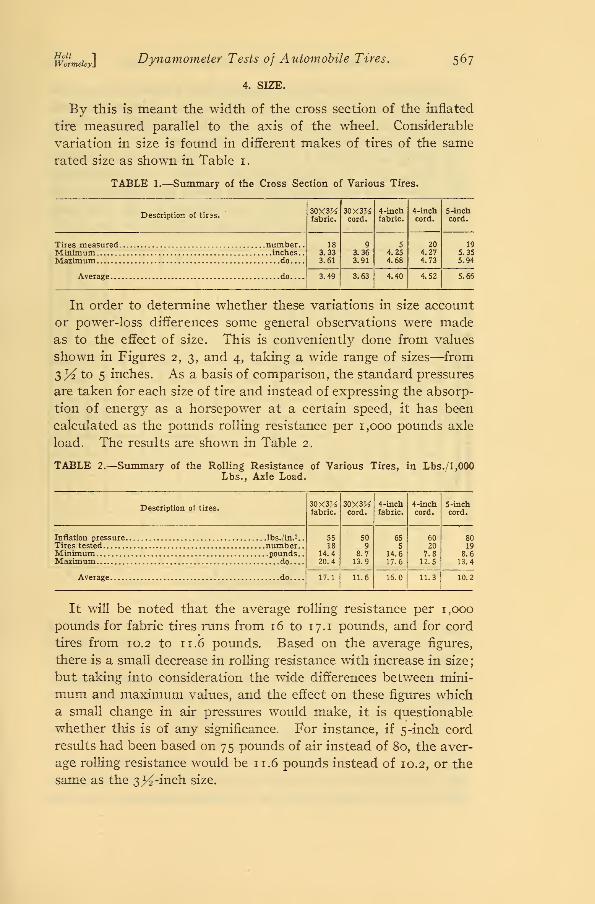
4. SIZE.
567
By this is meant the width of the cross section of the inflated
tire measured parallel to the axis of the wheel. Considerable
variation in size is found in different makes of tires of the same
rated size as shown in Table 1.
TABLE 1.—Summary of the Cross Section of Various Tires.
Description of tirss.30X3Kfabric.
30X3Kcord.
4-inchfabric.
4-inchcord.
5-inchcord.
Tires measuredMinimum
number.
.
inches..do
183.333.61
93.363.91
54.254.68
204.274.73
195.355.94
do.... 3.49 3.63 4.40 4.52 5.66
In order to determine whether these variations in size account
or power-loss differences some general observations were madeas to the effect of size. This is conveniently done from values
shown in Figures 2, 3, and 4, taking a wide range of sizes—from
Zyi to 5 inches. As a basis of comparison, the standard pressures
are taken for each size of tire and instead of expressing the absorp-
tion of energy as a horsepower at a certain speed, it has been
calculated as the pounds rolling resistance per 1,000 pounds axle
load. The results are shown in Table 2.
TABLE 2.—Summary of the Rolling Resistance of Various Tires, in Lbs./1,000Lbs., Axle Load.
Description of tires.30X3Kfabric.
30X3^cord.
4-inchfabric.
4-inchcord.
5-inchcord.
Inflation pressure lbs./in.2.
.
Tires tested number.
.
Minimum pounds.
.
Maximum do
5518
14.420.4
509
8.713.9
655
14.617.6
6020
7.812.5
8019
8.613.4
Average. .do. 17.1 11.6 16.0 11.3 10.2
It will be noted that the average rolling resistance per 1,000
pounds for fabric tires runs from 16 to 17.1 pounds, and for cord
tires from 10.2 to 11.6 pounds. Based on the average figures,
there is a small decrease in rolling resistance with increase in size;
but taking into consideration the wide differences between mini-
mum and maximum values, and the effect on these figures which
a small change in air pressures would make, it is questionable
whether this is of any significance. For instance, if 5-inch cord
results had been based on 75 pounds of air instead of 80, the aver-
age rolling resistance would be 11.6 pounds instead of 10.2, or the
same as the 3y2 -inch size.
568 Technologic Papers of the Bureau of Standards. [Vok 17
Accordingly, it seems fair to conclude that for tires from 2>}4 to
5 inches in size, the rolling resistance per 1,000 pounds axle load
is independent of the size ; which means that the relative perform-
ances of the different sizes of tires are the same.
It should be noted that these figures represent a rate of resist-
ance rather than the actual resistance at the 1,000-pound load.
But since it has been found that the power loss, and hence the
rolling resistance, is very nearly proportional to the axle load,
the actual rolling resistance at any reasonable load for the tire in
si
It
Hnoill <5
P Zz>
£5ooIK
cIII"
<V) 3^5678
RATED SIZE (CROSS SECTION) INCHES
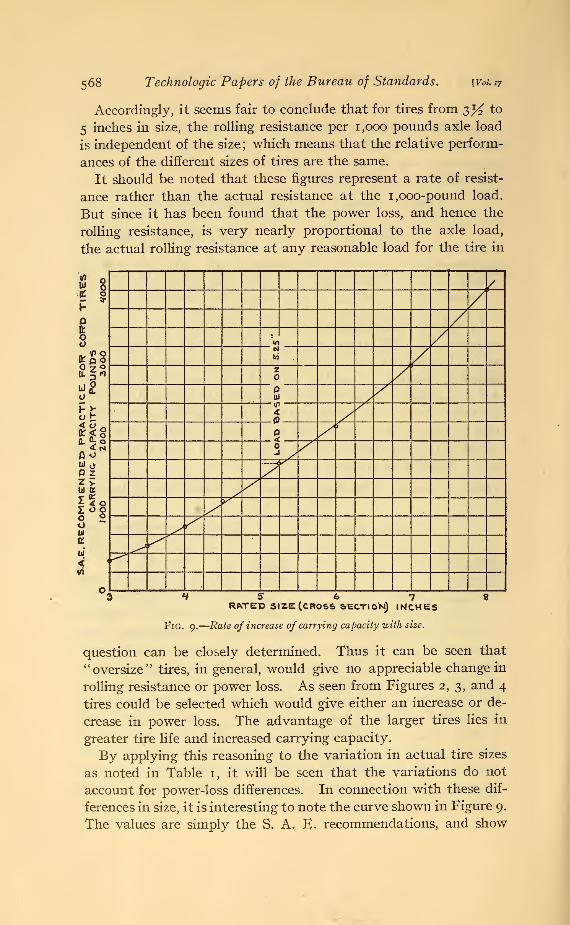
Fig. 9.—Rate of increase of carrying capacity with size.
question can be closely determined. Thus it can be seen that
"oversize" tires, in general, would give no appreciable change in
rolling resistance or power loss. As seen from Figures 2, 3, and 4
tires could be selected which would give either an increase or de-
crease in power loss. The advantage of the larger tires lies in
greater tire life and increased carrying capacity.
By applying this reasoning to the variation in actual tire sizes
as noted in Table 1, it will be seen that the variations do not
account for power-loss differences. In connection with these dif-
ferences in size, it is interesting to note the curve shown in Figure 9.
The values are simply the S. A. E. recommendations, and show
/5- /
/*«o /1/7 /Z As /
/</>
(0
OO g s i
M
pOO
1
*>'
sS< r^
n .
Holt 1Wormeley\ Dynamometer Tests of Automobile Tires. 569
the rate of increase in carrying capacity with increase in size.
By applying this rate to differences in the actual size of tires of
the same rated size, it will be seen that o. 1 inch increase or decrease
in cross section affects the carrying capacity by an amount varying
from 40 to 100 pounds. Taking into consideration the variations
shown in Table 1, it can be seen that if one car is equipped with
four 30 X zTA minimum size fabric tires, and one with four 30 X 3X
maximum size fabric tires the difference in carrying capacity
would amount to about 500 pounds, or over 20 per cent of the
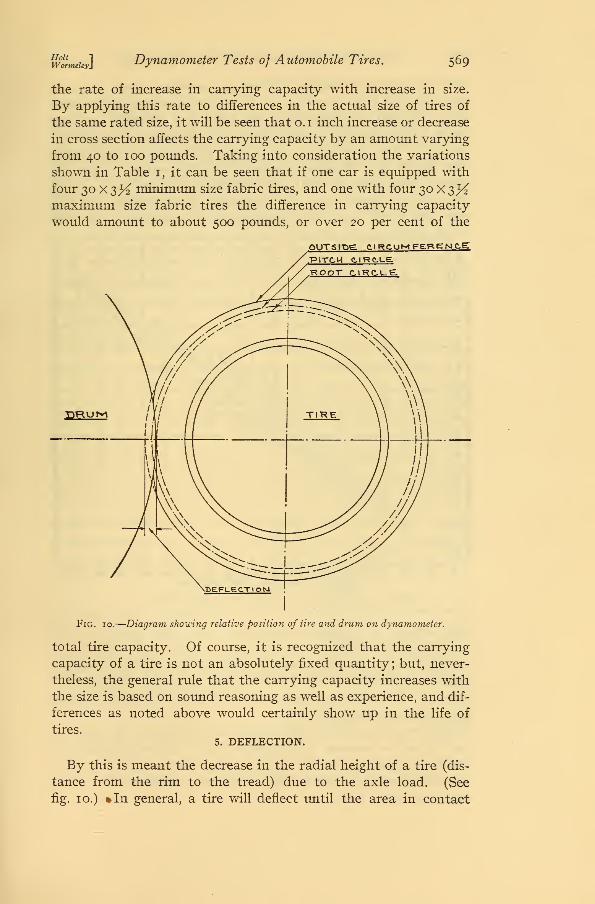
ouTsipe circumference:•pitch circle,root circle.
Fig. 10.
—
Diagram showing relative position of tire and drum on dynamometer.
total tire capacity. Of course, it is recognized that the carrying
capacity of a tire is not an absolutely fixed quantity; but, never-
theless, the general rule that the carrying capacity increases with
the size is based on sound reasoning as well as experience, and dif-
ferences as noted above would certainly show up in the life of
tires.
5. DEFLECTION.
By this is meant the decrease in the radial height of a tire (dis-
tance from the rim to the tread) due to the axle load. (See
fig. 10.) %In general, a tire will deflect until the area in contact
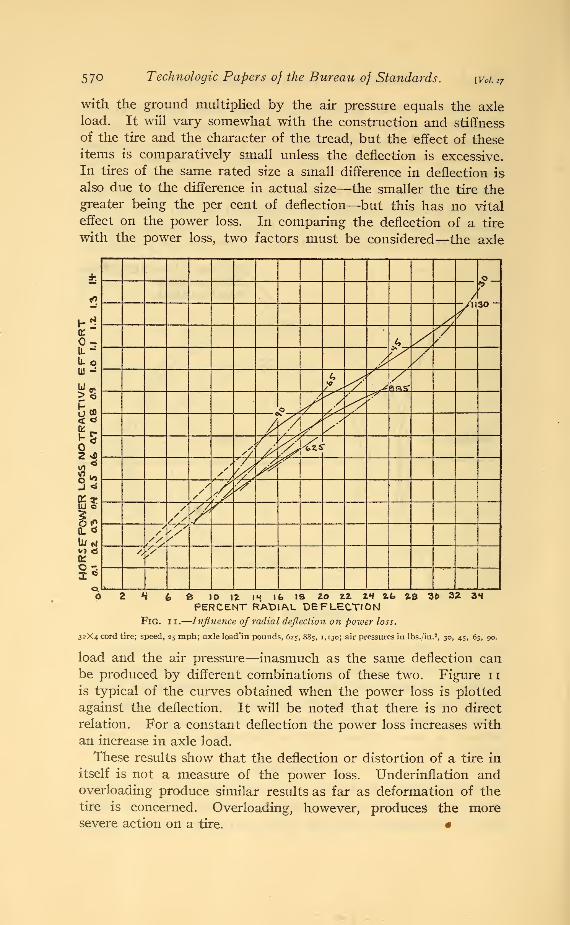
570 Technologic Papers of the Bureau of Standards. \Voi.i7
with the ground multiplied by the air pressure equals the axleload. It will vary somewhat with the construction and stiffness
of the tire and the character of the tread, but the effect of these
items is comparatively small unless the deflection is excessive.
In tires of the same rated size a small difference in deflection is
also due to the difference in actual size—the smaller the tire thegreater being the per cent of deflection—but this has no vital
effect on the power loss. In comparing the deflection of a tire
with the power loss, two factors must be considered—the axle
*
30-fO /
H rt /,/"
0- A /;Yj.
/y^ /iu -
<?' ^/
>s•P ^
/-</
sjr
/<yr .
*
2 O >'/ ^^5
*:Vv?
33 //
YAy
UJ ©•
IsIn *\
4*Y/
/ ' sv> cS
or
V*
'/V
O 2 H (, a 10 12 l«i l(> 18 ZO ZZ ZH Zb %Q 30 32 34PERCENT RADIAL DEFLECTION
Fig. ii.—Influence of radial deflection on power loss.
32X4 cord tire; speed, 25mph; axle load'in pounds, 625,885, 1,130; air pressures in lbs./in. 2, 30, 45, 65, 90.
load and the air pressure—inasmuch as the same deflection canbe produced by different combinations of these two. Figure nis typical of the curves obtained when the power loss is plotted
against the deflection. It will be noted that there is no direct
relation. For a constant deflection the power loss increases withan increase in axle load.
These results show that the deflection or distortion of a tire in
itself is not a measure of the power loss. Underinflation andoverloading produce similar results as far as deformation of the
tire is concerned. Overloading, however, produces the moresevere action on a tire. #

Wotmeiey]Dynamometer Tests of Automobile Tires. 571
6. CREEP.
The deflections referred to in the previous paragraph were
measured while the tires were running on the dynamometer under
the desired axle load and air pressure. In making these measure-
ments and noting the effect on the distance traveled by the tire
per revolution, some interesting results were observed. Referring
to Figure 10, the root circle is one which is concentric with the tire
axle and tangent to the road, or in this c'ase to the drum. Thecircumference of the pitch circle represents the distance which
the tire advances in one revolution under no tractive effort other
than that necessary to overcome tire resistance. The diameter
of this circle depends upon the construction of the tire and uponthe conditions under which it is run. In some cases it is almost
as large as the outside circumference of the tire and in some cases
it is smaller than the root circle.
An attempt has been made to explain these variations anddetermine what effect they might have on the life of the tire.
The deflection of a tire when running causes a circumferential
compression of the tread portion as it passes along the drum sur-
face due to the difference in the length of the outside circumfer-
ence and the root circle. If the tread is relatively noncompress-
ible it will tend to pile up as it approaches the point of contact
with the drum, but since an accumulated piling up is not possible
the tread is compressed to a certain extent and passes between
the tire proper and the drum at a slightly accelerated speed. It
carries the drum with it at this speed, which in most cases is
greater than that of the root circle. If the tread were entirely
noncompressible, each revolution of the tire would produce a move-ment of the drum surface equal to the circumference of the tire,
in which case the speed of the drum (the pitch circle) would be
independent of the deflection ; that is, the axle load and air pres-
sure. This condition is very closely approximated in a certain
type of tire which has a circumferential band embedded in the
tread. However, the material in most tires is compressible to
such a degree that the pitch diameter is affected by the conditions
under which a tire is operated.
Thus, the tread portion of a tire produces what we have called
a tread creep; that is, a gain in drum speed over that whichwould correspond to the root diameter.
At the same time that this creeping of the tread is taking place,
the force necessary to turn the tire in overcoming the resistance
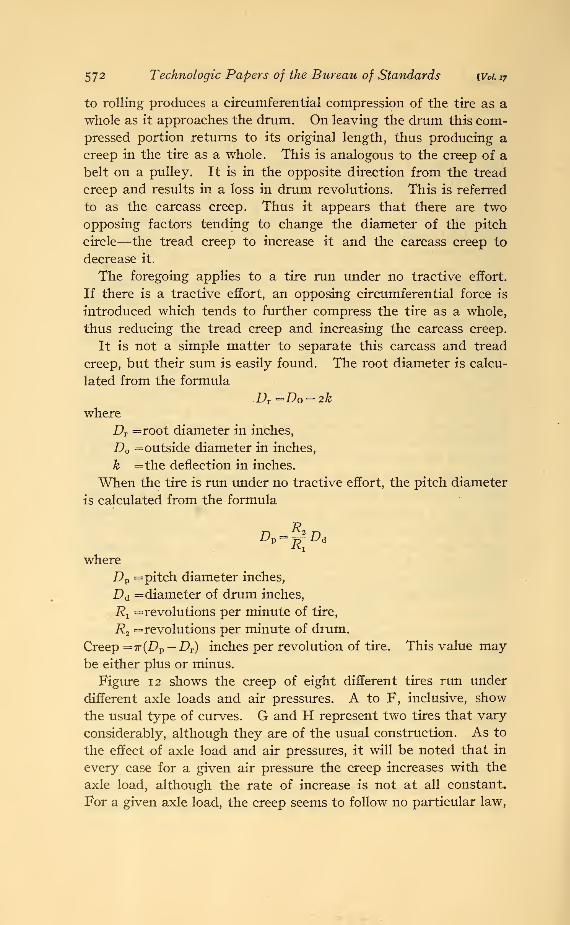
572 Technologic Papers of the Bureau of Standards [Vol 17
to rolling produces a circumferential compression of the tire as a
whole as it approaches the drum. On leaving the drum this com-pressed portion returns to its original length, thus producing a
creep in the tire as a whole. This is analogous to the creep of a
belt on a pulley. It is in the opposite direction from the tread
creep and results in a loss in drum revolutions. This is referred
to as the carcass creep. Thus it appears that there are twoopposing factors tending to change the diameter of the pitch
circle—the tread creep to increase it and the carcass creep to
decrease it.
The foregoing applies to a tire run under no tractive effort.
If there is a tractive effort, an opposing circumferential force is
introduced which tends to further compress the tire as a whole,
thus reducing the tread creep and increasing the carcass creep.
It is not a simple matter to separate this carcass and tread
creep, but their sum is easily found. The root diameter is calcu-
lated from the formula
DT =Do-2kwhere
Dr =root diameter in inches,
D =outside diameter in inches,
k =the deflection in inches.
When the tire is run under no tractive effort, the pitch diameter
is calculated from the formula
Dp =^Dd
where
Dp =pitch diameter inches,
Dd =diameter of drum inches,
Rt=revolutions per minute of tire,
R2=revolutions per minute of drum.
Creep =7r(Dp —DT) inches per revolution of tire. This value maybe either plus or minus.
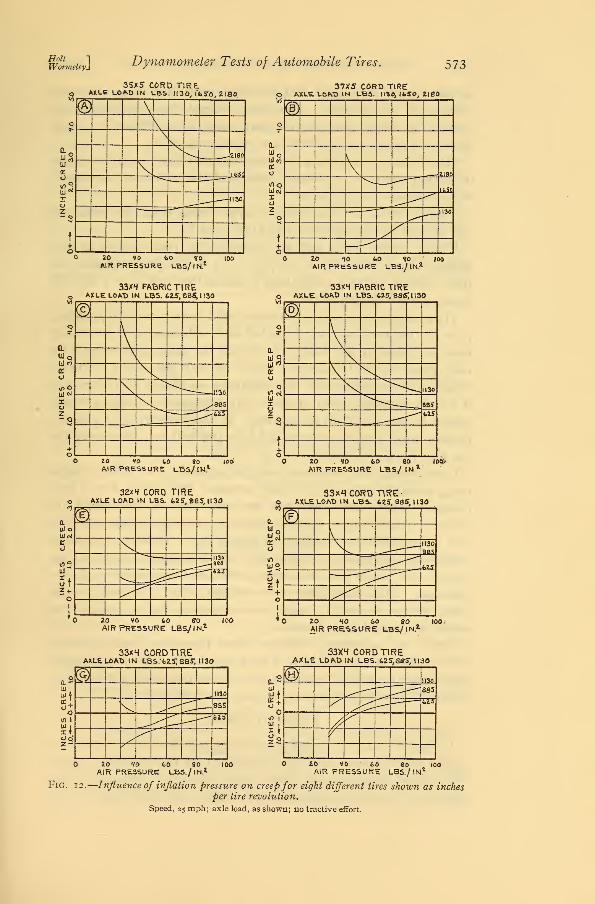
Figure 12 shows the creep of eight different tires run under
different axle loads and air pressures. A to F, inclusive, show
the usual type of curves. G and H represent two tires that vary
considerably, although they are of the usual construction. As to
the effect of axle load and air pressures, it will be noted that in
every case for a given air pressure the creep increases with the
axle load, although the rate of increase is not at all constant.
For a given axle load, the creep seems to follow no particular law,
Holt 1Wormeleyj Dynamometer Tests of Automobile Tires. 573
35X5 CORD TIREo AXLE LOA.D in LBS. 1120, 1*650,2180.
<s> \
\\\
ZI80
V IM<
HI30
20 VO 60 •go
AIR PRESSURE LBS/lN.'
37X5 CORD TIREO AXLE. LOAT> IN UBS. USQ IfcSO, 2160
®
\
\2lfl0
If 50
H30
20 40 GO <?0 J00
AIR PRESSURE LBS./ IN*
o
33X4 FABRIC TIREAXLE LOAD IN LBS. 625,885 1130
©? V
\§
\v
\vc \ mo
1* 885
c625
t
+o
33X4 FABRIC TIREO AXLE LOAD IN LBS. 625, 8SS;il30
f)\
\\
\'\ .n3o
WSfe25
AIR PRESSURE LBS/lN*zo . <ro 60 soAm PRESSURE LBS./ IN 1
32x4 CORD TIREAXLE LOAD IN LBS 625,385. 1130
a) oHidt
©
1I3&885
4ZJ
20 VO fcO go ZOOAIR PRESSURE LBS/iN*
33x4 CORD TAREAXLE LOAD IN LBS. 625, 88$ 1 130
<F)
\
\s
1130
f?,f
20 MO 60 80 100'
AIR PRESSURE LBS/IN.4
33x4 CORD TIREAXLE LOAD IN LBS. 625*, 885, 1130
©1130
'V 835
= 25
y
33X4 CORD TIREAXLE LOAD IN LBS. 62S,8ff5, 1130
o
(8)II7V>
885
^ 625
^y
/
20 Ht> 66 86 (00AIR PRESSURE LBS./\NZ
20 HO 60 90 100 I
AIR PRESSURE LBS./ IN.2
Fig. 12.
—
Influence of inflation pressure on creepfor eight different tires shown as inchesper tire revolution.
Speed, 2s mph; axle load, as shown; no tractive effort.
574 Technologic Papers of the Bureau of Standards. Woi.17
in some cases increasing and in some cases decreasing with anincrease in air pressure. This rather erratic behavior seems to
uphold the theory that the resultant creep is a combination of the
tread and carcass creep which are opposite in effect.
It will also be noted that the creep bears no direct relation to the
deflection, since for a constant axle load the deflection decreases
with increase in air pressure.
Fabric tires as a whole show a larger creep than cord tires, as
will be seen by comparison of C, D, E, and F.
Under normal loads and air pressures the creep varies in the
different tires from about —0.4 to +2.3 inches per revolution of
tire. Under extreme conditions it varies from about — 1 to +5inches per revolution of tire.
These figures represent adjustments which are continually taking
place in the tread portion of the tire as it rolls along and provision
must be made in the design of the tire for these adjustments to
take place without excessive strain on any particular portion.
Taking into consideration the difference as shown in Figure 12,
it is not surprising that tread or ply separation develops muchsooner in one tire than in another. It also appears that a satis-
factory tread construction on a fabric tire will not necessarily be
the best for a cord tire.
Considering any particular tire, it appears that other things
being equal a decrease in creep increases the power loss. For
instance, when tires were run wet and dry, as illustrated in
Figure 7, there was a decided decrease in creep in the wet test
and a corresponding increase in power loss. While in this case
the lower temperature during the wet test would also tend to
increase the power loss, it was not sufficient to account for all the
difference. The remainder was evidently due to a decrease in
creep which resulted in more tire revolutions being required to
cover the same linear distance.
While in comparing different tires there are many factors
which affect the power loss, if cord and fabric tires are grouped
separately the general tendency is for those tires with the smallest
creep to show comparatively higher power losses.
7. MISCELLANEOUS.
In Section III, (1), it was pointed out how the effect of changes
in the tread design could be determined by dynamometer tests.
With each change in the tread there was also a change in the
creep of the tire—comparatively small, but nevertheless dis-
Holt 1WormeleyJ
Dynamometer Tests of Automobile Tires. 575
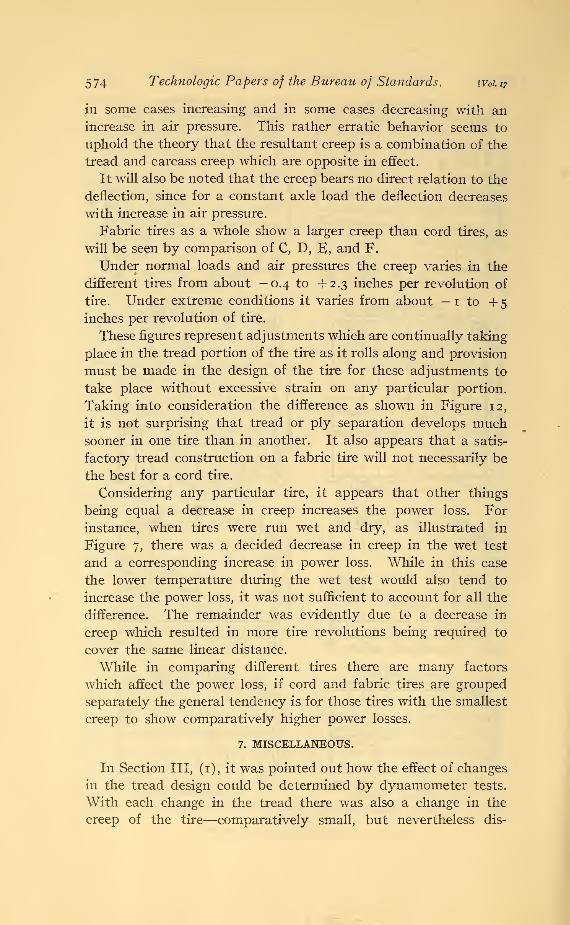
tinctly shown. It is obvious that a close correlation exists
between these two factors. Figure 13 illustrates these creep
changes—the letters corresponding to the designations in Figures
5 and 6. It will be seen that the results, in general, bear out
the conclusions reached in the preceding section, that a decrease
in creep results in an increase in power loss.
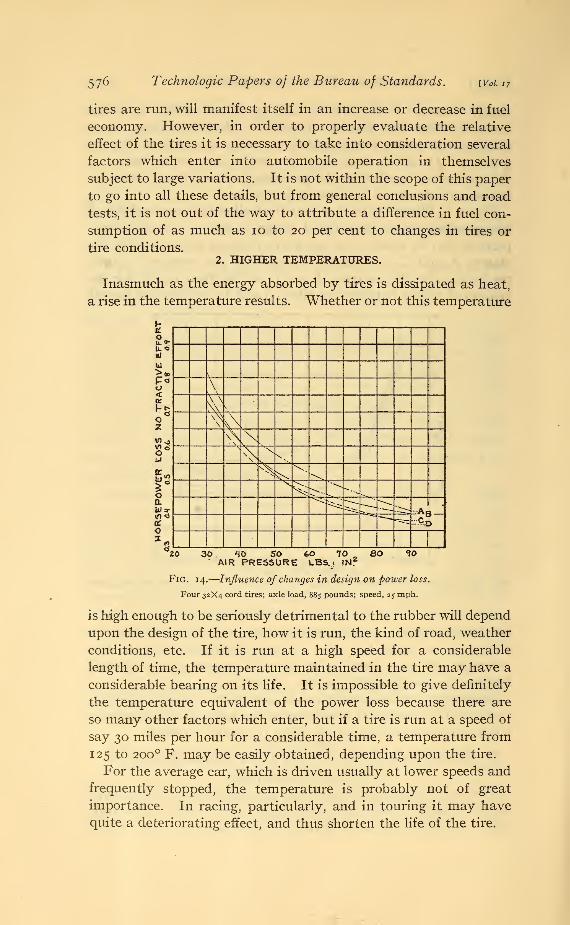
Figure 14 illustrates tests of four tires, all of the same make, but
incorporating special features of design in such a way that com-
parisons can be made as to the effect of these features. For in-
stance, A and C are identical, except for the number of cords
per inch in the ply material; B and C are identical, except for the
amount of rubber between the plies ; A and D are identical, except
V)
0.
sc
Ul
I '^^Z
io 30 HO 50 to TO 80AIR PRESSURE UBS-/ IN.
2?0 106
Fig. 13.
—
Influence of alterations in tread on creep shown as inches per tire revolution
(see fig. 5).
35X5 cord tire; speed, 25 mph; axle load, 1,650 pounds; no tractive effort.
for the breaker and cushion construction. It will be seen that the
differences in power loss show up very plainly, and, with tires
otherwise the same, may be traced to a greater or less internal
friction at a very definite portion of the tire.
These examples are pointed out in order to show that by progres-
sive tests it is possible to closely trace just what takes place inside
a tire and actually measure the effect of details of design.
IV. SIGNIFICANCE OF POWER LOSS DETERMINATION.1. FUEL CONSUMPTION.
The power required to supply the amount absorbed by the tires
and dissipated as heat must come from the fuel used and accord-ingly a change in the kind of tires, or the conditions under which
576 Technologic Papers of the Bureau of Standards. [Vol. i 7
tires are run, will manifest itself in an increase or decrease in fuel
economy. However, in order to properly evaluate the relative
effect of the tires it is necessary to take into consideration several
factors which enter into automobile operation in themselves
subject to large variations. It is not within the scope of this paper
to go into all these details, but from general conclusions and road
tests, it is not out of the way to attribute a difference in fuel con-
sumption of as much as 10 to 20 per cent to changes in tires or
tire conditions.2. HIGHER TEMPERATURES.
Inasmuch as the energy absorbed by tires is dissipated as heat,
a rise in the temperature results. Whether or not this temperature
i8*Hi
Ul
o<
v
\\\
\ \x^;>& \
s.
^V.
"SS S-.
~^ ^ -At*==,4>
20 30 40 SO 60 70 8O 1QAIR PRESSURE LBS. 4 JN.'
Fig. 14.
—
Influence of changes in design on power loss.
Four 32X4 cord tires; axle load, 885 pounds; speed, 25 mph.
is high enough to be seriously detrimental to the rubber will depend
upon the design of the tire, how it is run, the kind of road, weather
conditions, etc. If it is run at a high speed for a considerable
length of time, the temperature maintained in the tire may have a
considerable bearing on its life. It is impossible to give definitely
the temperature equivalent of the power loss because there are
so many other factors which enter, but if a tire is run at a speed of
say 30 miles per hour for a considerable time, a temperature from
125 to 200 F. may be easily obtained, depending upon the tire.
For the average car, which is driven usually at lower speeds and
frequently stopped, the temperature is probably not of great
importance. In racing, particularly, and in touring it may have
quite a deteriorating effect, and thus shorten the life of the tire.
WolmehA Dynamometer Tests of Automobile Tires. 577
3. UNIFORMITY OF PRODUCT.
In making tests on tires of different sizes, or on different tires of
the same size, made by a manufacturer, it has been noted that one
manufacturer's product will show uniform or consistent results
throughout, while another's gives quite varying results, "some tires
being unusually low and some unusually high in power loss.
It would appear that this latter condition results from lack of
proper control through the manufacturing processes or else in
inconsistencies in the design of the tires. If such is the case,
dynamometer tests should be of immense value in locating and
remedying such discrepancies.
4. INTERNAL FRICTION.
The ideal tire would be one which was perfectly elastic. Thepower loss would be zero, as the force used in compressing the tire
as it approached the road would equal that exerted by the tire
against the road as the compressed portion resumed its original
shape. This ideal tire will probably never be built, but by refer-
ring to Figures 2, 3, and 4 it will be seen that, at least, some tires
come much nearer to the ideal than others. By comparing the
cord tires of to-day with the fabrics of a few years ago, it will be
seen that considerable progress has been made in this direction,
and the result is very evident from the greater life of the cord tire.
One way of looking at the power loss in a tire is that it is the
hysterisis loss of the whole tire. Since this loss in the whole tire
is made up of the sum of all the small losses throughout the tire,
the problem is to reduce the loss in unit parts. A tire is madeprincipally of a combination of rubber and cotton, the cotton
giving strength and permanency of form while the rubber serves
as a bond to hold the parts together. As the tire flexes, the cotton
must still give the strength to the carcass, while at the same time
the relative position of the individual fibers and cords change.
One of the big problems in tire construction is to so build themthat, as the positions of the fibers and cords change, the rubber
bond will not be broken. Taking an imaginary unit section of
rubber in a tire, there are two factors which should be observed
in order that the power loss be low. The rubber compound mustbe of such a nature that the hysterisis loss is small and the unit
strain on the rubber must be low.
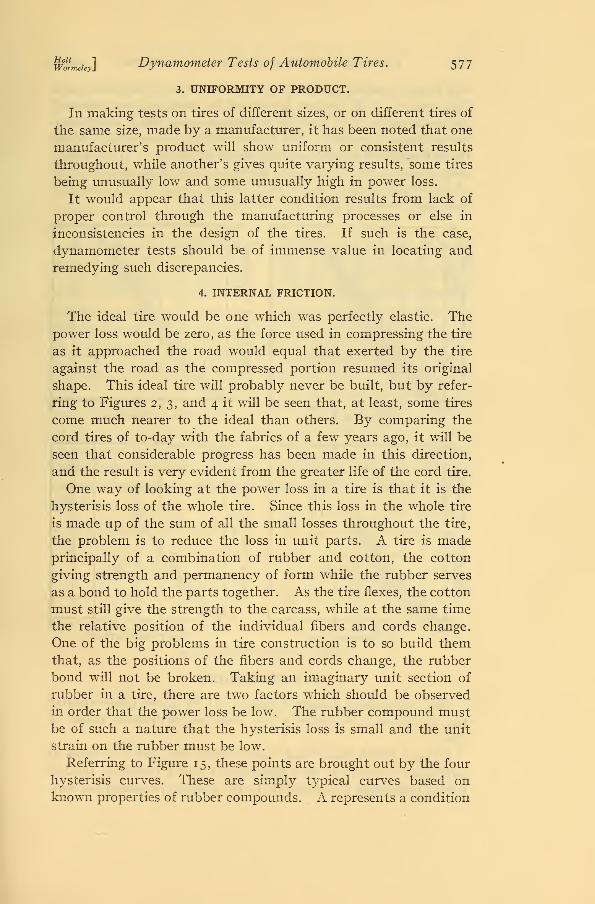
Referring to Figure 15, these points are brought out by the four
hysterisis curves. These are simply typical curves based onknown properties of rubber compounds. A represents a condition
578 Technologic Papers of the Bureau of Standards. [Vol i?
of a large hysterisis loss due to the nature of the compound and ahigh strain. In B the loss is reduced by changing the nature of
the compound. In C the loss is reduced using the A compound,but reducing the strain. The best condition is shown at D, wherethe B compound is used and the strain is reduced. If the condi-
tion shown at D is carried out throughout the tire, the hysterisis
of the whole tire will be low; or, in other words, the internal fric-
tion, and hence the power loss will be low.
©
tu c*
ft:
\-
P
id
Ug«o1L-
AA4J
AsA*%7
-I cy*>^
M s$&
Z 3 H 5"* *©
DEFORMATfON2. 3 *f S" 6D^FORMATfON
SO
in
fcto2
O
c /
//
f
MM •/
-LO55
At-MyP:tf
A-0\Z 3 H S £> 1REFORMATION
00
Hi
tin2
&:Ui&C0UJONIKo
D /
//
/
/
M •LO ?>S>
/^Z 3 f S &DEFORMATION
FlG. 15.
—
Typical hysterisis curves.
V. CONCLUSIONS.
The outstanding feature brought out by these dynamometertests is the wide variation in the power loss of different makes of
tires.
In tests which have been made during the past few years in
particular, by Prof. B. H. Lockwood, of Yale University, the fol-
lowing conclusion was reached : In the average passenger car run-
wwmeiey] Dynamometer Tests of Automobile Tires. 579
ning on a hard, level road at 20 miles per hour approximately one-
half of the power developed by the engine is used in overcoming
the rolling resistance of the tires. Using this figure as a basis, it
is seen from the data presented in this paper that a considerable
difference in the fuel consumption of an automobile can be attrib-
uted to the choice of tires. The actual saving in dollars will de-
pend upon the economy of the engine and will also vary with the
conditions under which the automobile is operated. This subject
will be treated fully in a later paper.
In addition to bringing out the differences with respect to power
loss which exist among different tires, dynamometer tests should
be of great value in the study of details of design of individual
tires. It has been pointed out that most of the power loss in a
tire occurs in the carcass and accordingly it is not surprising that
there is a decided difference between the power loss in a cord and
in a fabric tire. But taking either cord or fabric tires as a class
where constructions are fundamentally the same, the lack of uni-
formity suggests an opportunity for profitable study. The use of
dynamometer tests in making such studies is brought out by the
results pointed out in Section III, 7. These show the possibility
of extending the analysis of power losses much further and meas-
uring the effect of the many small variables which enter into the
construction of a tire. By means of such tests it should be possible
to coordinate more closely the different parts of a tire for maximumefficiency.
Washington, February 9, 1923.