Embed Size (px)
Citation preview
E-Bikes in the North America: Results from an online survey
John MacArthur (Corresponding author)
Oregon Transportation Research and Education Consortium
Portland State University
P.O. Box 751
Portland, OR 97207-0751
Email: [email protected]
Phone: 503-725-2866
Fax: 503-725-5950
Jennifer Dill
Nohad A. Toulan School of Urban Studies and Planning
Director, Oregon Transportation Research and Education Consortium
Portland State University
P.O. Box 751
Portland, OR 97207-0751
Email: [email protected]
Phone: 503-725-5173
Fax: 503-725-8770
Mark Person
1718 NE Junior Street
Portland, OR 97211
Email: [email protected]
Submitted for presentation and publication to the
93rd Annual Meeting of the Transportation Research Board
January 12-16, 2014
Revised November 15, 2013
7,900 words [6,650 + 5 Figures x 250]
TRB 2014 Annual Meeting Paper revised from original submittal.
MacArthur, Dill & Person
TRB 2014 Annual Meeting
2
ABSTRACT
This research aims in part to understand if different bicycling technology, in this case electric assist
bicycles or e-bikes, can reduce barriers to bicycling, including trip distance, topography, time, and rider
effort. Doing so may result in more bike trips and longer bike trips, and increase the diversity of people
bicycling, including people with a disability or chronic injury. E-bikes typically resemble a standard pedal
bicycle with the addition of a rechargeable battery and electric motor to assist the rider with propulsion.
To address these aims, we conducted an online survey of existing e-bike users on their purchase and use
decisions. Responses from 553 e-bike users across North America are analyzed here. Results suggest that
e-bikes are enabling users to bike more often, to more distant locations, and to carry more cargo with
them. Additionally, e-bikes allow people who would otherwise not be able to bike because of physical
limitations or proximity to locations, the ability to bike with electric assist.
INTRODUCTION
As the U.S. continues to urbanize and transportation funding becomes scarce, municipalities are
increasingly looking to reduce reliance on single occupant motor vehicles in favor or bicycling, walking,
and public transportation. These active transportation modes are attractive due to their reduced
greenhouse gas (GHG) emissions, reduced road and parking space, and associated health benefits. To
date, most efforts have been to increase these modes through changes in infrastructure, land use, and
awareness programs. While these are critical elements in mode choice decisions, less research exists on
improving the technology and usability of the mode itself to encourage more trips to be made by bike and
for more people to take bike trips. This research focuses on electric assist bicycles or “e-bikes” and
whether this technology can encourage more bike trips and longer bike trips, and increase the number of
people biking by attracting people who typically do not or cannot ride a regular bicycle. By increasing the
amount of biking, positive benefits could be realized in terms of reduced vehicle emissions and an
increase in physical activity and mental well-being.
This paper includes a literature review focused on common barriers to bicycling and existing e-
bike research. The literature review is followed by findings from an online survey of existing e-bike users.
The purpose of the survey is to better understand the factors that influence purchase decisions and how
current users in North America use their e-bikes. Survey responses were analyzed to determine if some of
the barriers to biking can be addressed by e-bikes.
BACKGROUND
U.S. cities are faced with many transportation challenges such as traffic congestion, injury and loss of life
from road crashes, local air quality, climate change, obesity and physical inactivity, economic burdens,
and international supplies of oil. Shifting people out of cars to other modes of transportation, such as
bicycling, can help address these challenges. With an increased focus on reducing the effects of motor
vehicles in metro regions, planners and policy makers are looking to increase the attractiveness of
walking and bicycling.
The city of Portland, already arguably one of the best large U.S. city for bicycling, adopted in
2010 the Portland Bicycle Plan for 2030 that aims to achieve a 25% mode share by 2030. Yet even with
its sterling reputation, cutting edge bike infrastructure, land use planning, and progressive programs, the
U.S. Census reports that the 2011 bicycle commute mode share was 6.3%. Comparatively, the nationwide
bike commute mode share is under one percent (1). While these numbers are an estimate of commute trips
only and do not include non-work trips, they indicate that there are social and physical barriers to
bicycling that are not currently being addressed.
There are many factors (i.e., adequate infrastructure and supportive policies) that affect the extent
to which bicycling will be a viable transportation mode in urban and suburban communities (2).
According to the 2009 Nationwide Household Travel Survey (NHTS), 57% percent of daily vehicle trips
are under five miles in length – a reasonable distance to ride a bike (3). Even with extensive bike
infrastructure, riders must be willing and physically able to operate bikes for a full range of trips. Because
TRB 2014 Annual Meeting Paper revised from original submittal.
MacArthur, Dill & Person
TRB 2014 Annual Meeting
3
of this, bicycle trips tend to be shorter than motor vehicle trips and cyclists tend to avoid hilly locations
(4). If urban and suburban areas want to increase the numbers participating in biking, barriers for some
individuals must be addressed.
One possible solution to increase biking in urban areas is through wider adoption of e-bikes. By
providing electric power assistance to a rider, the potential role of the bicycle, especially for commuting
and errands, can be expanded by addressing the limits of trip distance and terrain. In addition to distance
and terrain, e-bikes have the potential to overcome other barriers to biking that have been identified in
previous studies (5, 6).
Barriers to Biking
In the U.S., research has found that men bike at a significantly higher rate than women. Pucher, Buehler,
and Seinen found the 2009 NHTS showed that women made 24% of all bike trips with men making up
the remaining 76% (7). This is consistent with a study that found men’s total bike trips surpass women’s
by a ratio of at least 2:1 (8). In contrast, industrialized European countries such as the Netherlands,
Denmark, and Germany tend to have equal or higher rates of female cyclists compared to male cyclists
(9). Past research has shown that factors that keep women from biking more include: increased concern
for safety, the need to make multiple stops while hauling items such as groceries, and transporting
passengers (10). Baby boomers came of age during the automobile era and yet as a whole, this group is
more physically active than any previous generation. A report by the AARP Public Policy Institute states
that there is renewed interest from older adults in alternatives to the automobile, such as bicycles (11).
Past research has shown that older bike riders can have difficulty navigating intersections, left hand turns,
and maneuvering the bicycle (12). As the baby boom generation ages, their continued mobility and
accessibility needs will increase as their numbers increase.
In a survey of the bike commute literature, Heinen and colleagues found that barriers to biking
include: safety, weather, inconvenience, lack of fitness, lack of time, being tired, too much effort, and
difficulties with trip chaining (10). These barriers can be more or less significant based on an individual’s
age, fitness, or physical ability. Infrastructure improvements, destinations and destination amenities can
address some of these concerns related to safety and distance but fail to address other barriers related to
the individual rider such as fitness, topography, and effort. Distance and topography can be tied to many
of the barriers to biking that include lack of fitness, lack of time, being too tired, too much effort and
difficulties with trip chaining. E-bikes could allow people with physical limitations, older adults, and
people in geographically challenging areas to participate in bicycling (6, 13).
Electric Bikes
E-bikes typically resemble a standard pedal bicycle with the addition of a rechargeable battery and
electric motor to assist the rider with propulsion. E-bike makes and models vary widely in their
technology. This paper will focus on e-bikes that are essentially standard bicycles that have a battery and
small motor to assist the rider with propulsion. Electric scooters with or without pedals are not considered
e-bikes for the purposes of this paper. The location of the batteries and motors on the e-bike vary from
model to model. Many e-bikes place a motor either on the front or rear wheel hub of the bicycle.
Alternatively, e-bike motors can be located near the middle of the bicycle around the crank area to
provide assistance to the crank or chain. Batteries can be built into the frame of the e-bike, mounted
externally or within a rear rack. Some researchers make a distinction between powered bicycles (PBs) and
power-assisted bicycles (PABs), also referred to as “pedelecs”. The critical difference between PBs and
PABs is that on the former, the motor operates with a switch or throttle without any pedaling from the
rider, on the latter, power assistance is only provided when the rider is pedaling (14). The e-bike as we
know it today originated in Japan sometime during the early 1980s with the intent of making bicycling
easier for the elderly (15).
Federally, the Consumer Product Safety Act regulates the use of low-speed electric bicycles to
“two-or three-wheeled vehicle with fully operable pedals and an electric motor of less than 750 watts (1
horse power), whose maximum speed on a paved level surface, when powered solely by such a motor
TRB 2014 Annual Meeting Paper revised from original submittal.
MacArthur, Dill & Person
TRB 2014 Annual Meeting
4
while ridden by an operator who weighs 170 pounds, is less than 20 mph” (16). Individual states may
have their own requirements with respect to e-bikes that are more stringent than the federal law. Many
states do not have specific e-bike regulations at this time but that may change if this technology continues
to expand. As of this report, we found that 20 of 50 U.S. states had e-bike specific regulations. Some
municipalities in the U.S. specifically prohibit e-bikes on multi-use paths or city streets (17, 18, 19).
The worldwide market for e-bikes is growing but varies geographically. According to Navigant
Research, worldwide sales of e-bikes were expected to be 30 million units in 2012 and 47.6 million by
2018 with the majority of sales being in Asia. In China alone, 120 million e-bikes (includes scooter and
mopeds) were operating in the country as of 2010 and a total of 200 million were expected to be on roads
by 2012. In the U.S., e-bike sales in 2012 were approximately 53,000. Comparatively, approximately
252,000 e-bikes were sold in Germany, a country with less than one-third the population of the U.S. (20).
Because of limited numbers in North America, e-bikes can still be considered in the “early adopter” phase
though U.S. consumers are being presented with a broader range of e-bike options through specialty
bicycle stores, online stores and electronic retail outlets. Mainstream use of e-bikes in the U.S. has been
hampered by low retail availability, cost of units, lack of knowledge about the technology and issues
effecting general bike use; such as, inadequate infrastructure investments and a lack of comprehensive,
integrated policies and programs to promote bicycling and cycling safety (7).
The majority of the e-bike research has focused on use and adoption in China and Europe. In
2006, Weinhart et al. detailed results intercept surveys on consumer travel behavior and attitudes of 460
e-bike user in Shijiazhuang, China (21). More recently, Johnson and Rose looked to understand the
Australian e-bike market (22). These studies show that e-bikes are used by a variety of individuals to bike
further distances and to overcome barriers to biking, such as trip length, cargo weight or physical
limitations. One of the striking differences in the studies and with this study is in Shijiazhuang e-bike
users where evenly split between male and female and 73% where between 24 and 40 years old (21). The
Australian and North American users tend to be older and male.
METHODS
Existing e-bike owners and users, primarily in the U.S., were surveyed using an instrument adapted from
Institute of Transport Studies at Monash University in Melbourne Australia (22). The e-bike survey was
administered online starting March 7, 2013 and remained open until July 1, 2013. The survey link was
distributed through e-bike blogs, online forums, Facebook pages, Twitter accounts, e-mails to
manufacturers and retailers, and via postcards left in local bicycle shops in the Portland region. Closed-
ended responses were analyzed using SPSS to identify trends and differences. The survey included a
number of questions with the opportunity for the participant to include open-ended text responses. These
responses were analyzed and grouped into major themes where possible.
Five hundred and fifty-three people who own or use an e-bike regularly in the U.S. or Canada
took the survey, though not everyone answered all questions. Because the individuals were not a random
sample and there is very limited knowledge of actual e-bike ownership in the North America, findings
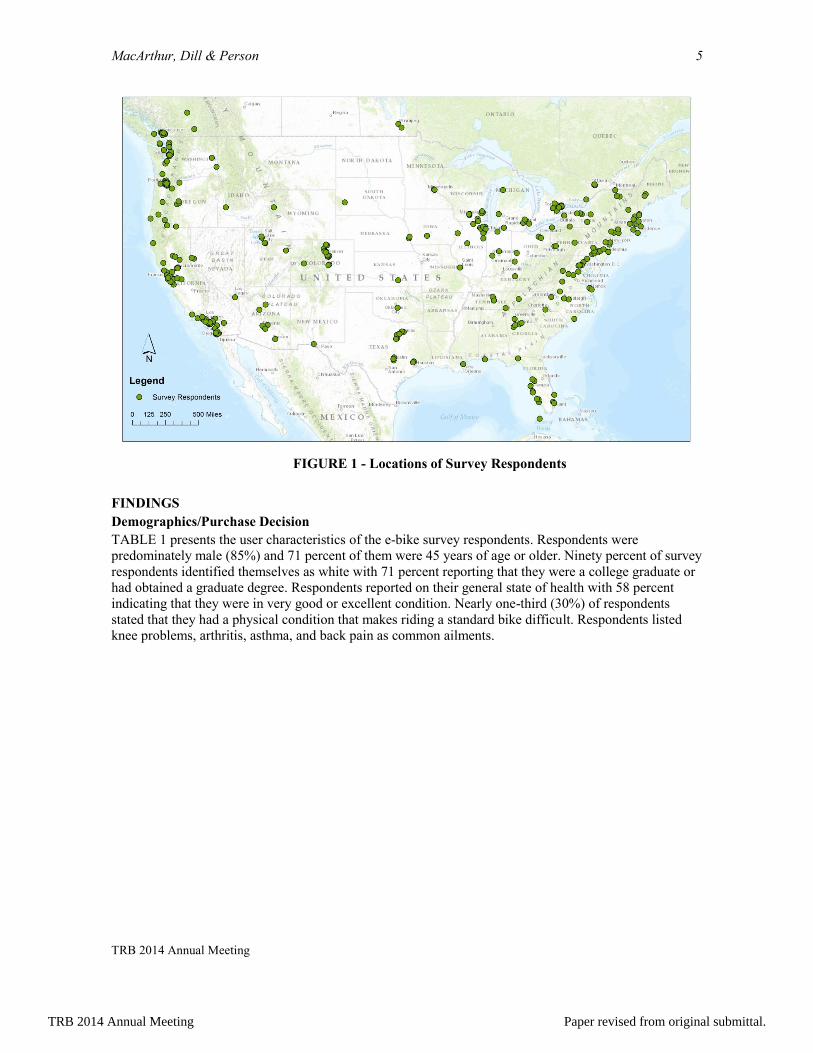
may not accurately represent the population of e-bike owners. FIGURE 1 shows the geographic
distribution of survey respondents across the U.S. and Canada. Concentrations of respondents are
observed in Southern California, the San Francisco Bay Area, the Pacific Northwest and along the
northeastern corridor.
TRB 2014 Annual Meeting Paper revised from original submittal.
MacArthur, Dill & Person
TRB 2014 Annual Meeting
5
FIGURE 1 - Locations of Survey Respondents
FINDINGS
Demographics/Purchase Decision
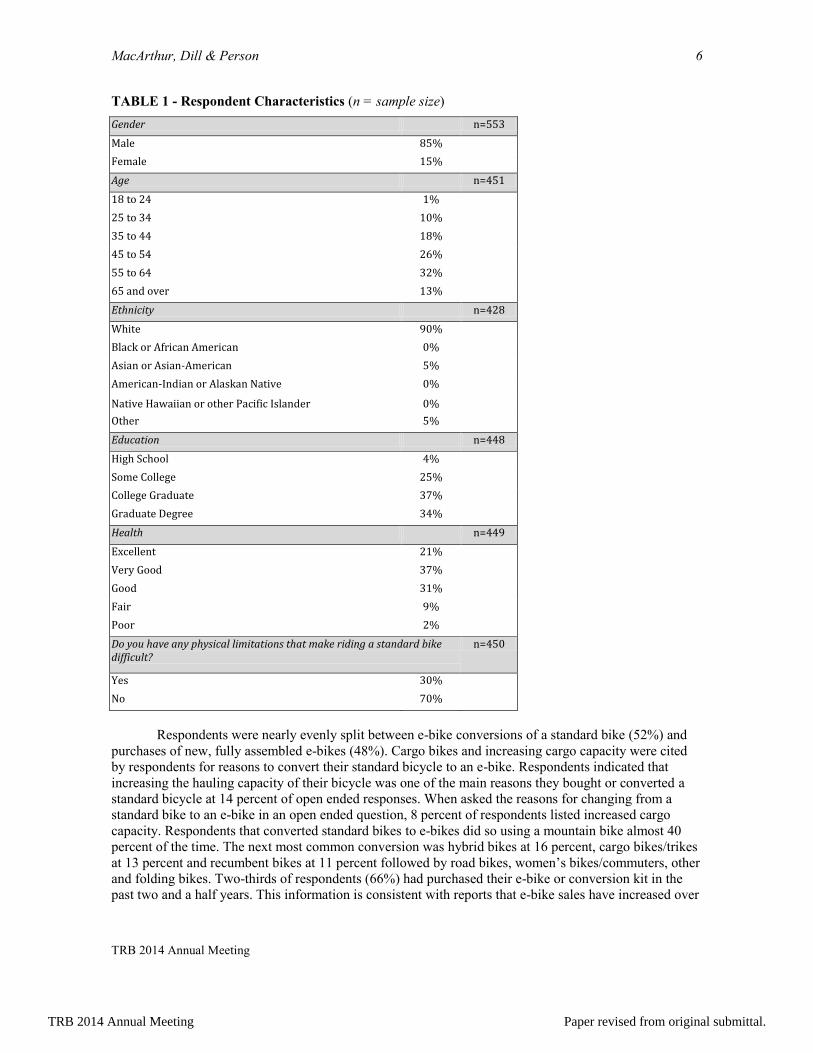
TABLE 1 presents the user characteristics of the e-bike survey respondents. Respondents were
predominately male (85%) and 71 percent of them were 45 years of age or older. Ninety percent of survey
respondents identified themselves as white with 71 percent reporting that they were a college graduate or
had obtained a graduate degree. Respondents reported on their general state of health with 58 percent
indicating that they were in very good or excellent condition. Nearly one-third (30%) of respondents
stated that they had a physical condition that makes riding a standard bike difficult. Respondents listed
knee problems, arthritis, asthma, and back pain as common ailments.
TRB 2014 Annual Meeting Paper revised from original submittal.
MacArthur, Dill & Person
TRB 2014 Annual Meeting
6
TABLE 1 - Respondent Characteristics (n = sample size)
Gender n=553
Male 85%
Female 15%
Age n=451
18 to 24 1%
25 to 34 10%
35 to 44 18%
45 to 54 26%
55 to 64 32%
65 and over 13%
Ethnicity n=428
White 90%
Black or African American 0%
Asian or Asian-American 5%
American-Indian or Alaskan Native 0%
Native Hawaiian or other Pacific Islander 0%
Other 5%
Education n=448
High School 4%
Some College 25%
College Graduate 37%
Graduate Degree 34%
Health n=449
Excellent 21%
Very Good 37%
Good 31%
Fair 9%
Poor 2%
Do you have any physical limitations that make riding a standard bike difficult?
n=450
Yes 30%
No 70%
Respondents were nearly evenly split between e-bike conversions of a standard bike (52%) and
purchases of new, fully assembled e-bikes (48%). Cargo bikes and increasing cargo capacity were cited
by respondents for reasons to convert their standard bicycle to an e-bike. Respondents indicated that
increasing the hauling capacity of their bicycle was one of the main reasons they bought or converted a
standard bicycle at 14 percent of open ended responses. When asked the reasons for changing from a
standard bike to an e-bike in an open ended question, 8 percent of respondents listed increased cargo
capacity. Respondents that converted standard bikes to e-bikes did so using a mountain bike almost 40
percent of the time. The next most common conversion was hybrid bikes at 16 percent, cargo bikes/trikes
at 13 percent and recumbent bikes at 11 percent followed by road bikes, women’s bikes/commuters, other
and folding bikes. Two-thirds of respondents (66%) had purchased their e-bike or conversion kit in the
past two and a half years. This information is consistent with reports that e-bike sales have increased over
TRB 2014 Annual Meeting Paper revised from original submittal.
MacArthur, Dill & Person
TRB 2014 Annual Meeting
7
the past few years (14). When asked how the electric power turns on for their e-bike, 46 percent of
respondents said that their e-bike either had a grip or thumb throttle on the handlebar. Thirty percent of
respondents indicated that their e-bike had an on/off button and 13 percent said that their e-bike only
provides assistance when pedaling. The remaining 11 percent of respondents chose “other” with 65
percent indicating that their e-bike had a pedal assist option in addition to a throttle and the remaining 35
percent described an ignition or switch to activate the power assistance.
When asked how much their e-bike or conversion kit cost to purchase, the responses varied
within categories from $500 or less to $2,501 or more. Twenty-two percent of respondents indicated that
their e-bike or conversion kit cost was $1,000-$1,500. The least populated price category was the $2,001-
2,500 range with only 10 percent of respondents. When price was compared to conversion type,
differences in purchase price were more apparent with those who converted a standard bike in general
spent less than respondents who purchased an e-bike.
Many, but not nearly all, of the e-bike users were standard bike riders prior to getting their e-bike.
Ninety-four percent of respondents indicated that they rode a standard bike as an adult before owning an
e-bike, but only 55 percent rode a standard bike either weekly or daily prior to e-bike purchase. When
asked how often they ride a standard bike now, 31 percent indicated weekly or daily. Interestingly, 6
percent of respondents didn’t ride a standard bike as an adult before they purchased an e-bike and 89
percent of them now ride daily or weekly.
The majority of e-bike survey respondents (90%) indicated that they have access to a motor
vehicle at home and 91 percent have a license for a motor vehicle. Seven percent of respondents reported
having zero motor vehicles in their household and 72 percent reported that they had one or two motor
vehicles. Nearly one-third (33%) of respondents reported that 61 percent or more of their trips were by e-
bike. Household size was predominately one or two persons (65%), reflecting the majority of older adult
respondents.
Motivations for Purchasing an E-bike
Respondents were asked about the main reasons they bought or converted an e-bike, with the ability to
indicate multiple reasons. Nearly 65 percent of respondents stated that one of the main reasons they
bought or converted an e-bike was to replace some car trips. Twenty-one percent of respondents indicated
that one of the main reasons for converting to an e-bike was a medical condition reduced their ability to
ride a standard bike and 52 percent of respondents indicated that one of the main reasons was to increase
fitness. Nearly 60 percent of respondents indicated that one of the main reasons was because they live or
work in a hilly area and 55 percent said that they wanted to ride with less effort. The reason with the least
percentage of respondents was to keep up with friends/family, 11 percent of respondents chose this as one
of the main reasons they bought or converted an e-bike.
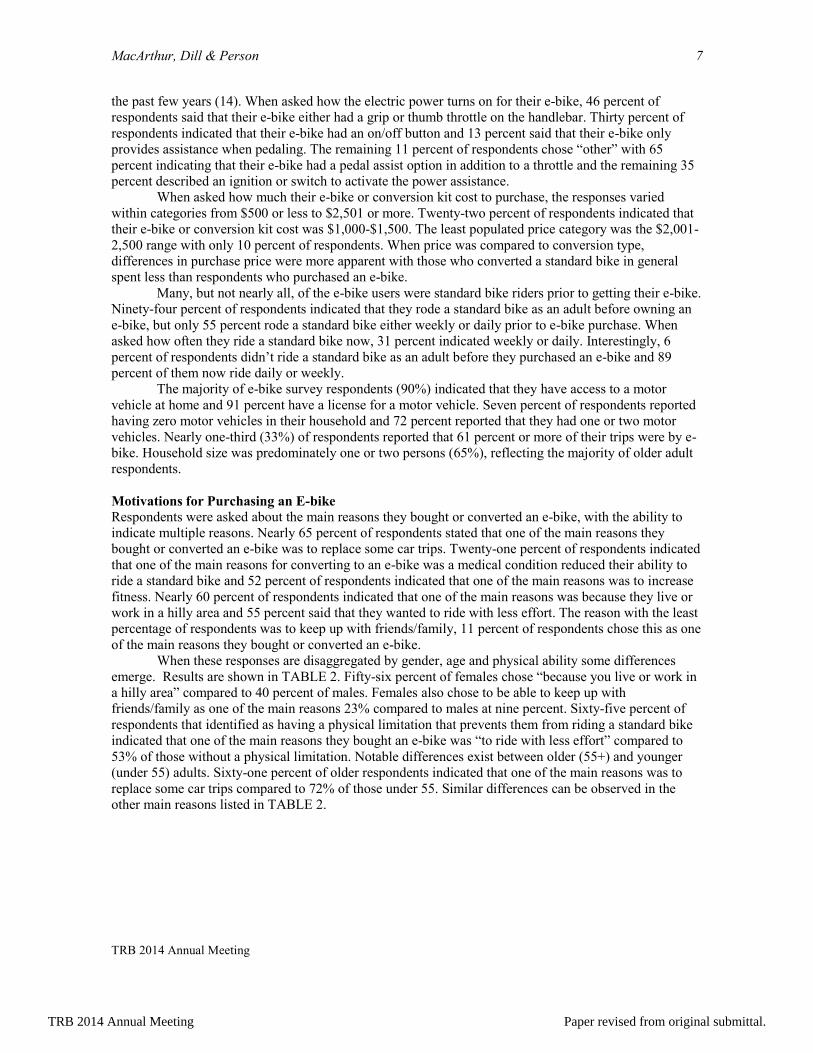
When these responses are disaggregated by gender, age and physical ability some differences
emerge. Results are shown in TABLE 2. Fifty-six percent of females chose “because you live or work in
a hilly area” compared to 40 percent of males. Females also chose to be able to keep up with
friends/family as one of the main reasons 23% compared to males at nine percent. Sixty-five percent of
respondents that identified as having a physical limitation that prevents them from riding a standard bike
indicated that one of the main reasons they bought an e-bike was “to ride with less effort” compared to
53% of those without a physical limitation. Notable differences exist between older (55+) and younger
(under 55) adults. Sixty-one percent of older respondents indicated that one of the main reasons was to
replace some car trips compared to 72% of those under 55. Similar differences can be observed in the
other main reasons listed in TABLE 2.
TRB 2014 Annual Meeting Paper revised from original submittal.
MacArthur, Dill & Person
TRB 2014 Annual Meeting
8
TABLE 2 – Motivations for Purchasing and Using an E-bike
Male Female
Respondents with physical
limitation
Respondents without a physical
limitation
Respondents Under 55
Respondents 55 and Older
Percent Percent Percent Percent Percent Percent
What were the main reasons you bought an electric bike, or converted a standard bicycle?
To replace some car trips 69% 61% 56% 72% 72% 61%
Health - medical condition reduced your ability to ride a standard bike
23% 20% 59% 6% 13% 33%
Health - to increase physical fitness
54% 57% 60% 52% 49% 61%
Because you live or work in a hilly area
40% 56% 41% 43% 41% 44%
To ride with less effort 57% 51% 65% 53% 51% 63%
To be able to keep up with friends/family when I go for rides
9% 23% 20% 8% 9% 15%
Sample size (n) 381 70 133 317 249 202
What is the main reason that you use your electric bike (purpose of trips)?
Commute to work/school 45% 49% 31% 51% 58% 30%
Local trips (shopping and errands)
24% 27% 27% 23% 21% 29%
Recreation 20% 13% 28% 16% 9% 31%
Other 11% 12% 14% 10% 12% 10%
Sample size (n) 381 68 132 316 248 201
Note: Bold indicates a significance difference between values based a chi-square test, p ≤ 0.05
One-hundred and seventeen respondents chose “other” as a main reason for buying or converting
an e-bike. Twenty-eight percent of these responses listed fun as the reason, 23 percent indicated that they
wanted to travel farther or faster by bike, 14 percent listed increased hauling capacity with hobby, saving
money, driving not being an option and to keep up with traffic/safety comprising the other answers.
Electric Bike Use
The survey responses indicate that e-bikes may be increasing overall levels of bicycling. When asked how
often they rode a standard bike before owning an e-bike, 55 percent of respondents indicated that they
rode weekly or daily. When asked how often they ride their e-bike, 93 percent of respondents replied that
they ride weekly or daily. Some of this difference may be attributed to response bias (the most
enthusiastic owners are more likely to take the survey), though that may not account for the large
difference (55% versus 93%).
E-bikes appear to be used primarily for utilitarian travel. Respondents were asked to pick the
main reason that they used their electric bike. In aggregate, 45 percent of respondents chose commute to
work/school as the main reason that they used their e-bike with local trips accounting for 24 percent,
TRB 2014 Annual Meeting Paper revised from original submittal.
MacArthur, Dill & Person
TRB 2014 Annual Meeting
9
recreation at 20 percent and 11 percent chose other. The majority of respondents that chose other wanted
an option for all of the above. When these responses were disaggregated by gender, physical ability and
age, some differences emerged. Males were more likely to use their e-bikes for recreation compared to
females with 20 percent of males choosing recreation as the main reason they use their e-bike versus 13
percent of females. Respondents with a physical limitation were less likely to use their e-bike to commute
to work than those without a physical ability, 31 percent versus 51 percent respectively. Consequently, 28
percent of those with a physical limitation responded that they use their e-bike for recreation compared to
16 percent of respondents without a physical limitation. Thirty-one percent of respondents 55 and older
use their e-bikes for recreation compared to nine percent of those under 55. Commute trips were much
higher for respondents under 55 (58%) compared to those 55 and older (30%). This difference may be
explained by the probability that fewer respondents 55 and older are in the workforce.
E-bikes do appear to be changing the way bicyclists ride. Forty-five percent of respondents
indicated that they take a different route on their e-bike than they did on their standard bike. When
segregated by gender, 51 percent of females responded that they take a different route compared to 44
percent of males. In an open-ended question, respondents that indicated that they take a different route
listed the routes they take on their e-bike. Thirty-five percent of respondents indicated that they do not
avoid hills on their e-bike as compared to a standard bike. Thirty-one percent of respondents indicated
that they take a more direct or higher traffic route on their e-bike and interestingly, 30 percent indicated
that they take a lower traffic or less direct route. The remaining responses listed avoiding off street or
multi-use paths to limit confrontation with other users.
Some of the advantages of an e-bike include being able to travel further, accelerate more easily,
travel faster, and ride up hills more easily. These advantages were evident among our respondents.
Seventy-three percent of respondents indicated that they ride their e-bike to different destinations than
they did on their standard bike. Again, there was a difference by gender with 79 percent of females
indicating that they ride to different destinations compared to 71 percent of males. Respondents that ride
to different destinations were asked what those destinations are in an open ended format. Nearly 34
percent indicated that they ride to places that are farther away. Another third listed errands or social
events as a different destination that they ride to on their e-bike. Sixteen percent listed commute as a
different destination, 10 percent indicated recreational trips and seven percent listed hillier destinations or
origins.
When asked how often they stop and wait at all stop signs on their e-bike, 54 percent chose
always. When asked the same question for riding their standard bike, 25 percent chose always but 10
percent chose not applicable presumably because they do not currently ride a standard bike. When asked a
series of question on if their top speed and average speed was higher than when they rode a standard bike,
the vast majority of respondents either agreed or strongly agreed. In the same set of questions participants
were asked to agree or disagree with statements about not needing a shower at the end of their trip and if
they were to make the same trip by a standard bike they would need a shower. Here again, respondents
agreed or strongly agreed that they don’t need a shower at the end of the trip (74%) and that they would
need a shower if they had ridden a standard bike (67%).
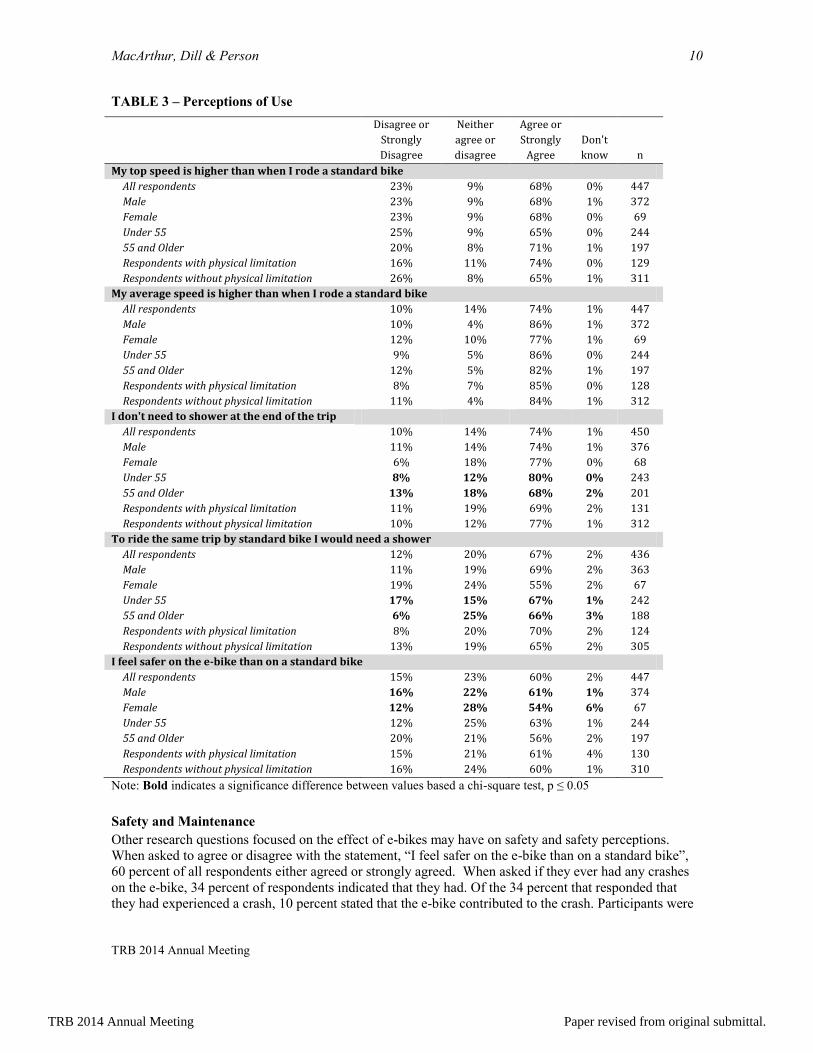
When this data are disaggregated by gender, age and physical limitations some differences are
more apparent as seen in TABLE 3. Seventy-one percent of respondents 55 and older agreed or strongly
agreed that their top speed is higher on an e-bike than a standard bike compared to 65 percent of
respondents under the age of 55. When asked to agree or disagree about their average speed being higher
on an e-bike, 86 percent of males either agreed or strongly agreed compared to 77 percent of females.
When asked to agree or disagree with the statement “I don’t need to shower at the end of the trip”, 80
percent of respondents under the age of 55 either agreed or strongly agreed compared to 68 percent of
those 55 and older. This could be partly explained by how older adults use their e-bikes, a higher
percentage of older adults use their e-bikes for recreation. When asked if they would need a shower to
ride the same trip on a standard bike, 69 percent of males either agreed or strongly agreed compared to 55
percent of females.
TRB 2014 Annual Meeting Paper revised from original submittal.
MacArthur, Dill & Person
TRB 2014 Annual Meeting
10
TABLE 3 – Perceptions of Use
Disagree or
Strongly
Disagree
Neither
agree or
disagree
Agree or
Strongly
Agree
Don't
know n
My top speed is higher than when I rode a standard bike
All respondents 23% 9% 68% 0% 447
Male 23% 9% 68% 1% 372
Female 23% 9% 68% 0% 69
Under 55 25% 9% 65% 0% 244
55 and Older 20% 8% 71% 1% 197
Respondents with physical limitation 16% 11% 74% 0% 129
Respondents without physical limitation 26% 8% 65% 1% 311
My average speed is higher than when I rode a standard bike
All respondents 10% 14% 74% 1% 447
Male 10% 4% 86% 1% 372
Female 12% 10% 77% 1% 69
Under 55 9% 5% 86% 0% 244
55 and Older 12% 5% 82% 1% 197
Respondents with physical limitation 8% 7% 85% 0% 128
Respondents without physical limitation 11% 4% 84% 1% 312
I don't need to shower at the end of the trip
All respondents 10% 14% 74% 1% 450
Male 11% 14% 74% 1% 376
Female 6% 18% 77% 0% 68
Under 55 8% 12% 80% 0% 243
55 and Older 13% 18% 68% 2% 201
Respondents with physical limitation 11% 19% 69% 2% 131
Respondents without physical limitation 10% 12% 77% 1% 312
To ride the same trip by standard bike I would need a shower
All respondents 12% 20% 67% 2% 436
Male 11% 19% 69% 2% 363
Female 19% 24% 55% 2% 67
Under 55 17% 15% 67% 1% 242
55 and Older 6% 25% 66% 3% 188
Respondents with physical limitation 8% 20% 70% 2% 124
Respondents without physical limitation 13% 19% 65% 2% 305
I feel safer on the e-bike than on a standard bike
All respondents 15% 23% 60% 2% 447
Male 16% 22% 61% 1% 374
Female 12% 28% 54% 6% 67
Under 55 12% 25% 63% 1% 244
55 and Older 20% 21% 56% 2% 197
Respondents with physical limitation 15% 21% 61% 4% 130
Respondents without physical limitation 16% 24% 60% 1% 310
Note: Bold indicates a significance difference between values based a chi-square test, p ≤ 0.05
Safety and Maintenance
Other research questions focused on the effect of e-bikes may have on safety and safety perceptions.
When asked to agree or disagree with the statement, “I feel safer on the e-bike than on a standard bike”,
60 percent of all respondents either agreed or strongly agreed. When asked if they ever had any crashes
on the e-bike, 34 percent of respondents indicated that they had. Of the 34 percent that responded that
they had experienced a crash, 10 percent stated that the e-bike contributed to the crash. Participants were
TRB 2014 Annual Meeting Paper revised from original submittal.
MacArthur, Dill & Person
TRB 2014 Annual Meeting
11
asked to describe their crash in an open ended question, responses varied widely from problems with
increased speed and weight, to rider error and conflicts with other road users. Alternatively, when asked if
the e-bike helps them avoid crashes, 42 percent replied yes. When asked to describe how the e-bike helps
them avoid crashes in an open ended question, responses included acceleration to get out of intersections
more quickly, keeping up with car traffic, and better balance at higher speeds.
When asked to rank where they typically recharge their e-bike, 83 percent ranked home as the
primary location. The workplace was ranked as the second most frequent recharge location at 52 percent.
Destinations ranked as the third most frequent charging location with 37 percent of responses. Fifty-three
percent of respondents indicated that the battery has run out when they were out riding. An open ended
follow-up question asked what they did when the battery ran out. Ninety percent of respondents indicated
that they pedaled when the battery ran out. Other answers included switching batteries, recharging
somewhere, walking the bike home, calling for a ride or using transit. The respondents were asked where
they get their bike serviced, 58 percent responded that they service it themselves and 31 percent had it
serviced where they had purchased the bike. Another electric bike retailer (8%) and private service (3%)
were less popular locations for service. When asked how often their e-bike needs to be serviced
compared to a standard bike, 49 percent indicated that it was about the same and 27 replied more often
than a standard bike.
User Perceptions
When respondents were asked if they ever had any reactions – positive or negative – from other road
users, 36 percent of respondents indicated that they had positive reactions, followed closely by curiosity
at 34 percent. Alternatively, 20 percent of respondents indicated that they had negative or angry reactions
and 10 percent used the word cheating explicitly. The perceptions of existing users may be useful in
developing marketing messages for non-users, some of whom who may have negative opinions of e-
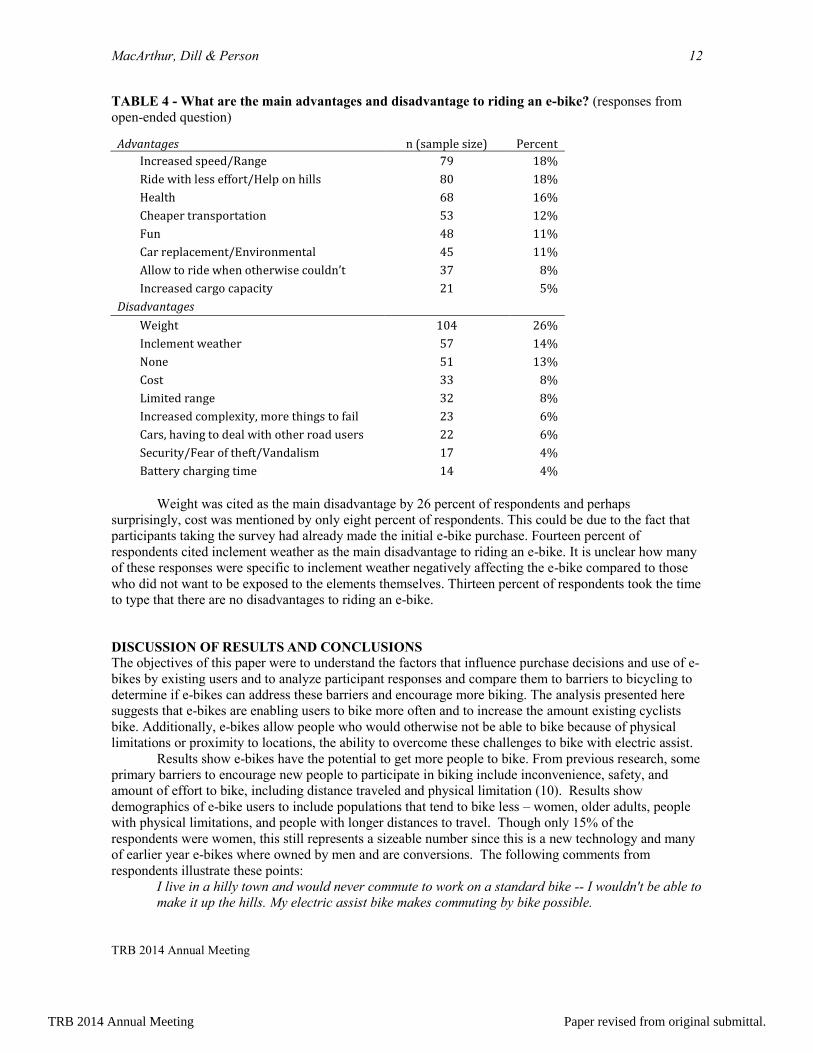
bikes. Participants provided the main advantages and disadvantages to riding an e-bike in an open ended
question. Responses varied widely with no clear advantage dominating (TABLE 4). Equal shares (18%)
cited increased speed and range and to ride with less effort or help with hills. The third most frequent
response included health advantages of riding an e-bike (16%). Cheaper transportation, fun and replacing
car trips/ environmental reasons were cited by about equal shares of respondents.
TRB 2014 Annual Meeting Paper revised from original submittal.
MacArthur, Dill & Person
TRB 2014 Annual Meeting
12
TABLE 4 - What are the main advantages and disadvantage to riding an e-bike? (responses from
open-ended question)
Advantages n (sample size) Percent
Increased speed/Range 79 18%
Ride with less effort/Help on hills 80 18%
Health 68 16%
Cheaper transportation 53 12%
Fun 48 11%
Car replacement/Environmental 45 11%
Allow to ride when otherwise couldn’t 37 8%
Increased cargo capacity 21 5%
Disadvantages
Weight 104 26%
Inclement weather 57 14%
None 51 13%
Cost 33 8%
Limited range 32 8%
Increased complexity, more things to fail 23 6%
Cars, having to deal with other road users 22 6%
Security/Fear of theft/Vandalism 17 4%
Battery charging time 14 4%
Weight was cited as the main disadvantage by 26 percent of respondents and perhaps
surprisingly, cost was mentioned by only eight percent of respondents. This could be due to the fact that
participants taking the survey had already made the initial e-bike purchase. Fourteen percent of
respondents cited inclement weather as the main disadvantage to riding an e-bike. It is unclear how many
of these responses were specific to inclement weather negatively affecting the e-bike compared to those
who did not want to be exposed to the elements themselves. Thirteen percent of respondents took the time
to type that there are no disadvantages to riding an e-bike.
DISCUSSION OF RESULTS AND CONCLUSIONS
The objectives of this paper were to understand the factors that influence purchase decisions and use of e-
bikes by existing users and to analyze participant responses and compare them to barriers to bicycling to
determine if e-bikes can address these barriers and encourage more biking. The analysis presented here
suggests that e-bikes are enabling users to bike more often and to increase the amount existing cyclists
bike. Additionally, e-bikes allow people who would otherwise not be able to bike because of physical
limitations or proximity to locations, the ability to overcome these challenges to bike with electric assist.
Results show e-bikes have the potential to get more people to bike. From previous research, some
primary barriers to encourage new people to participate in biking include inconvenience, safety, and
amount of effort to bike, including distance traveled and physical limitation (10). Results show
demographics of e-bike users to include populations that tend to bike less – women, older adults, people
with physical limitations, and people with longer distances to travel. Though only 15% of the
respondents were women, this still represents a sizeable number since this is a new technology and many
of earlier year e-bikes where owned by men and are conversions. The following comments from
respondents illustrate these points:
I live in a hilly town and would never commute to work on a standard bike -- I wouldn't be able to
make it up the hills. My electric assist bike makes commuting by bike possible.
TRB 2014 Annual Meeting Paper revised from original submittal.
MacArthur, Dill & Person
TRB 2014 Annual Meeting
13
I am age 78, legally blind, live alone in a semi-rural area. 4 miles to the nearest scheduled bus
route and town, 7 miles to my favorite shopping area, 12 miles to my church.
I cannot drive due to epilepsy. I cannot bus due to severe motion sickness. Biking is my only way
to work other than getting a ride. Bike commuting maintains my fitness level. I can ride even
when I don't feel physically well or am overtired. I get to work faster than it takes when I get a
car ride. I love the time outdoors, seeing the city and feeling like part of the bike community.
On the goal of encouraging more people to bike more often and to bike to more distant locations,
results show a positive relationship of having an e-bike and the increase in riding. Six percent of the
respondents stated that they did not ride a bike as an adult until purchasing an e-bike and 89 percent of
them now ride daily or weekly. Of the people owning a standard bike as an adult, 55 percent indicated
that they rode their standard bike daily or weekly before purchasing an e-bike. That number rose to 93
percent after purchasing an e-bike. Respondents also indicated that they are biking farther distances less
sweaty or tired than with a standard bicycle, they are not avoiding certain trips, destinations and hills and
they enjoy the experience of bike riding.
One of the primary advantages stated was the ability of biking with less effort. This benefit plays
out in different populations. For older adults and people with physical limitations, it means having an
easier time biking and it is not as strenuous. For younger people, it means the ability to travel farther
distances and not exerting too much effort to cause perspiration while riding. The following comments
from respondents highlight these points:
I get more exercise with the e-bike because I ride more.
E-bikes are a fantastic replacement for a car for short distances.
I can ride to and from work without needing to shower at my destination.
I use the e-bike primarily as a substitute for the car where I would have otherwise would have
driven a car.
I can carry my son and a week’s worth of groceries.
Assessing the net effects of these shifts – more biking but with less effort – on physical activity
was not an objective of this research. However, the findings indicate that the net effect may be positive.
About two-thirds of the users got their e-bike to replace car trips, and 30% have physical limitations that
make riding a standard bike difficult. Our survey respondents also indicated that they are riding more
often than they rode their standard bike (if they did at all). In addition, research indicates that even with
the electric assist, e-bikes can enhance health. At least three separate studies testing adults in laboratory-
type setting found that the even with the electric assist, an e-bike provided moderate to vigorous physical
activity (23, 24, 25). All of those researchers concluded that the e-bikes could lead to health benefits
because the reduced perception of effort could get people to bicycle more. The research offers insights
about existing e-bike owners to help identify potential policy issues and areas for future research. To date,
little research has been completed on how improvements in bicycling technology can encourage more
trips to be made by bike and for more people to take bike trips. Any time a new technology is adopted,
there are issues and challenges that arise in its use. Some of those issues explored in the survey where
related to cost, battery life, safety and conflicts, and perceptions of other cyclists and motorists. All these
topics should be explored in more detail, especially issues around safety and perceptions from others. In
areas of the country, where e-bike usage is increasing there could be policy issues that influence the
adoption of e-bikes, as seen in New York and Toronto. For example, there is concern on how e-bikes
interact with standard bikes and pedestrians on shared facilities. Issues of speed, safety, and operator
behavior should be explored. About 20 percent of the respondents noted negative feedback from other
TRB 2014 Annual Meeting Paper revised from original submittal.
MacArthur, Dill & Person
TRB 2014 Annual Meeting
14
cyclists and motorists. Some negative feedback (10%) was related to perceptions that e-bike riders were
seen as cheating. This perception may be a function of awareness and social acceptance as more people
adopt the technology.
This study was the first known nationwide survey of e-bike users in North America but it still
only reached an unknown fraction of the total North American e-bike owners. We acknowledge that these
results are not based upon a random sample of e-bike owners and may not be necessarily representative of
the population, but they are perhaps indicative of general decision factors and uses by individuals.
Because of the low adoption rates in the U.S., a random sample survey is not economically feasible at this
time. We received lower than expected representation from female riders. Because this is a crucial group
to encourage to cycle more often, further research should look into women and e-bikes. Additionally,
further research is needed to consider the implications of e-bikes on physical activity. Future studies could
examine how, when, and to what extent users engage in power assistance in conjunction with pedaling.
Finally, more insight is needed to understand how e-bikes might replace trips by standard bike, transit, or
car.
The next steps of our research will include additional analysis of the collected survey information.
As this survey was modified from an Australian study through Monash University, it may be possible to
compare results to see what the main differences or similarities are between the two continents and then
compare them to Asian and European markets. Additionally, more in-depth studies of e-bike users in the
Portland region are taking place, which will monitor travel activity, physical activity and user feedback on
the technology.
ACKNOWLEDGMENTS
This research was supported by the Oregon Transportation Research and Education Consortium (OTREC)
and Portland State University. The authors gratefully acknowledge Geoffrey Rose and Marilyn Johnson at
the Institute of Transport Studies, Monash University for allowing us to use their survey instrument, the
assistance and support of the faculty and staff at Portland State University and the people who
participated in the survey.
REFERENCES
1. League of American Bicyclists. 2011 State Bicycle Commute Rates, Including Bicycle Commuting by
Gender. http://www.bikeleague.org/content/advocacy-resources-0. Accessed Jul. 12, 2013.
2. Pucher, J., J. Dill, and S. Handy. Infrastructure, programs, and policies to increase bicycling: an
international review. Preventive Medicine, Vol. 50, 2010, pp.106-125.
3. US DOT. 2009 National Household Travel Survey, http://nhts.ornl.gov/tools.shtml Accessed
November 14, 2013.
4. Broach, J., J. Gliebe, and J. Dill. Where do cyclists ride? A route choice model developed with
revealed preference GPS data. Transportation Research Part A: Policy and Practice. 2012.
5. Cherry, C., R. Cervero (2007) Use Characteristics and Mode Choice Behavior of Electric Bike Users
in China. Transport Policy. 14(3) pg 247-257.
6. Dill, J. and G. Rose. E-bikes and Transportation Policy: Insights from Early Adopters. In
Transportation Research Record: Journal of the Transportation Research Board, No. 2314,
Transportation Research Board of the National Academies, Washington, D.C., 2012, pp. 1-6.
7. Pucher, J., R. Buehler, and M. Seinen. Bicycling renaissance in North America? An update and re-
appraisal of cycling trends and policies. Transportation Research Part A, Vol. 45, 2011, pp. 451-475.
8. Edmond, C.R., W. Tang and S.L. Handy. Explaining gender difference in bicycling behavior. In
Transportation Research Record: Journal of the Transportation Research Board, No. 2125,
Transportation Research Board of the National Academies, Washington, D.C. pp. 16-25.
9. Garrard, J., S. Crawford, and N. Hakman. Revolutions for women: increasing women’s participation
in cycling for recreation and transport, summary of key findings.
http://www.australianwomensport.com.au/images/Reports/victorian%20research/Revolutions%20key
%20findings%20A4.pdf. Accessed June 12, 2013.
TRB 2014 Annual Meeting Paper revised from original submittal.
MacArthur, Dill & Person
TRB 2014 Annual Meeting
15
10. Heinen, E., B. van Wee, and K. Maat. Commuting by bicycle: an overview of the literature. Transport
Reviews. Vol. 30(1), 2010, pp. 59-96.
11. McGuckin, N. and J. Lynott. Impact of Baby Boomers on US Travel, 1969 to 2009. Insight on the
Issues, Vol. 70, 2012.
12. Bernhoft, I., L. Hansen, H. Johansen, and L. Larsen. Mortal Accidents with Cyclists – Minute
Analysis of Frequent Types of Accidents. Notat, Vol. 4, 1993, pp. 1986-1990.
13. Rose, G., and J. Dill. Reactions and Concerns with E-Bikes in the United States: Insight from an
Exploratory, Blogological Study. Presented at 90th Annual Meeting of the Transportation Research
Board, Washington, D.C., 2011.
14. Rose, G. E-bikes and urban transportation: emerging issues and unresolved questions.
Transportation, Vol. 39, 2012, pp. 81-96.
15. Parker, A.A. Green products to help move the world beyond oil: power assisted bicycles. Proceedings
of Solar, Vol. 99, 1999, No. 37, pp. 1-4.
16. Consumer Product Safety Act. Sec. 38 [15 U.S.C. § 2085 Low-Speed Electric Bicycles. August 12,
2011 Version. pp. 110-111.
17. Hurst, Dave. In New York City, E-Bikes Get 86’d. Navigant Research.
www.navigantresearch.com/blog/in-new-york-city-e-bikes-get-86d. Accessed June 5, 2013.
18. Voelcker, John. NYC Bans Electric Bikes (again), Launches Bike Sharing System. Green Car Repots.
http://www.greencarreports.com/news/1084757_nyc-bans-electric-bikes-again-launches-bike-
sharing-system. Accessed June 13, 2013.
19. Er-Chua, Gloira. E-bikes banned from cycling trail. Toronto Star.
http://www.thestar.com/news/gta/2011/09/06/ebikes_banned_from_cycling_trail.html. Accessed
August 1, 2013.
20. Navigant Research. Electric Bicycles: Global Market Opportunities, Barriers, Technology Issues, and
Demand Forecasts for E-Bicycles, Pedal-Assist Bicycles and E-Bicycle Batteries and Motors.
http://www.navigantresearch.com/research/electric-bicycles, 2013.
21. Weinert, J., C. Ma, X. Yang, and C. Cherry. Electric Two-Wheelers in China: Effect on Travel
Behavior, Mode Shift, and User Safety Perceptions in a Medium-sized City. Transportation Research
Record: Journal of the Transportation Research Board, No. 2038, Transportation Research Board of
the National Academies, Washington, D.C. 2007, pp. 62-68.
22. Johnson, M. and G. Rose. Electric Bikes – cycling in the New World City: An Investigation of
Australian Electric Bicycle Owners and the Decision Making Process for Purchase. Proceedings of
the 2013 Australasian Transport Research Forum. pp. 13.
23. Gojanovic, B., J. Welker, K. Iglesias, C. Daucourt, and G. Gremion. "Electric Bicycles as a New
Active Transportation Modality to Promote Health." Medicine and Science in Sports and Exercise 43,
no. 11 (2011): 2204-10.
24. Sperlich, B., C. Zinner, K. Hebert-Losier, D. P. Born, and H. C. Holmberg. "Biomechanical,
Cardiorespiratory, Metabolic and Perceived Responses to Electrically Assisted Cycling." European
Journal of Applied Physiology 112, no. 12 (Dec 2012): 4015-25.
25. Louis, J., J. Brisswalter, C. Morio, C. Barla, and J. J. Temprado. "The Electrically Assisted Bicycle:
An Alternative Way to Promote Physical Activity." [In eng]. American Journal of Physical Medicine
& Rehabilitation 91, no. 11 (Nov 2012): 931-40.
TRB 2014 Annual Meeting Paper revised from original submittal.