Embed Size (px)
Citation preview
E-Center Project
Fermilab Team
Project Review
January, 2012
27/1/11
Outline Year 2 Goals
Year 2 Deliverables
Major Developed Components
Data Collection
Data Retrieval Service (DRS)
Anomalies Detection Service (ADS)
Forecasting Data Service (FDS)
Front-end and UI components
Site Centric View data service (SCV)
Dynamic Circuits Monitoring
User's Content
Year 3 Plan
Future Ideas
37/1/11
Year 2 Goals
Production quality E-Center site
Add Anomalous Detection Service and UI
Add Forecasting Data Service and UI
Site Centric Service and UI
User provided traceroute visualization
User's generated content and user's engagement
4
Year 2 deliverablesE-Center now consists of the Webservices Ecosystem:
DRS – Data Retrieval Service – extended with more sercices
ADS – Anomalous events Detection Service
FDS – Forecasting Data Service
SCV - Site Centric View Data service
Network Data Collection Health Monitoring service – DRS extention
E-Center Data Storage was moved to the newly procured hardware
Complete stack of Authentication and Authorization, Single Sign On ( Shibboleth) was added
5
Year 2 deliverables (continued)
Full text search added to the E-Center portal
Network Weather Map for the user's provided traceroute results was added
Forecasting front-end UI was implemented and integrated into the E-Center
Anomalous Events Detection front-end UI was implemented and integrated into the E-Center
Site Centric View UI was implemented and added to the E-Center
Anonymous user home page and Dashboard for the Authenticated user's with Site Centric View were added
Started User's engagement via social services provided by the E-Center ( area specific groups). Areas for each DOE lab were created to share ideas, concerns.
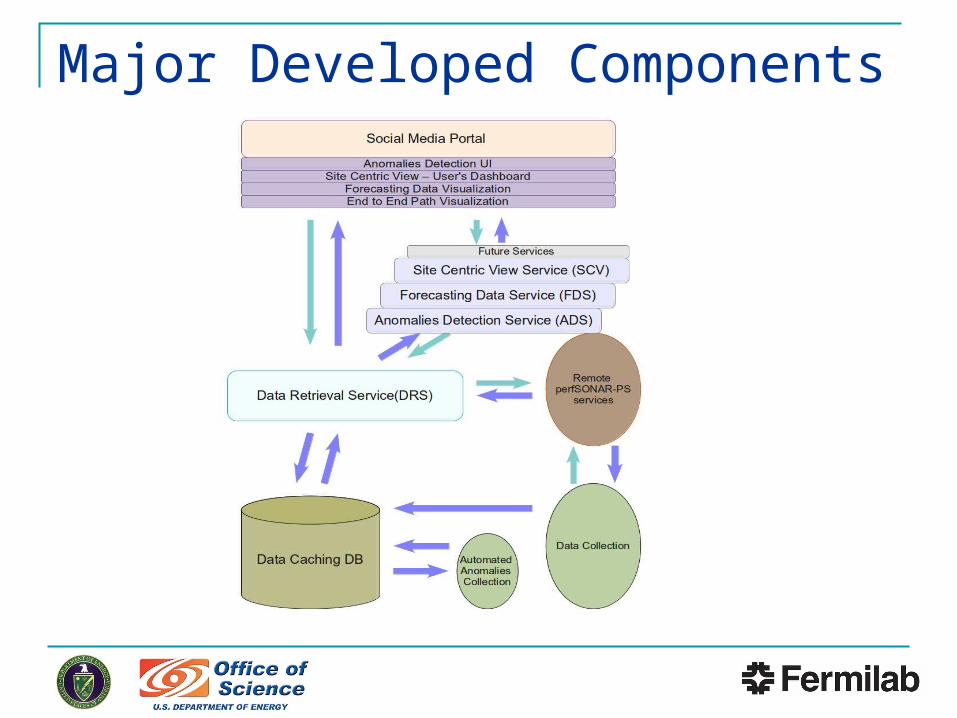
Major Developed Components
77/1/11
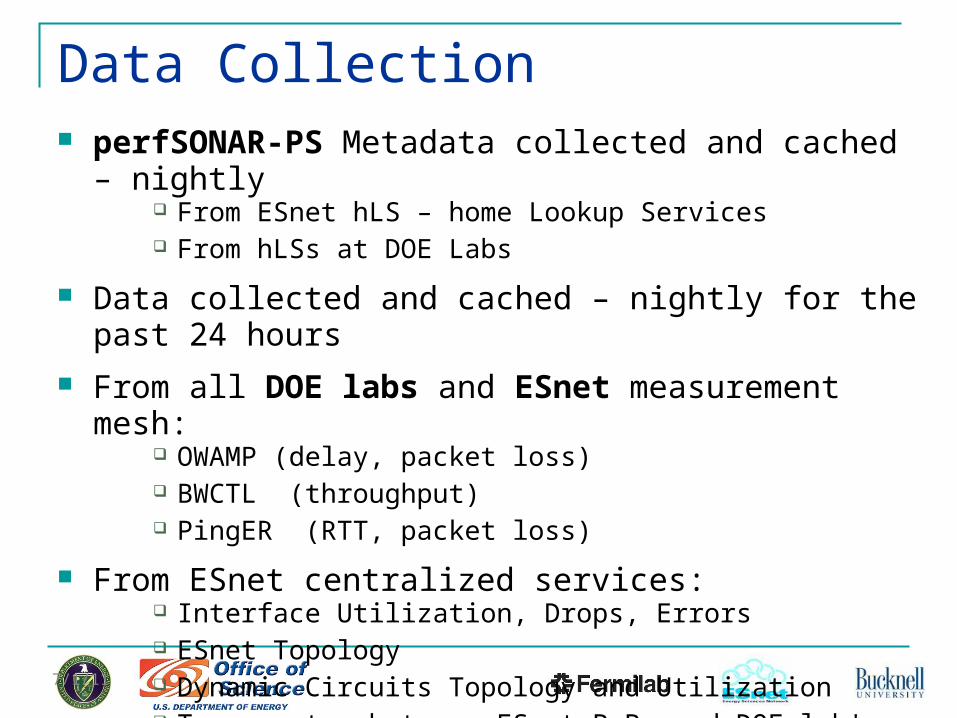
Data Collection perfSONAR-PS Metadata collected and cached – nightly
From ESnet hLS – home Lookup Services From hLSs at DOE Labs
Data collected and cached – nightly for the past 24 hours
From all DOE labs and ESnet measurement mesh: OWAMP (delay, packet loss) BWCTL (throughput) PingER (RTT, packet loss)
From ESnet centralized services: Interface Utilization, Drops, Errors ESnet Topology Dynamic Circuits Topology and Utilization Traceroutes between ESnet PoPs and DOE lab's
8
E-Center DRS and Webservices
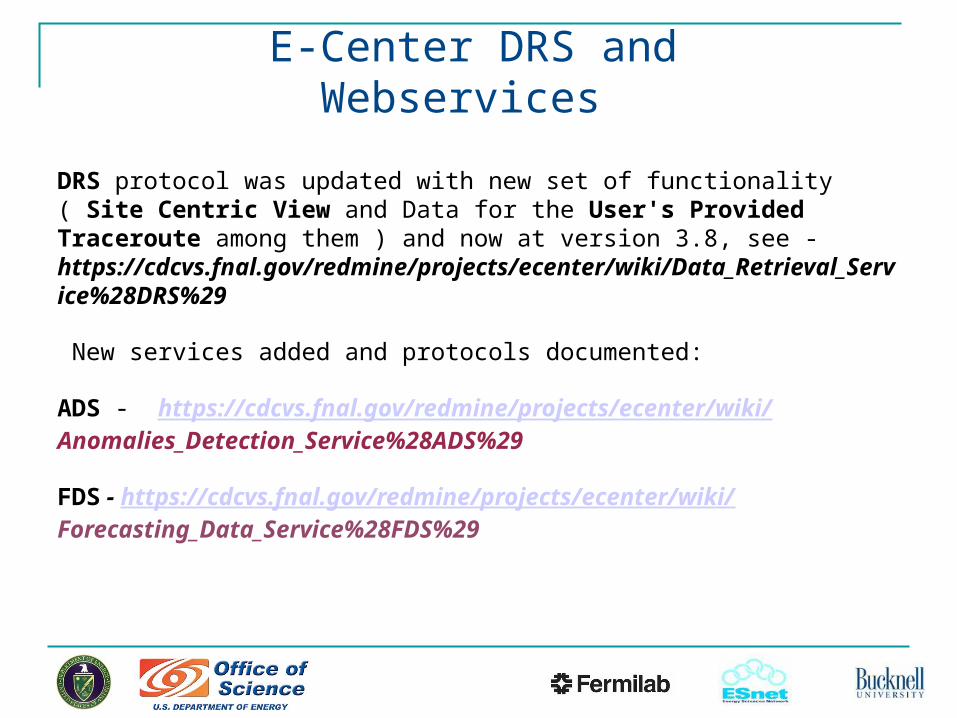
DRS protocol was updated with new set of functionality ( Site Centric View and Data for the User's Provided Traceroute among them ) and now at version 3.8, see - https://cdcvs.fnal.gov/redmine/projects/ecenter/wiki/Data_Retrieval_Service%28DRS%29
New services added and protocols documented:
ADS - https://cdcvs.fnal.gov/redmine/projects/ecenter/wiki/Anomalies_Detection_Service%28ADS%29
FDS - https://cdcvs.fnal.gov/redmine/projects/ecenter/wiki/Forecasting_Data_Service%28FDS%29
9
Data Collection: Just Numbers
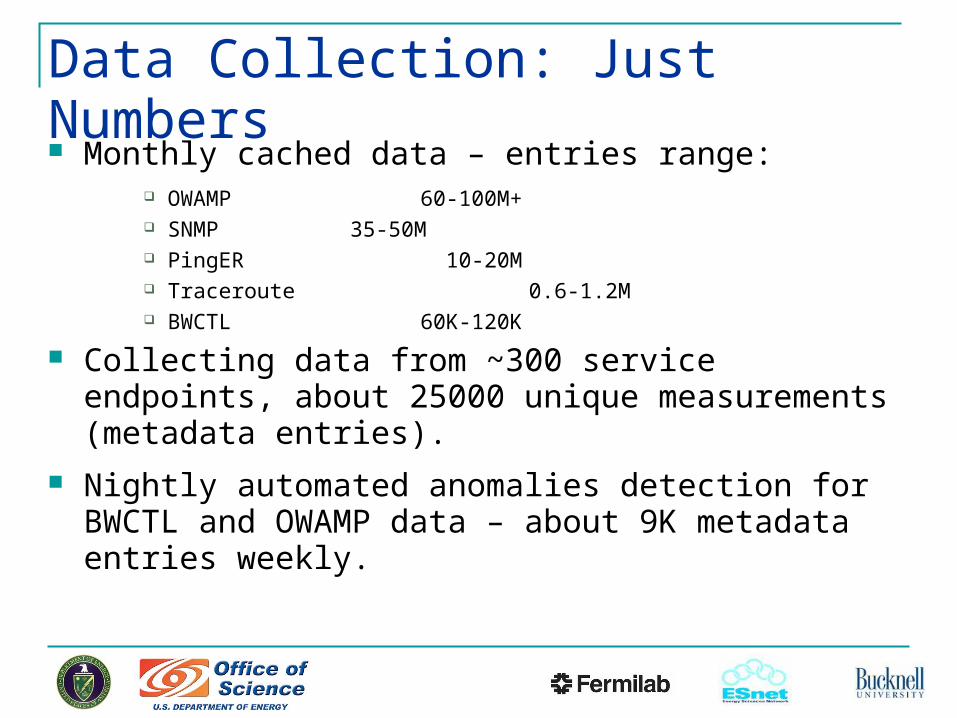
Monthly cached data – entries range: OWAMP 60-100M+ SNMP 35-50M PingER 10-20M Traceroute 0.6-1.2M BWCTL 60K-120K
Collecting data from ~300 service endpoints, about 25000 unique measurements (metadata entries).
Nightly automated anomalies detection for BWCTL and OWAMP data – about 9K metadata entries weekly.
107/1/11
Data Collection: API
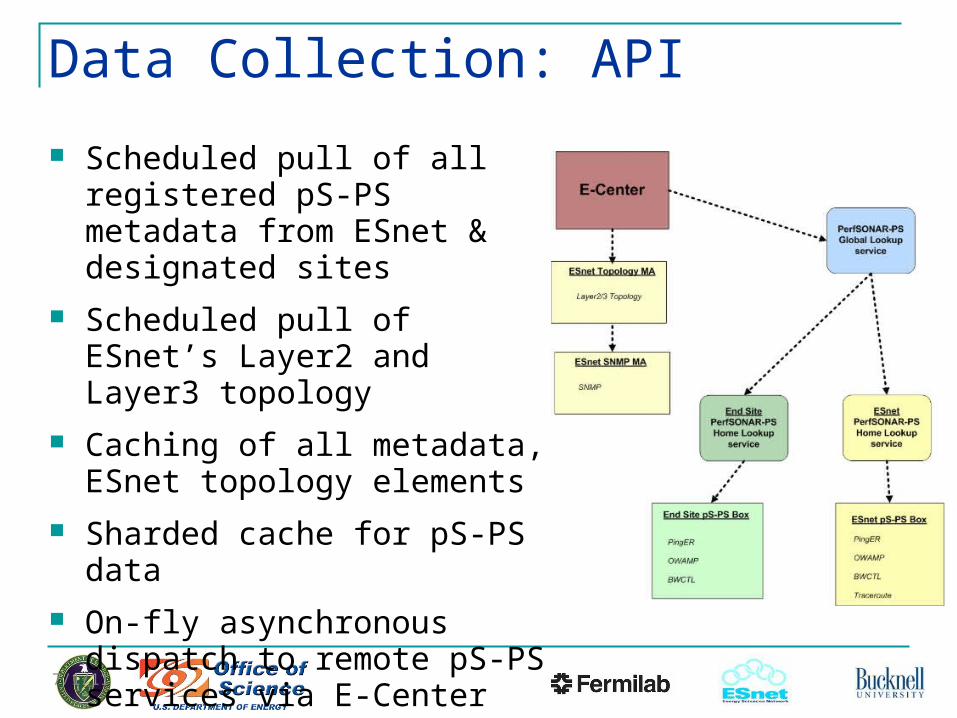
Scheduled pull of all registered pS-PS metadata from ESnet & designated sites
Scheduled pull of ESnet’s Layer2 and Layer3 topology
Caching of all metadata, ESnet topology elements
Sharded cache for pS-PS data
On-fly asynchronous dispatch to remote pS-PS services via E-Center Data API and distributed worker nodes
117/1/11
Technical Details Choice of the REST Data services – simple, flexible
Data cache - MySQL DB engine – scalable, supports replication and clustering for the future extension, data sharding – slicing each data set in pieces for fast retrieval – we use a timestamp for monthly tables
Gearman distributed Job submission manager for all backend tasks – to provide desired level of scalability
Modern Perl for the backend and services – stable, 20+ yr old language, great variety of APIs, mature web development framework, compatibility with perfSONAR-PS API
PHP, Drupal, and jQuery for the front-end – popular, well-known open-source development and content management tools with strong support for social functionality.
127/1/11
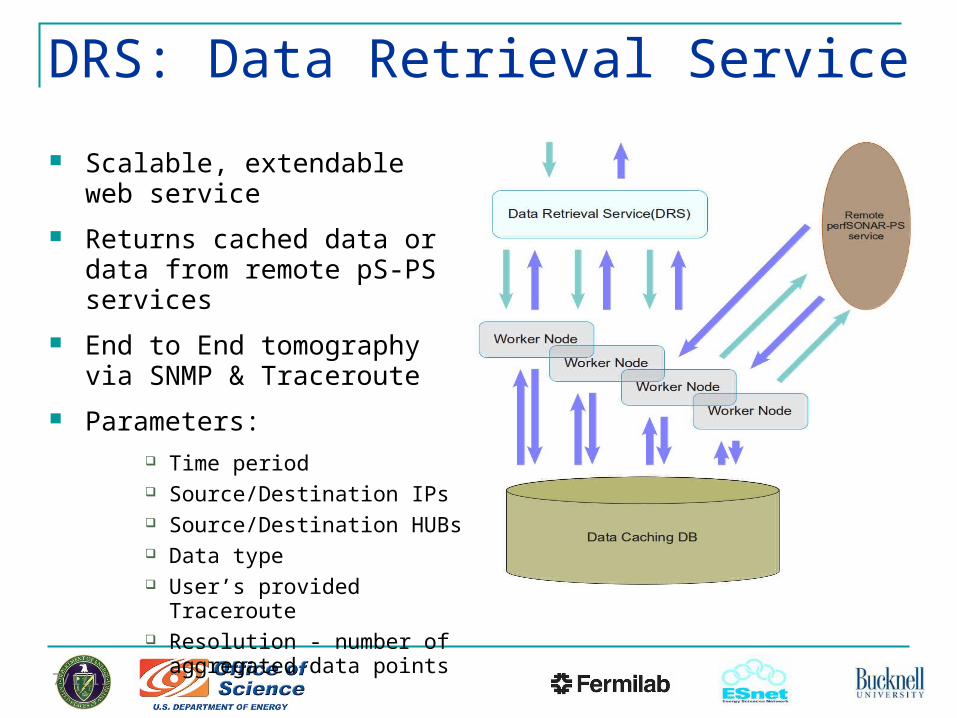
DRS: Data Retrieval Service
Scalable, extendable web service
Returns cached data or data from remote pS-PS services
End to End tomography via SNMP & Traceroute
Parameters: Time period Source/Destination IPs Source/Destination HUBs Data type User’s provided Traceroute Resolution - number of
aggregated data points
137/1/11
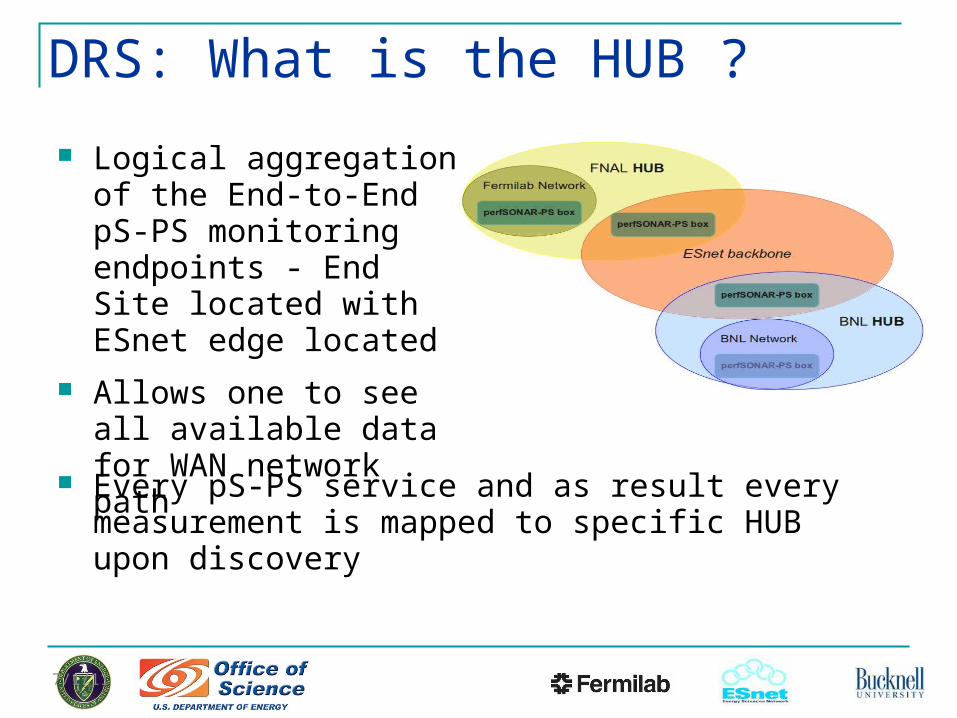
DRS: What is the HUB ?
Logical aggregation of the End-to-End pS-PS monitoring endpoints - End Site located with ESnet edge located
Allows one to see all available data for WAN network path
Every pS-PS service and as result every measurement is mapped to specific HUB upon discovery
147/1/11
ADS: Anomalies Detection Service
REST based web service, can be located anywhere
Designed to work with any E-Center supported data sample or may send request to the DRS for the time series dataset
Implements Static (SPD) or Adaptive Plateau Detection Algorithms (APD): developed at Ohio Supercomputing Center (Prasad Calyam)
Protocol is documented at:
https://cdcvs.fnal.gov/redmine/projects/ecenter/wiki/Anomalies_Detection_Service(ADS)
15
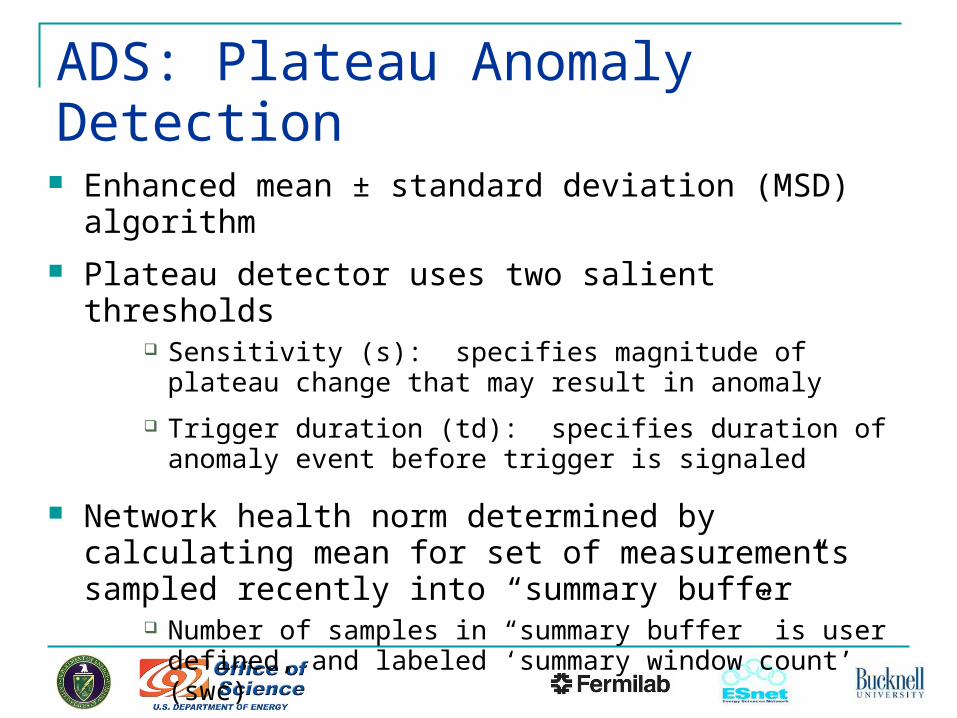
ADS: Plateau Anomaly Detection
Enhanced mean ± standard deviation (MSD) algorithm
Plateau detector uses two salient thresholds Sensitivity (s): specifies magnitude of plateau change that
may result in anomaly
Trigger duration (td): specifies duration of anomaly event before trigger is signaled
Network health norm determined by calculating mean for set of measurements sampled recently into “summary buffer”
Number of samples in “summary buffer” is user defined, and labeled ‘summary window count’ (swc)
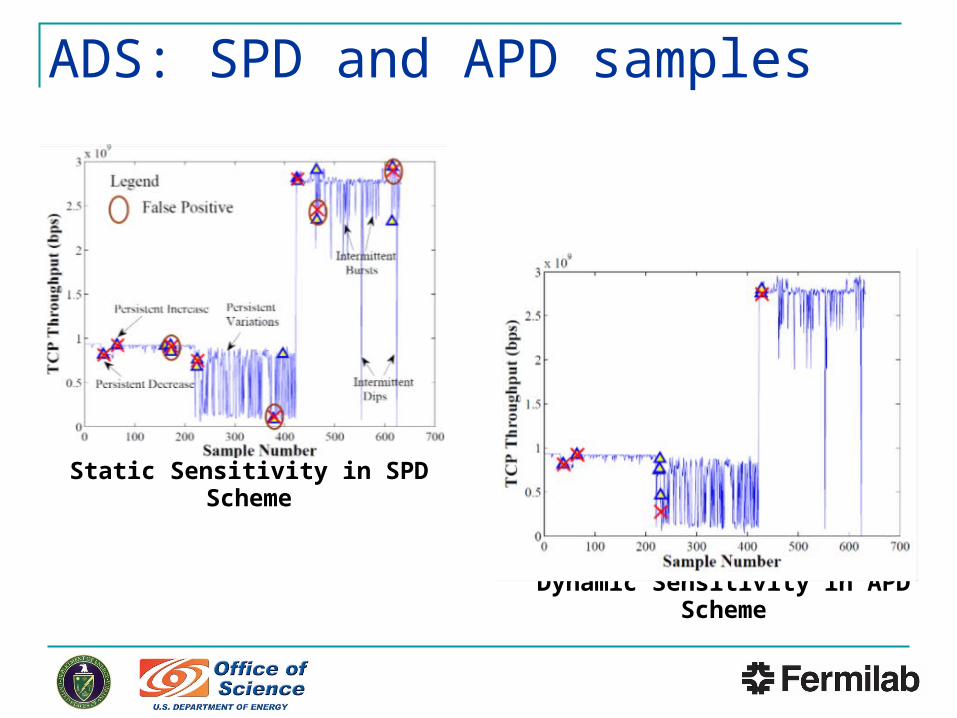
Static Sensitivity in SPD Scheme
Dynamic Sensitivity in APD Scheme
ADS: SPD and APD samples
17
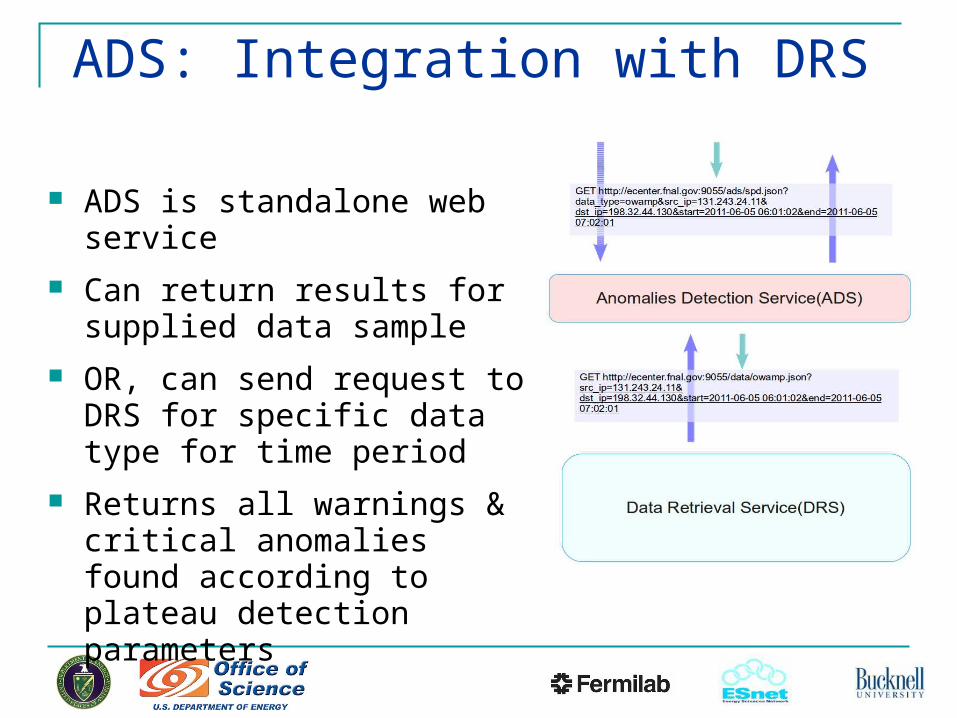
ADS: Integration with DRS
ADS is standalone web service
Can return results for supplied data sample
OR, can send request to DRS for specific data type for time period
Returns all warnings & critical anomalies found according to plateau detection parameters
187/1/11
FDS: Forecasting Data Service
REST based web service, can be located anywhere
Designed to work with any E-Center supported data sample or may send request to the DRS for the time series dataset
Based on Forecasting algorithm developed by Michael Frey at Bucknell University
Protocol is documented at:
https://cdcvs.fnal.gov/redmine/projects/ecenter/wiki/Forecasting_Data_Service(FDS)
19
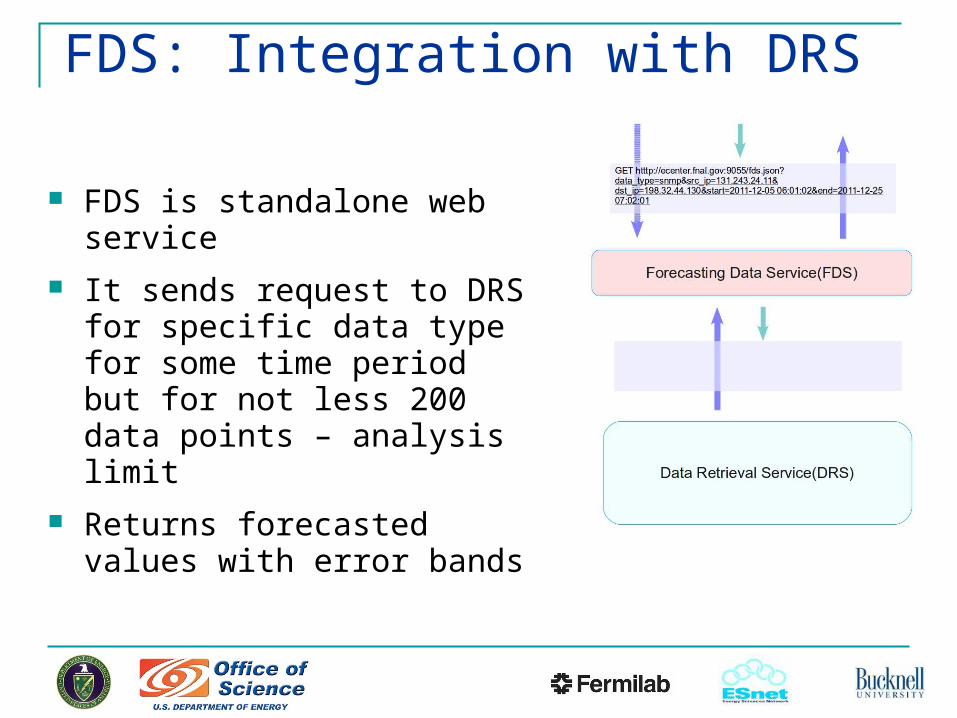
FDS: Integration with DRS
FDS is standalone web service
It sends request to DRS for specific data type for some time period but for not less 200 data points – analysis limit
Returns forecasted values with error bands
20
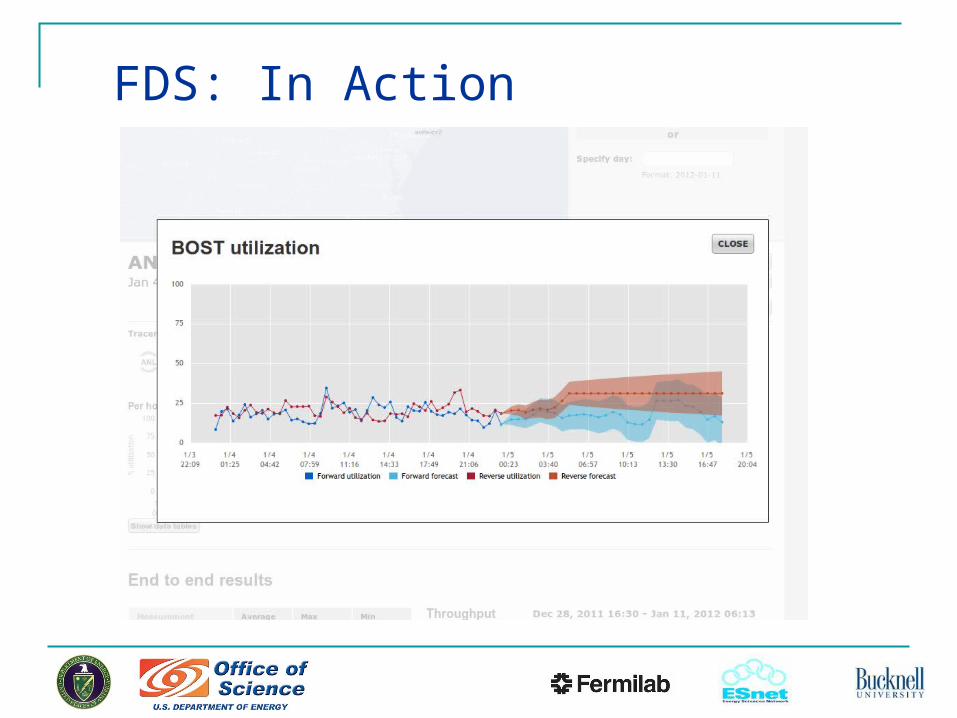
FDS: In Action
217/1/11
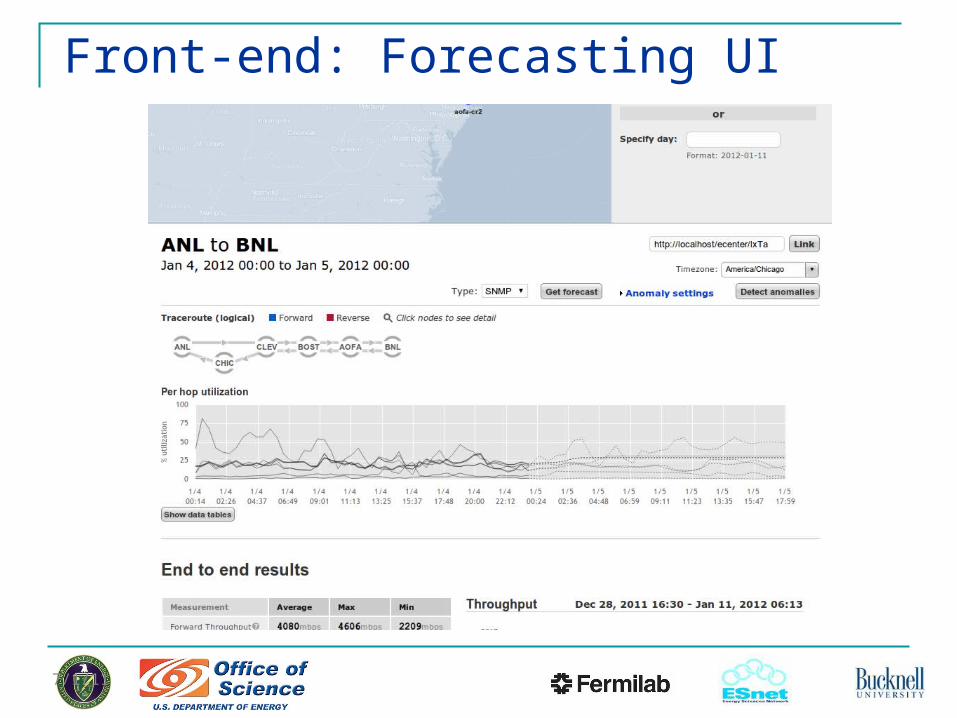
Front-end: Forecasting UI
227/1/11
Front-end Powered by Drupal Content Management System Popular and proven: Great community, stable, widely-known. Strong
support for social networking features (issue tracking, blogs, knowledge base, tag cloud)
Widely adopted by government: Challenge.gov, Whitehouse.gov, Energy.gov, Recovery.gov
Key social features Data conversations: Issue & data notification system allows
conversation & collaboration across DOE networking community. Knowledge base: A powerful WIKI with an easy editor for generating
and sharing documentation. Groups: Lightweight system for sharing conversations &
documentations with a task force or working group Activity stream: A birds' eye view of important conversations,
anomalies, and knowledge base articles customized for each user
237/1/11
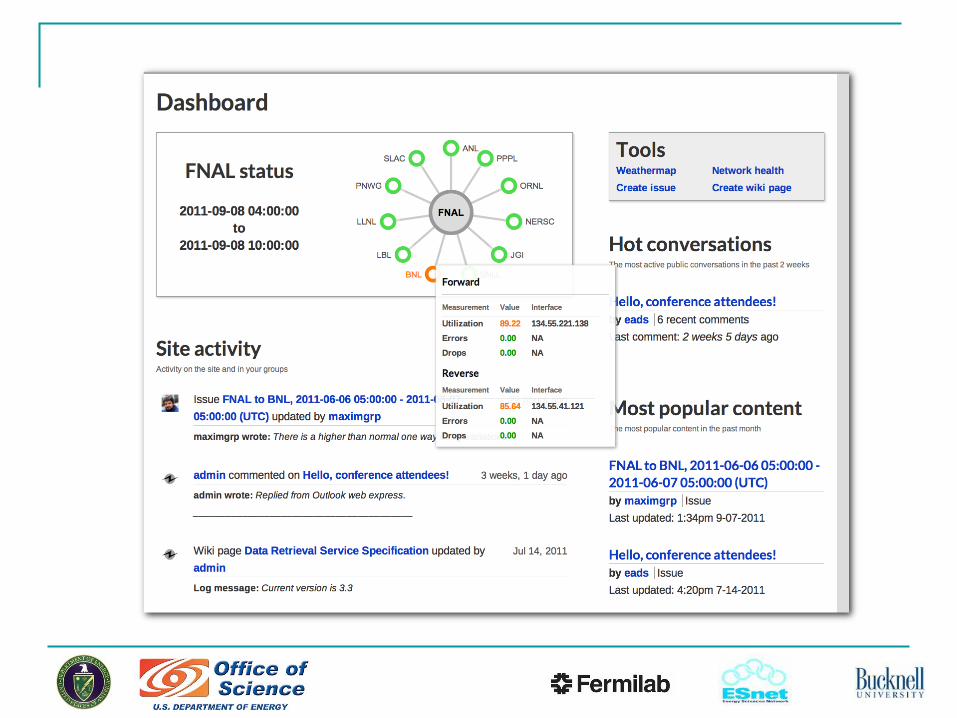
Front-end: DashboardDynamic, per-user dashboard: encourages users to interact with site and each
other user-selectable site-centric view and other data
tools to give user instant snapshot of network status
site-wide activities using familiar "activity stream" interface
Activity stream includes detected anomalies, new content, comments, and more, based on user's group membership
24
257/1/11
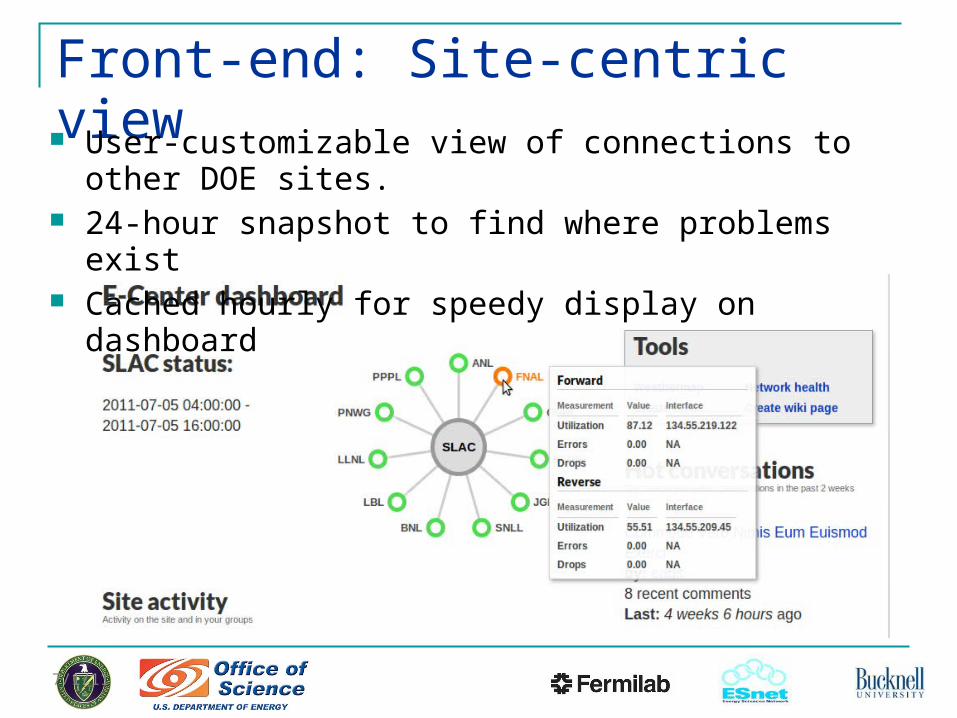
Front-end: Site-centric view User-customizable view of connections to other DOE sites. 24-hour snapshot to find where problems exist Cached hourly for speedy display on dashboard
267/1/11
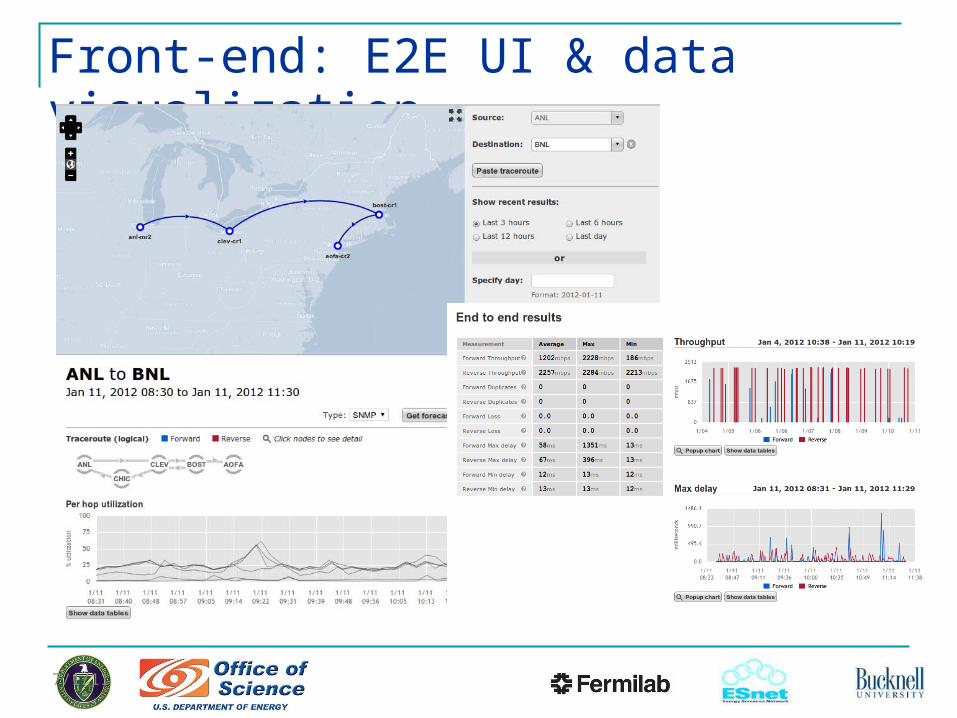
Front-end: E2E UI & data visualization
277/1/11
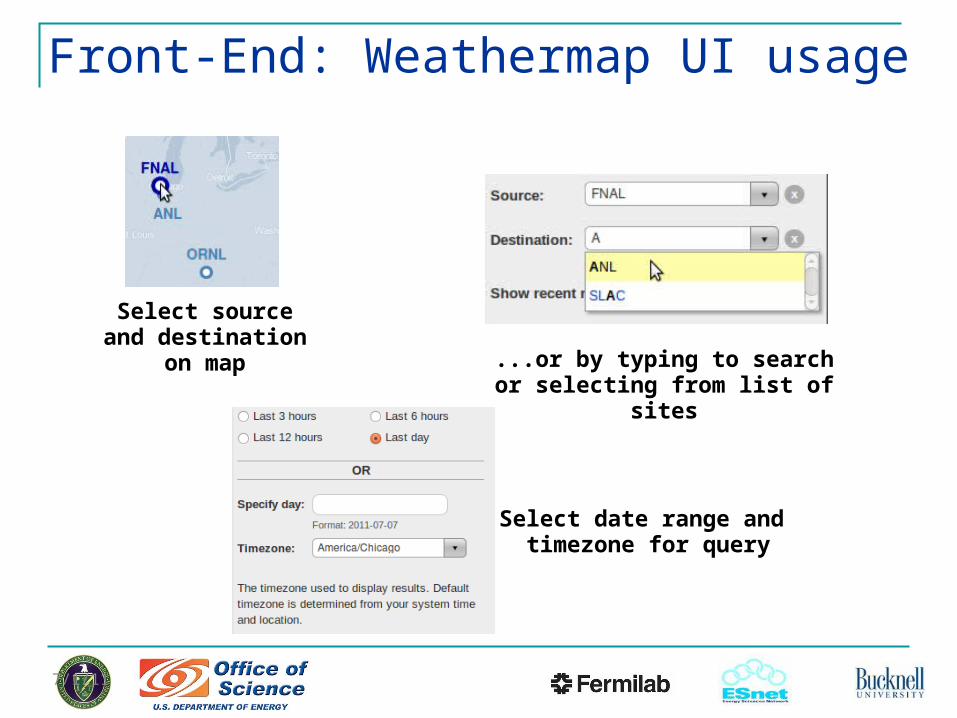
Front-End: Weathermap UI usage
Select source and destination on map
...or by typing to search or selecting from list of sites
Select date range and timezone for query
287/1/11
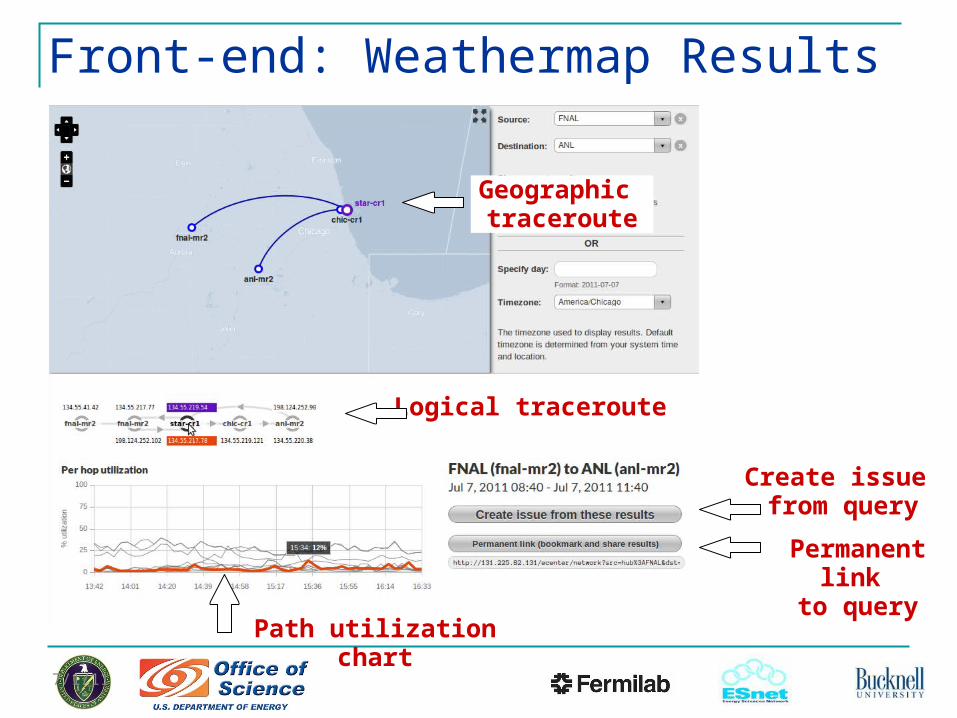
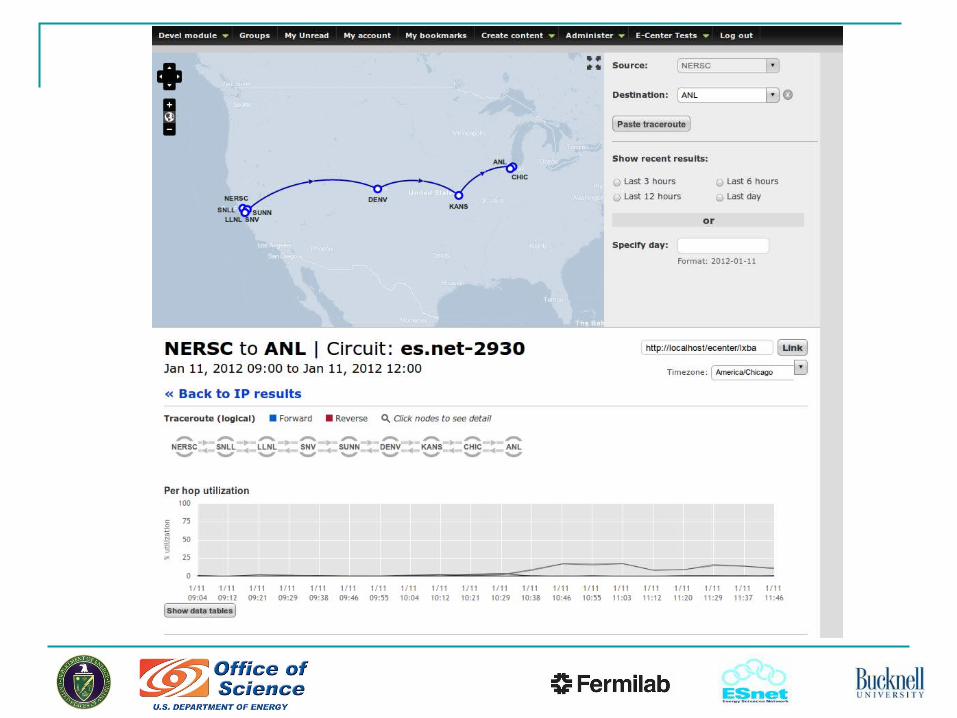
Front-end: Weathermap Results
Geographic traceroute
Logical traceroute
Permanent link to query
Path utilization chart
Create issue from query
297/1/11
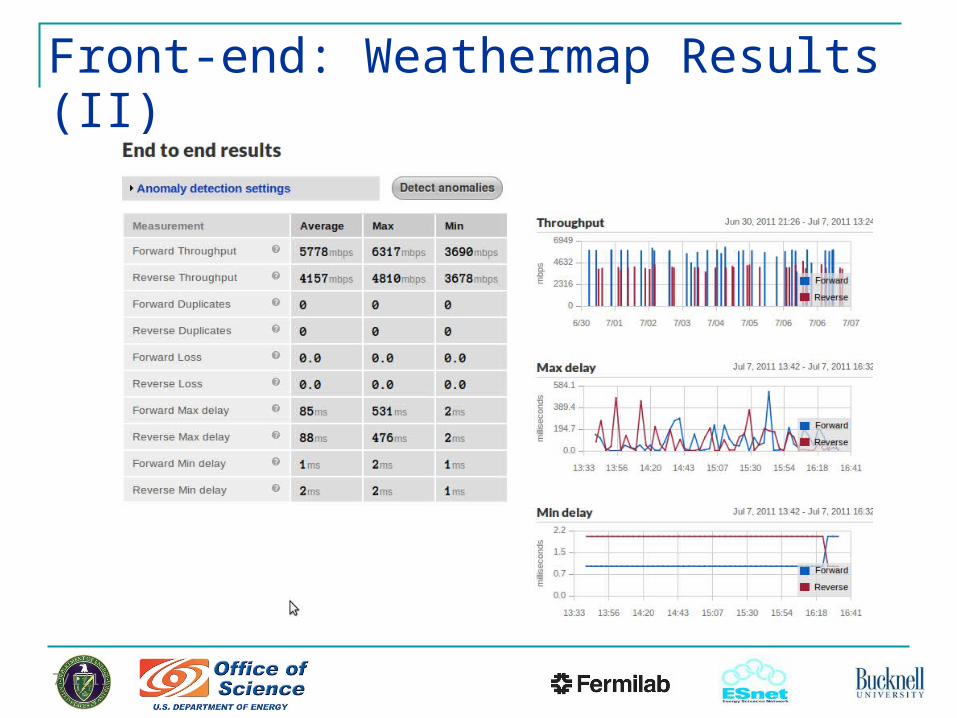
Front-end: Weathermap Results (II)
307/1/11
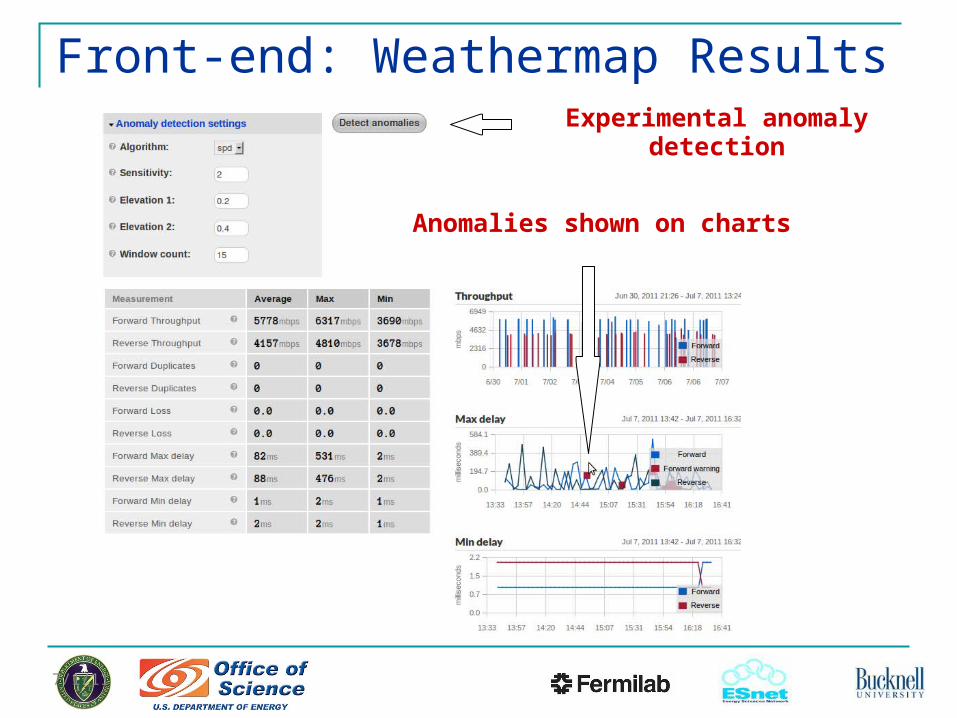
Front-end: Weathermap ResultsExperimental anomaly detection
Anomalies shown on charts
31
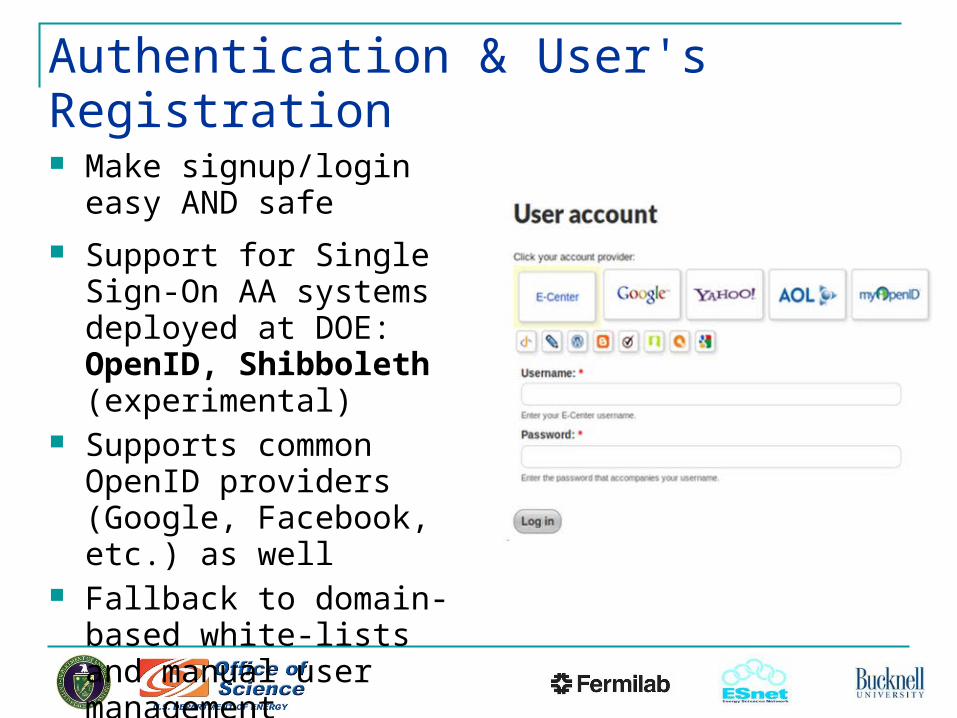
Authentication & User's Registration
Make signup/login easy AND safe
Support for Single Sign-On AA systems deployed at DOE: OpenID, Shibboleth (experimental)
Supports common OpenID providers (Google, Facebook, etc.) as well
Fallback to domain-based white-lists and manual user management
32
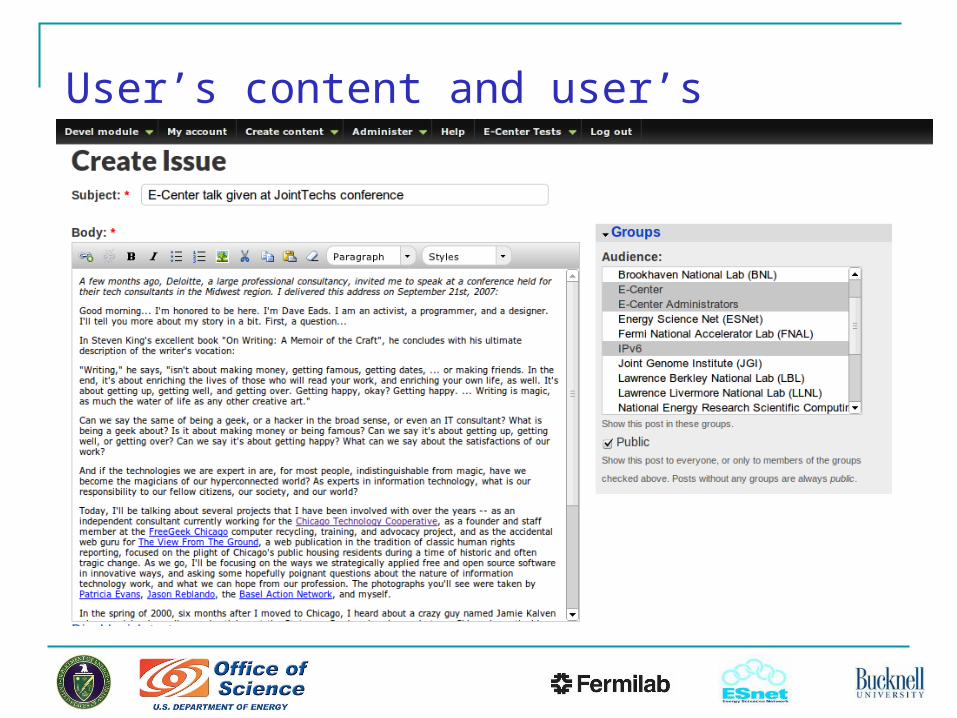
Front-end: Easy Content Creation
Rich text editor
WYSIWYG and Markdown modes
Embedded media support (YouTube, Vimeo)
Code/syntax highlighting
Powerful, secure, nice to use
Email integration: custom notifications, replied by-email functionality
33
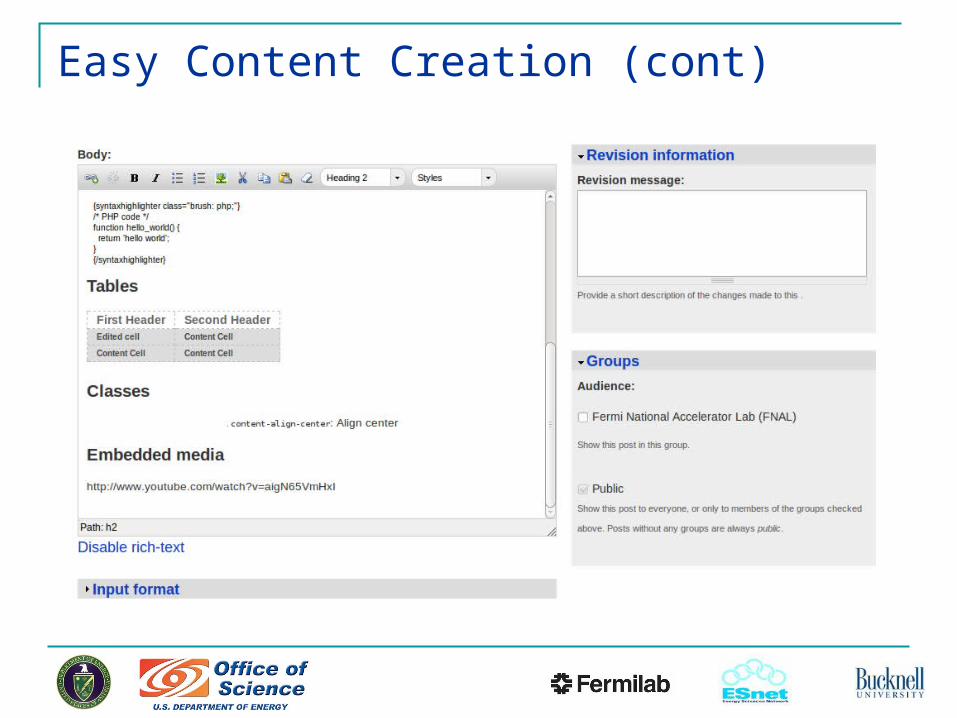
Easy Content Creation (cont)
347/1/11
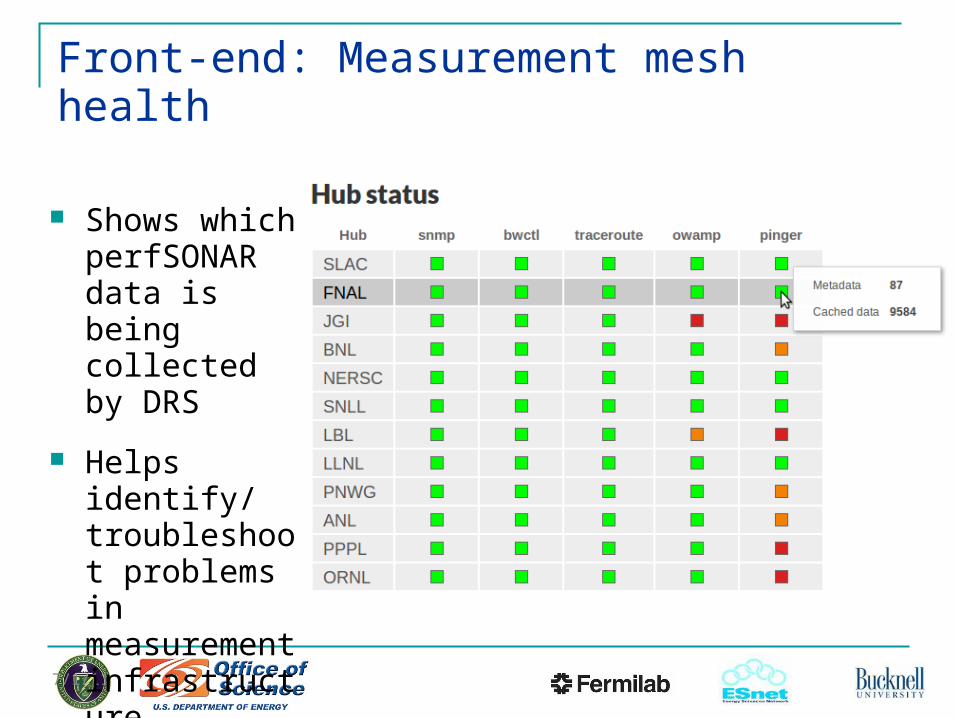
Front-end: Measurement mesh health
Shows which perfSONAR data is being collected by DRS
Helps identify/ troubleshoot problems in measurement infrastructure
357/1/11
Front-end: End-to-end UI & data visualization
Streamlined UI: Reduce clicking and "knob turning" for common cases (inspired by Google instant).
Provide many views of data: Subway map, geographical map, and end-to-end tables provide several perspectives on path data. Site-centric and measurement health status provide logical views of site status. Chart data magnifying glass feature.
Self-revealing: Tool-tips integrated throughout UI provide users with context for interpreting results.
Highlight critical information: Chart highlighting technology attempts to make finding and isolating abnormal results easy.
36
Dynamic Circuits Monitoring
Real-Time ESnet OSCAR circuits data: .Circuits Utilization is gathered in real-time, without caching
10 min delay for circuits pulling:.Circuits metadata pulled from ESnet topology service every 10 minutes to provide timely updates on active circuits
37
38
User’s content and user’s engagement
397/1/11
Year 3 Plans
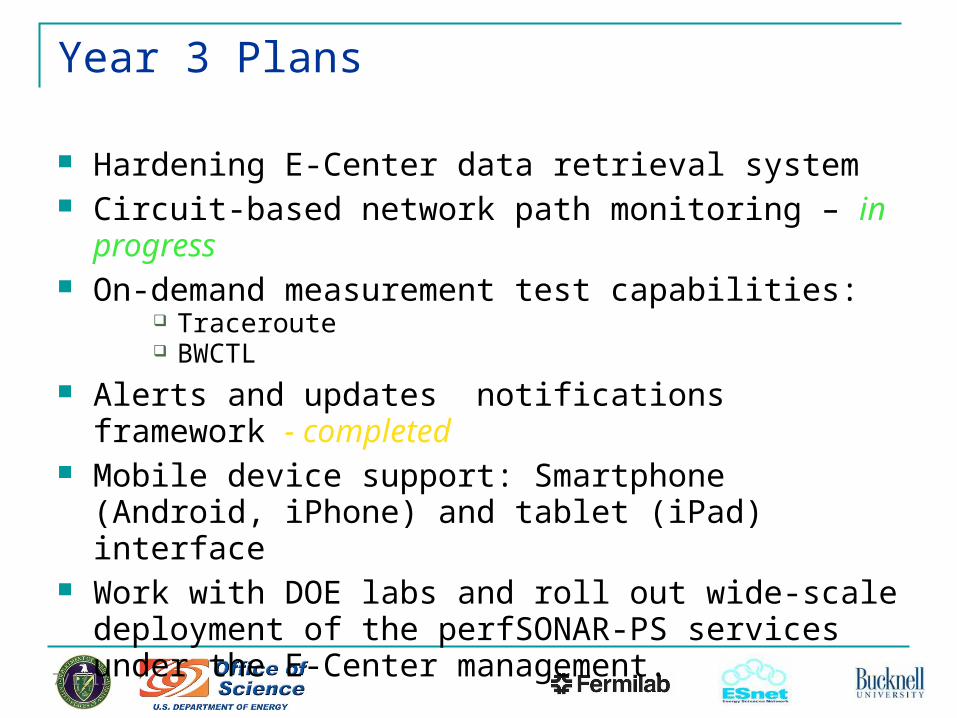
Hardening E-Center data retrieval system Circuit-based network path monitoring – in progress On-demand measurement test capabilities:
Traceroute BWCTL
Alerts and updates notifications framework - completed Mobile device support: Smartphone (Android, iPhone)
and tablet (iPad) interface Work with DOE labs and roll out wide-scale deployment
of the perfSONAR-PS services under the E-Center management.
407/1/11
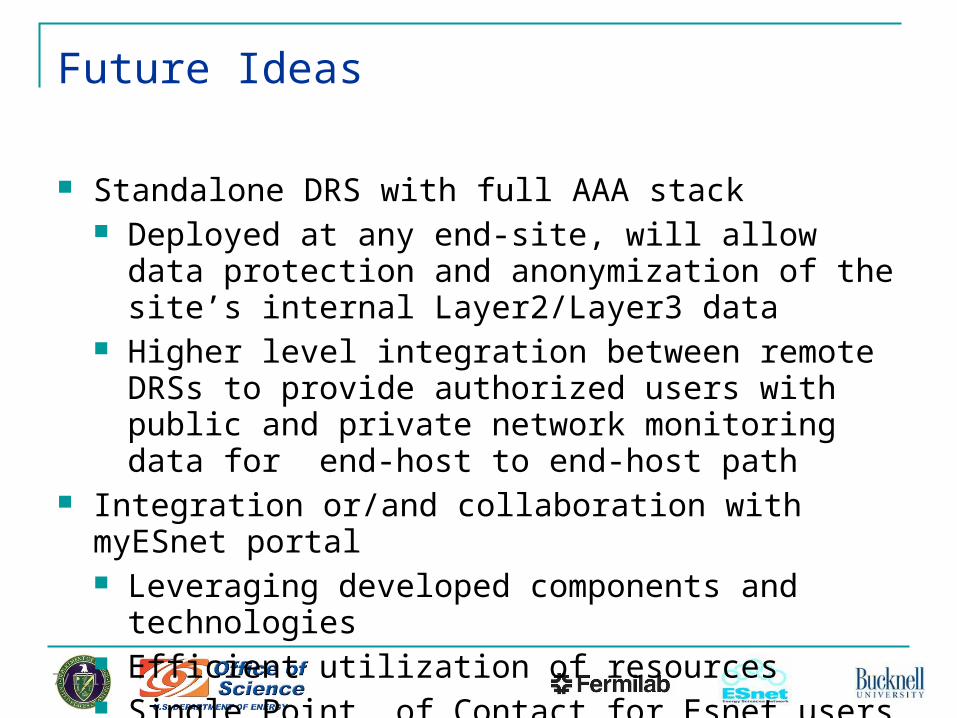
Standalone DRS with full AAA stack Deployed at any end-site, will allow data protection
and anonymization of the site’s internal Layer2/Layer3 data
Higher level integration between remote DRSs to provide authorized users with public and private network monitoring data for end-host to end-host path
Integration or/and collaboration with myESnet portal Leveraging developed components and technologies Efficient utilization of resources Single Point of Contact for Esnet users
Future Ideas
417/1/11
E-Center Project Site, including documents & software repository:
https://cdcvs.fnal.gov/redmine/projects/ecenter
Live Demo: https://ecenter.fnal.gov
Project Information