Embed Size (px)
Citation preview

UsingRegions
TutorialREGIONS
TNTedit™TNTview®
with
TNTmips®
page 2
Interactive Region Analysis
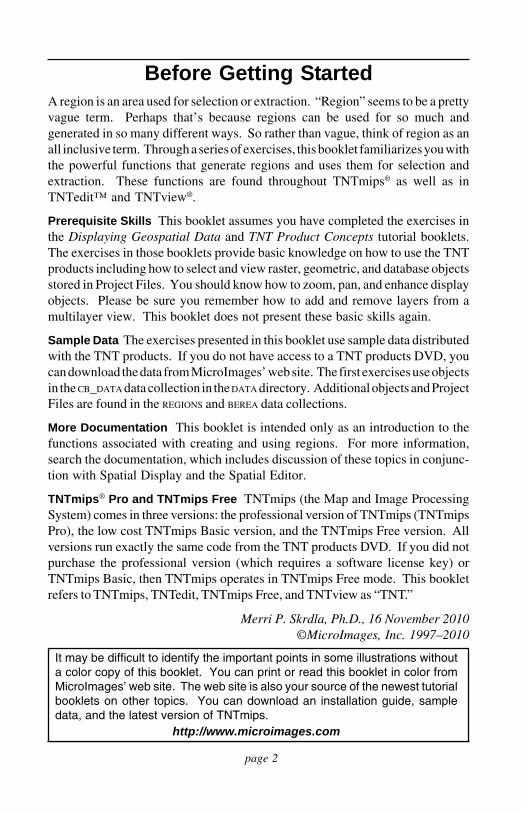
Before Getting StartedA region is an area used for selection or extraction. “Region” seems to be a prettyvague term. Perhaps that’s because regions can be used for so much andgenerated in so many different ways. So rather than vague, think of region as anall inclusive term. Through a series of exercises, this booklet familiarizes you withthe powerful functions that generate regions and uses them for selection andextraction. These functions are found throughout TNTmips® as well as inTNTedit™ and TNTview®.
Prerequisite Skills This booklet assumes you have completed the exercises inthe Displaying Geospatial Data and TNT Product Concepts tutorial booklets.The exercises in those booklets provide basic knowledge on how to use the TNTproducts including how to select and view raster, geometric, and database objectsstored in Project Files. You should know how to zoom, pan, and enhance displayobjects. Please be sure you remember how to add and remove layers from amultilayer view. This booklet does not present these basic skills again.
Sample Data The exercises presented in this booklet use sample data distributedwith the TNT products. If you do not have access to a TNT products DVD, youcan download the data from MicroImages’ web site. The first exercises use objectsin the CB_DATA data collection in the DATA directory. Additional objects and ProjectFiles are found in the REGIONS and BEREA data collections.
More Documentation This booklet is intended only as an introduction to thefunctions associated with creating and using regions. For more information,search the documentation, which includes discussion of these topics in conjunc-tion with Spatial Display and the Spatial Editor.
TNTmips® Pro and TNTmips Free TNTmips (the Map and Image ProcessingSystem) comes in three versions: the professional version of TNTmips (TNTmipsPro), the low cost TNTmips Basic version, and the TNTmips Free version. Allversions run exactly the same code from the TNT products DVD. If you did notpurchase the professional version (which requires a software license key) orTNTmips Basic, then TNTmips operates in TNTmips Free mode. This bookletrefers to TNTmips, TNTedit, TNTmips Free, and TNTview as “TNT.”
It may be difficult to identify the important points in some illustrations withouta color copy of this booklet. You can print or read this booklet in color fromMicroImages’ web site. The web site is also your source of the newest tutorialbooklets on other topics. You can download an installation guide, sampledata, and the latest version of TNTmips.
http://www.microimages.com
Merri P. Skrdla, Ph.D., 16 November 2010©MicroImages, Inc. 1997–2010

page 3
Interactive Region Analysis
Introducing RegionsA region is a simple object used to define what maybe a complex geographic area of interest. There areno separate element types in a region object. Nor doregions have associated databases with attachedattributes. Regions have rudimentary topology inthat alternating nested polygons are inside thenoutside the region. For all their simplicity, however,regions provide very sophisticated and powerfulselection capabilities for analytical tasks that usethe attributes of one object to determine the ele-ments selected in another object. For example, if youhave a contour map of the distance from the surfaceto the groundwater, a soil map with attributes suchas permeability attached to soil type polygons, andpoint locations for hazardous materials storage,you can identify areas most in need of monitoringfor groundwater contamination. You can identifytarget marketing areas from demographic pointdata and political boundaries, such as counties orZIP codes. You can identify areas in greatest needof public health information for a variety of dis-eases. In short, regions let you relate the previouslydisjoint information you have available in a numberof new and innovative ways.
A region is a geographic area, which means regionsare made up of one or more polygons but may alsocontain points or lines. Region generation is embed-ded in TNTmips’ powerful GeoToolbox and rightmouse button operations found in processes through-out TNTmips.
TNTmips supplies additional means for interactiveGIS by providing methods for region combinationto generate new regions. Intersection, union, exclu-sive union, and subtract operations are supportedfor region combinations. Thus you can generate aregion that is more than 200 but less than 400 metersfrom a stream or that has a specified soil type andis within 100 feet of a road.
Vocabulary: A region is ascalable mask generatedfrom selected vector points,lines, or polygons; selectedCAD elements; or raster cellvalues. The elements forregion generation can alsobe drawn directly.
Pages 4–7 introduce theelement selection tools thatare an integral part of regiongeneration. Pages 8–12introduce region generationtechniques that work directlyon selected elements. Pages13–17 describe regiongeneration methods thatrequire a reference raster.Pages 18–19 introduce theExtract Via Region operationand associated databasefeatures that can be appliedto vector layers. Pages 20–23 describe the advancedoptions, region combinations,and adding regions to vectorobjects.
launch TNT
copy the files in theREGIONS data collection, aswell as CB_DLG andCB_ELEV in the CB_DATA
data collection, to yourlocal drive
STEPS
page 4
Interactive Region Analysis
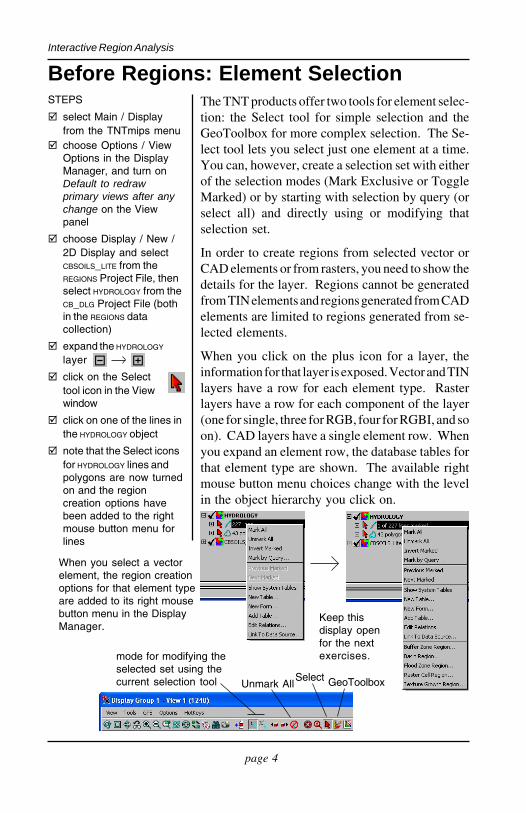
Before Regions: Element SelectionThe TNT products offer two tools for element selec-tion: the Select tool for simple selection and theGeoToolbox for more complex selection. The Se-lect tool lets you select just one element at a time.You can, however, create a selection set with eitherof the selection modes (Mark Exclusive or ToggleMarked) or by starting with selection by query (orselect all) and directly using or modifying thatselection set.
In order to create regions from selected vector orCAD elements or from rasters, you need to show thedetails for the layer. Regions cannot be generatedfrom TIN elements and regions generated from CADelements are limited to regions generated from se-lected elements.
When you click on the plus icon for a layer, theinformation for that layer is exposed. Vector and TINlayers have a row for each element type. Rasterlayers have a row for each component of the layer(one for single, three for RGB, four for RGBI, and soon). CAD layers have a single element row. Whenyou expand an element row, the database tables forthat element type are shown. The available rightmouse button menu choices change with the levelin the object hierarchy you click on.
STEPS
select Main / Displayfrom the TNTmips menu
choose Options / ViewOptions in the DisplayManager, and turn onDefault to redrawprimary views after anychange on the Viewpanel
choose Display / New /2D Display and selectCBSOILS_LITE from theREGIONS Project File, thenselect HYDROLOGY from theCB_DLG Project File (bothin the REGIONS datacollection)
expand the HYDROLOGY
layer
click on the Selecttool icon in the Viewwindow
click on one of the lines inthe HYDROLOGY object
note that the Select iconsfor HYDROLOGY lines andpolygons are now turnedon and the regioncreation options havebeen added to the rightmouse button menu forlines
mode for modifying theselected set using thecurrent selection tool Select GeoToolboxUnmark All
When you select a vectorelement, the region creationoptions for that element typeare added to its right mousebutton menu in the DisplayManager.
Keep thisdisplay openfor the nextexercises.
page 5
Interactive Region Analysis
Element Selection Tools and Modes
If no element types areturned on for marking andyou use a selection tool, allelement types in the activelayer are turned on formarking and the first tablewith a primary key isopened.
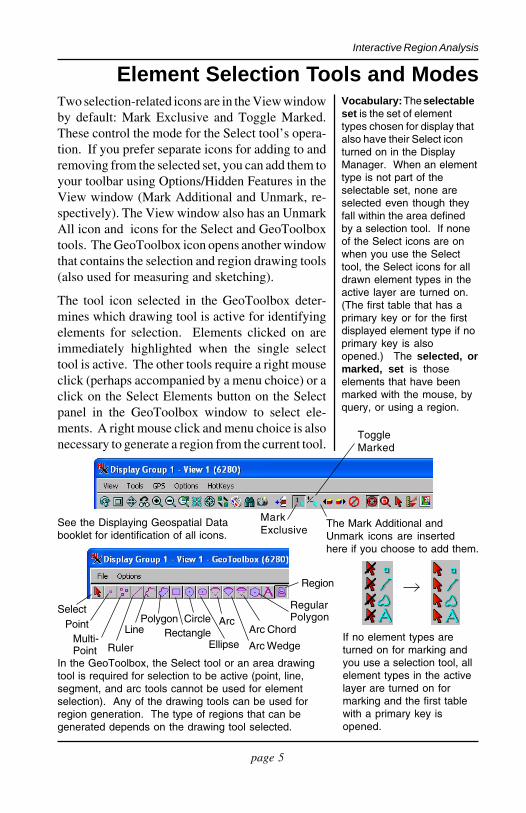
Two selection-related icons are in the View windowby default: Mark Exclusive and Toggle Marked.These control the mode for the Select tool’s opera-tion. If you prefer separate icons for adding to andremoving from the selected set, you can add them toyour toolbar using Options/Hidden Features in theView window (Mark Additional and Unmark, re-spectively). The View window also has an UnmarkAll icon and icons for the Select and GeoToolboxtools. The GeoToolbox icon opens another windowthat contains the selection and region drawing tools(also used for measuring and sketching).
The tool icon selected in the GeoToolbox deter-mines which drawing tool is active for identifyingelements for selection. Elements clicked on areimmediately highlighted when the single selecttool is active. The other tools require a right mouseclick (perhaps accompanied by a menu choice) or aclick on the Select Elements button on the Selectpanel in the GeoToolbox window to select ele-ments. A right mouse click and menu choice is alsonecessary to generate a region from the current tool.
Vocabulary: The selectableset is the set of elementtypes chosen for display thatalso have their Select iconturned on in the DisplayManager. When an elementtype is not part of theselectable set, none areselected even though theyfall within the area definedby a selection tool. If noneof the Select icons are onwhen you use the Selecttool, the Select icons for alldrawn element types in theactive layer are turned on.(The first table that has aprimary key or for the firstdisplayed element type if noprimary key is alsoopened.) The selected, ormarked, set is thoseelements that have beenmarked with the mouse, byquery, or using a region.
PolygonRectangle
SelectCirclePoint
Region
Line
MarkExclusive
ToggleMarked
In the GeoToolbox, the Select tool or an area drawingtool is required for selection to be active (point, line,segment, and arc tools cannot be used for elementselection). Any of the drawing tools can be used forregion generation. The type of regions that can begenerated depends on the drawing tool selected.
Ruler Ellipse
ArcArc Chord
Arc Wedge
RegularPolygon
Multi-Point
The Mark Additional andUnmark icons are insertedhere if you choose to add them.
See the Displaying Geospatial Databooklet for identification of all icons.
page 6
Interactive Region Analysis
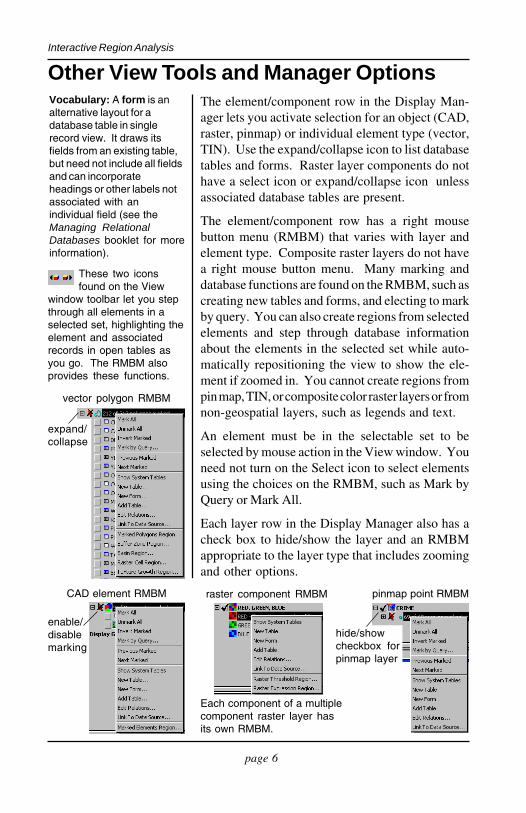
Other View Tools and Manager OptionsThe element/component row in the Display Man-ager lets you activate selection for an object (CAD,raster, pinmap) or individual element type (vector,TIN). Use the expand/collapse icon to list databasetables and forms. Raster layer components do nothave a select icon or expand/collapse icon unlessassociated database tables are present.
The element/component row has a right mousebutton menu (RMBM) that varies with layer andelement type. Composite raster layers do not havea right mouse button menu. Many marking anddatabase functions are found on the RMBM, such ascreating new tables and forms, and electing to markby query. You can also create regions from selectedelements and step through database informationabout the elements in the selected set while auto-matically repositioning the view to show the ele-ment if zoomed in. You cannot create regions frompin map, TIN, or composite color raster layers or fromnon-geospatial layers, such as legends and text.
An element must be in the selectable set to beselected by mouse action in the View window. Youneed not turn on the Select icon to select elementsusing the choices on the RMBM, such as Mark byQuery or Mark All.
Each layer row in the Display Manager also has acheck box to hide/show the layer and an RMBMappropriate to the layer type that includes zoomingand other options.
Vocabulary: A form is analternative layout for adatabase table in singlerecord view. It draws itsfields from an existing table,but need not include all fieldsand can incorporateheadings or other labels notassociated with anindividual field (see theManaging RelationalDatabases booklet for moreinformation).
These two iconsfound on the View
window toolbar let you stepthrough all elements in aselected set, highlighting theelement and associatedrecords in open tables asyou go. The RMBM alsoprovides these functions.
vector polygon RMBM
CAD element RMBM raster component RMBM pinmap point RMBM
expand/collapse
enable/disablemarking
Each component of a multiplecomponent raster layer hasits own RMBM.
hide/showcheckbox forpinmap layer
page 7
Interactive Region Analysis
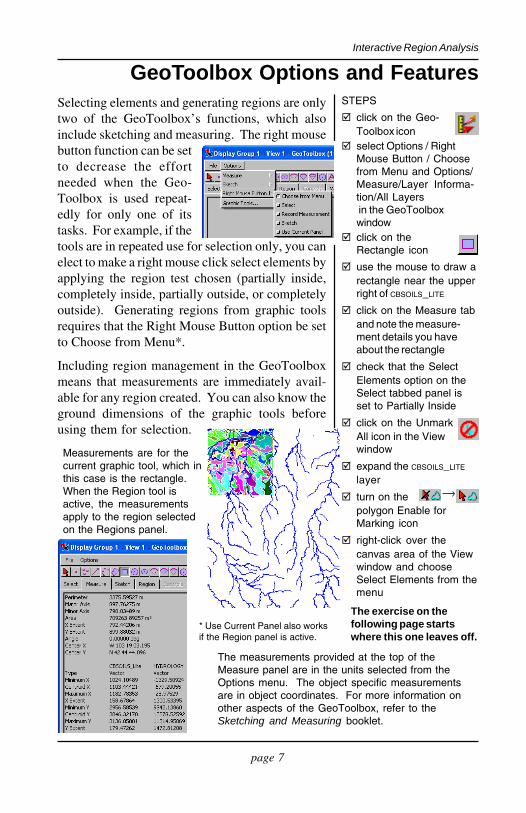
GeoToolbox Options and FeaturesSelecting elements and generating regions are onlytwo of the GeoToolbox’s functions, which alsoinclude sketching and measuring. The right mousebutton function can be setto decrease the effortneeded when the Geo-Toolbox is used repeat-edly for only one of itstasks. For example, if thetools are in repeated use for selection only, you canelect to make a right mouse click select elements byapplying the region test chosen (partially inside,completely inside, partially outside, or completelyoutside). Generating regions from graphic toolsrequires that the Right Mouse Button option be setto Choose from Menu*.
Including region management in the GeoToolboxmeans that measurements are immediately avail-able for any region created. You can also know theground dimensions of the graphic tools beforeusing them for selection.
STEPS
click on the Geo-Toolbox icon
select Options / RightMouse Button / Choosefrom Menu and Options/Measure/Layer Informa-tion/All Layers in the GeoToolboxwindow
click on theRectangle icon
use the mouse to draw arectangle near the upperright of CBSOILS_LITE
click on the Measure taband note the measure-ment details you haveabout the rectangle
check that the SelectElements option on theSelect tabbed panel isset to Partially Inside
click on the UnmarkAll icon in the Viewwindow
expand the CBSOILS_LITE
layer
turn on thepolygon Enable forMarking icon
right-click over thecanvas area of the Viewwindow and chooseSelect Elements from themenu
The measurements provided at the top of theMeasure panel are in the units selected from theOptions menu. The object specific measurementsare in object coordinates. For more information onother aspects of the GeoToolbox, refer to theSketching and Measuring booklet.
The exercise on thefollowing page startswhere this one leaves off.
Measurements are for thecurrent graphic tool, which inthis case is the rectangle.When the Region tool isactive, the measurementsapply to the region selectedon the Regions panel.
* Use Current Panel also worksif the Region panel is active.

page 8
Interactive Region Analysis
click on the ToggleMarked icon in theView window
drag the Rectangletool to the lowerright of CBSOILS_LITE
right-click over thecanvas area of theView window andchoose SelectElements from themenu
choose MarkedPolygons Regionfrom the polygonRMBM
click [OK] in theMarked ElementRegion Generationwindow that opens
click on theRegion icon inthe GeoToolbox tosee the newlycreated regionoutline and on the Regiontab to view the list ofregion management tools
Selected Polygon RegionsSTEPS The point of dwelling on element selection is that
elements must be selected to create regions. Theregion drawing tools let you directly draw the se-
lected elements (a feature thatwill be described later), but forthe most part regions are gen-erated from selected elementsin existing objects. Becauseregions are areas, polygons arethe only element type that can
be converted directly to a region.
You can select polygons to define aregion using any selection method,such as the mouse, a query, or withanother region. Lines between adja-cent selected polygons are dissolvedwhen a region is created. A regiongenerated from selected polygons caninclude spatially separated polygons,each referred to as a subregion. Theycan also contain islands. The MarkedPolygons Region option appears on
the RMBM as soon as at least one polygon isselected.
A region is added to the list on the Region panel ofthe GeoToolbox window as soon as you click on[OK] in any Region Generation window. We will usethis region to select line elements for buffering in thenext exercise.
All region manipulations arehandled from the Regiontabbed panel.
Keep this region openfor use in the nextexercise.
page 9
Interactive Region Analysis
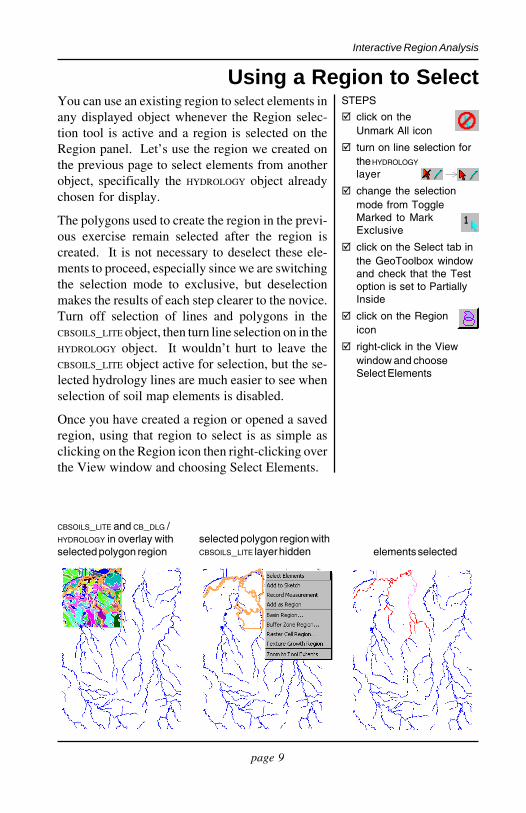
Using a Region to SelectYou can use an existing region to select elements inany displayed object whenever the Region selec-tion tool is active and a region is selected on theRegion panel. Let’s use the region we created onthe previous page to select elements from anotherobject, specifically the HYDROLOGY object alreadychosen for display.
The polygons used to create the region in the previ-ous exercise remain selected after the region iscreated. It is not necessary to deselect these ele-ments to proceed, especially since we are switchingthe selection mode to exclusive, but deselectionmakes the results of each step clearer to the novice.Turn off selection of lines and polygons in theCBSOILS_LITE object, then turn line selection on in theHYDROLOGY object. It wouldn’t hurt to leave theCBSOILS_LITE object active for selection, but the se-lected hydrology lines are much easier to see whenselection of soil map elements is disabled.
Once you have created a region or opened a savedregion, using that region to select is as simple asclicking on the Region icon then right-clicking overthe View window and choosing Select Elements.
click on theUnmark All icon
turn on line selection forthe HYDROLOGY
layer
change the selectionmode from ToggleMarked to MarkExclusive
click on the Select tab inthe GeoToolbox windowand check that the Testoption is set to PartiallyInside
click on the Regionicon
right-click in the Viewwindow and chooseSelect Elements
STEPS
CBSOILS_LITE and CB_DLG /HYDROLOGY in overlay withselected polygon region
selected polygon region withCBSOILS_LITE layer hidden elements selected
page 10
Interactive Region Analysis
Buffer Zone Regions
right-click on theHYDROLOGY lines in theDisplay Manager andselect Buffer ZoneRegion from the dropdown menu
set the buffer (linesetback) distance to 200meters and the LineWidth to 2 pixels
click on [Apply]
click on [OK]
right-click on theHYDROLOGY linesagain,and select Buffer ZoneRegion from the menu
set the buffer distanceto 400 meters thenclick on [Apply]
click on [OK]
click on the Saveicon on theRegion panel
save HYDROLOGY1 asHYDROLOGY400 then high-light HYDROLOGY, clickon Save and name itHYDROLOGY200
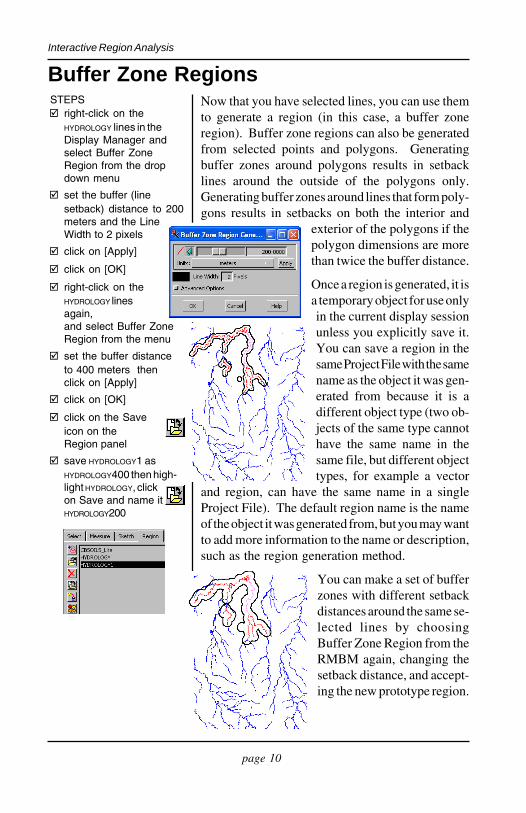
STEPS Now that you have selected lines, you can use themto generate a region (in this case, a buffer zoneregion). Buffer zone regions can also be generatedfrom selected points and polygons. Generatingbuffer zones around polygons results in setbacklines around the outside of the polygons only.Generating buffer zones around lines that form poly-gons results in setbacks on both the interior and
exterior of the polygons if thepolygon dimensions are morethan twice the buffer distance.
Once a region is generated, it isa temporary object for use onlyin the current display sessionunless you explicitly save it.You can save a region in thesame Project File with the samename as the object it was gen-erated from because it is adifferent object type (two ob-jects of the same type cannothave the same name in thesame file, but different objecttypes, for example a vector
and region, can have the same name in a singleProject File). The default region name is the nameof the object it was generated from, but you may wantto add more information to the name or description,such as the region generation method.
You can make a set of bufferzones with different setbackdistances around the same se-lected lines by choosingBuffer Zone Region from theRMBM again, changing thesetback distance, and accept-ing the new prototype region.

page 11
Interactive Region Analysis
The Region PanelWhen you click on the OK button in any of theRegion Generation windows, the Region is auto-matically added to the list on the Region panel andhighlighted. A region is created as a temporaryobject with a default name that is the same as theobject from which region generation was initiated.If you create multiple regions based on the sameobject, the new region names will be appended witha 1, then a 2, and so on. Click on the Edit icon if youwant to change the default name without creating apermanent region object. Click on the Save icon ifyou want to save the region as a permanent object foruse in later display sessions or other processes. Thecurrent region name is offered as the default in theNew Object window when you save. You canchange the name and edit the description if desired.
You can also open previously saved region objectsor any vector object to serve as a region by clickingon the Add icon. When you open a vector object asa region, all polygon boundaries are dissolved andyou are left with the object outline.
You can use the Region tool without first generat-ing any regions in the current display session byclicking on the Add button to select an existingregion or vector object, which will then be drawn inposition if it falls within the area currently shown inthe View window. The drawn region changes asyou change the region selected in the list.
There is also a Delete icon so that you can removeregions you no longer need from the list. Remem-ber that a newly generated region is a temporaryobject; if you haven’t used the Save button, youcannot select this region in a subsequent displaysession. The last icon at the left of the region list isthe Combine icon, which is active when there aretwo or more regions in the list. Region combina-tions are discussed at the end of this booklet.
click on the Add iconon the Region panel
select the CBSOILS_LITE
vector object and click[OK] in the Select Objectswindow
hide the CBSOILS_LITE
vector layer
STEPS
Note: The CBSOILS_LITE vectorobject you added as a regionwas renamed CBSOILS_LITE1 todistinguish it from the regiongenerated from selected soilpolygons in the exercise onpage 8.
highlight each entry in theregion list in turn and notethe changes in the objectsdrawn
when done with thisexercise, chooseDisplay / Close in theDisplay Manager window
page 12
Interactive Region Analysis
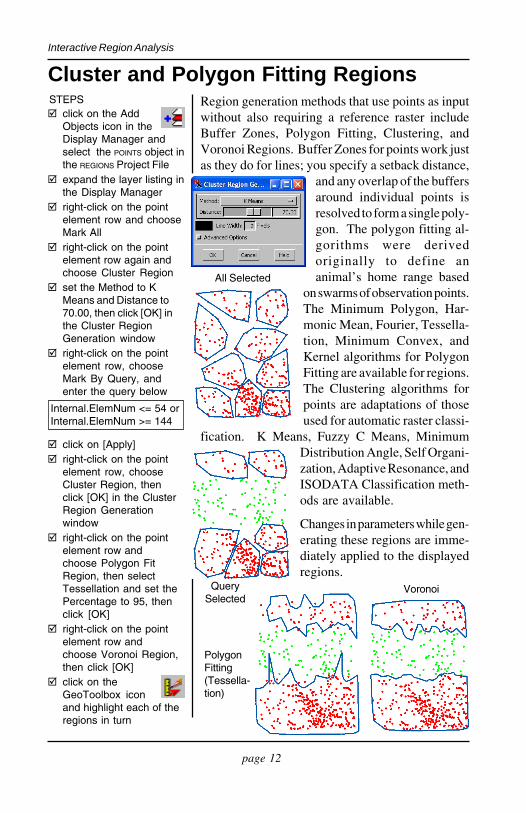
Cluster and Polygon Fitting RegionsRegion generation methods that use points as inputwithout also requiring a reference raster includeBuffer Zones, Polygon Fitting, Clustering, andVoronoi Regions. Buffer Zones for points work justas they do for lines; you specify a setback distance,
and any overlap of the buffersaround individual points isresolved to form a single poly-gon. The polygon fitting al-gorithms were derivedoriginally to define ananimal’s home range based
on swarms of observation points.The Minimum Polygon, Har-monic Mean, Fourier, Tessella-tion, Minimum Convex, andKernel algorithms for PolygonFitting are available for regions.The Clustering algorithms forpoints are adaptations of thoseused for automatic raster classi-
fication. K Means, Fuzzy C Means, MinimumDistribution Angle, Self Organi-zation, Adaptive Resonance, andISODATA Classification meth-ods are available.
Changes in parameters while gen-erating these regions are imme-diately applied to the displayedregions.
click on the AddObjects icon in theDisplay Manager andselect the POINTS object inthe REGIONS Project File
expand the layer listing inthe Display Manager
right-click on the pointelement row and chooseMark All
right-click on the pointelement row again andchoose Cluster Region
set the Method to KMeans and Distance to70.00, then click [OK] inthe Cluster RegionGeneration window
right-click on the pointelement row, chooseMark By Query, andenter the query below
click on [Apply] right-click on the point
element row, chooseCluster Region, thenclick [OK] in the ClusterRegion Generationwindow
right-click on the pointelement row andchoose Polygon FitRegion, then selectTessellation and set thePercentage to 95, thenclick [OK]
right-click on the pointelement row andchoose Voronoi Region,then click [OK]
click on theGeoToolbox iconand highlight each of theregions in turn
STEPS
PolygonFitting(Tessella-tion)
Voronoi
Internal.ElemNum <= 54 orInternal.ElemNum >= 144
All Selected
QuerySelected
page 13
Interactive Region Analysis
Basin Region Generation and Histogram
click on the Newicon, choose 2DDisplay, and select theDEM_16BIT object in theCB_ELEV Project File
click on the Geo-Toolbox icon
click on the Pointdrawing tool
position the cursorapproximately as shownand click the left mousebutton to place the tool
right-click and selectBasin Region from thedropdown menu
click on [Input Raster]and select DEM_16BIT ifnot selected
click on [Apply] click on [OK] (results will
vary with point position) right-click on the row for
the DEM_16BIT layer andselect View Histogramfrom the menu
view the HistogramDisplay then click onthe Update Histo-grams icon in theGeoToolbox window andnote the difference
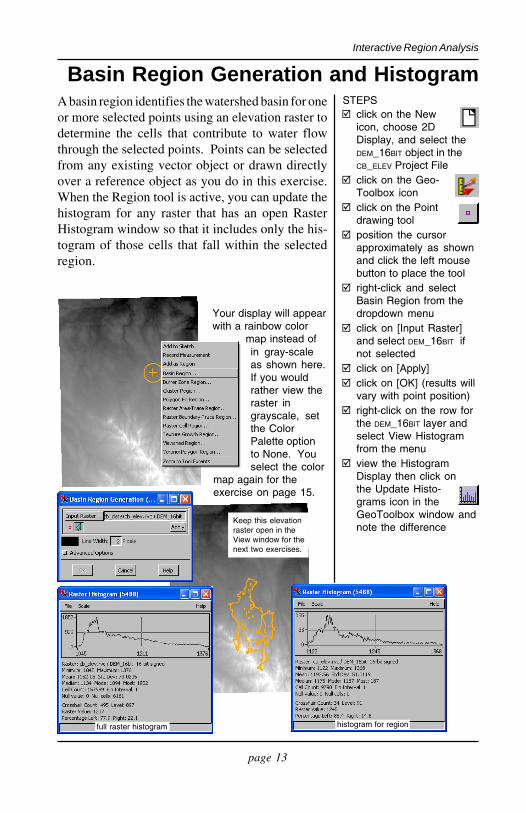
STEPSA basin region identifies the watershed basin for oneor more selected points using an elevation raster todetermine the cells that contribute to water flowthrough the selected points. Points can be selectedfrom any existing vector object or drawn directlyover a reference object as you do in this exercise.When the Region tool is active, you can update thehistogram for any raster that has an open RasterHistogram window so that it includes only the his-togram of those cells that fall within the selectedregion.
Your display will appearwith a rainbow color
map instead ofin gray-scaleas shown here.If you wouldrather view theraster ingrayscale, setthe ColorPalette optionto None. Youselect the color
Keep this elevationraster open in theView window for thenext two exercises.
full raster histogram histogram for region
map again for theexercise on page 15.
page 14
Interactive Region Analysis
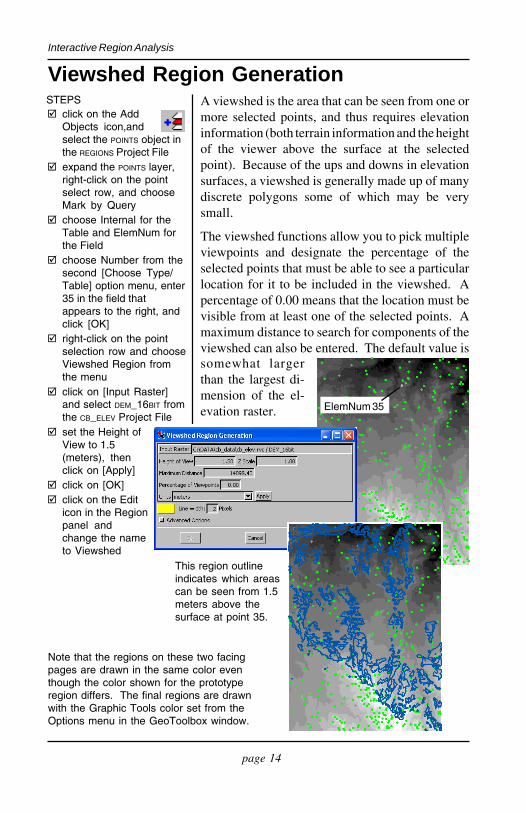
Viewshed Region Generation
click on the AddObjects icon,andselect the POINTS object inthe REGIONS Project File
expand the POINTS layer,right-click on the pointselect row, and chooseMark by Query
choose Internal for theTable and ElemNum forthe Field
choose Number from thesecond [Choose Type/Table] option menu, enter35 in the field thatappears to the right, andclick [OK]
right-click on the pointselection row and chooseViewshed Region fromthe menu
click on [Input Raster]and select DEM_16BIT fromthe CB_ELEV Project File
set the Height ofView to 1.5(meters), thenclick on [Apply]
click on [OK] click on the Edit
icon in the Regionpanel andchange the nameto Viewshed
STEPS A viewshed is the area that can be seen from one ormore selected points, and thus requires elevationinformation (both terrain information and the heightof the viewer above the surface at the selectedpoint). Because of the ups and downs in elevationsurfaces, a viewshed is generally made up of manydiscrete polygons some of which may be verysmall.
The viewshed functions allow you to pick multipleviewpoints and designate the percentage of theselected points that must be able to see a particularlocation for it to be included in the viewshed. Apercentage of 0.00 means that the location must bevisible from at least one of the selected points. Amaximum distance to search for components of theviewshed can also be entered. The default value issomewhat largerthan the largest di-mension of the el-evation raster. ElemNum 35
Note that the regions on these two facingpages are drawn in the same color eventhough the color shown for the prototyperegion differs. The final regions are drawnwith the Graphic Tools color set from theOptions menu in the GeoToolbox window.
This region outlineindicates which areascan be seen from 1.5meters above thesurface at point 35.
page 15
Interactive Region Analysis
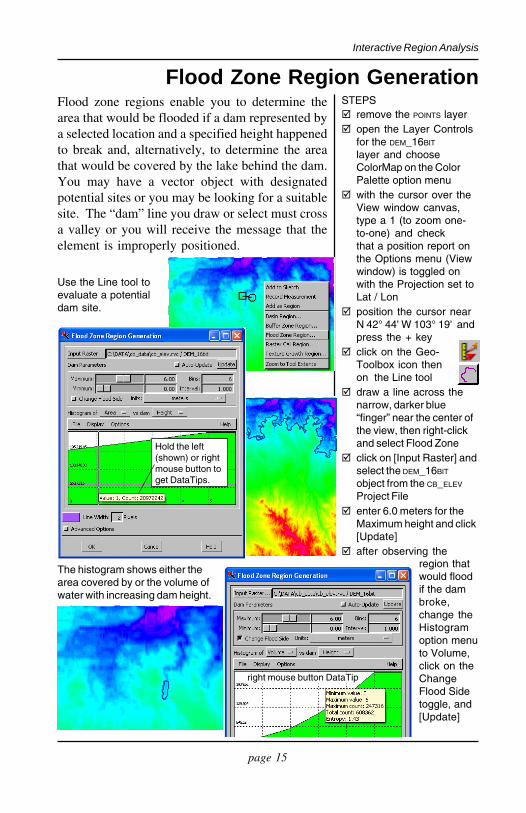
Flood Zone Region GenerationFlood zone regions enable you to determine thearea that would be flooded if a dam represented bya selected location and a specified height happenedto break and, alternatively, to determine the areathat would be covered by the lake behind the dam.You may have a vector object with designatedpotential sites or you may be looking for a suitablesite. The “dam” line you draw or select must crossa valley or you will receive the message that theelement is improperly positioned.
remove the POINTS layer open the Layer Controls
for the DEM_16BIT
layer and chooseColorMap on the ColorPalette option menu
with the cursor over theView window canvas,type a 1 (to zoom one-to-one) and checkthat a position report onthe Options menu (Viewwindow) is toggled onwith the Projection set toLat / Lon
position the cursor nearN 42° 44' W 103° 19' andpress the + key
click on the Geo-Toolbox icon thenon the Line tool
draw a line across thenarrow, darker blue“finger” near the center ofthe view, then right-clickand select Flood Zone
click on [Input Raster] andselect the DEM_16BIT
object from the CB_ELEV
Project File enter 6.0 meters for the
Maximum height and click[Update]
after observing the
STEPS
Use the Line tool toevaluate a potentialdam site.
The histogram shows either thearea covered by or the volume ofwater with increasing dam height.
Hold the left(shown) or rightmouse button toget DataTips.
region thatwould floodif the dambroke,change theHistogramoption menuto Volume,click on theChangeFlood Sidetoggle, and[Update]
right mouse button DataTip
page 16
Interactive Region Analysis
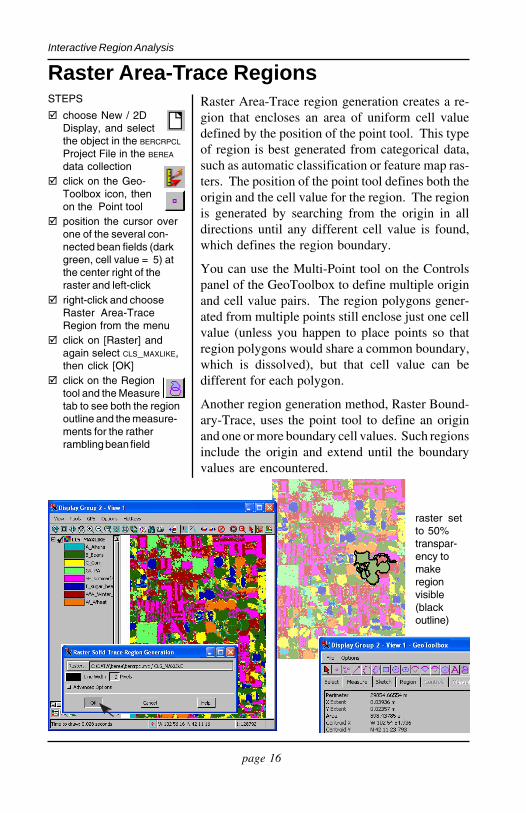
Raster Area-Trace RegionsSTEPS
choose New / 2DDisplay, and selectthe object in the BERCRPCL
Project File in the BEREA
data collection click on the Geo-
Toolbox icon, thenon the Point tool
position the cursor overone of the several con-nected bean fields (darkgreen, cell value = 5) atthe center right of theraster and left-click
right-click and chooseRaster Area-TraceRegion from the menu
click on [Raster] andagain select CLS_MAXLIKE,then click [OK]
click on the Regiontool and the Measuretab to see both the regionoutline and the measure-ments for the ratherrambling bean field
raster setto 50%transpar-ency tomakeregionvisible(blackoutline)
Raster Area-Trace region generation creates a re-gion that encloses an area of uniform cell valuedefined by the position of the point tool. This typeof region is best generated from categorical data,such as automatic classification or feature map ras-ters. The position of the point tool defines both theorigin and the cell value for the region. The regionis generated by searching from the origin in alldirections until any different cell value is found,which defines the region boundary.
You can use the Multi-Point tool on the Controlspanel of the GeoToolbox to define multiple originand cell value pairs. The region polygons gener-ated from multiple points still enclose just one cellvalue (unless you happen to place points so thatregion polygons would share a common boundary,which is dissolved), but that cell value can bedifferent for each polygon.
Another region generation method, Raster Bound-ary-Trace, uses the point tool to define an originand one or more boundary cell values. Such regionsinclude the origin and extend until the boundaryvalues are encountered.
page 17
Interactive Region Analysis
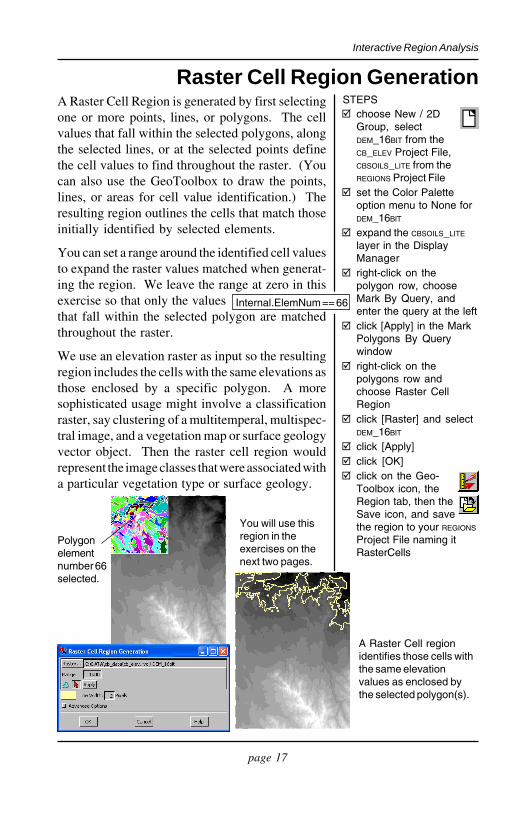
Raster Cell Region Generation
choose New / 2DGroup, selectDEM_16BIT from theCB_ELEV Project File,CBSOILS_LITE from theREGIONS Project File
set the Color Paletteoption menu to None forDEM_16BIT
expand the CBSOILS_LITE
layer in the DisplayManager
right-click on thepolygon row, chooseMark By Query, andenter the query at the left
click [Apply] in the MarkPolygons By Querywindow
right-click on thepolygons row andchoose Raster CellRegion
click [Raster] and selectDEM_16BIT
click [Apply] click [OK] click on the Geo-
Toolbox icon, theRegion tab, then theSave icon, and savethe region to your REGIONS
Project File naming itRasterCells
STEPSA Raster Cell Region is generated by first selectingone or more points, lines, or polygons. The cellvalues that fall within the selected polygons, alongthe selected lines, or at the selected points definethe cell values to find throughout the raster. (Youcan also use the GeoToolbox to draw the points,lines, or areas for cell value identification.) Theresulting region outlines the cells that match thoseinitially identified by selected elements.
You can set a range around the identified cell valuesto expand the raster values matched when generat-ing the region. We leave the range at zero in thisexercise so that only the valuesthat fall within the selected polygon are matchedthroughout the raster.
We use an elevation raster as input so the resultingregion includes the cells with the same elevations asthose enclosed by a specific polygon. A moresophisticated usage might involve a classificationraster, say clustering of a multitemperal, multispec-tral image, and a vegetation map or surface geologyvector object. Then the raster cell region wouldrepresent the image classes that were associated witha particular vegetation type or surface geology.
Internal.ElemNum == 66
Polygonelementnumber 66selected.
You will use thisregion in theexercises on thenext two pages.
A Raster Cell regionidentifies those cells withthe same elevationvalues as enclosed bythe selected polygon(s).
page 18
Interactive Region Analysis
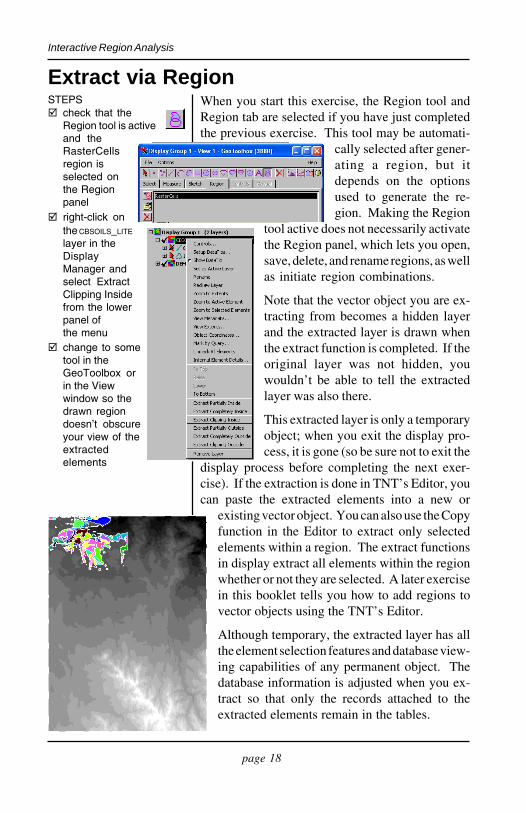
Extract via Region
check that theRegion tool is activeand theRasterCellsregion isselected onthe Regionpanel
right-click on
STEPS When you start this exercise, the Region tool andRegion tab are selected if you have just completedthe previous exercise. This tool may be automati-
cally selected after gener-ating a region, but itdepends on the optionsused to generate the re-gion. Making the Region
tool active does not necessarily activatethe Region panel, which lets you open,save, delete, and rename regions, as wellas initiate region combinations.
Note that the vector object you are ex-tracting from becomes a hidden layerand the extracted layer is drawn whenthe extract function is completed. If theoriginal layer was not hidden, youwouldn’t be able to tell the extractedlayer was also there.
This extracted layer is only a temporaryobject; when you exit the display pro-cess, it is gone (so be sure not to exit the
display process before completing the next exer-cise). If the extraction is done in TNT’s Editor, youcan paste the extracted elements into a new or
existing vector object. You can also use the Copyfunction in the Editor to extract only selectedelements within a region. The extract functionsin display extract all elements within the regionwhether or not they are selected. A later exercisein this booklet tells you how to add regions tovector objects using the TNT’s Editor.
Although temporary, the extracted layer has allthe element selection features and database view-ing capabilities of any permanent object. Thedatabase information is adjusted when you ex-tract so that only the records attached to theextracted elements remain in the tables.
the CBSOILS_LITE
layer in theDisplayManager andselect ExtractClipping Insidefrom the lowerpanel ofthe menu
change to sometool in theGeoToolbox orin the Viewwindow so thedrawn regiondoesn’t obscureyour view of theextractedelements

page 19
Interactive Region Analysis
New Tables from Extracted Elements
expand the extractedvector layer and itspolygon row
open the DESCRIPTNtable and switch totabular view
choose Save As from theTable menu
check that Format is setto RVC, Records to AllRecords, and Values isset to Data, then click[OK]
select CBSOILS_LITE as thedestination vector object,click [OK] in the Selectdatabase object window,set the element type toPolygon, and click [OK]again in the Edit Nameand Description window
note the new table at theend of the CBSOILS_LITE
(not the extractedversion) polygon list
close this group anddelete the region
STEPSThe extracted layer is identified by DataTip and inthe Layer Controls window as located in a file namedTEMP0001.TMP (or a higher number if you have othertemporary files on your machine) with the originalobject name. You will note that all the displaycontrols are available for this temporary layer. Youcan click on the Layer Controls icon and change thedisplay parameters. You can expand the layer in theDisplay Manager and view all the associated data-base information, which is the same as for the origi-nal object except only those records related to theelements in the extracted object are present. You canuse the Save As feature found in tabular databaseviewing to create a new and permanent table thatwill continue to identify the attributes of the ele-ments that were part of this extraction. The elementsthemselves can also be identified using either theselection tools or by selecting from database records.
The tables associated with extracted elements, orany tables, can be saved in TNTmips’ internal format(RVC), in dBASE III/IV format, in a predefinedODBC format, as comma separated values, as tabdelimited text, as a CAD snapshot, or as HTML. Youneed not save all records in a table; you can save onlythose records attached to the active element or allmarked elements or only records that are selected inthe tabular view. You also have the option ofwhether or not to save any fields hidden at the timeand whether to save with the units as currentlyshown or as stored.
The number of records in theextracted and saved databasetable is fewer than in the original.
page 20
Interactive Region Analysis
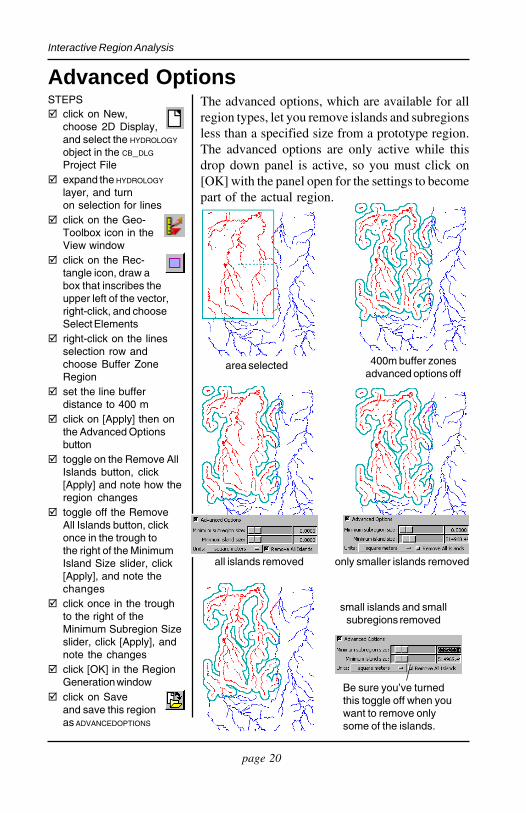
Advanced Options
click on New,choose 2D Display,and select the HYDROLOGY
object in the CB_DLG
Project File expand the HYDROLOGY
layer, and turnon selection for lines
click on the Geo-Toolbox icon in theView window
click on the Rec-tangle icon, draw abox that inscribes theupper left of the vector,right-click, and chooseSelect Elements
right-click on the linesselection row andchoose Buffer ZoneRegion
set the line bufferdistance to 400 m
click on [Apply] then onthe Advanced Optionsbutton
toggle on the Remove AllIslands button, click[Apply] and note how theregion changes
toggle off the RemoveAll Islands button, clickonce in the trough tothe right of the MinimumIsland Size slider, click[Apply], and note thechanges
click once in the troughto the right of theMinimum Subregion Sizeslider, click [Apply], andnote the changes
click [OK] in the RegionGeneration window
click on Saveand save this regionas ADVANCEDOPTIONS
STEPS The advanced options, which are available for allregion types, let you remove islands and subregionsless than a specified size from a prototype region.The advanced options are only active while thisdrop down panel is active, so you must click on[OK] with the panel open for the settings to becomepart of the actual region.
400m buffer zonesadvanced options off
area selected
all islands removed only smaller islands removed
small islands and smallsubregions removed
Be sure you’ve turnedthis toggle off when youwant to remove onlysome of the islands.
page 21
Interactive Region Analysis
STEPS
click on New, choose 2DDisplay, and select theCBSOILS_LITE object fromthe REGIONS Project File
expand the layer in theDisplay Manager andturn on polygon selection
open the CLASS table click on the Show All
Records icon in tabularview, scroll and click inthe Select Record boxfor GoB and JmCpolygons
click onthe Ex-clusive icon intabular view
right-click on the poly-gon selection row,choose MarkedPolygons Region, andclick OK
click on the Geo-Toolbox icon, thenon the Region tab,and on the Add icon
select the hydrology200region you made on p. 10
click on the Combineicon on the Regionpanel
with the operation set toIntersect and HYDROL-OGY200 as the Sourceand CBSOILS_LITE (selectedpolygons) as theOperator, click on[Combine]
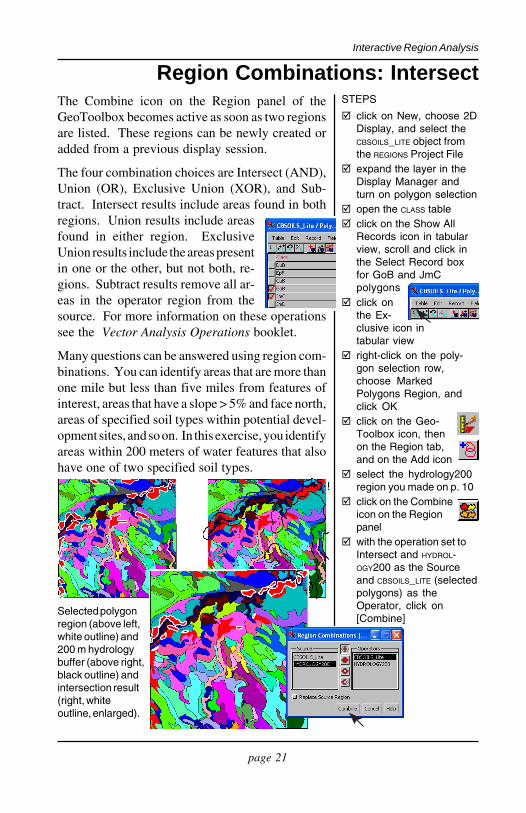
Region Combinations: IntersectThe Combine icon on the Region panel of theGeoToolbox becomes active as soon as two regionsare listed. These regions can be newly created oradded from a previous display session.
The four combination choices are Intersect (AND),Union (OR), Exclusive Union (XOR), and Sub-tract. Intersect results include areas found in bothregions. Union results include areasfound in either region. ExclusiveUnion results include the areas presentin one or the other, but not both, re-gions. Subtract results remove all ar-eas in the operator region from thesource. For more information on these operationssee the Vector Analysis Operations booklet.
Many questions can be answered using region com-binations. You can identify areas that are more thanone mile but less than five miles from features ofinterest, areas that have a slope > 5% and face north,areas of specified soil types within potential devel-opment sites, and so on. In this exercise, you identifyareas within 200 meters of water features that alsohave one of two specified soil types.
Selected polygonregion (above left,white outline) and200 m hydrologybuffer (above right,black outline) andintersection result(right, whiteoutline, enlarged).
page 22
Interactive Region Analysis
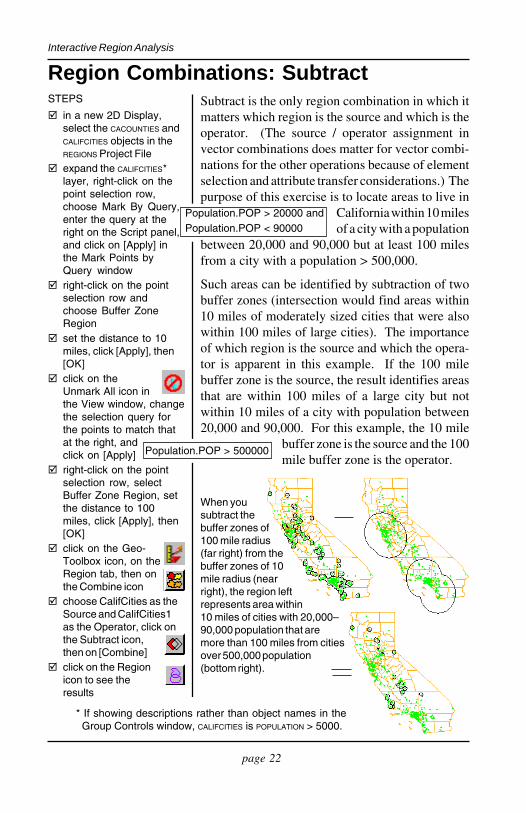
Region Combinations: SubtractSubtract is the only region combination in which itmatters which region is the source and which is theoperator. (The source / operator assignment invector combinations does matter for vector combi-nations for the other operations because of elementselection and attribute transfer considerations.) Thepurpose of this exercise is to locate areas to live in
California within 10 milesof a city with a population
between 20,000 and 90,000 but at least 100 milesfrom a city with a population > 500,000.
Such areas can be identified by subtraction of twobuffer zones (intersection would find areas within10 miles of moderately sized cities that were alsowithin 100 miles of large cities). The importanceof which region is the source and which the opera-tor is apparent in this example. If the 100 milebuffer zone is the source, the result identifies areasthat are within 100 miles of a large city but notwithin 10 miles of a city with population between20,000 and 90,000. For this example, the 10 mile
buffer zone is the source and the 100mile buffer zone is the operator.
STEPS
in a new 2D Display,select the CACOUNTIES andCALIFCITIES objects in theREGIONS Project File
expand the CALIFCITIES
layer, right-click on thepoint selection row,choose Mark By Query,enter the query at theright on the Script panel,and click on [Apply] inthe Mark Points byQuery window
right-click on the pointselection row andchoose Buffer ZoneRegion
set the distance to 10miles, click [Apply], then[OK]
click on theUnmark All icon inthe View window, changethe selection query forthe points to match thatat the right, andclick on [Apply]
right-click on the pointselection row, selectBuffer Zone Region, setthe distance to 100miles, click [Apply], then[OK]
click on the Geo-Toolbox icon, on theRegion tab, then onthe Combine icon
choose CalifCities as theSource and CalifCities1as the Operator, click onthe Subtract icon,then on [Combine]
click on the Regionicon to see theresults
Population.POP > 20000 andPopulation.POP < 90000
Population.POP > 500000
When yousubtract thebuffer zones of100 mile radius(far right) from thebuffer zones of 10mile radius (nearright), the region leftrepresents area within10 miles of cities with 20,000–90,000 population that aremore than 100 miles from citiesover 500,000 population(bottom right).
*
* If showing descriptions rather than object names in theGroup Controls window, CALIFCITIES is POPULATION > 5000.
page 23
Interactive Region Analysis
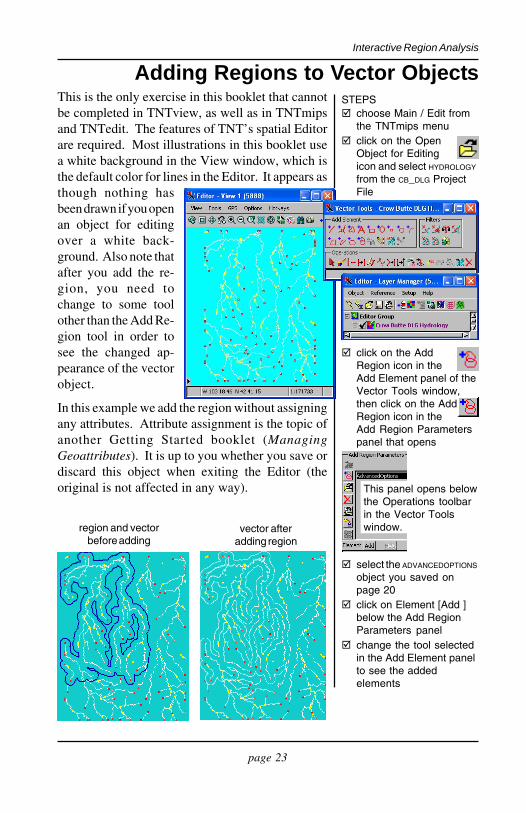
Adding Regions to Vector ObjectsThis is the only exercise in this booklet that cannotbe completed in TNTview, as well as in TNTmipsand TNTedit. The features of TNT’s spatial Editorare required. Most illustrations in this booklet usea white background in the View window, which isthe default color for lines in the Editor. It appears asthough nothing hasbeen drawn if you openan object for editingover a white back-ground. Also note thatafter you add the re-gion, you need tochange to some toolother than the Add Re-gion tool in order tosee the changed ap-pearance of the vectorobject.
In this example we add the region without assigningany attributes. Attribute assignment is the topic ofanother Getting Started booklet (ManagingGeoattributes). It is up to you whether you save ordiscard this object when exiting the Editor (theoriginal is not affected in any way).
choose Main / Edit fromthe TNTmips menu
click on the OpenObject for Editingicon and select HYDROLOGY
from the CB_DLG ProjectFile
click on the AddRegion icon in theAdd Element panel of theVector Tools window,then click on the AddRegion icon in theAdd Region Parameterspanel that opens
select the ADVANCEDOPTIONS
object you saved onpage 20
click on Element [Add ]below the Add RegionParameters panel
change the tool selectedin the Add Element panelto see the addedelements
STEPS
vector afteradding region
region and vectorbefore adding
This panel opens belowthe Operations toolbarin the Vector Toolswindow.
Advanced Software for Geospatial Analysis
MicroImages, Inc.
REGIONS
Voice: (402)477-9554www.microimages.com
Indexadding regions to vectors ...................... 2 3advanced options .................................... 20basin regions ........................................... 1 3buffer zone regions ......................... 10, 22clear selectable set .................................... 5cluster regions ......................................... 12database form ............................................ 6database tables for extracted
elements .............................................. 1 9deselect all ................................................. 5element selection ............................. 4–7, 8extract using region ............................... 1 8flood zone regions ................................. 15GeoToolbox ..................................... 4, 5, 7histogram for region .............................. 13intersecting regions ................................ 21polygon fitting regions .......................... 12prototype color ....................................... 14
raster cells region .................................... 17raster histograms ..................................... 1 3raster solid-trace regions ........................ 17raster transparency ................................. 16rectangle tool ............................................ 7region combinations ....................... 21, 22region definition .................................. 2, 3Region panel, GeoToolbox ................... 1 1removing islands .................................... 20removing subregions ............................. 20select by query ........................................ 1 2selectable set .............................................. 5selected polygon regions ......................... 8selected set ................................................. 5selecting with region ................................ 9subtracting regions ................................. 22update histogram .................................... 13viewshed regions .................................... 14
MicroImages, Inc. publishes a complete line of professional software for advanced geospatial datavisualization, analysis, and publishing. Contact us or visit our web site for detailed productinformation.
TNTmips Pro TNTmips is a professional system for fully integrated GIS, image analysis,CAD, TIN, desktop cartography, and geospatial database management.
TNTedit TNTedit provides interactive tools to create, georeference, and edit vector, image,CAD, TIN, and relational database project materials in a wide variety of formats.
TNTview TNTview has the same powerful display features as TNTmips and is perfect forthose who do not need the technical processing and preparation features of TNTmips.
TNTatlas TNTatlas lets you publish and distribute your spatial project materials on CD-ROM at low cost. TNTatlas CDs can be used on any popular computing platform.
TNTserver TNTserver lets you publish TNTatlases on the Internet or on your intranet.Navigate geodata atlases with your web browser and TNTmap, which is WMS compliant.
TNTmips Basic TNTmips Basic is a very low cost version of TNTmips for students andprofessionals with small projects with large object size limits than TNTmips Free.
TNTmips Free TNTmips Free is a free version of TNTmips for students and professionalswith small projects. You can download TNTmips Free from MicroImages’ web site.