Embed Size (px)
Citation preview
ELECTRICITY ACCESS PROGRESS IN GHANAClement G. Abavana
Noxie Consult, Ghana

2
Nox
ie C
onsu
lt
ELECTRICITY ACCESS IN GHANA
The Present Situation The process of getting to where we are The future

3
Nox
ie C
onsu
lt
ELECTRICITY ACCESS SITUATION NOW
Ghana has presently (2010) an electrification access rate of over 72%.
The government has set an ambitious target of universal access of 100% by 2020.

4
Nox
ie C
onsu
lt
DEFINITIONS AS USED IN PRESENTATION
There are two definitions of electrification: a. Electrification (penetration) rate: percentage
of Communities connected with electricity, either grid or off-grid.
b. Access rate: percentage of Households connected with electricity.
5
Nox
ie C
onsu
lt
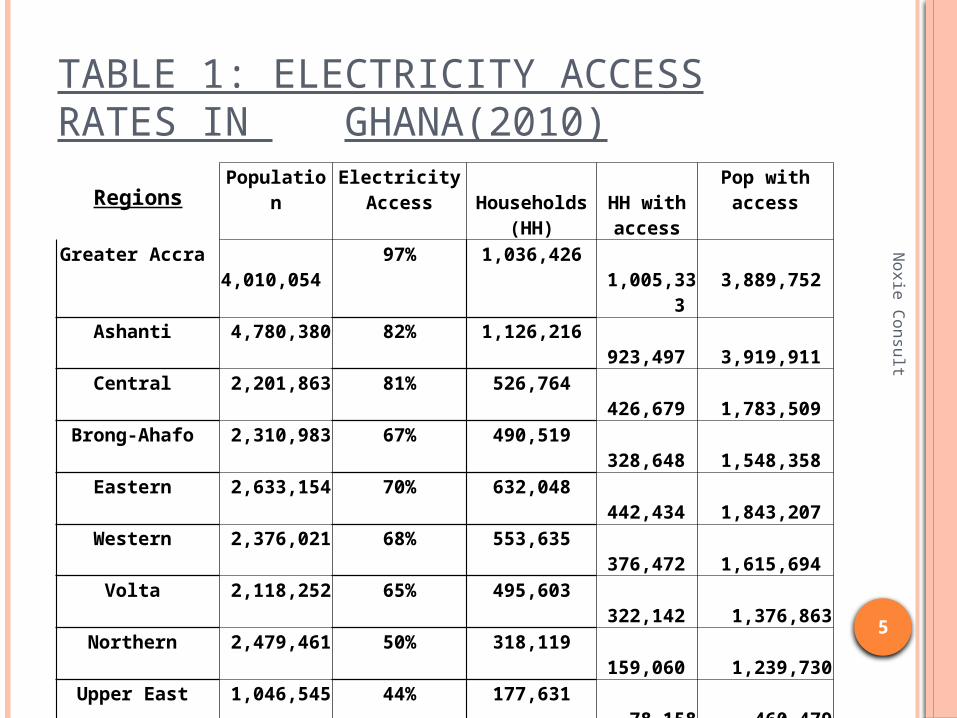
TABLE 1: ELECTRICITY ACCESS RATES IN GHANA(2010)
Regions Population Electricity Access Households (HH)
HH with access
Pop with access
Greater Accra 4,010,054 97% 1,036,426 1,005,333 3,889,752
Ashanti 4,780,380 82% 1,126,216 923,497 3,919,911
Central 2,201,863 81% 526,764 426,679 1,783,509
Brong-Ahafo 2,310,983 67% 490,519 328,648 1,548,358
Eastern 2,633,154 70% 632,048 442,434 1,843,207
Western 2,376,021 68% 553,635 376,472 1,615,694
Volta 2,118,252 65% 495,603 322,142 1,376,863
Northern 2,479,461 50% 318,119 159,060 1,239,730
Upper East 1,046,545 44% 177,631 78,158 460,479
Upper West 702,110 40% 110,175 44,070 280,844
Ghana Overall 24,658,823 72% 5,467,136 3,936,338 17,754,352

6
Nox
ie C
onsu
lt
THE PROCESS
National Electrification Scheme (NES) - 1989 National Electrification Programme (NEP)
District Capitals Electrification Project Self Help Electrification Programme (SHEP)

7
Nox
ie C
onsu
lt
NATIONAL ELECTRIFICATION SCHEME OBJECTIVES To connect all communities with a population above 500 in
1989, to the national grid: there were 4,221 communities in Ghana that had a population higher than 500 of which only 478 had access to electricity supply;
To construct new and reinforce existing generation and transmission facilities to support and sustain the scheme;
To promote the productive uses of electricity in order to improve upon people's standard of living and accelerate poverty alleviation;
To encourage the development and establishment of local indigenous industries to support and sustain the scheme thereby creating employment and increasing productivity;
To enhance activities in other sectors of the economy such as agriculture, health, education and tourism; and
To increase the overall socio-economic development of the country.

8
Nox
ie C
onsu
lt
NATIONAL ELECTRIFICATION SCHEME
National Electrification Planning Study (NEPS) was done by Acres International Ltd of Canada with Canadian Government grant in 1988/89;
Master Plan outlined six 5-year implementation phases (1990 – 2020) - 30 years;
In 1989 Government of Ghana endorsed the NES with overall goal of universal access by 2020.

9
Nox
ie C
onsu
lt
NATIONAL ELECTRIFICATION PROGRAMME
At the start of the NEP the electrification rate was 28%
Phase I District Capitals Electrification Project
Extension of national grid to all 110 political Districts capitals (at that time) and towns and villages en-route to the District capitals. 46 out of the 110 district capitals were connected at the start of the NEP.
Phase II and onwards Electrification of communities based on the
most economically viable projects.
10
Nox
ie C
onsu
lt
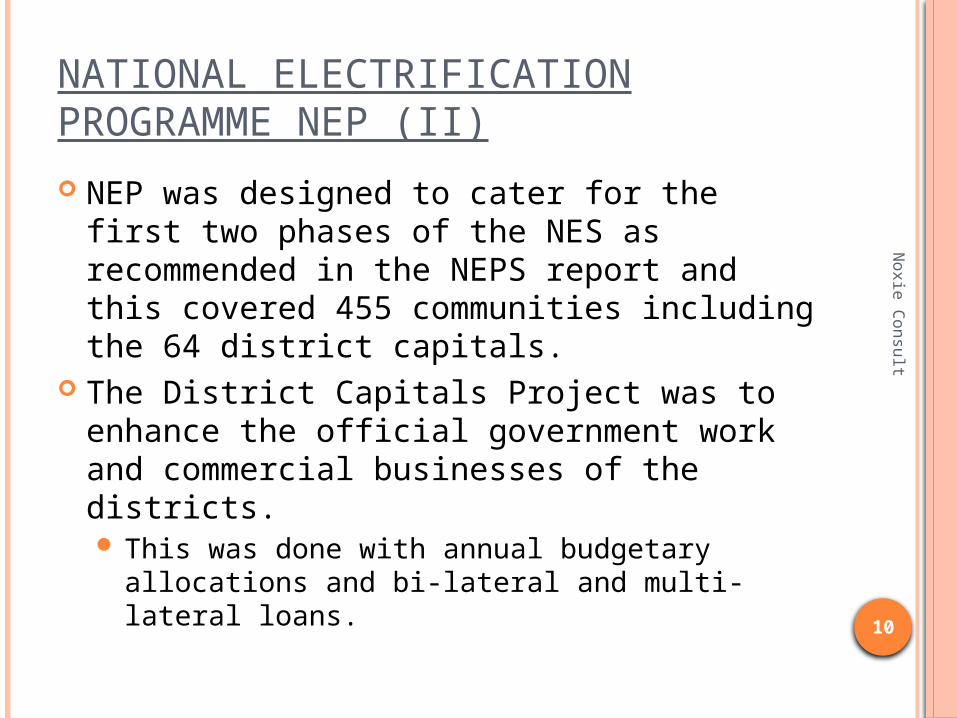
NATIONAL ELECTRIFICATION PROGRAMME NEP (II)
NEP was designed to cater for the first two phases of the NES as recommended in the NEPS report and this covered 455 communities including the 64 district capitals.
The District Capitals Project was to enhance the official government work and commercial businesses of the districts. This was done with annual budgetary allocations
and bi-lateral and multi-lateral loans.

11
Nox
ie C
onsu
lt
MAP OF GHANA

12
Nox
ie C
onsu
lt
SELF HELP ELECTRIFICATION PROGRAMME (SHEP)
This is a Government of Ghana (GOG) complementary programme to speed up the process by electrifying towns and villages which were prepared to help themselves. i.e. Contribute to the cost of electrification of their communities.
With the active implementation of SHEP the Access rate had rose to 54% by 2005.

13
Nox
ie C
onsu
lt
QUALIFYING CRITERIA FOR SHEP
Community should be located within 20km of an existing 33kV or 11kV source of supply;
Community must be willing and able to procure and erect the required number of standard LV poles needed for the LV distribution network within the community;
At least 33% of houses in community must be wired and ready for service.

14
Nox
ie C
onsu
lt
INSTITUTIONAL ARRANGEMENT
The two pillars of the NES: NEP SHEP
Both implemented by Ministry of Energy

15
Nox
ie C
onsu
lt
IMPLEMENTATION OF RURAL ELECTRIFICATION
National Electrification Fund (NEF), Dedicated donor assistance
Material Supplies
Procures &delivers to site
Contractors &Consultants
Hires
Rural ElectrificationSite
Install networks on site
Ministry of Energy
Administers
District Assemblies
Site selectionunder SHEP
Communicates selected site
ECG-VRA-NED
Maintains system
after completion

16
Nox
ie C
onsu
lt
ANOTHER MODEL EXAMINED BUT NOT ADOPTED
Set up a Rural Electrification Agency (REA) and a Rural Electrification Fund (REF) outside the Ministry of Energy as an autonomous body to implement rural electrification.
Not adopted because of the creation of another level of bureaucracy.

17
Nox
ie C
onsu
lt
COSTS AND FINANCING MECHANISMS
NEP connected the last batch of 23 district capitals and over 400 other towns for US$185 million. (1996 – 1998)

18
Nox
ie C
onsu
lt
NEP
Table 2: Number of Electrified District Capitals and Other Towns (1996 - 1998)
Region District Capitals Other Towns Total
Ashanti - 15 15
Central 2 64 66
Eastern - 42 42
Volta 2 54 56
Western 3 93 96
Upper West 3 10 13
Brong Ahafo - - -
Northern & Upper East
13 129 142
Total 23 407 430

19
Nox
ie C
onsu
lt
FUNDINGTable 3: Number of Electrified District Capitals and Other Towns
Component of NEP Funding Agency
Amount(US$
Millions)
Total # of Towns including District capitals
Completion Date
Brong Ahafo, Northern and Upper East (VRA-NED)
World Bank 35.5 142 1998
Central Rural and Upper West Regions
Danish Govt. (DANIDA
24.35 55 1999
Volta Region (Rural) Nordic Dev. Fund (NDF)
6.88 35 1999
Eastern, Ashanti (Rural & Urban), Greater Accra, Volta (Urban), Central, Western (Urban) ECG
World Bank 42.5 67 2000
Western Region (Rural) Dutch Govt. (ORET)
31.0 96 2000
Sub-Total 140.23 395

20
Nox
ie C
onsu
ltTABLE 4. OTHER BI-LATERAL FUNDED
ELECTRIFICATION PROJECTS
Area/District/Region
Funding Agency
Amount US$(millions)
Total # of Towns including District capitals
Completion Date
Bekwai, Kuntenase and other Communities
JICA 7.8 31 1990
Juabase-Bia and Sefwi-Wiaso
GoG 34 1994
Ada-Foah, Sogakope and Adidome and other communities
JICA 17.1 22 1995
Asesewa and Yeji Areas JICA 10.2 34 1999Greater Accra & Volta regions
SIDA 10.77 110 2001
Upper East Spanish Government
10.0 51 2001
Nyinahin and Surrounding Comms
JICAGoG
6.3750,000 Gh
Cedis
24 2003
Volta Lake Resettlement
China EXIM Bank Loan
32.8 144 2003
Amasie West District JICA 2.6 10 2004Western Region EU €10.0 108 2004
21
Nox
ie C
onsu
lt
NATIONAL ELECTRIFICATION LEVY/FUND
Established in 1989 as a levy charged on all classes of customers to serve as seed funds for the National Electrification Fund.

22
Nox
ie C
onsu
lt
ACHIEVEMENT OF THE NES
NES began as scheduled in 1990 At the end of 2004 access rated had reached
54% corresponding to 11 million people (at that time)
In mid- 2005, 3,026 towns and communities (including all district capitals) were electrified. This figure includes towns/villages that were not captured by NEPS.

23
Nox
ie C
onsu
lt
TABLE 5: STATUS OF SHEP PROJECTSProject Phase Years Number of Towns
electrifiedCompleted Projects
SHEP 1 1990-1992 50
SHEP 2 1993-1995 250
SHEP 3 – Phase 1 1996-1998 280
SHEP 3 – Phase 2 1998-2000 494
SHEP 3 – Phase 3 2000-2002 700
SHEP 4 – Phase 1 2002-2004 193
SHEP 4 – Phase 2 2006 226
SHEP4 – Phase 3 2007 229
SHEP4 – Phase 4 2008 269
SHEP 2009 146
Table 5: Status of SHEP projectsSource: MoE December 2011.

24
Nox
ie C
onsu
lt
TURNKEY ELECTRIFICATION PROJECTS (2011 - )
Type/Name of Project No. of Communities
Region Contractor
China Exim Bank funded electrification
419 Volta CWE
US Exim Bank funded electrification project
1,200 Country-wide
Weldy Lamont
China Exim Bank funded electrification
500 Northern Reg
Hunan
New Electrification project for communities
400 Upper West
CWE
NED Bank funded electrification 500 Upper East -Extension of grid to selected rural towns (GEDAP)
250 GEDAP
ECOWAS Bank for Investment and Development (EBID) Electrification Project
106 Brong Ahafo and
Ashanti
-
Eltel Phase II electrification of communities
140 Eastern ELTEL
Total no. of Towns 3,515
Projects Commenced in 2011 but not completed:

25
Nox
ie C
onsu
lt
FINANCING
National Public Funding– Budgetary allocation from the consolidated Fund
Community Contributions (PPP) - SHEP External Donor finance – Loans and grants

26
Nox
ie C
onsu
lt
FUNDING AGENCIES
Govt. budgetary support of about US$9 m/yr over 2001-2004 (Average between 1990-2005; about US$5m/yr)
PS: About US$130million was used for off-shore electrical materials for the SHEP-3 (1,400 communities)
About US$350 million was used for the SHEP-4 (2,500 communities)
Project Funding Agency Type of funding
NEP JICA, DANIDA World Bank, Dutch Government (ORET), SIDA , FINNIDA, NDF, GEF
Grants & soft loans
SHEP Indian Ex-Im Bank US Ex-Im Bank, SIDA, FINNIDA & South African Govt. Chinese Ex-Im Bank
Grants & Soft loans

27
Nox
ie C
onsu
lt
TECHNICAL INNOVATIONS
Shield-Wire Scheme on the 161kV transmission line 30 kV and 20kV system (1989) Additional cost (in 1989): US$300.00/km Cost of an independent 34.5 kV line:
US$20,000.00/km

28
Nox
ie C
onsu
lt
RENEWABLE ENERGY – SOLAR PV
UNDP/GEF/GoG project/Spanish Government (RESPRO) Fee-for-service Un-sustainable
Danida Battery charging stations in Northern Ghana

29
Nox
ie C
onsu
lt
THE FUTURE: POTENTIAL TO INCREASE RENEWABLE ENERGY CONTRIBUTION
National Policy: 10% - RE Volta River Authority (VRA) 10MW solar PV
project (2MW started in Navrongo in the Upper East Region)

30
Nox
ie C
onsu
lt
KEY ISSUES AND CHALLENGES
Long planning horizon (30 years) National resolve and commitment Rural Electrification to be put on the national
political agenda to get Members of Parliament of all political parties interested .
Steady national budgetary allocation for rural electrification
Community willingness and ability to participate.

31
Nox
ie C
onsu
lt
Thank you for your attention