Embed Size (px)
Citation preview
No.3(9)/2010-DPE (MoU)Government of India
Ministry of Heavy Industries & Public EnterprisesDepartment of Public Enterprises
(MoU Division)
Web-site: http://dpemou.nic.in/ E-mail: [email protected]
Public Enterprises Bhavan,Block No. 14, 3rd Floor,
CGO Complex, Lodhi Road, New Delhi -110 003
Dated : 30th November, 2010
OFFICE MEMORANDUM
Subject: Guidelines for Memorandum of Understanding (MoU) between CPSE and Government Department /Ministry for the year 2011-12.
Please find attached a copy of the Guidelines for drafting of MoU for the
Financial Year 2011-12. Please note the following key features:
1.1 Applicability: All CPSEs (Holding as well as Subsidiaries), without exception, are
required to sign MoUs; while the Apex/Holding companies will sign MoUs with their
administrative Ministries/Departments, the Subsidiary companies will sign MoUs with
their respective Apex/Holding companies on the same lines as MoU is signed between a
CPSE and Government of India. The MoU formats for all CPSEs, including the
Subsidiaries, will be as attached. Those CPSEs who do not stick to DPE's schedule for
signing of MoU will have their MoU performance rated as “Poor”.
1.2 Financial Targets (Static parameters): The basic targets of Gross Sales, Turnover,
Gross Margin, Net Profit, Net Worth should be projected based on last five years’ actuals
subject to the condition that they are at least 10% higher than the expected achievement
for 2010-11, or achievement in 2009-10, whichever is higher. Financial Parameters
should be fixed using DPE's definitions as appearing in these guidelines (Annexure-I).
Some common definitional errors (Annexure- II) should be avoided. Industrial and
Economic Outlook by CMIE for 2011-12 (Annexure-XII) can be referred to while
projecting financial targets.
1.3 Non-financial Targets : These should be consistent with the proposed Annual Plan and
budget of the department, and Corporate Plan of the CPSE for 2011-12. Major ongoing
projects being monitored by the Department of Statistics and Program Implementation
should be included .The non-financial targets should be SMART (Specific, Measurable,
1
Attainable, Results-oriented, Tangible). Targets should be included to assess the
performance of the CPSE under Corporate Social Responsibility, R&D, Sustainable
Development, Human Resource Management and Corporate Governance, for which at
least 5% marks each are earmarked. To the extent possible, the targets for non-financial
parameters should be independently verifiable, and CPSE should also specify the agency
and means of their verification.
1.4 Task Force : Task Force on MoU is a neutral and independent body of experts that assists
the High Power Committee on MoU and Department of Public Enterprises in setting
annual targets of CPSEs at the beginning of the year and performance evaluation of
MoUs during and at the end of the year. In order to lend greater technical and
professional expertise as well as diverse and rich experience to Task Force on MoU for
the year 2011-12, CPSEs were categorized into 11 new syndicate groups including two
newly created syndicate groups “Sick and Loss Making CPSEs” and “ Section 25
CPSEs”; each syndicate normally having 6 members comprising 1 Convenor (Senior
most among the members), 1 Administrative member (retired secretary to GOI), 1
Finance/ CA expert, 1 Ex-CMD of any CPSE, 1 renowned academician, and 1 domain
expert. There are 66 Task Force members and one Chairman for the year 2011-12. The
list of Task Force members, syndicate wise is available on DPE website
http://www.dpemou.nic.in.
1.5 The Task Force will commence negotiation meetings from January 2011 to evaluate and
finalise the MoUs in respect of Apex/Holding CPSEs as well as Subsidiary Companies.
1.6 Time-line : An advance copy of the draft MoU for 2011-12, including enclosed
Annexures and a copy of the Corporate Plan for the CPSE and its Subsidiary companies,
may be sent directly to DPE, Planning Commission and Ministry of Statistics and
Programme Implementation in hard and soft copy by 10.12 2010. The main copy, after
taking the approval of their Board, can be sent to DPE through the Administrative
Ministry/Department by the 24.12.2010.
2. CPSEs (Holding as well as Subsidiaries) under the administrative control of your
Ministry/Department may be advised to draft MOUs for the year 2011-12 on the basis of
the enclosed Guidelines. These guidelines are also available on DPE website
http://www.dpemou.nic.in.
2
3. International Financial Reporting Standards (IFRS) will be applicable to some CPSEs
including listed CPSEs and also those whose net worth is more than Rs 1000 crores w.e.f
from 1st April 2011. CPSEs are advised to consider the changes in Accounting standards
and take into account the effects while projecting the Financial parameters in the MoU
2011-12.
Modifications, if any, in these guidelines will be issued before the meetings of the Task
Force.
(J.R. Panigrahi)Director (MoU)
Tel : 011-2436 0841
To: Secretaries to the Government of India (as per list)
Copy to: Chief Executives of PSEs (as per list)
3
INDEX
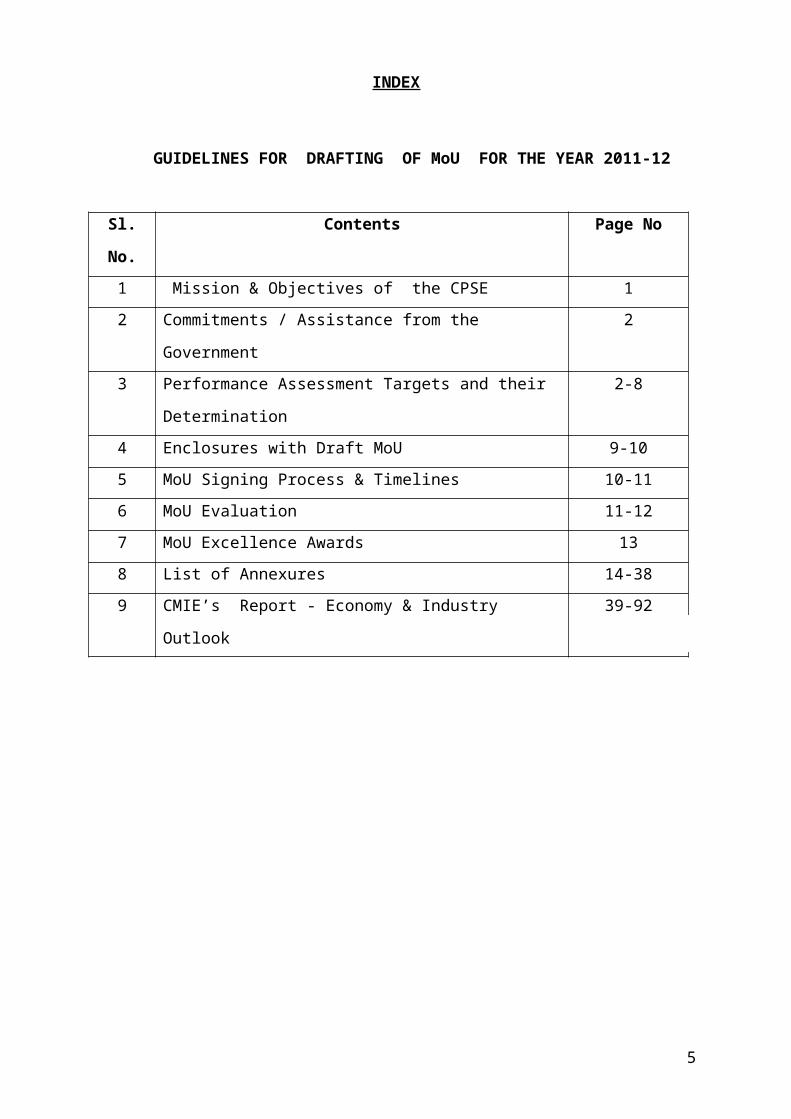
GUIDELINES FOR DRAFTING OF MoU FOR THE YEAR 2011-12
Sl. No. Contents Page No
1 Mission & Objectives of the CPSE 1
2 Commitments / Assistance from the Government 2
3 Performance Assessment Targets and their Determination 2-8
4 Enclosures with Draft MoU 9-10
5 MoU Signing Process & Timelines 10-11
6 MoU Evaluation 11-12
7 MoU Excellence Awards 13
8 List of Annexures 14-38
9 CMIE’s Report - Economy & Industry Outlook 39-92
4
MoU Guidelines for the drafting of MoU for the year 2011-12
Memorandum of Understanding (MoU) is a negotiated agreement and contract between the
Government and the Management of the Central Public Sector Enterprise (CPSE). It is
intended to evaluate the performance of the CPSE at the end of the year vis-à-vis the targets
fixed in the beginning of the year. CPSE shall follow the below listed guidelines and format
while drafting the MoU document.
Part I
1. MISSION AND OBJECTIVES OF THE CPSE
1.1 MISSION/VISION:
Mission should be a concise statement incorporating the rationale for the existence of the
enterprise and its business/activities.
The Mission statement should be formulated keeping in view fresh initiatives being
planned or /and under active consideration by the enterprise.
1.2 OBJECTIVES OF THE CPSE
The objectives should be related to the mission of the enterprise and listed in order of
priority as approved by the Board of Directors of the enterprise.
These objectives should cover quantitative and qualitative; commercial and non-
commercial; and static as well as dynamic aspects of the operations of the enterprise.
Efforts should be made to ensure that all the objectives get reflected in the MoU
Assessment Format.
1
1.3 COMMITMENTS / ASSISTANCE FROM THE GOVERNMENT
Commitments/assistance expected from the Government should be relevant and
related to the fulfilment of the agreed performance targets.
These obligations should have a direct bearing on the performance of the enterprise,
and their effect on the performance should be quantified.
2. PERFORMANCE ASSESSMENT TARGETS AND THEIR DETERMINATION
2.1.1 Performance evaluation is based on the ‘Balanced Score Card’ approach and
includes both “financial” and “non-financial parameters” having equal weights of
50% each. However, in the case of two newly created syndicate groups “Sick and
Loss Making CPSEs” and “Section 25 CPSEs” the weights for financial and non-
financial parameters are 40% and 60% respectively.
2.1.2 With a view to distinguishing ‘excellent performance’ from ‘poor performance’, 5
different performance targets should be fixed in the MoU assessment format on a 5
point scale in the ascending order, that is, (1) ‘Excellent’, (2) ‘Very Good’, (3)
‘ Good’, (4) ‘ Fair’ and (5) ‘ Poor’.
2.1.3 The basic target (B.T.) will be placed in "Good" column in respect of CPSEs
which are in growth phase and are operating below 100% capacity utilization. For
CPSEs which are performing near or above 100% capacity utilization and are fully
operative, the basic target will be placed in “Very Good” column.
2.1.4 No provisional or conditional target fixation is permissible. Hence, all performance
targets are unconditional.
2.1.5 Once the MoUs are signed between the CPSEs and the administrative
Ministries/Departments, no revision of targets will be permitted. The MoU Task
Force have the flexibility to select appropriate financial and non-financial
parameters, weightage for each of these parameters, spread between basic and other
targets subject to broad DPE guidelines. The power to permit offsets while
performance evaluation of MoU for happenings beyond the control of the
CPSE, based on recommendations of DPE and Task Force, will however,
continue to remain with the HPC. 2
2.2 Financial Targets (Static) :
Definitions of Financial Parameters: All the financial parameters should conform
to definitions which are adopted in the Public Enterprises Survey and laid before the
Parliament every year are given in Annexure - I attached.
2.2.1 Common definitional errors relating to definitional issues on the financial
parameters (refer Annexure -II) should be avoided.
2.2.2 CPSE will give a self certification (Annexure- X) at the end of the MoU to the
effect that while arriving at the targets for negotiation by calculating the financial
parameters and management ratios, the definitions and norms laid down in the MoU
guidelines of DPE have been strictly and scrupulously followed and no deviations
have been made.
2.2.3 The targets set should be realistic, growth oriented and be at least 10% higher
compared to the MoU targets for the previous year (2010-11), anticipated
achievement in 2010-11 or actual achievement in 2009-10, whichever is the highest.
These targets should be reflected in the Budget Estimates (BE) for the year 2011-12.
The target set in MoU should be consistent with those approved by the Planning
Commission and the Ministry of Finance. While evaluating the MoU for the year
2009-10, it has been observed that in the case of a number of CPSEs there is a large
difference between the targets fixed and the actual achievements for that year.
Thus, while fixing targets for the MoU for the year 2011-12, the following
methodology shall be followed:
2.2.4 To determine the basic target (BT) for primary parameters like Gross Sales,
Turnover, Gross Margin, Net Profit , Net Worth, the actual achievement of past
5 years (Annexure-IX) can be taken and a trend line projected by using any
suitable regression method; the projections so estimated can be modulated
considering factors such as business environment, projects under implementation
and Company’s growth forecast to arrive at Basic Target. Basic financial targets
should be generally determined by projecting 10% growth over achievement or
targets of the previous year, unless there was a bad performance in the previous year.
In such cases of bad performance , 10% growth on average of the last 3 years’ actual
performance should be taken as basic target. Thus a realistic and growth oriented
target for the ensuing financial year should be fixed. The targets for other financial 3

parameters and management ratios can then be derived. For CPSEs which have only
recently started signing MoUs, the projection shall be done using available data.
2.2.5 The difference in target values between "Very Good" and "Good"; "Good" and Fair";
and "Fair" and "Poor" columns should be at least 5%.
2.2.6 The difference between “Excellent” and “Very Good” targets : For the industrial
sector CPSEs (‘Manufacturing and Mining CPSEs’) in the growth phase and
operating below 100% capacity utilization, the differential of 10% between
“Excellent” and “Very Good” should be maintained. In case of CPSEs operating at
or above 100% capacity utilization, the Task Force may fix the differential between
‘”Excellent” and “Very Good” targets in the range of 5% to 10%.
2.2.7 In case of benchmarking targets with national and/or international standards, the
discretion of Task Force on MoU will apply.
2.3 Non-Financial Targets
2.3.1 A CPSE can select non-financial parameters in consultation with the administrative
Ministry/Department which are considered crucial to its functioning and fulfillment
of its objectives. However, non-financial targets fixed should be SMART (Specific,
Measurable, Attainable, Results-oriented, Tangible), clearly identifiable and
verifiable and which should be decided a priori. While setting targets for non-
financial parameters at the time of MoU negotiation meetings and similarly, at the
time of showing achievements of targets during self evaluation, CPSEs should
obtain prior approval of their Board of Directors and then send it to DPE through
their administrative Ministry/Department.
2.3.2 Dynamic Parameters
During the deliberations of the MoU negotiation meeting, if the Task Force comes
to the conclusion that any of the dynamic parameter(s) as indicated in the MoU
Assessment Format is not relevant to a particular CPSE, then the Task Force may
evolve new parameters and adjust the balance weight relevant to that particular
CPSE.
4
2.3.3 Ongoing projects implemented by CPSEs of various central Ministries and
monitored by Ministry of Statistics and Programme Implementation should be
included in non financial targets.
2.3.4 Sector-specific Parameters
Task Force will identify/evolve suitable sector specific parameters that reflect how
the macro environment affects the performance of a particular CPSE, which is
beyond the control of the CPSE management and pertain to the industry/sector in
which the CPSE operates.
2.3.5 Enterprise-specific Parameters
Enterprise-specific parameters relate to parameters like safety, environment, and
ecological considerations, i.e. parameters that do not get reflected in increased
profits either during the year of investments or later, but are considered important
from the viewpoint of the society.
2.3.6 In regard to both “Sector-specific” and “Enterprise–specific” parameters, the Task
Force may alter weights in consultation with the Administrative Ministry where
fine-tuning is felt necessary and may also club the parameters together under Non-
financial parameters, without any distinction between them.
2.3.7 Corporate Social Responsibility
The guidelines lay stress on the link of Corporate social Responsibility with
sustainable development and define Corporate Social Responsibility (CSR) as a
philosophy wherein organizations serve the interest of society by taking
responsibility for the impact of their activities on customers, employees,
shareholders, communities and the environment in all aspects of their operations.
In the MoU Guidelines for 2010-11, “Corporate Social Responsibility” was
included as a compulsory element under the ‘Non-financial parameters” with a
mandatory weightage of 5%. Department of Public Enterprises has already issued
Guidelines on Corporate Social Responsibility for CPSEs vide O.M.
No.15(3)/2007-DPE(GM) dated 9.4.2010 and available in DPE website
http://dpe.nic.in./newgl/glch1223pdf. The guidelines specify the mandate and scope
of activities for Corporate Social Responsibility by the CPSEs and are in the nature
5
of a charter on activities, projects, expenditure, documentation and monitoring of
Corporate Social Responsibility initiatives of CPSEs. A CPSE should include
targets to assess its performance under Corporate Social Responsibility..
The template for review of CSR activities/projects of CPSEs and awarding of
score/marks in MoU by the Syndicate Task Force is given in Annexure-XI
2.3.8 Research & Development
In the MoU Guidelines for 2010-11, “Research & Development”(R&D) was
included as a compulsory element under the ‘Non-financial parameters” with a
mandatory weightage of 5%. The basic rationale behind R&D activities is the
changed business environment, highly competitive markets, the rapid pace of
change in technology, stringent quality control criteria, heightened expectations and
demands of customers, lack of transfer of technology and know-how from
competitors, etc.
R&D activities by CPSEs results in substantial increase in market share and
demonstrable increase in competitiveness. It leads to greater increase in profitability
for manufacturing firms and a greater reduction in costs for services firms. R&D
activities can help strengthen our country’s technological strength and ensure
growth and creation of jobs in the country, and also allow CPSEs to address the new
challenges and opportunities in an increasingly global world.Focused R&D
activities, combined with new international partnerships, can help address pressing
global issues such as climate change, health, food security and poverty.
Department of Public Enterprises had circulated draft Guidelines on Research &
Development for CPSEs in its website (http://www.dpemou.nic.in and
http://www.dpe.nic.in) soliciting views, comments and suggestions on the draft
R&D guidelines from all the stake holders. The Guidelines will be issued shortly.
2.3.9 Sustainable Development:
In the MoU Guidelines for 2010-11, “Sustainable Development” (SD) was included
as a compulsory element under the ‘Non-financial parameters” with a mandatory
weightage of 5%.
6
Sustainable Development is development that meets the needs of the present
without compromising the ability of future generations to meet their own needs.
Sustainable Development involves an enduring, balanced approach to economic
activity, social progress and environmental responsibility. While conservation of
environmental resource is necessary to secure livelihoods and well-being of all, the
most secure basis for conservation is to ensure that people dependent on particular
resources obtain better livelihood from the fact of conservation than from
degradation of the resource.
DPE is in the process of the finalization of Guidelines on Sustainable Development
(SD) and will be issued shortly.
2.3.10 Compliance of Corporate Governance
CPSEs must have good Corporate Governance to be effective in competition
with the private sector including global players. Emphasis must be placed as much
on performance and delivery as on corporate governance. Corporate Governance
involves a set of relationships between a company’s management, its Board, its
shareholders and other stakeholders and it provides a principled process and
structure through which the objectives of the company, the means of attaining the
objectives and systems of monitoring performance are also set. Corporate
governance involves issues like grant of autonomy to CPSEs matched with
accountability. It is about commitment to values, ethical business conduct, and
transparency and makes a distinction between personal and corporate funds in the
management of a company.
Department of Public Enterprises has issued guidelines on Corporate Governance
vide O.M. No.18(8)/2005-GM Dated 14th May 2010. Listed CPSEs will follow
both SEBI guidelines and DPE guidelines while non-listed CPSEs could
voluntarily follow DPE Guidelines.
In the MoU for 2011-12, “Compliance of Corporate Governance” will be a
compulsory element under the ‘Non-financial parameters” with a mandatory
weightage of 5%.
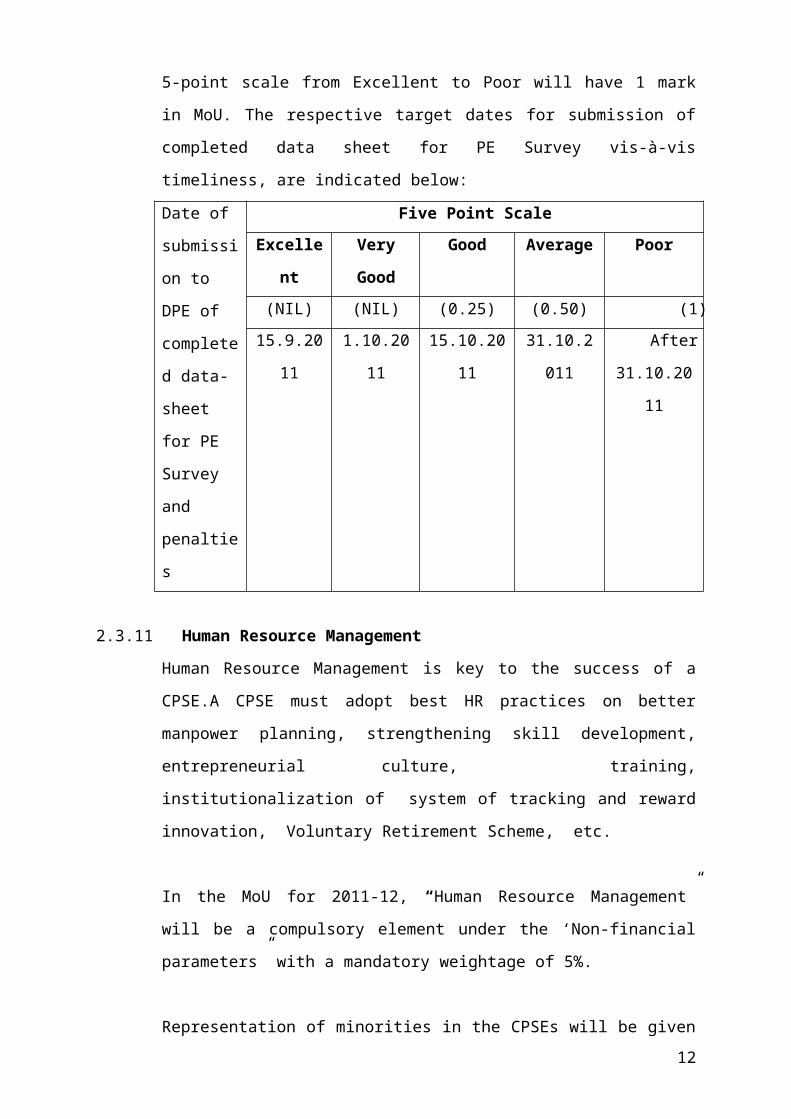
Submission of data by CPSEs for Public Enterprises Survey published by DPE as
per the time schedule in the 5-point scale from Excellent to Poor will have 1 mark
7
in MoU. The respective target dates for submission of completed data sheet for PE
Survey vis-à-vis timeliness, are indicated below:
Date of
submission
to DPE of
completed
data-sheet
for PE
Survey and
penalties
Five Point Scale
Excellent Very
Good
Good Average Poor
(NIL) (NIL) (0.25) (0.50) (1)
15.9.2011 1.10.2011 15.10.2011 31.10.2011 After
31.10.2011
2.3.11 Human Resource Management
Human Resource Management is key to the success of a CPSE.A CPSE must adopt
best HR practices on better manpower planning, strengthening skill development,
entrepreneurial culture, training, institutionalization of system of tracking and
reward innovation, Voluntary Retirement Scheme, etc.
In the MoU for 2011-12, “Human Resource Management” will be a compulsory
element under the ‘Non-financial parameters” with a mandatory weightage of 5%.
Representation of minorities in the CPSEs will be given a weightage of 1 mark in
MoU from 2011-12.. The Task Force will decide during MoU negotiation
meeting, the target for CPSE with regard to the percentage of minorities to be
recruited during the year and regular submission of this information by CPSE to
DPE in the desired format.
8
3. ENCLOSURES WITH DRAFT MoU
For MoU 2011-12 exercises, DPE has reclassified CPSEs into 11 new functional
groups, in alignment with the classification used in the Public Enterprises Survey
which is laid before the Parliament, to facilitate homogeneity and ensure
comparability within the group. Besides, two new separate functional groups have
been formed for (i) Section 25 CPSEs and (ii) Sick & Loss making CPSEs. (Vide
DPE’s O.M. No.3(16)/2009-DPE(MoU) dated 21st July, 2010). Any changes required
in this classification on consideration of representations of CPSEs and for
administrative expediency, will be notified by DPE.
A new, separate syndicate group for ”CPSEs registered under Sec 25 of the
Companies Act, 1956” has been formed to accommodate their unique nature which
prohibits the distribution of dividend to its members and apply the profit back for the
purpose for which they were formed. Based on the recommendation of the Syndicate
Group, MoU format, parameters, inter-se-weightage, etc. have been revised. MoU
format is in Annexure-VI.
Similarly, a new, separate syndicate group for ‘Sick & Loss making CPSEs’ has been
formed to accommodate their unique needs, viz. the diversity in terms of sectors,
products / services and stages of sickness / revival. Based on the recommendation of
the Syndicate Group, MoU format, parameters, inter-se-weightage, etc. have been
revised. MoU format is in Annexure-VII.
3.1 Key financial indicators of CPSEs relating to last five years along with MoU targets
for 2011-12 should be submitted in format enclosed. (Annexure IX)
3.1.1 MOU Assessment Format for different sectors
The CPSEs falling broadly in the categories of ‘Industrial sector’, “Manufacturing &
Mining sector”, ‘Trading & Consulting sector ’and ‘Financial sector’ may adopt the
MoU assessment format in line with the practice followed in previous years and with
the approval of the Task Force during negotiation meetings. ( Annexure- III - V.) .
‘Sick and Loss making CPSEs’ and ‘CPSEs registered under Section 25 of the
Companies Act’ will adopt the formats (Annexure-VI & VII) as discussed above.
9
3.1.2 The SDR minutes of the MoU negotiation meetings (2010-11) along with the Action
Taken Report (ATR) on the minutes of MoU negotiation meetings (2010-11) issued
by DPE should be annexed with the draft MoU 2011-12.
3.1.3 A CPSE should submit three copies each of Corporate Plan, Annual Report for 2009-
10, Performance up to Quarter ending December 2010 and Reviewed Financial results
for the period up to September 2010 to DPE and separately to Task Force Members of
the concerned Syndicates.
4. MoU SIGNING PROCESS AND TIMELINES
4.1 All CPSEs (Holding as well as Subsidiaries), without exception, are required to sign
MoUs; while the Apex/Holding companies will sign MoUs with their respective
Ministries/Departments, the Subsidiary companies will sign MoUs with their
respective Apex/Holding companies on the same lines as MoU is signed between a
CPSE and Government of India. The MoU formats for all CPSEs, including the
Subsidiaries, will remain as attached. Those CPSEs who do not stick to DPE's
schedule for signing of MoU will have their MoU performance rated as “Poor”.
4.1.1 The revised MoUs based on the minutes of the MoU negotiation meetings should be
sent by all CPSEs (Holding as well as Subsidiary Companies) through administrative
Ministries/Departments for authentication by DPE before signing of the MoUs..
4.1.2 To ensure that MoU system is conducted effectively in the DPE, the Administrative
Ministry/Department & CPSEs (Holding as well as Subsidiary Companies) shall
follow the below mentioned timelines:
4.1.3 Timely submission of MoU for the year 2011-12 : An advance copy of the draft
MoU for 2011-12, including enclosed Annexures and a copy of the Corporate Plan for
the CPSE and its Subsidiary companies, may be sent directly to DPE, Planning
Commission and Ministry of Statistics and Programme Implementation in hard and
soft copy by 10 th December 2010 . The main copy, after taking the approval of their
Board, can be sent to DPE through the Administrative Ministry/Department by the
24 th December 2010 .
10

(i) Timely signing of MoU for the year 2011-12 : Submission of copy of
MoU signed between CPSE and Administrative Ministry/ Department and
between Subsidiary Company and Apex /Holding CPSE, within the target
date of 15 th March 2011 .
(ii) Timely submission of Performance Evaluation Report (composite score)
for the year 2010-11 on the basis of Audited data along with the Audited
Accounts, Balance Sheet and Profit and Loss Account of the CPSE for
the year 2010-11 to DPE (copies to be sent to Task Force Members by
CPSEs separately) after approval of the Board of CPSE and through their
Administrative Ministry/Department within the target date of 31 st August
2011. Any delay in submission of Performance Evaluation Report with
annual audited data will disentitle a CPSE for MoU Excellence Awards /
Certificates.
5. MoU EVALUATION
Evaluation of MoU of the CPSE is done at the end of the year on the basis of actual
achievements vis-à-vis the MoU targets. CPSEs (Holding as well as Subsidiaries) are
required to submit performance evaluation reports on the basis of audited data
alongwith Annual Accounts, Balance Sheet etc. to Department of Public Enterprises ,
after approval of the Board of CPSE and through the administrative
Ministries/Departments within the target date of 31 st August .
The weighted score for each parameter in the MoU is worked out by taking into
account the actual achievements and the weights assigned to that parameter. The
overall MoU composite score is, thus arrived at by adding weight score for all
parameters. This system is based on ‘Five-point’ scale and ‘criteria weight’ for the
calculation of Composite Score, which is index of the performance of the CPSE with
reference to its targets.
After completing the evaluation of the performance of the MoU signing CPSEs with
the assistance and expertise the Task Force, DPE submits the results of MoU
Composite score and rating of CPSEs to the High Power Committee on MoU headed
by the Cabinet Secretary for its approval. Once the High Power Committee gives its 11
seal of approval to the evaluation done by the Task Force, the composite score and the
ratings of the CPSEs become final. Composite score, thus, facilitates measuring the
ability of the CPSEs to meet their own commitments and to compare and rank various
CPSEs even though the commitments of these enterprises are different
5.1 PROCESS OF EVALUATION
MoU evaluation of CPSE is done only once in the year based on audited annaual
accounts of the concerned CPSE.
5.1.1 RAW SCORE
Raw Score reflects the ‘actual performance’ in relation to the 5- point scale of MoU
targets (as mentioned in para 2.1.2 above). If actual performance is equal to or more
than the “Excellent” target (1), Raw score would be 1.00. If actual performance is
equal to or less than the “Poor” target (5), Raw score would be 5.00. If actual
performance falls in between “Excellent” (1) and “Very Good” (2) in that case Raw
score would be 1 + (Excellent-Actual) ¸ (Excellent-Very Good). If actual
performance falls in between “Good” (3) and “Fair” (4) target, in that case Raw score
would be 3 + (Good-Actual) ¸ (Good-Fair). The Raw score for the rest can be
similarly calculated if ‘the actual’ falls in between other columns.
5.1.2 COMPOSITE SCORE AND RATING
Composite score is an index of the performance of the CPSE which is calculated as
the aggregate of all the weighted score of “the actual achievements” vis-à-vis ‘the
targets’ set out on a 5-point scale. The Composite Score may either be (1), (2), (3),
(4), or (5) or may have values between (1 to2), (2 to 3), (3 to 4) or (4 to 5).
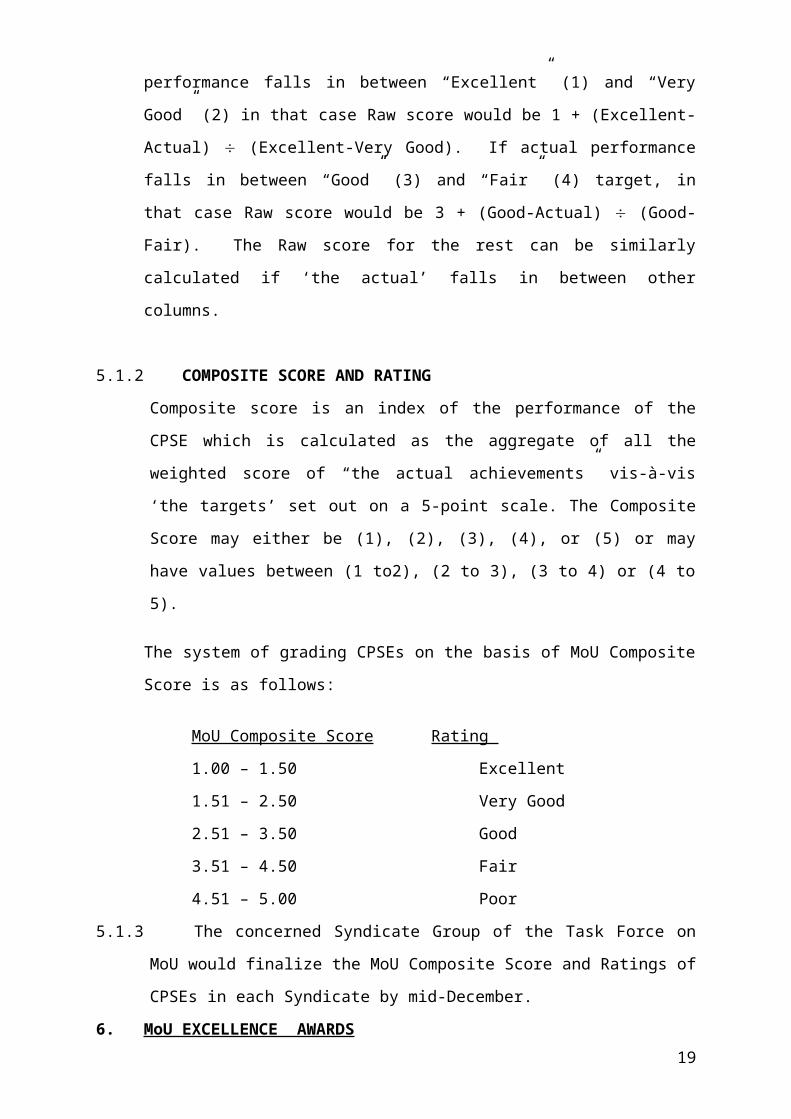
The system of grading CPSEs on the basis of MoU Composite Score is as follows:
MoU Composite Score Rating
1.00 – 1.50 Excellent
1.51 – 2.50 Very Good
2.51 – 3.50 Good
3.51 – 4.50 Fair
4.51 – 5.00 Poor
5.1.3 The concerned Syndicate Group of the Task Force on MoU would finalize the MoU
Composite Score and Ratings of CPSEs in each Syndicate by mid-December.
6. MoU EXCELLENCE AWARDS12
6.1. The total number of MoU Excellence Awards are 12 (1 from each of the 10 Syndicate
groups, 1 from the listed CPSEs, 1 from amongst the turnaround sick and loss making
CPSEs). All other ‘Excellent’ performing CPSEs get MoU Excellence certificates.
6.1.1 The following three basic principles for selection of CPSEs for MoU Excellence
Awards from amongst the Syndicate groups will be adopted:
(i) The profit of the CPSE in the year should be higher compared to the previous
year.
(ii) It should not be a loss-making enterprise.
(iii) The composite score of the CPSE should not be more than 1.5 (Excellent
rating).
6.1.2 Award is given to the CPSE meeting the above criteria and having the best MoU
composite score in the concerned Syndicate Group. In case two or more CPSEs
have the same MoU composite score in a Syndicate Group, the CPSE recording the
highest growth rate of net profit over the previous year is eligible for the Award.
The selection of CPSEs as ‘ the best listed CPSE’ and ‘ the best turnaround sick and
loss making CPSE’ for MoU Excellence Awards is done by the Department of
Public Enterprises.
The “listed CPSEs” with the highest percentage growth in market capitalization are
arranged in descending order and the CPSE with the highest growth is selected for
the MoU Excellence Award.
CPSE is considered sick if it is referred to either BIFR or BRPSE. Out of such
CPSEs, those are eligible for award that has earned profit before tax (PBT) for the
year the MoU is under consideration as well as during the immediately preceding
year. The CPSE having the best MoU composite score is given the MoU Excellence
Award.
6.1.3 Compliance of Corporate Governance will be one of the criteria for the consideration
of MoU Excellence Awards.
13

List of Annexures
Annex-I: Definitions of Financial Parameters
Annex-II : Some Common definitional errors in MoU Self-Assessment from DPE
guidelines
Annex-III : MoU Assessment Format for Industrial CPSEs– ‘Manufacturing and
Mining’ CPSEs
Annex-IV: MoU Assessment Format for ‘Trading and Consulting Sector’
Annex-V: MoU Assessment Format for ‘Financial Sector’
Annex-VI: MoU Assessment Format for ‘CPSEs registered under Section 25 of the
Companies Act’
Annex-VII: MoU Assessment Format for ‘Sick and Loss Making’CPSEs.
Annex-VIII: MoU Assessment Format for ‘CPSEs under Construction’
Annex-IX: Trend of CPSE’sPerformance on Financial Parameters for last 5
years
Annex –X: Self declaration/Certification by CPSE
Annex-XI : Template for CSR Review
Annex-XII: Industrial and Economic Outlook by CMIE for 2011-12
14
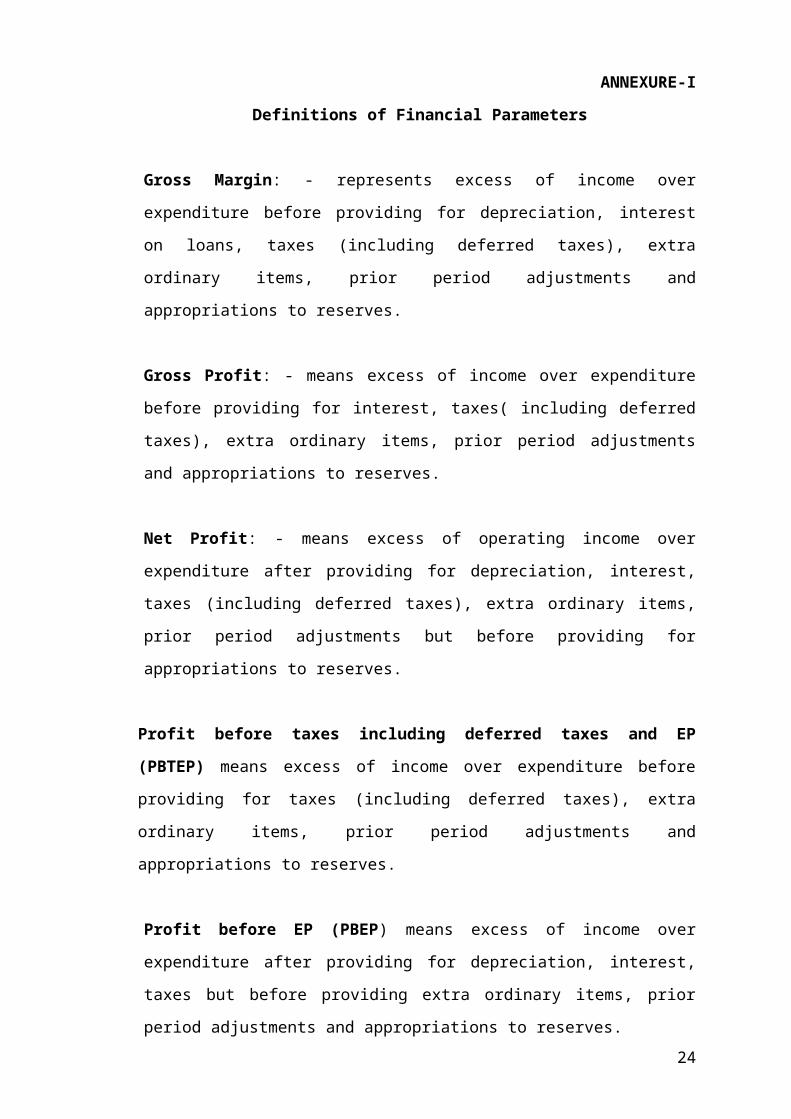
ANNEXURE-I
Definitions of Financial Parameters
Gross Margin: - represents excess of income over expenditure before providing for
depreciation, interest on loans, taxes (including deferred taxes), extra ordinary items,
prior period adjustments and appropriations to reserves.
Gross Profit: - means excess of income over expenditure before providing for
interest, taxes( including deferred taxes), extra ordinary items, prior period
adjustments and appropriations to reserves.
Net Profit: - means excess of operating income over expenditure after providing for
depreciation, interest, taxes (including deferred taxes), extra ordinary items, prior
period adjustments but before providing for appropriations to reserves.
Profit before taxes including deferred taxes and EP (PBTEP) means excess of
income over expenditure before providing for taxes (including deferred taxes), extra
ordinary items, prior period adjustments and appropriations to reserves.
Profit before EP (PBEP) means excess of income over expenditure after providing
for depreciation, interest, taxes but before providing extra ordinary items, prior period
adjustments and appropriations to reserves.
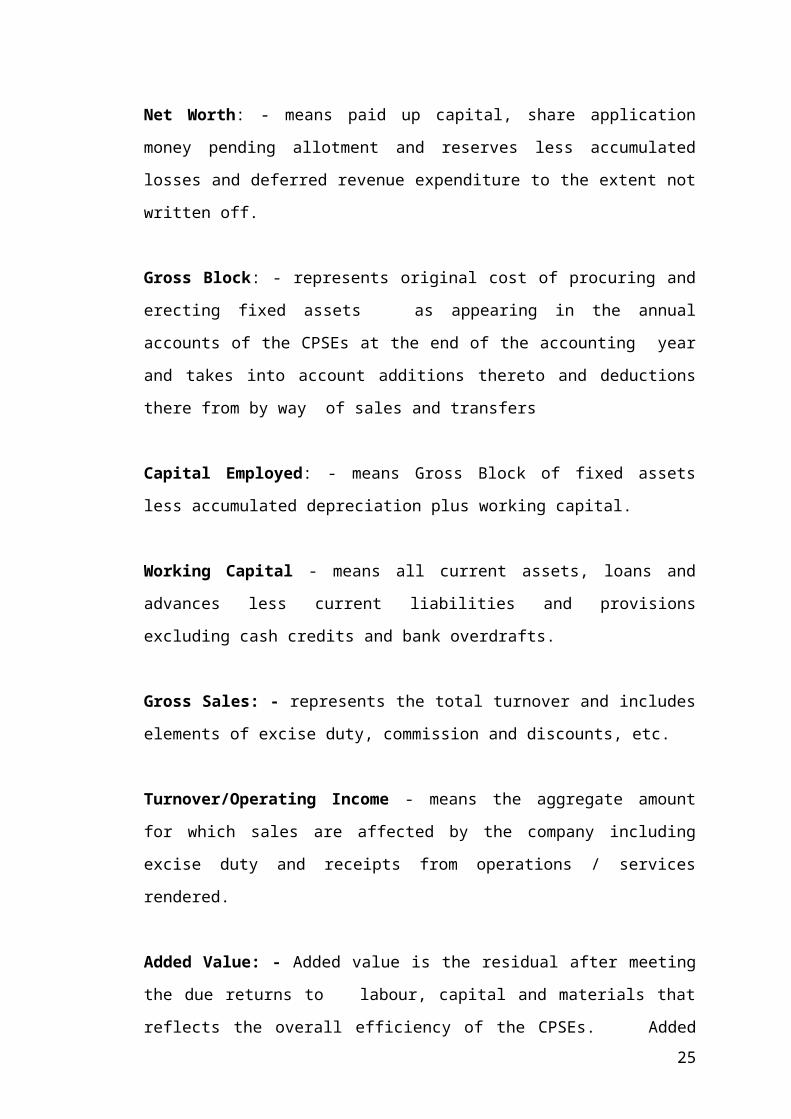
Net Worth: - means paid up capital, share application money pending allotment and
reserves less accumulated losses and deferred revenue expenditure to the extent not
written off.
Gross Block: - represents original cost of procuring and erecting fixed assets as
appearing in the annual accounts of the CPSEs at the end of the accounting year and
takes into account additions thereto and deductions there from by way of sales and
transfers
Capital Employed: - means Gross Block of fixed assets less accumulated
depreciation plus working capital.
Working Capital - means all current assets, loans and advances less current liabilities 15
and provisions excluding cash credits and bank overdrafts.
Gross Sales: - represents the total turnover and includes elements of excise duty,
commission and discounts, etc.
Turnover/Operating Income - means the aggregate amount for which sales are
affected by the company including excise duty and receipts from operations / services
rendered.
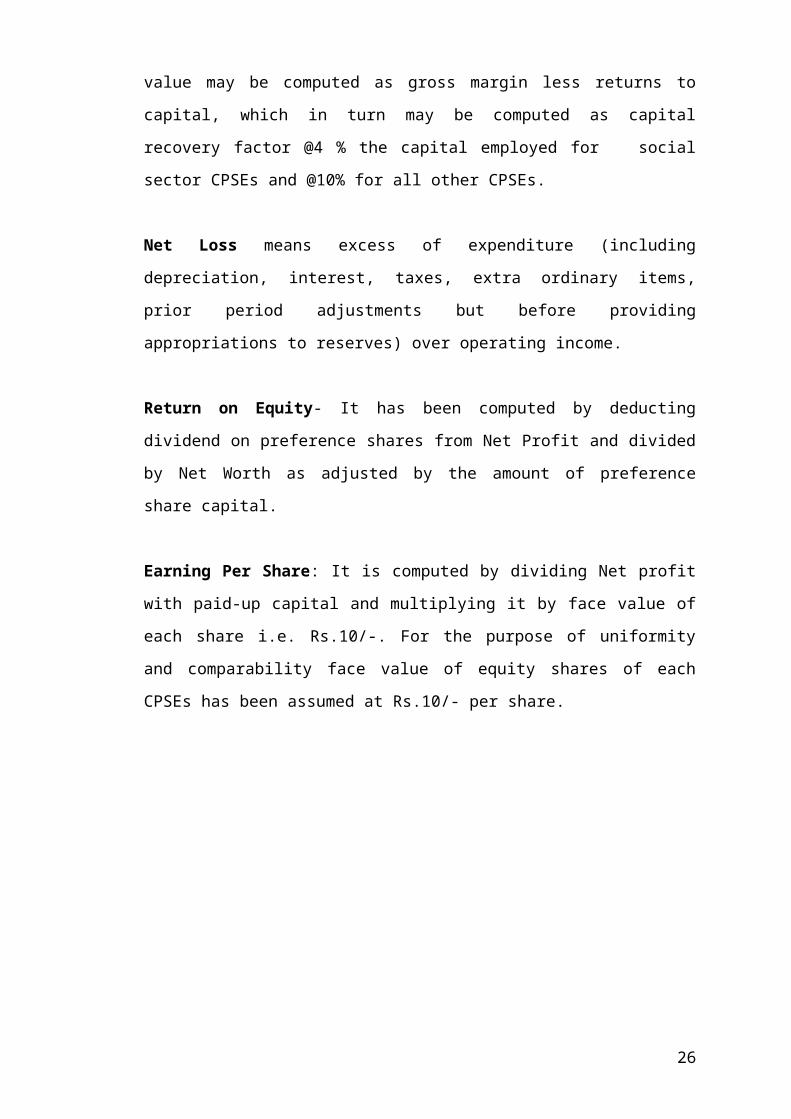
Added Value: - Added value is the residual after meeting the due returns to labour,
capital and materials that reflects the overall efficiency of the CPSEs. Added value
may be computed as gross margin less returns to capital, which in turn may be
computed as capital recovery factor @4 % the capital employed for social sector
CPSEs and @10% for all other CPSEs.
Net Loss means excess of expenditure (including depreciation, interest, taxes, extra
ordinary items, prior period adjustments but before providing appropriations to
reserves) over operating income.
Return on Equity- It has been computed by deducting dividend on preference shares
from Net Profit and divided by Net Worth as adjusted by the amount of preference
share capital.
Earning Per Share: It is computed by dividing Net profit with paid-up capital and
multiplying it by face value of each share i.e. Rs.10/-. For the purpose of uniformity
and comparability face value of equity shares of each CPSEs has been assumed at
Rs.10/- per share.
16
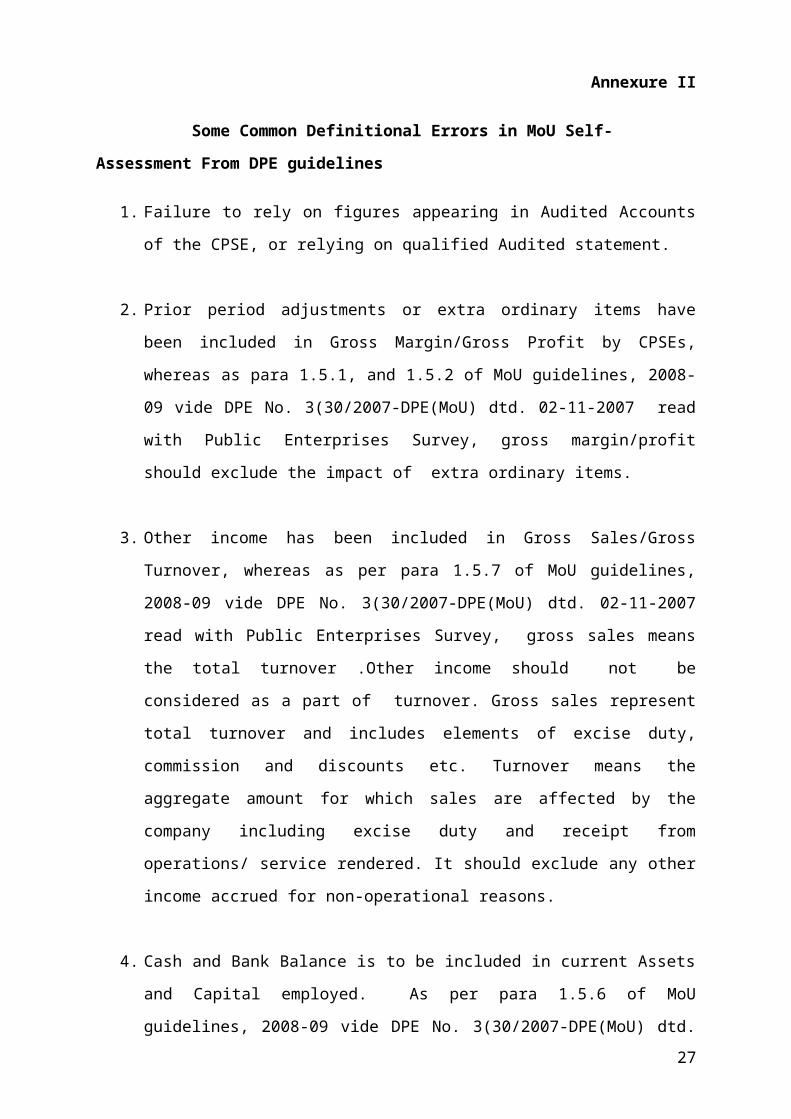
Annexure II
Some Common Definitional Errors in MoU Self-Assessment From DPE guidelines
1. Failure to rely on figures appearing in Audited Accounts of the CPSE, or relying on
qualified Audited statement.
2. Prior period adjustments or extra ordinary items have been included in Gross
Margin/Gross Profit by CPSEs, whereas as para 1.5.1, and 1.5.2 of MoU guidelines,
2008-09 vide DPE No. 3(30/2007-DPE(MoU) dtd. 02-11-2007 read with Public
Enterprises Survey, gross margin/profit should exclude the impact of extra ordinary
items.
3. Other income has been included in Gross Sales/Gross Turnover, whereas as per para
1.5.7 of MoU guidelines, 2008-09 vide DPE No. 3(30/2007-DPE(MoU) dtd. 02-11-
2007 read with Public Enterprises Survey, gross sales means the total turnover .Other
income should not be considered as a part of turnover. Gross sales represent total
turnover and includes elements of excise duty, commission and discounts etc.
Turnover means the aggregate amount for which sales are affected by the company
including excise duty and receipt from operations/ service rendered. It should exclude
any other income accrued for non-operational reasons.
4. Cash and Bank Balance is to be included in current Assets and Capital employed. As
per para 1.5.6 of MoU guidelines, 2008-09 vide DPE No. 3(30/2007-DPE(MoU) dtd.
02-11-2007 read with Public Enterprises Survey, capital employed means gross block
less accumulated depreciation plus working capital ;and working capital is total
current assets minus total current liabilities. A few CPSEs have not included cash and
bank balance in their current assets and capital employed.
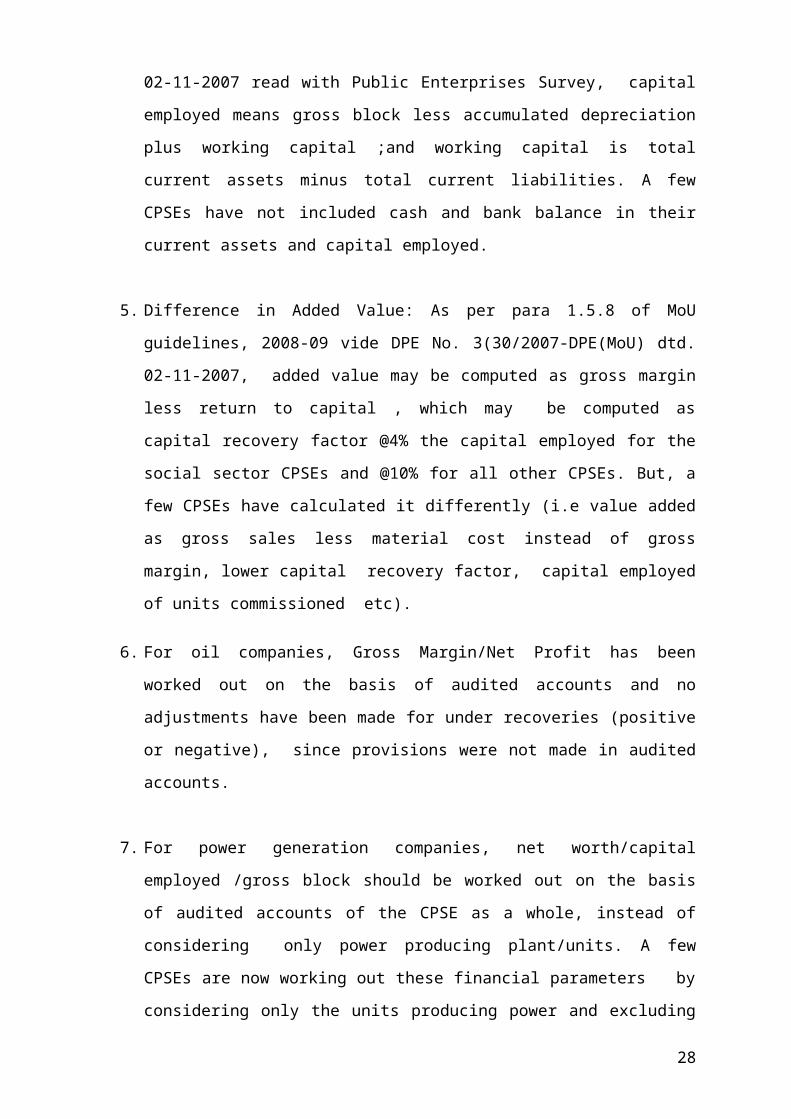
5. Difference in Added Value: As per para 1.5.8 of MoU guidelines, 2008-09 vide DPE
No. 3(30/2007-DPE(MoU) dtd. 02-11-2007, added value may be computed as gross
margin less return to capital , which may be computed as capital recovery factor
@4% the capital employed for the social sector CPSEs and @10% for all other
CPSEs. But, a few CPSEs have calculated it differently (i.e value added as gross
sales less material cost instead of gross margin, lower capital recovery factor, capital
employed of units commissioned etc).
17
6. For oil companies, Gross Margin/Net Profit has been worked out on the basis of
audited accounts and no adjustments have been made for under recoveries (positive or
negative), since provisions were not made in audited accounts.
7. For power generation companies, net worth/capital employed /gross block should be
worked out on the basis of audited accounts of the CPSE as a whole, instead of
considering only power producing plant/units. A few CPSEs are now working out
these financial parameters by considering only the units producing power and
excluding projects under constructions/station under repairs. For working out
PBDIT/Total Employment, a few CPSE’s are considering number of employees of
Power plants producing power/stations under commission instead of total
employment of CPSE.
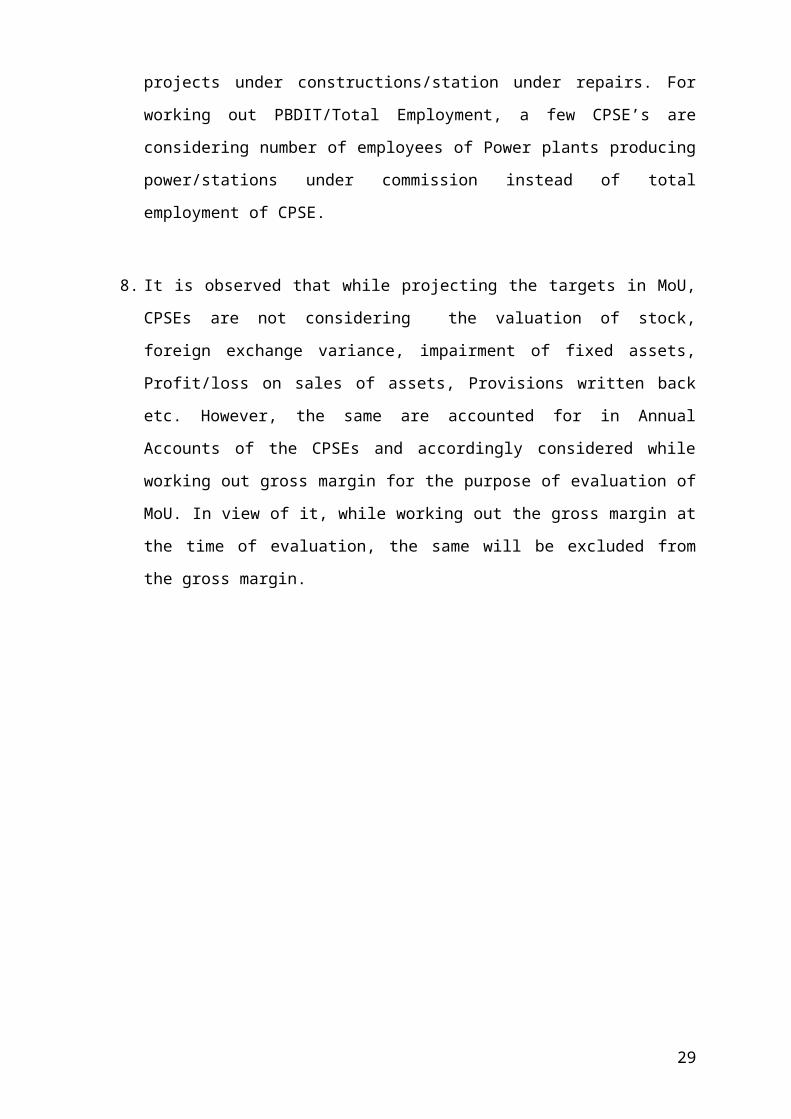
8. It is observed that while projecting the targets in MoU, CPSEs are not considering the
valuation of stock, foreign exchange variance, impairment of fixed assets, Profit/loss
on sales of assets, Provisions written back etc. However, the same are accounted for
in Annual Accounts of the CPSEs and accordingly considered while working out
gross margin for the purpose of evaluation of MoU. In view of it, while working out
the gross margin at the time of evaluation, the same will be excluded from the gross
margin.
18

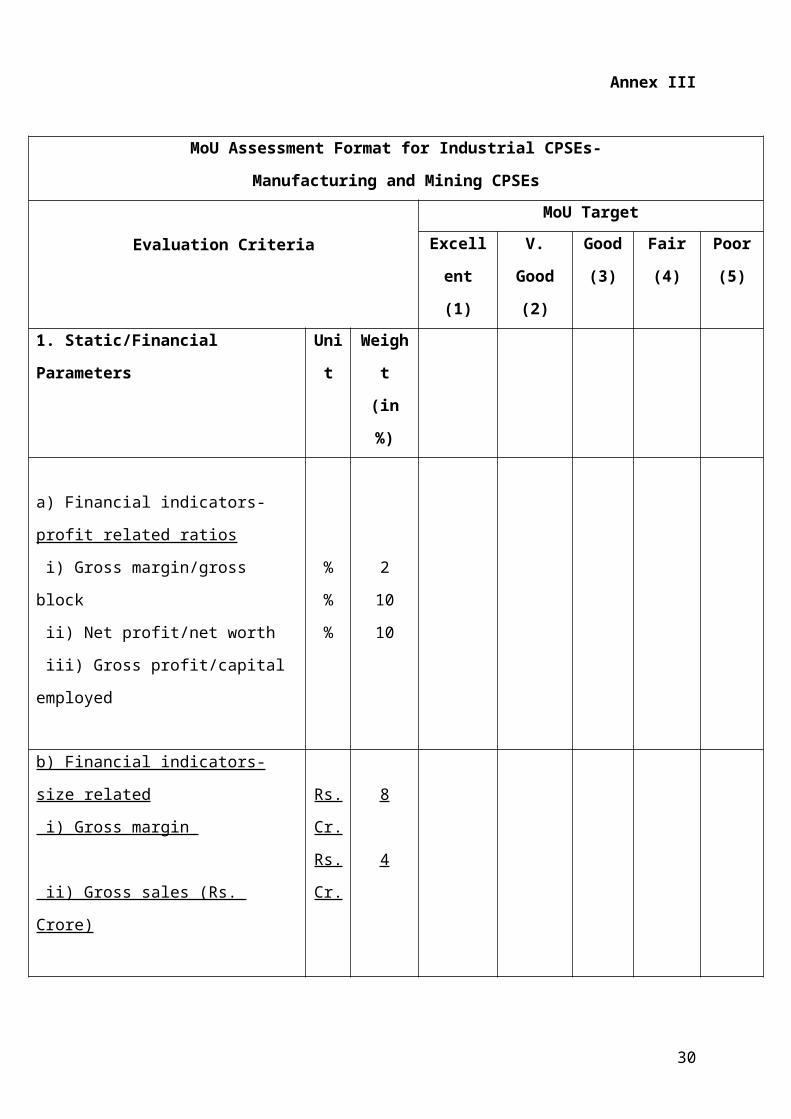
Annex III
MoU Assessment Format for Industrial CPSEs-
Manufacturing and Mining CPSEs
Evaluation Criteria
MoU Target
Excellent
(1)
V. Good
(2)
Good
(3)
Fair
(4)
Poor
(5)
1. Static/Financial Parameters Unit Weight
(in %)
a) Financial indicators-
profit related ratios
i) Gross margin/gross block
ii) Net profit/net worth
iii) Gross profit/capital employed
%
%
%
2
10
10
b) Financial indicators-size related
i) Gross margin
ii) Gross sales (Rs. Crore)
Rs.
Cr.
Rs.
Cr.
8
4
c) Financial returns-productivity related
i) PBDIT/total employment
ii) Added value/sales
%
%
7
9
Sub-total 1 (a + b + c) 50
19
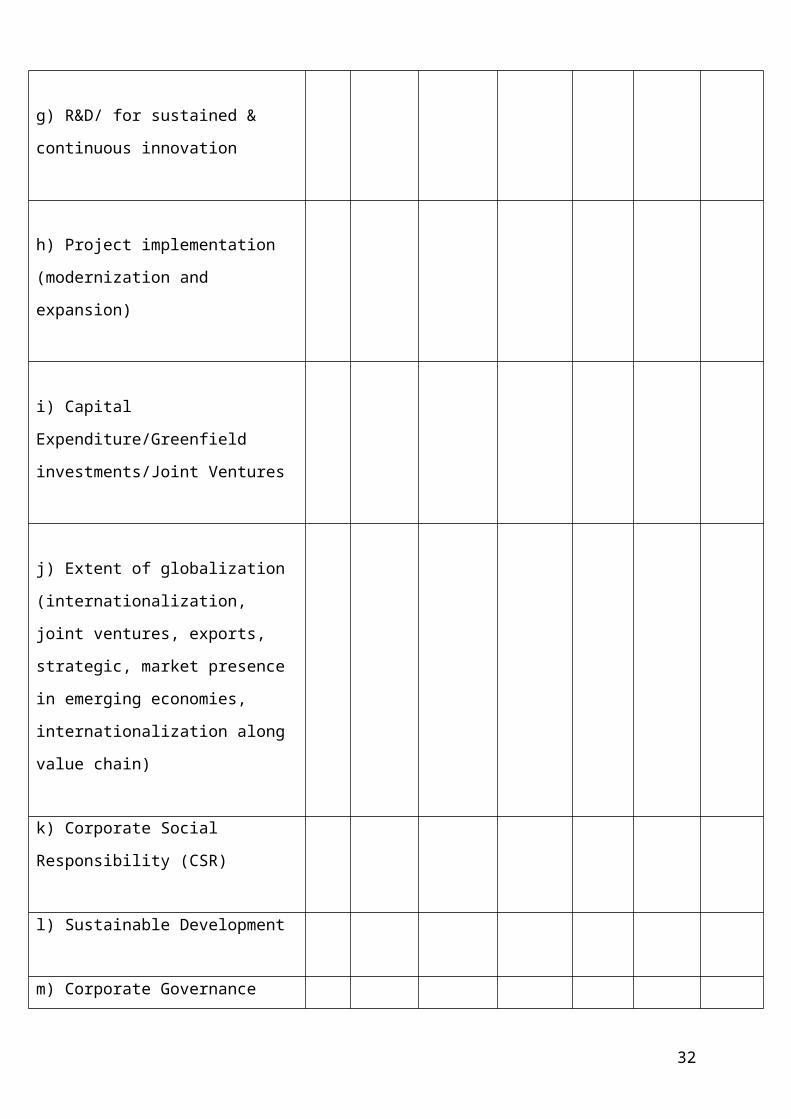
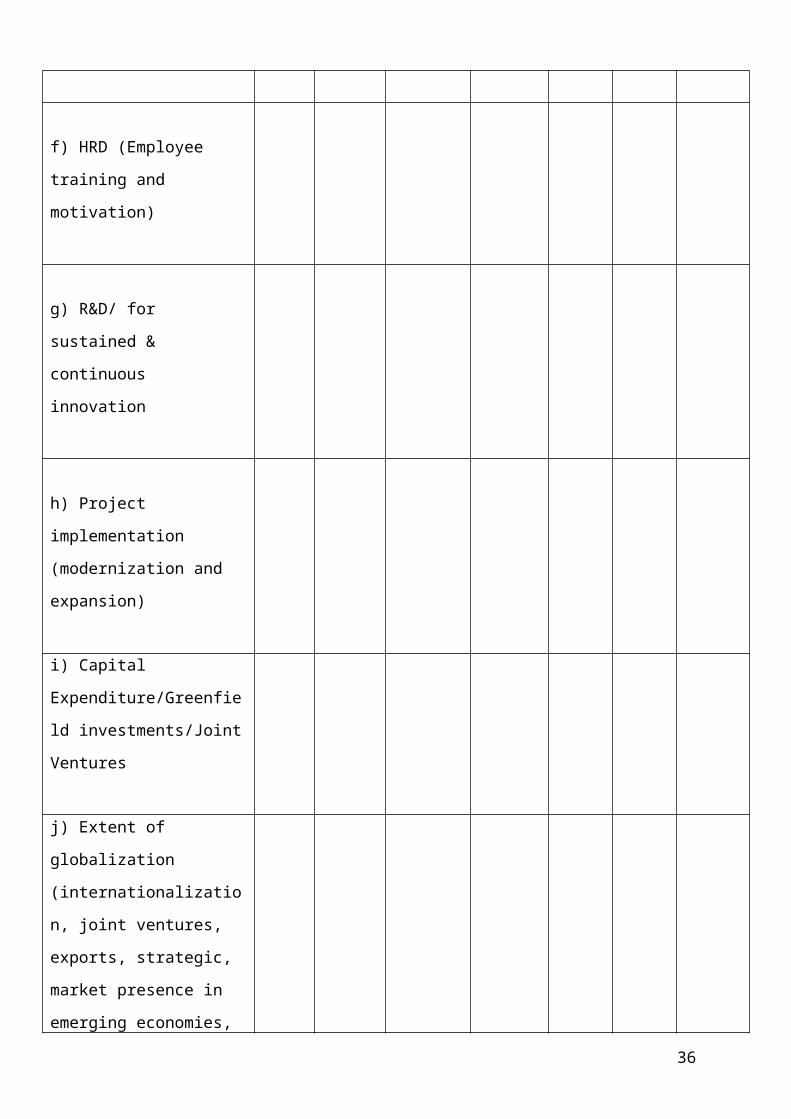
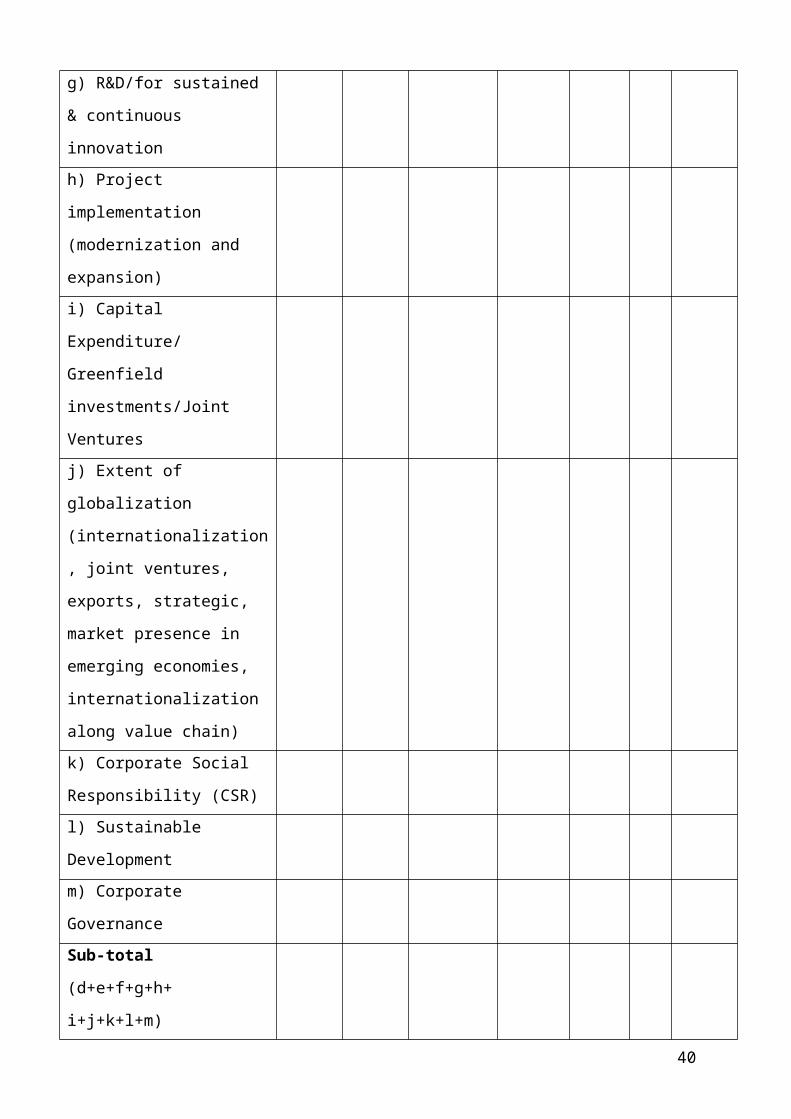
2. Dynamic Parameters *
d) Quality (ISO certification,
internalization of quality within
SBU/products)
e) Customer Satisfaction (Customer
orientation)
f) HRD (Employee training and
motivation)
g) R&D/ for sustained & continuous
innovation
h) Project implementation
(modernization and expansion)
i) Capital Expenditure/Greenfield
investments/Joint Ventures
j) Extent of globalization
(internationalization, joint ventures,
exports, strategic, market presence in
emerging economies,
internationalization along value chain)
20
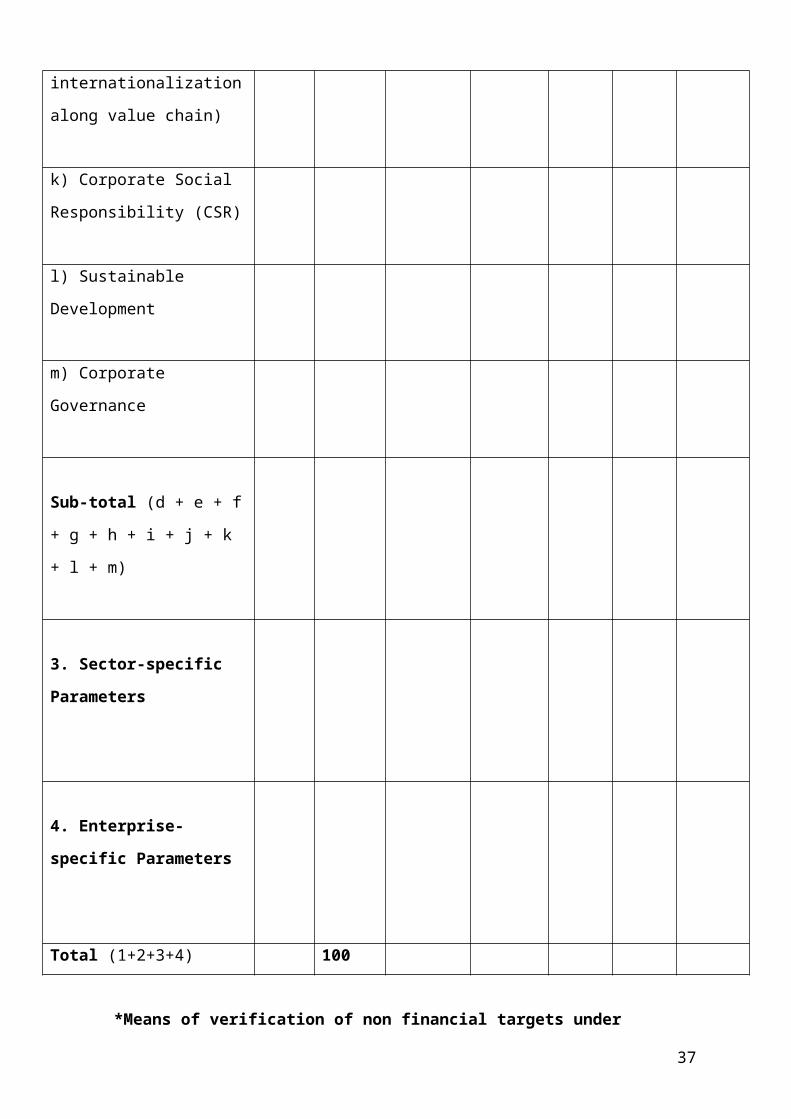
k) Corporate Social Responsibility
(CSR)
l) Sustainable Development
m) Corporate Governance
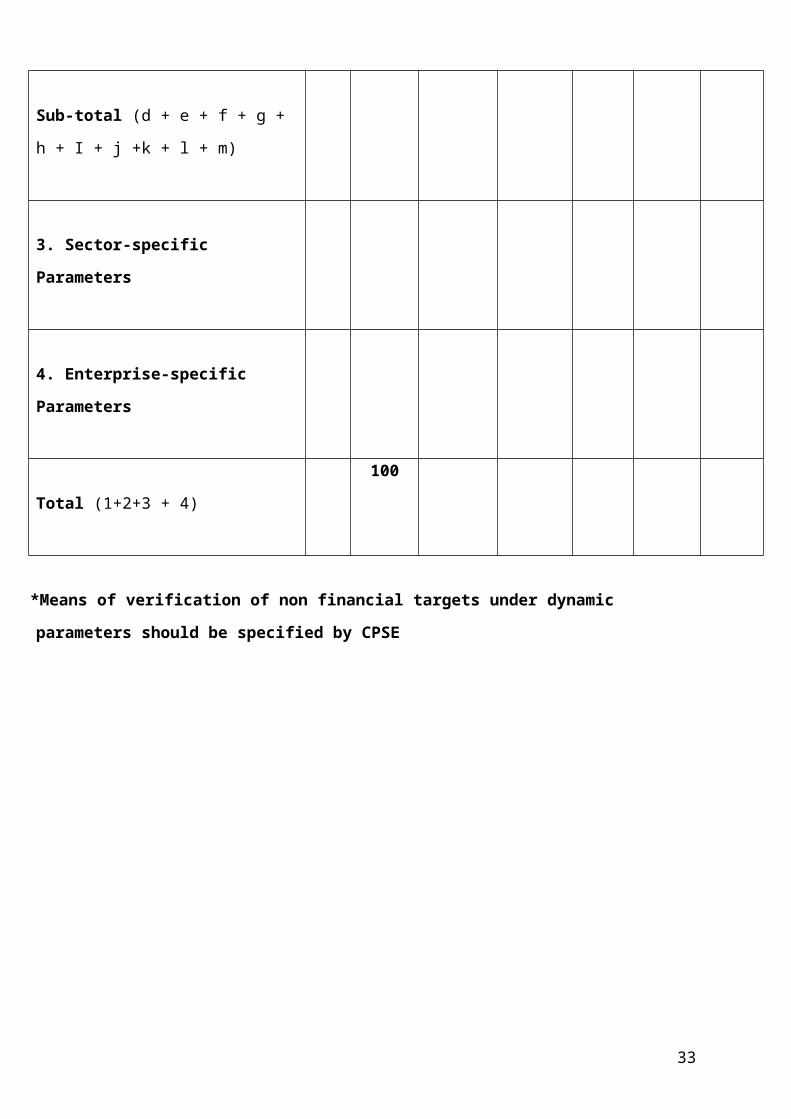
Sub-total (d + e + f + g + h + I + j +k +
l + m)
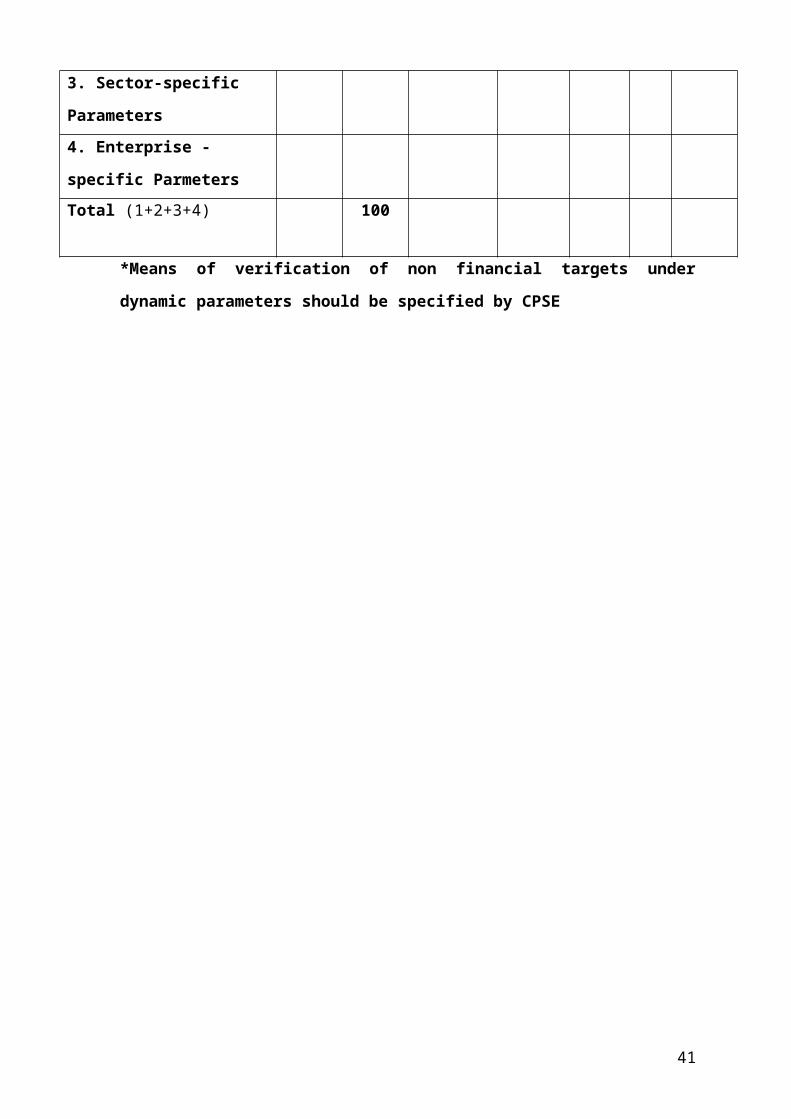
3. Sector-specific Parameters
4. Enterprise-specific Parameters
Total (1+2+3 + 4)
100
*Means of verification of non financial targets under dynamic parameters should be specified by
CPSE
21
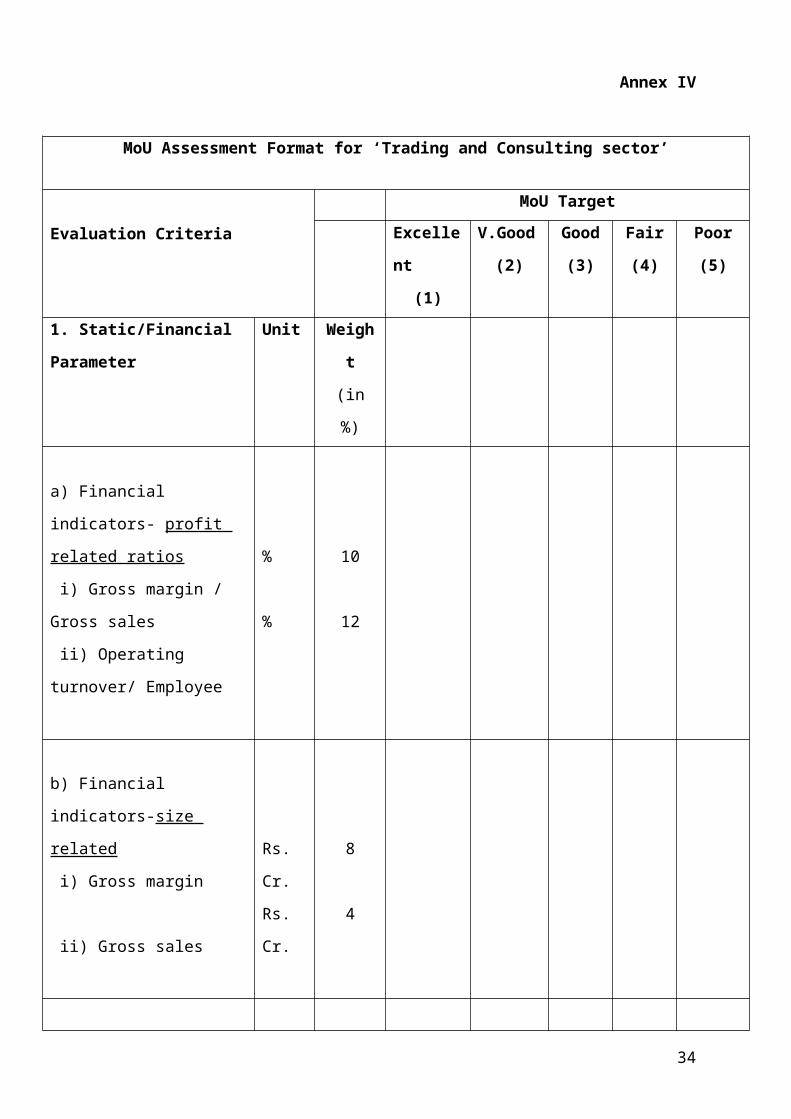
Annex IV
MoU Assessment Format for ‘Trading and Consulting sector’
Evaluation Criteria
MoU Target
Excellent
(1)
V.Good
(2)
Good
(3)
Fair
(4)
Poor
(5)
1. Static/Financial
Parameter
Unit Weight
(in %)
a) Financial indicators- profit
related ratios
i) Gross margin / Gross sales
ii) Operating turnover/
Employee
%
%
10
12
b) Financial indicators-size
related
i) Gross margin
ii) Gross sales
Rs. Cr.
Rs. Cr.
8
4
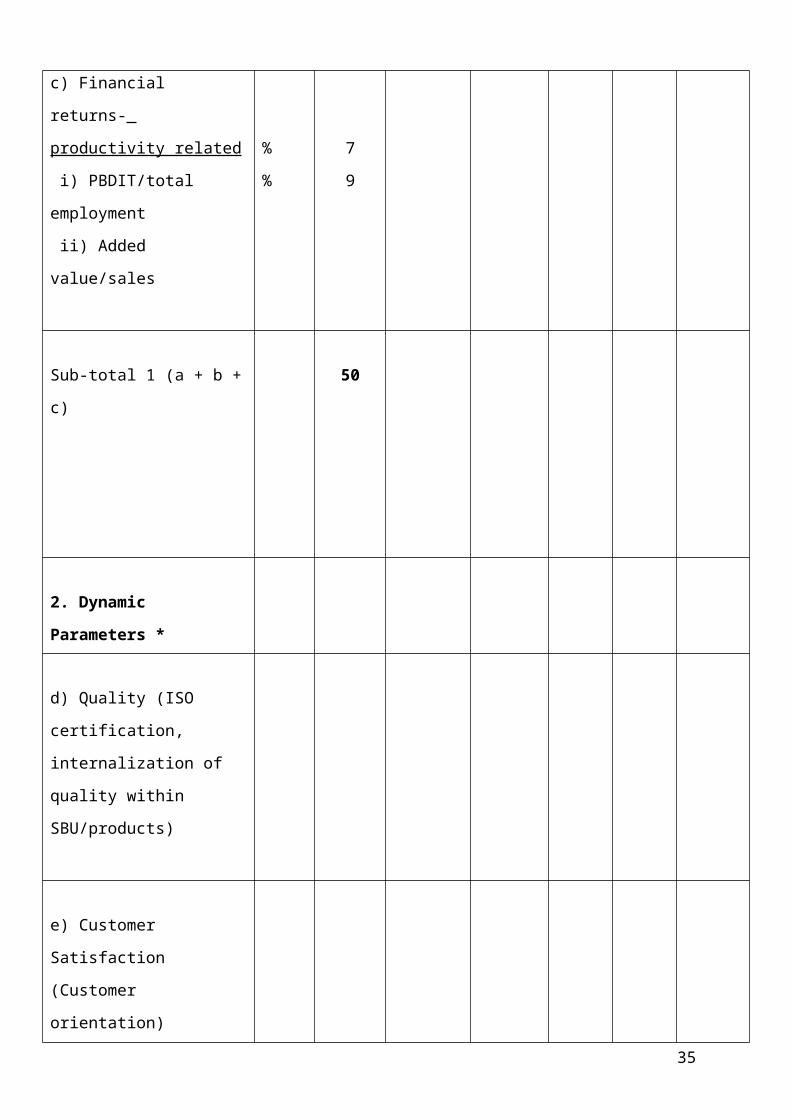
c) Financial returns-
productivity related
i) PBDIT/total employment
ii) Added value/sales
%
%
7
9
Sub-total 1 (a + b + c) 50
22
2. Dynamic Parameters *
d) Quality (ISO certification,
internalization of quality
within SBU/products)
e) Customer Satisfaction
(Customer orientation)
f) HRD (Employee training
and motivation)
g) R&D/ for sustained &
continuous innovation
h) Project implementation
(modernization and
expansion)
i) Capital
Expenditure/Greenfield
investments/Joint Ventures
j) Extent of globalization
(internationalization, joint
ventures, exports, strategic,
market presence in emerging
economies,
internationalization along
value chain)
23

k) Corporate Social
Responsibility (CSR)
l) Sustainable Development
m) Corporate Governance
Sub-total (d + e + f + g + h +
i + j + k + l + m)
3. Sector-specific
Parameters
4. Enterprise-specific
Parameters
Total (1+2+3+4) 100
*Means of verification of non financial targets under dynamic parameters should be
specified by CPSE
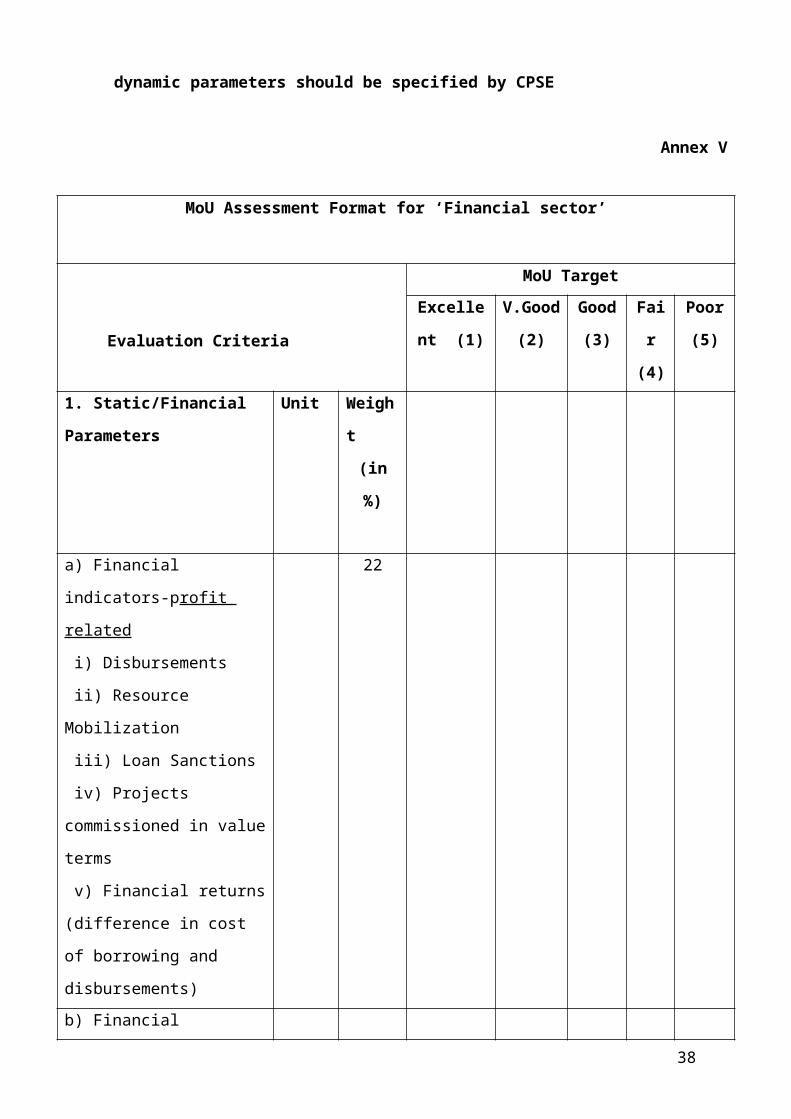
Annex V
MoU Assessment Format for ‘Financial sector’
Evaluation Criteria
MoU Target
Excellent
(1)
V.Good
(2)
Good
(3)
Fair
(4)
Poor
(5)
1. Static/Financial
Parameters
Unit Weight
(in %)
24
a) Financial indicators-profit
related
i) Disbursements
ii) Resource Mobilization
iii) Loan Sanctions
iv) Projects commissioned in
value terms
v) Financial returns
(difference in cost of
borrowing and disbursements)
22
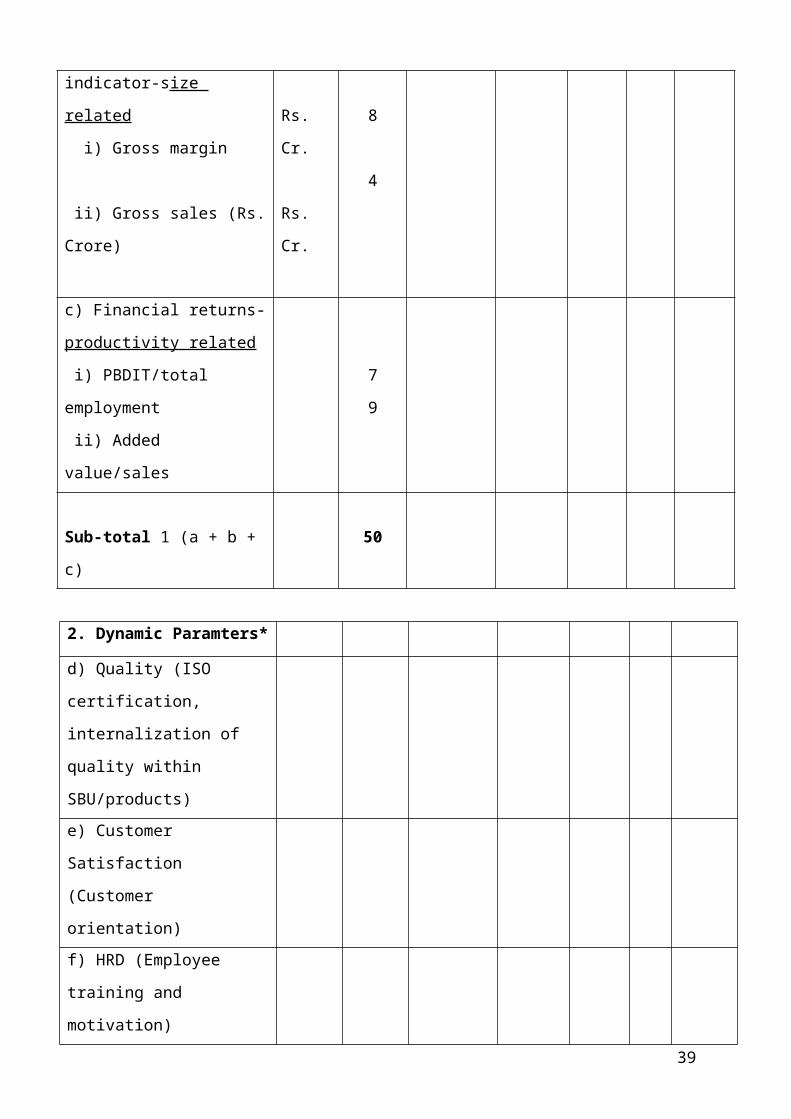
b) Financial indicator-size
related
i) Gross margin
ii) Gross sales (Rs. Crore)
Rs. Cr.
Rs. Cr.
8
4
c) Financial returns-
productivity related
i) PBDIT/total employment
ii) Added value/sales
7
9
Sub-total 1 (a + b + c) 50
2. Dynamic Paramters*
d) Quality (ISO certification,
internalization of quality
within SBU/products)
e) Customer Satisfaction
(Customer orientation)
f) HRD (Employee training
and motivation)
g) R&D/for sustained &
continuous innovation
25
h) Project implementation
(modernization and expansion)
i) Capital Expenditure/
Greenfield investments/Joint
Ventures
j) Extent of globalization
(internationalization, joint
ventures, exports, strategic,
market presence in emerging
economies, internationalization
along value chain)
k) Corporate Social
Responsibility (CSR)
l) Sustainable Development
m) Corporate Governance
Sub-total
(d+e+f+g+h+ i+j+k+l+m)
3. Sector-specific Parameters
4. Enterprise -specific
Parmeters
Total (1+2+3+4) 100
*Means of verification of non financial targets under dynamic parameters should be
specified by CPSE
26
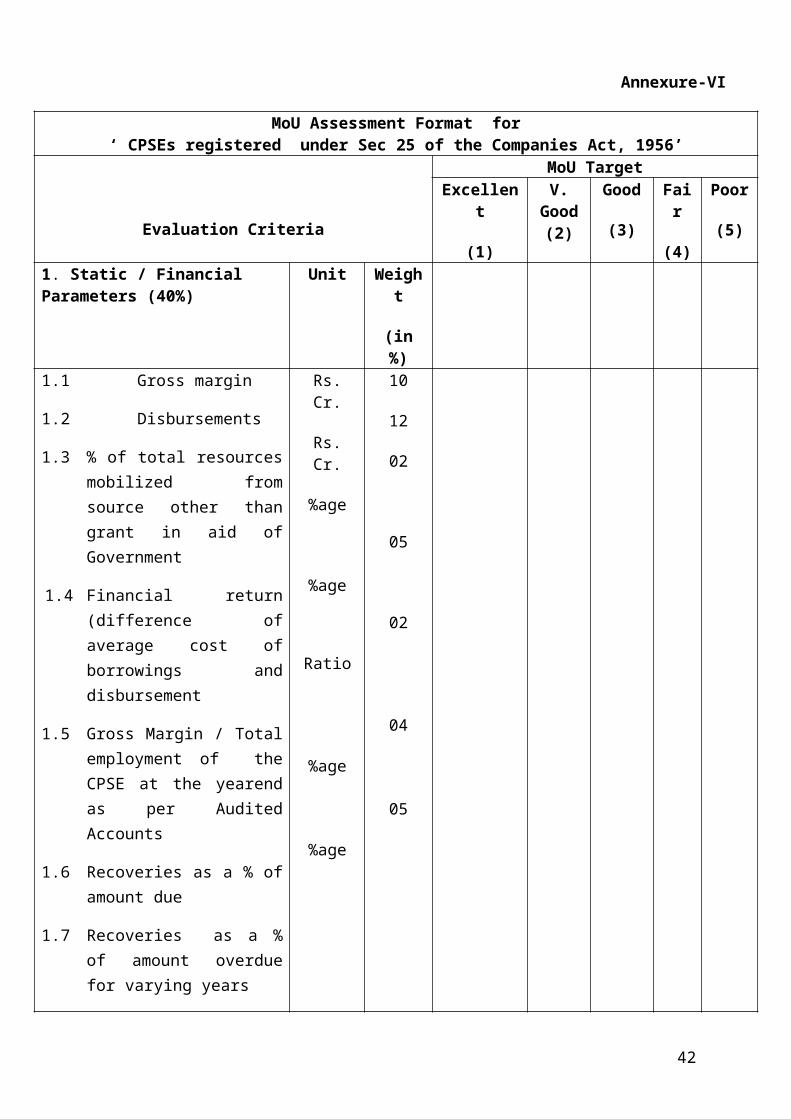
Annexure-VI
MoU Assessment Format for ‘ CPSEs registered under Sec 25 of the Companies Act, 1956’
Evaluation Criteria
MoU Target Excellent
(1)
V. Good
(2)
Good
(3)
Fair
(4)
Poor
(5)1. Static / Financial Parameters (40%)
Unit Weight
(in %)1.1 Gross margin
1.2 Disbursements
1.3 % of total resources mobilized from source other than grant in aid of Government
1.4 Financial return (difference of average cost of borrowings and disbursement
1.5 Gross Margin / Total employment of the CPSE at the yearend as per Audited Accounts
1.6 Recoveries as a % of amount due
1.7 Recoveries as a % of amount overdue for varying years
Rs. Cr.
Rs. Cr.
%age
%age
Ratio
%age
%age
10
12
02
05
02
04
05
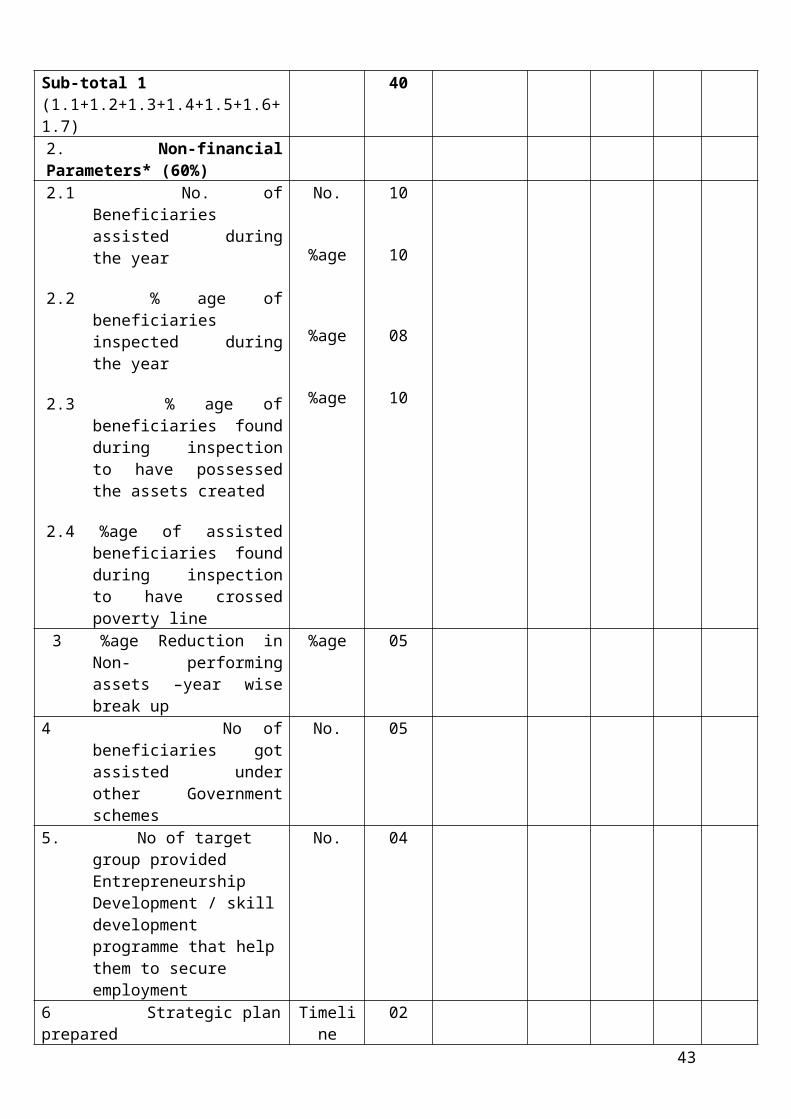
Sub-total 1 (1.1+1.2+1.3+1.4+1.5+1.6+1.7)
40
2. Non-financial Parameters* (60%)2.1 No. of Beneficiaries assisted
during the year
2.2 % age of beneficiaries inspected during the year
2.3 % age of beneficiaries found during inspection to have possessed the assets created
2.4 %age of assisted beneficiaries found during inspection to have crossed poverty line
No.
%age
%age
%age
10
10
08
10
27
3 %age Reduction in Non- performing assets –year wise break up
%age 05
4 No of beneficiaries got assisted under other Government schemes
No. 05
5. No of target group provided Entrepreneurship Development / skill development programme that help them to secure employment
No. 04
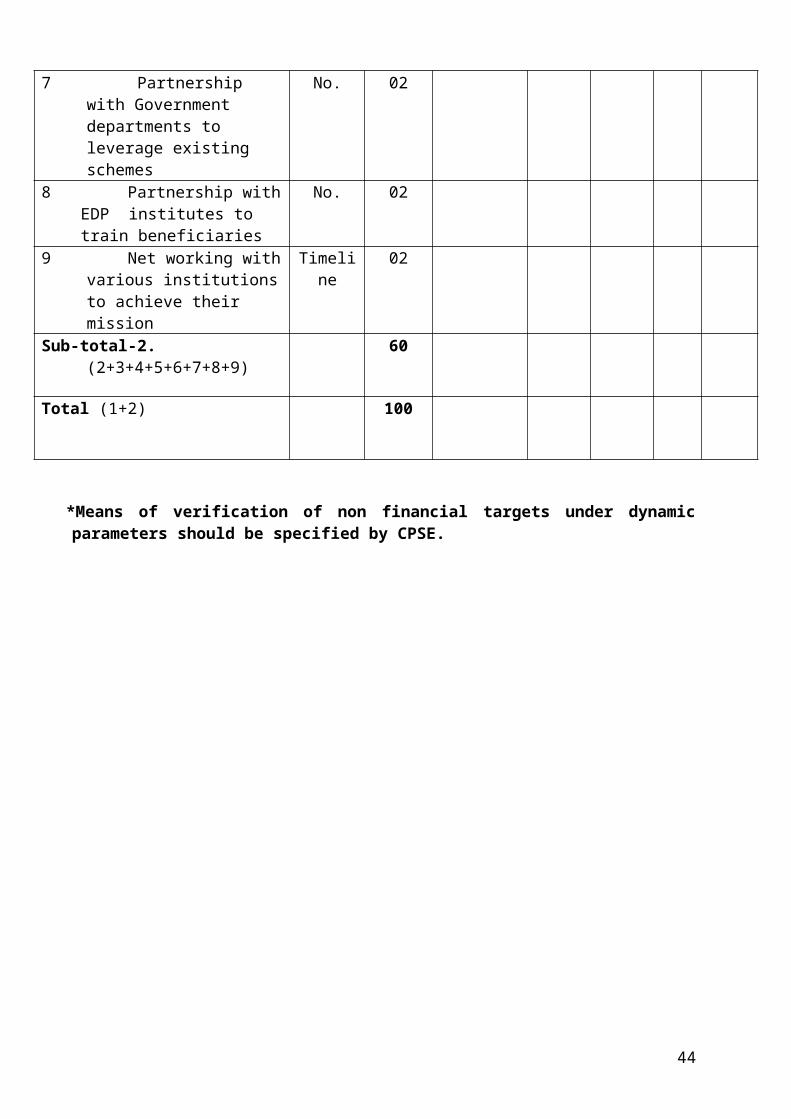
6 Strategic plan prepared Timeline 027 Partnership with Government
departments to leverage existing schemes
No. 02
8 Partnership with EDP institutes to train beneficiaries
No. 02
9 Net working with various institutions to achieve their mission
Timeline 02
Sub-total-2. (2+3+4+5+6+7+8+9) 60
Total (1+2) 100
*Means of verification of non financial targets under dynamic parameters should be specified by CPSE.
28
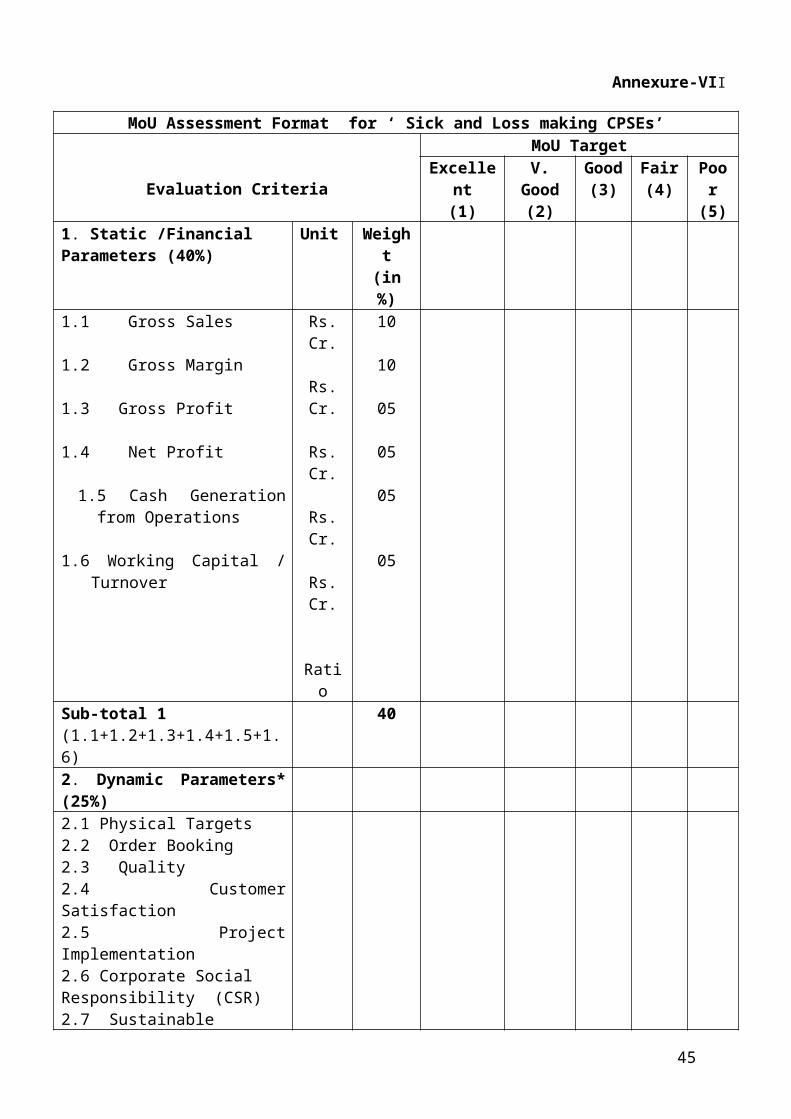
Annexure-VII
MoU Assessment Format for ‘ Sick and Loss making CPSEs’
Evaluation Criteria
MoU Target Excellent
(1)V.
Good (2)
Good(3)
Fair(4)
Poor(5)
1. Static /Financial Parameters (40%)
Unit Weight(in %)
1.1 Gross Sales
1.2 Gross Margin 1.3 Gross Profit
1.4 Net Profit
1.5 Cash Generation from Operations
1.6 Working Capital / Turnover
Rs. Cr.
Rs. Cr.
Rs. Cr.
Rs. Cr.
Rs. Cr.
Ratio
10
10
05
05
05
05
Sub-total 1 (1.1+1.2+1.3+1.4+1.5+1.6)
40
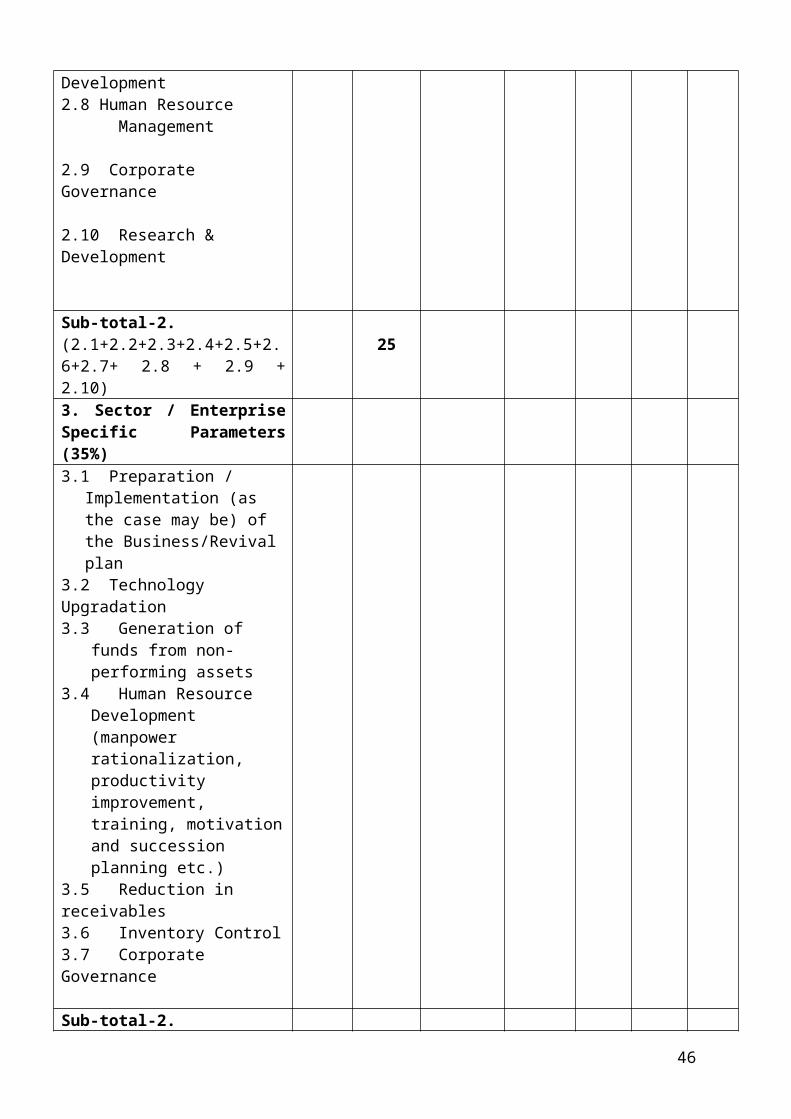
2. Dynamic Parameters* (25%)2.1 Physical Targets 2.2 Order Booking2.3 Quality 2.4 Customer Satisfaction2.5 Project Implementation2.6 Corporate Social Responsibility (CSR)2.7 Sustainable Development2.8 Human Resource Management
2.9 Corporate Governance
2.10 Research & Development
Sub-total-2. (2.1+2.2+2.3+2.4+2.5+2.6+2.7+ 2.8 + 2.9 + 2.10)
25
3. Sector / Enterprise Specific Parameters (35%)3.1 Preparation / Implementation
(as the case may be) of the Business/Revival plan
3.2 Technology Upgradation3.3 Generation of funds from
non-performing assets
29
3.4 Human Resource Development (manpower rationalization, productivity improvement, training, motivation and succession planning etc.)
3.5 Reduction in receivables3.6 Inventory Control3.7 Corporate Governance
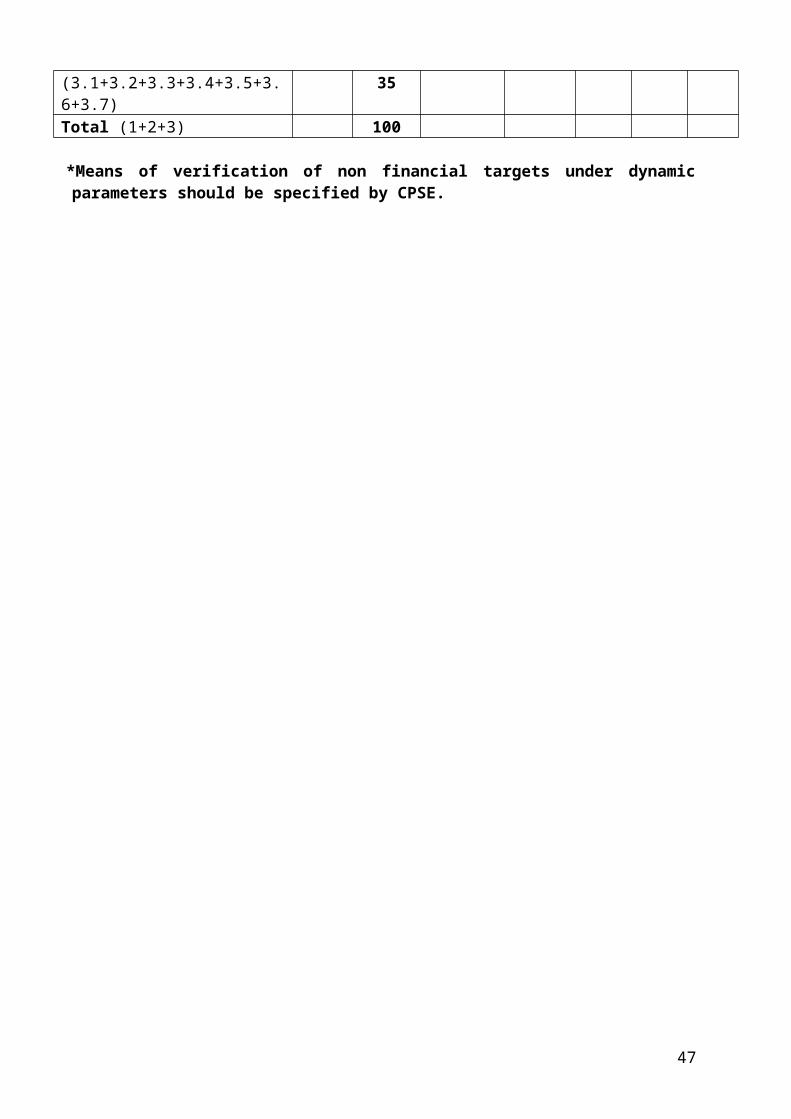
Sub-total-2. (3.1+3.2+3.3+3.4+3.5+3.6+3.7) 35Total (1+2+3) 100
*Means of verification of non financial targets under dynamic parameters should be specified by CPSE.
30
Annex VIIIMoU Assessment Format for ‘CPSEs Under Construction’
Evaluation Criteria
MoU Target
Excellent (1)
V. Good(2)
Good(3)
Fair(4)
Poor(5)
1. Project Related
Parameters
Unit Weight
(in %)
1.1 Physical Achievement
(Time over run)
1.2 Project Cost (Cost over
run)
25
25
Sub-Total (a+b) 50
2. Dynamic Parameters *
2.1 Corporate Plan/Vision
2.2 Project Implementation
2.3 Corporate Social Responsibility (CSR)
2.4 Sustainable Development
2.5 Human Resource Management
2.6 Corporate Governance
2.7 Research DevelopmentSub-Total (2.1+2.2+2.3+ 2.4+
2.5+2.6+2.7)
3. Sector Specific Variables
4. Enterprise Specific
Variables
Total (1+2+3+4) 100
*Means of verification of non financial targets under dynamic parameters should be
specified by CPSE
31

Annexure-IX
(Rs. in Crore)
TREND OF CPSE’s PERFORMANCE ON FINANCIAL PARAMETERS FOR THE LAST FIVE YEARS
Particulars 2006-07 2007-08 2008-09 2009-10 2010-11 2011-12
MoU ACTUAL MOU ACTUAL MOU ACTUAL MOU ACTUAL MOU Projected as
on 31.3.2011
Projected
Production
Gross Sales
Gross Margin
Profit before tax
Gross Block
Less dep
Net block
share capital of CPSEReserves & surplus of CPSE Less deferred revenue exp. / pre-acquisition lossLess Profit & Loss A/cNet worth of CPSEInvestment
32
Sundry debtors/salesInventory
Total Current assets Total current liabilities & provision Net current assets
Capital employed ( Net block + net current assets)Total debt (loan funds)total assets
No of employess of CPSEDividend paid
Add value ( gross margin less capital recovery factor 4% of capital employed for social sector and 10% for other CPSE) Ratios
Debt/equity
Return on Net worth ( % age)
33
PBDIT/ Total employment of CPSE (Rs.)Gross Profit/Capital employed (% age)Net Profit / Net Worth (% age)Working of gross marginNet profit
Tax
Net profit before taxadd Prior period
add extra ordinary itemsProfit before prior periodadd Interest
Gross profit
add depreciation
Misc. expenditure written off Gross Margin before Interest, depreciation & misc. expenditure written off
34
Additional for Fiinancial Sector
Financial Indicator-profit relatedi) Disbursement
ii) Resource Mobilisation iii) Loan sanctions
iv) Project Commissioned in value termsv) financial return ( difference of cost of borrowing & disbursementAdditional for 'Trading & Consultancy Sector’i) Gross margin/ gross salesii) Operating turnover/ Total No of employee of CPSE
Gross margin - profit before interest, depreciation, tax including deferred
35
tax, amortisation, prior period adjustment a/c & extra ordinary items - Rs in CroresNet profit after tax but before extra ordinary items and prior period adjustment a/cAdded Value ( Rs in crores)
36
ANNEXURE-X
Self declaration/certification by CPSE
It is hereby certified that the targets and actual achievements in respect of financial parameters
have been worked out as per MoU Guidelines by adopting the norms and definitions laid down
in MoU Guidelines for the year 2011-12. In case, any deviation is found at the time of
appraisal of performance, DPE is free to evaluate as per audited accounts as per MoU
Guidelines. CPSE has no right of claim in this regard.
Authorised Signatory
37
Annexure-XI
TEMPLATE FOR CSR REVIEW
(Top 5 and other projects)
Sl. No.
Name of the Project
Starting date
Completion date
Amount allotted
Date of completion & Name of Agency for need assessment / Base line services
Name of implementing agency and date of appointment
Amount spent on documentation and dissemination
Name of monitoring agency
Brief details of evaluation report (separate sheet to be attached)
(1) (2) (3) (4) (5) (6) (7) (8) (9) (10)1.2.3.4.5.6. Other
sTOTAL
TABLESl.No. Item `1. PAT for the year under review2. CSR expenditure as percentage of PAT3. CSR expenditure as percentage of minimum prescribed 4. Unspent Balance amount of CSR Budget rolled over to
the following year.5. Contribution to CSR HUB as percentage of CSR budget6.
ENCLOSURES TO TABLE1. 5 samples of detailed documentation/ publicity material/ dissemination material to be attached – one for each of the 5 projects listed in Template.2. Evaluation reports for 5 selected projects indicated in Template to be attached.
38
Economy & Industry OutlookA Report on CMIE’s Projections for Second Half of 2010-11 and First Half of 2011-12 as on November 2010
Annexure XII
Compiled by :
Centre for Monitoring Indian Economy (CMIE) at
Department of Public Enterprises (DPE)
39
November 2010
Contents:S.No. Particular Sectors Page No.1. GDP Growth 32. Outlook of Indian Industries 8
2.1 Cotton & blended yarn 132.2 Fertilizer 152.3 Pesticides 172.4 Drugs & Pharma 18
3. Mining & Metals3.1 Steel 203.2 Aluminum & its products 233.3 Copper & Its Products 253.4 Sponge Iron 28
4. Petroleum4.1 Crude Oil and Natural Gas 314.2 Petroleum Products 344.3 LNG Distribution 365 Industrial
5.1 General Purpose Machinery 375.2 Boilers & turbines 395.3 Tractors 415.4 Construction Equipment 425.5 Construction & allied activities 435.6 Polymers 455.7 Cement 475.8 Newsprint & Paper Products 495.9 Two wheeler & three wheeler 51
6. Energy6.1 Electricity 53
7. Transport7.1 Shipping 557.2 Aviation 577.3 Hotels 59
8. Financial Service8.1 Asset Financing Service 61
9. Electronics & Communication9.1 Telecommunication Services 649.2 Generators, Transformers &
Switch Gears66
GDP Growth*
40
GDP to grow by 9.2%in 2010-11 : The Indian economy has grown at an impressive pace of over 8.5 per cent in the two quarters ended June 2010. CMIE believe that this pace of growth will be sustained in the coming quarters as well. Our confidence is based on a smart recovery in the agricultural sector, and impressive growth in the manufacturing and services sectors. CMIE expects the Indian economy to clock a 9.2 per cent growth in real GDP in 2010-11. It had grown by 6.7 per cent in 2008-09 and 7.4 per cent in 2009-10 on account of an adverse impact of external factors and poor performance of the agricultural sector because. Manufacturing production, mining & quarrying and export growth rates are projected to moderate in the second half of fiscal 2010-11, although they will continue to remain robust.
Growth in real Gross Domestic Product at factor cost (%): By economic activity
2005-06
2006-07
2007-08
2008-09
2009-10
2010-11 Forecast
Agriculture,forestry & fishing 5.2 3.7 4.7 1.6 0.2 5.7Agriculture 5.6 3.8 5 1.1 -0.5 6.3Forestry & logging 2 3 2.2 2.9 3.3 2.5Fishing 5.7 3 6 6.3 5.4 5Industry 9.3 12.7 9.5 3.9 9.2 9.4Mining & quarrying 1.3 8.7 3.9 1.6 10.6 8.2Manufacturing 9.6 14.9 10.3 3.2 10.8 9.4Electricity, gas & water supply 6.6 10 8.5 3.9 6.5 7.3Construction 12.4 10.6 10 5.9 6.5 10.2Service 11.1 10.2 10.5 9.8 8.6 10Trade, hotel, tranp. Storage &commun. 12.1 11.7 10.7 7.6 9.3 11.9Trade,hotel & restaurant 12.4 11.2 9.5 5.3 7.3 10.4Trade 11.8 10.8 9.2 6.3 7.3 10.5Hotels & resaurant 17.8 14.6 12.8 -3.5 7 9Transport, storage & communication 11.5 12.6 13 11.6 12.9 14.5Railways 7.5 11.1 9.8 8.6 7.5 8.7Transport by other means 9 8.8 7.9 5.9 6.5 8.3Storage 4.7 9.9 4.6 11.6 10 9Communication 22.5 25.3 28.4 25.7 27 26Fin.,insu., real est. & business serv. 12.8 14.5 13.2 10.1 9.7 9.2Banking & insurance 15.9 21.1 16.8 13.9 10 9.5Real est.,ownership of dewellings & business services 10.8 10.1 10.5 7.1 9.5 9Community, social & personal services 7.6 2.6 6.7 13.9 5.6 7Public administration & defence 3.6 0.8 7.4 22.1 5.7 5Other community & personal services 10.6 3.9 6.3 8.2 5.5 8.6Gross domestic product at Factor cost 9.5 9.7 9.2 6.7 7.4 9.2
*Note : The data and excerpts in the above report have been taken from EIS:Monthly Review (November 2010) IMF and ADB revise India’s GDP growth projection in 2010 upwardThe International Monetary Fund (IMF) and the Asian Development Bank (ADB) have given a thumbs up to the Indian Economy. The IMF, in its World Economic Outlook published in October 2010, pointed out that India’s macroeconomic performance has been vigorous, with industrial production at a two-year high. Leading indicators like the production manufacturing index and measures of business and consumer confidence continue to point upward, it said. The real GDP growth is projected at 9.7 per cent in 2010 and 8.4 per cent in 2011, led increasingly by domestic demand. Robust corporate profits and favourable external financing are expected to encourage investment. The Asian Development Bank (ADB) has revised India’s GDP growth projection for 2010-11 upward to 8.5 per cent in September 2010, from 8.2 per cent estimated in
41
the outlook released in April 2010. For 2011-12, it has maintained its earlier projected growth of 8.7 percent. Sustained business optimism and rebounded corporate earnings in the second half of 2009-10 are likely to support new investment, despite a hardening of interest rates in recent months. According to Asian Development Bank, projected average inflation will remain elevated at 7.5 per cent in fiscal 2010-11 despite sequential falls in the year-on-year rate. As nonfuel commodity prices slacken in 2011 and domestic production and stock of foodgrains remain comfortable, overall inflation is expected to moderate to 5.5 per cent.The World Bank released its South Asia Economic Update 2010 on 7 June 2010. In the release the bank revised India’s real GDP growth to 8.5 per cent in 2010-11 from 7.5 per cent projected in January 2010. The OECD, in its Economic Outlook released in May 2010, has placed India’s real GDP growth at 8.3 per cent in 2010-11 and 8.5 per cent in 2011-12. This is a sharp upward revision from 6.1 per cent and 7.2 per cent, respectively, projected in November 2009. In May 2010, the United Nations (UN) updated the World Economic Situation and Prospects 2010 report, released in January 2010. In this update, India’s real GDP growth to 7.9 per cent in 2010 from 6.5 per cent projected in January 2010. For 2011, the growth has been placed at 8.1 per cent.Outlook – Indian Industry.
India’s GDP growth (%): Projections of CMIE and other organisations Release Month Year ending March 2010 2011RBI July-10 8.5EAC to PM July-10 8.5IMF@ July-10 5.7 9.7CMIE Feb-10 7.1 9.2ADB Apr-10 8.2 8.5World Bank Jun-10 7.4 8.5Morgan Stanley Feb-10 7.1 8.5Citigroup Feb-10 7.2 8.4FICCI Apr-10 8.4OECD May-10 6.6 8.3Moody’s Jan-10 7.5 8.3Standard charted Bank Apr-10 7 8.1EIU Mar-10 7.7 8United Nation @ May-10 6.4 7.9@ = Year ended December of the preceding year; AEC = Economic Advisory Council to PM
Dubious IIP zooms by 13.8%in July 2010Industrial output, measured by the Index of Industrial Production (IIP), grew by 13.8 per cent in July 2010, after recording a 7.2 per cent growth in July 2009. This is an exceptionally high growth. The IIP had reported steeper 15.7 per cent rise during December 2009-April 2010. But, this growth had come after a meagre 0.5 percent rise in the year-ago period. The main driver of the IIP growth in July 2010 was the manufacturing sector, which reported a 15 per cent rise in production. The output of machinery grew the most, by 49.4 per cent.
IIP rises by 11.4% in April-July 2010 (y-o-y % change)
Weight (%)
Jan-10
Feb-10
Mar-10
Apr-10
May-10
Jun-10
Jul-10
Apr08-Jul08
Apl09-Jul09
Apl10-Jul10
Mining & quarrying 10.47 15.3 11 12.3 12 10.1 8.5 9.7 3.7 7.3 10.1Manufacturing 79.36 17.4 15.7 15.3 16.4 12 5.8 15 6 4.4 12.2Food products 9.08 -3.4 14.4 26.5 25.1 7.4 7.3 9.1 -4.8 -13.6 12.4Beverages & tobacco 2.38 1.4 2.7 2.4 -4.8 -7.6 -0.9 -2.1 26.4 -3.9 -3.9Cotton textiles 5.52 9.8 11.5 8 6.1 7 7.5 12. 2.2 -1.1 8.2
42
1Wool,,silk & man-made txtl. 2.26 4.9 -6.4 -4.6 -4.6 0.9 2 1.2 2.2 11.1 -0.1
Jute textile 0.59-
89.3-
63.8 -9.6 1.1 26.6 3019.
3 -6.2 -19.4 17.6Textile products 2.54 6.8 1.2 -0.3 1.3 5.6 -0.7 6.5 7.6 1.5
Wood products 2.7 14.2 7.7 16.9-
14.4 -5.7 -7 -9.4 -11.1 11.2 -9.2Paper products 2.65 8.8 12.4 7.5 10.4 6.4 3.3 7.3 2.9 3.1 6.7
Leather products 1.14 -2.6 14 12 2.7 12.4-
10.2 -1.8 3.2 1.2 0.1Chemical products 14 6 4.8 5.5 9.1 7.6 3.4 2.5 9.5 3.2 5.5Rubber, plastic, petro. & coal Prod. 5.73 26 13.3 15.1 19.2 15.6 12.6
19.4 -3.1 11.1 16.7
Non-metallic mineral prod. 4.4 16.6 11.6 6.2 3.1 5.6 3.2 1.2 7.8 3Basic metals 7.45 12 7.9 16.3 10.9 9.4 -0.5 4.6 6 6.7 5.9Machinery & equipments 9.57 43.8 40 23.5 43.3 24.7 1.5
49.4 9.3 8.4 28.8
Transport equipments 3.98 57.9 36 29 32.6 25.2 22.9
24.9 12.2 7.9 26.3
Miscelleneous industries 2.56 9.1 -0.1 40 32.7 27.6 12.2
31.1 -3.6 10.4 25
Electricity 10.17 5.6 7.3 8.3 6.9 6.4 3.5 3.7 2.6 5.4 5.1
General 100 16.3 14.7 14.5 15.2 11.3 5.813.
8 5.6 4.7 11.4Basic goods 35.57 11.5 8.5 10.8 9.2 8.2 3.1 5.1 3.6 5.9 6.4Capital goods 9.26 53.7 44 30.8 55 34.2 -0.3 63 10.4 1.9 35.6Intermediate goods 26.51 21.9 14.8 13.4 10.8 10.1 8.9 9.1 2.7 8.1 9.7Consumer goods 28.66 3 8.4 11 12.3 7.4 8.5 6.7 7.9 1.9 8.7
Consumer durables 5.37 31.7 30.3 32.8 32.7 23.7 27.822.
1 6.1 17.3 26.4Consumer non- durables 23.3 -4.7 1.6 3.7 5.2 1.4 1.5 0.5 8.5 -2.8 2.1
A whopping 517.7 per cent growth in production of insulated wires & cables pulled up the overall growth in machinery production. Similarly, massive 57.4 per cent rise in production of PVC pipes & tubes pulled up the growth in the rubber, plastic, petroleum & coal products group by 19.4 per cent. The growth in above-mentioned items looks unusually high and unprecedented. It brings the credibility of the IIP as an indicator of industrial output under question.IIP overestimated growth in 2009-10The Index of Industrial Production (IIP) failed to correctly capture the magnitude of rise in industrial production in 2009-10. As per the IIP data, the rise in manufactured products output in 2009-10 was 10.9 per cent. However, CMIE believes that there was no growth or it was much slower.As per Prowess, CMIE’s corporate sector database, the nominal sales of the manufacturing sector grew by a meagre two per cent in 2009-10. The rise in sales volumes is likely to have been even lower or there could have been a fall in sales volumes. This is because the inflation in manufactured products during the year (measured by the WPI) was three per cent.The factors that will drive the growth in industrial production are:• Rise in income: CMIE expects the income in hands of urban and semi-urban consumers to rise because of an 18.1 per cent increase expected in corporate wages and 27 per cent increase in
43
salaries of government employees. Income level of the rural population is also expected to increase backed by a 7.2 per cent rise expected in agricultural crop production and increase in minimum support prices (MSPs) for various crops. • Lower inflation: CMIE expects inflation at the consumer level to reduce to 8.4 per cent in 2010-11 from 12.4 per cent in 2009-10. A rise in income and fall in inflation will improve purchasing power of Indian consumers.• Improvement in availability of inputs: CMIE expects agricultural output to rise by 7.2 per cent in 2010-11, as against a 6.6 per cent fall in 2009-10. Output of mined products is also expected to grow by a healthy 8.2 per cent in 2010-11. This will ensure that there is no scarcity of inputs for industrial production.• Capacity additions: CMIE expects projects worth Rs.5.5 lakh crore to be commissioned in 2010-11. This will be the highest project commissioning in a single year. The commissioning of these capacities will ensure that there are no capacity constraints in most industries. The capital formation will trigger demand for construction related items and machinery.GFCF to grow by 12%in 2010-11We expect the real gross fixed capital formation (GFCF) to increase by 12 per cent during 2010-11, as compared to a 7.2 per cent increase recorded in the preceding fiscal. Our CapEx database reveals that projects worth Rs.6.5 lakh crore are scheduled to be completed during the year. This is expected to create demand for machinery and equipment. Thus, we expect that capital formation in the form of machinery and equipment will rise by 13 per cent during 2010-11, as compared to en estimated 6.4 per cent in 2009-10.In the first half of 2010-11, the GFCF is estimated to have gone up by 10 per cent, largely because of a rise in demand for machinery and equipment. According to the IMF, “the interest rate in advanced countries is likely to remain low for a prolonged period and sustain flows to emerging markets, provided the global financial condition remains relatively stable.”This is expected to keep liquidity at a reasonable level. We expect the growth in GFCF to accelerate in the remaining two quarters of the current fiscal. The Capex database reveals that investment activities will remain robust during this period. Projects worth Rs.1.14 lakh crore were completed during April September 2010. This amount is expected to go up significantly to Rs.5.4 lakh crore in the remaining months of the current fiscal, which will create demand for machinery and equipment.PFCE to grow by 6.5%in 2010-11In the quarter ended June 2010, the growth in private final consumption expenditure (PFCE) was much lower than our expectation. Hence we have revised our growth forecast for PFCE during 2010-11 downward to 6.5 per cent from our earlier estimate of 8.6 per cent.In second quarter ended September 2010, growth in the PFCE is estimated to have been good. This conclusion is drawn from a robust 41 per cent rise in excise duty collections during April-September 2010, compared to a 22 per cent decline in the corresponding period of 2009.In the remaining three quarters we expect the PFCE to grow by 7.3 per cent. Following factor are expected to contribute to this growth:
In the third quarter ending December 2010, agricultural income is projected to grow by a robust
7.8 per cent. This will be fuelled by a higher growth in kharif 2010 crop production, a hike in MSP and higher market prices of agricultural items.
An increase of 18 per cent and 27 per cent, respectively, in the wages and salaries of in the corporate sector and of government employees.
44
An expected deceleration in consumer price inflation in the remaining months of the current fiscal.
Outlook of Indian Industries
Industrial output to remain buoyant during 2010-13
The growth in industrial production picked up from the second half of 2009-10 and remained buoyant in the first half of 2010-11. This is evident from the over 20 per cent rise in nominal sales of the manufacturing companies listed on the Indian bourses. We expect the industry to remain on a high growth trajectory for at least the next two-and-a-half years.The growth in industrial production is expected to be driven by rise in both, consumption demand and investment demand. We expect the investment demand to grow by 12 per cent in 2010-11, as compared to a 7.2 per cent growth in 2009-10. The industry is expected to see record commissioning of projects worth Rs.5.5 lakh crore in 2010-11. Projects worth Rs.8.5 lakh crore are scheduled to be commissioned in 2011-12 and worth Rs.8 lakh crore in 2012-13. This will further accelerate the growth in investment demand.We expect the growth in consumption demand to accelerate from 4.3 per cent in 2009-10 to 6.5 per cent in 2010-11 and remain at around 5-6 per cent in following two years. A rise in corporate wages, fresh employment generation triggered by the capacity additions and lower inflation will improve the purchasing power of Indian consumers.We discuss below the growth prospects of the leading industries during 2010-13.Automobiles & ancillaryRising income levels, stable interest rates, easy availability of finance and new model launches are expected to keep the demand for automobiles buoyant. We expect sales volumes of passenger cars and two wheelers to rise by over 20 per cent in 2010-11. The growth is expected to remain at around 15 per cent per annum in the following two years. Sales volumes of commercial
45
vehicles are expected to grow by 15.7 per cent in 2010-11, by 13.5 per cent in 2011-12 and by 11 per cent in 2012 13.Healthy growth in sales of automobiles will lead to a rise in demand for tyres, storage batteries and other automobile components. We expect tyre production to grow at a CAGR of 13.8 per cent, storage batteries production at a CAGR of 12.7 per cent and automobile ancillary production at a CAGR of 18.7 per cent during 2010-13.Cement & other construction related itemsWe expect the construction sector to grow (in real terms) by 10.2 per cent in 2010-11. The growth will remain over 10 per cent per annum in the next two years, owing to the huge capacity additions scheduled during this period.We expect cement production to grow by 9.4 per cent in 2010-11, backed by the huge demand from the infrastructural construction and real estate sectors. The demand for cement will remain buoyant in the following two years, resulting in an around 11 per cent per annum growth in production.Output of ceramic tiles too will grow at around 10 per cent per annum during 2010-13. Healthy demand from the real estate and automobiles sectors will push up production of paints by 8.7 per cent in 2010-11, by 12.3 per cent in 2011-12 and by 14.5 per cent in 2012-13. Machinery Projects worth Rs.22 lakh crore are scheduled to be commissioned during 2010-13. The process of commissioning these projects is expected to generate a huge demand for machinery.Since a bulk of the projects is scheduled to be commissioned in the electricity sector, the demand for power equipments is expected to grow at a rapid pace. We expect transformers production to rise by 30.1 per cent in 2010-11, by 44.3 per cent in 2011-12 and by 16.2 per cent in 2012-13. Boilers production is expected to rise by 25-30 per cent per annum during 2010-13.Production of switchgears, compressors, bearings, cranes and lifts is also expected to rise at a healthy pace during 2010-13.MetalsWe expect steel production to grow by 6.5 per cent in 2010-11. The growth is expected to accelerate to 12.5 per cent in 2011-12 and to 17.5 per cent in 2012-13. Demand for steel in the domestic market will remain strong due to smart growth in the construction, machinery and automobiles sectors. Steel production capacity is expected to double to 137.5 million tonnes by March 2013. The huge capacity additions are expected to help the steel manufacturers ramp up production and cater to the rising demand.A handsome rise in steel production is also expected to lead to a healthy rise in production of pig iron and sponge iron. We expect production of primary aluminium to grow by 9-10 per cent in 2010-11 and 2011-12. The growth will shoot up to 26 per cent in 2012- 13, owing to the capacity additions by Hindalco in the second half of 2011-12. The aluminium production capacity is expected to increase by 9.7 lakh tonnes to 27 lakh tonnes in 2011-12.Crude oil & petroleum products We expect the growth in crude oil production to pick up from 2010-11. Reliance’s KG D6 field and Cairn India’s Mangala oil fields will push up production by 8.3 per cent in 2010-11. Commencement of production from new oil fields by ONGC is expected to lead to an 8.2 per cent rise in crude oil production in 2011-12 and 9.6 per cent 2012-13.This will lead to a slower growth in oil imports. Demand for petroleum products is also expected to rise during 2010-13 because of rising population of automobiles, an 11-16 per cent rise expected in air passenger traffic and speeding up of road construction projects. A rise in demand and capacity additions will lead to a 9-10 per cent growth in petroleum products output in 2011-
46
12 and 2012-13. We expect 714 lakh tonnes per annum of refinery capacity to go on stream during 2010-13.ElectricityWe expect the monitored capacity of electricity generation to rise by a whopping 81,826 mw during 2010-13. Of this, 16,144 mw capacity is expected to come up in 2010-11. The capacity addition will accelerate to 33,031 mw in 2011-12 and 32,651 mw in 2012-13.A majority of this capacity will come up in the thermal electricity segment. The domestic availability of coal will not be enough to utilise the fresh capacity. The industry will increase coal imports substantially and will report a 7.2 per cent growth in electricity generation in 2010-11. The growth will accelerate to 14.7 per cent in 2011-12 and to 13.3 per cent in 2012-13.Textiles We expect demand for apparels from the overseas market to rise during 2010-13. The domestic demand for apparels is expected to rise too, owing to a rise in disposable income in the hands of India consumers. A rise in demand for apparels will provide a boost to the entire value chain of the textile industry. Production of cloth will rise by 5.8 per cent in 2010-11. The growth will inch up to six per cent in 2011-12 and further to seven per cent in 2012-13. Production of yarn is expected to grow by 7-8 per cent per annum during 2011-13.New investment announcements continueIn spite of the huge capacity additions lined up for the next two-and-a-half years, the industry is witnessing announcement of fresh projects. As per CMIE’s CapEx service, new projects worth Rs.9.5 lakh crore were announced in the first half of 2010-11. In October 2010, the service captured 219 more projects. Of these, cost details were available for only 95 projects. The aggregate investment in these 95 projects was Rs.58,916 crore. The continuous flow of fresh investment announcements reflects the confidence of Indian corporate and the foreign companies in the sustainability of the growth in demand.Twenty eight electricity projects, entailing an investment of Rs.26,657 crore, were announced in October 2010. The major projects among these are – 1,980 mw power generation unit of GMR Bundelkhand Energy (worth Rs.14,000 crore) in Madhya Pradesh and 1,320 mw power generation unit of Kazstory Service Infrastructure India (Rs.5,280 crore) in Uttar Pradesh.The other large projects announced in October are – coal mining and electricity generation project of Adani Enterprises worth Rs.11,000 crore, cement project of Ultratech worth Rs.6,000 crore and steel & manganese alloy project of Visa Steel worth Rs.4,025 crore.
Production forecast for major industries Production Growth (%)Industry Unit 2010-11 2011-12 2012-13 2010-11 2011-12 2012-
13Crude oil Lakh
tonnes364.7 396 434 8.3 8.2 9.6
Natural gas Millioncu. meters
55,867 62,093 64,578 17.4 11.1 4
Petroleum Products Lakh tonnes
1,675.60 1,841 2,005 4.6 9.8 8.9
Sugar 000 tonnes 18,800 24,000 26,000 29.3 27.7 8.3Beer 000 liters 14,75,380 16,01,900 17,22,986 11.9 8.6 7.6Indian Made Foreign Liquor
000 liters 14,24,803 15,81,906 17,05,657 13.2 11 7.8
Cigarettes Million nos 1,08,202 1,11,423 1,14,502 2.7 3 2.8Cloth Million sq.
meters62,611 66,406 71,070 5.8 6.1 7
Newsprint Tonnes 10,17,921 11,10,533 12,36,677 7.1 9.1 11.4Paper Tonnes 74,90,084 80,89,921 86,81,911 6 8 7.3Tyres 000 nos 1,13,046 1,27,309 1,43,069 16.4 12.6 12.4
47
Cement Lakh tonnes
2,195 2,432 2,712 9.4 10.8 11.5
Paints & varnishes Tonnes 11,25,867 12,63,958 14,47,528 8.7 12.3 14.5Ceramic tiles Tonnes 26,84,387 29,55,589 32,47,271 9.5 10.1 9.9Bottles Tonnes 9,53,134 10,22,668 10,94,337 6.3 7.3 7Pig iron 000 tonnes 9,237 10,327 12,434 14.8 11.8 20.4Sponge iron 000 tonnes 25,293 28,809 34,110 10 14 18.4Finished Steel 000 tonnes 63,570 71,508 84,054 6.5 12.5 17.5Tubes & pipes 000 tonnes 6,752 7,967 9,083 15 18 14Refined copper Tonnes 7,13,763 7,44,673 7,65,154 4.4 4.3 2.8Aluminium unalloyed ingots
Tonnes 16,77,704 18,28,700 23,04,100 10 9 26
Prime movers Rs. crore 7,552 10,254 13,333 39.1 35.8 30Steam boilers Rs. crore 16,595 21,193 26,557 28.4 27.7 25.3Compressors Numbers 87,02,796 97,13,477 1,05,51,366 15.2 11.6 8.6Ball or roller bearing 000 nos 61,23,668 66,99,293 72,82,131 10.6 9.4 8.7Tractors Numbers 4,93,618 5,54,816 6,04,484 13.9 12.4 9Cranes Tonnes 22,843 25,723 29,559 20.4 12.6 14.9Lifts & elevators Numbers 10,313 12,214 13,370 21.7 18.4 9.5Engines 000 nos 3,512 3,695 3,872 4 5.2 4.8Transformers Mva 2,29,489 3,31,064 3,84,685 30.1 44.3 16.2Switching apparatus 000 nos 2,65,357 3,07,151 3,42,381 20.5 15.7 11.5Storage batteries Lakh nos 575.1 644 728 13 11.9 13Domestic refrigerators 000 nos 11,514 13,300 14,800 19.5 15.5 11.3Commercial vehicles Number 6,57,957 7,60,000 8,38,000 16.1 15.5 10.3Passenger cars Number 25,09,841 29,10,424 33,57,076 20.8 16 15.3Two wheelers Number 1,28,31,456 1,50,32,871 1,74,55,066 22.1 17.2 16.1Three wheelers Number 7,54,166 8,18,800 9,11,916 21.8 8.6 11.4Automobile ancillaries Rs. crore 21,926 25,417 29,662 23.5 15.9 16.7Electricity energy Million
kwh8,27,103 9,48,849 10,75,050 7.2 14.7 13.3
Sector-by-sector income and PAT growth forecasts for 2010-13 (%) Total income (net of P&E) PAT (net of P&E) 2009-10 2010-11
(F)2011-12
(F)2012-13
(F)2009-10 2010-11
(F)2011-12
(F)2012-13
(F)Sugar 40.4 18.2 9.1 7.8 138.2 P-L L-P 21.2Tobacco Products 19.1 15.1 13.7 15.5 25.3 18.3 17.9 22.3Beer & alcohol 16.2 22.1 17.3 18.1 34.3 99.7 40.7 25Paints & varnishes 17.7 19 12.9 16.7 83.3 7.3 -17.8 11.7Tyres & tubes 16.9 25.1 18 15 645.8 -32.2 69.3 32Ceramic products 7.3 22.3 22.5 15.7 -24.9 78 79.7 36.2Aluminium 2.9 21.7 8.3 8.7 -19.8 41.1 19 4.3Copper 8 23 14.1 18.6 -1.4 69.2 13.7 12.9Boilers & turbines 7.3 22.9 21.7 23.3 4 21.5 12.3 25.6Engines -6 28.9 16.5 14.1 17.8 35.1 12.5 8.8Wires & cables 6.8 15.7 19.1 17.3 921.5 -1.8 53.6 16.4Acs & refrigerators 19.2 21.8 17.2 17.7 55.5 11.2 35.4 31.8Storage batteries 7.6 21.4 16.2 15.7 74.9 10 6.5 21.4Computers hardware 6 4.7 12 8.7 D-L I-L L-P 41.8Passenger cars & MUVs
35.5 19.5 16.7 15.9 118.9 6.2 18.1 11.8
Two & three wheelers 26.3 26.2 20.3 19.1 110.9 18.8 18.4 15.7Automobile ancillaries 16.2 26.6 16.8 17.3 83.7 33 22.3 23.9Paper & newsprint -1.8 17.9 13.4 14 -35.9 63.1 24.3 24.3Media-print 3.6 11.1 8.2 7.1 95.3 9.3 -9.1 -2Crude oil & natural gas -7 10.7 17.1 11.9 13.3 9.5 19.6 11.4Hotels & restaurants -11.9 19.2 15 13.5 -53.5 52.7 36.7 28.8Media-broadcasting 13.8 24.3 16.6 12.2 L-P 51.8 9.6 9.9Transport logistics 6.1 11.3 9.8 8.4 -4.7 9.9 11.2 6.3
48
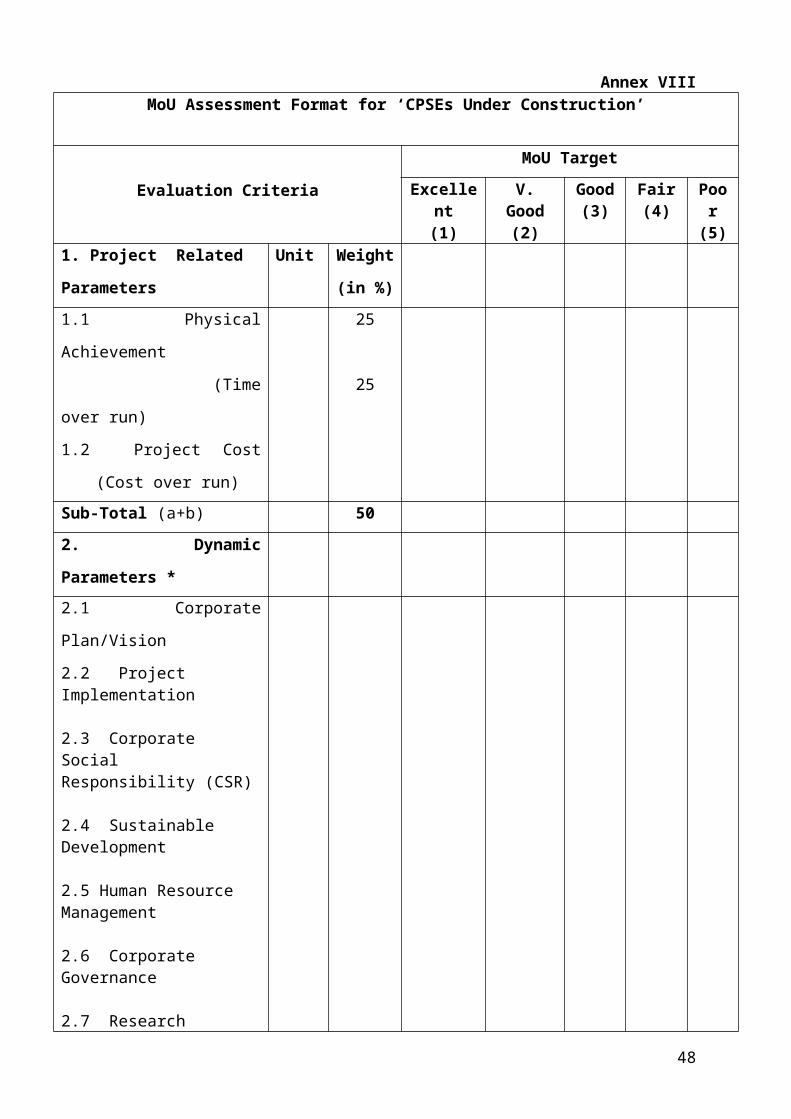
servicesComputer software 5.9 15.8 18 15.2 16.8 17.4 16.6 13Securities broking 25.3 3.3 11.5 10 89 8.5 17.1 15.8
Cotton & blended yarn
Spun yarn production to rise by around 8% during 2010-13
CMIE expects yarn production to grow by 7.1 per cent during 2011-12 and then by 7.9 per cent during 2012-13. The demand for yarn from the fabric segment and integrated apparel makers is expected to remain strong in the next two years as well. Driven by the healthy demand for yarn from fabric makers and integrated apparel companies, production to continue in the coming months. During 2010-11, total spun yarn production is expected to rise by 8.5 per cent to 45.3 lakh tonnes.Although cotton production is expected to dip by a marginal 1.1 per cent during 2011-12 before again rising by 2.6 per cent in 2012-13, the availability of cotton would not pose a problem to the yarn industry. This is because India has been a cotton surplus country and exports 15-20 per cent of cotton output in the global markets. Hence, a minor fall in cotton output is unlikely to affect cotton availability and thus yarn production.Continuous flow of fresh investments in the industry
The demand for yarn from the fabric and integrated apparel companies is expected to remain high over the next few years. To cater to this, companies in the industry are continuously adding capacities. During 2010-13, 36 projects entailing an investment of over Rs.3,950 crore are scheduled to be commissioned. Most of these investments would go towards the setting up of cotton yarn manufacturing facilities. The industry is scheduled to add a capacity of around 10.7 lakh spindles during this period.Industry sales to rise by 29.5%during 2010-11
During 2010-11, we expect the cotton & blended yarn industry to post a healthy 29.5 per cent increase in its sales. This growth will mainly be price driven and would be the highest sales growth recorded in at least the last decade.Cotton prices scaled new highs during October 2010, As a result of this rise in yarn prices; CMIE expects the margins of the industry to improve during the year. The industry’s PBDIT margin is expected to increase by 100 basis points to 14.9 per cent. Its net margin would also rise to 3.8 per cent from 1.9 per cent during 2009-10.
Profit margins of yarn industry to improve in 2010-11 (% change compared to a year-ago)
Mar-09
Jun-09 Sep-09 Dec-09 Mar-10
Jun-10
Sep-10 Estima
te
Dec-10 Forecas
t
Mar-11
Forecast
Jun-11 Forecast
Income -7.1 2.3 8.3 23.3 32.8 32.9 29.6 26 28.8 18.3
Net sales -7.2 2 8.3 23 32.5 33.5 30 26 29 18
Total expenses -8.4 -1.7 2.3 14.4 28.7 30.9 26.9 23.4 28.3 16.7
49
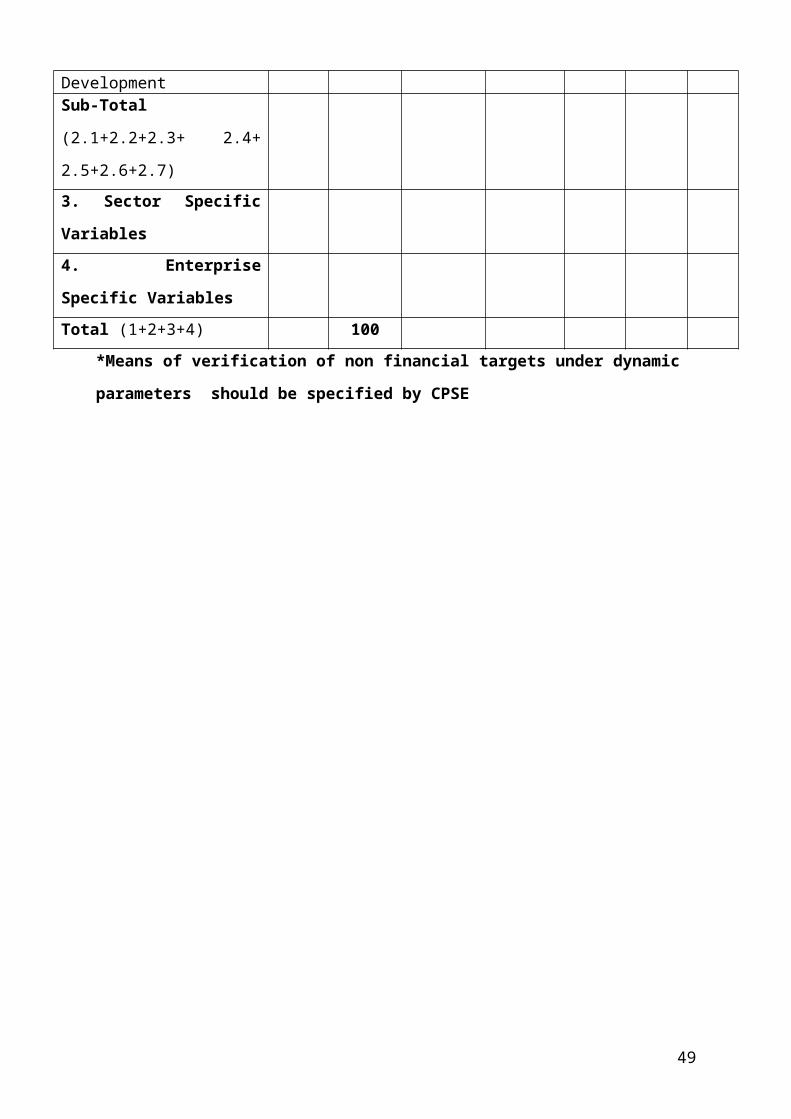
Raw Materials -10.3 -3.5 2.1 19.7 38.3 38.2 33.2 26.5 27 14.2
Salaries & Wages 0.1 4.2 9.4 12.6 13.1 16.7 16.1 23 35.2 21.9
Power & Fuel 0.3 4 11.4 18.7 9.6 11.9 10 7 31.1 20.2
Selling & Marketing -44.4 -29.2 -18.2 61.5 15 8.2 8.7 13.9 11.1 6.6
Other Expenses -14.2 -8.8 -4.1 0.1 17.8 30.3 23.1 22.8 31.5 22.2
Depreciation -0.3 4.5 0.2 0 12.3 4.3 3.9 9.5 12.8 15.1
Interest Expenses 17.8 9.7 -1.3 -4.7 0.6 9.2 13 19.2 25.6 18
Tax Provision 180.9 162.7 245.5 140.7 63.7 106 27.1
PBDIT -29.5 23.8 49.1 153.5 199 67.9 41.3 28.9 23.7 16.1
PAT 209.3 88.1 16.6 11
Other income/Income (%)
1.2 0.7 0.8 0.8 1.5 0.3 0.5 0.8 1.3 0.5
Raw Material/Net Sales (%)
57.2 58.4 58.6 59.7 59.4 60.5 60 60 58.5 58.6
Interest/PBDIT (%) 92.9 48.7 38.8 37 32 31.4 31 34.2 32.5 31.9
PBDIT/Net Sales 5.5 12.1 13.1 13.5 13.6 16 14.6 13.8 13.1 15.5
PBDIT/Income (%) 6.7 12.7 13.8 14.1 14.8 16.2 15 14.5 14.3 15.9
PAT/Income (%) -5.5 -0.7 1.7 2.2 3.9 4.3 4.1 3.2 3.5 4
All income and profit figures are net of prior period and extraordinary transactions. PBDIT is net of other income in PBDIT/Net sales ratio. Growth is not calculated when figures are negative.
Fertilizers
Production to grow at healthy pace in 2011-13CMIE expect the growth in fertilizer production to pick up in the coming months, leading to 6.1 per cent rise in production in 2010-11. The healthy growth in fertilizer production is likely to continue in 2011-13. CMIE expects fertilizer production to grow by 5.9 per cent in 2011-12 and by 8.2 per cent in 2012-13. This is because of three reasons: Capacity additions: In 2011-13, we expect fertilizer industry to witness a huge capacity addition. The installed capacity in the industry is expected grow by 62 lakh tonnes to 514 lakh tonnes.Rise in demand With the increasing use of HYV (High yielding variety) seeds, the consumption of fertilizers is likely to rise. Moreover, the rainfall is expected to remain normal in the coming years, which will lead to higher area under cultivation. Consequently, fertilizer demand will grow by around 5.5 per cent p.a. in 2011-13. Availability of raw materials Production of fertilizers was adversely affected in 2007-09 due to raw material scarcity. However, the situation has improved since 2009-10. As the natural gas production is expected to grow by 11.1 per cent in 2011-12 and by four per cent in 2012-13, we believe that an adequate gas will be available to the fertilizer sector. Moreover, availability of rock phosphate/phosphoric acid is expected to remain normal in the coming years. This will drive fertilizer production upwards.As domestic production of fertilisers is not sufficient to meet aggregate demand, India relies on imported fertilisers. India witnessed a sharp rise in Imports during 2003-09. However, in 2011-13 imports are likely to rise at a slower pace as we expect a healthy growth in fertilizer
50
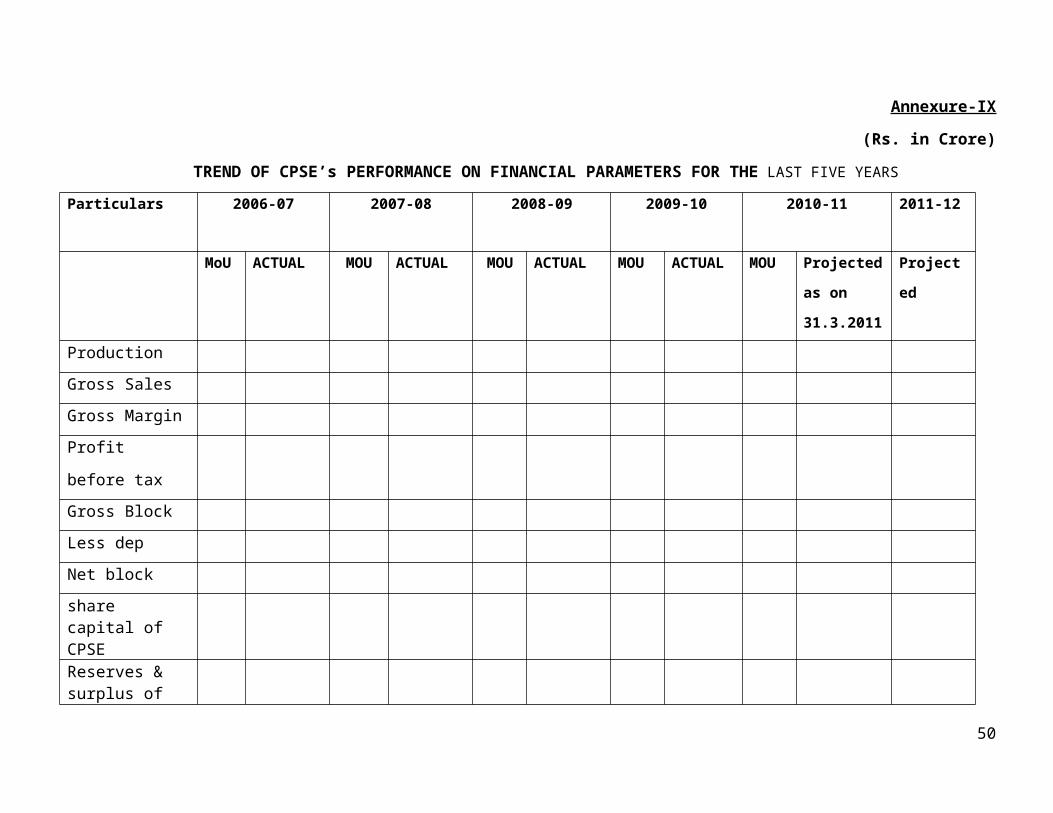
production. In 2011-12, imports will grow by 4.2 per cent to 162 lakh tonnes, whereas in 2012-13, imports will rise by 1.2 per cent to 164 lakh tonnes. Total income to rise by 22.7%in 2010-11, although dissatisfactory performance on profitability front CMIE expect total income of the industry to rise by 22.7 per cent in 2010-11 as against a 23.3 per cent fall reported in 2009-10. Higher volumes and rise in sales realizations will enable the industry to report a double-digit growth in income in 2010-11. However, despite posting a strong income growth, the performance of the industry will not be satisfactory on the profitability front. A sharp rise in raw material expenses will take a toll on the profitability of the industry. In May, the government hiked the APM (Administered Price Mechanism) gas price from USD 1.79 mmbtu (metric million British thermal unit) to USD 4.2/mmbtu. The APM gas accounts for nearly 40-50 per cent of the total gas consumed by the fertilizer industry. Hence, rise in APM gas price will push input cost of the industry upwards. Moreover, prices of phosphoric acid/rock phosphate are also expected to rise by 30-40 per cent compared to a year ago. Consequently, the raw material expenses will grow by 34.2 per cent. Besides, the energy cost of the industry is expected to grow by 25.8 per cent. Consequently, total expenses will grow by 28.3 per cent. With a faster rise in total expenses, the PAT margin of the industry will slip by 20 basis points to 4.3 per cent.
Profit margins of the industry to decline in 2010-11 (% change over year-ago) Mar-
09Jun-09
Sep-09
Dec-09
Mar-10
Jun-10
Sep-10 Estimates
Dec-10 Forecast
Mar-11 Forecast
Jun-11 Forecast
Income 8.2 -9.1 -41.6 -30.1 12.3 5.2 32.8 30.5 18.2 15.5Net Sales 12.9 -9.6 -42.5 -30.3 11.4 5.3 34 30.6 20.8 15.4Total expenses 9.9 -21.5 -39.9 -27.2 -2 19.6 31 31.2 30.2 7.3Raw materials 9.9 -22.8 -46.8 -34.4 -6.7 22.5 39 38 36 6.5Salaries & Wages 40.4 0 -0.1 2.8 -5.3 10.2 11.3 14.5 18.1 10Power & Fuel -5.7 -16.8 -32.7 -6.6 5.6 18.2 29.8 25 29 14Other expenses 4.1 -27.3 -16.1 -7 12 13.6 9.8 15 20 9.9Depreciation 12.7 10.1 6.1 5.7 7.3 5.9 1.5 19 22.7 18.4Interest expenses 30.4 -29.4 -31.6 -36.1 3.8 -8.8 10.3 15 19 16Tax provision 40.6 -42.9 -18.5 10.6 10.2 41.4 8.2 4.3 29.1 -37.6PBDIT -14.3 -10.3 -16.5 14.1 18.1 39.7 5.2 7.6 15.4 -10.8PAT -51.4 46.5 -17.7 68.7 42.5 122.6 3.8 1.2 2.2 -26.4Other income/incomes (%)
1.9 1.9 2.3 1.3 3.6 1.8 1.4 1.1 1.5 1.9
Raw material/Net Sales (%)
61.5 69.4 64.6 66.2 51.5 80.7 67 69.9 58 74.4
Interest/PBDIT (%) 22.1 23.6 14.7 14.4 18.3 15.4 15.4 15.4 18.9 20PBDIT/Net Sales (%) 8.6 7.9 11.1 10.7 8 11.2 9.2 8.7 9.7 8.1PBDIT/Income (%) 10.3 9.6 13.2 11.8 11.3 12.8 10.4 9.7 11 9.9PAT/Income (%) 3 2.6 5.7 5 4.3 5.4 4.4 3.9 3.7 3.5All income and profit figures are net of prior period and extraordinary transactions. PBDIT is net of other income in PBDIT/Net sales ratio. Growth is not calculated when figures are negative.
51
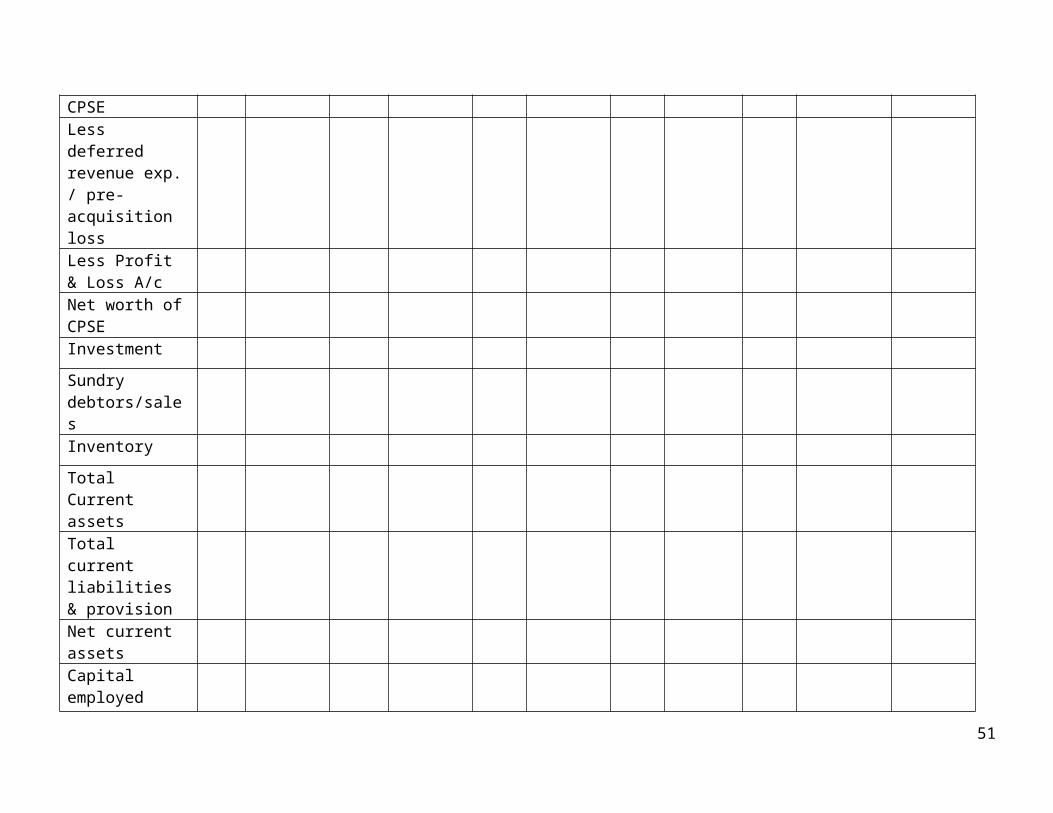
PesticideProduction of pesticides to report modest growth in 2011-13
CMIE expect the pesticides industry to report a more than five per cent growth in production in 2011-13. This is because of two reasons. Firstly, the industry is expected to witness a rise in its installed capacity. CMIE expects nine projects worth Rs.1, 203 crore to get commissioned in 2011-13. Secondly, CMIE expect a rise in pesticides demand assuming rainfall to be normal. CMIE expect output of monocrotophos to rise by six per cent in 2011-12 and by 6.5 per cent in 2012-13. Production of endosulphan will also report modest growth in 2011-13. It will grow by 5.4 per cent in 2011-12 and by 6.7 per cent in 2012-13. Income to grow at healthy pace in 2010-11
CMIE believes that the industry will continue to clock a double digit growth in income in the remaining quarters of 2010-11. In 2010-11, total income is expected to grow by 15.4 per cent as against a 5.1 per cent rise reported in 2009-10. This will be driven by both higher volumes and improved realizations. The performance of the industry will also be satisfactory at the net level. In 2010-11, the raw material expenses are expected to grow at a slightly faster pace (16.1 per cent). With a less than proportionate rise in expenses vis-a-vis income, net profits of the industry will grow by 17.6 per cent and the PAT margin will grow by 20 basis points to 7.3 per cent.
PAT margin to improve in 2010-11 (% change compared to year-ago quarter) Mar-
09Jun-09
Sep-09
Dec-09
Mar-10
Jun-10
Sep-10 Estimate
Dec-10 Forecas
t
Mar-11 Forecas
t
Jun-11 Forecast
Income 18 11.1
-3.1 9.4 4.2 6.7 19.1 19.8 17.6 13.6
Net Sales 19 10.3
-2.7 10.3 6.3 8 19.1 18.9 15.6 13.1
Total expenses 21.7 11 -8.6 -6.1 3.8 10 22 16.3 14.5 12.9Raw materials 18.9 16.
1-8.6 -10.6 3.1 6.1 24.5 19 18 14.4
Salaries & Wages 18 11.7
8.7 7.2 7.3 17.9 10.2 10.1 9.1 12.1
Power & fuel 16.2 1.8 12.6 30.6 1.2 13.4 19.5 20 17 17.6Other expenses 28.9 -3.7 -12.5 3.1 7.3 28.9 21 14.9 10.3 11.4Depreciation 384.6 9 9.6 23.6 1.8 7.5 25 15 6.1 9Interest expenses -15.3 -15 -22.5 -58.6 -63.6 9.7 9 15.9 12 7Tax provision -25.8 36.
9-3.2 70.1 336 -20.9 19.8 -0.7 1 1.7
PBDIT -7.8 5.9 -12.6 39 15.3 -10 24.6 8.9 38 6PAT -55.7 3 -16.2 165.
691.7 -15.8 34.4 8.9 98.8 6.4
Other income/income (%)
2.4 2.9 1.5 1.5 0.5 1.7 1.4 2.3 2.3 2.1
Raw material/Net Sales (%)
62.4 66.6
56.5 51.2 60.5 65.4 59.1 51.3 61.8 66.1
Interest/PBDIT (%) 39 14.9
21.9 11.1 12.3 18.2 19.2 11.9 10 18.4
PBDIT/Net sales (%)
7.2 13.9
15.6 14.9 9.9 12.3 16.5 12.7 10.2 11
PBDIT/Income (%) 9.4 16.4
16.9 16.2 10.4 13.8 17.7 14.7 12.2 12.9
PAT/Income (%) 2 8.4 7.4 8.5 3.6 6.6 8.4 7.7 6.1 6.2
52
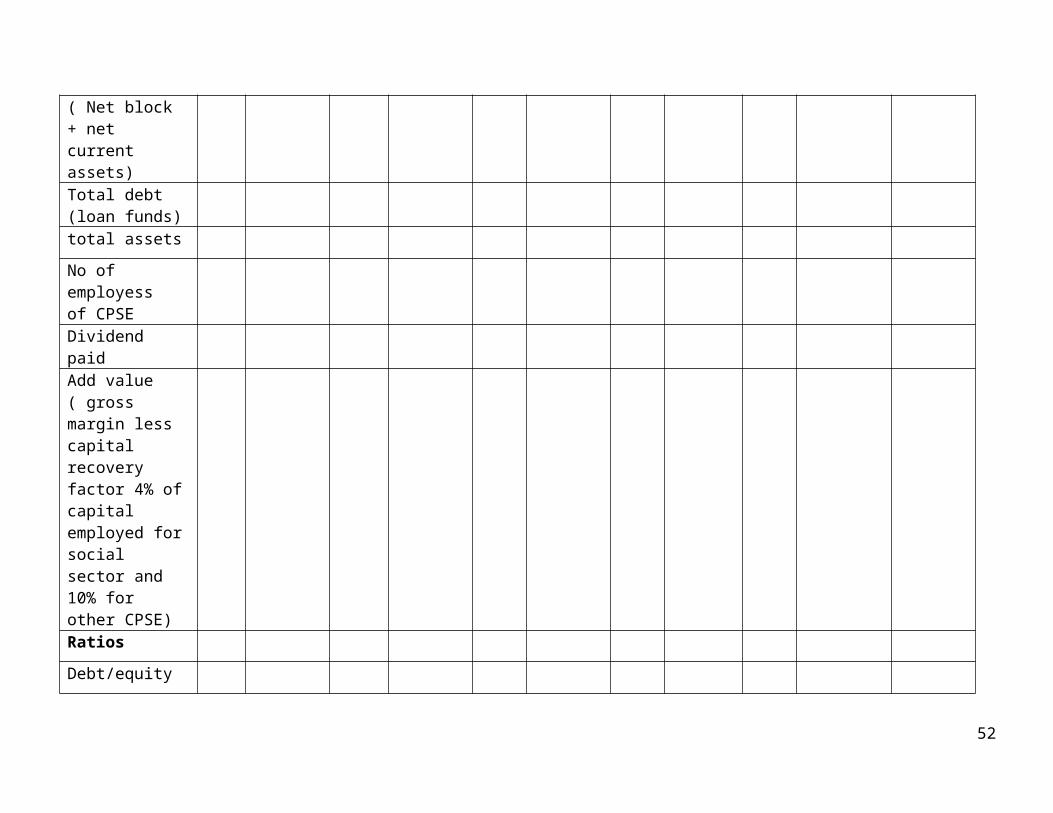
All income and profit figures are net of prior period and extraordinary transactions. PBDIT is net of other income in PBDIT/Net sales ratio. Growth is not calculated when figures are negative.
Drugs & Pharmaceuticals
Healthy export growth expected in 2010-13
CMIE expect drug exports to increase at a healthy pace over the next three years. For the year ending March 2011, we expect exports to grow by 13.4 per cent to USD 10,065 million. In 2010-11, we expect the exchange rate to average at Rs.45.6 per USD, a four per cent appreciation over the preceding year. Consequently, in rupee terms we expect exports to grow by a lower nine per cent to Rs.45, 896 crore. In 2011-12, drug exports are expected to increase by a slower 8.2 per cent to USD 10,889 million. In 2011-12, we expect a further appreciation of 3.6 per cent and the rupee will average at Rs.44 per USD. Consequently, in 2011-12, drug exports are expected to increase by a slower 4.4 per cent to Rs.47, 912 crores over the nine per cent rise expected in 2010-11. For the year ending March 2013, we expect exports of drugs to grow by 9.9 per cent to USD 11,968 million. The rupee is likely to appreciate by a 1.2 per cent and consequently, it is expected to average at Rs.43.5 per USD. Thus, exports are likely to grow by an 8.7 per cent to Rs.52, 061 crores.The reason for a healthy export growth rate is driven from the fact that US market alone accounts for over 20 per cent of India’s drug exports. Consequently, favorable conditions prevailing in the US will have a positive impact on Indian drug exports. Moreover, Indian companies have increasingly been filing Abbreviated New Drug Approvals (ANDAs) applications. In March 2010, the US government passed the US Health Care Bill. According to this bill, an additional 32 million people will be covered by insurance companies. This means that the US government will try to curtail growing healthcare costs. They will try to introduce generic version of drugs wherever possible to cut cost of medication. With the Indian pharma industry deeply entrenched in manufacturing generics, Indian exporters of generic drugs are likely to gain. Margins to contract in 2010-11
For the year ending March 2011, the sector’s sales growth is expected to rise by 13.6 per cent in 2010-11, on account of a healthy increase in both the domestic and international markets. Following the loss incurred by Piramal Healthcare in the September 2010 quarter, we have revised our PAT growth forecast for 2010-11. CMIE now expects the sector’s PAT to decline by a sharper 36.6 per cent in 2010-11 compared to the sharp 191 per cent increase a year ago. CMIE had earlier expected the sector’s PAT to decline by two per cent in 2010-11
.Sales expected to increase at a healthy pace in 2010-11 (% change from year-ago) Mar-
09Jun-09
Sep-09 Dec-09 Mar-10 Jun-10
Sep-10 Estimates
Dec-10 Forecast
Mar-11 Forecast
Jun-11 Forecast
Income 10.4 14 7.3 18.7 20.4 6.8 13.2 14.1 11.9 14.5Net sales 11.9 6 7.6 17.4 17.1 13.5 13 15 13 14Total expenses 22.3 9.7 -3.2 1.8 7.8 11.2 37.6 13.9 13.4 12.5Raw materials 8.9 6.4 -0.3 10.7 15.9 12 15.2 17.5 19 15Salaries & wages 17.9 20.2 10.2 21 23.3 19.9 12 13 11 10Power 5.1 -6.4 -10.2 -0.1 32.5 22.1 12 16.5 13 25Selling 17.1 2 12.1 -9.5 -2.3 20.2 12 9 12 14Other expenses 51.3 -1.9 -19.3 -25.5 -20.6 20.6 10 11 16 7
53
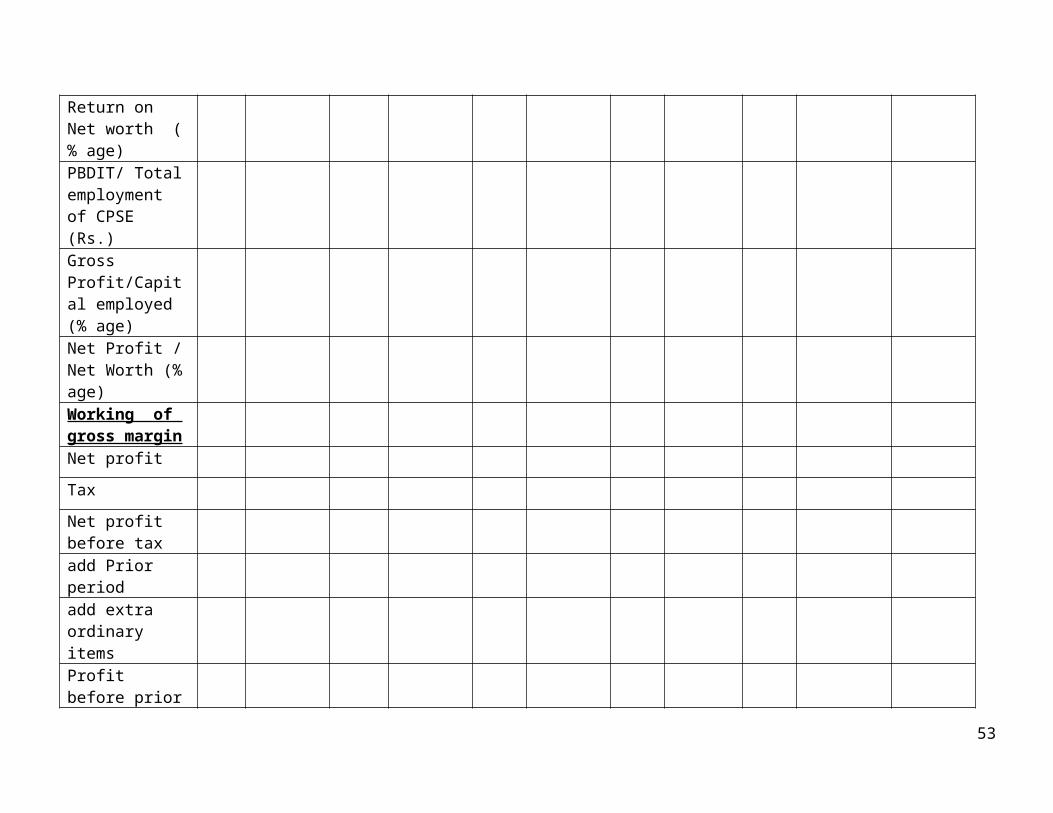
Depreciation 22.5 16.8 13.2 9.8 17.3 14.6 11 10 11 10Interest expenses 71.9 30.7 2.8 -18.3 -5 -11.3 4 5 4.3 15Tax provision -6.2 119.6 35.2 172 160.4 -42.2 608.5 3.2 -30.6 28.3PBDIT -35.5 50.8 61.9 204 151.5 -17.6 11.5 3 -5.7 16.8PAT -76.1 48 113.8 1,728.60 462.1 -17 1.1 -1.5 16.3 -Other income/incomes 2.6 8.8 1.6 4.5 5.3 3.3 1.8 3.7 4.4 3.8Raw material/Net sales (%)
47.4 48.2 46.1 47.2 46.9 47.7 47 48.2 49.4 48.1
Interest/PBDIT (%) 26.6 9.7 10.2 8.6 9.6 10.3 9.5 8.8 10.6 10.2PBDIT/Net sales (%) 9.6 19 22.2 22 21.2 17.7 21.7 20 17.7 17.7PBDIT/Income (%) 12 26.2 23.5 25.5 25.3 20.4 23.1 23 21.3 20.8PAT/Income (%) 2.6 15.4 14.3 14.8 13.9 12.2 -4.6 13.1 12.3 12.4All income and profit figures are net of prior period and extraordinary transactions. PBDIT is net of other income inPBDIT/Net sales ratio. Growth is not calculated when figures are negative.
Steel
Production to grow faster than consumption in 2011-12 and 2012-13Finished steel production growth lagged the growth in consumption in the last five years as capacity additions did not keep pace with the growth in demand. While steel consumption has grown at a CAGR of 10.4 per cent since 2005-06, CAGR in production has been much slower at 7.6 per cent. This trend is expected to reverse from 2011-12. We expect steel production growth to outpace the growth in consumption in 2011- 12 and 2012-13, driven by huge capacity additions.The steel industry is expected to commission 16.5 million tonnes of finished steel capacity in 2010-11, the highest ever in a single year. In the following two years, capacity additions are expected to be even higher at 27 million tonnes and 18.9 million tonnes. With this, finished steel production is expected to grow by 12.5 per cent in 2011-12 and by 17.5 per cent in 2012-13. By March 2013, finished steel production is expected to touch 84 million tonnes. Finished steel consumption is expected to grow by 12 per cent and 14 per cent, respectively, in 2011-12 and 2012-13, after an estimated 9.5 per cent growth in 2010- 11. An unprecedented growth seen in the production of automobiles and consumer durables in the last one year is expected to continue. Automobiles production is expected to grow by 14.5 per cent per annum in the subsequent two years after 2010-11, which will drive the demand for flat steel products.
54

Rising construction activity in the real estate, infrastructure and industrial segment is expected to boost the demand for long steel products. We expect construction component of GDP to grow by 10.5 per cent in 2011-12 and by 11 per cent in 2012-13.India has been a net importer of steel since 2007-08 as demand has grown faster than supply. As domestic supply improves in the next two years, we expect the rate of growth in imports to moderate. After rising by 38 per cent in 2009-10, we expect volume of imports to grow by 25 per cent in 2010-11 and slow down to 17.9 per cent and 10 per cent in 2011-12 and 2012-13.Domestic steel prices are highly influenced by movements in international steel prices. Global steel demand remained subdued in the first half of 2010 due to concerns of debt crisis in Europe andmonetary policy tightening in China. Demand continues to remain sluggish in key markets like US and Europe. However, we expect demand to pick up from 2011. This is expected to keep the international steel prices on an uptrend in the next two years. Also, the prices of major raw materials like iron ore and coking coal are expected to remain high. Thus, globally prices are expected to rise in the next two years.High international prices and a strong demand are expected to push up domestic steel prices. After an estimated 18 per cent rise in prices in 2010-11, the benchmark hot rolled coil prices are expected to rise by seven per cent and eight per cent in 2011-12 and 2012-13.Installed capacity is expected to touch 137.5 million tonnes by March 2013
The steel industry is expected to commission 62 million tonnes of finished steel capacity in the next three years. The installed capacity is expected to touch 137.5 million tonnes by March 2013. However, Progress of a several large steel projects has gathered pace in the last 2-3 years and they are now scheduled to be commissioned by March 2013. JSW steel is expected to complete its Rs.7,000 crore expansion project at Torangallu in Karnataka by March 2011and enhance the installed capacity of by 3.2 million tonnes to 10 million tonnes. Essar steel is expected to add a 3.4 million tonnes steel capacity at its SEZ project at Hazira in Gujarat. SAIL is expected to complete the expansion and modernisation of the IISCO plant of Rs.14,430 crore, which will increase its manufacturing capacity by two million tonnes. Tata steel is expected to complete its capacity expansion project at Jamshedpur by September 2011and increase its capacity from 6.8 million tonnes to 10 million tonnes.Prices to remain stable during November & December 2010
CMIE expects prices to remain stable during November and December 2010 because international steel prices have been softening since mid-October as demand from key markets like US and Europe remained sluggish, especially the demand from the construction sector. It is expected that global steel demand to pick up in the March 2011 quarter. Thus, international steel prices are expected to firm up during January-March 2011. In the domestic market steel prices to rise by 3-5 per cent in the fourth quarter. Steel companies hiked prices by up to Rs.3,000 per tonne during September-October 2010 due to firm international steel prices, a pick up in demand and higher raw material cost. Sales to grow by 28.5% in December 2010
Driven by a healthy demand and higher prices, steel industry’s sales are expected to grow by a robust 28.5 per cent and 32 per cent, respectively, in the December 2010 and March 2011 quarters. It is also expected that the financial performance of other steel companies that are yet to announce their results to be in line with the early results. Net sales of the industry are estimated to have grown by 18.2 per cent in the September 2010 quarter.
55

PBDIT margin to increase to 20-23% in the second-half of 2010-11
With a combination of rise in prices and lower raw material cost, CMIE expects the PBDIT margins of the steel industry to increase to 20-23 per cent in the second-half of 2010-11 from an estimated 18.6 per cent in the September 2010 quarter. However, margins are expected to contract compared to second half of 2009-10 as the y-o-y rise in raw material prices is expected to be higher than the rise in steel prices.
A majority of the 26 companies experienced a pressure on their profitability on account of soft pricing and a surge in raw material cost. Early results of 26 steel companies show that the aggregate PBDIT margin declined by 580 basis points to 18.9 per cent in the September 2010 quarter from 24.6 per cent in the June 2010 quarter. However, since September 2010, steel companies have hiked prices by up to Rs.3,000 per tonne and contract prices of iron ore and coking coal have come down by 10-15 per cent due to weak demand from China.
Sales to grow at robust pace in second-half of 2010-11 (% change over a year ago) Mar-
09Jun-
09Sep-09 Dec-09 Mar-
10Jun-
10Sep-10
Estimate
Dec-10 Forecas
t
Mar-11 Forecas
t
Jun-11 Forecast
Income -11.1 -11.9 -13.7 29.1 23 13.9 18.7 28.6 31.3 21.3Net sales -12.8 -13.5 -13.9 29.4 23 15.8 18.2 28.5 32 20.5Total expenses -16.1 -12.8 -17.2 12.5 25.6 26.1 22.3 29 34.2 16.9Raw Materials -6.6 -6.5 -14 5.6 16.7 25.5 24 32.5 39 21.2Salaries & Wages
-42.7 -34.2 -48.1 0 18.2 56.8 30 20.6 28.5 11.2
Power & Fuel 2.7 5.7 7.9 27 28 11.4 19.8 37.6 38 20Selling & Marketing
47.8 -23.1 79.2 54.2 22.7 2,978 13.6 18.2 8.9 -86.5
Other Expenses -37.7 -35.9 -29.7 10.6 60.3 31.8 25.8 35 31.8 12Depreciation 15.6 13 10.1 9.6 9.4 14.4 18 22.7 13.4 Interest Expenses 18.2 22.5 18.7 4.9 11.2 8.9 20.3 21.8 29.5 17.3Tax Provision -54.5 -35.4 -21.7 473.6 139.2 33.8 0.5 1 14.4 -8.3PBDIT -19.6 -11.8 152.1 69.2 22.1 -4.8 7.9 18.1 6.2 PAT -34.1 -23.2 1,068 101.7 29.7 -26.8 1.7 15.4 5.6 Other income/Income (%)
3.1 3 1.9 2.5 2.9 1.4 2.3 2.6 2.4 2.1
Raw Material/Net Sales (%)
51.6 56 52.4 52.4 49.7 60.5 55 54 52.3 60.8
Interest/PBDIT (%)
20.2 20.5 18.6 17.9 13.7 18 23.6 20.2 15 19.8
PBDIT/Net Sales 16.6 19.3 21.7 22.6 23.5 22.6 16.7 18.4 21.3 19PBDIT/Income (%)
19.2 21.7 23.2 24.5 25.8 23.7 18.6 20.6 23.2 20.7
PAT/Income (%) 8.2 8.6 9.8 11 13.1 10.1 6 8.7 11.5 8.8
56
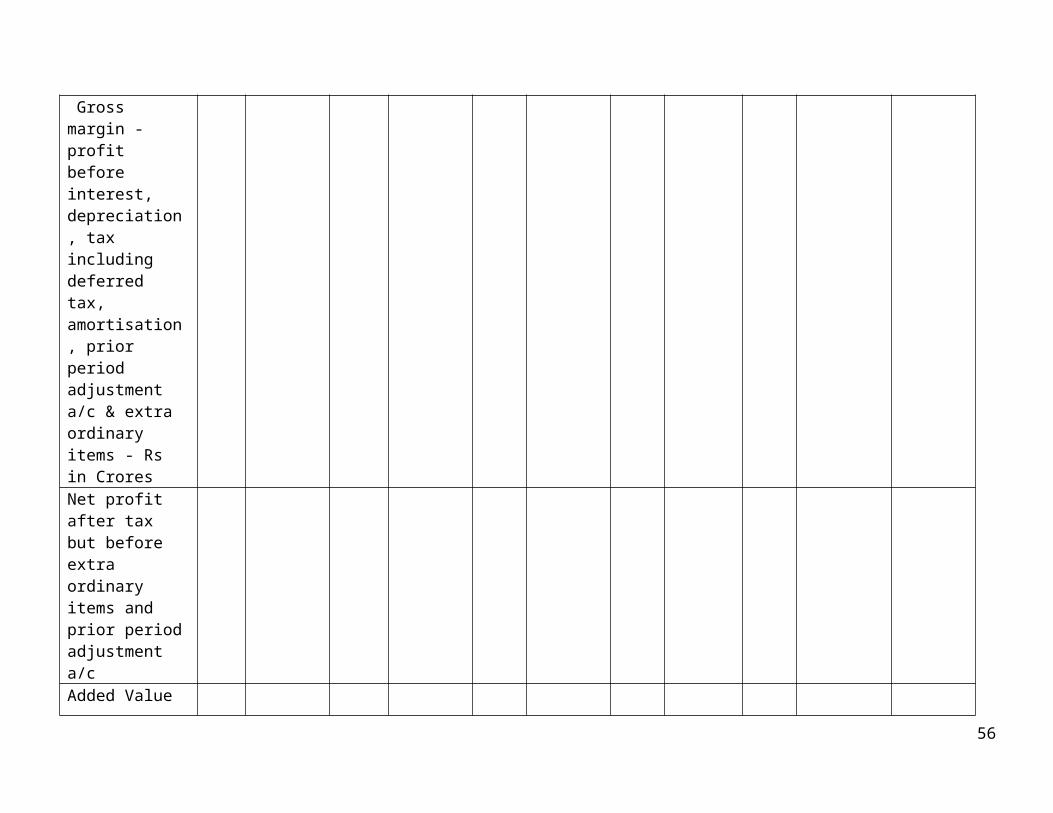
All income and profit figures are net of prior period and extraordinary transactions. PBDIT is net of other income in PBDIT/Net sales ratio. Growth is not calculated when figures are negative.
Aluminum & Aluminum Products
Primary aluminum capacity to grow by 9.7 lakh tonnes in next three years
CMIE estimates for capacity additions by primary aluminum companies to increase by only 9.7 lakh tonnes during 2011- 12 as against earlier expectation of 26 lakh tonnes. Vedanta Aluminum, which was scheduled to commission the first phase of its 12.5 lakh tonnes aluminum smelter at Jharsuguda in Orissa by the end of 2010- 11, has deferred the project temporarily. The company has also deferred the expansion of the 3.25 lakh tonnes aluminum smelter of its subsidiary, Balco, at Korba in Madhya Pradesh. By March 2013, we expect the installed capacity to touch 27 lakh tonnes as against 43.4 lakh tonnes expected earlier.CMIE expects the sales growth of aluminum & aluminum products industry to decelerate in the second-half of 2010-11. In the December 2010 and March 2011 quarters, we expect sales to grow by 14.6 per cent and 15.6 per cent, respectively. This is because the y-o-y rise in prices will taper off in the second-half as high base effect sets in. Sales growth of the industry is expected to decelerate in 2011-12 and 2012-13 to around 8 per cent, after an estimated 22 per cent rise in 2010-11. Nalco, which accounts for 65 per cent of the industry sales, is not expected to add new capacity in the two years. This coupled with a modest rise in prices will result in a slowdown in sales growth.Net Profit margin to come under pressure, earmarking a decline of 12% in December 2010
The profitability of the industry is also expected to come under pressure in the second-half as prices are expected to remain range-bound due to oversupply in the industry. CMIE expects the net profit margin of the industry to decline to around 12 per cent in the December 2010 and March 2011 quarters compared to 15-16 per cent in the first-half. In 2011-12, the net profit of the industry is expected to grow faster than sales by 19 per cent as major cost components are not expected to rise sharply. However, as new projects of downstream companies come on stream expenses like raw materials, salaries and interest are expected to surge, leading to a modest 4.8 per cent rise in net profit in 2012-13.
Profit margins to come under pressure in the second half of 2010-11 (% change over a year ago)
Mar-09 Jun-09 Sep-09 Dec-09 Mar-10
Jun-10 Sep-10 Estimate
s
Dec-10 Forecas
t
Mar-11 Forecas
t
Jun-11 Forecas
tIncome -7.2 -27.1 -13.3 32.5 33.5 35.5 24.2 15.6 15.9 9.5
Net sales -8.2 -28.8 -16.5 38 37.8 39 25.3 14.6 15.6 9.4
Total expenses 4.7 -13 0.9 24.3 14.9 28.1 9 12.1 19.6 10.8
Raw Materials -8.1 -10.7 1.5 33.7 28.5 30.3 5 10 14.6 8.5
Salaries & Wages 130.3 10.8 14.5 15.1 -31.2 27.7 18 9.8 25 8.8
Power & Fuel 30.1 5 22.2 21.4 44.8 29.3 5 12.9 20.2 18
Depreciation -0.7 14.1 12.4 22.1 3.4 19 20.5 16.1 22 4.5
Interest Expenses 22.9 -4.2 -7.9 -2.4 -12.9 17.1 6 14.2 30 11.4
Tax Provision -78.3 -73 -61.2 14.6 185.5 64.3 24.1 24.3 10 7
PBDIT -71.7 -62.1 -53.9 10.9 268.7 68.8 77.6 29.3 -8.2 -0.1
PAT -86.4 -70.6 -64.7 6 1,439.1 107.2 154.2 39.6 -22 -5.1
Other income/Income (%)
6.2 6.6 7.4 3 3.2 4.3 6.5 3.9 3.4 4.3
57

Raw Material/Net Sales (%)
35.2 39 36.1 35.1 31.8 36.2 30.2 33.7 31.5 35.9
PBDIT/Net Sales 6.7 16.1 12.8 18.5 27.6 23.8 22.4 20.4 21 21.3
PBDIT/ Income (%) 12.4 21.6 19.2 21 29.9 27.1 27.5 23.5 23.7 24.7
PAT/Income (%) 3.5 9.9 8.2 10 19 15.2 16.8 12.1 12.8 13.2
Profitability to come under pressure in 2012-13 (% change) 2006-07 2007-08 2008-09 2009-10 2010-11
Forecast2011-12 Forecast
2012-13 Forecast
Income 52.1 -8.3 4.9 2.9 21.7 8.3 8.7Net sales 51.9 -9.5 6.1 3.3 22.1 8 8.3Total expenses 47.7 2 13.8 6.1 16.6 9.7 9.6Raw Materials 82.1 12.6 8.5 11.9 14.3 6.8 7.6Salaries & Wages 14.2 17.3 57.5 -2.2 19.7 10.4 16.3Power & Fuel 142.2 10.8 39.1 23.2 15.3 12.3 10.1Depreciation -7.1 3 12.8 19.3 4.8 10Interest Expenses 5.1 31.7 25.9 -6.8 16.4 12.6 14.9Tax Provision 61 -29.2 -23.1 -35.5 26.2 20.7 3.4PBDIT -27 -22.2 -19.1 32.1 16.5 5.5PAT -30 -28.6 -19.8 41.1 19 4.3Other income/Income (%) 3.1 6.4 5.3 4.8 4.5 4.6 4.8Raw Material/Net Sales (%) 50 32.3 34 35.1 32.8 32.6 32.5Interest/PBDIT (%) 3.2 2.2 3.7 4.4 3.9 3.9 4.2PBDIT/Net Sales 31.4 35.6 25.2 19.4 21.8 22.9 21.7PBDIT/Income (%) 33.5 39.7 29.1 23.3 25.3 26.4 25.5PAT/Income (%) 19.8 23 15.5 12.1 14.1 14.8 14
All income and profit figures are net of prior period and extraordinary transactions. PBDIT is net of other income in PBDIT/Net sales ratio. Growth is not calculated when figures are negative.
Copper & Copper Products
Copper cathodes production is expected to grow by 4.4% in 2010-11
CMIE expects production to grow at a robust pace in the second half of 2010-11, driven by a strong demand for the metal. The highest ever capacity additions of 16,144 mw by power companies and a rise in real estate construction activity are expected to boost demand for copper. With this, copper cathodes production is expected to grow by 15.9 per cent y-o-y during October 2010-March 2011. Our production forecast for 2010-11 is based on the assumption that operations of Sterlite Industries’ 4.1 lakh tonnes smelter at Tuticorin in Tamil Nadu remain unaffected. Domestic production is not expected to grow at a similar pace as demand during 2011-13, as no new capacity is scheduled to be commissioned. CMIE expects production growth to decelerate to around 4.3 per cent and 2.8 per cent, respectively, during 2011-12 and 2012-13. In the first half of 2010-11 the copper cathodes production fell by 6.8 per cent, compared to the corresponding period of 2009. This was due to a sharp 14.5 per cent fall in Sterlite’s production.
58
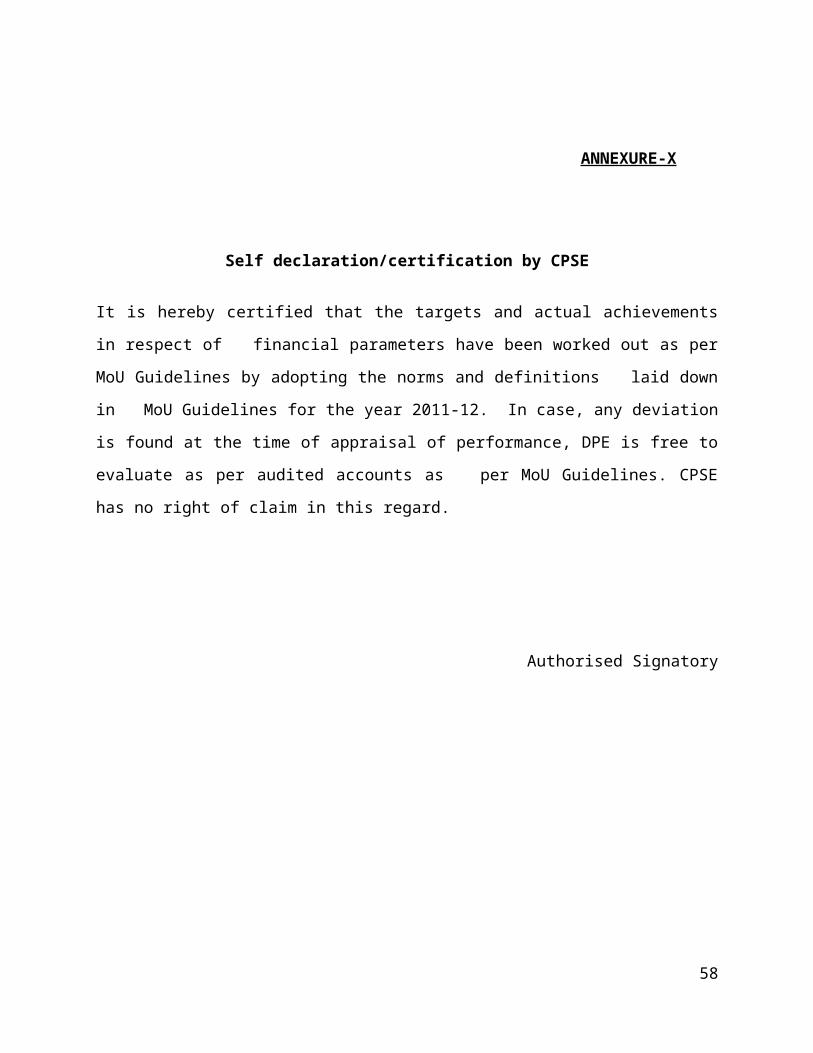
Sales growth to accelerate in second half of 2010-11CMIE expects sales growth of the copper industry to accelerate in the second half of 2010-11. A strong demand coupled with higher prices is expected to drive the growth in industry’s sales. Sales are expected to grow by around 14.8 per cent and 31.8 per cent in the December 2010 and March 2011 quarters, respectively. It is also expected that the net sales of the copper & copper products industry to grow by a healthy 13.9 per cent and 18.9 per cent, respectively, in 2011-12 and 2012-13. Hindalco and Sterlite Industries together account for more than 95 per cent of sales of the copper industry. Both the companies operate custom smelters, i.e., they buy copper concentrates from miners to process them into copper cathodes. Due to limited availability of copper concentrates and a strong demand, prices of copper are expected to rise sharply. Sales growth will be primarily driven by rise in copper prices.Copper price to remain buoyant during 2011-13
CMIE expects copper prices to remain buoyant during 2011-12 and 2012-13, on account of strong demand supply dynamics. Globally, copper supply is expected to remain tight, due to raw material constraints. No significant copper supply is expected to come on stream for the next 1-2 years, as copper ore producers are in the initial stages of developing new mines. Due to a tight demand-supply outlook, in line with the rise in LME prices, domestic prices are also expected to rise by 11.5 per cent and 9.1 per cent in 2011-12 and 2012-13, respectively. Domestic demand for copper is expected to surge, considering the huge power generation capacity that is expected to come up in the next three years. Domestic demand for copper is expected to surge, considering the huge power generation capacity that is expected to come up in the next three years and lead to rise in domestic copper price.Profitability is expected to come under pressure
Profitability is expected to come under pressure, due to a combined effect of high cost of copper concentrates and low TC/RC charges. CMIE expects PBDIT and PAT margins to remain almost flat at around 16- 17 per cent and 10-11 per cent, respectively, in 2011-12 and 2012-13. TC/RC charges have been falling due to limited availability of copper concentrates. Since Sterlite and Hindalco do not have captive mines, low TC/RC rates will put pressure on their profit margins.
Margins to contract in December 2010 quarter compared to previous quarter (% change over a year ago)
Jun-09
Sep-09 Dec-09 Mar-10
Jun-10
Sep-10 Estimate
s
Dec-10 Forecas
t
Mar-11 Forecas
t
Jun-11 Forecas
t
Sep-11 Forecast
Income -18.1 -10.7 30.4 43.8 34.1 11.2 17.4 31.6 18.6 24.4
Net sales -17.4 -10.8 32.2 43 30.2 7.2 14.8 31.8 18.4 24.8
Total expenses -8.3 6.4 58.4 23.2 16 -5.4 15.3 32.2 18.8 23.9
Raw Materials -0.9 12.2 89.7 26.5 3.9 -10 16 35 21 27
Salaries & Wages
9.7 7.5 3.2 16.4 14.4 7.2 7 19.9 14.5 14.9
Power & Fuel -13.4 -4.4 -2.4 17.7 18.1 -6.1 7.4 18.2 15.6 25.6
Other Expenses
-59.5 -16.5 10 4.8 237.4 23.6 25.7 20.3 1.5 5.5
Depreciation 4.4 3.3 3.6 -9.2 1.9 -6.5 -7.2 -7.4 0.7 0.5
Interest Expenses
-1 16.3 -12.1 15.9 0.7 -9.6 -22.9 -22.4 8.5 3.7
Tax Provision -50.4 -52.1 21 123.7 102.9 102.7 63.3 128.6 54.3 41.1
PBDIT -36.4 -41.2 16.7 144.1 50.6 62.2 23.2 59 39.5 32.2
PAT -46.5 -55.4 32.6 496.4 64.9 111.2 36.4 73.5 47.4 41.1
59
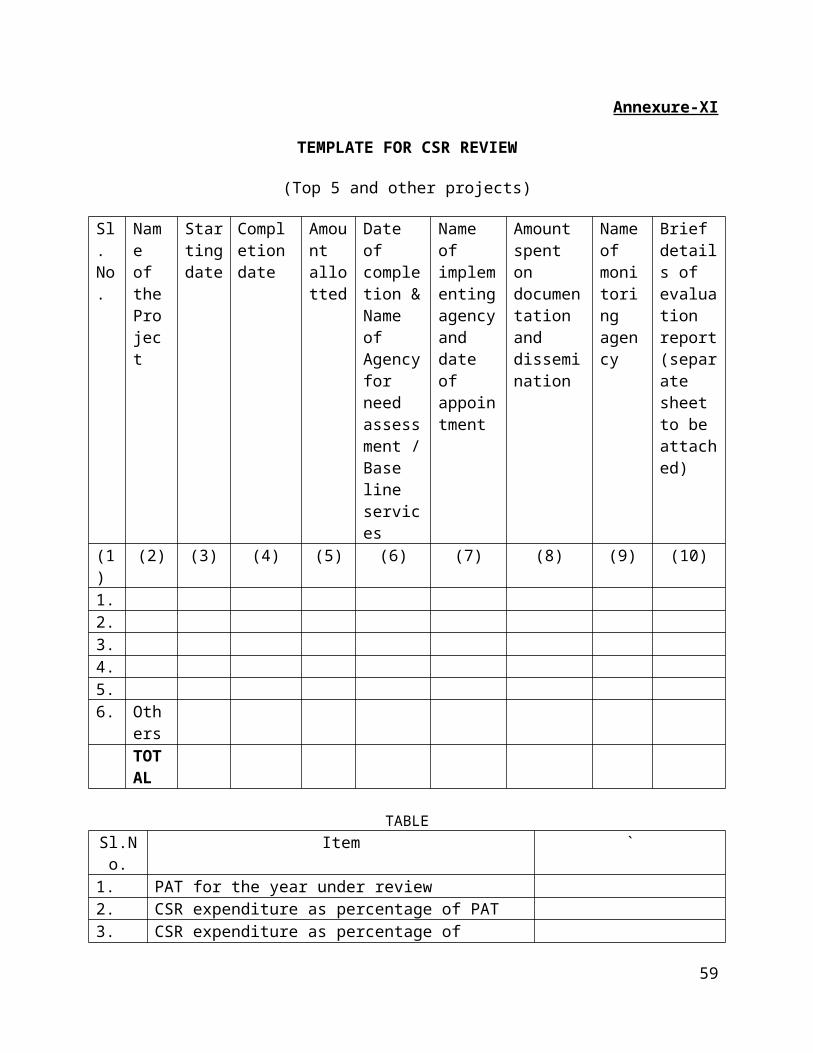
Other income/Income (%)
4.1 3.8 3.5 5.2 6.8 7.2 5.6 5.1 6.9 6.9
Raw Material/Net Sales (%)
82.9 85.7 73.2 66.3 65.9 71.9 73.9 67.9 67.4 73.2
Interest/PBDIT (%)
14.7 18.6 14.5 11.3 7.9 10.4 9.1 5.5 6.1 8.1
PBDIT/Net Sales
11.8 8 10.2 12.5 11.6 10.2 8.9 16.3 14.8 11.7
PBDIT/Income (%)
15.4 11.5 13.3 17 17.6 16.7 14 20.6 20.7 17.8
PAT/Income (%)
7.7 5.4 7.3 10.5 10.5 10.3 8.5 13.9 13.1 11.7
All income and profit figures are net of prior period and extraordinary transactions. PBDIT is net of other income in PBDIT/Net sales ratio. Growth is not calculated when figures are negative.
Sales to grow by 14-19% during 2011-13 (% change over a year ago)
2006-07 2007-08 2008-09 2009-10 2010-11 Forecast
2011-12 Forecast
2012-13 Forecast
Income 50.5 6.2 -5.6 8 23 14.1 18.6
Net sales 49.9 4.7 -6.7 8.3 20.5 13.9 18.9
Total expenses 42.1 5.9 -8.7 16.5 13.8 15.2 19.5
Raw Materials 49.3 8 -14.6 25.4 10.5 17.2 21.2
Salaries & Wages 38.7 18.9 24.6 10.5 12 12.6 15.7
Power & Fuel -6.4 3.9 -1 -1.8 8.9 16.7 23.6
Selling & Marketing -38.5 87.5 6.7 -31.3 57.1 54.5 -11.8
Other Expenses 34.3 -3.4 20.9 -16 47.6 3.6 10.2
Depreciation 8.6 -3.5 10.3 0.3 -4.9 0.8 7.1
Interest Expenses 21.1 8.5 12.7 3.7 -14.8 7 6.1
Tax Provision 15.9 -17.5 -9.6 -18 102.3 15.8 12.7
PBDIT 36.8 -7 -7.2 -3.2 49 12.1 11.8
PAT 52.7 -7.1 -14.9 -1.4 69.2 13.7 12.9
Other income/Income (%) 1.9 3.3 4.4 4.2 6.1 6.2 6
Raw Material/Net Sales (%) 73.3 72.1 66 76.4 70 72 73.3
Interest/PBDIT (%) 11.4 11 13.4 14.3 7.8 7.5 7.1
PBDIT/Net Sales 14 13.4 12 10.6 12 11.6 10.7
PBDIT/Income (%) 15.7 16.2 15.9 14.3 17.4 17.1 16.1
PAT/Income (%) 10.1 9.5 8.6 7.8 11 10.9 10.4
All income and profit figures are net of prior period and extraordinary transactions. PBDIT is net of other income in PBDIT/Net sales ratio. Growth is not calculated when figures are negative.
Sponge iron
60
Production growth to accelerate during 2011-13CMIE expects sponge iron production to grow by 14 per cent and 18.4 per cent, respectively, during 2011-12 and 2012-13, after a 10 per cent growth estimated for 2010-11. Sponge iron production has grown at a CAGR of 18 per cent in the last five years. A rise in share of secondary steel sector (which use sponge iron to manufacture steel) in total steel production has driven the production growth of sponge iron sector. Steel production is expected to grow by 12.5 per cent and 17.5 per cent, respectively, in 2011-12 and 2012-13. As secondary steel sector accounts for a major share in total steel production, sponge iron demand is expected to be robust in 2011-12 and 2012-13.Capacity to grow by 14.1%by March 2013To meet the rising demand from the steel industry in the next three years, sponge iron industry is coming up with healthy capacity additions during 2010-13. As per the CMIE CapEx database, the installed capacity of the industry will be enhanced to 380 lakh tonnes by the end of March 2013, an increase of 14.1 per cent from the current capacity. CMIE’s CapEx database reveals that another 7.5 lakh tonnes of capacity is scheduled to come on stream during November 2010-March 2011. It is expected that at least six lakh tonnes of this capacity to get commissioned as per the schedule, after discounting 20 per cent of the capacity for unanticipated delays.
Capacity to grow by 13.2 lakh tonnes in 2010-11
Units 2007-08 2008-09 2009-10(Estimate)
2010-11(Forecast)
2011-12(Forecast)
2012-13(Forecast)
Capacity ’000 tonnes
26,563.00 29,945.00 33,314.00 34,637.00 36,717.00 38,002.00
Production ’000 tonnes
19,987.70 21,330.70 22,993.60 25,286.40 28,821.00 34,122.70
Export ’000 tonnes
49.6 29.6 52.3 75.9 103.8 146.7
Import ’000 tonnes
2 0.3 125.5 137.1 107 88.5
Export Rs. crore 72.3 72.9 119.1 204.9 296.9 440.1
Import Rs. crore 3.7 8.6 179.9 260.5 223.6 208
Realisation Rs./kg 15.8 20 14.6 17.8 19.7 21.6
Sales Rs. crore 31,600.60 42,682.80 33,501.60 44,984.50 56,719.70 73,602.60
Domestic market value Rs. crore 31,532.00 42,618.50 33,562.40 45,040.00 56,646.50 73,370.50
Sponge iron industry to report healthy sales growth in 2011-12 and 2012-13
CMIE expects net sales of the sponge iron industry to grow by a healthy 18.7 per cent and 15.8 per cent, respectively, in 2011-12 and 2012-13, on account of higher volumes and rise in prices. Driven by a strong demand, sponge iron companies are expected to report robust sales volume in the two years. Volumes are expected to grow by around 6-8 per cent, while prices by around 9-11 per cent in 2011-12 and 2012-13.It is also expected that the industry’s sales to grow at a robust pace in the second half of 2010-11. A strong demand and a rise in prices are expected to boost the industry’s sales. Net sales of the industry are expected to grow by 50.4 per cent and 36 per cent in the December 2010 and March 2011 quarters, respectively. A part of the growth in December 2010 quarter will be due to a low base of the year-ago quarter.Profitability to improve in 2011-12
61
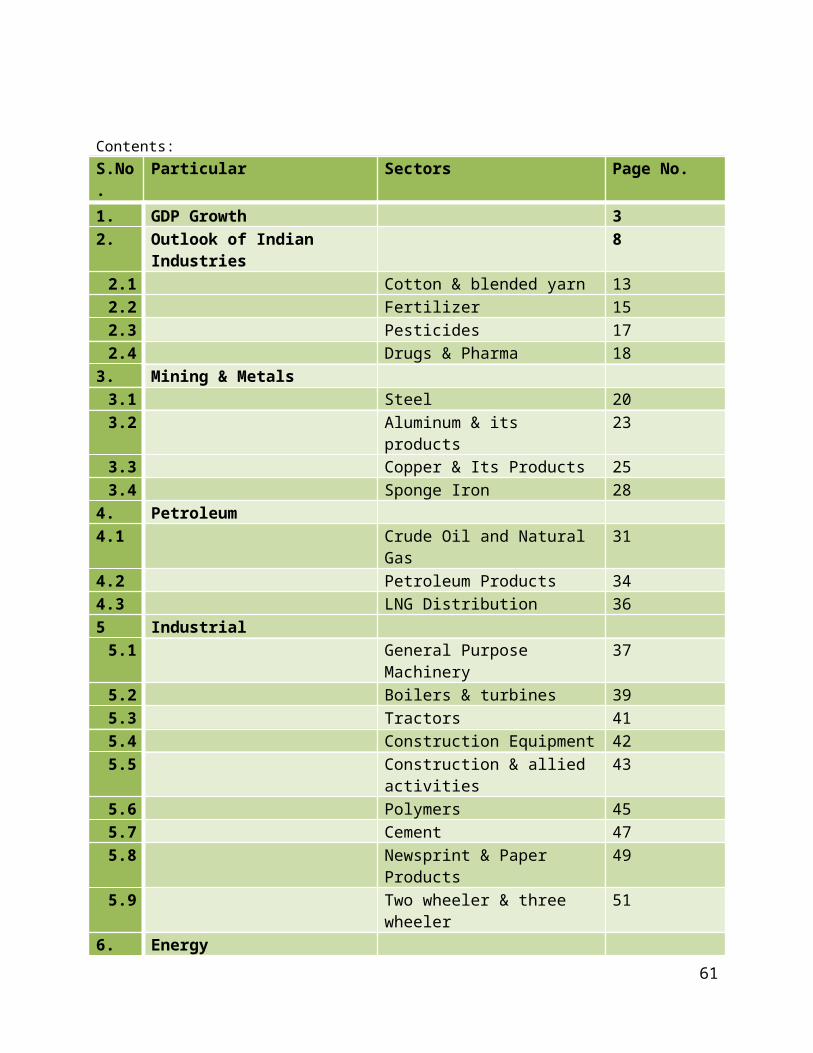
Profitability of the industry is expected to improve in 2011-12, as sponge iron prices are expected to rise by around 10 per cent in the year. It is expected that the PBDIT and PAT margins to expand by 100-160 basis points to 14.1 per cent and 6.2 per cent, respectively, in 2011- 12. In 2012-13, profitability is expected to come under pressure, as raw material cost is expected to rise at a faster pace than rise in sponge iron prices. It is expected that the PBDIT and PAT margins to contract by 90-150 basis points to 12.6 per cent and 5.3 per cent, respectively.Margins of the industry are expected to improve sequentially, due to a combined effect of higher prices and lower raw material cost. We expect the PBDIT margin to improve to 13.9 per cent and 15.1 per cent, respectively in December 2010 and March 2011 quarters. The PAT margin is also expected to expand to 5.6 per cent and 7.7 per cent, respectively.
Raw material prices to rise at sharper rate than sales in 2010-11 (% change over a year ago)
Mar-09
Jun-09
Sep-09 Dec-09 Mar-10
Jun-10
Sep-10 Estimate
s
Dec-10 Forecast
Mar-11 Forecas
t
Jun-11 Forecas
tIncome -24 -17.3 -32.4 -18.7 41.2 -1.1 21.3 50.9 35.7 32.9Net sales -23 -17.7 -32.7 -17.7 39.4 -1.1 20.6 50.4 36 32.3Total expenses -15.4 -17.8 -20.7 -16.4 16.7 -0.4 20.8 42.3 35.6 28Raw Materials -12 -16.2 -15.2 -18.1 14.3 -2 22 52.5 42 31.5Salaries & Wages 23.9 -1.8 -1.2 -9.1 5.2 6.8 10 20 25 20Power & Fuel 406.1 -8.9 -39.5 17.5 176.6 -27.4 23.5 42.1 30.7 75Selling & Marketing -47.7 -22.1 -26.2 -69.9 -28.9 -63.1 14.7 15.6 40.2 31.7Other Expenses -27.9 -20.1 -28 -33.4 17.6 1.1 10 10 15 20Depreciation -6.4 -4.5 -5.1 4.6 12 3.7 4.4 4 12 5Interest Expenses -26.1 -22.2 -16.4 -24.5 1.5 11.1 10 20 10 10Tax Provision -82.2 -66.4 -88.6 2,117.5
0287.8 80.7 189.9 20 25 6
PBDIT -69.8 -61.5 -81.5 295 228.6 2 113.3 54.3 14.9 91.4PAT -88.6 229.4 15.5Other income/Income (%)
1.3 1.1 1 0.8 2.6 1.1 1.5 1.2 2.4 1.5
Raw Material/Net Sales (%)
81.7 75.1 78.3 71.5 67 74.5 79.2 72.5 69.9 74
Interest/PBDIT (%) 60.3 30.4 51.6 25.8 18.6 33.1 26.6 20 17.8 19.1PBDIT/Net Sales 6.4 9.3 5.4 12.9 15.7 9.6 9.8 12.9 13 14
PBDIT/Income (%) 7.7 10.3 6.4 13.6 17.9 10.6 11.2 13.9 15.1 15.3
PAT/Income (%) -2 1.6 -1.8 2.6 9.1 0 2.7 5.6 7.7 6.7
All income and profit figures are net of prior period and extraordinary transactions. PBDIT is net of other income in PBDIT/Net sales ratio. Growth is not calculated when figures are negative.
Sales to grow at a healthy rate in 2011-12 and 2012-13 (% change over a year ago)
2006-07 2007-08 2008-09 2009-10 2010-11Forecast
2011-12Forecast
2012-13Forecast
Income 39.3 42.3 29.7 -11.3 26.9 18.9 15.7
Net sales 39.2 42.9 30.8 -11.7 26.7 18.7 15.8
Total expenses 33.8 16.5 28.3 -11 24.6 17.7 16.5
Raw Materials 34.2 36.5 33.5 -9.8 28.3 18.6 17.5
Salaries & Wages 24.3 9.1 34 -1.9 15.7 18.3 17.2
Power & Fuel 36.2 -65.8 1,141.90 1.3 17.3 27.9 19.3
Selling & Marketing 14.7 -7.6 -10.3 -38.3 -9.1 16 12.7
62
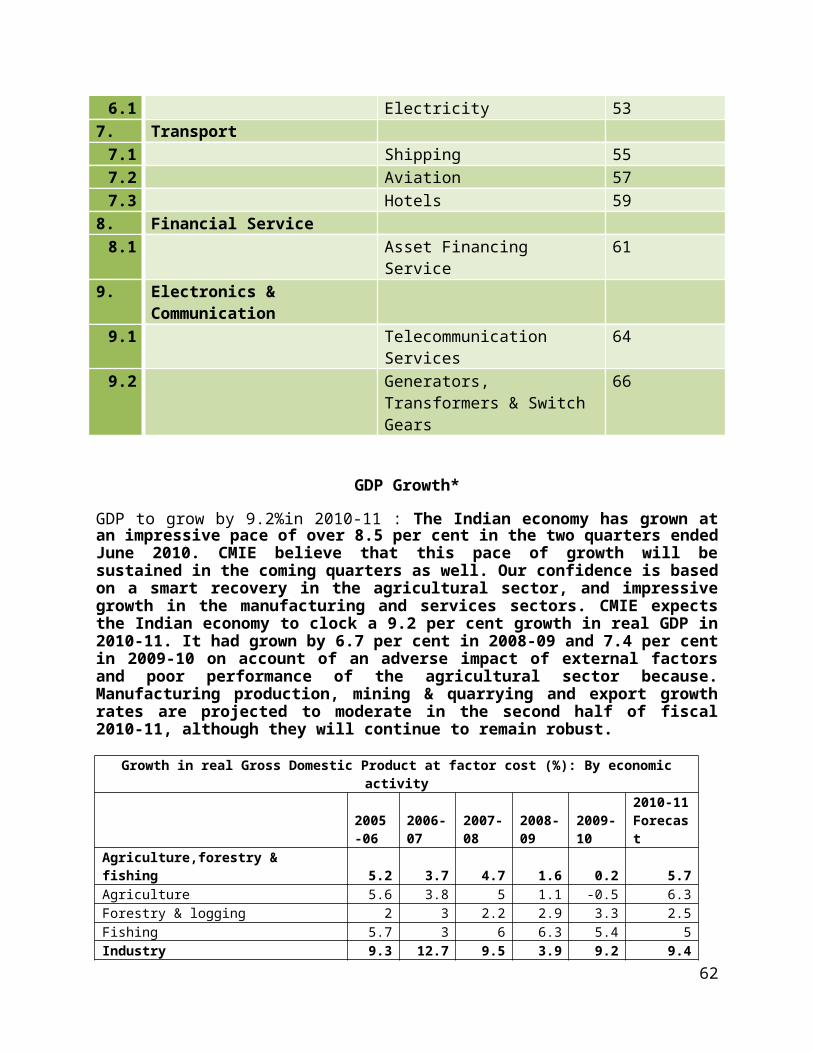
Other Expenses 34.5 11.9 12.8 -17.9 9.5 15.2 15
Depreciation 47.3 -0.8 -1.1 1.4 6.1 6.4 5.9
Interest Expenses 39.4 -64.1 -12.4 -15.5 12.6 11.6 9
Tax Provision -48.1 1,142.40 16.7 -38.7 51.8 14.3 7.3
PBDIT 49 220.6 6.7 -26.9 34 27.8 3.9
PAT 25.3 -46.3 79.2 59.9 -0.6
Other income/Income (%) 2.5 1.8 1 1.5 1.6 1.7 1.7
Raw Material/Net Sales (%) 74.5 71.7 71.2 72.7 73.6 73.4 74.5
Interest/PBDIT (%) 168.9 27.3 23.1 26.7 22.5 19.6 20.6
PBDIT/Net Sales 7.3 16.1 14.1 11.1 11.6 12.5 11.1
PBDIT/Income (%) 9.7 17.6 15 12.4 13.1 14.1 12.6
PAT/Income (%) -13 5.7 5.4 3.3 4.6 6.2 5.3
All income and profit figures are net of prior period and extraordinary transactions. PBDIT is net of other income in PBDIT/Net sales ratio. Growth is not calculated when figures are negative.
Crude Oil & natural gas
Crude oil & natural gas industry to report healthy sales growth in second-half of 2010-11CMIE expects the crude oil & natural gas industry to report healthy sales growth of 15-20 per cent in the second half of 2010-11. The growth in sales will be on account of rise in average realizations. Price of natural gas sold under the administered price mechanism (APM) will be higher in the second-half of 2010-11 compared to the year-ago, owing to a hike in APM gas price in June 2010.Besides, crude oil prices are expected to be 9% higher in the second-half of 2010-11. CMIE expects the industry to end the financial year 2010-11 with a healthy net sales growth of 11 per cent. Though the subsidy burden is expected to increase, rise in oil prices will result in better realizations. CMIE expects this sales momentum to be sustained even in the following two years. Sales are likely to grow by 17.5 per cent in 2011-12 and 12.4 per cent in 2012-13. However, unlike 2010-11, the growth will be largely driven by rise in sales volumes during 2011-13.Oil prices are expected to increase by 13.8% in 2010-11Oil price are expected to be 13.8 per cent higher over the previous period in 2010-11. However, the rise in oil prices is likely to be moderate at 5.9 per cent and 4.6 per cent in 2011-12 and 2012-13, respectively, as the global oil supply is also likely to rise. International Energy Agency (IEA) has increased its projections for non-OPEC supply for 2010. Non-OPEC supply is now likely to be at 52.6 mb/day in 2010, higher from 52.4 mb/day projected earlier. For 2011, IEA has estimated non-OPEC supply to increase to 53.1 mb/day. Further, OPEC’s spare capacity (the amount of additional production that can reach market) at 5.9 mb/day is almost 7% of the present global oil consumption of 87.6 mb/day. This is expected to stem any dramatic rise in oil prices in 2011-12 and 2012-13.Oil production to grow by 8.3%in 2010-11Domestic oil production is expected to grow by 8.3 per cent to 364.7 lakh tonnes in 2010-11. The oil output in the country almost stagnated in the last three years ended 2009-10. However, CMIE expects the scenario to change from 2010-11 as private companies like Reliance Industries (RIL) and Cairn India are increasingly making significant contribution to the domestic oil production. In 2011-12 and 2012-13, the oil production is likely to grow by 8.6 per cent to 396.3 lakh tonnes and 9.6 per cent to 434.4 lakh tonnes. However, unlike 2010-11, the growth in oil production will be largely driven by ONGC, the largest oil producer of the country. As domestic oil supply
63
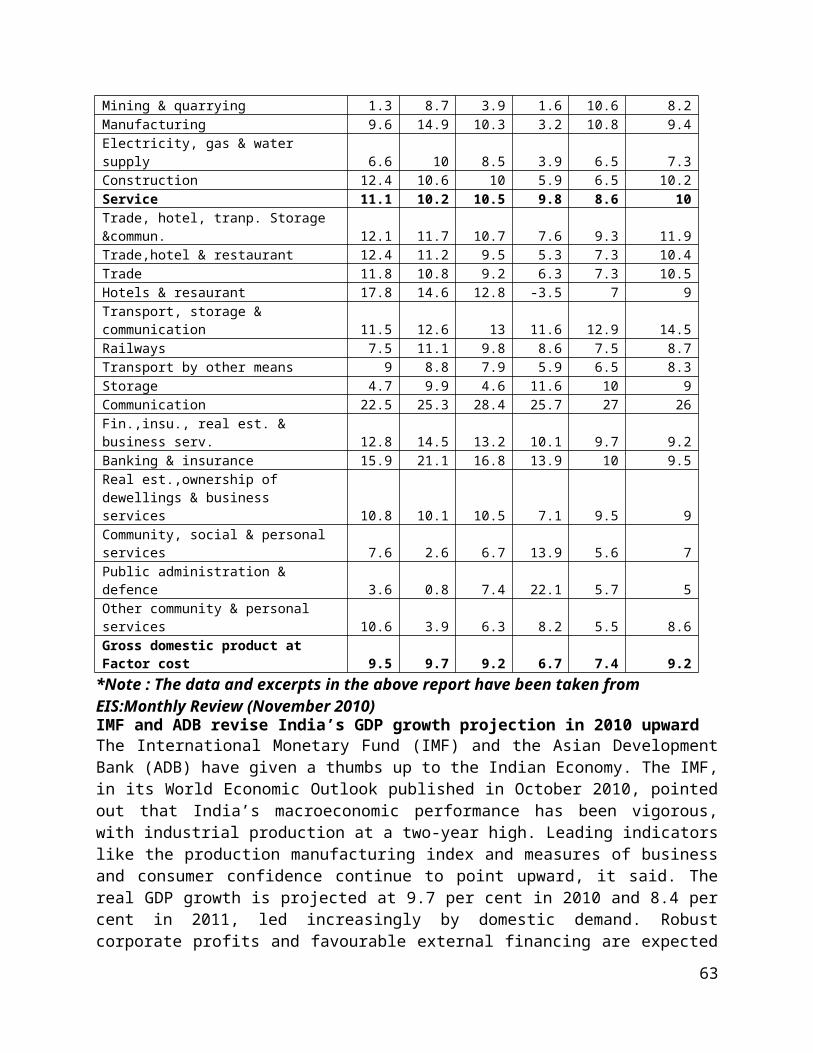
improves in the 2010-13, we expect the rate of growth in crude oil imports to moderate. The enhanced oil recovery and improved oil recovery schemes implemented by ONGC and Oil India are expected to increase crude oil production.Profits to grow at a healthy rate in second-half of 2010-11The industry is expected to witness a y-o-y rise in net realizations though the subsidy burden is expected to remain higher over the year-ago period, higher oil prices will result in better net realizations in the second-half of 2010-11. A higher net realisation is expected to keep the operating margins well above 75 per cent. Though depreciation and tax expenses will continue to rise, PAT margin will remain above 30 per cent. Oil and gas sales volumes are also expected to be slightly higher in the second-half of 2010-11.
Profit margins to remain healthy in second-half of 2010-11 (% change over year-ago)
Jun-09
Sep-09
Dec-09
Mar-10
Jun-10
Sep-10
Dec-10 Forecas
t
Mar-11 Forecast
Jun-11 Forecas
t
Sep-11 Forecast
Income -28 -14.8 13.8
12 -11.9 16.2 24.3 14.8 40.2 8.5
Net sales -29.2 -14 24.9
17.8 -10.1 19.7 19.1 15.4 40.1 9.6
Total expenses -28.3 -22.7 5.9 -9 -3 27.8 14 8 39.6 8.7
Raw Materials -95.9 -93.9 -90.8
-87.7 17.4 14.8 49.5 12.3 61.2 77.9
Salaries & Wages -13.2 13 -11.6
-34.1 5.9 8.2 1.7 56.1 35 138.8
Other Expenses -1.5 6.3 -8.5 2.5 17.1 -6.3 12.6 -14.1 19 5.7
Depreciation 13.7 8.8 57.5
5.5 1.3 87.8 0.8 0.9 52.4 3.9
Interest Expenses 36.6 -93.7 293.2
305.1 406.5
1,656 112.4 -37 43.9 -20
Tax Provision -26.3 -10.8 63.6
25.2 -27.5 12.3 46.8 60.8 44.5 2
PBDIT -17.3 -0.6 51 45.1 -18.6 22.8 28.4 23.2 44.1 5.3
PAT -25.8 3.2 37.2
186 -26.3 -3.5 53.9 34 37.2 8.9
Other income/Income (%)
6.6 9.3 1.5 4.6 5.2 6 5.7 4.1 5.3 5
Raw Material/Net Sales (%)
0.9 1.3 1.2 1.6 1.3 1 1.5 1.5 1.5 1.7
Depreciation/PBDIT (%)
30 22.1 45.8
44.4 34.8 36 35.9 36.4 36.8 35.6
Interest/PBDIT (%) 0.1 0.1 0.3 0.9 0.5 0.7 0.5 0.5 0.5 0.5
PBDIT/Net Sales (%) 80.4 71.8 74.6
69.6 73.6 77.6 76.1 75.1 75.8 75.3
PBDIT/Income (%) 81.7 74.4 75 71 74.9 78.9 77.5 76.1 77 76.6
PAT/Income (%) 37.6 38.5 26.4
27 32.3 31.7 32.7 31.5 31.6 31.8
Sales growth to remain healthy in 2011-13 (% change over year-ago) 2006-07 2007-08 2008-09 2009-10 2010-11
Forecast2011-12 Forecast
2012-13 Forecast
Income 20.5 6.5 10.6 -7 10.7 17.1 11.9Net sales 16.8 6.1 12 -4 11 17.5 12.4Total expenses 24.5 7.2 18.4 -14.2 11.3 15.8 11.9Raw Materials 66.3 13.6 29.1 -92.7 23.3 31.3 10.7Salaries & Wages 133.5 -60.8 19.6 -13.6 18.3 41.1 8.7Power & Fuel 13.5 28.8 27.4 -0.2 0.3 8.1 12.3Other Expenses 12.3 3.1 23.4 20.5 14.3 18.1 14.3
64
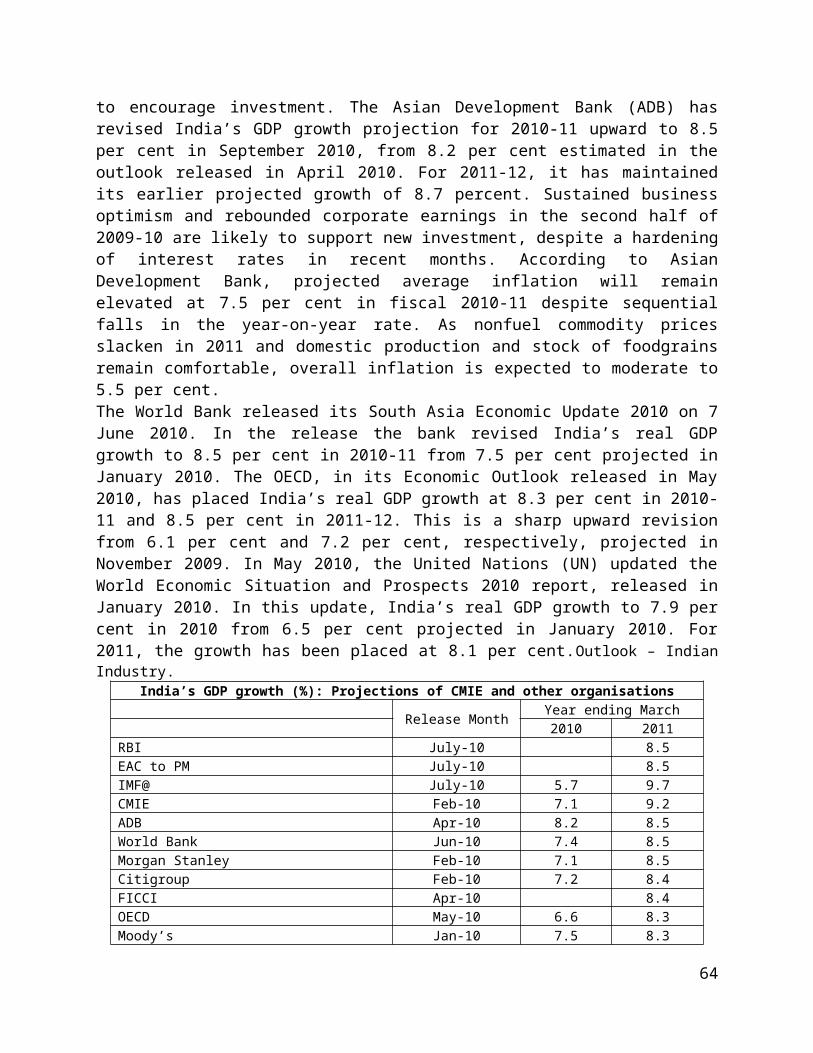
Depreciation -43.6 146.3 94.9 5.6 79.6 3.1 14.7Interest Expenses 7.4 13.7 -5.4 -1.3 16.9 14.4 8.6Tax Provision 10.2 7.1 2.2 12.1 13 17.8 11.8PBDIT 10.6 5.9 -6.9 13.3 9.5 19.6 11.4PAT 8.7 9.1 8 5.6 5.2 4.9 4.5Other income/Income (%)
14.1 15.1 17.5 1.3 1.4 1.5 1.5
Raw Material/Net Sales (%)
28.9 27.9 33.7 35.4 35.9 36 36.7
Interest/PBDIT (%) 0.1 0.2 0.4 0.3 0.5 0.5 0.5PBDIT/Net Sales 63.8 64 58.8 73.8 75.7 76.2 76.3PBDIT/Income(%) 67 67.3 62.1 75.3 76.9 77.4 77.4PAT/Income (%) 31.5 31.3 26.2 32.3 32 32.7 32.6
All income and profit figures are net of prior period and extraordinary transactions. PBDIT is net of other income in PBDIT/Net sales ratio. Growth is not calculated when figures are negative.
Petroleum Products
Growth in petro-products consumption to persist during 2010-13
Domestic consumption of petro-products is expected to remain buoyant during 2011-12 and 2012-13, after an estimated 5.1 per cent growth in 2010-11. The sales of automobiles are expected to remain healthy and grow by around 14-16 per cent in the subsequent two years after 2010-11.
This is expected to keep the demand for auto fuels like petrol and diesel that account almost 52 per cent of the total domestic consumption, high in 2011-12 and 2012-13. The demand for non-auto fuels like air turbine fuel (ATF), bitumen, LPG and furnace oil is likely to remain buoyant, too. An expected 11-14 per cent rise in air passenger traffic and speeding up of road construction projects will boost the demand for ATF and bitumen in the following two years after 2010-11.90 lakh tonnes of refining capacity to be added during November-March 2010-11
CMIE expects the industry to make huge capacity additions in the remaining five months of 2010-11. Refining capacity of 90 lakh tonnes is likely to be added during November- March 2010-11. Bharat Oman Refineries and Indian Oil Corporation (IOCL) will contribute to the increase in capacity.With an addition of 100 lakh tonnes in 2010-11, the refining capacity that stood at 1,844 lakh tonnes at the end of March 2010 is expected to reach 1,944 lakh tonnes by March 2011. In 2011-12 and 2012-13, it is expected that the industry to add 278.1 lakh tonnes and 336 lakh tonnes of refining capacities, respectively. At the end of March 2013, we expect India’s refining capacity to reach 2,558 lakh tonnes.Prices to be higher by 9-10% in December 2010
CMIE expects the crude oil prices to be higher by 9-10 per cent in the December 2010 quarter compared to the year-ago quarter. CMIE expects the prices to remain firm in the next two months on account of healthy winter demand for auto and non-auto fuels.
International crude oil prices rallied in October 2010 crossing even the psychological mark of USD 80 per barrel. Prices inched upwards from USD 80.7 per barrel on 30 September 2010 and remained range bound between USD 83-85 per barrel in the first-half of October 2010.
65
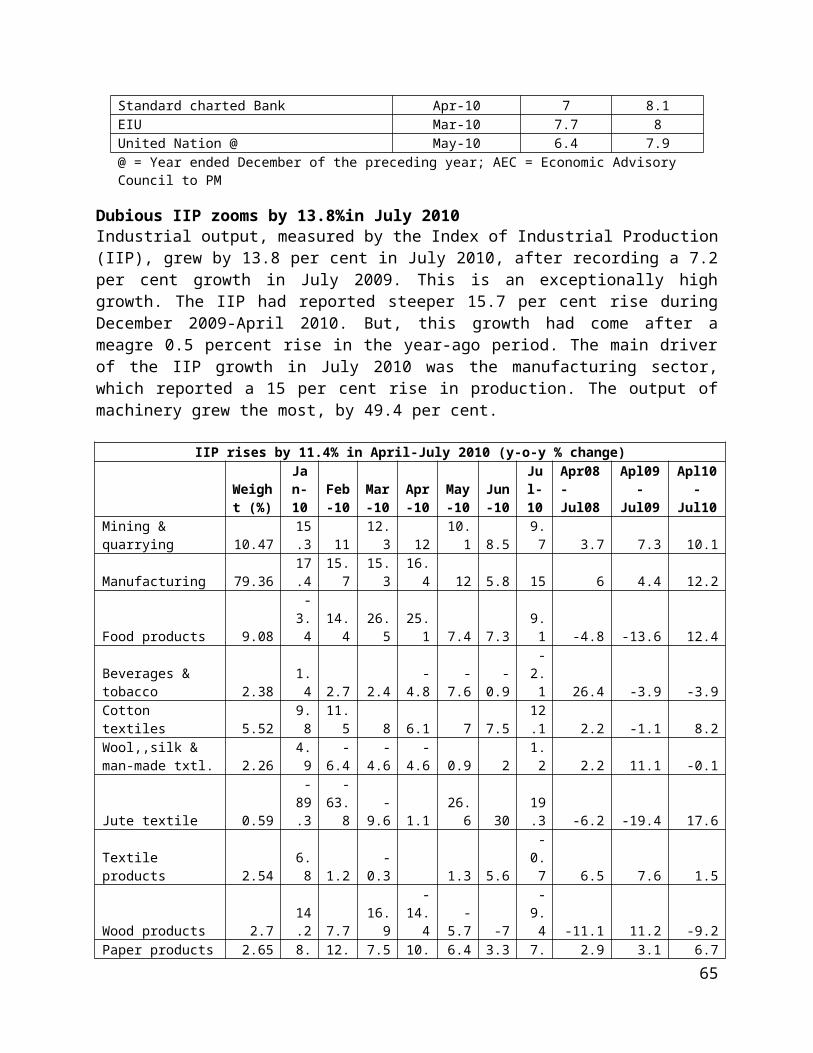
Thereafter, oil prices retreated but remained well above USD 80 per barrel for the rest of the month. Industry to slip in to red in December 2010 quarter
CMIE expects the petroleum products industry to report losses in the December 2010 quarter. It is also expected that the government which generally shares 50 per cent of the under-recoveries incurred by the three oil marketing companies (OMCs), not to compensate for the same during the quarter. This will result in to net losses amounting to 0.5 per cent of total income.CMIE expects the industry to remain profitable in the March 2011 quarter. The government is expected to compensate for its share of under-recoveries made in the second-half of 2010-11, in the March 2011 quarter. This will help the industry make net profits amounting to 4.6 per cent of total income despite higher oil prices. Our forecast is based on the assumption that upstream companies will compensate for 33 per cent of the under recoveries in the second-half of 2010-11.
Petroleum products industry to incur losses in December 2010 quarter (% change over year ago)
Mar-09
Jun-09
Sep-09
Dec-09
Mar-10
Jun-10
Sep-10 Estimates
Dec-10 Forecas
t
Mar-11 Forecas
t
Jun-11 Forecas
tIncome -15.3 -28.2 -23.9 15.2 42.9 29.2 34 10.8 17.7 24.6
Net sales -16.4 -29.6 -24.5 15.8 43.8 31.2 33.8 10.2 17.6 24.5
Total expenses -25.6 -30.4 -25 24.8 58.7 33.4 20.4 19.2 16.1 18.4
Raw Materials -31.2 -33.1 -26.6 26.6 65 38.3 20.7 19.9 19.4 17.5
Salaries & Wages 26.5 -22.1 18.8 -7.6 44.9 -2.3 -3.8 -4.5 -3.3 43.6
Other Expenses 6.8 -28.9 -21.4 29.6 20.5 8.4 1.4 14.5 -2.2 27.1
Depreciation 14.1 42.4 49.1 56.7 63.2 50 30 20.8 11.8 10.5
Interest Expenses 107.2 -2.4 -41.2 -54.7 -38.9 4.9 13.3 5.9 14.8 2.8
Tax Provision 137.8 124.9 55.3 64.6 48.9 -68 158.1 59 -41.4 127.8
PBDIT 212 81.3 21.1 -20.6 -65.2 106.6 -35.5 -2.8 240.4
PAT 405.9 122.3 74.7 -41.4 207.1 3
Other income/Income (%) 1.7 2.4 1.2 1.1 1.1 1 1.4 1.6 1.2 1.1
Raw Material/Net Sales (%)
73.5 88.3 95.1 86.1 84.4 93.1 85.8 93.7 85.7 87.9
Interest/PBDIT (%) 9.4 9.4 15 13.8 7.3 28.4 8.2 22.7 8.6 8.6
PBDIT/Net Sales 16.9 9 4.9 4.9 9.2 2.1 8 1.9 7.3 7.3
PBDIT/Income (%) 18.3 11.2 6 6 10.2 3 9.3 3.5 8.4 8.3
PAT/Income (%) 12.7 5.7 2.2 2.4 5.2 -0.9 5 -0.5 4.6 4.3
All income and profit figures are net of prior period and extraordinary transactions. PBDIT is net of other income in PBDIT/Net sales ratio. Growth is not calculated when figures are negative.
LNG Storage & DistributionLNG storage & distribution industry to witness 26.2% sales growth in December 2010 quarter : The industry is expected to witness a healthy sales growth of 26.2 per cent in the December 2010 quarter on a y-o-y basis. Total expenses are expected to grow by 25.2 per cent on the back of a rise in the raw material expenses during the quarter. Raw material expenses are
66
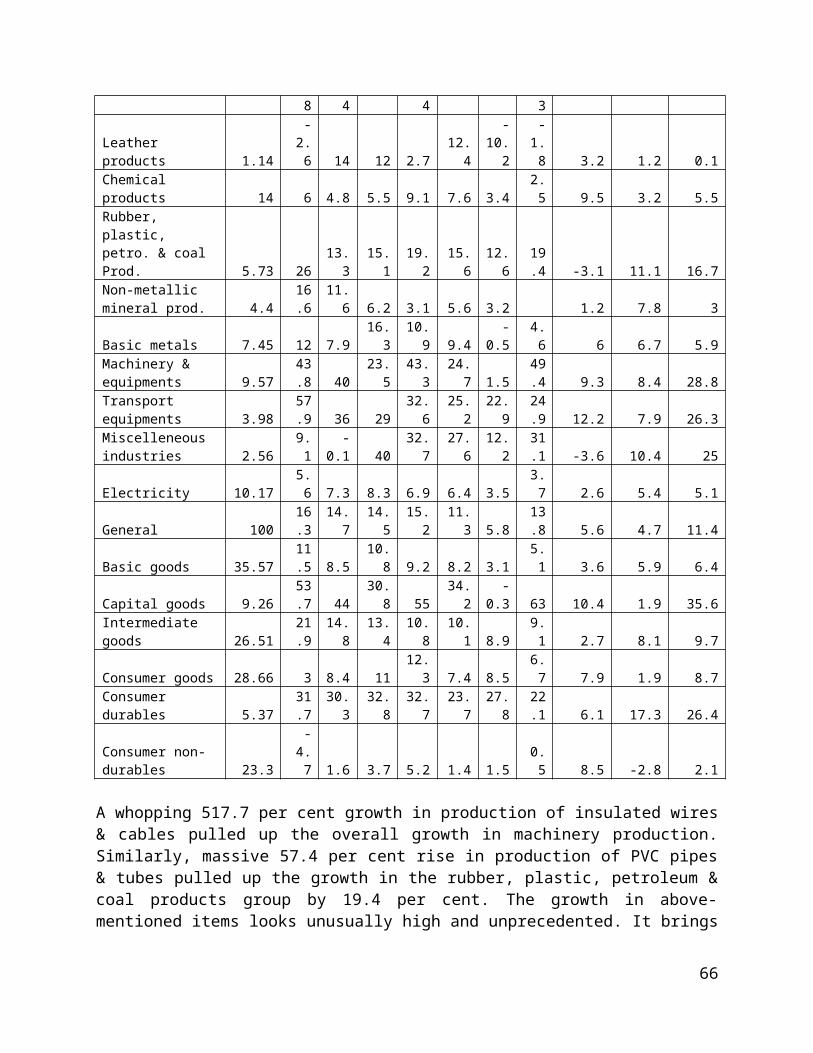
expected to rise by 31.5 per cent owing to a hike in prices of natural gas sold under the administered price mechanism (APM) from USD 1.79 per million British thermal units (mmBtu) to USD 4.2 per mmBtu.GAIL, the largest company in our sample, is expected to report a healthy sales growth in the December 2010 quarter. An increase in supply of natural gas from Reliance Industries’ KG basin is expected to boost GAIL’s transmission volumes on a y-o-y basis. PAT to grow by 28.5%in December 2010 quarter : A 31.5 per cent rise in raw material expenses is expected to drive this growth. Raw material expenses are expected to rise owing to a hike in prices of natural gas. Owing to a slower growth in total expenses compared to sales, PAT is expected to grow by a faster 28.5 per cent.
Net sales to grow by 26.2% in December 2010 quarter (% change over year ago) Mar-
09Jun-09
Sep-09
Dec-09
Mar-10
Jun-10
Sep-10 Estima
te
Dec-10 Foreca
st
Mar-11
Forecast
Jun-11 Foreca
st
Income 30 17.2 23.2 3.4 3.7 12.1 4.9 25.9 18.9 16.9Net Sales 30.6 18.1 24.3 4.9 3.6 12.6 5.2 26.2 18.9 16.1Total expenses 33.9 22.5 28.3 -3.7 1.3 11.5 2.7 25.2 19.1 15.7Raw materials 40.1 26.9 36.7 -8.8 -1.2 10.9 0.2 31.5 25 17.9Salaries & Wages -66.7 45.1 9.4 -18.7 79.4 24.6 31.3 -29.1 34.2 8Other expenses 63.5 23.6 -4.1 -7.9 9.1 -3.2 6.2 13.6 -26.6 6.1Depreciation 1.7 6.2 17.4 19.8 17.5 23.9 16.6 18.6 28.9 19Interest expenses 18.9 7.4 42.2 35 21.5 31.5 1.1 8.5 5.7 6.3Tax provision 8.6 -16.7 -18.4 190.6 2.9 24.9 24.7 -6.2 5.6 -1.8PBDIT 0.8 -13.2 -11.2 120.6 19.9 27.9 20.7 17.1 12.6 14.1PAT -4.4 -16.6 -16 155.2 30.1 30.2 21.7 28.5 12.5 21.1Other income/income (%)
1.3 1.1 1.7 1.6 1.4 0.7 1.4 1.4 1.4 1.3
Raw material/Net Sales (%)
74.2 74.5 77 71 70.7 73.3 73.4 74 74.4 74.4
Interest/PBDIT (%) 4.3 4.1 5 4.3 4.3 4.2 4.2 4 4.1 3.9PBDIT/Net sales (%) 17.4 17.2 16.2 20.6 20.2 20.1 19.2 19.2 19.1 19.1PBDIT/Income (%) 18.5 18.1 17.6 21.9 21.4 20.6 20.3 20.3 20.3 20.2PAT/Income (%) 9.7 9.8 9.7 12.2 12.2 11.4 11.3 12.4 11.6 11.8All income and profit figures are net of prior period and extraordinary transactions. PBDIT is net of other income in PBDIT/Net sales ratio. Growth is not calculated when figures are negative
General Purpose Machinery
Production of general purpose machinery industry to post a brisk rise during 2010-13 All segments of the general purpose machinery (GPM) industry are expected to post a healthy rise in production during 2010-13. Production of compressors is expected to rise by 9-15 per cent during 2010-13. Bearings production is expected to post a healthy 8-11 per cent growth during the same period. Output of gears and valves, too, are expected to grow in the range of 11-18 per cent during 2010-13.Growth in production will be fuelled by a healthy demand from user industries. These products are used in almost all industries and their major demand driver is industrial capex. According to CMIE’s CapEx survey, capacities worth over Rs.17.9 lakh crore are scheduled to get commissioned in the manufacturing sector during 2010-13. The commissioning of these projects will push up the demand for GPM .
67
Sales to grow by a healthy 19.6 per cent in 2010-11 CMIE expect the industry’s sales to grow by a healthy 19.6 per cent in 2010-11 as compared to the modest 6.6 per cent rise reported in 2009-10. It will be fuelled by the rising domestic demand. Enhanced demand from the automobiles and consumer durables will generate demand for bearings and compressors. With investments worth over Rs.4.5 lakh crore (as per CMIE’s CapEx survey), scheduled to be commissioned across manufacturing sector in 2010-11, the other segments of the GPM industry are also expected to do well.Net margin is expected to expand by 40 basis pointsDuring the year, the industry’s raw material expenses are expected to rise by a faster 21.3 per cent compared to the 19.5 per cent rise in income. However, a controlled rise in most other expenses will lead to a slower rise in total expenses. As a result, the industry’s PAT is expected to rise by 25.6 per cent. Its net margin is also expected to expand by 40 basis points to 8.2 per cent during the year.
Compressor production to rise 15.2% in 2010-11Units 2007-08 2008-09 2009-10
Estimate2010-11 Forecast
2011-12 Forecast
2012-13 Forecast
Production Numbers 56,97,403 53,81,167 75,52,283 87,02,796 97,13,477 1,05,51,366Export Numbers 12,13,649 9,15,713 7,58,888 8,54,053 9,26,647 10,24,872Import Numbers 24,25,931 23,91,886 39,05,943 28,98,210 32,66,282 35,07,987Export Rs.crore 655 606.1 448.6 601.3 726.8 897Import Rs.crore 1,498.10 1,475.90 1,675.20 1,446.90 1,798.60 2,173.10Realization Rs./number 5,017.70 5,538.00 5,037.30 5,756.50 6,147.90 6,590.60Sales Rs.crore 2,858.80 2,980.10 3,804.30 5,009.70 5,971.70 6,953.90Domestic market value Rs.crore 3,701.90 3,850.00 5,031.00 5,855.30 7,043.50 8,230.00
Industry’s PAT to grow by 25.6% in 2010-11 (% change over year ago quarter)
Mar-09
Jun-09 Sep-09 Dec-09 Mar-10 Jun-10 Sep-10 Estimates
Dec-10 Forecast
Mar-11 Forecast
Jun-11 Forecast
Income -3.1 -7.2 -0.4 11.8 21.3 27.2 15 16.6 20.4 15.2
Net Sales -3 -7.2 0.5 12.2 20.6 27.6 14.7 16.3 20.8 14.7
Total expenses -7 -8.6 -4.2 6.6 22.8 27.7 16.4 15.9 20.5 14.2
Raw materials -7.7 -9.9 -5.5 7.7 25.7 28.6 16.4 18.5 22.4 15.3
Salaries & Wages 1.3 9.4 1.2 0.6 13.6 10.7 17.1 14 14.9 13.9
Other expenses -11.5 -12 -2.9 2.1 21.9 33 13.8 11.5 10.8 12.4
Depreciation 3.2 4.9 6.4 11.1 12.4 11.3 12.7 11.3 13.5 12.2
Interest expenses 44.6 40.3 -9.2 -42.9 -46.6 -42.7 10.3 34.8 60.4 26.5
Tax provision -14.3 -34.6 -5.3 50.7 36.2 98.2 30 -3 32.5 6.4
PBDIT -15.1 -21.1 -2.8 32.3 30.8 58.7 23.1 5.7 19.5 8.4
PAT -26.5 -31.1 -3.1 57.5 50.3 91.4 24.8 4.9 11.6 6.8
Other income/incomes 1.5 1.7 1.1 1.1 2.1 1.4 1.3 1.4 1.8 1.8
Raw material/Sales 59.7 61 60 61.7 62.3 61.6 60.9 62.9 63.1 61.9
Interest/PBDIT (%) 10.5 12.6 7.5 6.1 4.1 4.5 6.7 7.7 5.5 5.3
PBDIT/Net sales (%) 13.8 11.7 14.7 14.6 14.7 15.4 15.6 12.9 14.8 14
PBDIT/Income (%) 15.1 13.3 15.6 15.6 16.5 16.5 16.7 14.1 16.4 15.6
PAT/Income (%) 7.2 5.7 7.9 7.7 9.1 8.6 8.6 7 8.5 8
68
All income and profit figures are net of prior period and extraordinary transactions. PBDIT is net of other income in
PBDIT/Net sales ratio. Growth is not calculated when figures are negative.
Boilers & Turbines
Boilers & turbines industry to report 22-24% sales growth during 2010-13 Sales growth of boilers & turbines industry, which slowed down to 7.7 per cent in 2009-10, is expected to accelerate in the coming years. In 2010-11, industry sales are expected to rise by a healthy 23.6 per cent. Sales are further expected to rise by 21.9 per cent in 2011-12 and by 23.2 per cent in 2012-13. This rise in sales will be driven by increased demand for power generating equipment due to the addition of new power generating capacities.Boiler production to grow by 25-28%during 2010-13In 2010-11, we expect boiler production to rise by a healthy 28.4 per cent to Rs.16,595 crore. Further, it is expected to rise by 27.7 per cent and 25.3 per cent in 2011-12 and 2012-13, respectively. Demand for boilers mainly stems from additions in thermal power generation capacity. According to CMIE’s CapEx survey, around 1.4 lakh mw of thermal power generation capacities are scheduled to be added during April 2010-March 2015. These capacity additions are expected to drive the demand for boilers in the coming years.To cater to the rising demand, boiler manufacturing companies have been constantly adding capacities. During 2007-10, the industry witnessed capacity additions worth over Rs.1,950 crore. It is further expected to augment its capacity by Rs.3, 140 crore during March 2011-June 2012. These capacity additions would ensure that the industry faces no major capacity constraints in the coming years.Output of turbines to rise at a healthy pace during 2010-13In 2010-11, turbine production is expected to rise by 39.1 per cent to Rs.7, 552 crore. Production is further expected to rise in the range of 30-36 per cent during 2011-13. Turbines are used in the generation of thermal as well as hydro power, and hence their major demand driver is addition of new power generating capacities in the country. According to data compiled by CMIE’s CapEx service, 1.4 lakh mw of thermal power generating capacities and 13,000 mw of hydro power generating capacities are scheduled to be added during April 2010 - March 2015. These will ensure that the demand for turbines remains healthy in the ensuing years.
Boiler domestic market value to rise 27.3% in 2010-11
Units 2007-08 2008-09 2009-10 2010-11 Forecast
2011-12 Forecast
2012-13 Forecast
Production Rs.crore 8,231.30 10,155.70 12,922.10 16,595.00 21,193.30 26,556.90
Export Rs.crore 732.6 955 844.7 1,058.40 1,256.50 1,467.50
Import Rs.crore 1,395.40 2,263.30 2,095.80 2,499.20 2,864.10 3,194.90
Domestic market value Rs.crore 8,894.20 11,464.00 14,173.30 18,035.80 22,800.90 28,284.30
Industry sales to rise 23.6% in 2010-11 (% change over year-ago quarter) Jun-
09Sep-09
Dec-09
Mar-10
Jun-10
10-Sep
Dec-10 Forecast
Mar-11 Forecast
Jun-11 Forecast
Sep-11 Forecast
Income 0.2 -4.3 3.6 19.9 18.7 30.9 27 18.6 21.4 17.6
69
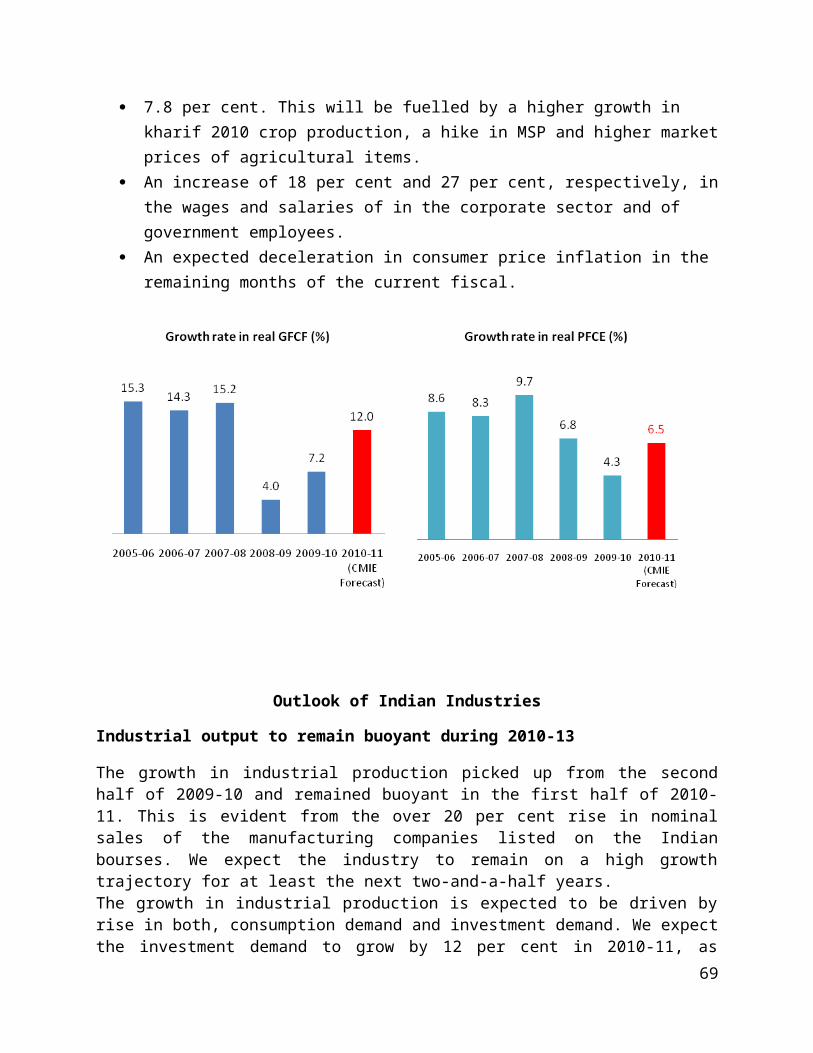
Net Sales -1.2 -5.3 3.4 22.7 20.9 32.6 27.3 18.5 21 17.8Total expenses 5.5 -9.7 0.4 18.5 17.8 32.4 25.5 19.4 21.1 19Raw materials 3.6 -15.6 -0.7 15.5 19.2 43.8 32.7 25.4 25.3 19.5Salaries & Wages 20.3 18.1 29 24.4 20 20.6 21.7 11.5 27.6 27.3Other expences -14.5 -26.2 -31.3 10.6 3.4 10 11.3 13.2 12.2 11.9Depreciation 23.7 16.2 23 64.4 36.9 48.2 10 -22.3 9.3 4.3Interest expenses 249.8 119.9 33.1 20.7 14.4 -22.7 -12.9 -19.6 -21.8 3.3Tax provision 8 28 26.1 46.2 25.7 11.4 4.2 6.3 -13.3 13.5PBDIT -32.5 15.3 29.9 37.4 61.8 32.9 -0.1 1.5 -2.1 -6.1PAT -82.4 -2.8 33.2 30.7 267 58.8 -2 3.6 12.5 -18.4Other income/income (%) 4.8 3.8 2.9 1.7 3 2.6 2.6 1.8 3.3 2.4Raw material/Net Sales (%) 62.5 59.1 62.1 59.8 61.6 64.1 64.8 63.3 63.8 65Interest/PBDIT(%) 21.9 11.6 9.7 5.9 15.5 6.7 8.4 4.7 12.3 7.4PBDIT/sales(%) 5 14.9 17.2 18.2 10.4 16.3 13.2 15.3 7.5 12.6PBDIT/Income(%) 9.6 18.1 19.6 19.7 13 18.4 15.4 16.8 10.5 14.7PAT/Income(%) 1.4 8.6 9.8 9.8 4.5 10.4 7.6 8.6 4.1 7.2All income and profit figures are net of prior period and extraordinary transactions. PBDIT is net of other income in PBDIT/Net sales ratio. Growth is not calculated when figures are negative.
Tractors
Tractor sales to rise by 9-15% during 2010-13 : CMIE expects tractor off-take to further rise by 11.1 per cent and by 9.1 per cent in 2011-12 and 2012-13, respectively. A healthy demand from the agricultural sector will continue to fuel the growth in tractor sales. An expected 3-7 per cent rise in major crop production during 2010-13, coupled with an increase in MSP, will increase farm income and generate demand for farm equipments. Further, the easy availability of credit at favorable interest rates and terms will increase the affordability of tractors. This, along with low tractor ownership, will boost demand in the next two and a half years.
Industry’s sales to rise 18.7% in September 2010 quarter (% change over year ago quarter)
Mar-09
Jun-09
Sep-09 Dec-09 Mar-10
Jun-10
Sep-10 Forecast
Dec-10 Forecast
Mar-11 Forecast
Jun-11 Forecast
Income -4.8 9.6 9.6 22.5 34.3 36.6 18.4 26.2 16 7.5
Net Sales -5.8 9.6 9.4 22.5 35.3 36.8 18.7 26.4 16.4 7.6
Total expenses -4.4 0.6 9.8 14.3 33.9 37.6 24.6 25.2 19.4 8.1
Raw materials -13.4 -7.5 6.8 15.4 49.7 47.6 28.7 33.6 23.1 9.5
Salaries & Wages -3 13 27.5 18.2 29.8 37.1 12.9 11.1 12.2 7
Other expenses 37 22.1 23 9.5 5.3 16 11 14.4 13.3 10.3
Depreciation -6.7 4.7 -3.4 5.3 -17.2 -20.2 -16.3 -13.6 4.8
Interest expenses 8.8 -8.4 12.3 -45.5 -63.7 -45.7 -51 -43.3 2.1 1.8
Tax provision 71.4 277.8 995.5 6.7 17.3 -1.4 6.4 -31.5
PBDIT -36.9 59.4 119.7 179.7 222.9 37.5 -36.9 -9.9 -42.7 -25.5
PAT 1,334.60 535.6 -74.4 21 -79.8 -39.2
Other income/income (%) 1.4 0.4 0.6 0.3 0.6 0.3 0.3 0.2 0.3 0.2
Raw material/Net Sales (%) 62.5 66.9 65.6 67.5 69.1 72.2 71 71.3 73.1 73.4
Interest/PBDIT (%) 95.6 27.8 19.9 23 10.7 11 15.4 14.5 19.1 15
PBDIT/Net sales (%) 2.1 7.7 9.6 6.8 7.8 7.9 5.1 4.9 3.9 5.5
PBDIT/Income (%) 3.5 8.1 10.1 7.2 8.4 8.2 5.4 5.1 4.1 5.7
70
PAT/Income (%) -3.9 0.7 7.1 1.7 4.3 3.4 1.5 1.6 0.8 1.9
All income and profit figures are net of prior period and extraordinary transactions. PBDIT is net of other income in PBDIT/Net sales ratio. Growth is not calculated when figures are negative.
Construction Equipment
Driven by the increased demand for construction equipments, CMIE expect the production of equipments like cranes and lifts & escalators to grow at a healthy pace in the next three years. Demand for cranes from construction and shipping (ports) sectors is expected to remain healthy in the coming years. CMIE expects the production of cranes to grow by 20.4 per cent, 12.6 per cent and 14.9 per cent during 2010-13. A large proportion of cranes required by the above mentioned sectors will be of high tonnage, the demand for which cannot be met domestically. Production of lifts & escalators is expected to revive in 2010-11 and grow by 21.7 per cent. It is expected to rise further by 18.4 per cent and 9.5 per cent in 2011-12 and 2012-13, respectively.
Margins to contract in 2010-11
Mar-09
Jun-09
Sep-09
Dec-09
Mar-10
Jun-10
Sep-10 Estimates
Dec-10 Forecast
Mar-11 Forecast
Jun-11 Forecast
Income 20.7 33.9 0.8 19.7 8.2 21.2 29.5 20.34286 19.6 16.3
Net sales 22.5 35.7 1 22.2 5.3 20.1 29.8 15.4 23.4 16.9
Total expenses 25.6 27 4.7 20.4 -3.1 18.2 24.4 15.3 30.7 14.6
Raw materials 24.3 22.3 1.8 23.7 -5.4 17.4 31.4 17.9 36.6 17.8
Salaries & wages 37.9 18.9 9.8 10.9 -17.4 12.9 9.9 15 34.8 15.2
Other expenses 21 52.3 11 16.3 24.5 26.4 16 15 18 8.2
Depreciation 44.8 38.6 23.6 24.7 17.5 20 18.5 15 13.8 19.3
Interest expenses 93.6 100.6 61 18.2 -27.2 -10.8 -21.9 -14.7 12.3 13.7
Tax provision 14.4 -4 -33.8 12.2 -15.6 49 70.6 4.1 8.7 -0.4
PBDIT 23.7 36.6 -19.4 14.1 -4.9 30 31.3 1.7 9.5 5.7
PAT 18.3 29.8 -41.1 11.8 3 59.8 55.6 3.9 8.9 -0.3
Other income/incomes 1.2 1.4 1.8 1.4 3.9 2.2 1.6 1.4 0.8 1.7
Raw material/Net sales (%) 64.6 66.4 67.4 64.9 58.1 65.1 68.2 66.3 64.3 65.7
Interest/PBDIT (%) 11.1 29.1 27.8 17.3 8.6 20.5 16.5 14.6 8.8 22.1
PBDIT/Net sales (%) 15.8 8.5 9.3 12.5 11.4 8.2 9.6 10.9 12.9 7.8
PBDIT/Income (%) 16.8 9.7 11 13.8 14.8 10.3 11.1 12.1 13.5 9.3
PAT/Income (%) 9.3 3.5 4.5 6.9 8.9 4.5 5.4 6.2 8.1 3.8
All income and profit figures are net of prior period and extraordinary transactions. PBDIT is net of other income in
PBDIT/Net sales ratio. Growth is not calculated when figures are negative.
Construction and Allied Activity
71
Construction sector to continue its healthy growth momentum in coming years CMIE expect the construction sector to grow by about 10 per cent per annum during the next three years ending March 2013. This growth will be driven by increased activity in the industrial and infrastructure construction segments. The government’s thrust of infrastructure creation to boost the overall economic growth is expected to add to the order books of construction companies. Additionally, the increase in capex projects being announced by companies in the manufacturing segment will also augur well for the industry. Order books of construction companies likely continue to strengthenThe order books of most other companies would have also risen handsomely during the third quarter. This is evident in the rise in order inflows of companies like Lanco Infratech, Nagarjuna Constructions and IVRCL, among others. CMIE expect the order books of these companies to rise further in the coming years. The government’s emphasis on infrastructure creation to boost the overall economic growth will continue to give impetus to the order booking opportunities of construction companies. Additionally, the increase in new project announcements by companies in the manufacturing sector will also augur well for the industry. Driven by this, we expect the construction sector (construction component of GDP) to grow by around 10 per cent per annum in 2010-11, 2011-12 and 2012-13.The industry’s PBDIT margin is expected to contract by 200 basis pointsThe industry’s PBDIT margin is expected to contract by 200 basis points to 14.6 per cent. Its net margin will also contract to six per cent from 7.8 per cent during 2009-10. The industry’s sales growth is expected to accelerate from around 15 per cent during the first half of 2010-11 to around 25 per cent during the second half of the year. As a result, aggregate sales during the year are expected to be higher by around 20.2 per cent. In spite of this healthy rise in sales, the industry is expected to face pressure on its margins on account of higher expenses. Prices of raw materials like steel are expected to rise sharply during the second half of the current year. This would lead to a sharp 23.2 per cent rise in the raw material expenses of the industry. Its wage bill is also expected to see a steep increase during the year. This steep rise in expenses, along with a fall in its other income will lead to a contraction in its margins.
Industry margins to contract during 2010-11(% change over a year ago)
Mar-09 Jun-09
Sep-09
Dec-09
Mar-10
Jun-10
Sep-10 Estimates
Dec-10 Forecast
Mar-11 Forecast
Jun-11 Forecast
Income 31.6 27.8 19.7 10.9 20.2 8.5 15.8 26.3 24.2 20.7
Net Sales 31.6 21.5 15.6 11.3 20 12.3 18.6 25 23 20
Total expenses 31.6 18.2 17 10.5 21.7 17.8 19.1 29.2 25.6 19
Raw materials 29 7.9 1.5 3 19.1 12.7 20.9 32.5 24.7 21
Salaries & Wages 23.2 15 12.6 2.8 24 21.9 20.6 36.6 31.2 22.8
Power & Fuel - -98.4 -98.1 -97.7 38.4 78.6 - -25 -99.8 6
Selling & marketing 108 33.9 13.8 -3.9 42 0.2 28 3.7 -
Other expenses 34.2 24.2 29.6 15.9 21.4 19.3 21.3 27.3 27.5 19.3
Depreciation 41.9 35.5 28 26.2 10.9 21.8 19.3 20.1 16.9 11.1
Interest expenses 68.3 80.9 52.5 16 35.8 22.3 11.1 25.3 37.4 12.7
Tax provision 18.8 16.6 36.6 39 40.5 35.4 -12.8 12 5.4 1.2
PBDIT 28.4 76.1 36.4 28.5 20.7 -5.1 -4.3 13.7 13.8 7.2
PAT 20.6 115.3 27.7 32.2 9.2 -30.4 -13.2 6.4 8 5.7
Other income/incomes 1.9 6.5 5.1 1.5 2.1 3.2 2.8 2.4 3.1 3.8
72
Raw material/Sales 39 35.2 36.6 35.6 38.3 36.1 37.3 37.8 38.8 36.4
Interest/PBDIT (%) 17 19.2 23.7 23.6 19 24.8 27.5 26 22.9 26.1
PBDIT/Sales (%) 13.6 13.3 11.7 14.9 13.6 14 11.1 12.4 11.4 11.5
PBDIT/Income (%) 15.2 19 16.4 16.2 15.4 16.8 13.6 14.5 14.1 14.9
PAT/Income (%) 7.7 10.6 6.9 7 7.1 6.8 5.2 5.9 6.2 6
All income and profit figures are net of prior period and extraordinary transactions. PBDIT is net of other income in
PBDIT/Net sales ratio. Growth is not calculated when figures are negative.
Polymers
Polymer industry’s capacity to rise during 2010-13
The domestic polymer industry is expected to fasten its capacity additions during 2010-13. The industry is expected to add 116.9 thousand tones of capacity in 2010-11. Hence, the outstanding capacity of the industry is expected to rise from 9725 thousand tons in 2009-10 to 9841.9 thousand tones by the end of March 2011. Some of the projects expected to be commissioned in 2010-11 are:
Vinati Organics’ Ratnagiri Diacetone Acrylamide project is expected to be commissioned in December 2010. The plant is expected to manufacture 12.5 thousand tons per annum of different types of polymers. The project envisages a cost of Rs.77 crore.
Lanxess India’s Jhagadia Ion Exchange & Rubber Chemicals project is expected to be commissioned in December 2011. The project envisages a cost of Rs.335 crore and is expected to be set up at Jhagadia in Gujarat.
Supreme Petrochem’s Amdoshi Cup Grade & Eps project is expected to be commissioned in March 2011. The project is expected to add an annual capacity of 44.4 thousand tones of Expandable Polystyrene.
Rise in polymer prices to drive sales growth in December 2010 quarterThe polymer industry is expected to witness a healthy sales growth in the December 2010 quarter, primarily driven by rise in polymer prices. CMIE expects the polymer prices to be higher by 14-15 per cent in the December 2010 quarter compared to the year-ago quarter. With the rise in polymer prices, realizations of polymer companies are expected to improve, resulting in a healthy growth in net sales. CMIE expects net sales of the polymer industry to grow by 23.1 per cent in the December 2010 quarter.The PBDIT margin is likely to contract by 220 basis points to 10.5 per cent in the December 2010 quarterThe PBDIT margin is likely to contract by 220 basis points to 10.5 per cent in the December 2010 quarter compared to the year-ago quarter.Since, Raw material expenses account for more than 70 per cent of the total sales of the industry. Raw materials of the industry like ethylene, ethylene dichloride, etc. are crude derivatives. CMIE expects crude oil prices to rise by 8-9 per cent in the December 2010 quarter compared to the year-ago quarter. As a result, the raw material expenses are expected to grow by 28.4 per cent during the quarter. A faster growth in raw material expenses than sales will restrict the growth in PBDIT to just 2.2 per cent in the December 2010 quarter.
73

HDPE import volumes to rise during 2011-13 Units 2007-08 2008-09 2009-10 2010-11
Forecast2011-12 Forecast
2012-13 Forecast
Production Tonnes 9,68,294.0 9,40,142.0 8,56,275.0 10,53,004.2 12,48,409.2 12,98,473.9Export Tonnes 1,15,453.2 94,957.80 16,116.80 89,610.00 87,388.60 84,400.80Import Tonnes 2,00,840.4 2,21,505.7 3,84,951.9 4,08,729.1 4,16,921.2 5,21,662.9Export Rs.crore 653.8 543.3 87.7 544.1 555.4 546.5Import Rs.crore 1,182.20 1,410.30 2,258.20 2,582.40 2,685.40 3,422.60Realization Rs./kg 78.7 79.4 75 82.1 84.8 86.3Sales Rs.crore 7,625.20 7,466.60 6,421.70 8,639.90 10,580.30 11,209.70Domestic market value Rs.crore 8,153.50 8,333.70 8,592.20 10,678.10 12,710.20 14,085.90
LDPE output to remain range bound between 1.93-1.97 lakh tonnes during 2011-13 Units 2007-08 2008-09 2009-10 2010-11
Forecast2011-12 Forecast
2012-13 Forecast
Production Tonnes 1,98,139.0 1,91,214.0 1,92,601.0 1,93,420.1 1,94,892.9 1,96,698.1Export Tonnes 36,053.40 32,360.10 7,744.50 30,000.00 28,259.50 25,570.80Import Tonnes 2,49,365.1 3,08,115.3 5,37,505.3 6,16,730.6 7,07,135.4 8,33,706.8Export Rs.crore 215.8 197.9 45.2 204.2 202.2 185.6Import Rs.crore 1,471.70 1,993.00 3,254.60 4,259.10 4,918.10 5,881.80Realization Rs./kg 86.4 92.4 85.6 98.7 100.8 102.3Sales Rs.crore 1,711.00 1,767.50 1,649.20 1,908.10 1,964.30 2,011.20Domestic market value Rs.crore 2,966.90 3,562.60 4,858.60 5,963.00 6,680.20 7,707.40
Net sales to rise by 23.1% in December 2010 quarter (% change over year-ago) Mar-09 Jun-09 Sep-09 Dec-09 Mar-
10Jun-10
Sep-10 Estimates
Dec-10 Forecast
Mar-11 Forecast
Jun-11 Forecast
Income -19.2 -10.6 -8.8 21.3 30.3 39 46.3 22.8 15.9 13.5Net Sales -14.9 -10.8 -8.7 21.2 31.5 39.1 44.9 23.1 15.5 13Total expenses -13.3 -10.8 -6.3 15.7 43 38.4 32.5 28.2 11 18.5Raw materials -19.5 -17.9 -11.2 14.9 57.3 53.3 40.2 28.4 7.8 17.4Salaries & Wages 9.5 6.2 20.7 10.2 16 13.1 10.2 26.1 36.6 34.4Power & Fuel -21.4 -18.5 9.8 22.9 15.4 15.1 9.2 10.7 22.5 27.8Other expenses 5.3 -0.2 -6.6 -10.2 -0.4 14 16.5 52 16.9 12Depreciation 7.4 8.9 12.2 21.7 15.2 19.8 5 15 27.2 25Interest expenses 34.3 41.5 24.1 6.8 9.9 15 10.6 9.2 3.1 2.5Tax provision 22.7 284.9 316.5 - 64.3 -56.7 1 60 30 100PBDIT -32.6 62.1 77.7 - 14.8 -31 -3.5 2.2 5.1 58.8PAT -62.2 76 1,537.40 - -1.2 -78.4 -31.7 -28.3 -27.2 325.1Other income/incomes 2.4 2.3 1.1 2.1 1.5 1.6 2.1 1.8 1.9 2.1Raw material/Sales 65.7 66.8 80.5 70.4 78.6 72.4 77.8 73.4 73.4 75.2Interest/PBDIT (%) 25.4 22.4 30.4 24.6 24.3 39.3 34.8 26.3 23.8 25.4PBDIT/Sales (%) 12.1 15.3 12 10.4 11.2 7.4 6.6 8.9 9.7 10.5PBDIT/Income (%) 14.3 17.2 13 12.7 12.6 8.9 8.6 10.5 11.4 12.4PAT/Income (%) 5.1 6.7 3.4 4.1 3.9 1 1.6 2.4 2.4 3.7All income and profit figures are net of prior period and extraordinary transactions. PBDIT is net of other income inPBDIT/Net sales ratio. Growth is not calculated when figures are negative.
Cement
74
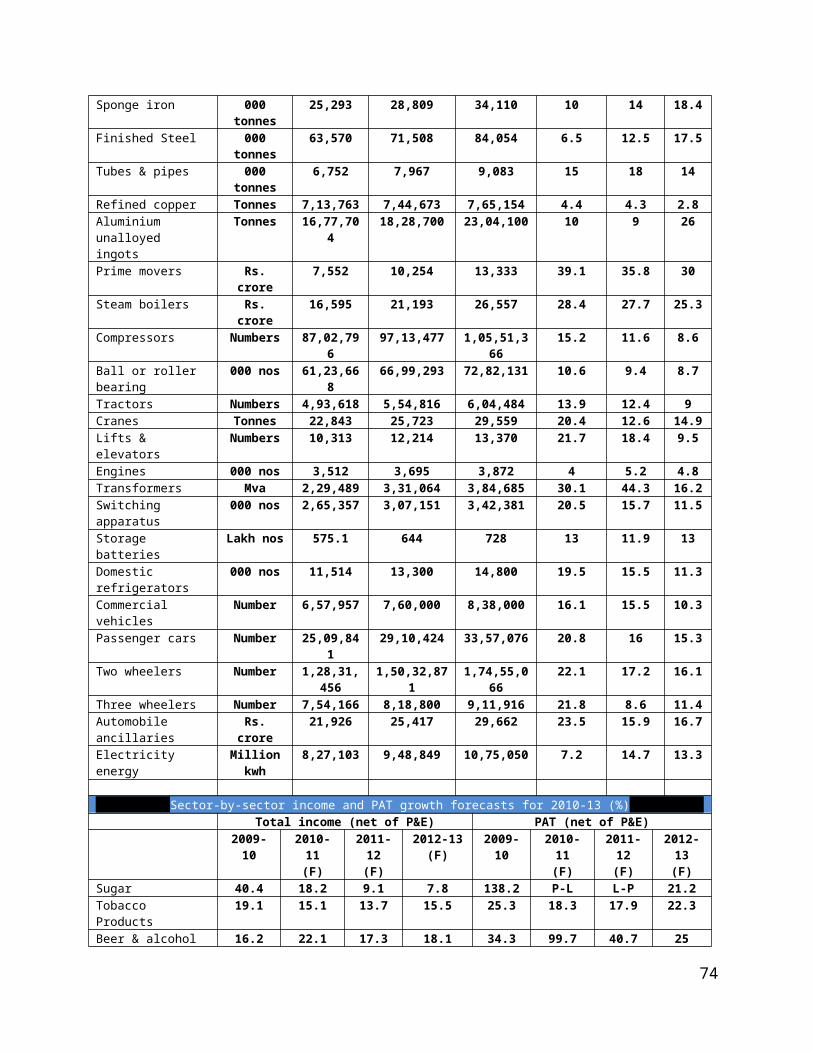
Healthy demand to drive production growthCement production is expected to grow at a CARG of 10.6 per cent during 2010-13. Production is expected to rise to 271.2 million tons by the end of March 2013. This would be driven by a healthy demand and huge capacity additions in the industry. Bullish on the long term demand prospects from infrastructure and realty sectors, cement industry is on a major expansion drive. Cement industry is expected to add 34 million tones of capacity in 2010-11. Of these, 9.5 million tones of capacity have already been added in the first half of the year. The industry is expected to add 22.9 million tones and 44.6 million tones of capacity in 2011-12 and 2012-13, respectively. The industry is expected to have a total installed capacity of 392.8 million tons by the end of March 2013. Dispatch growth accelerates to 6.2%in September 2010Cement production growth numbers reflected the trend in dispatches. Production growth accelerated to 4.8 per cent in September 2010. For the September 2010 quarter, cement production grew by a modest 2.1 per cent to 475.6 lakhs tones. Cement demand is expected to pick up in the second half as construction activity revives post monsoons. However, taking cognizance of the dull growth in dispatches during April-September 2010, we have downward revised our cement dispatches growth forecast for 2010-11. Dispatches are expected to grow by 8.9 per cent as against 10.8 per cent growth expected earlier. Dispatch growth is expected to accelerate to 11.8 per cent in the December 2010 quarter and 13.1 per cent in the March 2011 quarter.
Cement production to grow at a CARG of 10.6% over three years ending March 2013
Units 2007-08 2008-09 2009-10 2010-11 (Forecast)
2011-12 (Forecast)
2012-13 (Forecast)
Capacity Lakh tonnes 2,013.20 2,368.70 2,916.20 3,252.40 3,481.60 3,927.70
Production Lakh tonnes 1,683.20 1,814.20 2,007.20 2,195.20 2,432.10 2,712.00
Dispatches Lakh tonnes 1,676.70 1,810.10 1,997.90 2,176.20 2,403.60 2,670.20
Export Lakh tonnes 34.2 32.6 26.9 55.8 68.4 84.2
Import Lakh tonnes 6.2 10.3 21.1 9.7 4.2 1.5
Export Rs. crore 822.1 880.9 665.7 1,201.10 1,488.40 1,849.20
Import Rs. crore 218.2 345.1 568.3 263.8 110.8 39.2
Realization Rs./tonnes 3,572.00 3,728.10 3,798.50 3,638.40 3,529.30 3,494.00
Sales Rs. crore 59,892.10 67,481.60 75,890.20 79,178.90 84,829.10 93,295.70
Domestic market value Rs. crore 59,288.10 66,945.80 75,792.80 78,241.60 83,451.50 91,485.70
Rising input costs to affect industry profitability in December 2010 quarter (% change over a year ago)
Mar-09
Jun-09
Sep-09
Dec-09
Mar-10
Jun-10
Sep-10 Estimates
Dec-10 Forecast
Mar-11 Forecast
Jun-11 Forecast
Income 11.6 22.9 21.6 5.2 7.4 -1.2 -6 14.1 13.4 13.5
75
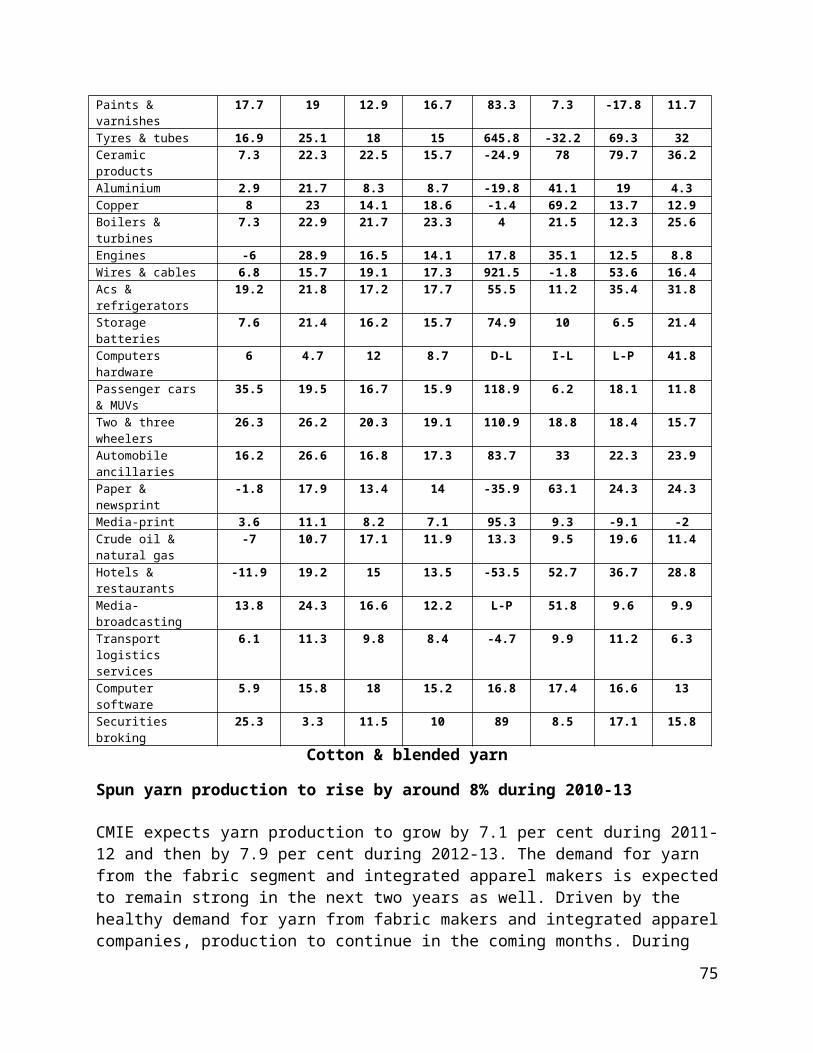
Net Sales 13.4 25.3 21.2 5.7 6.7 -1.3 -6.5 14 13.1 13.4
Total expenses 10 18.9 17.7 6.4 15.5 9.8 5.8 14.2 15.1 14.5
Raw materials 2 24.9 34.7 13.2 31.6 12 13 17.1 15.6 16.8
Salaries & Wages 4.3 17.9 22.2 3 18.9 14.3 22.7 23 25 17
Power & Fuel 16.9 5.2 -3.2 -11.9 4.7 16.1 13 18 22 17.7
Selling & marketing 6.5 -3.6 -5.6 -14.9 -4.8 15.1 5 16 13 11
Freight & Distribution 13.1 18.2 20.9 15.1 19 15.2 9 14 14.8 11.2
Other expenses 8 14.3 8.9 14.5 19.3 15.3 13 15.3 13.2 13
Depreciation 32 36.2 29.6 31.3 20.1 22.3 19 19 14 15
Interest expenses 44.6 38.3 23.6 4.2 18.5 20.2 11 16 16 17.4
Tax provision -7.6 44.8 69.5 13.8 -15.7 -43.2 -78.4 -31.9 -10.4 -0.6
PBDIT 6.4 33.6 54.1 0.7 -6.2 -28.1 -52.8 -2.8 -0.6 3.4
PAT 0.7 28.2 64.2 -18.5 -20 -41.3 -75.6 -7.2 -7.4 -5.2
Other income/incomes 1 1.2 1.5 0.6 1.6 1.4 2 0.7 1.8 1.4
Raw material/Sales 17.8 18.9 18.8 19.4 20.1 20.4 22.8 19.9 20.5 21
Interest/PBDIT (%) 8.4 6.7 7.9 11.3 11.4 11.3 18.5 13.5 13.3 12.9
PBDIT/Sales (%) 27.6 31.8 30.5 22.7 23.7 23 14.1 19.2 20.7 20.9
PBDIT/Income (%) 28.3 32.7 31.5 23.2 25.2 24.1 15.8 19.7 22.1 22
PAT/Income (%) 14 17.9 16.6 9.1 10.6 10.8 4.3 7.4 8.7 9
All income and profit figures are net of prior period and extraordinary transactions. PBDIT is net of other income in
PBDIT/Net sales ratio. Growth is not calculated when figures are negative.
Paper, News Print & Paper Products
Paper output to grow at a CARG of 7.7% during 2011-13The healthy demand for printing & writing paper (PWP), industrial and packaging paper (Kraft paper, corrugated boards and duplex boards) is expected to continue well into 2011-12 and 2012-13. To meet the rising demand, paper mills have lined up capacity additions of 5.9 lakh tones and 8.7 lakh tones, respectively, in each of these years. With this, the industry’s capacity is expected to touch 97.5 lakh tones by March 2013. Hence, CMIE expects paper production to grow by a healthy eight per cent in 2011-12 over and above the six per cent growth expected in 2010-11. Production is expected to grow by a healthy 7.3 per cent in 2012-13 on the back of a sustained growth in demand. Rising literacy levels and increasing government thrust on achieving compulsory school education is expected to boost the demand for PWP. Increasing urbanization and a healthy strong outlook for industrial production is expected to increase the demand for industrial and packaging paper. Newsprint production to grow at the rate of 10.2% per annum during 2011-13CMIE expect production to grow by a healthy 9.1 per cent in 2011-12 over and above the 7.1 per cent growth expected in 2010-11. Production volumes are expected to cross the pre-slowdown (2009-10) levels in 2011-12. Production growth is expected to accelerate to 11.4 per cent in 2012-13. This is been on account of Advertisement volumes and revenues which are expected to grow at a healthy pace on the back of a robust economic outlook. This is likely to result in an increase in pagination and therefore an increase in demand for newsprint.
Domestic realizations of paper to grow at the rate of 1.3% per annum during 2011-13
76
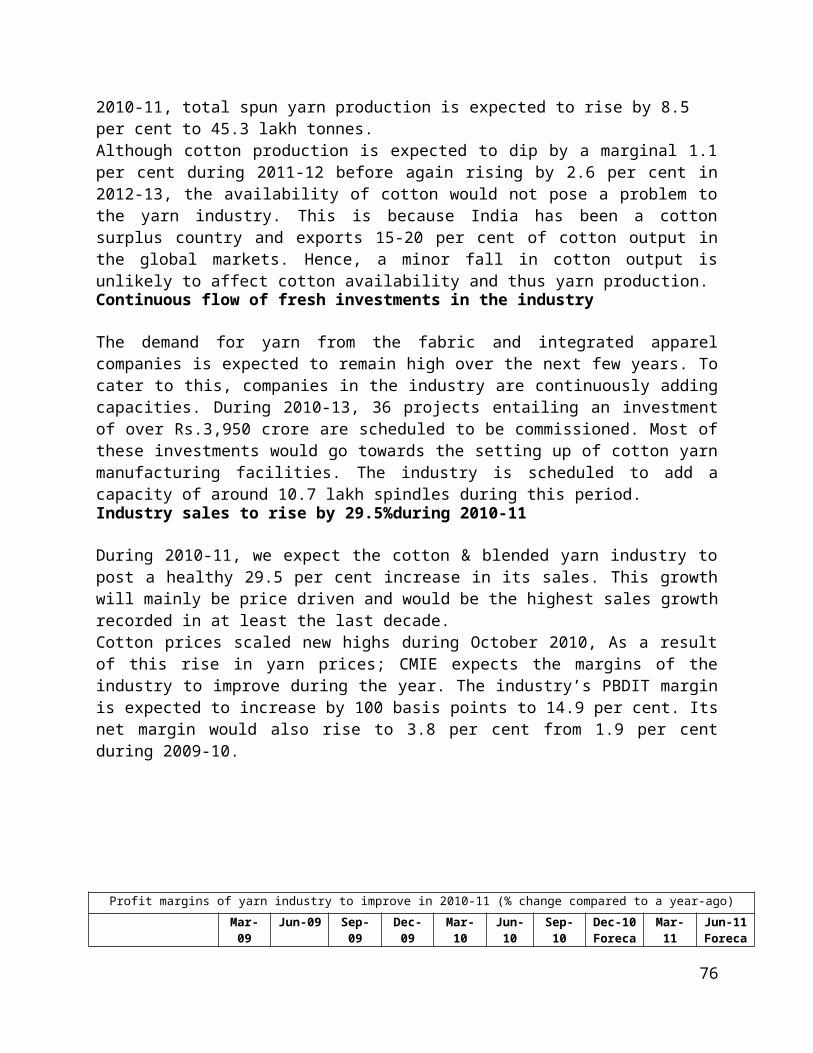
Units 2007-08 2008-09 2009-10 Estimate
2010-11 Forecast
2011-12 Forecast
2012-13 Forecast
Capacity Tonnes 69,43,000.0
72,55,000.0
76,17,900.0
82,84,650.0
88,72,750.0
97,47,250.0
Production Tonnes 62,88,658.0
65,42,839.0
70,66,337.0
74,90,084.0
80,89,921.0
86,81,911.0
Export Tonnes 3,25,553.4 3,33,693.7 3,68,643.6 3,94,817.0 4,18,506.0 4,50,270.0Import Tonnes 4,51,347.4 4,37,073.6 6,14,045.6 6,69,310.0 7,10,138.0 7,42,094.0Export Rs. crore 1,071.90 1,298.40 1,544.90 1,697.70 1,841.40 2,071.20Import Rs. crore 2,643.00 3,254.40 3,791.60 4,484.40 4,782.10 5,147.20Realisation Rs./
tonnes30,826.20 33,386.20 31,725.00 33,946.00 34,014.00 34,864.00
Sales Rs. crore 19,385.60 21,844.10 22,418.00 25,425.80 27,517.10 30,268.60Domestic market value Rs. crore 20,956.60 23,800.10 24,664.60 28,212.50 30,457.70 33,344.50
Net sales, profits to grow at a healthy pace during 2011-13
A sustained healthy growth in demand from the academic, corporate, industrial and retail segments is expected to drive the growth in the paper industry’s sales volumes during 2011-13. Realizations are also expected to increase during these years. Hence, CMIE expect the net sales of the paper & newsprint industry to grow by a healthy 13.3 per cent and 14 per cent, respectively, in 2011-12 and 2012-13. The industry is expected to face cost pressures on raw material front even in 2011-12 and 2012-13. Raw material expenses are expected to grow at a faster pace than net sales in each of these years, partially due to a rise in wood pulp prices. Its proportion in net sales is expected to increase to 48.2 per cent and 48.9 per cent, respectively, in 2011-12 and 2012-13 from 47.9 per cent expected in 2010-11. However, with the remaining expenses expected to grow at a slower pace than income, the industry’s net profit is expected to grow by a robust 24.3 per cent in each of the two years ending March 2013.
Net profit of the paper & newsprint industry to grow by 24.3% each in 2011-12 and 2012-13 2006-07 2007-08 2008-09 2009-10 2010-11
Forecast2011-12 Forecast
2012-13 Forecast
Income 12.7 -2.9 14.8 -1.8 17.9 13.4 14Net Sales 13.1 -2.3 15.6 -1.7 18.1 13.3 14Total expenses 13.9 -0.5 17.5 -1.8 16.7 12.7 13.6Raw materials 20.5 -0.8 17.1 -5.8 19.2 14.3 16Salaries & Wages 4.7 -0.2 7.1 9.4 13 4.3 6Power & fuel 16.3 -3.3 27.4 -7.3 11.7 13.1 12.8Selling & marketing -92.2 -90.6 983.3 52.2 29 16.1 32.3Other expenses 0.5 2.2 18 -0.7 16.3 17.9 12Depreciation 10.7 -0.7 19.3 10 11.5 9.5 7.1Interest expenses 4.7 11.9 33.7 -2.1 19.3 3.1 3.4Tax provision 43.1 -12.3 -33.2 82.8 20 1.8 37.7PBDIT 16.3 -9.4 4.6 -0.2 24 10.2 14.8PAT 23.7 -25.2 -14.8 -35.9 63.1 24.3 24.3Other income/income (%) 1.9 1.2 0.5 0.5 0.3 0.4 0.4Raw material/Net Sales (%) 48.2 48.9 49.3 47.4 47.9 48.2 48.9Interest/PBDIT (%) 24.4 22.4 28.2 27.5 26.4 24.5 21.9PBDIT/Net sales (%) 17.1 16.4 15.7 16.1 17.2 16.7 17PBDIT/Income (%) 18.7 17.5 16.1 16.5 17.4 17 17.3PAT/Income(%) 6 5.6 4.4 2.9 4 4.5 5All income and profit figures are net of prior period and extraordinary
77
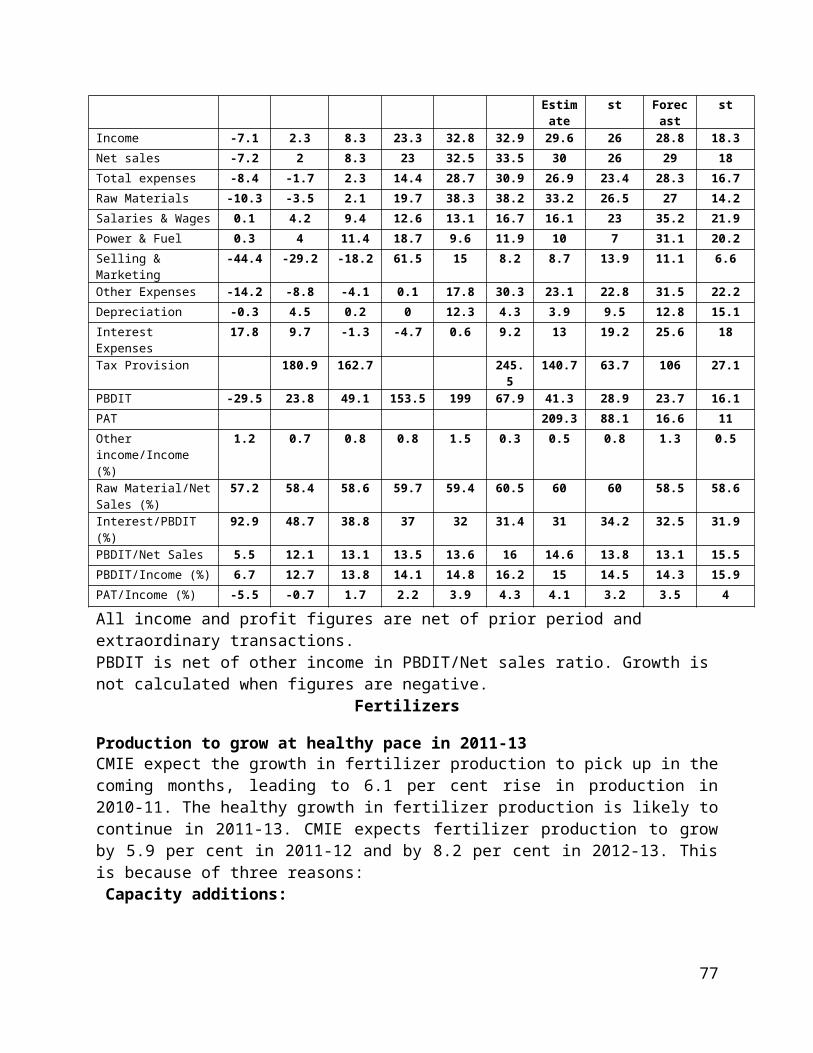
transactions. PBDIT is net of other income in PBDIT/Net sales ratio. Growth is not calculated when figures are negative.
Two Wheelers & Three Wheelers
Industry sales expected to grow over 19% during 2011-13 : Two-wheeler sales volumes are expected to rise by 17.4 and 15.8 per cent in 2011-12 and 2012-13, respectively, aided by a healthy rise in domestic demand. Sales volumes of three-wheelers are also expected to grow by 9-13 per cent during 2011-13. Hence, driven by volumes, the industry is expected to record a sales growth of 20.3 per cent in 2011-12 and 19.1 per cent in 2012-13. This will be over an expected total sales growth of 26.1 per cent in 2010-11. An expected 2-3 per cent rise in average realization will also support the overall industry sales growth.
CMIE expects domestic two-wheeler sales to rise by 21.7 per cent in 2010-11. This is expected because of a robust consumer demand backed by rising income levels, increased rural penetration, stable interest rates and new models have been driving domestic demand for two-wheelers.
Exports continue to drive three wheeler sales : On the back of a healthy demand for passenger carriers in the domestic market and a strong demand in the export markets, three-wheeler sales are expected to grow by 21 per cent in 2010-11. New variant launches like Bajaj Auto’s RE 145D and RE 445M and implementation of the BS III emission norms in October 2010 are expected to help maintain the momentum in domestic sales. Exports are also likely to grow over 12 per cent in the next two years. Hence, three-wheeler sales are expected to grow by 9-13 per cent in 2011-13.
Healthy demand for three-wheelers to continue in 2012-13
Units 2007-08 2008-09 2009-10 Estimate
2010-11 Forecast
2011-12 Forecast
2012-13 Forecast
Production Numbers 5,00,660 4,97,020 6,19,093 7,54,166 8,18,800 9,11,916Sales Numbers 5,06,006 4,97,793 6,13,650 7,42,598 8,09,218 9,11,198Export Numbers 1,41,225 1,48,066 1,73,282 2,69,457 3,03,347 3,50,954Realisation Rs./number 81,320.90 85,535.10 86,422.50 90,311.50 93,129.20 96,295.60Sales Rs. Crore 4,114.90 4,257.90 5,303.30 6,706.50 7,536.20 8,774.40
Industry to post healthy financial performance during 2011-13 (% change over a year-ago) 2006-07 2007-08 2008-09 2009-10 2010-11
Forecast2011-12 Forecast
2012-13 Forecast
Income 16.7 -1.8 2.7 26.3 26.2 20.3 19.1Net Sales 16.5 -1.4 2.8 26.5 26.1 20.3 19.1Total expenses 18.7 -2.8 1.1 20.7 27 21.1 19Raw materials 20.4 -2.3 0.9 20.1 32.6 22.3 20.6Salaries & Wages 6.1 6.6 7.4 12.5 4.8 16.2 13.5Other expenses 19.6 -6.6 2 18.9 12.6 16.2 14.4Depreciation 3.2 11.9 -7.6 -2 5.3 11.8 18.2
78
Interest expenses 55.5 11.5 22.7 -9.3 0.5 5.2 4.5Tax provision 11.9 -18.9 -3.8 64.1 16.5 21.2 6.7PBDIT -1.6 10.7 6.2 77.8 16.8 18.3 13.6PAT -10.2 38 14.8 110.9 18.8 18.4 15.7Other income/income (%) 3.6 2 1.6 1.4 1.5 1.5 1.4Raw material/Net Sales (%) 72.9 72.6 71.7 68.1 71.6 72.8 73.7Interest/PBDIT (%) 2.4 5.2 3.9 2 1.7 1.6 1.4PBDIT/Net sales (%) 10.5 9.6 11.1 16.2 14.8 14.6 13.9PBDIT/Income (%) 13.8 11.3 12.5 17.4 16.1 15.8 15.1PAT/Income (%) 7.4 5.5 7.1 11.6 10.9 10.8 10.5All income and profit figures are net of prior period and extraordinary transactions. PBDIT is net of other income in PBDIT/Net sales ratio. Growth is not calculated when figures are negative.
Electricity
Power sector continues to attract fresh investments
CMIE believes that the capacity addition will remain healthy in the remaining months of 2010-11 and the monitored capacity will rise by 16,144 mw in 2010-11. The capacity addition will accelerate further in next two years, with capacity of 33,031 mw to get added in 2011-12 and of 32,651 mw in 2012-13. With a sharp rise in generation capacity, the power generation will report an unprecedented growth in 2011-13. CMIE expects power generation to rise by 14.7 per cent in 2011-12 and by 13.3 per cent in 2012-13.
In the last few years, power sector consistently attracted huge fresh investments. In fact, during October 2009-September 2010, CMIE’s CapEx survey captured fresh investments worth Rs.5, 89, 652 crore. In addition to this, the service captured fresh investments worth Rs.26, 803 crore in October 2010. Project completion also remained healthy, as nine projects with a capacity of 1,068 mw were completed in October 2010. Sharp rise in power generation in 2011-13Power sector is expected to witness an unprecedented growth in generation in 2011-13. CMIE expects the generation to grow by 14.7 per cent in 2011-12 and by 13.3 per cent in 2012-13. A sharp rise in generation capacity will lead to a double-digit growth in generation. Thermal power generation accounts for 81-85 per cent of the total power generation in India. Thermal power generation is expected to grow by 15.5 per cent in 2011-12 and by 14.5 per cent in 2012-13. This will be driven by a sharp rise in thermal capacity.Total income will grow by 16.4% in 2010-11
CMIE believes that the industry will continue to report a double-digit growth in income in the remaining quarters of 2010-11. Total income of the industry will grow by 16.4 per cent in 2010-11. A healthy growth in generation coupled with a rise in sales realization will enable the industry to report a more than 15 per cent rise in income. Early results of the electricity companies indicated a 29.9 per cent rise in total income in the September 2010 quarter. This was mainly driven by a sharp rise in income of NTPC and Power Grid. However, despite reporting a sharp rise in income, the performance of the industry was not satisfactory at the net level. During the quarter, net profits of the industry grew by a mere 4.1 per cent. In 2010-11, power generation is expected to grow by 7.2 per cent, whereas realization will grow by six to seven per cent.
PAT margin to decline in 2010-11 (% change compared to year-ago quarter)
79
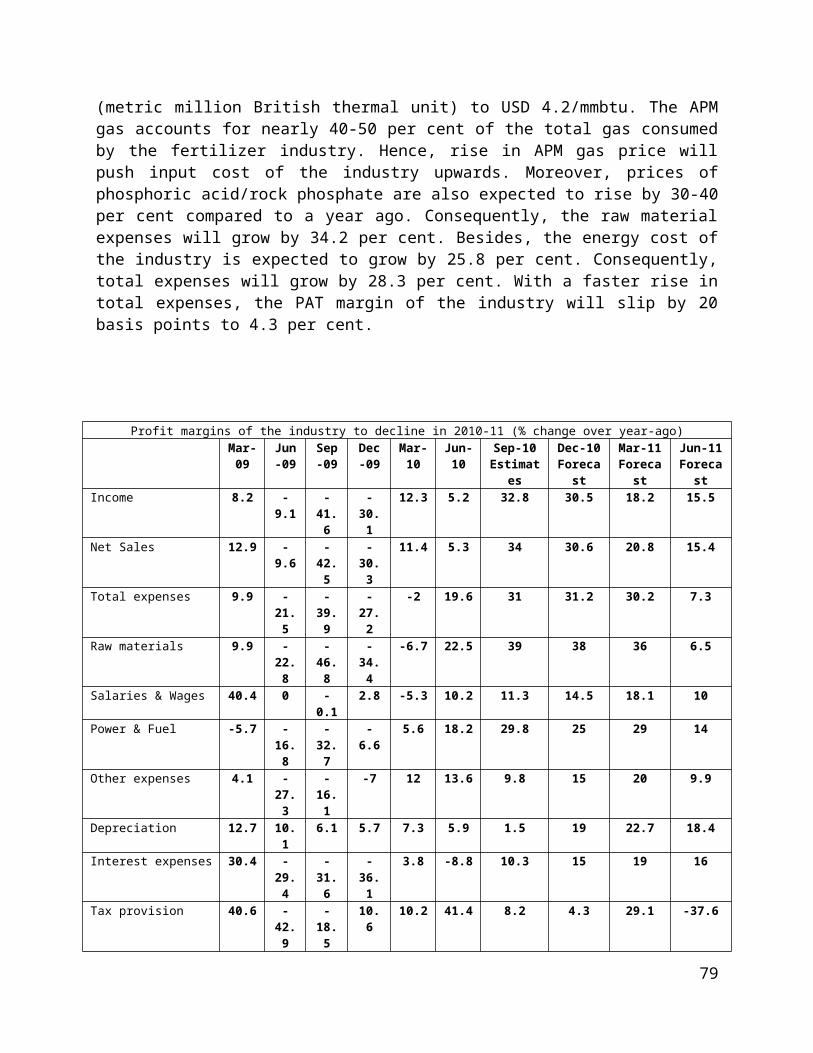
Mar-09
Jun-09
Sep-09
Dec-09 Mar-10
Jun-10
Sep-10 Estimate
s
Dec-10 Forecas
t
Mar-11 Forecast
Jun-11 Forecas
tIncome 14.6 15.8 8.3 2.4 11.5 10 25.5 17.7 13.3 10.6
Net sales 14.2 16 9.6 1.5 14.1 9.9 26.1 17.8 13 10.4
Total expenses 11.6 13.7 9.3 1.3 7.8 12.8 27 18.3 16.2 11.2
Raw Materials 15.2 11.8 1.6 -10.4 5.2 8.5 29.8 26.5 17.6 13
Salaries & Wages 40.5 13.9 4.3 19 19.5 16.7 25.2 12 10.3 10
Power & Fuel 5.3 3.5 47.6 65.5 70.7 64.4 24 11 9 10.2
Other Expenses 23.6 0.3 0.6 5.4 -1.9 27.1 28.1 8.7 7.1 6
Depreciation 33.4 47.5 47.1 12 13.4 19.9 7.5 20.9 15.9
Interest Expenses -2.9 1.1 -13.3 -16.6 -18.5 13.7 17.1 13 14.2 7
Tax Provision -70 52.5 125.5 34.6 119.1 6 28.4 -1 41.7 1.8
PBDIT 7.8 22.6 16.9 13.9 18.7 7 19.8 10.2 9.9 8.3
PAT 30.1 19.2 4.2 8.8 29.1 3.2 18.2 14.6 1.3 7.4
Other income/Income (%) 5.5 4.6 4.2 5 3.5 4.6 3.7 4.9 3.8 4.7
Raw Material/Net Sales (%)
51.3 50.3 47.3 47.1 47.2 48.4 48.7 50.6 49.1 49.6
Interest/PBDIT (%) 21.8 14 14.4 15 14.9 14.8 14 15.3 15.5 14.6
PBDIT/Net Sales 29.3 33.7 35.5 33.9 33.3 34.2 34 31.5 32 33.3
PBDIT/Income (%) 33.2 36.8 38.2 37.2 35.7 37.2 36.5 34.8 34.6 36.5
PAT/Income (%) 17.8 19.1 19.3 17.2 20.9 18.8 18.1 16.7 18.7 18.3
All income and profit figures are net of prior period and extraordinary transactions. PBDIT is net of other income in PBDIT/Net sales ratio. Growth is not calculated when figures are negative.
Shipping
Sales of the industry to grow by a slower 2.7% in 2010-11
CMIE expects the sales of the industry to grow by a slower 7 per cent y-o-y during the December 2010 quarter as compared to our earlier forecast of a 9.3 per cent growth. This growth is likely to be driven by increase in cargo volumes and tonnage. It is also expected that the year 2010-11 to end with a modest 2.7 per cent growth in sales. This growth is likely to be driven by higher cargo volumes and fleet expansion undertaken by companies.
Considering the recent performance of the companies in the shipping transport & allied services industry, CMIE has toned down its sales forecast over the next few quarters. With the recovery in the global economy taking longer than expected and increasing additions into global fleet, shipping freight rates continue to rule weak. Net profit is expected to jump by 82% in December 2010Industry’s net profit is expected to jump by 82 per cent y-o-y during the December 2010 quarter due to a fall in total expenses and a low base in the year-ago quarter. Other expenses are expected to fall by 4.8 per cent due to the strict cost control undertaken by companies. Power &
80
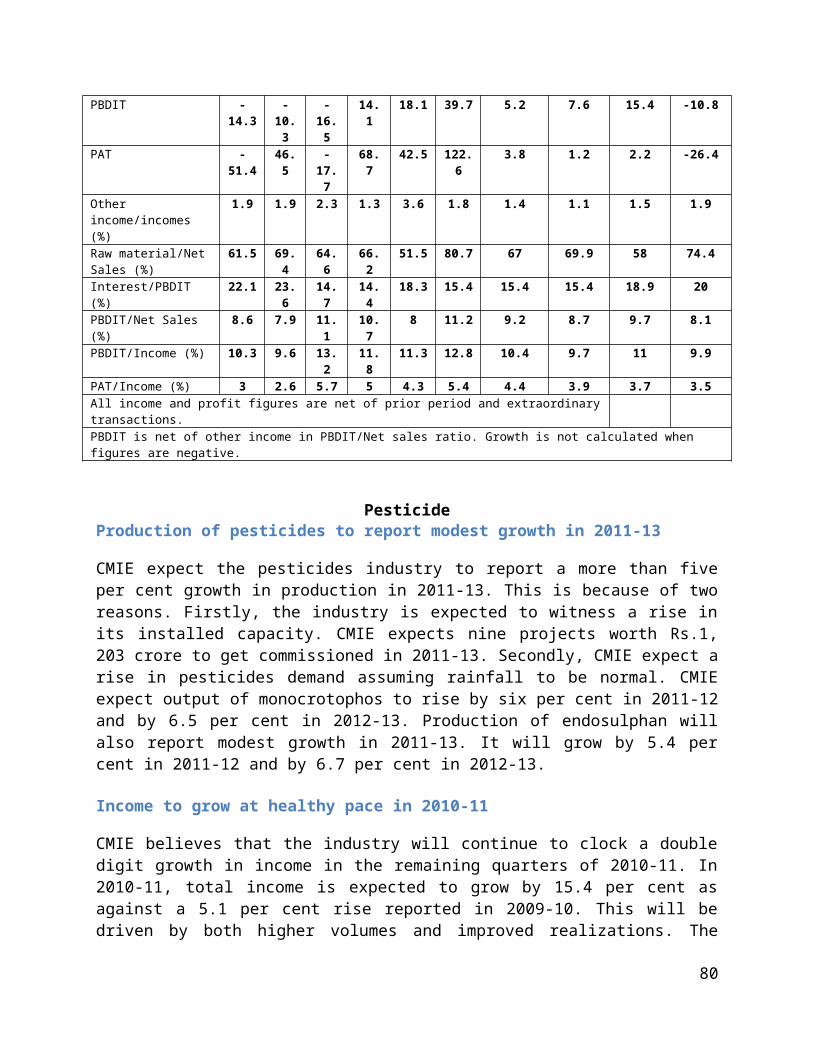
fuel expenses are expected to fall by 3.5 per cent. Net margin is expected to expand by 6.5% y-o-y to 15.8 per cent. According to the IMF, world trade(volumes) are expected to grow by nine per cent in 2010 after falling by 11.3 per cent in 2009. Growth is expected to remain healthy at 6.3 per cent in 2011. These will result in an increased movement of goods across countries. Hence, the growth in cargo volumes is expected to remain healthy over the next few quarters.Port infrastructure & related projects worth Rs.86, 171 crore to get completed by March 2013According to CMIE’s CapEx database, shipping infrastructure projects worth Rs.86,171 crore are scheduled to get completed during the period November 2010-March 2013. These include projects related to construction, modernization and expansion of ports and related infrastructure and shipyards. According to CMIE’s CapEx database, a tonnage of 39.8 lakh deadweight tonnes (DWT) is scheduled to get added to the Indian shipping fleet during 2010-13. Considering gross additions, the Indian tonnage is expected to rise to 197.9 lakh DWT by March 2013. According to CMIE’s 63rd CapEx survey, the outstanding investments in the shipping & allied services industry stood at Rs.3.5 lakh crore as of September 2010. Major ports to handle 608.6 million tonnes in 2010-11CMIE expects cargo traffic at major ports to grow by 8.5 per cent to 608.6 million tonnes in 2010-11. This growth is likely to be driven by a full recovery in India’s foreign trade. It is also expected that foreign trade to grow by 18.1 per cent in 2010-11. Imports are expected to grow by 19.9 per cent and exports are expected to grow by 15.2 per cent. This growth is likely to be driven by higher exports of petroleum products, gems & jewellery , machinery & instruments, pharmaceuticals, iron ore, transport equipment, primary & semi-finished iron & steel and ready-made garments.
Robust growth in net profit expected in December 2010 quarter (% change compared to year-ago quarter)
Mar-09
Jun-09
Sep-09 Dec-09 Mar-10
Jun-10 Sep-10 Estimate
s
Dec-10 Forecast
Mar-11 Forecast
Jun-11 Forecast
Income 1.4 -13 -31.6 -21 -12 0.3 2 6.9 5 6
Net sales -16.6 -14.2 -29.6 -22.2 7 -2.4 0.7 7 5 8
Total expenses -7.5 -8.7 -18.8 -11.4 4.7 -4.3 -6.3 -0.8 3 10.6
Raw Materials -29 -34.1 -33.8 0.5 -17 95 -6 13.8
Salaries & Wages 5.6 8 4.9 -15.8 -6.5 6.1 2 6 14.6 6.7
Power & Fuel -17.4 -22.5 -13.5 -13.4 25.5 27.1 -19 -3.5 15.3 6.3
Selling & Marketing
120.1 211.8
113.3 16.2 -94.4 -95.9 -23 32.1 32.1 614.8
Other Expenses -13.6 -15.9 -31.5 -11.6 13.4 -17.3 -0.4 -4.8 -6.6 12.5
Depreciation 42.6 10.1 13.6 11.2 -16 5.8 -7 -0.5 9.9 22.6
Interest Expenses -4.9 23.1 2.7 -16.6 9.4 25.5 -9 7.9 34.7 -4.9
Tax Provision -64.3 -21 16.9 9.9 50.3 -35.2 -29.6 -1.7 -22.4 -14.2
PBDIT 24.3 -11.4 -38.7 -30.8 -36.1 16.2 14 24.5 14.4 -1.7
PAT 36.1 -37.9 -73.4 -61.5 -56.4 35.4 85.4 82 17.3 -19
Other income/Income (%)
23 7 4.6 5.7 6.3 9.9 5.8 5.6 6.3 8.2
Other expenses/ Sales
37.7 40.5 35.9 41 39.9 34.6 35.5 36.5 35.5 36
Interest/PBDIT 10 23.4 24.4 22.4 17.2 24.5 19.5 19.4 20.2 23.7
81
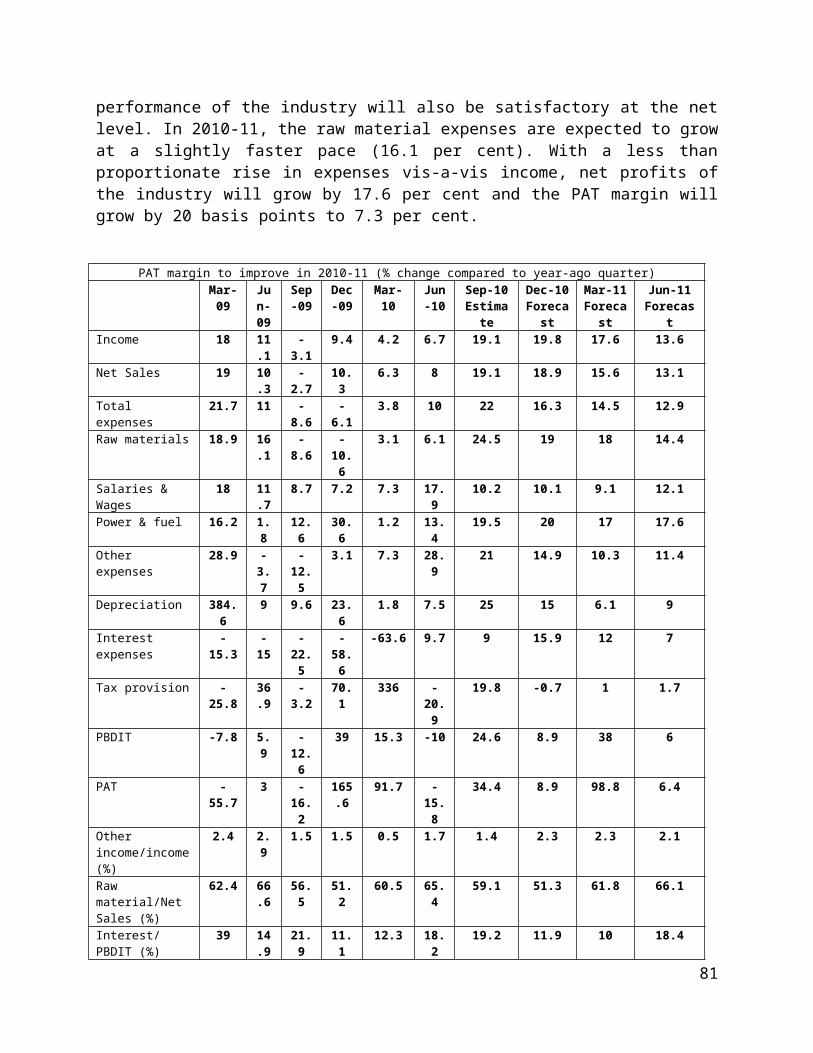
(%)PBDIT/Net Sales 31.7 30.8 32.2 29 31 34.7 35.8 34.7 34.4 32.8
PBDIT/Income (%)
48.8 35.8 35.4 33 35.4 41.2 39.6 38.4 38.6 38.2
PAT/Income (%) 27.2 10.9 9 9.3 13.5 15.5 16.4 15.8 15.1 11.8
All income and profit figures are net of prior period and extraordinary transactions. PBDIT is net of other income in PBDIT/Net sales ratio. Growth is not calculated when figures are negative.
Aviation
Aviation industry’s sales to grow by 27% in December 2010 quarter Sales of the aviation industry are expected to grow by a robust 27 per cent in the December 2010 quarter. This growth is expected to be driven by higher passenger volumes and better yields in the peak season. The industry is likely to post a robust 26.7 per cent growth in sales in 2010-11. The industry is likely to remain in the red at the net level during the December 2010 quarter. Its net loss as a proportion of income is expected to widen to 3.1 per cent, from 1.9 per cent in the year-ago quarter.Air passenger traffic to grow by healthy 16% in 2010-11Air passenger traffic is expected to grow by a healthy 16 per cent in 2010-11. In 2011-12 and 2012-13, it is likely to grow by 14 per cent and 11 per cent, respectively. With airlines shifting to low-cost operations and developing a more competitive cost structure, air travel is set to become more affordable. The construction of airports in various parts of the country, and especially in non-metros, and in tier-II and tier-III cities will make air transport more accessible. As a result, a new set of air passengers which would have previously never considered flying as a travelling option is likely to emerge, thus adding to air passenger traffic.ATF prices to grow by 3.9 %in December 2010 : Aviation turbine fuel (ATF) prices in the December 2010 quarter are expected be 3.9 per cent higher than those in the preceding quarter. In the March 2011 quarter, however, the average prices are expected to remain flat. The average of ATF prices in 2010-11 as a whole is expected to be about 12-13 per cent higher than that in 2009-10. ATF prices for the fortnight beginning 1 November 2010 rose as compared to the corresponding fortnight a month ago.
PBDIT to grow by 52.7% in December 2010The strong growth in sales and slower growth in the total operating expenses are likely to translate into a 52.7 per cent y-o-y growth in the industry’s PBDIT during the quarter. The PBDIT margin is likely to expand to 12.8 per cent from 10.6 per cent in the year-ago quarter. However, with an expected increase in interest costs and depreciation, the industry is likely to incur losses at the net level. Its net loss as a proportion of income during the December 2010 quarter is expected to widen to 3.1 per cent from 1.9 per cent in the year-ago quarter.
PBDIT to grow by 52.7% y-o-y in December 2010 quarter (% change over a year ago)
Mar-09
Jun-09
Sep-09
Dec-09
Mar-10
Jun-10
Sep-10Estimate
s
Dec-10Forecas
t
Mar-11Forecas
t
Jun-11Forecas
t Forecas
tForecas
tIncome 12.5 -7.6 -17.5 -1.5 11.5 24 34.2 26.1 20.3 16.1
Net sales 6.2 -10.5 -15.9 -1.4 16.8 25.8 34 27 21 16.7
Total expenses 22.7 -17.5 -20.9 -11 -7.8 17.3 19.5 27.6 24.3 17.1
Salaries & Wages 15.3 -6.7 -14.2 -18.1 -9.1 -5.5 1.4 3.4 3.3 2.9
82
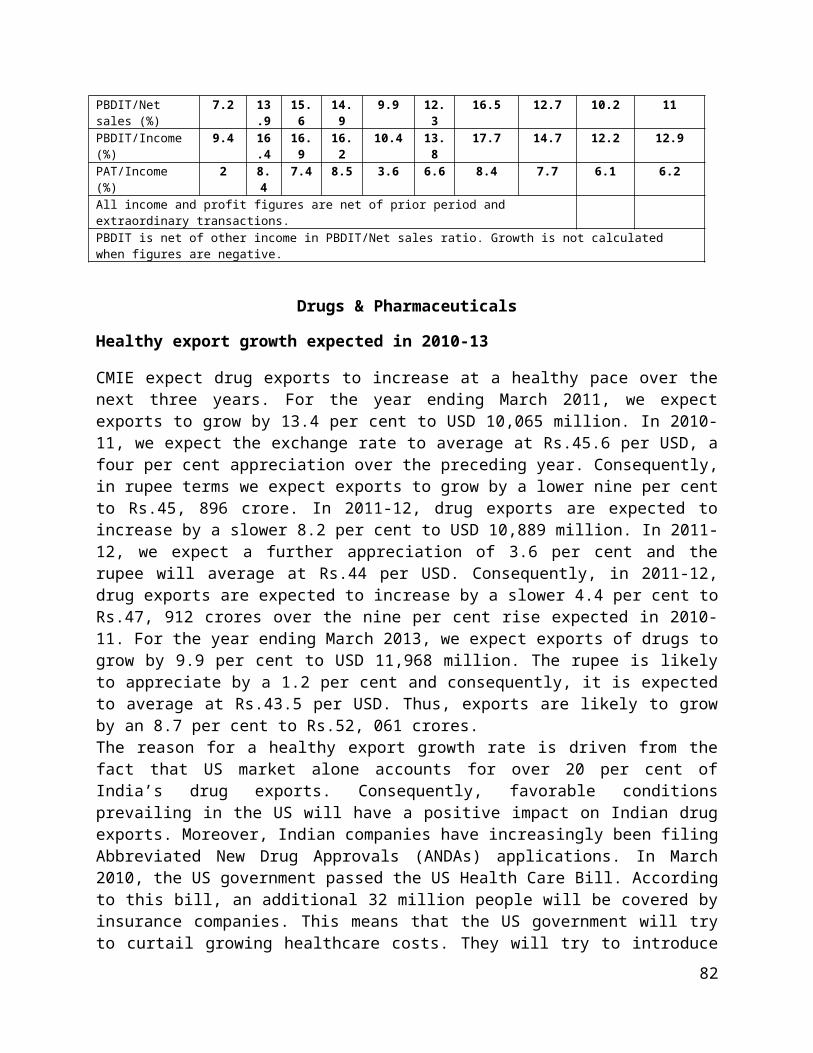
Power & Fuel -33.6 -54.9 -47.5 -18 42.5 49.1 33.5 35 28 20.3
Selling & Marketing -32.7 -28.7 -9.7 0.5 1.6 19.2 14.8 13.2 50.9 22.4
Other Expenses 70.9 28.6 -10.5 -9.5 -29.8 4.6 3.5 30.9 29 24
Depreciation 24.7 12.1 0.6 7.7 0.8 26.5 19 11 28.5
Interest Expenses 188.4 81.6 67.3 19.7 7.2 39.1 26.7 18.3 8.2 0.2
Tax Provision 370.9
PBDIT 52.7 7.3 8.6
PAT
Other income/Income (%)
7.8 4.4 2.2 2.4 3.4 3 2.3 1.8 2.8 2.5
Other expenses/Sales 54.3 36.7 40.8 32.5 32.6 30.5 31.5 33.5 34.8 32.4
Power fuel/Sales (%) 26.9 28.9 36.5 31.2 32.9 34.3 36.4 33.1 34.8 35.3
Interest/PBDIT (%) -196.6 182.7 -135.6 102.6 125.6 92.2 135.9 79.5 126.7 85.1
PBDIT/Net Sales -15.6 1.4 -11.7 8.3 6.7 10.1 6.6 11.2 6.2 9.7
PBDIT/Income (%) -6.6 5.7 -9.3 10.6 9.9 12.8 8.8 12.8 8.8 11.9
PAT/Income (%) -27.2 -9.2 -23.2 -1.9 -5.2 -3.3 -9.7 -3.1 -8.8 -4.2
All income and profit figures are net of prior period and extraordinary transactions. PBDIT is net of other income in PBDIT/Net sales ratio. Growth is not calculated when figures are negative.
Hotel
Capacity Addition of 47, 633 rooms over next 3 years : As per CMIE’s CapEx database, the hotels industry is expected to witness a capacity addition of 47,633 rooms over the next three years, taking the total outstanding capacity to 1.8 lakh rooms. Of this, a larger capacity of around 17,948 rooms is expected to come up in 2010-11, at an investment of Rs.13,036 crore. In 2011-12, we expect a capacity addition of 14,872 rooms to take place at an investment of Rs.14,452 crore. The remaining capacity of 14,813 rooms is expected to come up in 2012-13, at an investment of Rs.12,471 crore.
Sales are expected to grow by 14 percent and 13.9 percent in 2011-13 : In 2011-12 & 2012-13, we expect the hotels industry to report a sales growth of 14 and 13.9 per cent, respectively. Sales are expected to be driven by a rise in ARRs and occupancy levels. With fresh rooms coming over the next three years, we expect a modest increase in ARRs as the companies would aim to maintain higher occupancies. Additionally, we expect higher number of tourists to visit the country in the coming years thereby aiding the sales growth.
Net Profit to grow on account of lower interest chargesTotal expenses of the industry are expected to increase at a slower pace of 12.5 and 11.4 per cent in 2011-12 & 2012-13, respectively. The industry’s wage bill is expected to rise by 14.8 and 12.4 per cent in 2011-12 & 2012-13, respectively. With more capacity expected to come up over the next three years, we expect the companies in the sector to hire more people. The growth in industry’s interest expenses is expected to slow down to 10.2 per cent in 2012-13. CMIE expects the euro bonds issued by Hotel Leelaventure to get converted by April 2012. Additionally, we also expect Indian Hotels to retire its debt, thereby pulling down the interest expenses. Consequently, we expect the net profit to grow by 36.7 and 28.8 per cent in 2011-12 & 2012-13, respectively.
Industry to report robust sales in December 2010 quarter (% change compared to year ago)
Mar-09 Jun-09
Sep-09 Dec-09 Mar-10
Jun-10 Sep-10 Estimates
Dec-10 Forecast
Mar-11 Forecast
Jun-11 Forecast
83
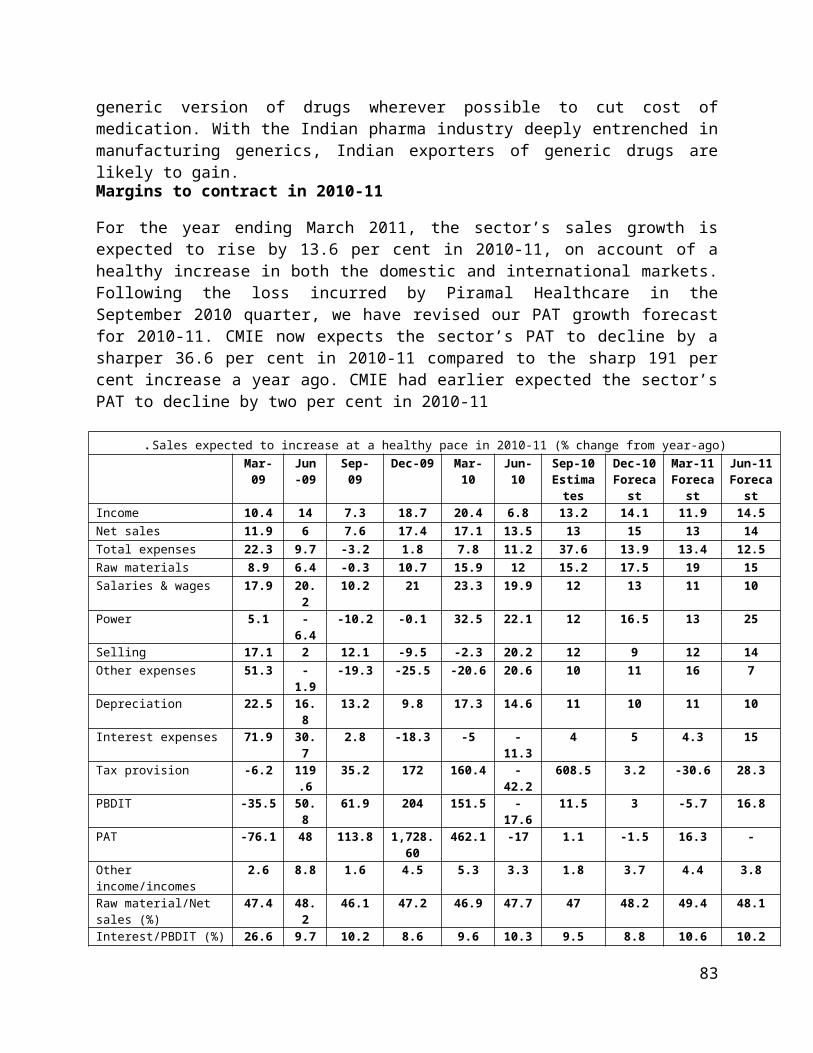
Income -22.1 -25.1 -20.1 -1.9 -2.4 14.7 16.8 23.7 19.7 16.9
Sales -27.8 -25 -19.1 -0.2 6.7 16.2 16.5 25 17 16.5
Total expenses -14.4 -8.2 -8.3 2 -4.3 10 11.9 21.5 20.2 14.5
Salaries & Wages 11.6 3.8 -3.8 0.3 -12.6 12.4 7 20.2 18 19
Power & Fuel -2.4 -2.6 -7.1 -1.5 6.9 13.3 11.5 15 19.5 4.6
Selling & marketing 13.2 -7 -10.9 18.8 28.2 -11.3 13.9 23 41.5 17
Other expenses -23.9 -16.4 -12.5 2.1 4 16.2 12 16.4 20 13
Depreciation 8.4 20.5 16.5 11.9 5.4 8.7 14.1 17.5 13.9 14.5
Interest expenses 21.1 38 33.4 34.1 17.3 9.3 19 25.7 24 15
Tax provision -45.6 -53.6 -63.4 -25.1 -41.6 -50.2 -6.4 62 25.9 6.2
PBDIT -36.6 -55.7 -45.6 -8.4 -4.2 19.1 38.2 35 19.2 25.2
PAT -52.4 - - -20.8 9 - - 37.2 17 141.5
Other income/incomes
11.7 3.5 3.9 3 3.4 2.2 4.2 1.9 5.5 2.6
Raw material/Sales 39.7 43.2 44.7 38.1 36.9 43 43 35.4 37.8 41.7
Interest/PBDIT (%) 17.2 46.6 45.3 21.6 19.4 41.9 39 20.1 20.2 38.4
PBDIT/Sales (%) 25.6 17.1 16.9 31.3 32.6 19.3 20.5 35.3 30.9 20.5
PBDIT/Income (%) 34.2 20 20.2 33.4 34.9 21.1 23.8 36.5 34.7 22.6
PAT/Income (%) 12.2 -2.6 -0.1 13.9 15.3 1.9 4.1 15.5 15 3.9
All income and profit figures are net of prior period and extraordinary transactions. PBDIT is net of other income in
PBDIT/Net sales ratio. Growth is not calculated when figures are negative.
Hotel industry to report healthy sales in 2011-12 & 2012-13 2006-07 2007-08 2008-09 2009-10 2010-11
Forecast2011-12 Forecast
2012-13 Forecast
Income 31 14.4 -6.5 -11.9 19.2 15 13.5Sales 31.2 14.7 -8.7 -9.2 19.1 14 13.9Total expenses 27.8 12.8 -0.4 -4.6 16.3 12.5 11.4Salaries & Wages 21.8 21.1 15.5 -3.6 14.6 14.8 12.4Power & Fuel 9.3 17.5 7 -1.4 14.8 5.4 3.2Selling & marketing 18.7 135.8 73.5 5.1 17.3 12.2 10.5Other expenses 32.3 7.1 -2.1 -5.8 16.3 9.4 9.8Depreciation 17.5 6.8 13.3 13.1 13.6 11.2 10.6Interest expenses 23.3 19 5.8 30.2 19.7 17 10.2Tax provision 71.5 30.5 -33.4 -43.7 20.8 31.4 28.9
84

PBDIT 43.9 21.2 -21.7 -26.4 27.5 24.6 20.4PAT 48.7 21.6 -31.5 -53.5 52.7 36.7 28.8Other income/incomes 4.6 4.3 6.5 3.4 3.5 4.4 4Raw material/Sales 40.3 37.7 40.3 40.2 39.2 37.6 36.3Interest/PBDIT (%) 12.6 12.5 16.6 28.1 26.2 24.6 22.6PBDIT/Sales (%) 34.7 37.1 28.8 25.7 27.8 29.8 32.1PBDIT/Income (%) 37.7 39.8 33.5 28.2 30.3 32.8 34.8PAT/Income (%) 18.4 19.5 14.4 7.9 10.3 12.2 13.8All income and profit figures are net of prior period and extraordinary transactions. PBDIT is net of other income inPBDIT/Net sales ratio. Growth is not calculated when figures are negative.
Asset Financing Services
AFS sector to continue on growth trajectory in the second half of the year 2010-11
The sector is expected to continue on growth trajectory in the second half of the year 2010-11, with income expected to rise by a healthy 16.3 per cent. In line with income growth, net profit is also likely to be higher by 16.5 per cent. With this, the sector is expected to end the year with an income and a PAT growth of 16.7 per cent and 22.2 per cent, respectively. The sector is expected to expand its net margin for the second successive year as average cost of funds is expected to be lower than that in 2009-10. An expected healthy rise in salaries of individuals in 2010-11 is likely to result into a strong consumer sentiment. Income growth of the sector will continue to remain broad-based with all its segments expected to report healthy performance during the quarter. With the loan disbursements by AFCs expected to continue to rise in the coming quarters, CMIE expects the sector to continue to grow briskly. It is expected to post an income growth of 20 per cent in the December 2010 quarter. PAT is expected to rise at a faster pace of 32.8 per cent, aided by a y-o-y improvement in interest cost to income ratio.
Income expected to continue to grow briskly in quarters to come (% change over year-ago)
Mar-09
Jun-09
Sep-09
Dec-09
Mar-10
Jun-10
Sep-10 Estimate
s
Dec-10 Foreca
st
Mar-11 Forecast
Jun-11 Foreca
stTotal income 25.3 21.5 14.7 11.6 12.3 18 21.2 20 15.1 15.1Income from operations 28.9 19.8 14.8 10.9 11.5 19.2 20.8 19.9 15.2 15.1Other income -64.4 210.4 11.8 90.7 88.7 -36.7 40 24.4 7.3 16.5Expenses 23.4 18.8 8.4 4.6 5.8 13.4 17.6 16.4 14.9 14.4Interest exp. 36.8 23.1 11 -0.5 -2.1 8 13.9 16.5 19.4 15.2Salaries & wages -22.5 9.7 2.4 3.6 35.9 26.4 30.7 29.9 5.9 11.2Other operating expenses 5.7 -15.9 -19.8 13.7 20.8 35.4 22.2 7.6 4.1 8.1Provisions & contingencies
28.2 11.5 27.8 18.1 3.3 23.1 -12.8 -0.1 11.9 8.8
Tax provision -12.5 21.3 11.8 34.8 45.4 32.9 47.1 22.6 5.8 15.6Profit before provision 16.9 27.8 33 39.8 37.5 33.5 32.9 27.4 12.7 16.3PAT 33.6 33.3 43.6 45.4 38.7 35.1 33.2 32.8 15.7 17.5Oth. Income/Inc. from operations (%)
1.1 2.2 1.8 1.4 1.8 1.2 2.1 1.5 1.7 1.2
PAT/Income (%) 20.1 20.9 22.7 22 24.5 24 25.1 24.4 24.6 24.4
85
All income and profit figures are net of prior period and extraordinary transactions. Growth is not calculated when figures are negative.
Brisk income growth to continue in second half by housing finance companies : Sales of residential properties are expected to remain upbeat in the festival season, driving the demand for home loans. We, therefore, expect loan disbursements, by housing finance companies to continue to grow briskly in the last two quarters of the year 2010-11. We expect revenues of the segment to grow in the range of 11-15 per cent in the coming two quarters. Profit margin of the segment, however, is expected to come under pressure due to increase in borrowing cost of HFCs. The segment is expected to post a y-o-y decline in net profit in the March 2011 quarter.
PAT to rise by 28.8% in December 2010 quarter (% change over year-ago)
Mar-09
Jun-09
Sep-09
Dec-09
Mar-10
Jun-10
Sep-10 Estimate
s
Dec-10 Forecas
t
Mar-11 Forecast
Jun-11 Forecas
tTotal income 32.7 23.6 12.
30.6 -0.3 7 12.7 15 11.1 12.5
Income from operations 33.5 22.2 11.3
-0.7 -1.3 8.3 12.1 15 11.3 12
Other income -32.2 523.3
123.1
635.9 169.1
-85.9 49.5 12 249.9
Expenses 34 24.2 9.7 -4.4 -7.7 1.1 6.9 11 15.7 11.1
Interest exp. 45.5 25.7 8.9 -9.2 -14 -3.6 2.4 11 19.5 10.7
Salaries & wages -2.2 22.7 11.5
0.7 16.4 16 40 15 22 10
Other operating expenses
-9.9 8.2 6.7 15.1 59.3 22.2 16 12 10 20
Provisions & contingencies
49.3 1.2 517.9
428.7 -97.7 55.8 10 -35 23,900 8
Tax provision -6.7 18.3 13.8
25.1 21.3 33.9 34.5 14 -6 11.8
Profit before provision 16 20 21.4
26.1 24.7 33.3 34.2 23.2 -1.8 15.2
PAT 28.4 21 23.3
23.6 26.4 32.7 34.3 28.8 -1.2 16.7
Oth. Income/Inc. from operations (%)
0.6 1.4 1.7 1.5 1.6 0.2 2.3 1.4 1.4 0.6
PAT/Income (%) 21.7 18.6 21.2
22 27.7 23.1 25.3 24.6 24.7 24
All income and profit figures are net of prior period and extraordinary transactions. Growth is not calculated when figures are negative.
Income to rise by 18.2%in December quarter of Auto Finance Companies
Buoyancy in the financials of auto finance companies is expected to continue in the December 2010 quarter, aided by continued buoyancy in sale of the Original Equipment Manufacturing (OEM) industry. CMIE expects the segment to record an income growth of 18.2per cent during the quarter. PAT is expected to be higher by a faster 34.8 per cent, leading into a 250 per cent y-o-y expansion in its PAT margin to 20 per cent.
Net profit to grow by 34.8% in December 2010 quarter (% change over year-ago)
Jun-09
Sep-09
Dec-09
Mar-10
Jun-10
Sep-10
Dec-10 Forecast
Mar-11 Forecast
Jun-11 Forecas
t
Sep-11 Forecast
Total income 10.2 9.1 12 16.5 19.1 24.2 18.2 13.6 17 13
86
Income from operations 9.2 8.5 11.6 15.7 18.2 23.4 17.5 13.5 18 13
Other income 70.2 55.7 47.9 77.8 56.6 70.8 70 16 -10 15
Expenses 8.4 5.3 2.3 15 12.5 16 14.7 12.1 15.7 14.3
Interest exp. 18.4 1.5 -2 3.1 1.9 11.7 8.8 16.5 18 17
Salaries & wages 7.1 2.5 0.8 19.8 31.3 33.7 45 22.5 10 12.5
Other operating expenses -15.8 -18.4 6.7 15.8 28.4 46.6 30 12 14 12.5Provisions & contingencies -5.2 29.9 -11.5 40.8 7.1 -20.3 8 7.5 12
Tax provision 13 46.5 73.8 67.8 62.2 56 30 22 9
Profit before provision 9.7 36.9 45.7 38 42.8 35 24.2 11.4 18.7 9.1
PAT 23.1 38.2 101.9 23.9 61.2 72.2 34.8 19.8 22.8 8Oth. Income/Inc. from operations (%) 2.6 1.7 1.4 2.1 3.4 2.2 2 2.1 2.6 2.3
PAT/Income (%) 13.7 14.5 17.5 18.8 18.6 20.2 20 19.8 19.5 19.3All income and profit figures are net of prior period and extraordinary transactions. Growth is not calculated when figures are negative.
Telecommunication Services
Telecom sector likely to report 9.3 per cent growth in sales revenues for September 2010 quarter
The telephone communication services sector is expected to report a 9.3 per cent growth in sales revenues for the quarter ended September 2010. Telecom services providers are estimated to have expanded their subscriber base by over 40 per cent during September 2009-September 2010. However, this volume growth is likely to have been substantially offset by a 20-22 per cent decline in average revenue per user (ARPUs). ARPUs are declining on account of both, lower pricing as reflected in lower tariff rates as well as lower usage as reflected in lower minutes of usage (MoUs).
Decline in PAT likely to be arrested in September 2010 quarter In the September 2010 quarter, CMIE expects the sector to return to reporting year-on-year growth in profits at the net level. This will be mainly because of a 13.1 per cent growth in revenues and a decline in interest expenses. CMIE expects the growth momentum in sales revenues to continue and the sector to continue reporting year-on year growth in profits in the next four quarters. Sales revenues are expected to grow at double digit rates at least till the June 2011 quarter.
`Sales to pick-up, margins to remain under pressure in September 2010 quarter (% change over year-ago) Mar-
09Jun-09
Sep-09
Dec-09
Mar-10 Jun-10
Sep-10 Estimates
Dec-10 Forecast
Mar-11 Forecast
Jun-11 Forecast
Income 19.2 13.6 1.8 -2.4 1.9 5.4 13.1 14.4 14.4 12.4Sales 13.9 6.8 1.6 -0.9 1.1 8.3 9.3 12.8 14.5 12.5Total expenses 16.1 11.8 2.7 3.2 6.1 16.8 14.2 12.1 18.6 8.8Salaries & Wages 40.4 16.2 0.5 47.7 -6.2 9.5 24.3 -18 36.5 28Network cost 51.9 49.7 35.4 27 23.9 -7.8 16.4 16.4 12.4 7
87
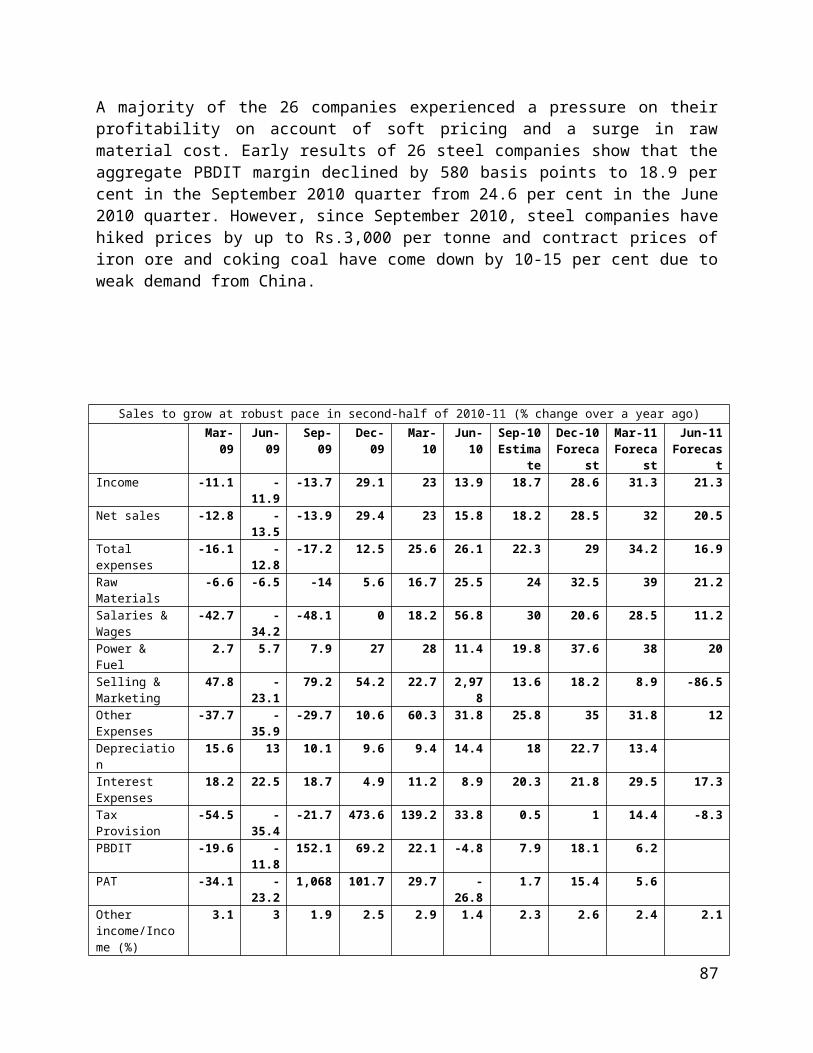
Regulatory charges 20.2 11.1 3.3 -5.8 14 69 13.5 14.2 5.9 7Access charges 14.1 -10.1 -9.7 -7.9 -10.1 24 8.7 11.7 13.4 17Selling & marketing 9.2 12.4 2.2 16.1 25.3 24.3 31.2 36 35 20Other expenses -24.6 -2.4 -11.6 2.1 30.4 7.3 14.5 8.1 5.2 3Depreciation 25.4 18.7 0.1 -2.6 -2.3 13.1 21.1 10.1 16.9 6.3Interest expenses -24.9 -53.6 -50.9 -77 172.
1-33.5 131.7 -13.6
Tax provision 74.6 11 27.3 33.6 -31.4 10.6 12.5 12.5 14.3PBDIT 22.6 12.4 -6.9 -31 -16.8 -13.6 6.3 29.9 16 14.7PAT 32.2 23 -5.4 -40.1 -16.7 -47.8 5.5 44.2 -6.5 48.5Other income/incomes (%)
6.5 7.4 1.4 4.1 7.4 4.9 4.7 5.4 7.3 4.8
Network cost/Sales (%)
19.4 22.3 22.7 22.8 23.4 18.9 24.2 23.5 22.9 18
Regulatory charges/ Sales (%)
10 9.7 9.7 9.4 11.3 15.2 10.1 9.5 10.5 14.4
Interest/PBDIT (%) 9.5 4.4 14.3 6.6 -0.8 11.9 9 11.8 9.1 9PBDIT/sales (%) 31.3 27.8 28.5 20.3 23.6 22.8 24.1 22.6 24.1 24.3PBDIT/Income (%) 35.8 33.2 29.5 23.6 29.3 27.4 27.7 26.8 29.7 27.9PAT/Income (%) 17.9 17 12.1 8.1 14.9 8.7 11.2 10.2 12.2 11.4All income and profit figures are net of prior period and extraordinary transactions. PBDIT is net of other income in PBDIT/Net sales ratio. Growth is not calculated when figures are negative.
Generators, Transformers & Switchgears
Sales to rise by 14.6 per cent in 2010-11
In 2010-11, the generators, transformers & switchgears industry is expected to post a 14.6 per cent rise in sales. Double-digit growth in sales is expected on the back of a rising demand from the electricity sector. During 2010-13, electricity generation capacity in India is expected to increase by 81,826 mw, leading to a sharp rise in electricity generation. To distribute this electricity, strengthening of transmission and distribution grid will also be essential. This will lead to a healthy growth in sales of generators, transformers and switchgears.Profit margins of generators, transformers & switchgears industry to contract in 2010-11
With a faster rise in expenses coupled with a decline in other income, the net profits of the industry are expected to decline by 9.7 per cent. The PAT margin will contract by 150 basis points to 5.8 per cent. Other income is also expected to decline by 38.9 per cent. In 2010-11, prices of key raw materials, copper and aluminum, are expected to rise. This will lead to a 18.5 per cent rise in the raw material expenses. As a result, the total expenses of the industry will grow at a faster pace (17.1 per cent) compared to sales. Switchgears production to rise by 20.5% in 2010-11 : In 2010-11, CMIE expects the switchgears production to increase by 20.5 per cent to 26.5 crore units. The production is expected to rise further by 15.8 per cent and 11.5 per cent in 2011-12 and 2012-13, respectively. Healthy rise in production will be fueled by aggressive capacity expansion plans in the electricity industry. During 2010-13, 81,826 mw of electricity generation capacity is expected to come on stream. This will lead to a sharp rise in power generation. It is also expected that the power generation to grow by 14.7 per cent in 2011-12 and by 13.3 per cent in 2012-13. Our production forecast is based on the production data compiled from the annual reports of the companies.
Margins to contract in 2010-11
Mar- Jun- Sep-09 Dec-09 Mar- Jun-10 Sep-10 Dec-10 Mar-11 Jun-11
88
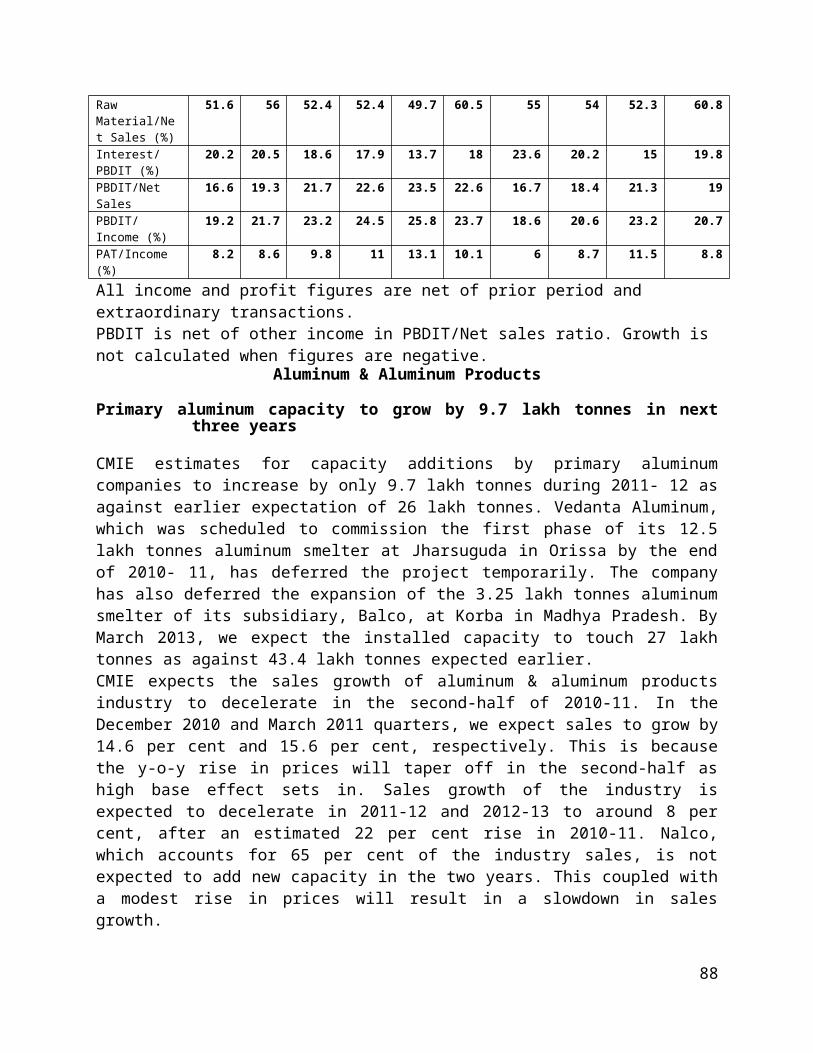
09 09 10 Estimates
Forecast Forecast
Forecast
Income 7.7 3.8 -0.8 2.8 5.4 5.7 14.8 16.3 17.4 18.4
Net sales 8.1 0.7 -0.7 5.9 5.1 8.9 14.6 16.3 17.5 18.5
Total expenses -0.2 -1 0.1 8 10.3 17.3 16.3 16.4 18.4 17.1
Raw Materials -5.9 -5.7 0.5 7.2 10 19.1 17.1 17.8 20 17.4
Salaries & Wages 16.7 17.6 20.3 8.8 14.7 17.7 17.7 19.5 22.6 13.8
Other Expenses 21.4 20.3 -8.5 14.1 23.7 24.1 18 17 13.4 16.7
Depreciation 33.4 25.9 24.8 27 28.8 19.1 17.4 19.2 26.3
Interest Expenses 39.5 41.9 -8.1 -19.9 0.4 -9.5 -3.1 -19.7 -20.3 14.9
Tax Provision 36.3 -1 -22.2 12.4 -22.2 -28.4 -5 -5.4 5.7 15.4
PBDIT 13.1 -16.6 -7 -13 -30.6 3.4 -3.7 7.5 19
PAT 15.5 -20.3 -16.2 -15.2 -41.4 5.4 -4.4 10.8 19.7
Other income/Income (%)
0.7 3.8 0.5 0.8 0.9 0.8 0.7 0.7 0.8 0.8
Raw Material/Net Sales (%)
68.2 72.1 74.2 73.7 71.4 78.9 75.9 74.7 72.9 78.1
Interest/PBDIT (%)
7.8 6.6 8 7.5 9 8.2 7.5 6.3 6.6 7.9
PBDIT/Net Sales 13.2 12.3 10.9 13.8 10.6 9.4 9.6 11.3 9.7 9.5
PBDIT/Income (%)
13.7 15.6 11.3 14.4 11.3 10.2 10.2 12 10.4 10.3
PAT/Income (%) 7.6 9.3 6.1 8 6.1 5.2 5.6 6.6 5.7 5.2
All income and profit figures are net of prior period and extraordinary transactions. PBDIT is net of other income in PBDIT/Net sales ratio. Growth is not calculated when figures are negative. ******************************************************************************
89
![· jk.padmashali@nic.in 8870157906 DGFT, Trivandrum Shri R.A Nair, Dy DGFT [i] trivandrum-dgft @nic.in [ii] ra.nair@nic.in 04712441867](https://img.pdfslide.net/doc/110x75/5f9fbc266e37460ab4753c8a/jkpadmashalinicin-8870157906-dgft-trivandrum-shri-ra-nair-dy-dgft-i-trivandrum-dgft.jpg)