Embed Size (px)
Citation preview
E-mobility opportunities & challengesy g1st Green Manufacturing Summit – Sectoral Case Automotive
New Dehli, 18 March, 2011
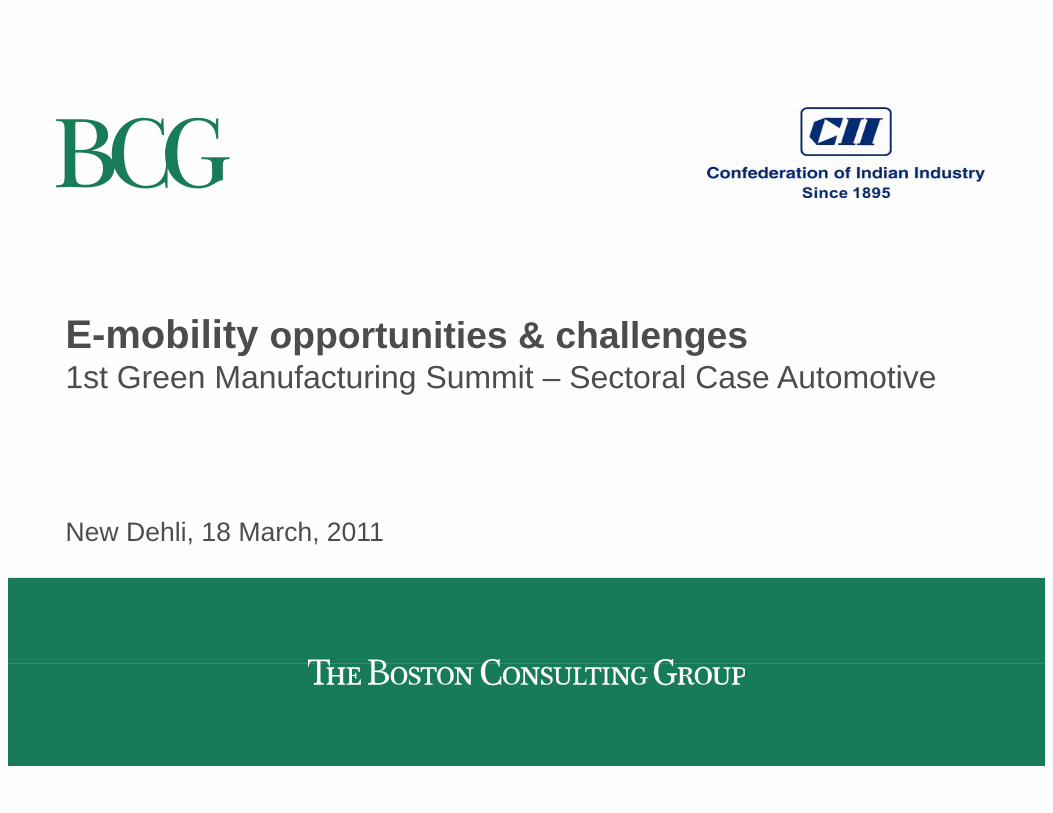
Electricity has a long history in car technology
La Jamais Contente, 1899La Jamais Contente, 1899
2
4
5 1
1
1
1
VW (incl. Audi)
GM (Opel)
Toyota
HybridPlug-in hybridRange extend.Full EV
Ampera
E-tron spyder
2
3
4
1
2
1
1
3
1
Honda
PSA
Hyundai
Ford ICEC-Max PHEV
BlueOn
iOn, EX1, Survolt3-RC
2
1
1
3 4
2
R l
Suzuki
Fiat
Nissan
Honda
Fluence ZE, Kangoo ZE, Twizy 3
5
2
1
4
BMW
Daimler(incl. smart)
Renaultg y
ZE, DeZir ZEA-class E-Cell
J t h i it f l?
1BCG-CII-New Dehli-18March11.ppt
Just a hype – or is it for real?... and what does it mean for the industry?
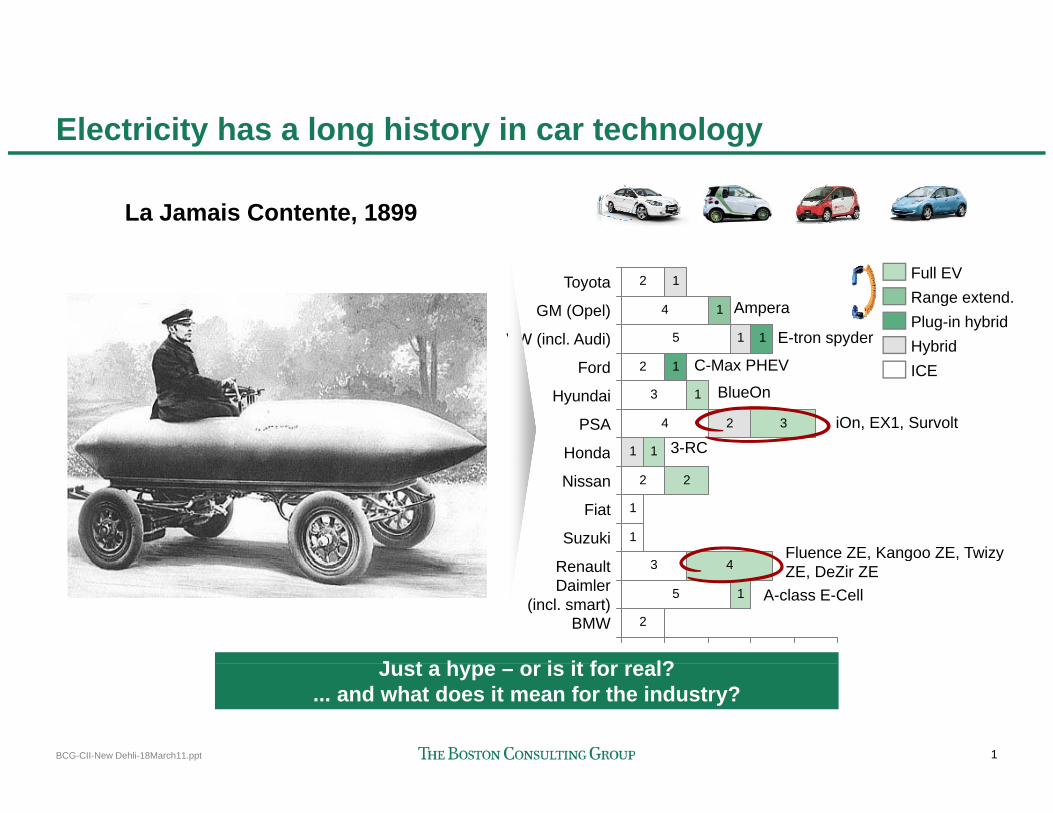
Bold statements regarding e-Car ramp-up
... with strong strategic ambitions... with strong strategic ambitionsAggressive volume plans ...Aggressive volume plans ...
"We think that scale for us is between 500,000 and 1 million cars a year.">150
>150
>150"Volkswagen will be the automaker to massproduce the electric car for everyone."
>100
>100
"This vehicle will change the auto industrywe know today significantly."
72
>80
we know today significantly.
"We maintain our claim to be the worldwide market leader in e-mobility2012
2015
2BCG-CII-New Dehli-18March11.ppt
market leader in e mobility2012
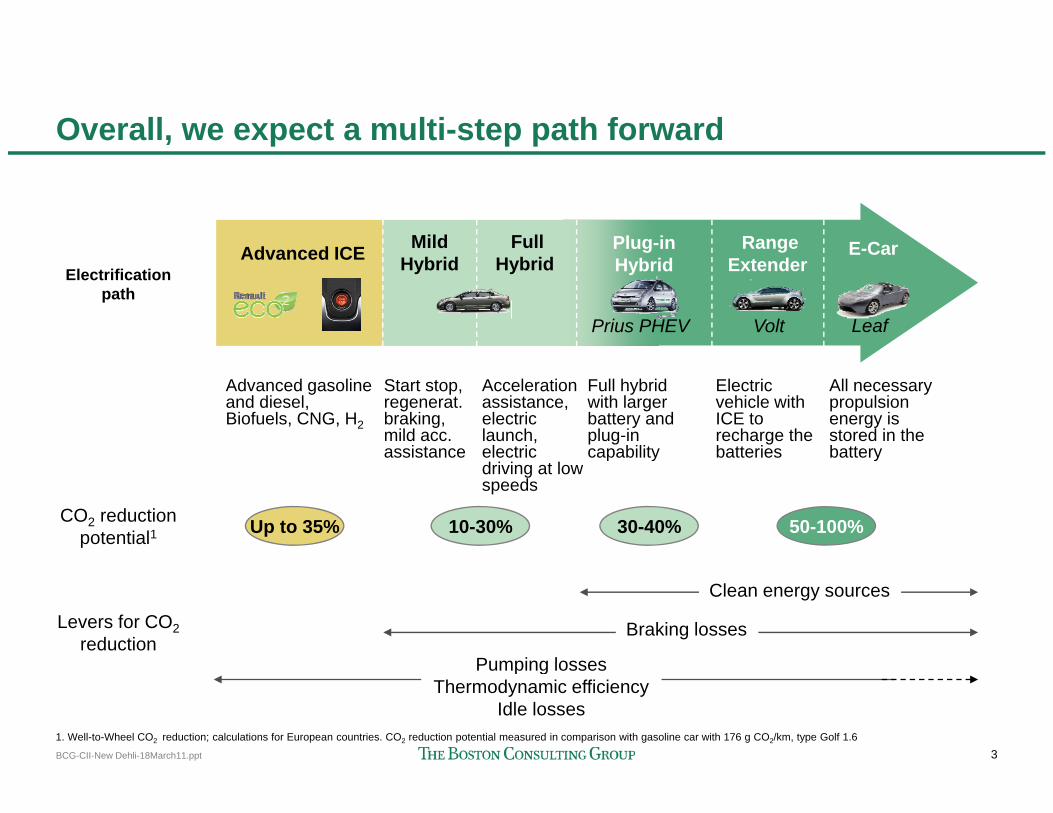
Overall, we expect a multi-step path forward
RangeAdvanced ICE Mild Plug-in E-CarFullExtenderAdvanced ICE Hybrid Hybrid
E CarElectrification
path
Prius PHEV Volt Leaf
Hybrid
Advanced gasoline and diesel, Biofuels, CNG, H2
Start stop, regenerat.braking, mild acc. assistance
Acceleration assistance, electric launch, electric
Full hybrid with larger battery and plug-in capability
Electric vehicle with ICE to recharge the batteries
All necessary propulsion energy is stored in the battery
Up to 35% 10-30% 30-40% 50-100%CO2 reduction potential1
driving at low speeds
p y y
Clean energy sources
Pumping losses
Levers for CO2 reduction
Braking losses
3BCG-CII-New Dehli-18March11.ppt
Pumping lossesThermodynamic efficiency
Idle losses1. Well-to-Wheel CO2 reduction; calculations for European countries. CO2 reduction potential measured in comparison with gasoline car with 176 g CO2/km, type Golf 1.6
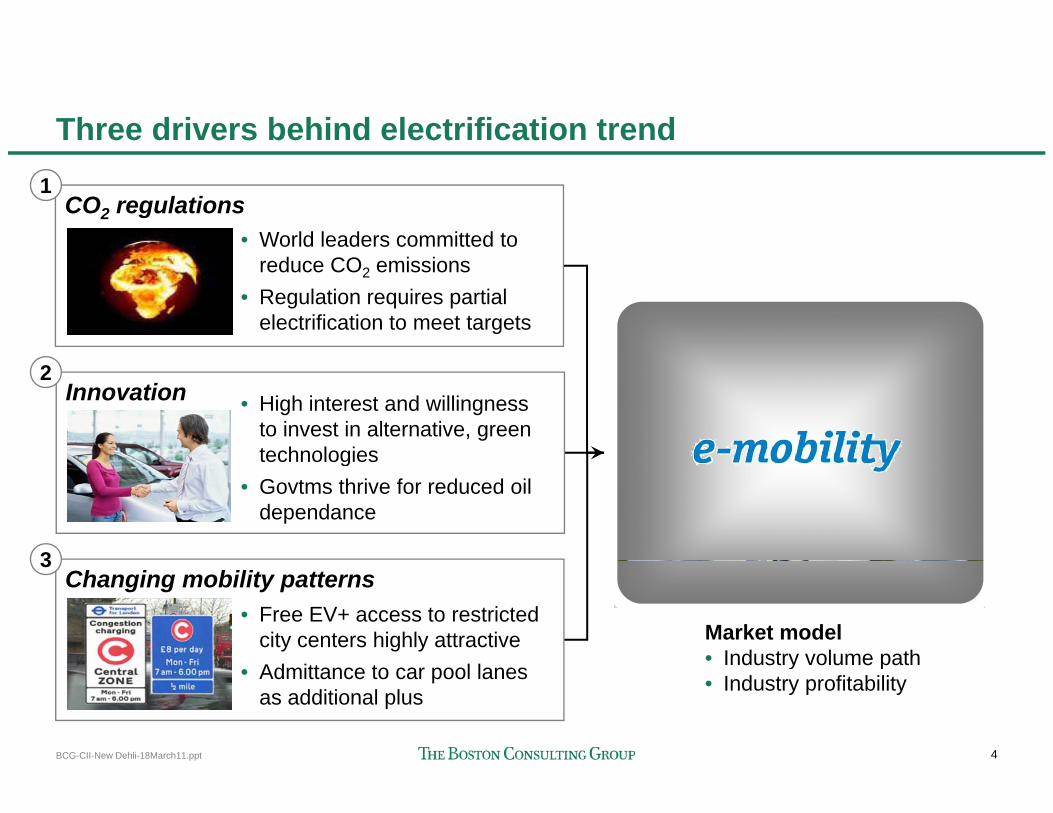
Three drivers behind electrification trend
CO2 regulations• World leaders committed to
1
reduce CO2 emissions• Regulation requires partial
electrification to meet targets
Innovation • High interest and willingness to invest in alternative, green technologies
2
technologies• Govtms thrive for reduced oil
dependance
3Changing mobility patterns
• Free EV+ access to restricted city centers highly attractive
3
Market model• Industry volume path
4BCG-CII-New Dehli-18March11.ppt
• Admittance to car pool lanes as additional plus
Industry volume path• Industry profitability
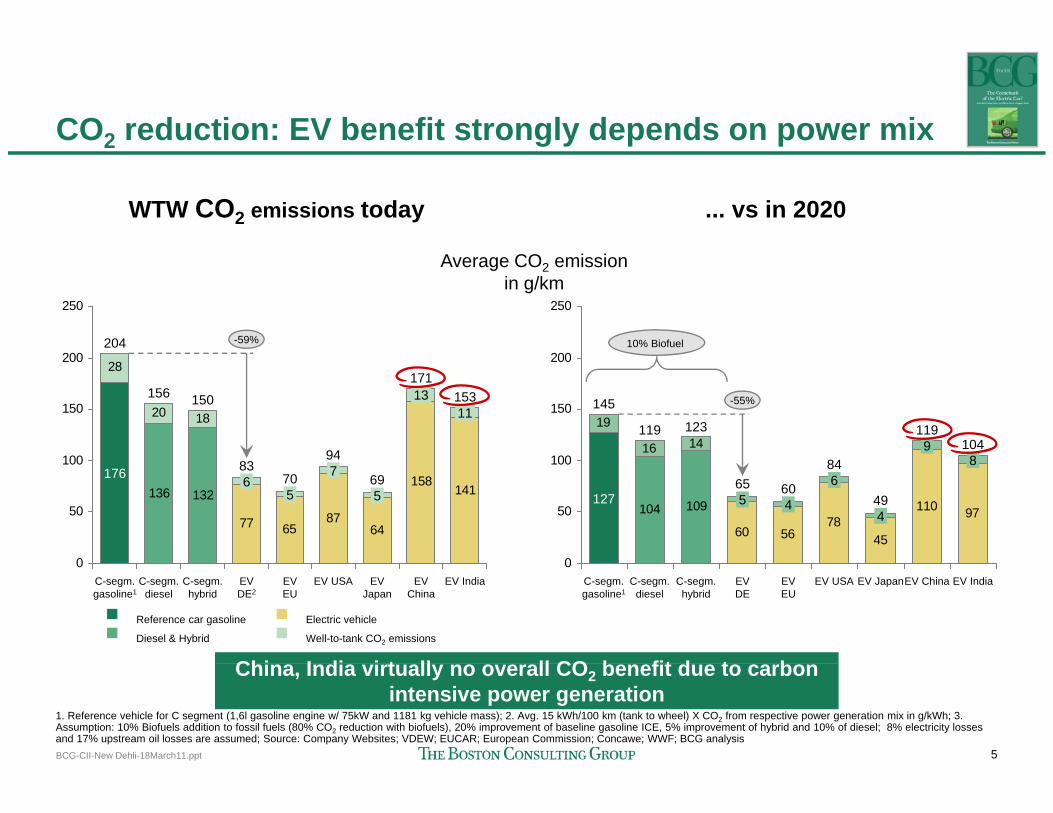
CO2 reduction: EV benefit strongly depends on power mix
WTW CO2 emissions todayWTW CO2 emissions today ... vs in 2020... vs in 2020
200
250
204 -59%
200
250
10% Biofuel
Average CO2 emission in g/km
1820
28
100
150
200
94
15015611
13171
153
1416
19
100
150
200
123119
145
89
119104
-55%
136 132
77 6587
64
158141
0
50
10069
94
7083
5
7
56176
104 109
60 5678
45
110 97
0
50
100 84
6065
8
4
6
45127 49
0C-segm. gasoline1
C-segm. diesel
C-segm. hybrid
EV DE2
EVEU
EV USA EV Japan
EV China
EV India0
EV IndiaC-segm. gasoline1
C-segm. diesel
C-segm. hybrid
EV DE
EVEU
EV USA EV JapanEV China
Chi I di i t ll ll CO b fit d t b
Reference car gasoline
Diesel & Hybrid
Electric vehicle
Well-to-tank CO2 emissions
5BCG-CII-New Dehli-18March11.ppt
China, India virtually no overall CO2 benefit due to carbon intensive power generation
1. Reference vehicle for C segment (1,6l gasoline engine w/ 75kW and 1181 kg vehicle mass); 2. Avg. 15 kWh/100 km (tank to wheel) X CO2 from respective power generation mix in g/kWh; 3. Assumption: 10% Biofuels addition to fossil fuels (80% CO2 reduction with biofuels), 20% improvement of baseline gasoline ICE, 5% improvement of hybrid and 10% of diesel; 8% electricity losses and 17% upstream oil losses are assumed; Source: Company Websites; VDEW; EUCAR; European Commission; Concawe; WWF; BCG analysis
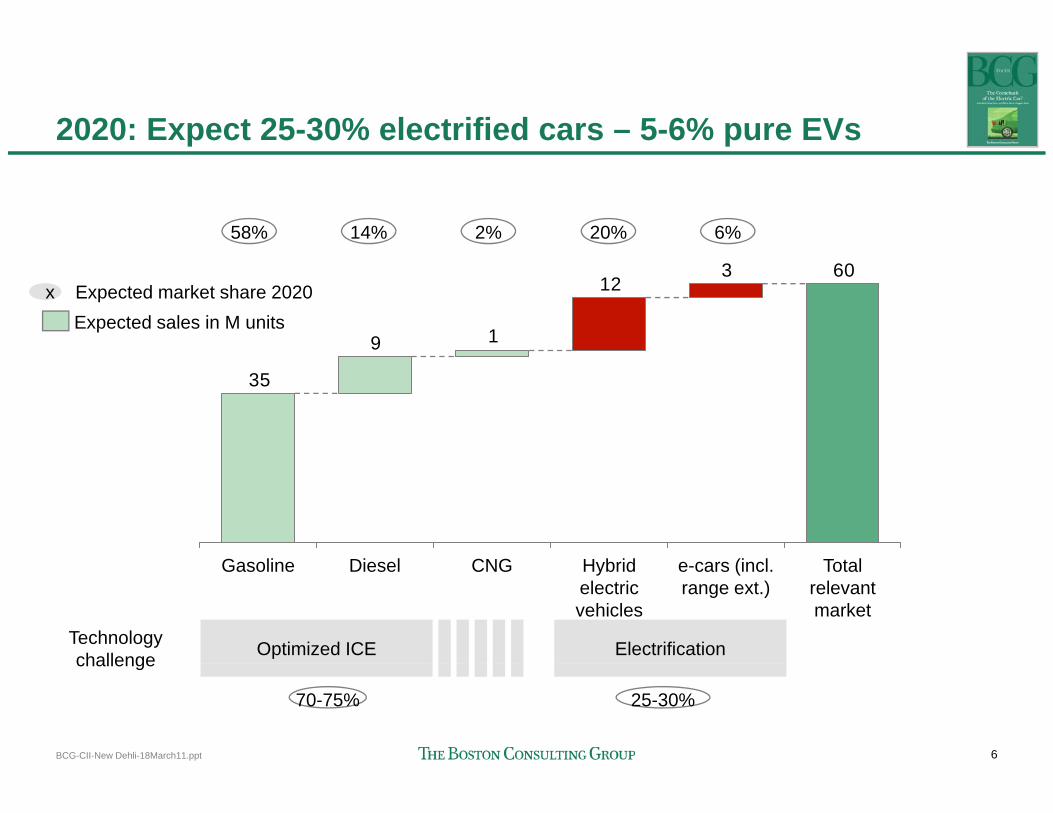
2020: Expect 25-30% electrified cars – 5-6% pure EVs
58% 14% 20% 6%2%
60312
19
x Expected market share 2020Expected sales in M units
35
T t l(i lH b idCNGDi lG li Total relevant market
e-cars (incl. range ext.)
Hybrid electricvehicles
CNGDieselGasoline
Optimized ICE ElectrificationTechnology challenge
6BCG-CII-New Dehli-18March11.ppt
70-75% 25-30%
challenge
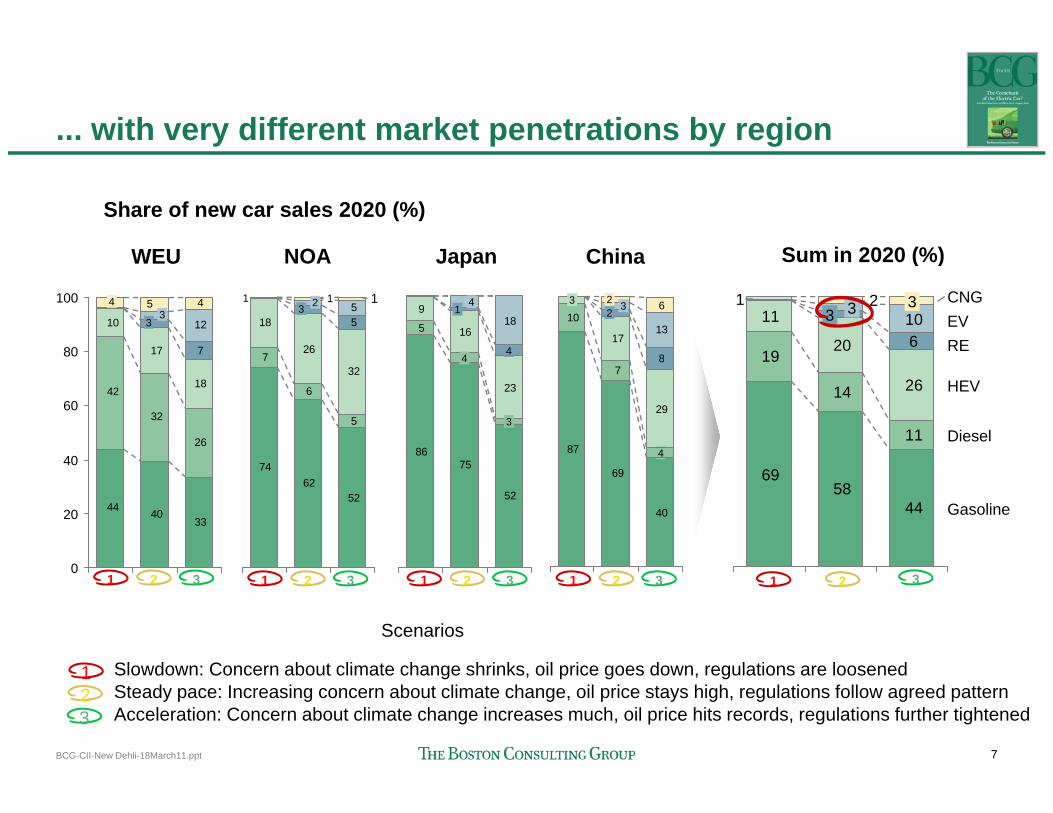
... with very different market penetrations by region
Sum in 2020 (%)Sum in 2020 (%)
Share of new car sales 2020 (%)
WEU NOA Japan China
17
10
7
12
45
80
100
33
4
726
18 55
113 2
5 16
918
44
14
10
17
8
13
62 323
Sum in 2020 (%)Sum in 2020 (%)
1920
11610
213 3
REEVCNG3
WEU NOA Japan China
1
26
32
4218
80
60
40
5
6
732
86
23
3
4
87
7
29
8
411
14
19
26
Diesel
HEV
334044
40
2052
6274
52
75
40
69
4458
69
Gasoline
01 32 1 32 1 32 1 32 1 32
ScenariosScenarios
Sl d C b t li t h h i k il i d l ti l d
7BCG-CII-New Dehli-18March11.ppt
1 Slowdown: Concern about climate change shrinks, oil price goes down, regulations are loosened2 Steady pace: Increasing concern about climate change, oil price stays high, regulations follow agreed pattern3 Acceleration: Concern about climate change increases much, oil price hits records, regulations further tightened
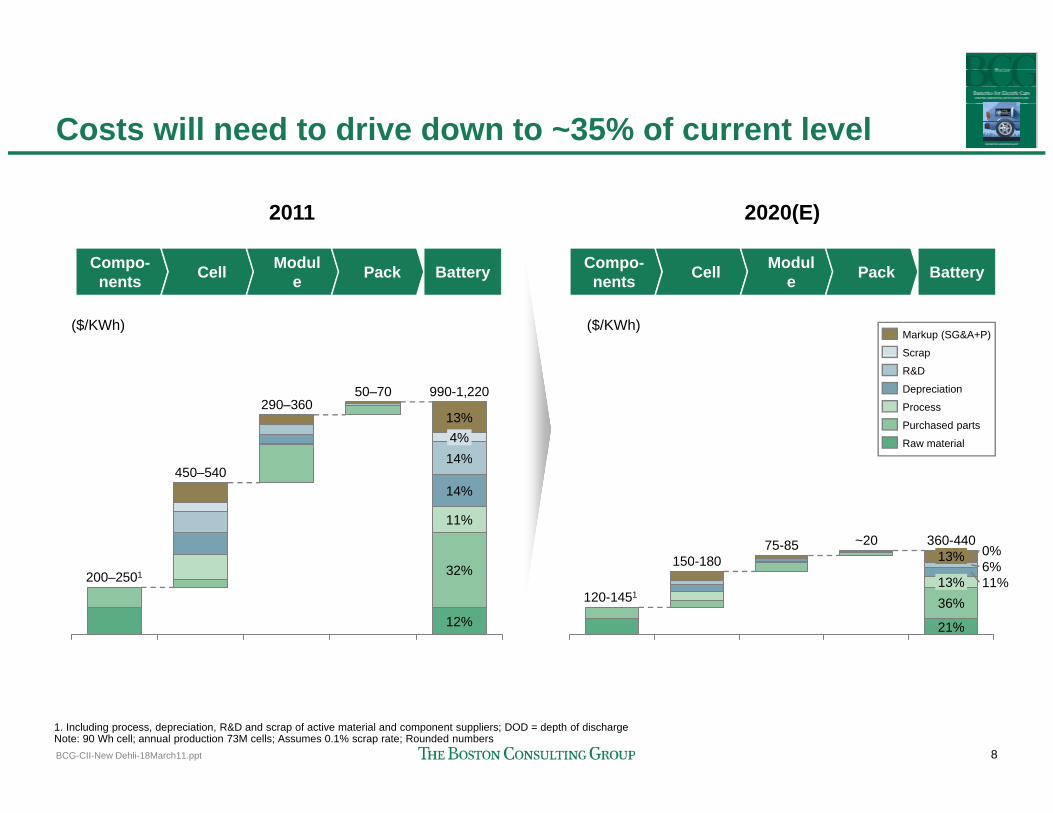
Costs will need to drive down to ~35% of current level
20112011 2020(E)2020(E)
Compo-nents Cell Modul
e Pack Battery Compo-nents Cell Modul
e Pack Battery
($/KWh) ($/KWh)Markup (SG&A+P)
Scrap
990-1,220
14%4%13%
50–70290–360
Purchased parts
Scrap
Raw material
Depreciation
Process
R&D
11%
14%
14%450–540
75-85150 180
360-4400%13%
~20
12%
32%200–2501150-180
120-145113%
21%
36%11%6%
13%
8BCG-CII-New Dehli-18March11.ppt
1. Including process, depreciation, R&D and scrap of active material and component suppliers; DOD = depth of dischargeNote: 90 Wh cell; annual production 73M cells; Assumes 0.1% scrap rate; Rounded numbers
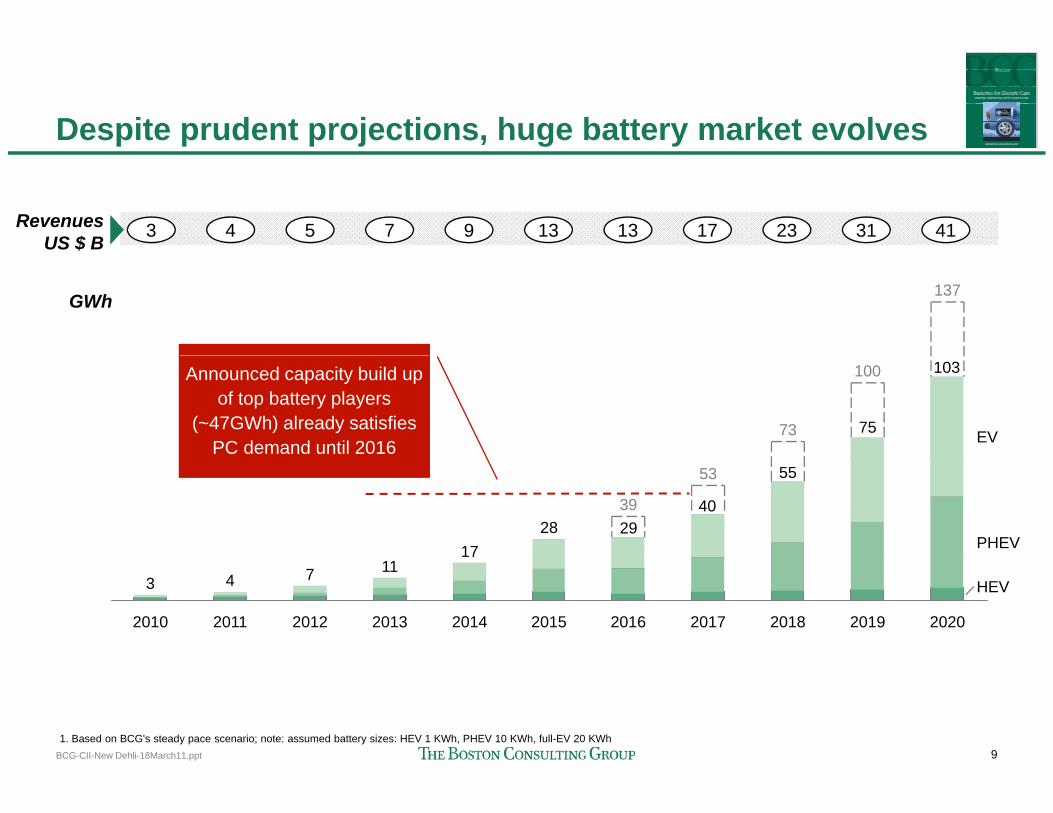
Despite prudent projections, huge battery market evolves
3 4 5 7 9 13 13 17 23 31 41RevenuesUS $ B
137GWh
EV
100
73
Announced capacity build up of top battery players
(~47GWh) already satisfies PC demand until 2016
103
75
PHEV
53
3928
1711
55
4029
HEV
20202019201820172016201520142013
11
2012
7
2011
4
2010
3
9BCG-CII-New Dehli-18March11.ppt
1. Based on BCG's steady pace scenario; note: assumed battery sizes: HEV 1 KWh, PHEV 10 KWh, full-EV 20 KWh
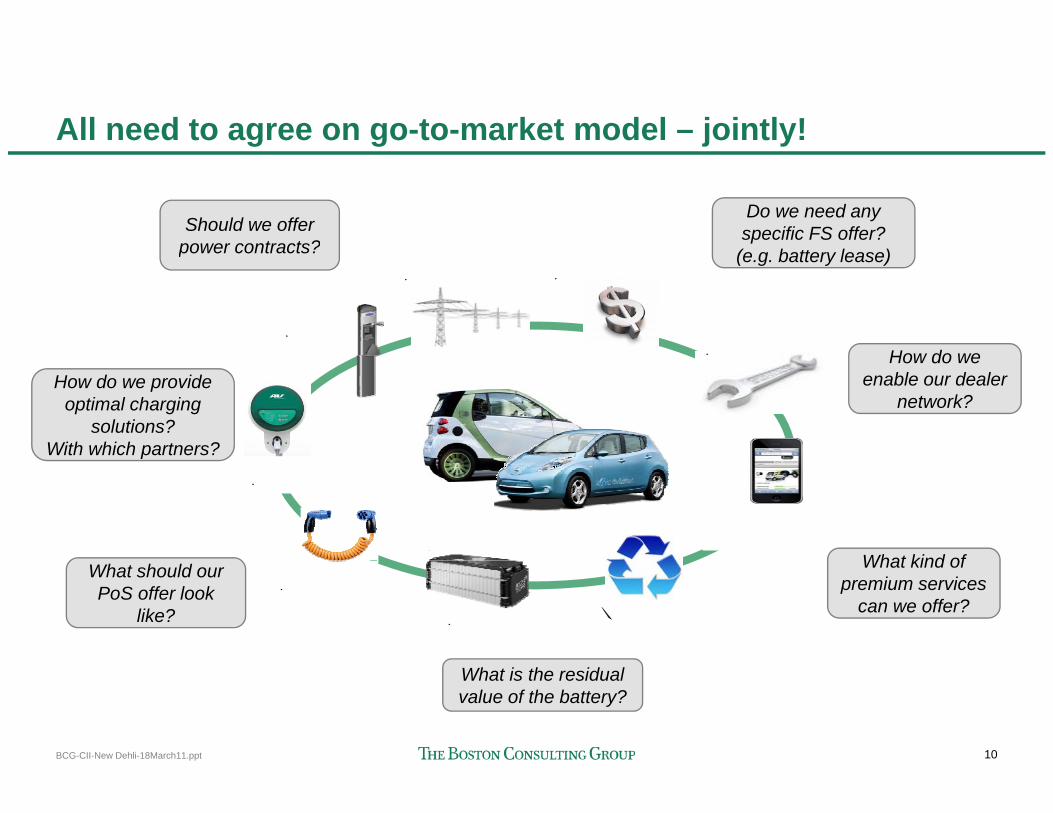
All need to agree on go-to-market model – jointly!
Do we need any specific FS offer?
(e g battery lease)
Should we offer power contracts?
C�������
P���� �������� F�������� ��������
M How do we
(e.g. battery lease)power contracts?
��������������
http://ed.smart.comhttp://ed.smart.com
���������� How do we enable our dealer
network?How do we provide
optimal charging solutions?
With which partners?W������
����������
��������
What kind of
p
C������� ����
B������
R��������
What kind of premium services
can we offer?
What should our PoS offer look
like?
10BCG-CII-New Dehli-18March11.ppt
What is the residual value of the battery?
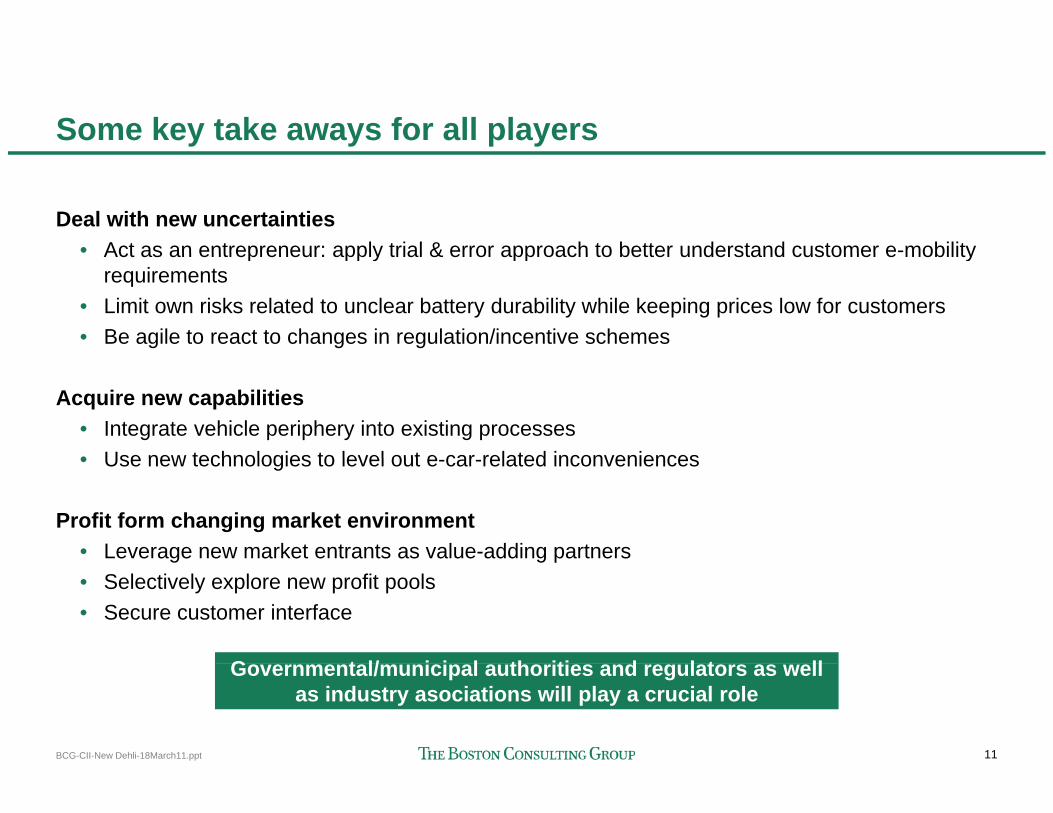
Some key take aways for all players
Deal with new uncertainties• Act as an entrepreneur: apply trial & error approach to better understand customer e-mobilityAct as an entrepreneur: apply trial & error approach to better understand customer e mobility
requirements• Limit own risks related to unclear battery durability while keeping prices low for customers• Be agile to react to changes in regulation/incentive schemes
Acquire new capabilities• Integrate vehicle periphery into existing processes• Use new technologies to level out e car related inconveniences• Use new technologies to level out e-car-related inconveniences
Profit form changing market environment• Leverage new market entrants as value-adding partnersg g p• Selectively explore new profit pools• Secure customer interface
G t l/ i i l th iti d l t ll
11BCG-CII-New Dehli-18March11.ppt
Governmental/municipal authorities and regulators as well as industry asociations will play a crucial role