Embed Size (px)
Citation preview
March 1, 2012
Local Government Assistance & Economic Analysis Texas Comptroller of Public Accounts P.O. Box 13528 Austin, Texas 78711-3528 RE: Amended Application to the Beaumont Independent School District from Lucite To the Local Government Assistance & Economic Analysis Division: On behalf of the Beaumont Independent School District, please find attached a supplemented Beaumont_Lucite_2013_Application. Please note the following changes from the application previously submitted to your office for review:
1. The applicant has updated the estimated date of application approval and start of qualifying time period.
2. The applicant has provided a detailed description of the entire “Project Rebound” and detailed the portions of the project that are subject to the application.
3. Applicant has provided specific detailed legal descriptions based upon the Jefferson County Appraisal Records of the existing property that will be exempt from any approved agreement with the Beaumont Independent School District.
4. Schedules A and B have been amended 5. Applicant has provided a digital map of the planned facility sites. The map also
provides the location of the existing facilities that are not the subject of its application to Beaumont ISD.
6. The Order creating the reinvestment zone has been included in the application. We will submit by Monday a revised school finance report based upon the new investment numbers.
Letter to Local Government Assistance & Economic Analysis Division March 1, 2012 Page 2 of 2 In accordance with 34 Tex. Admin Code §9.1054, a copy of the supplemented application will be submitted to the Jefferson County Appraisal District. Sincerely,
Kevin O’Hanlon School District Consultant Cc: Chief Appraiser Jefferson County Appraisal District
Robert Zingelman, Beaumont ISD
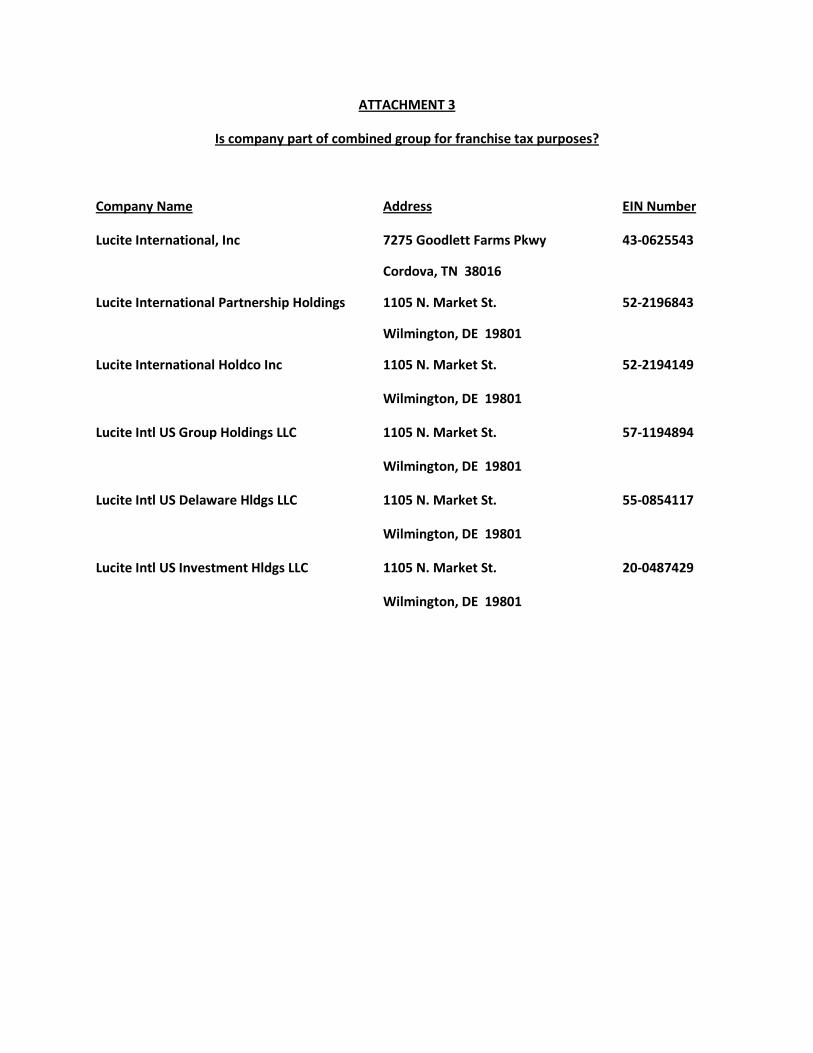
ATTACHMENT 3
Is company part of combined group for franchise tax purposes?
Company Name Address EIN Number
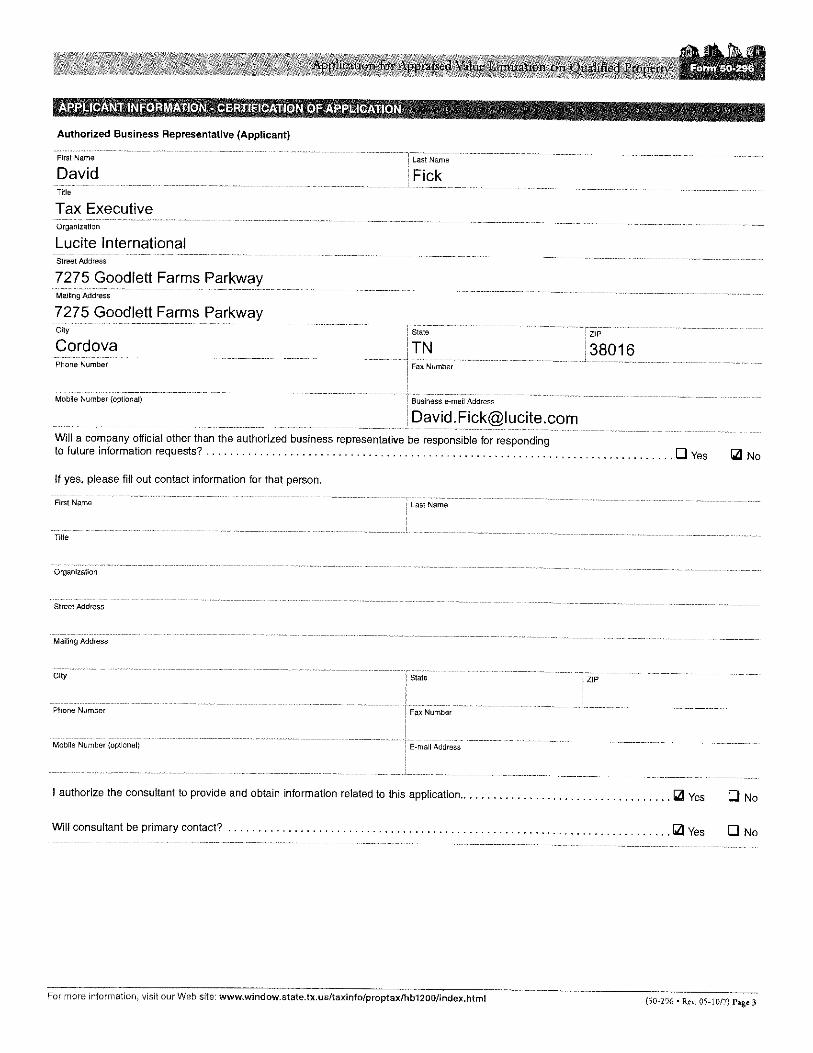
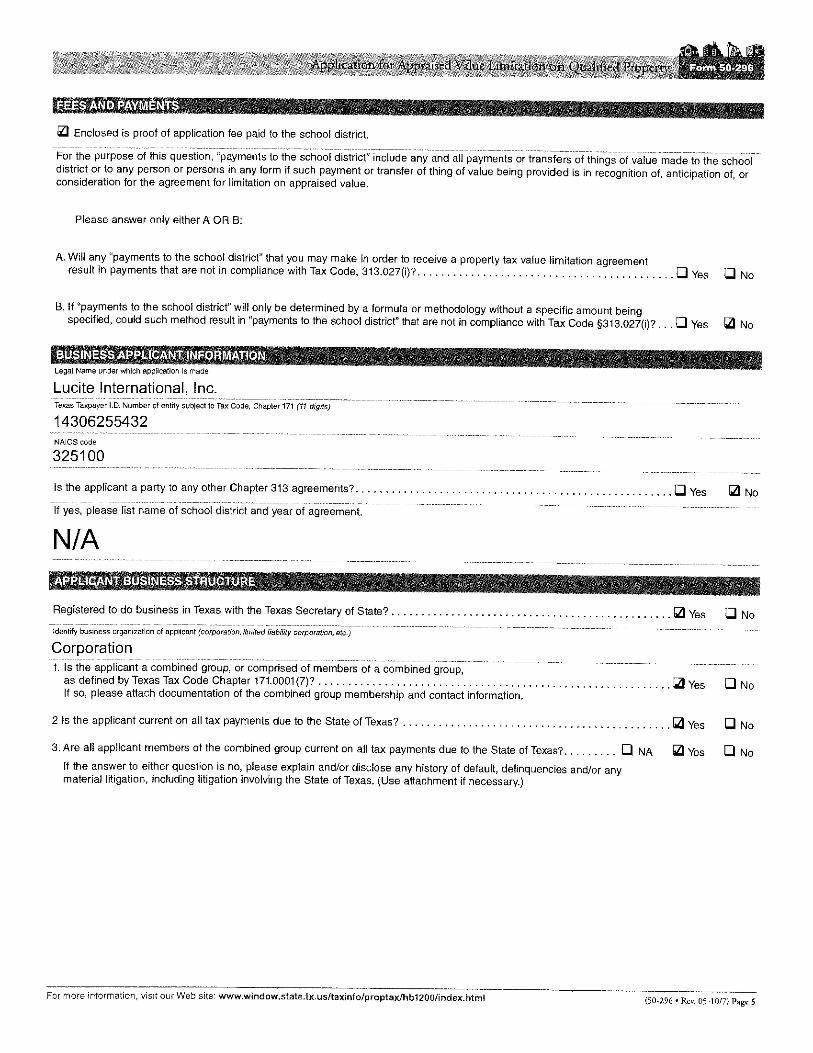
Lucite International, Inc 7275 Goodlett Farms Pkwy 43-0625543
Cordova, TN 38016
Lucite International Partnership Holdings 1105 N. Market St. 52-2196843
Wilmington, DE 19801
Lucite International Holdco Inc 1105 N. Market St. 52-2194149
Wilmington, DE 19801
Lucite Intl US Group Holdings LLC 1105 N. Market St. 57-1194894
Wilmington, DE 19801
Lucite Intl US Delaware Hldgs LLC 1105 N. Market St. 55-0854117
Wilmington, DE 19801
Lucite Intl US Investment Hldgs LLC 1105 N. Market St. 20-0487429
Wilmington, DE 19801
ATTACHMENT 4
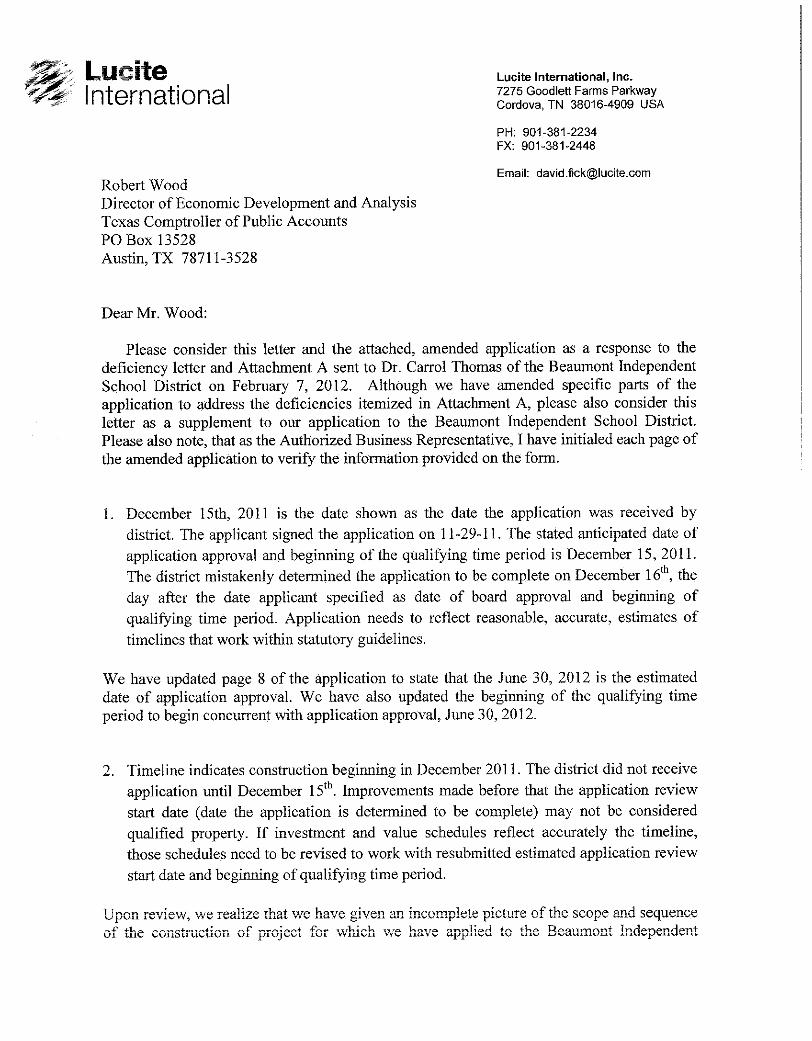
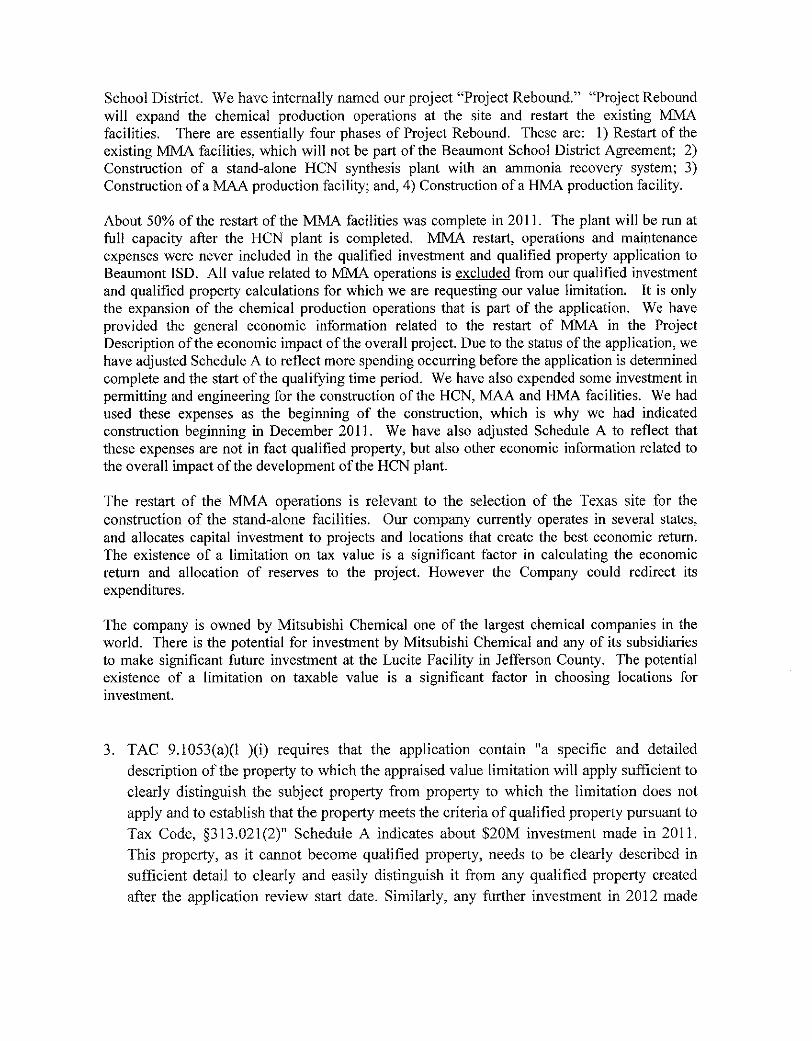
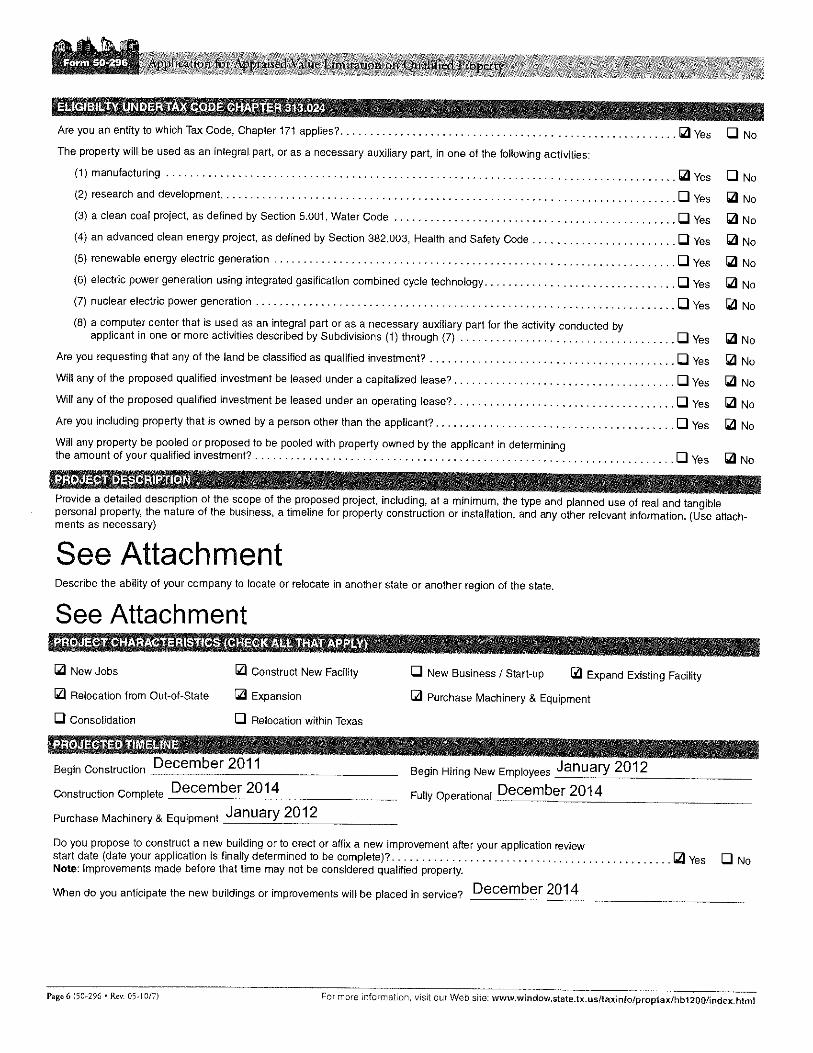
Lucite International's Project Rebound is aptly named as it will breathe new life into an underutilized facility located at 6350 North Twin City Highway in Nederland, Texas. Project Rebound will expand the chemical production operations at the site and restart the existing MMA facilities. There are basically four phases of Project Rebound. These are: 1) Restart of the existing MMA facilities (will not be part of the Beaumont School District Agreement), 2) Construction of a stand alone HCN synthesis plant with an ammonia recovery system, 3) Construction of a MAA production facility and 4) Construction of a HMA production facility. MMA Restart - Initially, the project will entail clean-up, maintenance and turnaround of the 1st and 2nd trains of the existing methyl methacrylate (MMA) plant. The company will spend approximately $12.7 million on the restart of the MMA operations. All the spend on the restart of operations will be on heavy maintenance of the existing MMA operations so no new equipment will be put in place and thus no new equipment on the tax rolls as a result of this effort. The MMA operations were restarted in early 2011and continue in operation today. The restart of the MMA operations and the existing MMA process will not be part of the Beaumont School District Agreement. It is only mentioned here because it is part of Project Rebound. HCN Plant - A Hydrogen Cyanide (HCN) synthesis plant and an ammonia recovery system for the HCN plant will be constructed with a projected Q4 2012 start-up. These production assets are expected to be located on vacant land at the site near the abandoned Acrylonitrile process. Please note that the abandoned Acrylonitrile assets and the associated equipment will not be part of the Beaumont School District Agreement. Projected spending to build the HCN plant is $32.5 million. Initial construction spending began in 3Q 2011, which included engineering, permitting, initial payments on long lead items and site preparation. Construction is anticipated to be complete, and property will be placed in service in Q4 2012. MAA Plant - A methacrylic acid (MAA) production plant will be constructed with a projected start- up of Q4 2012. The estimated costs to build the plant will be $32 million. These production assets will be located on vacant land located near the MMA production facility. Please note that although the MAA Plant is located near the MMA production facility, the MMA production facility and the associated equipment related to the MMA production facility will not be part of the Beaumont School District Agreement. Construction will begin before the end of the 2Q of 2012. HMA Plant – A Higher Monomers (HMA) production plant will be constructed with a projected start-up date of Q2 2014. These production assets are expected to be located on vacant land at the site near the abandoned Acrylonitrile process. Please note that the abandoned Acrylonitrile assets and the associated equipment will not be part of the Beaumont School District Agreement. Construction should start sometime in 2013. Some early engineering has been done on this project but the purchasing of equipment and the hiring of employees is not expected to take place until 2013. Lucite International will spend an estimated $97.2 million in investment on Project Rebound. The entire Project Rebound will add $84 Million to the local tax rolls. No improvements related to the MMA restart, however, are included in Schedule B. Schedule B only includes the value of property that will be subject to the agreement, i.e., the property listed in Attachment 8. The
qualified property for which we are requesting a value limitation we have estimated to have a value of $59,134,410 in TY 2014. Overall, the project is expected to take about 48 months to complete. Ability to relocate The Company currently operates in several states, and allocates capital investment to projects and locations that create the best economic return. The existence of a limitation on tax value is a significant factor in calculating the economic return and allocation of reserves to the project. However the Company could redirect its expenditures.
The company is owned by Mitsubishi Chemical one of the largest chemical companies in the world. There is the potential for investment by Mitsubishi Chemical and any of its subsidiaries to make significant future investment at the Lucite Facility in Jefferson County. The existence of a limitation on tax value is a significant factor in choosing locations for investment.

ATTACHMENT 5
N/A
Attachment 6
Higher Mononomers Production Facility: The project provides for construction of a Higher Monomers Production Facility. Major items of equipment in this phase of the project include: Reaction Kettles Distillation Columns Pumps Condensers Storage Tanks Project will also include any other necessary equipment to construct a fully functioning Higher Monomers manufacturing plant.
ATTACHMENT 6
HCN Plant: The project will provide facilities to produce HCN used in the manufacture of MMA. Major items of equipment that will be constructed for this phase of the project will include: HCN Column HCN Column Reflux Drum Rich/Lean Circulation Water Heat Exchangers Pumps Absorber Column Waste Water Column Packed Scrubber Project will also include any other necessary equipment to construct a fully functioning HCN manufacturing plant. Ammonia Recovery: The purpose of the Ammonia Recovery System will be to recover unreacted ammonia to recycle it back into the HCN process. Major items of equipment that will be constructed for this phase of the project will include: Ammonia Absorber HCN Phosphate Stripper Ammonia Stripper Ammonia Rectifier Project will also include any other necessary equipment to construct a fully functioning Ammonia Recovery System. MAA Manufacturing Plant: The project will construct facilities to produce MAA. Major items of equipment that will be used in the construction include: Reactors Decanters Afterboiler Heavies Removal Column Water Stripper Column Product Rectifier Column Pumps Tanks Project will also include any other necessary equipment to construct a fully functioning MAA manufacturing plant.

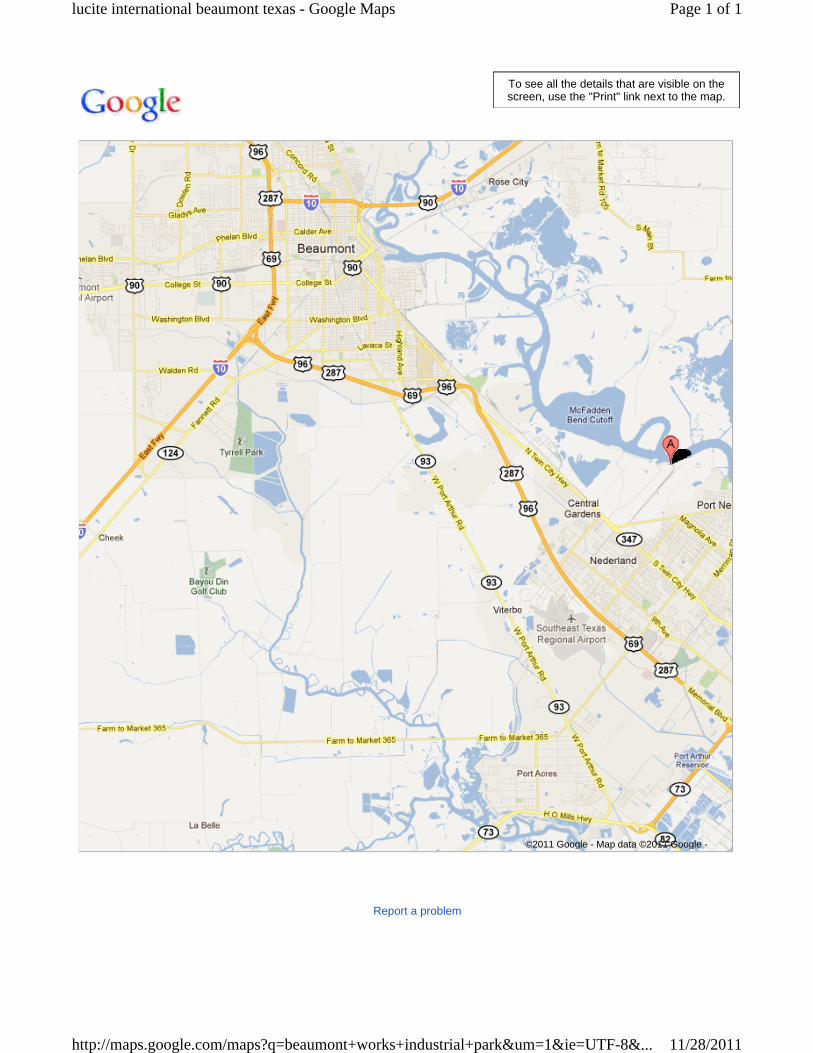
©2011 Google - Map data ©2011 Google -
Report a problem
To see all the details that are visible on the screen, use the "Print" link next to the map.
Page 1 of 1lucite international beaumont texas - Google Maps
11/28/2011http://maps.google.com/maps?q=beaumont+works+industrial+park&um=1&ie=UTF-8&...

ATTACHMENT 8
HCN Plant: The project will provide facilities to produce HCN used in the manufacture of MMA. Major items of equipment that will be constructed for this phase of the project will include: HCN Column HCN Column Reflux Drum Rich/Lean Circulation Water Heat Exchangers Pumps Absorber Column Waste Water Column Packed Scrubber Project will also include any other necessary equipment to construct a fully functioning HCN manufacturing plant. Ammonia Recovery: The purpose of the Ammonia Recovery System will be to recover unreacted ammonia to recycle it back into the HCN process. Major items of equipment that will be constructed for this phase of the project will include: Ammonia Absorber HCN Phosphate Stripper Ammonia Stripper Ammonia Rectifier Project will also include any other necessary equipment to construct a fully functioning Ammonia Recovery System. MAA Manufacturing Plant: The project will construct facilities to produce MAA. Major items of equipment that will be used in the construction include: Reactors Decanters Afterboiler Heavies Removal Column Water Stripper Column Product Rectifier Column Pumps Tanks Project will also include any other necessary equipment to construct a fully functioning MAA manufacturing plant.
Attachment 8
Higher Mononomers Production Facility: The project provides for construction of a Higher Monomers Production Facility. Major items of equipment in this phase of the project include: Reaction Kettles Distillation Columns Pumps Condensers Storage Tanks Project will also include any other necessary equipment to construct a fully functioning Higher Monomers manufacturing plant.
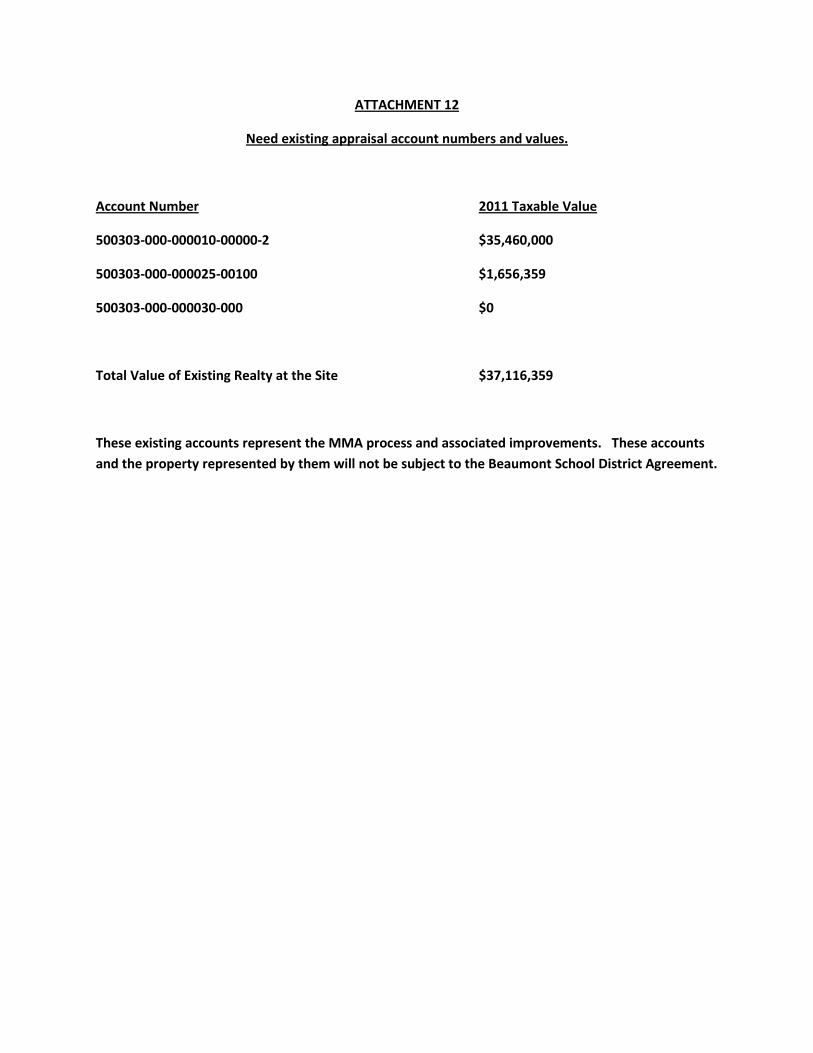
ATTACHMENT 12
Need existing appraisal account numbers and values.
Account Number 2011 Taxable Value
500303-000-000010-00000-2 $35,460,000
500303-000-000025-00100 $1,656,359
500303-000-000030-000 $0
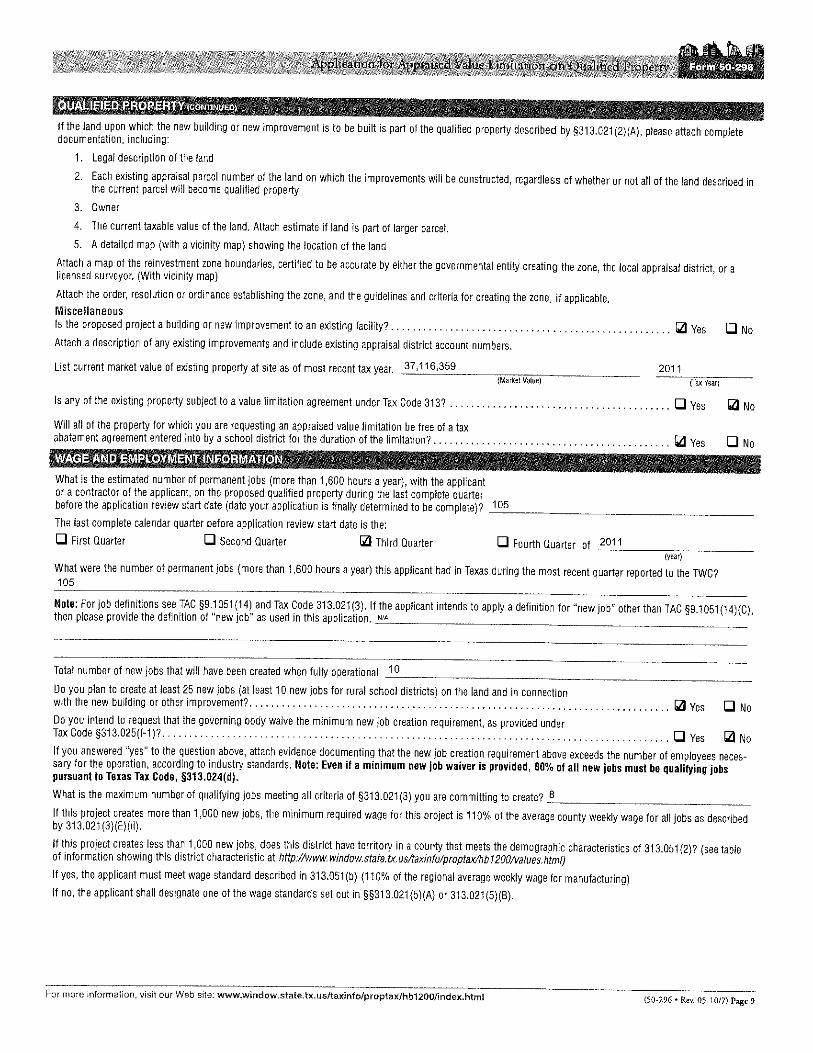
Total Value of Existing Realty at the Site $37,116,359
These existing accounts represent the MMA process and associated improvements. These accounts and the property represented by them will not be subject to the Beaumont School District Agreement.

ATTACHMENT 13
Job Requirement Waiver N/A
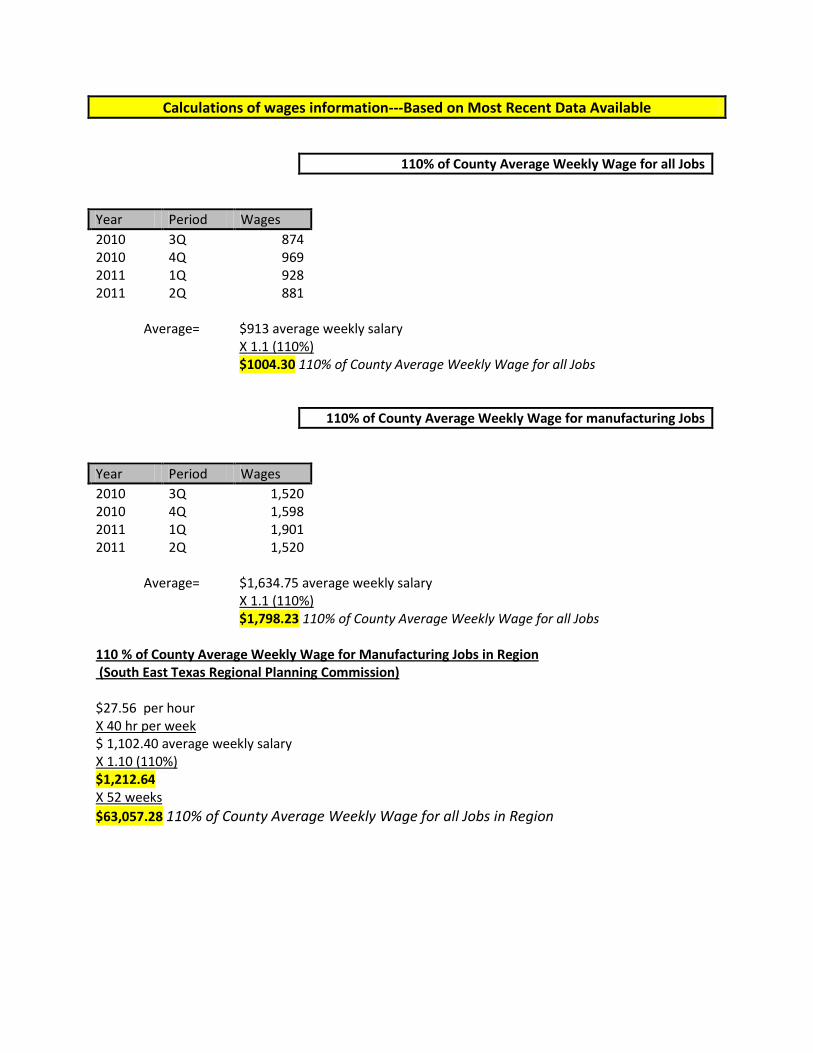
Calculations of wages information---Based on Most Recent Data Available
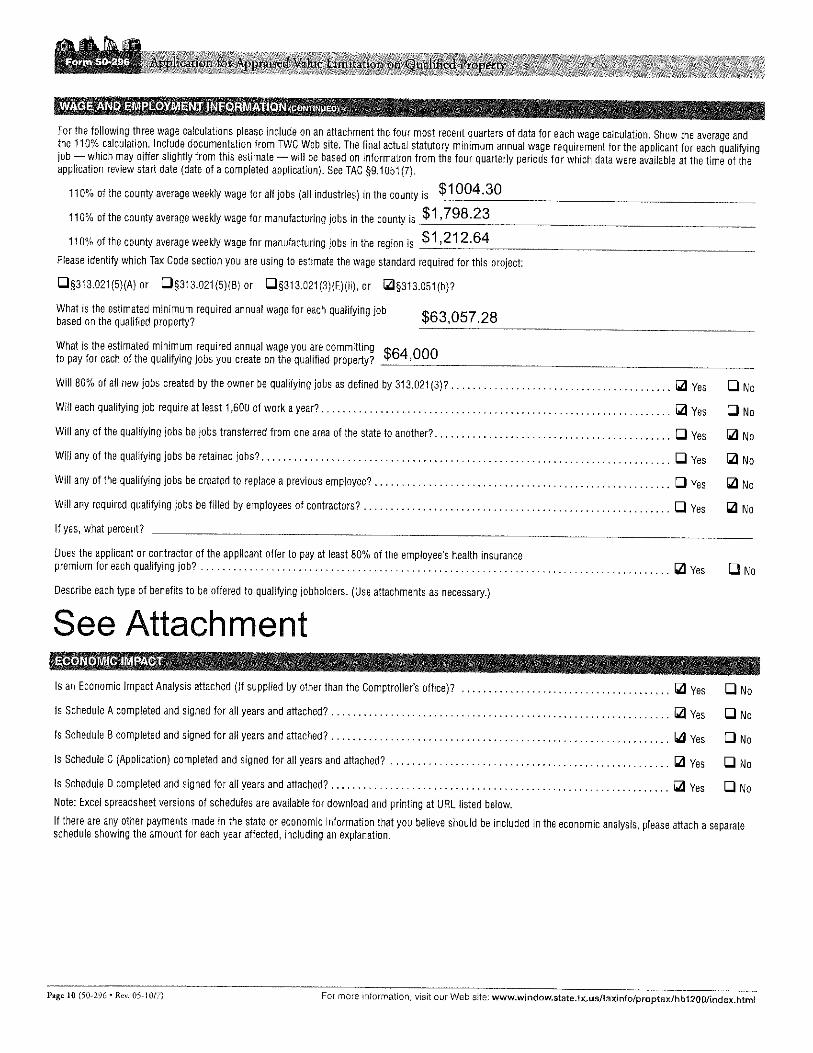
110% of County Average Weekly Wage for all Jobs
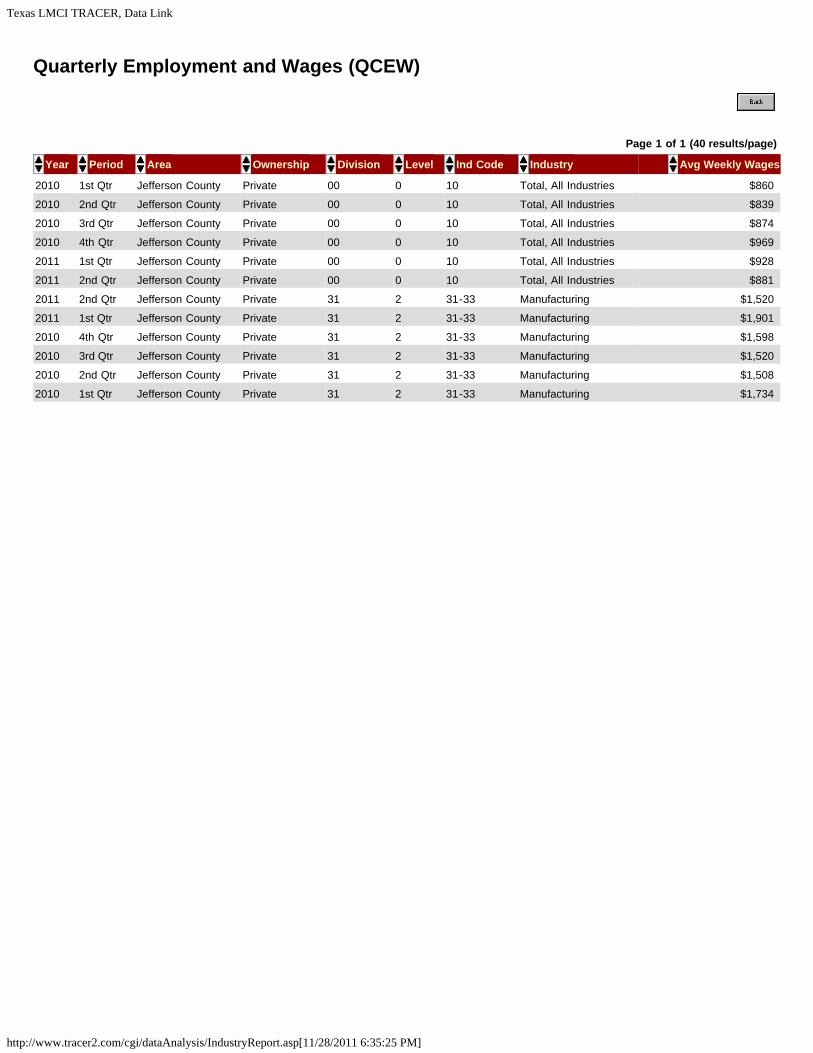
Year Period Wages 2010 3Q 874 2010 4Q 969 2011 1Q 928 2011 2Q 881 Average= $913 average weekly salary X 1.1 (110%) $1004.30 110% of County Average Weekly Wage for all Jobs
110% of County Average Weekly Wage for manufacturing Jobs
Year Period Wages 2010 3Q 1,520 2010 4Q 1,598 2011 1Q 1,901 2011 2Q 1,520 Average= $1,634.75 average weekly salary X 1.1 (110%) $1,798.23 110% of County Average Weekly Wage for all Jobs 110 % of County Average Weekly Wage for Manufacturing Jobs in Region (South East Texas Regional Planning Commission) $27.56 per hour X 40 hr per week $ 1,102.40 average weekly salary X 1.10 (110%) $1,212.64 X 52 weeks $63,057.28 110% of County Average Weekly Wage for all Jobs in Region
Texas LMCI TRACER, Data Link
http://www.tracer2.com/cgi/dataAnalysis/IndustryReport.asp[11/28/2011 6:35:25 PM]
Quarterly Employment and Wages (QCEW)
Page 1 of 1 (40 results/page)
Year Period Area Ownership Division Level Ind Code Industry Avg Weekly Wages
2010 1st Qtr Jefferson County Private 00 0 10 Total, All Industries $860
2010 2nd Qtr Jefferson County Private 00 0 10 Total, All Industries $839
2010 3rd Qtr Jefferson County Private 00 0 10 Total, All Industries $874
2010 4th Qtr Jefferson County Private 00 0 10 Total, All Industries $969
2011 1st Qtr Jefferson County Private 00 0 10 Total, All Industries $928
2011 2nd Qtr Jefferson County Private 00 0 10 Total, All Industries $881
2011 2nd Qtr Jefferson County Private 31 2 31-33 Manufacturing $1,520
2011 1st Qtr Jefferson County Private 31 2 31-33 Manufacturing $1,901
2010 4th Qtr Jefferson County Private 31 2 31-33 Manufacturing $1,598
2010 3rd Qtr Jefferson County Private 31 2 31-33 Manufacturing $1,520
2010 2nd Qtr Jefferson County Private 31 2 31-33 Manufacturing $1,508
2010 1st Qtr Jefferson County Private 31 2 31-33 Manufacturing $1,734
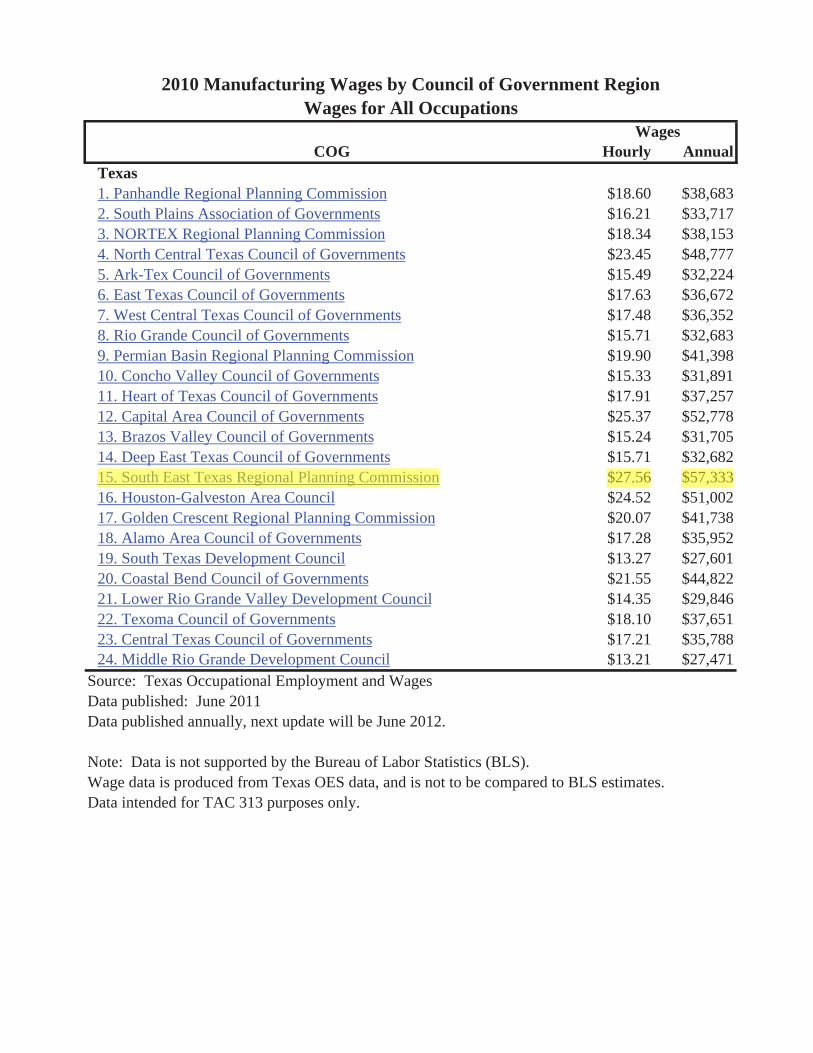
COG Hourly AnnualTexas1. Panhandle Regional Planning Commission $18.60 $38,6832. South Plains Association of Governments $16.21 $33,7173. NORTEX Regional Planning Commission $18.34 $38,1534. North Central Texas Council of Governments $23.45 $48,7775. Ark-Tex Council of Governments $15.49 $32,2246. East Texas Council of Governments $17.63 $36,6727. West Central Texas Council of Governments $17.48 $36,3528. Rio Grande Council of Governments $15.71 $32,6839. Permian Basin Regional Planning Commission $19.90 $41,39810. Concho Valley Council of Governments $15.33 $31,89111. Heart of Texas Council of Governments $17.91 $37,25712. Capital Area Council of Governments $25.37 $52,77813. Brazos Valley Council of Governments $15.24 $31,70514. Deep East Texas Council of Governments $15.71 $32,68215. South East Texas Regional Planning Commission $27.56 $57,33316. Houston-Galveston Area Council $24.52 $51,00217. Golden Crescent Regional Planning Commission $20.07 $41,73818. Alamo Area Council of Governments $17.28 $35,95219. South Texas Development Council $13.27 $27,60120. Coastal Bend Council of Governments $21.55 $44,82221. Lower Rio Grande Valley Development Council $14.35 $29,84622. Texoma Council of Governments $18.10 $37,65123. Central Texas Council of Governments $17.21 $35,78824. Middle Rio Grande Development Council $13.21 $27,471
Source: Texas Occupational Employment and WagesData published: June 2011Data published annually, next update will be June 2012.
Note: Data is not supported by the Bureau of Labor Statistics (BLS).Wage data is produced from Texas OES data, and is not to be compared to BLS estimates.Data intended for TAC 313 purposes only.
2010 Manufacturing Wages by Council of Government RegionWages for All Occupations
Wages

ATTACHMENT 15
In addition to the annual salary, each qualified position will receive Medical, Dental, Vision, Basic Life Insurance, and Short & Long Term Disability Insurance. The company also has a 401K plan that will 100% match up to 6% of the employee’s wages. The company also pays for an EAP (employee assistance program) and a tuition reimbursement program.
A Report of the Economic Impactover 25 Years from
Lucite International's
Project Rebound ‐‐ the RestartedOperations and Expansion of
December 19, 2010
Prepared for:
Beaumont, Texas Plant
6350 North Twin City Highway
Nederland, Texas 77627
Fax (512) 892‐2569
Lucite International
www.impactdatasource.com
(512) 892‐0205
Prepared by:
Impact DataSource
4709 Cap Rock Drive
Austin, Texas 78735
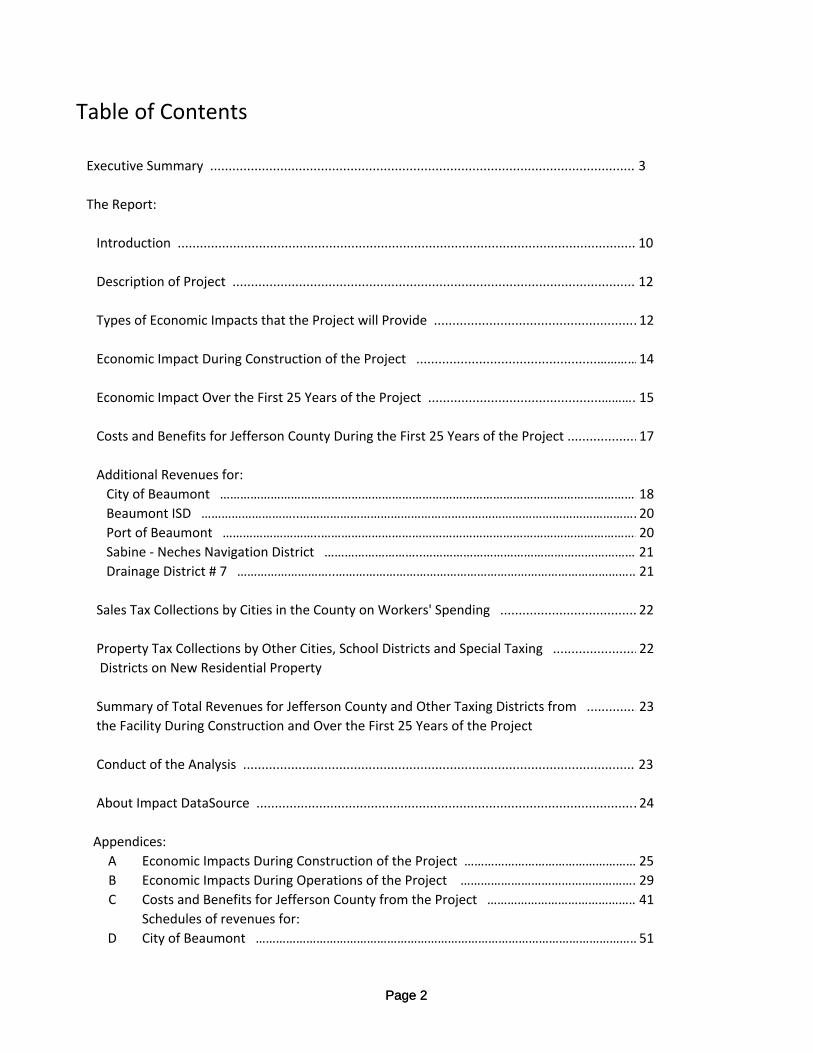
Table of Contents
Executive Summary ................................................................................................................... 3
The Report:
Introduction ............................................................................................................................ 10
Description of Project ............................................................................................................. 12
Types of Economic Impacts that the Project will Provide ....................................................... 12
Economic Impact During Construction of the Project .................................................…………14
Economic Impact Over the First 25 Years of the Project ...............................................…………15
Costs and Benefits for Jefferson County During the First 25 Years of the Project ...................17
Additional Revenues for:
City of Beaumont ………………………………………………………………………………………………………………18
Beaumont ISD ………………………..…………………………………………………………………………………………20
Port of Beaumont ………………………..……………………………………………………………………………………20
Sabine ‐ Neches Navigation District ………………………..……………………………………………………… 21
Drainage District # 7 ………………………..………………………………………………………………………………21
Page 2
Sales Tax Collections by Cities in the County on Workers' Spending ..................................... 22
Property Tax Collections by Other Cities, School Districts and Special Taxing .......................22
Districts on New Residential Property
Summary of Total Revenues for Jefferson County and Other Taxing Districts from ..............23
the Facility During Construction and Over the First 25 Years of the Project
Conduct of the Analysis .......................................................................................................... 23
About Impact DataSource ....................................................................................................... 24
Appendices:
A Economic Impacts During Construction of the Project …………………………………………… 25
B Economic Impacts During Operations of the Project ………………………………………………29
C Costs and Benefits for Jefferson County from the Project ………………………………………41
Schedules of revenues for:
D City of Beaumont ……………………………………………………………………………………………………51
Page 2

E Beaumont ISD …………………………………………………………………………………………………………57
F Port of Beaumont ……………………………………………………………………………………………………67
G Sabine ‐ Neches Navigation District …………………………………………………………………………73
H Drainage District # 7 …………………………………………………………………………………………………79
I Sales Taxes Collected by Other Cities on Workers' Spending ………………………………… 85
J Property Taxes Collected by Other Cities, School Districts and ……………………………… 87
Special Taxing Districts on New Residential Property
Page 3Page 3
Executive Summary
The Project
Lucite International’s Project Rebound for the restart of operations and expansion of the chemical
operations located at 6350 North Twin City Highway in Nederland, Texas will begin in 2011. Initially,
the project will entail clean‐up, maintenance and turnaround of the 1st and 2nd trains of the existing
methyl methacrylate (MMA) plant. No real property improvements will be associated with the
turnaround and restart of MMA production.
If approved, a hydrogen cyanide (HCN) synthesis plant and an ammonia recovery system for the HCN
plant will be constructed in 2011 with a projected 2012 start‐up. If approved, a methacrylic acid (MAA)
plant may be constructed with a projected start‐up in the fourth quarter of 2012. If approved, an HMA
(higher monomers production) plant may be constructed in 2013 and will be projected to be completed
for operation beginning in 2014.
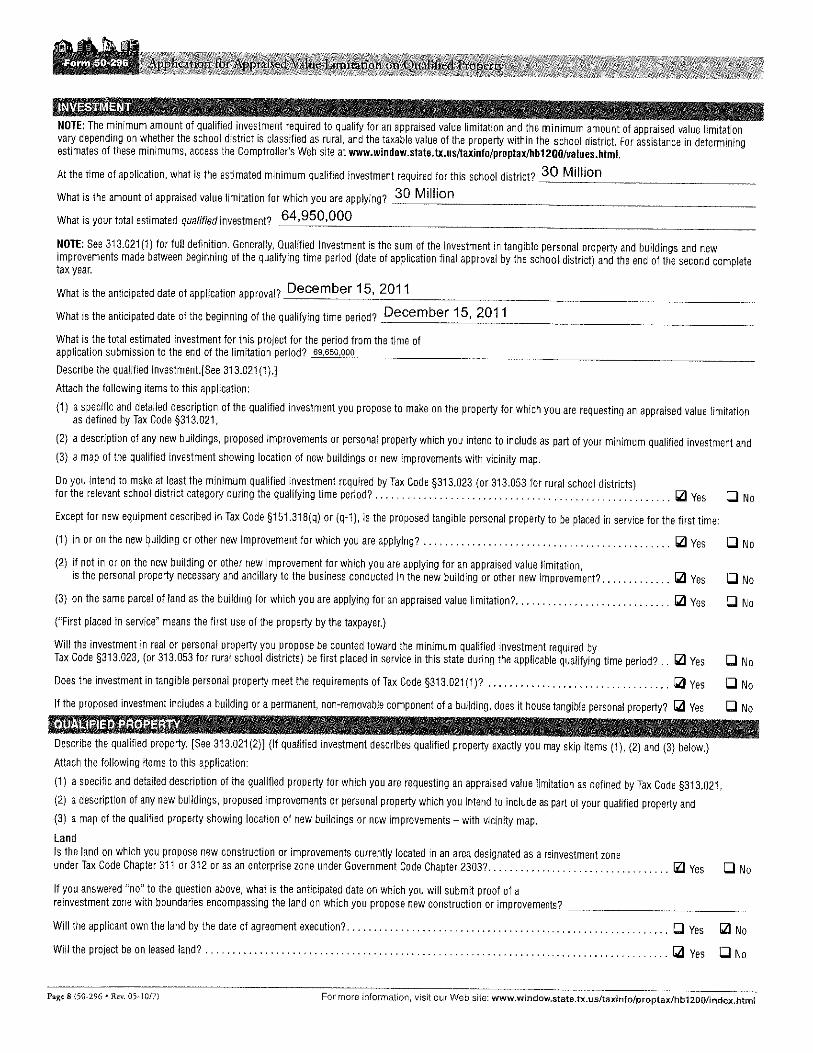
Lucite International will spend an estimated $97.2 million on restarting and expansion of its plant ‐‐
about $84 million of which will be added to local tax rolls.
Overall, the project is expected to take about 48 months to complete.
Once expanded, the facility will employ 105 permanent workers whose average annual salaries will
be $82,000.
Page 4
The taxing districts in which the facility is located include Jefferson County, Beaumont ISD, Port of
Beaumont, Sabine ‐ Neches Navigation District, and Drainage District # 7. In addition, the facility is located
the City of Beaumont's extraterritorial jurisdiction (ETJ).
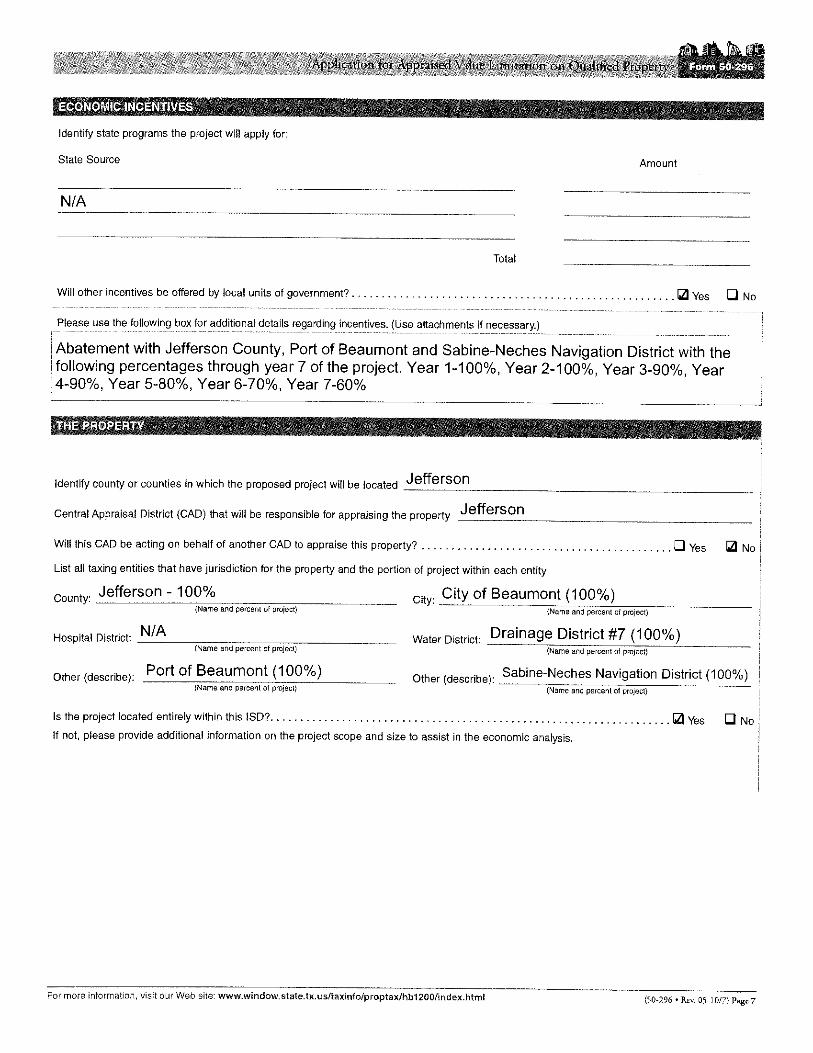
Tax Abatement Requested from the County and Other Taxing Districts
The firm will request property taxes on it qualified property from Jefferson County and from the port,
navigation and drainage districts.
Page 4
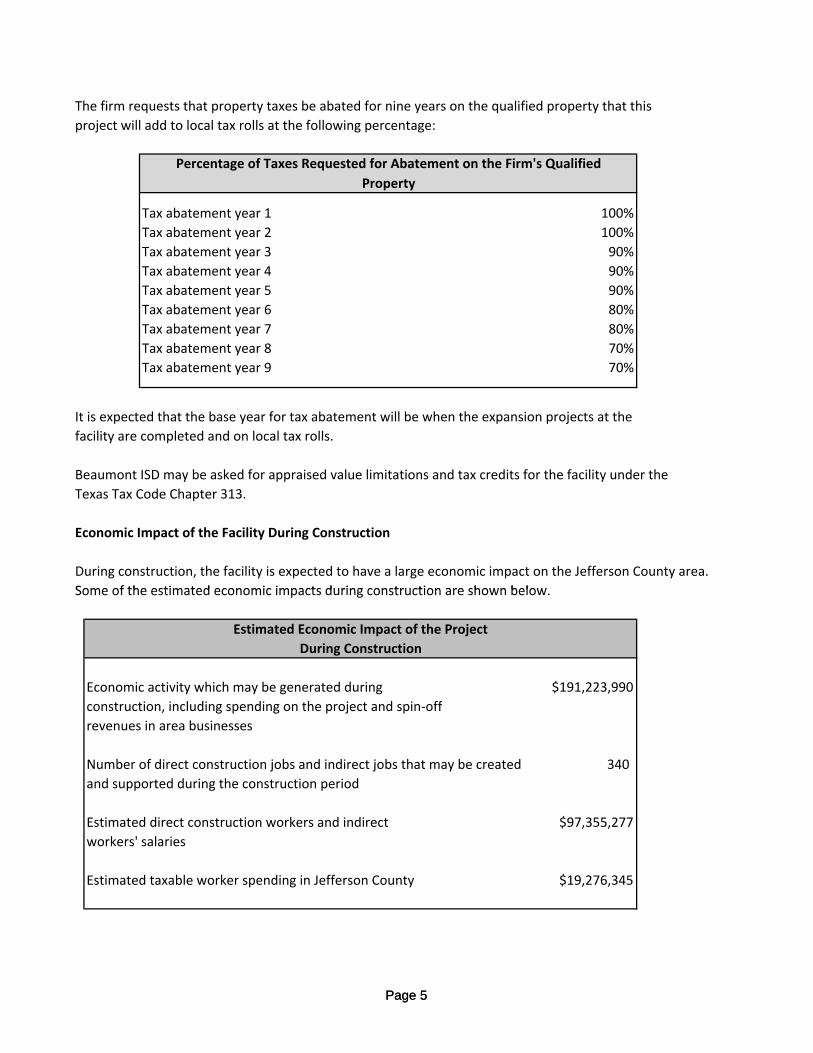
The firm requests that property taxes be abated for nine years on the qualified property that this
project will add to local tax rolls at the following percentage:
Tax abatement year 1 100%
Tax abatement year 2 100%
Tax abatement year 3 90%
Tax abatement year 4 90%
Tax abatement year 5 90%
Tax abatement year 6 80%
Tax abatement year 7 80%
Tax abatement year 8 70%
Tax abatement year 9 70%
It is expected that the base year for tax abatement will be when the expansion projects at the
facility are completed and on local tax rolls.
Beaumont ISD may be asked for appraised value limitations and tax credits for the facility under the
Texas Tax Code Chapter 313.
Economic Impact of the Facility During Construction
During construction, the facility is expected to have a large economic impact on the Jefferson County area.
Some of the estimated economic impacts during construction are shown below
Percentage of Taxes Requested for Abatement on the Firm's Qualified
Property
Page 5
Some of the estimated economic impacts during construction are shown below.
Economic activity which may be generated during
construction, including spending on the project and spin‐off
revenues in area businesses
Number of direct construction jobs and indirect jobs that may be created 340
and supported during the construction period
Estimated direct construction workers and indirect
workers' salaries
Estimated taxable worker spending in Jefferson County $19,276,345
Estimated Economic Impact of the Project
$191,223,990
$97,355,277
During Construction
Page 5
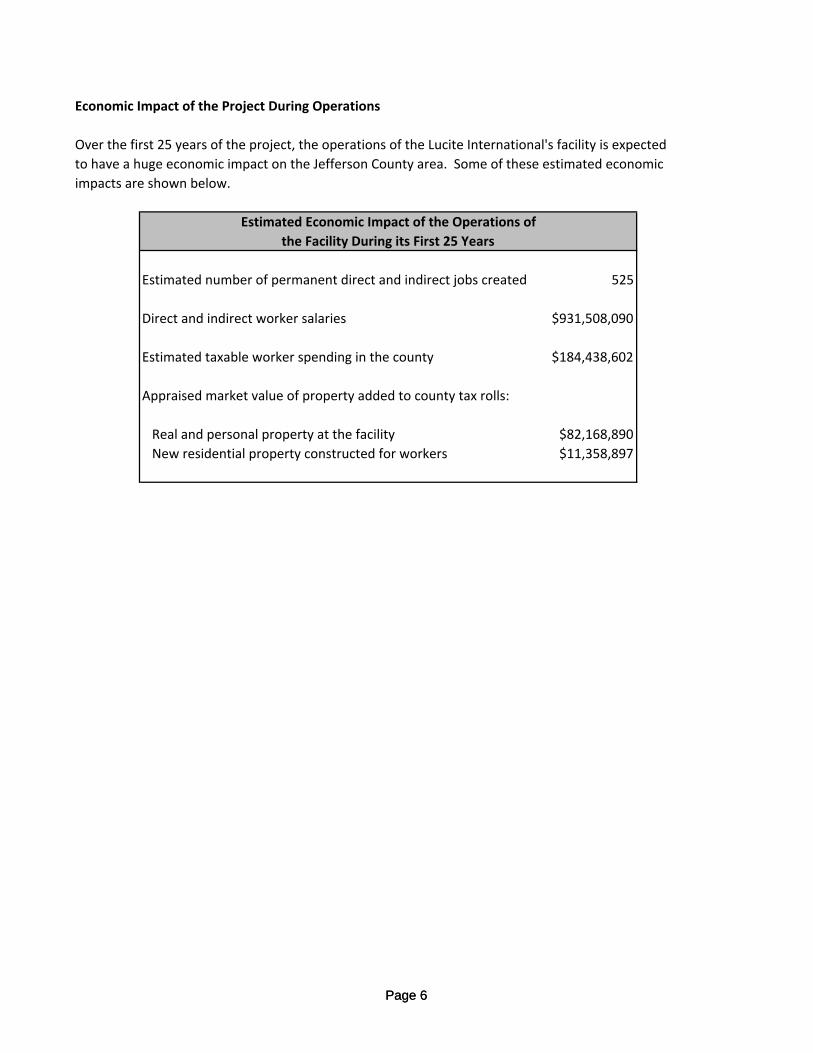
Economic Impact of the Project During Operations
Over the first 25 years of the project, the operations of the Lucite International's facility is expected
to have a huge economic impact on the Jefferson County area. Some of these estimated economic
impacts are shown below.
Estimated number of permanent direct and indirect jobs created 525
Direct and indirect worker salaries
Estimated taxable worker spending in the county $184,438,602
Appraised market value of property added to county tax rolls:
Real and personal property at the facility
New residential property constructed for workers $11,358,897
Estimated Economic Impact of the Operations of
the Facility During its First 25 Years
$82,168,890
$931,508,090
Page 6Page 6
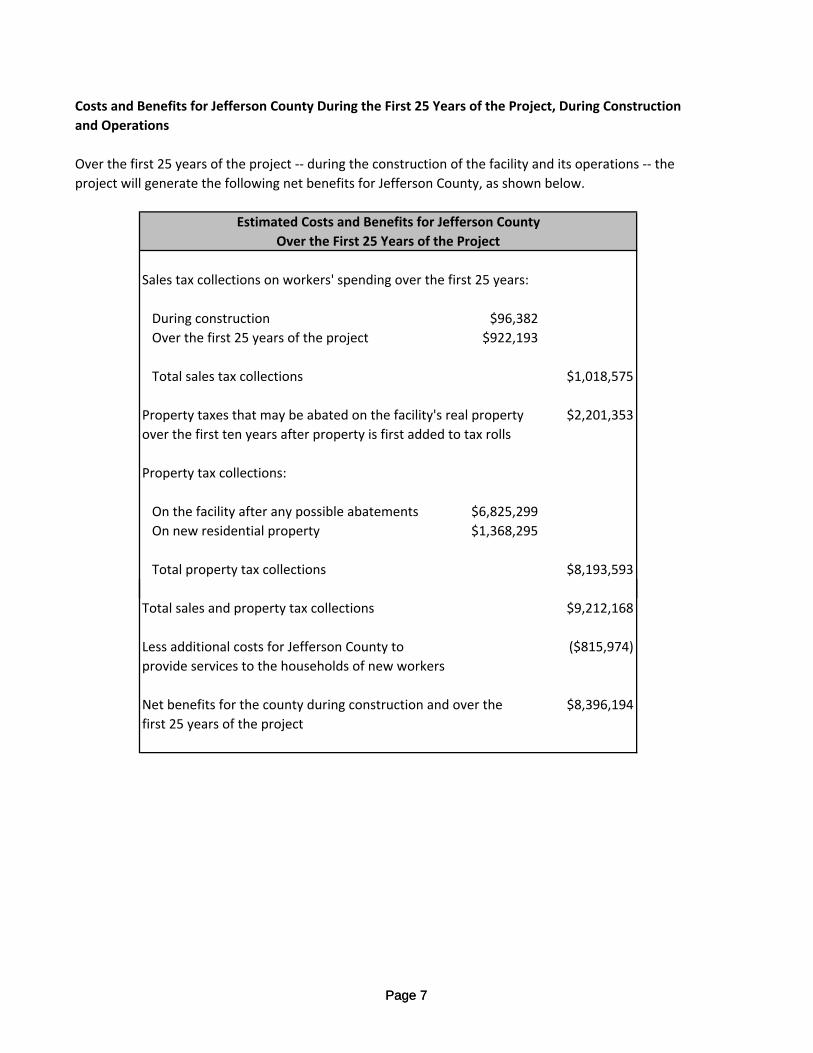
Costs and Benefits for Jefferson County During the First 25 Years of the Project, During Construction
and Operations
Over the first 25 years of the project ‐‐ during the construction of the facility and its operations ‐‐ the
project will generate the following net benefits for Jefferson County, as shown below.
Sales tax collections on workers' spending over the first 25 years:
During construction $96,382
Over the first 25 years of the project $922,193
Total sales tax collections $1,018,575
Property taxes that may be abated on the facility's real property $2,201,353
over the first ten years after property is first added to tax rolls
Property tax collections:
On the facility after any possible abatements $6,825,299
On new residential property $1,368,295
Total property tax collections $8,193,593
Estimated Costs and Benefits for Jefferson County
Over the First 25 Years of the Project
Page 7
Total sales and property tax collections $9,212,168
Less additional costs for Jefferson County to ($815,974)
provide services to the households of new workers
Net benefits for the county during construction and over the $8,396,194
first 25 years of the project
Page 7
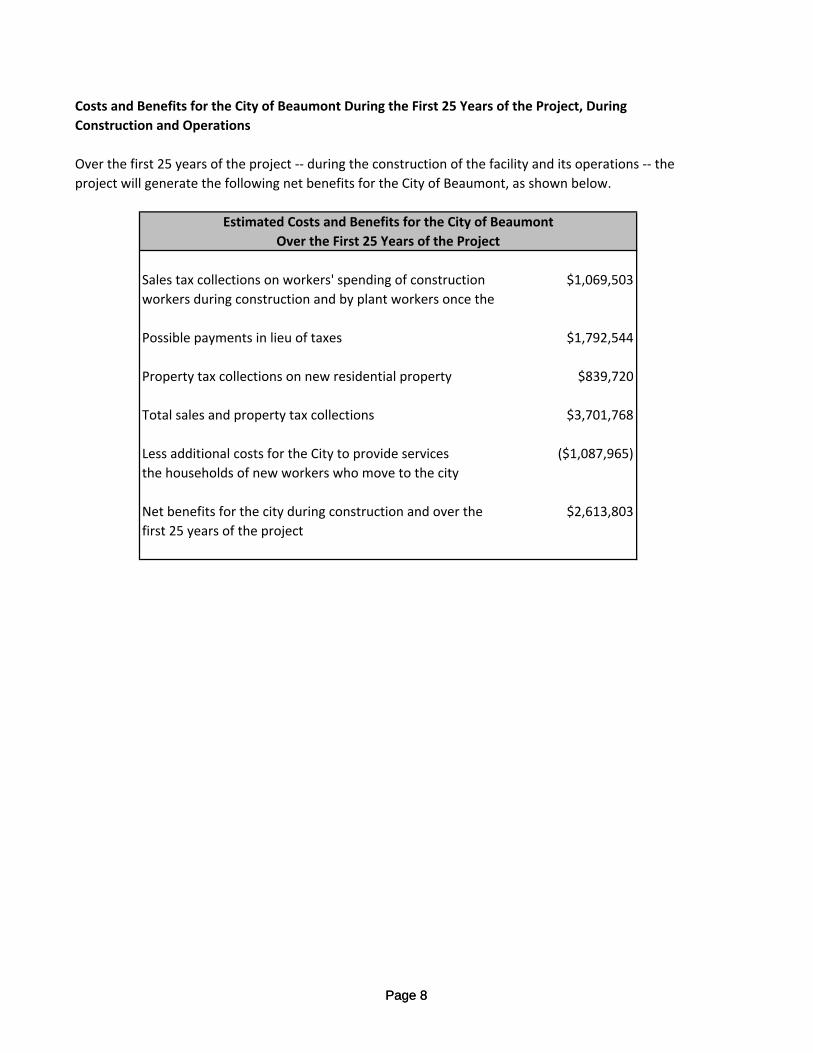
Costs and Benefits for the City of Beaumont During the First 25 Years of the Project, During
Construction and Operations
Over the first 25 years of the project ‐‐ during the construction of the facility and its operations ‐‐ the
project will generate the following net benefits for the City of Beaumont, as shown below.
Sales tax collections on workers' spending of construction $1,069,503
workers during construction and by plant workers once the
Possible payments in lieu of taxes $1,792,544
Property tax collections on new residential property $839,720
Total sales and property tax collections $3,701,768
Less additional costs for the City to provide services ($1,087,965)
the households of new workers who move to the city
Net benefits for the city during construction and over the $2,613,803
first 25 years of the project
Estimated Costs and Benefits for the City of Beaumont
Over the First 25 Years of the Project
Page 8Page 8
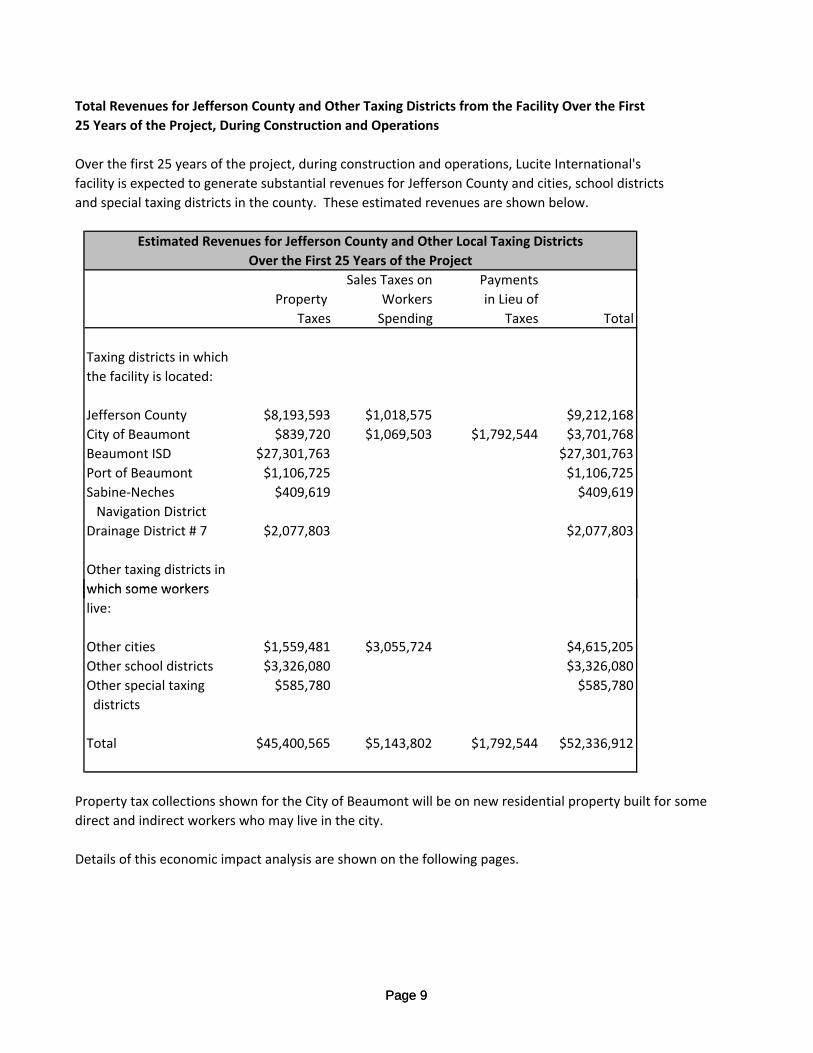
Total Revenues for Jefferson County and Other Taxing Districts from the Facility Over the First
25 Years of the Project, During Construction and Operations
Over the first 25 years of the project, during construction and operations, Lucite International's
facility is expected to generate substantial revenues for Jefferson County and cities, school districts
and special taxing districts in the county. These estimated revenues are shown below.
Sales Taxes on Payments
Property Workers in Lieu of
Taxes Spending Taxes Total
Taxing districts in which
the facility is located:
Jefferson County $8,193,593 $1,018,575 $9,212,168
City of Beaumont $839,720 $1,069,503 $1,792,544 $3,701,768
Beaumont ISD $27,301,763 $27,301,763
Port of Beaumont $1,106,725 $1,106,725
Sabine‐Neches $409,619 $409,619
Navigation District
Drainage District # 7 $2,077,803 $2,077,803
Other taxing districts in
which some workers
Estimated Revenues for Jefferson County and Other Local Taxing Districts
Over the First 25 Years of the Project
Page 9
which some workers
live:
Other cities $1,559,481 $3,055,724 $4,615,205
Other school districts $3,326,080 $3,326,080
Other special taxing $585,780 $585,780
districts
Total $45,400,565 $5,143,802 $1,792,544 $52,336,912
Property tax collections shown for the City of Beaumont will be on new residential property built for some
direct and indirect workers who may live in the city.
Details of this economic impact analysis are shown on the following pages.
Page 9
Introduction
This report presents the results of an economic impact analysis performed by Impact DataSource, an
Austin, Texas economic research firm. The purpose of this analysis was to estimate the impact that the
restart and expansion of Lucite International's plant in Beaumont, Texas will have on the economy
of Jefferson County over the first 25 years of the project, during its construction and operations. In
addition, costs and benefits for the county were estimated along with revenues for cities, school districts and
special taxing districts in the county over the same period.
Projections of this Study are Estimates
Projections, targets, and expectations in this report are estimates. Actual results, including project scope,
timing, costs, jobs, construction plans, potential tax and other payments and any other forecasted
economic benefits may be different.
Study of Impacts Over Twenty‐Five Years
This study projects the economic impact over a 25 year period ‐‐ during construction and operations of the
the project. The projected and productive life of the project is longer than ten years of productive life
required for eligible property under the Jefferson County Uniform Tax Abatement Policy ‐ 2009.
The Full Report
Page 10
q g p p y y y
Property Taxes and Estimated Property Tax Abatement Calculated
Lucite International's plant located near Beaumont, Texas in the city's ETJ. The facility is in
Jefferson County, Beaumont ISD, the Port of Beaumont, Sabine‐Neches Navigation District and
Drainage District # 7.
This analysis calculates property taxes that will be paid and may be abated by Jefferson County and
along with similar possible abatements that may be requested from the port, navigation and drainage
districts.
Page 10
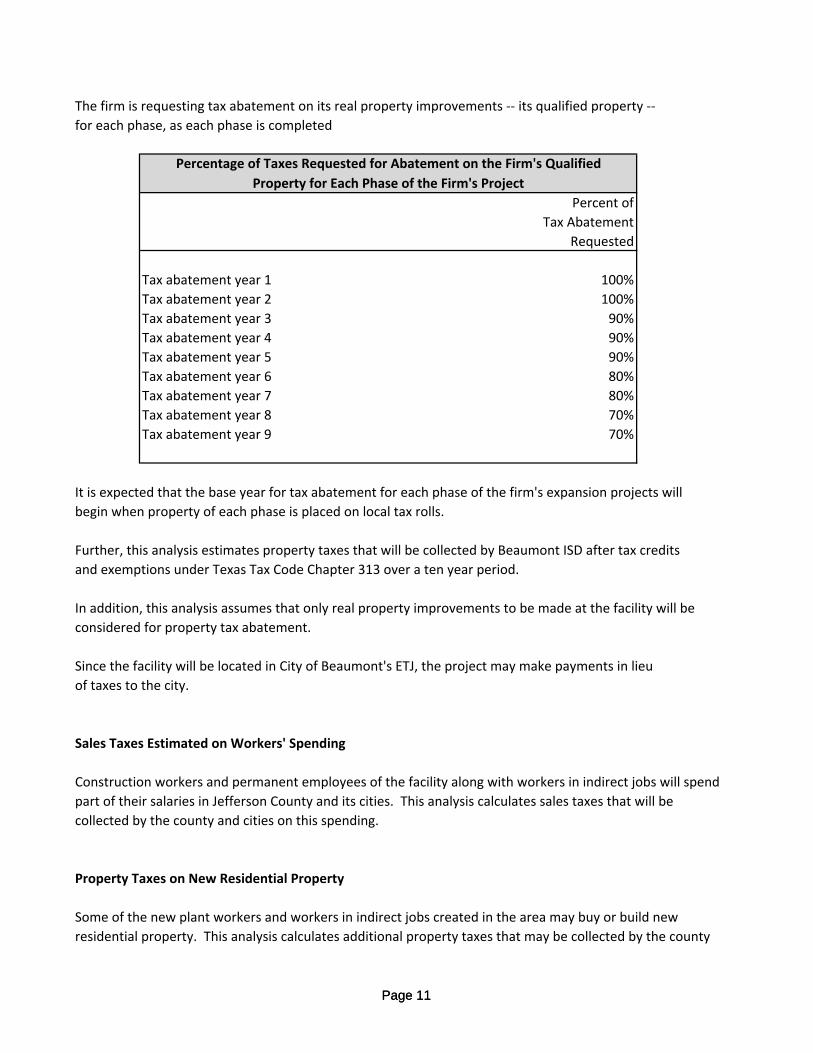
The firm is requesting tax abatement on its real property improvements ‐‐ its qualified property ‐‐
for each phase, as each phase is completed
Percent of
Tax Abatement
Requested
Tax abatement year 1 100%
Tax abatement year 2 100%
Tax abatement year 3 90%
Tax abatement year 4 90%
Tax abatement year 5 90%
Tax abatement year 6 80%
Tax abatement year 7 80%
Tax abatement year 8 70%
Tax abatement year 9 70%
It is expected that the base year for tax abatement for each phase of the firm's expansion projects will
begin when property of each phase is placed on local tax rolls.
Further, this analysis estimates property taxes that will be collected by Beaumont ISD after tax credits
and exemptions under Texas Tax Code Chapter 313 over a ten year period.
Percentage of Taxes Requested for Abatement on the Firm's Qualified
Property for Each Phase of the Firm's Project
Page 11
In addition, this analysis assumes that only real property improvements to be made at the facility will be
considered for property tax abatement.
Since the facility will be located in City of Beaumont's ETJ, the project may make payments in lieu
of taxes to the city.
Sales Taxes Estimated on Workers' Spending
Construction workers and permanent employees of the facility along with workers in indirect jobs will spend
part of their salaries in Jefferson County and its cities. This analysis calculates sales taxes that will be
collected by the county and cities on this spending.
Property Taxes on New Residential Property
Some of the new plant workers and workers in indirect jobs created in the area may buy or build new
residential property. This analysis calculates additional property taxes that may be collected by the county
Page 11
and other local taxing districts on this new residential property.
Description of the Project
Lucite International’s Project Rebound for the restart of operations and expansion of the chemical
operations located at 6350 North Twin City Highway in Nederland, Texas will begin in 2011. Initially,
the project will entail clean‐up, maintenance and turnaround of the 1st and 2nd trains of the existing
methyl methacrylate (MMA) plant. No real property improvements will be associated with the
turnaround and restart of MMA production.
If approved, a hydrogen cyanide (HCN) synthesis plant and an ammonia recovery system for the HCN
plant will be constructed in 2011 with a projected 2012 start‐up. If approved, a methacrylic acid (MAA)
plant may be constructed with a projected start‐up in the fourth quarter of 2012. If approved, an HMA
(higher monomers production) plant may be constructed in 2013 and will be projected to be completed
for operation beginning in 2014.
Lucite International will spend an estimated $97.2 million on restarting and expansion of its plant ‐‐
about $84 million of which will be added to local tax rolls.
Overall, the project is expected to take about 48 months to complete.
Once expanded, the facility will employ 105 permanent workers whose average annual salaries will
be $82,000.
Page 12
Types of Economic Impacts that the Project May Provide
Jefferson County can expect substantial economic benefits from project.
Economic benefits were projected in this analysis from the following activities:
• The development and construction of the facility,
• The operations of the facility, and
• Spending by the facility's workers and workers in spin‐off jobs created in the area.
The economic impacts that may be expected from the project include the following:
• Spending by the facility and revenues for area businesses,
• New jobs,
• Additional worker salaries or personal income,
• New homes to be constructed
• Additional taxable sales in area businesses, and
• Property at the facility that may be added to local tax rolls.
Page 12
These economic impacts may be characterized as direct, indirect and induced.
The direct economic impact will be from the construction and operations of the facility and its
employees. From the spending by the facility and its employees, indirect and induced benefits or spin‐off
benefits will be created. Indirect sales, jobs and salaries will be created in new or existing local businesses
and organizations, such as construction companies, parts and equipment suppliers, motels, and other
businesses that supply goods and services to the facility during construction and during the facility's
operations.
In addition, induced sales, jobs and salaries will be created in new or existing area businesses or
organizations, such as restaurants, gas stations, banks, book stores, grocery stores, apartment complexes,
convenience stores, service companies, etc. that supply goods and services to employees of the facility and
their families and, in turn, to workers in indirect jobs and their families.
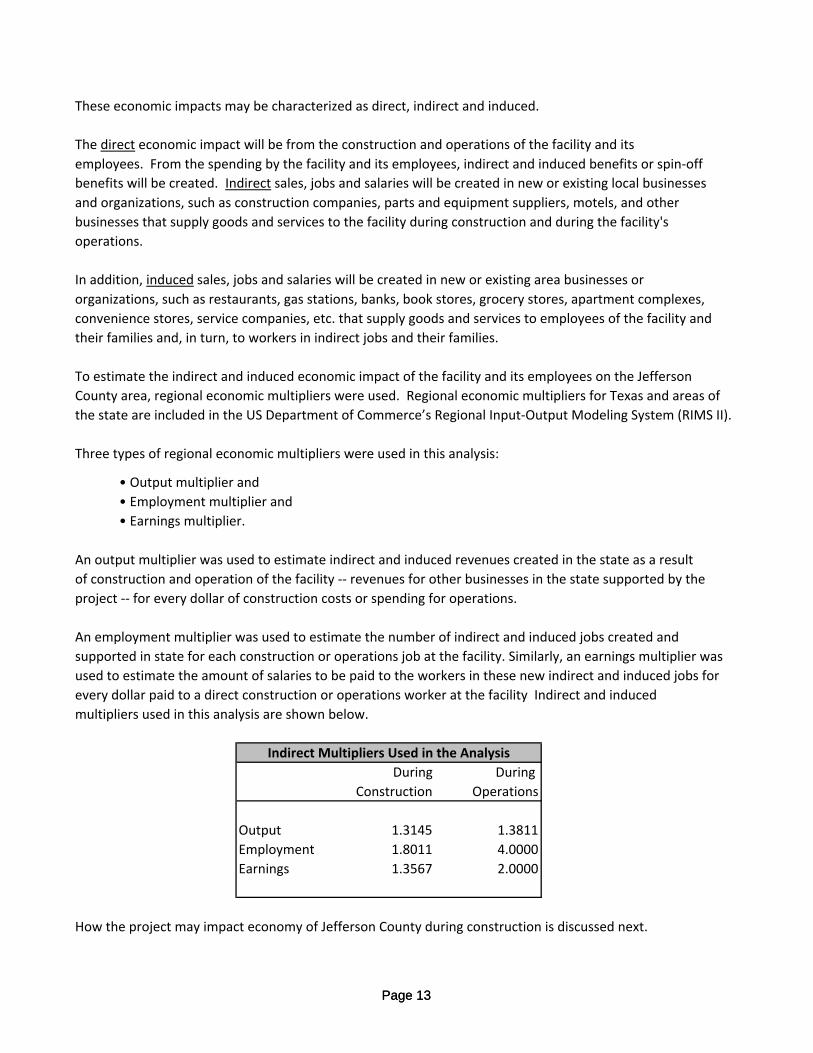
To estimate the indirect and induced economic impact of the facility and its employees on the Jefferson
County area, regional economic multipliers were used. Regional economic multipliers for Texas and areas of
the state are included in the US Department of Commerce’s Regional Input‐Output Modeling System (RIMS II).
Three types of regional economic multipliers were used in this analysis:
• Output multiplier and
• Employment multiplier and
• Earnings multiplier.
An output multiplier was used to estimate indirect and induced revenues created in the state as a result
of construction and operation of the facility ‐‐ revenues for other businesses in the state supported by the
Page 13
project ‐‐ for every dollar of construction costs or spending for operations.
An employment multiplier was used to estimate the number of indirect and induced jobs created and
supported in state for each construction or operations job at the facility. Similarly, an earnings multiplier was
used to estimate the amount of salaries to be paid to the workers in these new indirect and induced jobs for
every dollar paid to a direct construction or operations worker at the facility Indirect and induced
multipliers used in this analysis are shown below.
During During
Construction Operations
Output 1.3145 1.3811
Employment 1.8011 4.0000
Earnings 1.3567 2.0000
How the project may impact economy of Jefferson County during construction is discussed next.
Indirect Multipliers Used in the Analysis
Page 13
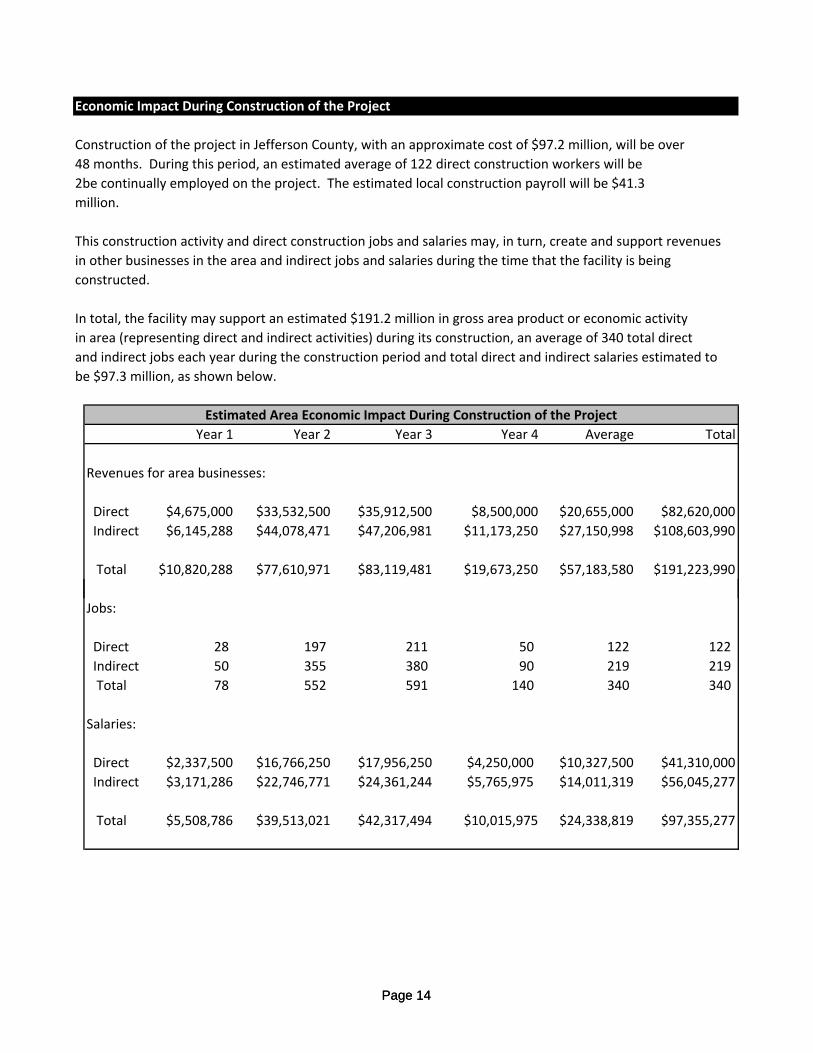
Economic Impact During Construction of the Project
Construction of the project in Jefferson County, with an approximate cost of $97.2 million, will be over
48 months. During this period, an estimated average of 122 direct construction workers will be
2be continually employed on the project. The estimated local construction payroll will be $41.3
million.
This construction activity and direct construction jobs and salaries may, in turn, create and support revenues
in other businesses in the area and indirect jobs and salaries during the time that the facility is being
constructed.
In total, the facility may support an estimated $191.2 million in gross area product or economic activity
in area (representing direct and indirect activities) during its construction, an average of 340 total direct
and indirect jobs each year during the construction period and total direct and indirect salaries estimated to
be $97.3 million, as shown below.
Year 1 Year 2 Year 3 Year 4 Average Total
Revenues for area businesses:
Direct $4,675,000 $33,532,500 $35,912,500 $8,500,000 $20,655,000 $82,620,000
Indirect $6,145,288 $44,078,471 $47,206,981 $11,173,250 $27,150,998 $108,603,990
Total $10,820,288 $77,610,971 $83,119,481 $19,673,250 $57,183,580 $191,223,990
Estimated Area Economic Impact During Construction of the Project
Page 14
Jobs:
Direct 28 197 211 50 122 122
Indirect 50 355 380 90 219 219
Total 78 552 591 140 340 340
Salaries:
Direct $2,337,500 $16,766,250 $17,956,250 $4,250,000 $10,327,500 $41,310,000
Indirect $3,171,286 $22,746,771 $24,361,244 $5,765,975 $14,011,319 $56,045,277
Total $5,508,786 $39,513,021 $42,317,494 $10,015,975 $24,338,819 $97,355,277
Page 14
In addition, estimated spending by workers in Jefferson County during construction of the facility on which
sales taxes may be collected is shown below:
In Jefferson County $19,276,345
Schedules showing the economic impact of the facility during construction are on Appendix A.
Economic Impact of the Operations of the Facility
The facility is expected to restart operations in 2011 and the expanded plant will begin full operations
in 2014.
An estimated 105 workers will be employed when the expanded facility is fully operational. The average
annual salaries of these workers will be $82,000.
Over the first 25 years of its operations, the facility is expected to generate $23.2 billion in estimated
revenues for area businesses including the facility, 300 estimated direct and indirect jobs and
estimated salaries of $566 million. In addition, the facility is expected to add real property with a value of
$880 million to local tax rolls. Further, an estimated $8.1 million in new residential property is expected be
added to tax rolls by new direct and indirect workers.
Estimated Taxable Worker Spending
During Construction of the Project
Page 15
Plus, workers in these new jobs are expected to generate estimated taxable sales of $101 million in the
county. This estimated economic impact over the first 25 years the project is shown on the following page.
Page 15
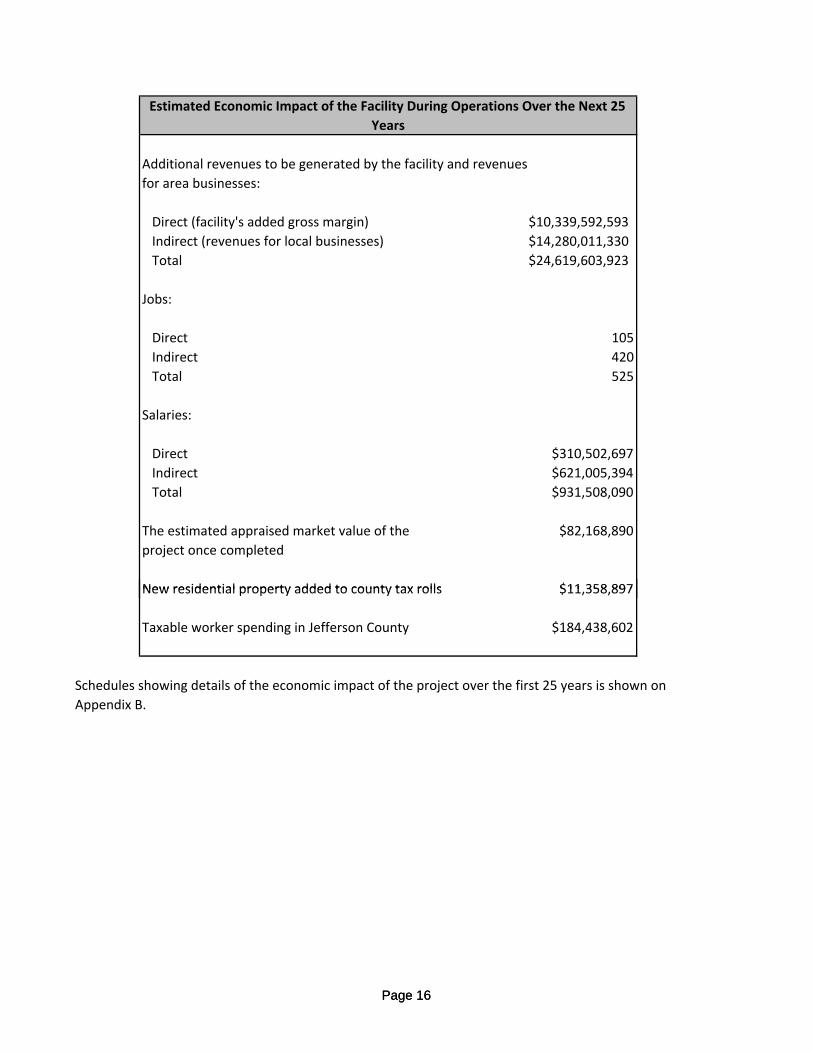
Additional revenues to be generated by the facility and revenues
for area businesses:
Direct (facility's added gross margin)
Indirect (revenues for local businesses)
Total
Jobs:
Direct 105
Indirect 420
Total 525
Salaries:
Direct $310,502,697
Indirect $621,005,394
Total $931,508,090
The estimated appraised market value of the $82,168,890
project once completed
New residential property added to county tax rolls $11 358 897
$14,280,011,330
$24,619,603,923
$10,339,592,593
Estimated Economic Impact of the Facility During Operations Over the Next 25
Years
Page 16
New residential property added to county tax rolls $11,358,897
Taxable worker spending in Jefferson County $184,438,602
Schedules showing details of the economic impact of the project over the first 25 years is shown on
Appendix B.
Page 16
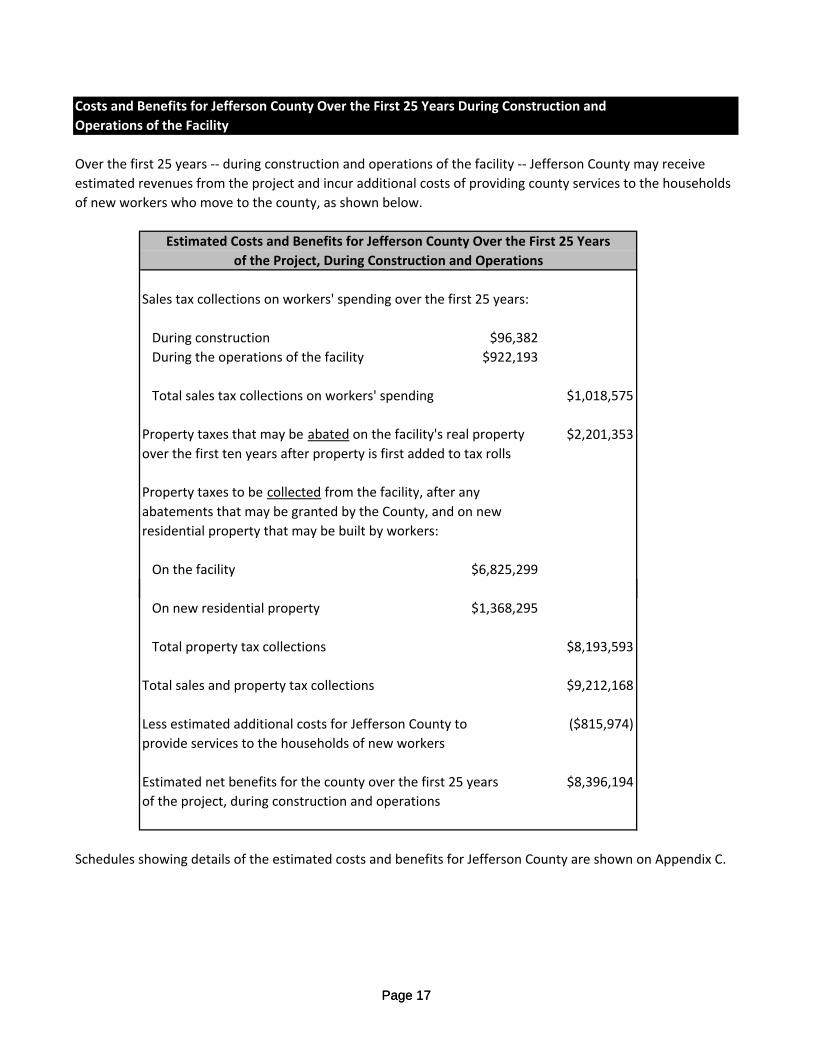
Costs and Benefits for Jefferson County Over the First 25 Years During Construction and
Operations of the Facility
Over the first 25 years ‐‐ during construction and operations of the facility ‐‐ Jefferson County may receive
estimated revenues from the project and incur additional costs of providing county services to the households
of new workers who move to the county, as shown below.
Sales tax collections on workers' spending over the first 25 years:
During construction $96,382
During the operations of the facility $922,193
Total sales tax collections on workers' spending $1,018,575
Property taxes that may be abated on the facility's real property $2,201,353
over the first ten years after property is first added to tax rolls
Property taxes to be collected from the facility, after any
abatements that may be granted by the County, and on new
residential property that may be built by workers:
On the facility $6,825,299
Estimated Costs and Benefits for Jefferson County Over the First 25 Years
of the Project, During Construction and Operations
Page 17
On new residential property $1,368,295
Total property tax collections $8,193,593
Total sales and property tax collections $9,212,168
Less estimated additional costs for Jefferson County to ($815,974)
provide services to the households of new workers
Estimated net benefits for the county over the first 25 years $8,396,194
of the project, during construction and operations
Schedules showing details of the estimated costs and benefits for Jefferson County are shown on Appendix C.
Page 17
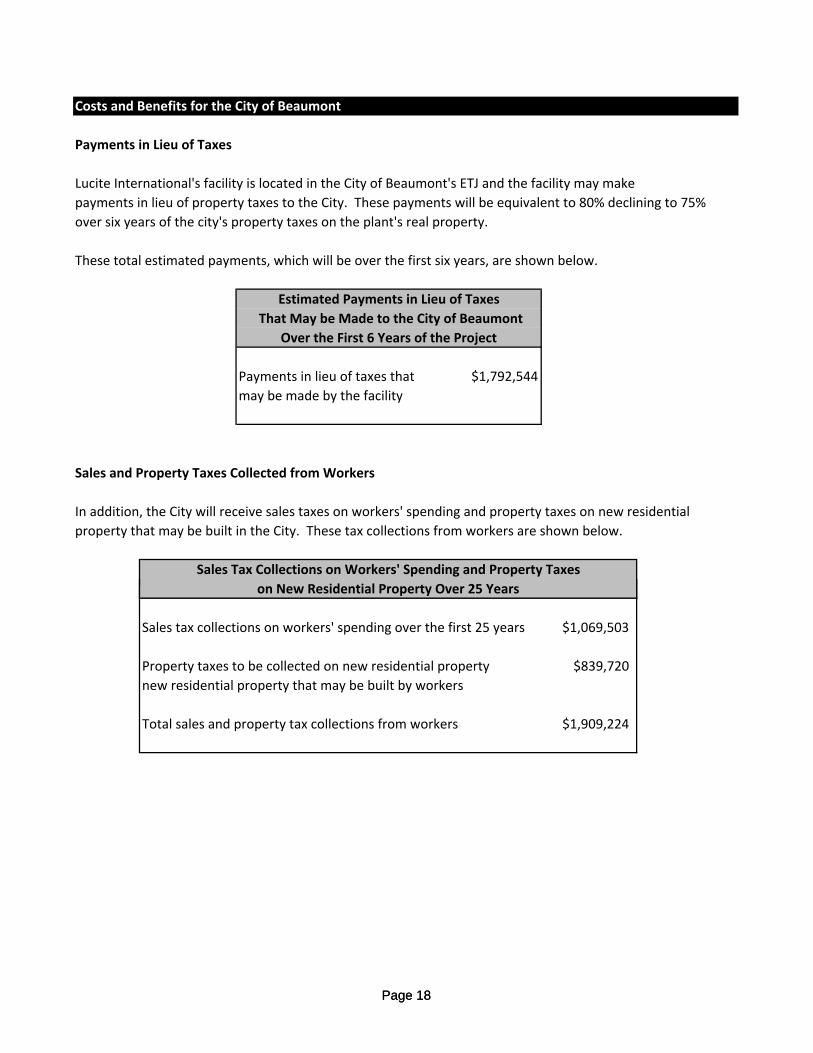
Costs and Benefits for the City of Beaumont
Payments in Lieu of Taxes
Lucite International's facility is located in the City of Beaumont's ETJ and the facility may make
payments in lieu of property taxes to the City. These payments will be equivalent to 80% declining to 75%
over six years of the city's property taxes on the plant's real property.
These total estimated payments, which will be over the first six years, are shown below.
Payments in lieu of taxes that $1,792,544
may be made by the facility
Sales and Property Taxes Collected from Workers
In addition, the City will receive sales taxes on workers' spending and property taxes on new residential
property that may be built in the City. These tax collections from workers are shown below.
Estimated Payments in Lieu of Taxes
Sales Tax Collections on Workers' Spending and Property Taxes
on New Residential Property Over 25 Years
That May be Made to the City of Beaumont
Over the First 6 Years of the Project
Page 18
Sales tax collections on workers' spending over the first 25 years $1,069,503
Property taxes to be collected on new residential property $839,720
new residential property that may be built by workers
Total sales and property tax collections from workers $1,909,224
on New Residential Property Over 25 Years
Page 18
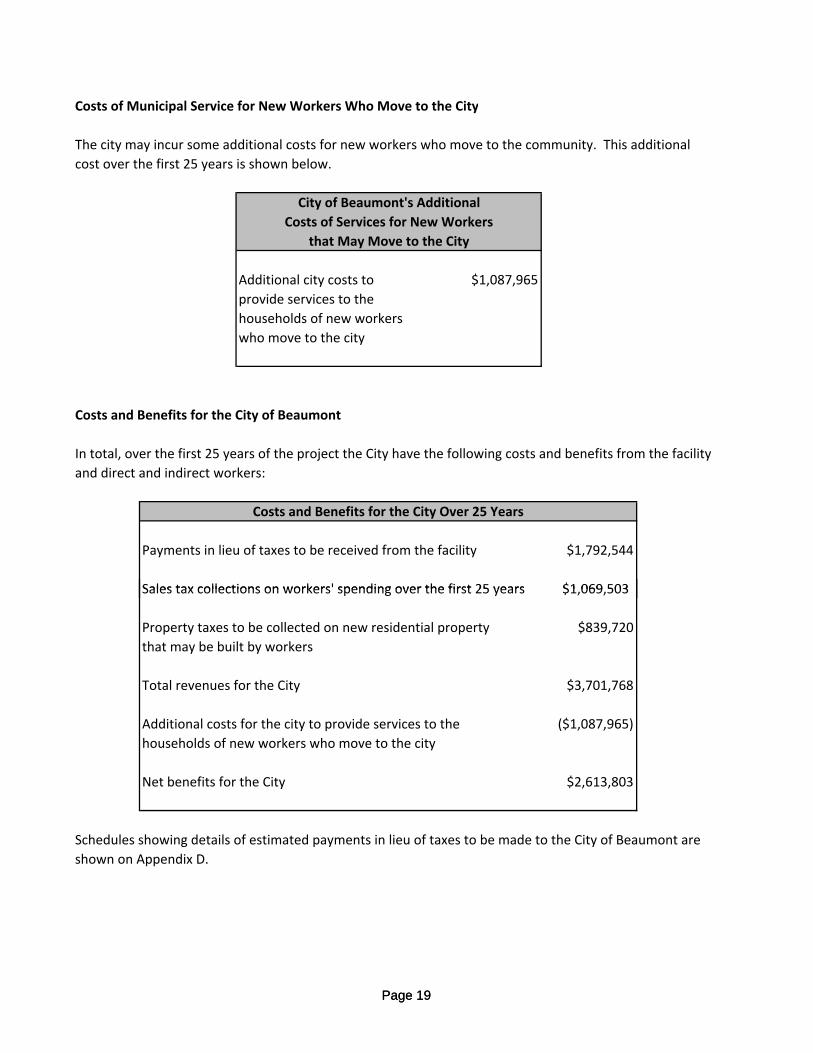
Costs of Municipal Service for New Workers Who Move to the City
The city may incur some additional costs for new workers who move to the community. This additional
cost over the first 25 years is shown below.
Additional city costs to $1,087,965
provide services to the
households of new workers
who move to the city
Costs and Benefits for the City of Beaumont
In total, over the first 25 years of the project the City have the following costs and benefits from the facility
and direct and indirect workers:
Payments in lieu of taxes to be received from the facility $1,792,544
Sales tax collections on workers' spending over the first 25 years $1 069 503
Costs and Benefits for the City Over 25 Years
City of Beaumont's Additional
Costs of Services for New Workers
that May Move to the City
Page 19
Sales tax collections on workers' spending over the first 25 years $1,069,503
Property taxes to be collected on new residential property $839,720
that may be built by workers
Total revenues for the City $3,701,768
Additional costs for the city to provide services to the ($1,087,965)
households of new workers who move to the city
Net benefits for the City $2,613,803
Schedules showing details of estimated payments in lieu of taxes to be made to the City of Beaumont are
shown on Appendix D.
Page 19
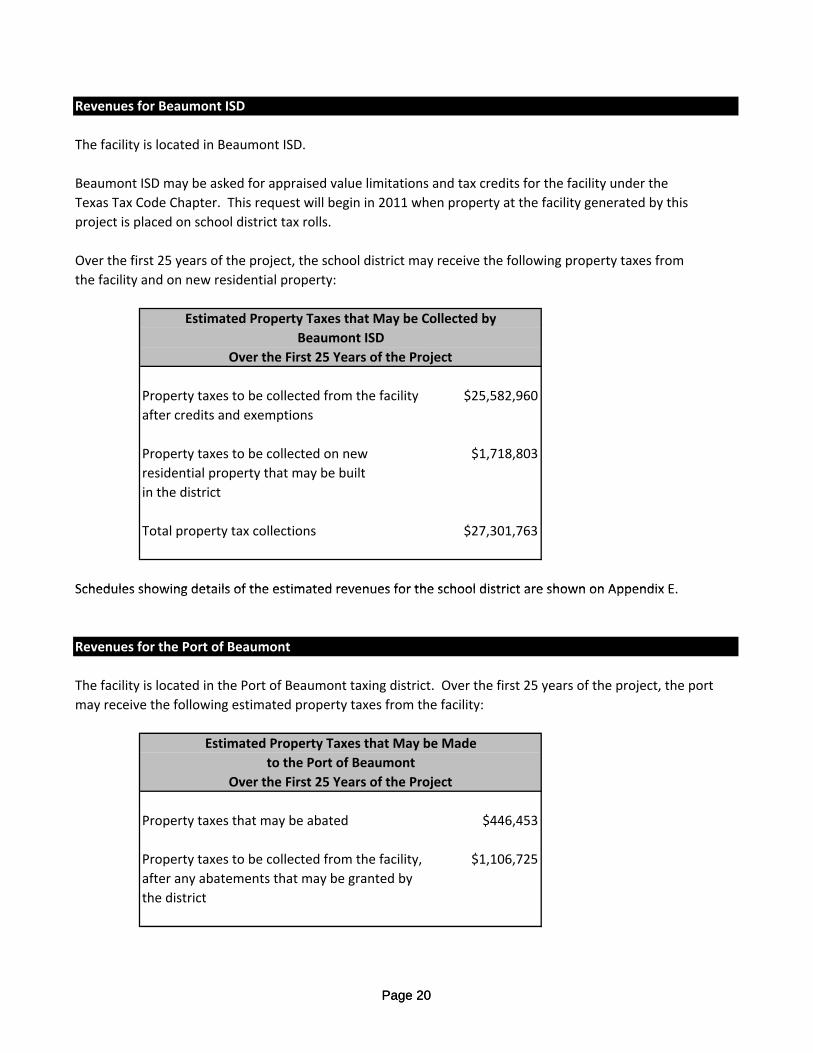
Revenues for Beaumont ISD
The facility is located in Beaumont ISD.
Beaumont ISD may be asked for appraised value limitations and tax credits for the facility under the
Texas Tax Code Chapter. This request will begin in 2011 when property at the facility generated by this
project is placed on school district tax rolls.
Over the first 25 years of the project, the school district may receive the following property taxes from
the facility and on new residential property:
Property taxes to be collected from the facility $25,582,960
after credits and exemptions
Property taxes to be collected on new $1,718,803
residential property that may be built
in the district
Total property tax collections $27,301,763
Schedules showing details of the estimated revenues for the school district are shown on Appendix E
Beaumont ISD
Over the First 25 Years of the Project
Estimated Property Taxes that May be Collected by
Page 20
Schedules showing details of the estimated revenues for the school district are shown on Appendix E.
Revenues for the Port of Beaumont
The facility is located in the Port of Beaumont taxing district. Over the first 25 years of the project, the port
may receive the following estimated property taxes from the facility:
Property taxes that may be abated $446,453
Property taxes to be collected from the facility, $1,106,725
after any abatements that may be granted by
the district
Estimated Property Taxes that May be Made
to the Port of Beaumont
Over the First 25 Years of the Project
Page 20
Schedules showing details of the estimated revenues for the port are shown on Appendix F.
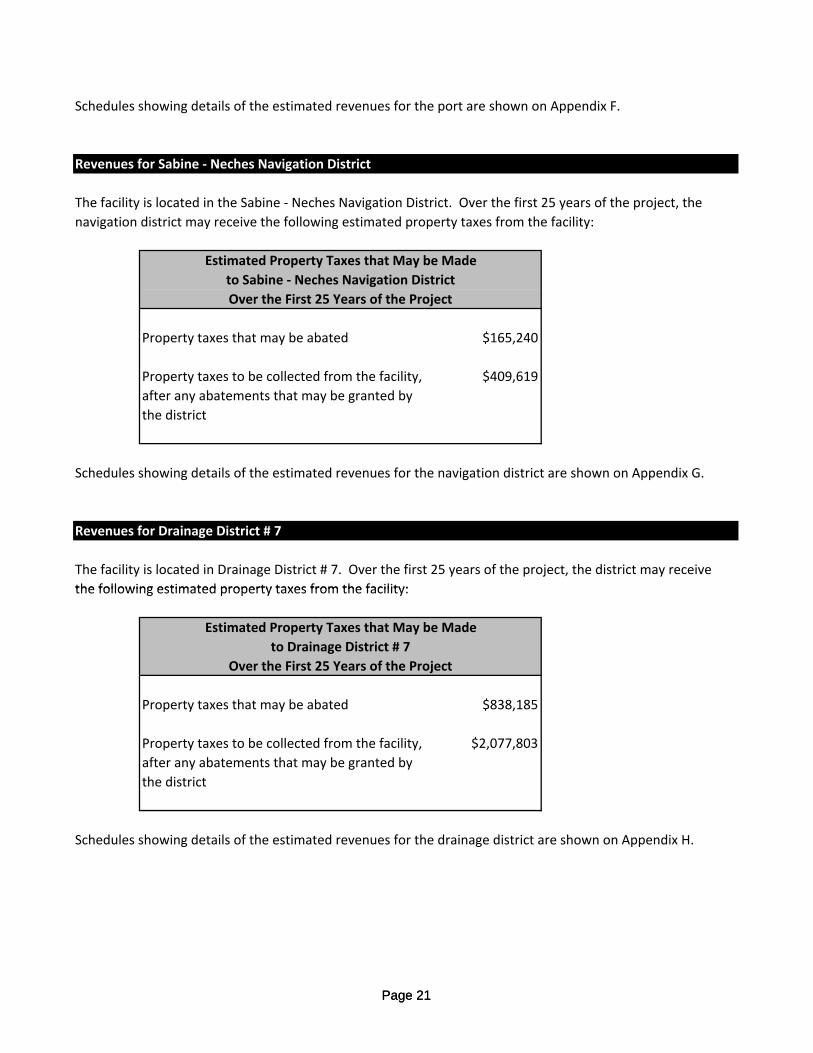
Revenues for Sabine ‐ Neches Navigation District
The facility is located in the Sabine ‐ Neches Navigation District. Over the first 25 years of the project, the
navigation district may receive the following estimated property taxes from the facility:
Property taxes that may be abated $165,240
Property taxes to be collected from the facility, $409,619
after any abatements that may be granted by
the district
Schedules showing details of the estimated revenues for the navigation district are shown on Appendix G.
Revenues for Drainage District # 7
The facility is located in Drainage District # 7. Over the first 25 years of the project, the district may receive
the following estimated property taxes from the facility:
to Sabine ‐ Neches Navigation District
Estimated Property Taxes that May be Made
Over the First 25 Years of the Project
Page 21
the following estimated property taxes from the facility:
Property taxes that may be abated $838,185
Property taxes to be collected from the facility, $2,077,803
after any abatements that may be granted by
the district
Schedules showing details of the estimated revenues for the drainage district are shown on Appendix H.
to Drainage District # 7
Estimated Property Taxes that May be Made
Over the First 25 Years of the Project
Page 21
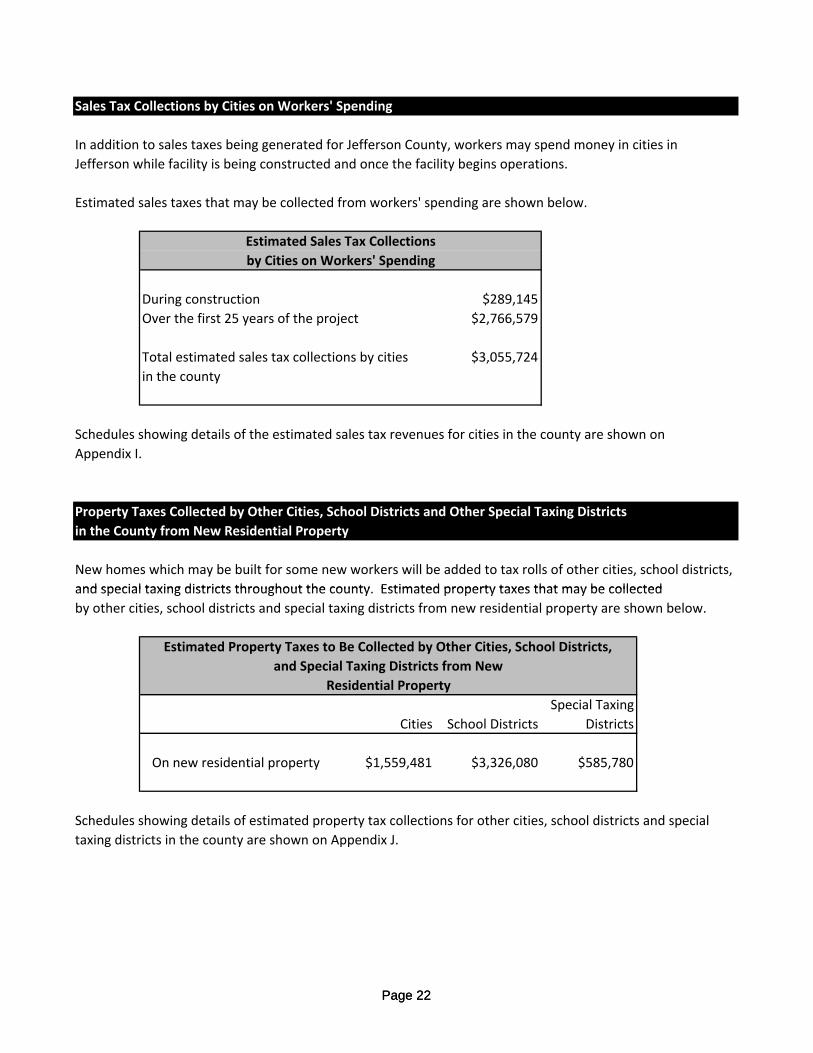
Sales Tax Collections by Cities on Workers' Spending
In addition to sales taxes being generated for Jefferson County, workers may spend money in cities in
Jefferson while facility is being constructed and once the facility begins operations.
Estimated sales taxes that may be collected from workers' spending are shown below.
During construction $289,145
Over the first 25 years of the project $2,766,579
Total estimated sales tax collections by cities $3,055,724
in the county
Schedules showing details of the estimated sales tax revenues for cities in the county are shown on
Appendix I.
Property Taxes Collected by Other Cities, School Districts and Other Special Taxing Districts
in the County from New Residential Property
New homes which may be built for some new workers will be added to tax rolls of other cities, school districts,
and special taxing districts throughout the county Estimated property taxes that may be collected
by Cities on Workers' Spending
Estimated Sales Tax Collections
Page 22
and special taxing districts throughout the county. Estimated property taxes that may be collected
by other cities, school districts and special taxing districts from new residential property are shown below.
Special Taxing
Cities School Districts Districts
On new residential property $1,559,481 $3,326,080 $585,780
Schedules showing details of estimated property tax collections for other cities, school districts and special
taxing districts in the county are shown on Appendix J.
Estimated Property Taxes to Be Collected by Other Cities, School Districts,
and Special Taxing Districts from New
Residential Property
Page 22
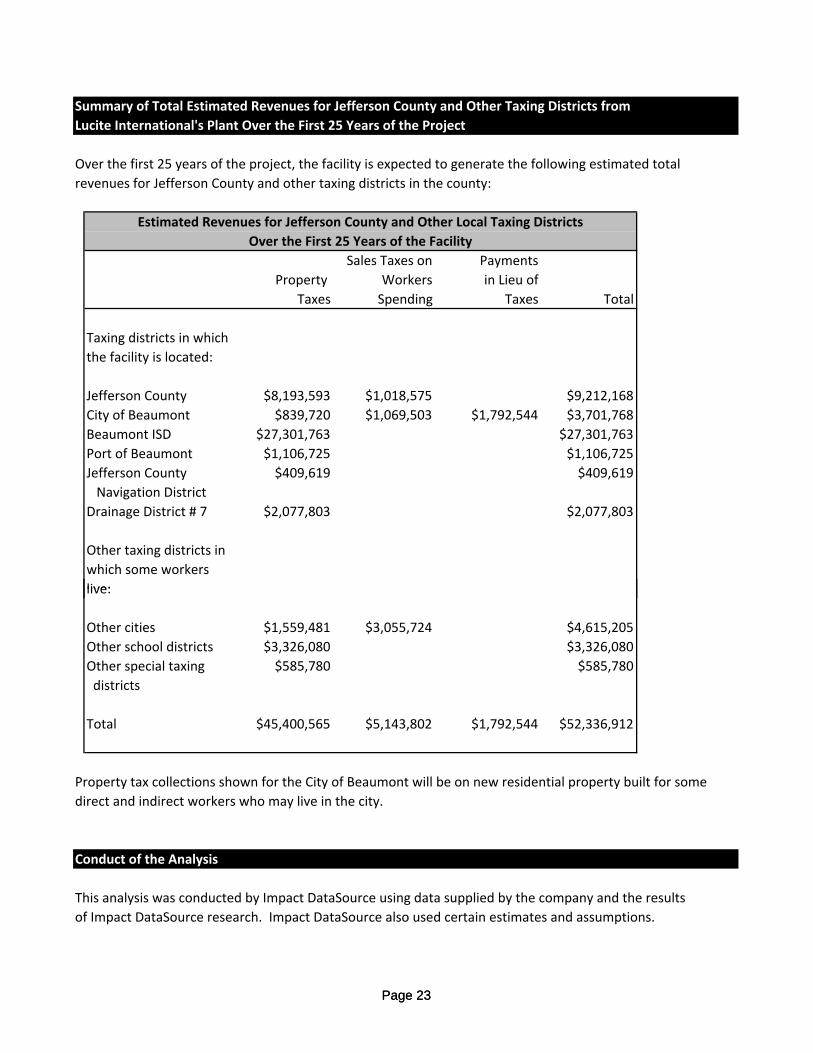
Summary of Total Estimated Revenues for Jefferson County and Other Taxing Districts from
Lucite International's Plant Over the First 25 Years of the Project
Over the first 25 years of the project, the facility is expected to generate the following estimated total
revenues for Jefferson County and other taxing districts in the county:
Sales Taxes on Payments
Property Workers in Lieu of
Taxes Spending Taxes Total
Taxing districts in which
the facility is located:
Jefferson County $8,193,593 $1,018,575 $9,212,168
City of Beaumont $839,720 $1,069,503 $1,792,544 $3,701,768
Beaumont ISD $27,301,763 $27,301,763
Port of Beaumont $1,106,725 $1,106,725
Jefferson County $409,619 $409,619
Navigation District
Drainage District # 7 $2,077,803 $2,077,803
Other taxing districts in
which some workers
live:
Estimated Revenues for Jefferson County and Other Local Taxing Districts
Over the First 25 Years of the Facility
Page 23
live:
Other cities $1,559,481 $3,055,724 $4,615,205
Other school districts $3,326,080 $3,326,080
Other special taxing $585,780 $585,780
districts
Total $45,400,565 $5,143,802 $1,792,544 $52,336,912
Property tax collections shown for the City of Beaumont will be on new residential property built for some
direct and indirect workers who may live in the city.
Conduct of the Analysis
This analysis was conducted by Impact DataSource using data supplied by the company and the results
of Impact DataSource research. Impact DataSource also used certain estimates and assumptions.
Page 23
Using this data, the economic impact from the facility over the first 25 years ‐‐ during construction and
operations of the project were estimated. In addition, costs and benefits for Jefferson County were
estimated during this period, along with estimated revenues for other local taxing districts.
About Impact DataSource
Impact DataSource is a seventeen‐year‐old Austin, Texas economic consulting, research and analysis firm.
The firm has conducted economic impact analyses of numerous projects Texas and 25 other states.
In addition, the firm has also developed economic impact analysis computer programs for several clients,
including the New Mexico Economic Development Department.
The firm’s principal, Jerry Walker, performed this economic impact analysis. He is an economist and has
Bachelor of Science and Master of Business Administration degrees in accounting and economics from
Nicholls State University, Thibodaux, Louisiana.
Schedules showing the results of calculations used in this analysis are on the following pages.
Page 24Page 24
Appendix AEconomic Impacts During Construction of the Project
Page 25Page 25
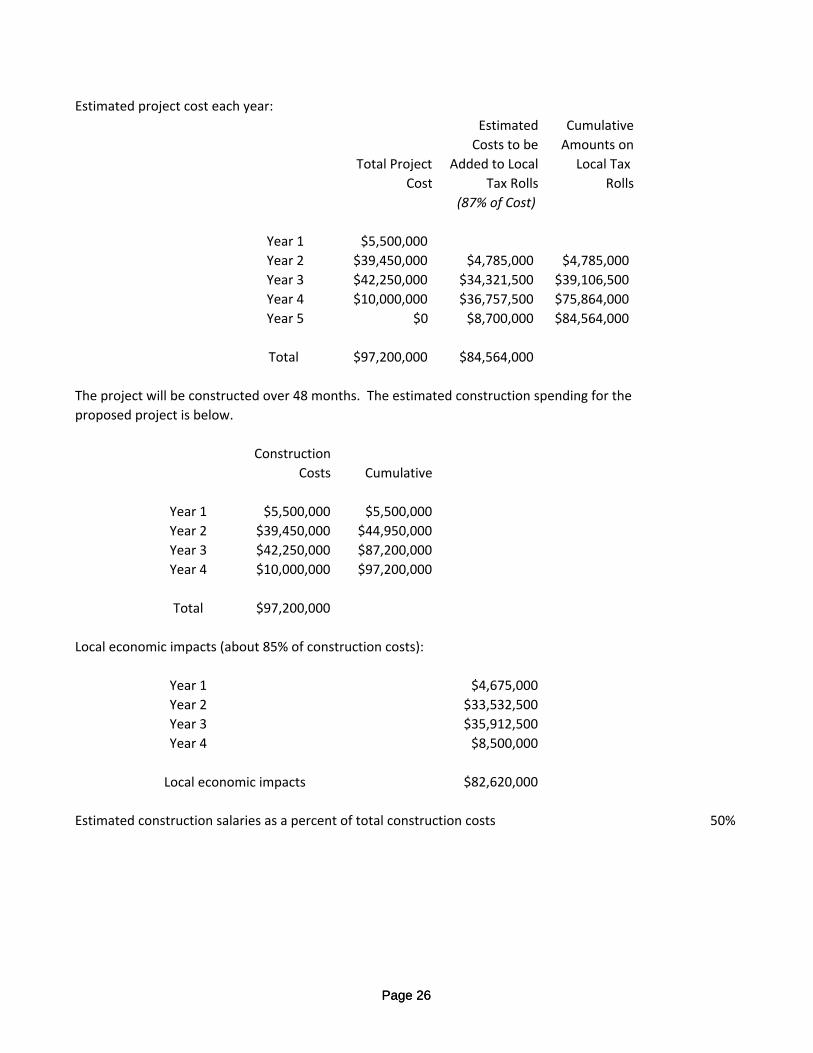
Estimated project cost each year:
Estimated Cumulative
Costs to be Amounts on
Total Project Added to Local Local Tax
Cost Tax Rolls Rolls
(87% of Cost)
Year 1 $5,500,000
Year 2 $39,450,000 $4,785,000 $4,785,000
Year 3 $42,250,000 $34,321,500 $39,106,500
Year 4 $10,000,000 $36,757,500 $75,864,000
Year 5 $0 $8,700,000 $84,564,000
Total $97,200,000 $84,564,000
The project will be constructed over 48 months. The estimated construction spending for the
proposed project is below.
Construction
Costs Cumulative
Year 1 $5,500,000 $5,500,000
Year 2 $39,450,000 $44,950,000
Year 3 $42,250,000 $87,200,000
Year 4 $10,000,000 $97,200,000
Page 26
Total $97,200,000
Local economic impacts (about 85% of construction costs):
Year 1 $4,675,000
Year 2 $33,532,500
Year 3 $35,912,500
Year 4 $8,500,000
Local economic impacts $82,620,000
Estimated construction salaries as a percent of total construction costs 50%
Page 26
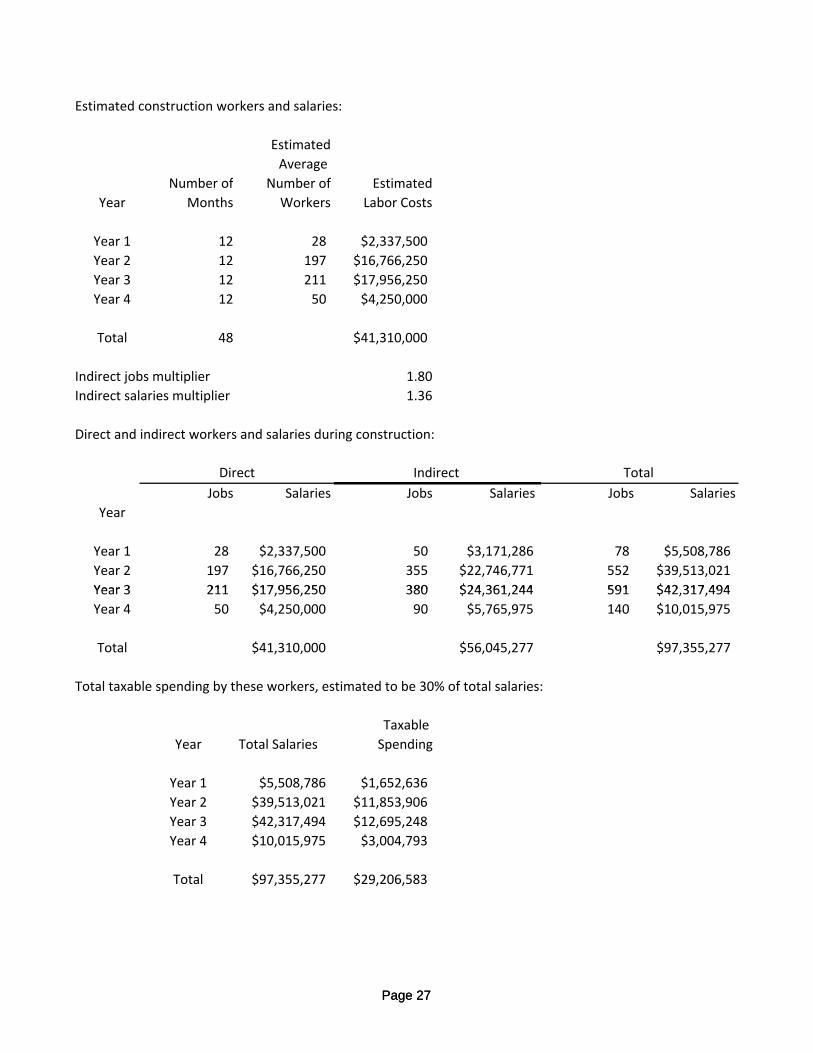
Estimated construction workers and salaries:
Estimated
Average
Number of Number of Estimated
Year Months Workers Labor Costs
Year 1 12 28 $2,337,500
Year 2 12 197 $16,766,250
Year 3 12 211 $17,956,250
Year 4 12 50 $4,250,000
Total 48 $41,310,000
Indirect jobs multiplier 1.80
Indirect salaries multiplier 1.36
Direct and indirect workers and salaries during construction:
Jobs Salaries Jobs Salaries Jobs Salaries
Year
Year 1 28 $2,337,500 50 $3,171,286 78 $5,508,786
Year 2 197 $16,766,250 355 $22,746,771 552 $39,513,021
Year 3 211 $17 956 250 380 $24 361 244 591 $42 317 494
Total Direct Indirect
Page 27
Year 3 211 $17,956,250 380 $24,361,244 591 $42,317,494
Year 4 50 $4,250,000 90 $5,765,975 140 $10,015,975
Total $41,310,000 $56,045,277 $97,355,277
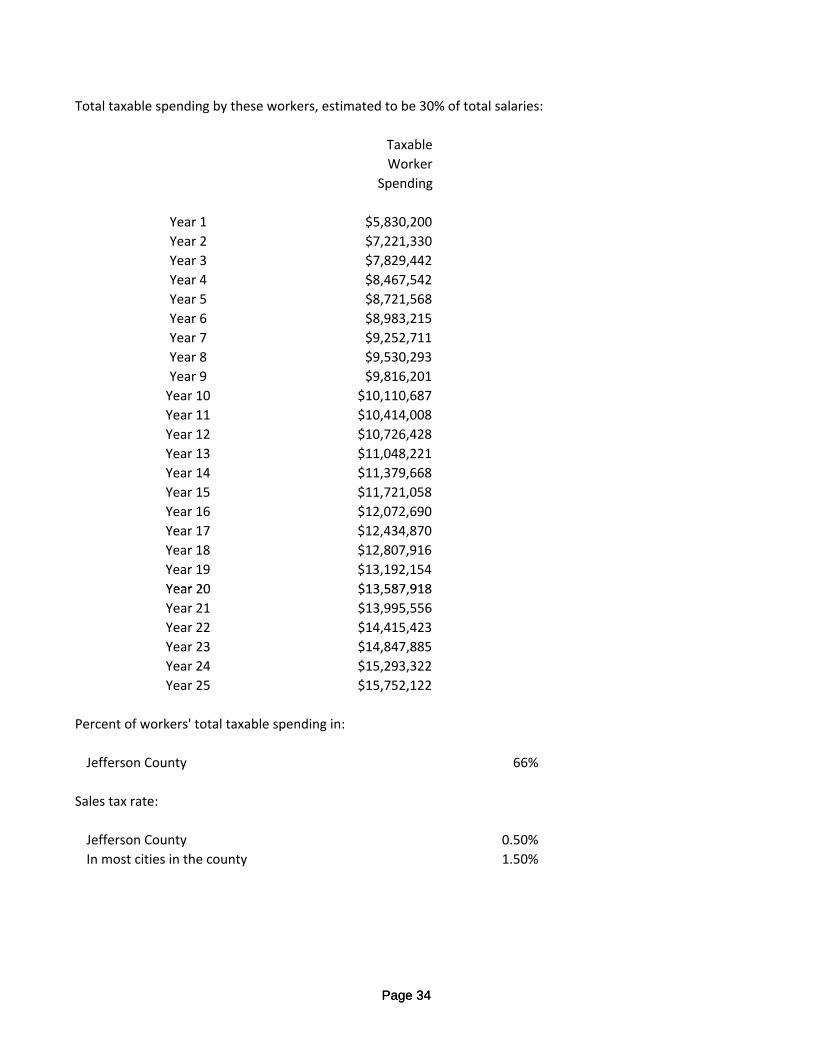
Total taxable spending by these workers, estimated to be 30% of total salaries:
Taxable
Year Total Salaries Spending
Year 1 $5,508,786 $1,652,636
Year 2 $39,513,021 $11,853,906
Year 3 $42,317,494 $12,695,248
Year 4 $10,015,975 $3,004,793
Total $97,355,277 $29,206,583
Page 27
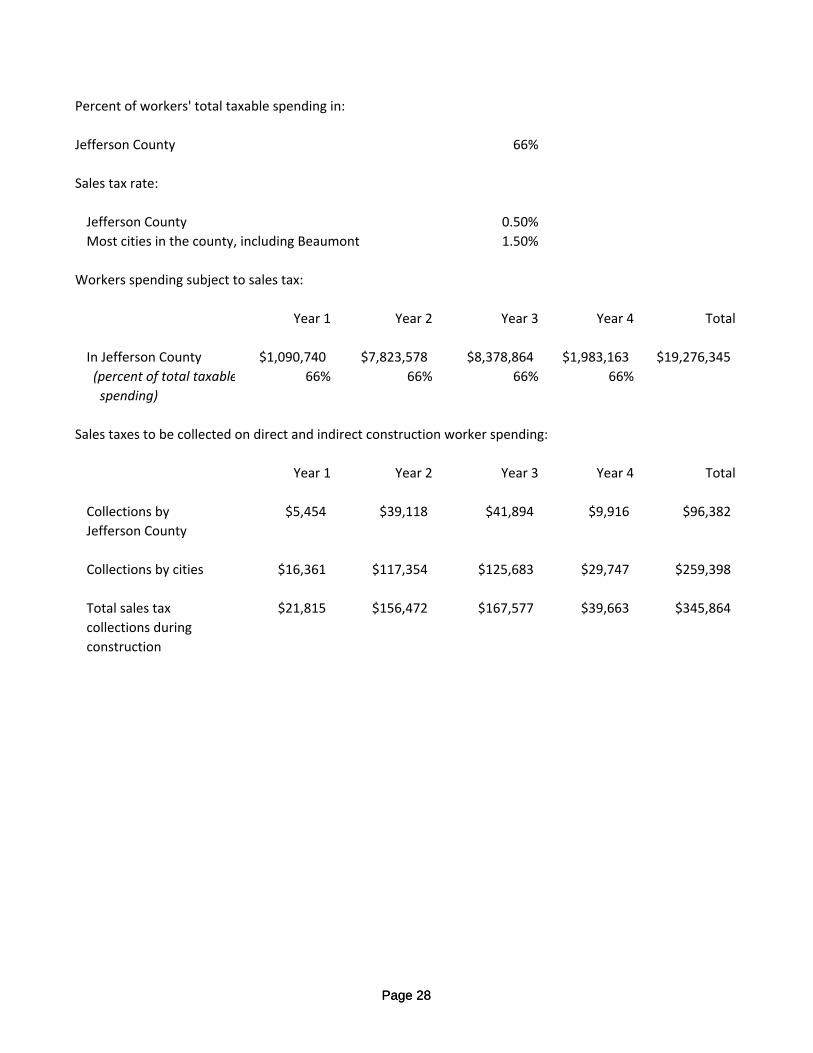
Percent of workers' total taxable spending in:
Jefferson County 66%
Sales tax rate:
Jefferson County 0.50%
Most cities in the county, including Beaumont 1.50%
Workers spending subject to sales tax:
Year 1 Year 2 Year 3 Year 4 Total
In Jefferson County $1,090,740 $7,823,578 $8,378,864 $1,983,163 $19,276,345
(percent of total taxable 66% 66% 66% 66%
spending)
Sales taxes to be collected on direct and indirect construction worker spending:
Year 1 Year 2 Year 3 Year 4 Total
Collections by $5,454 $39,118 $41,894 $9,916 $96,382
Jefferson County
Collections by cities $16,361 $117,354 $125,683 $29,747 $259,398
Page 28
Total sales tax $21,815 $156,472 $167,577 $39,663 $345,864
collections during
construction
Page 28
Appendix BEconomic Impacts During Operations of the Facility
Page 29Page 29
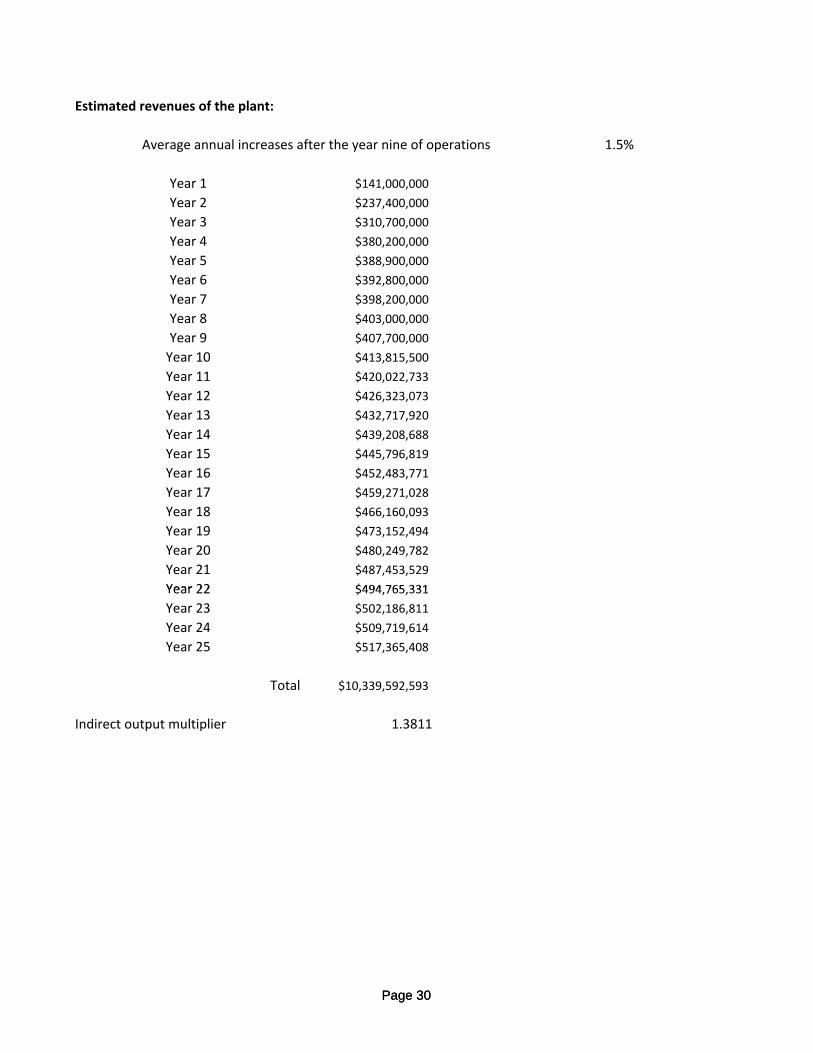
Estimated revenues of the plant:
Average annual increases after the year nine of operations 1.5%
Year 1 $141,000,000
Year 2 $237,400,000
Year 3 $310,700,000
Year 4 $380,200,000
Year 5 $388,900,000
Year 6 $392,800,000
Year 7 $398,200,000
Year 8 $403,000,000
Year 9 $407,700,000
Year 10 $413,815,500
Year 11 $420,022,733
Year 12 $426,323,073
Year 13 $432,717,920
Year 14 $439,208,688
Year 15 $445,796,819
Year 16 $452,483,771
Year 17 $459,271,028
Year 18 $466,160,093
Year 19 $473,152,494
Year 20 $480,249,782
Year 21 $487,453,529
Year 22 $494 765 331
Page 30
Year 22 $494,765,331
Year 23 $502,186,811
Year 24 $509,719,614
Year 25 $517,365,408
Total $10,339,592,593
Indirect output multiplier 1.3811
Page 30
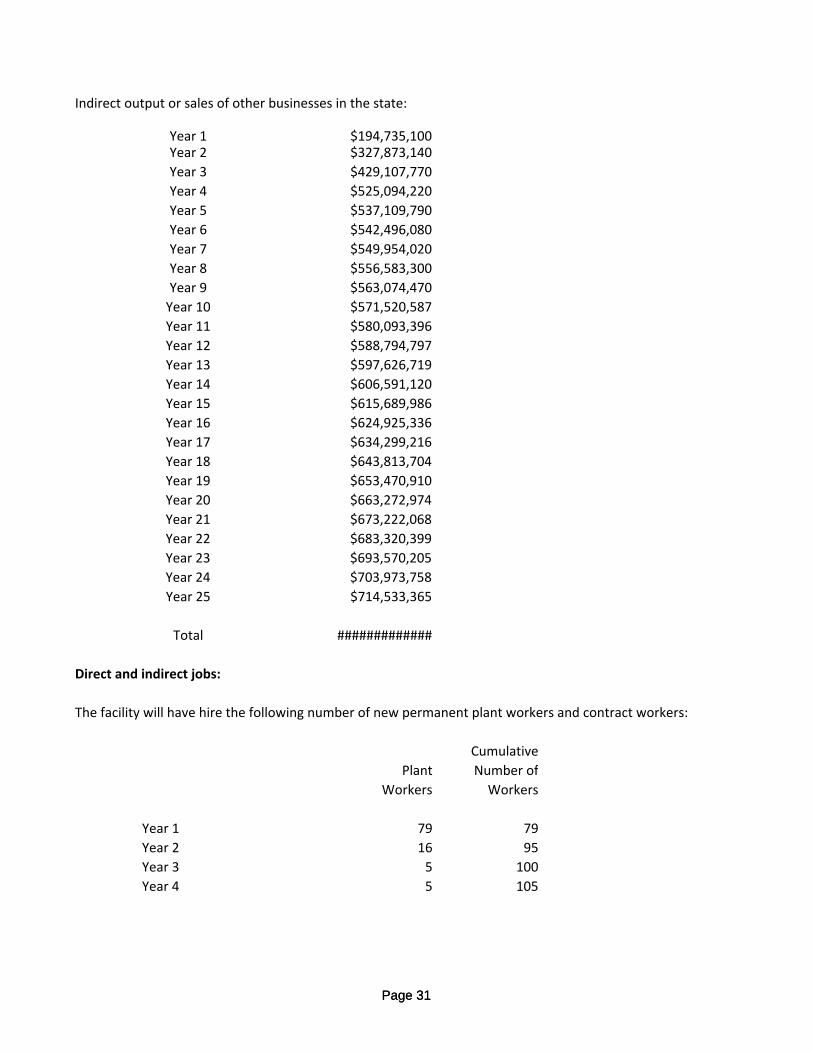
Indirect output or sales of other businesses in the state:
Year 1 $194,735,100Year 2 $327,873,140
Year 3 $429,107,770
Year 4 $525,094,220
Year 5 $537,109,790
Year 6 $542,496,080
Year 7 $549,954,020
Year 8 $556,583,300
Year 9 $563,074,470
Year 10 $571,520,587
Year 11 $580,093,396
Year 12 $588,794,797
Year 13 $597,626,719
Year 14 $606,591,120
Year 15 $615,689,986
Year 16 $624,925,336
Year 17 $634,299,216
Year 18 $643,813,704
Year 19 $653,470,910
Year 20 $663,272,974
Year 21 $673,222,068
Year 22 $683,320,399
Year 23 $693,570,205
Year 24 $703,973,758
Page 31
Year 25 $714,533,365
Total #############
Direct and indirect jobs:
The facility will have hire the following number of new permanent plant workers and contract workers:
Cumulative
Plant Number of
Workers Workers
Year 1 79 79
Year 2 16 95
Year 3 5 100
Year 4 5 105
Page 31
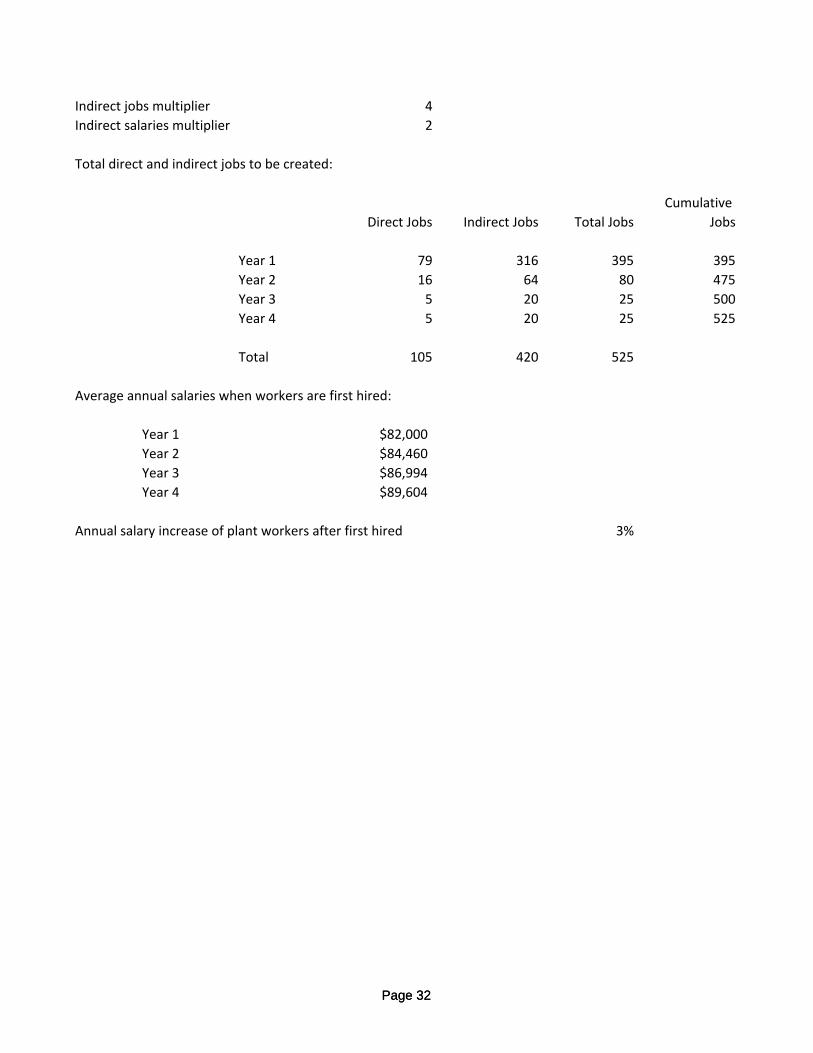
Indirect jobs multiplier 4
Indirect salaries multiplier 2
Total direct and indirect jobs to be created:
Cumulative
Direct Jobs Indirect Jobs Total Jobs Jobs
Year 1 79 316 395 395
Year 2 16 64 80 475
Year 3 5 20 25 500
Year 4 5 20 25 525
Total 105 420 525
Average annual salaries when workers are first hired:
Year 1 $82,000
Year 2 $84,460
Year 3 $86,994
Year 4 $89,604
Annual salary increase of plant workers after first hired 3%
Page 32Page 32
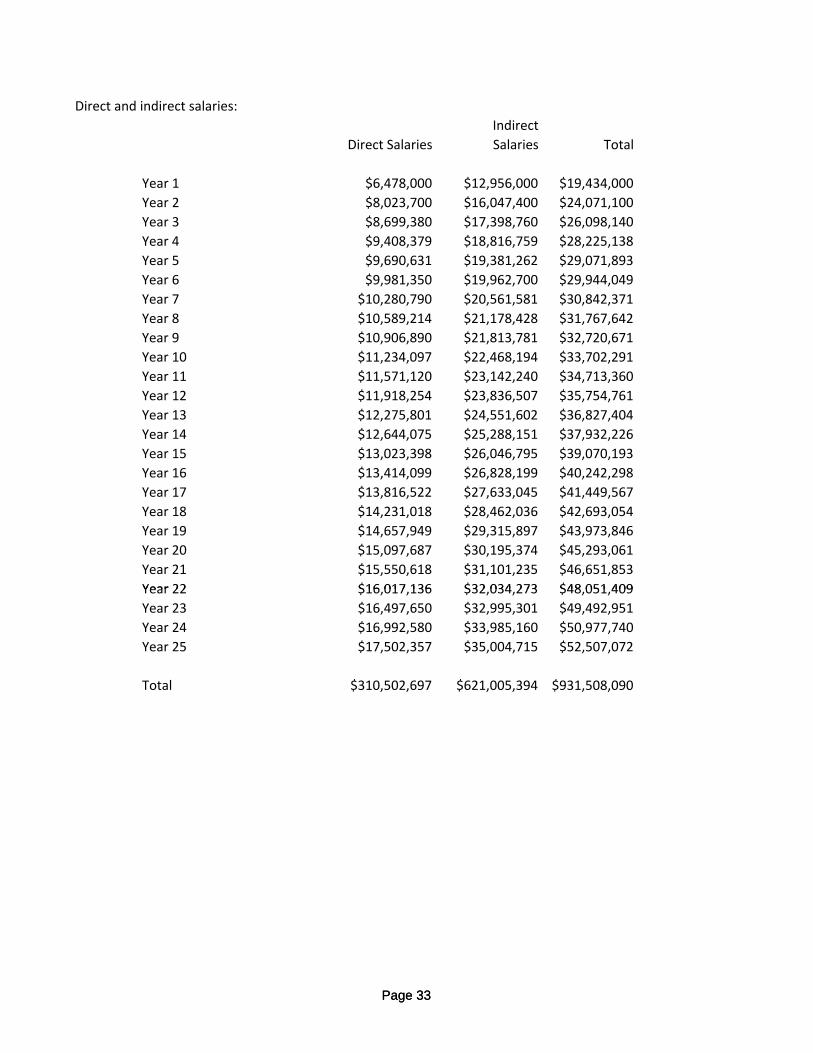
Direct and indirect salaries:
Indirect
Direct Salaries Salaries Total
Year 1 $6,478,000 $12,956,000 $19,434,000
Year 2 $8,023,700 $16,047,400 $24,071,100
Year 3 $8,699,380 $17,398,760 $26,098,140
Year 4 $9,408,379 $18,816,759 $28,225,138
Year 5 $9,690,631 $19,381,262 $29,071,893
Year 6 $9,981,350 $19,962,700 $29,944,049
Year 7 $10,280,790 $20,561,581 $30,842,371
Year 8 $10,589,214 $21,178,428 $31,767,642
Year 9 $10,906,890 $21,813,781 $32,720,671
Year 10 $11,234,097 $22,468,194 $33,702,291
Year 11 $11,571,120 $23,142,240 $34,713,360
Year 12 $11,918,254 $23,836,507 $35,754,761
Year 13 $12,275,801 $24,551,602 $36,827,404
Year 14 $12,644,075 $25,288,151 $37,932,226
Year 15 $13,023,398 $26,046,795 $39,070,193
Year 16 $13,414,099 $26,828,199 $40,242,298
Year 17 $13,816,522 $27,633,045 $41,449,567
Year 18 $14,231,018 $28,462,036 $42,693,054
Year 19 $14,657,949 $29,315,897 $43,973,846
Year 20 $15,097,687 $30,195,374 $45,293,061
Year 21 $15,550,618 $31,101,235 $46,651,853
Year 22 $16 017 136 $32 034 273 $48 051 409
Page 33
Year 22 $16,017,136 $32,034,273 $48,051,409
Year 23 $16,497,650 $32,995,301 $49,492,951
Year 24 $16,992,580 $33,985,160 $50,977,740
Year 25 $17,502,357 $35,004,715 $52,507,072
Total $310,502,697 $621,005,394 $931,508,090
Page 33
Total taxable spending by these workers, estimated to be 30% of total salaries:
Taxable
Worker
Spending
Year 1 $5,830,200
Year 2 $7,221,330
Year 3 $7,829,442
Year 4 $8,467,542
Year 5 $8,721,568
Year 6 $8,983,215
Year 7 $9,252,711
Year 8 $9,530,293
Year 9 $9,816,201
Year 10 $10,110,687
Year 11 $10,414,008
Year 12 $10,726,428
Year 13 $11,048,221
Year 14 $11,379,668
Year 15 $11,721,058
Year 16 $12,072,690
Year 17 $12,434,870
Year 18 $12,807,916
Year 19 $13,192,154
Year 20 $13 587 918
Page 34
Year 20 $13,587,918
Year 21 $13,995,556
Year 22 $14,415,423
Year 23 $14,847,885
Year 24 $15,293,322
Year 25 $15,752,122
Percent of workers' total taxable spending in:
Jefferson County 66%
Sales tax rate:
Jefferson County 0.50%
In most cities in the county 1.50%
Page 34
Workers spending subject to sales taxes in Jefferson County:
Year 1 $3,847,932
Year 2 $4,766,078
Year 3 $5,167,432
Year 4 $5,588,577
Year 5 $5,756,235
Year 6 $5,928,922
Year 7 $6,106,789
Year 8 $6,289,993
Year 9 $6,478,693
Year 10 $6,673,054
Year 11 $6,873,245
Year 12 $7,079,443
Year 13 $7,291,826
Year 14 $7,510,581
Year 15 $7,735,898
Year 16 $7,967,975
Year 17 $8,207,014
Year 18 $8,453,225
Year 19 $8,706,822
Year 20 $8,968,026
Year 21 $9,237,067
Year 22 $9,514,179
Year 23 $9,799,604
Year 24 $10 093 592
Page 35
Year 24 $10,093,592
Year 25 $10,396,400
Total $184,438,602
Page 35
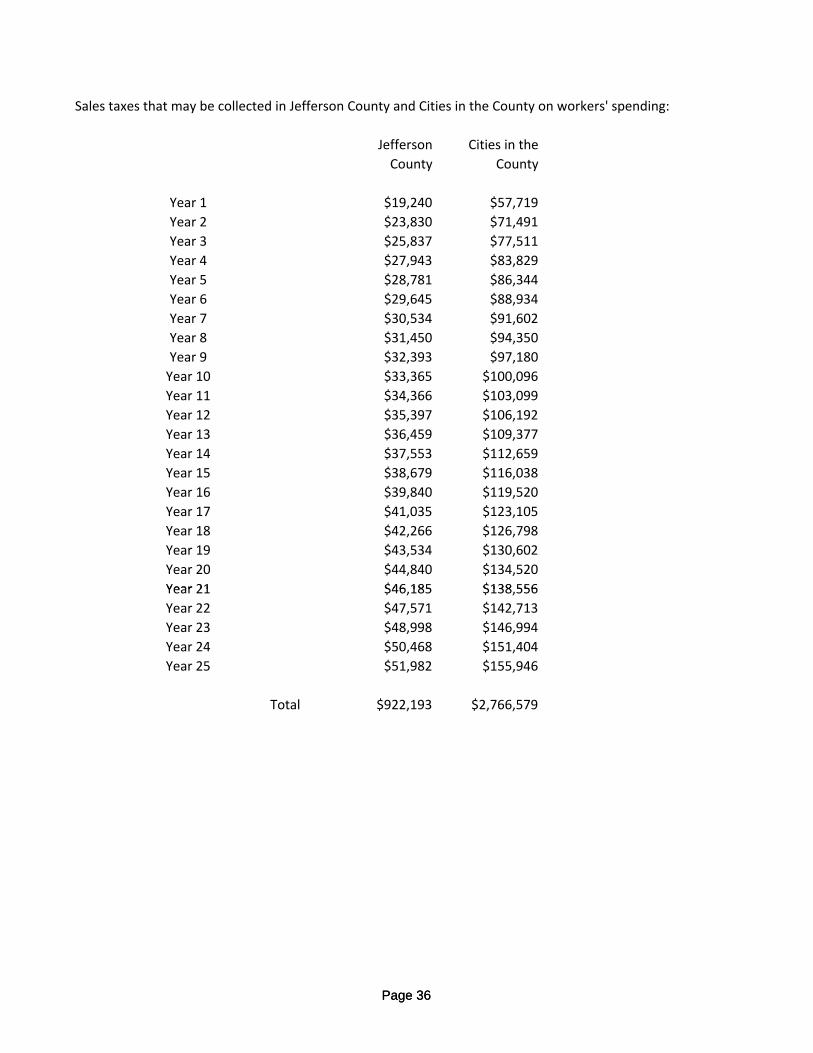
Sales taxes that may be collected in Jefferson County and Cities in the County on workers' spending:
Jefferson Cities in the
County County
Year 1 $19,240 $57,719
Year 2 $23,830 $71,491
Year 3 $25,837 $77,511
Year 4 $27,943 $83,829
Year 5 $28,781 $86,344
Year 6 $29,645 $88,934
Year 7 $30,534 $91,602
Year 8 $31,450 $94,350
Year 9 $32,393 $97,180
Year 10 $33,365 $100,096
Year 11 $34,366 $103,099
Year 12 $35,397 $106,192
Year 13 $36,459 $109,377
Year 14 $37,553 $112,659
Year 15 $38,679 $116,038
Year 16 $39,840 $119,520
Year 17 $41,035 $123,105
Year 18 $42,266 $126,798
Year 19 $43,534 $130,602
Year 20 $44,840 $134,520
Year 21 $46 185 $138 556
Page 36
Year 21 $46,185 $138,556
Year 22 $47,571 $142,713
Year 23 $48,998 $146,994
Year 24 $50,468 $151,404
Year 25 $51,982 $155,946
Total $922,193 $2,766,579
Page 36
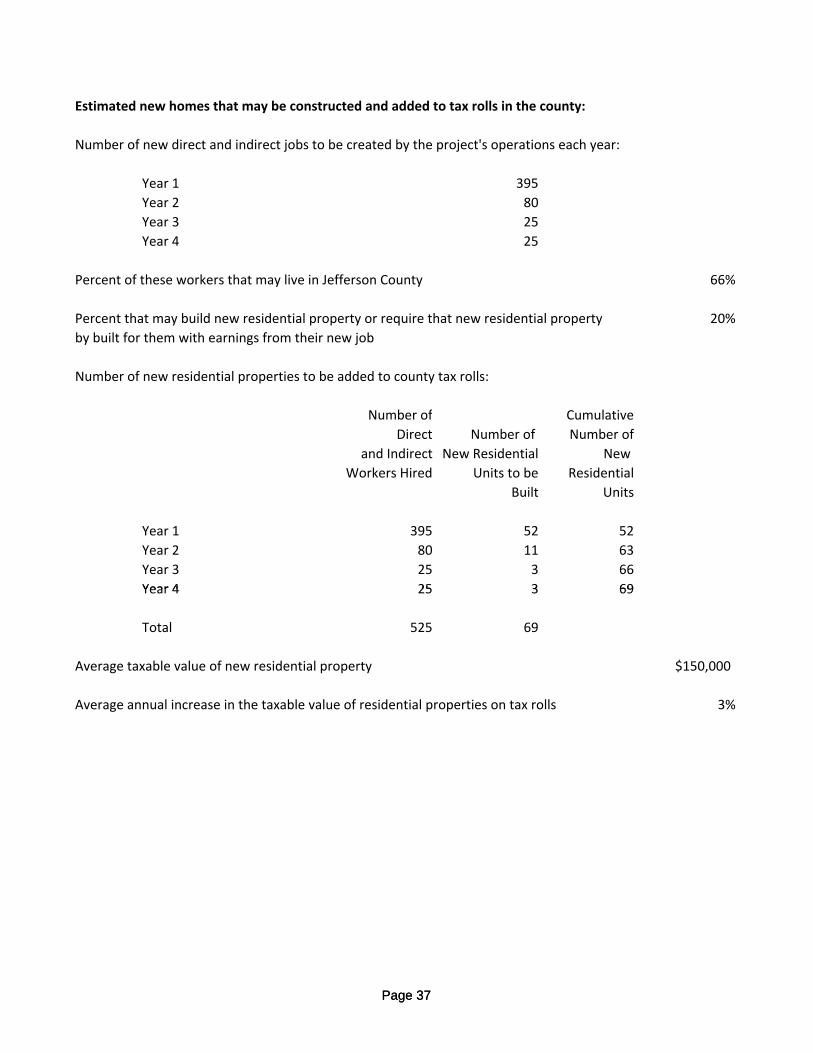
Estimated new homes that may be constructed and added to tax rolls in the county:
Number of new direct and indirect jobs to be created by the project's operations each year:
Year 1 395
Year 2 80
Year 3 25
Year 4 25
Percent of these workers that may live in Jefferson County 66%
Percent that may build new residential property or require that new residential property 20%
by built for them with earnings from their new job
Number of new residential properties to be added to county tax rolls:
Number of Cumulative
Direct Number of Number of
and Indirect New Residential New
Workers Hired Units to be Residential
Built Units
Year 1 395 52 52
Year 2 80 11 63
Year 3 25 3 66
Year 4 25 3 69
Page 37
Year 4 25 3 69
Total 525 69
Average taxable value of new residential property $150,000
Average annual increase in the taxable value of residential properties on tax rolls 3%
Page 37
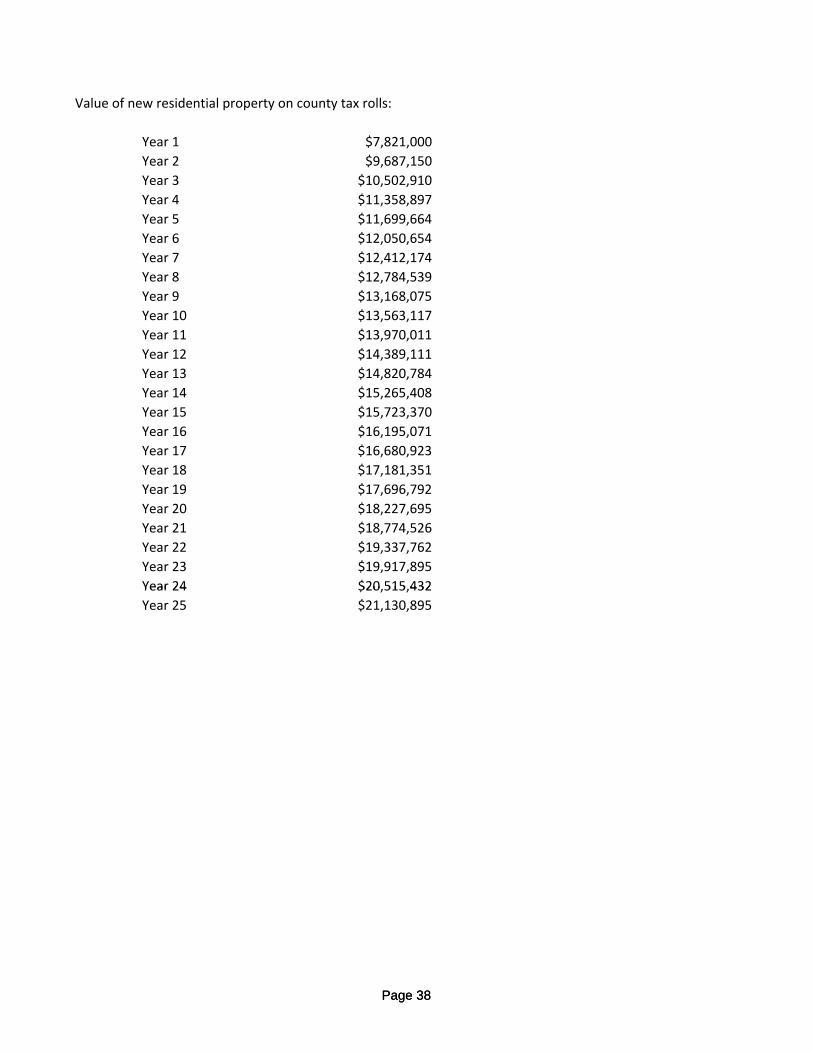
Value of new residential property on county tax rolls:
Year 1 $7,821,000
Year 2 $9,687,150
Year 3 $10,502,910
Year 4 $11,358,897
Year 5 $11,699,664
Year 6 $12,050,654
Year 7 $12,412,174
Year 8 $12,784,539
Year 9 $13,168,075
Year 10 $13,563,117
Year 11 $13,970,011
Year 12 $14,389,111
Year 13 $14,820,784
Year 14 $15,265,408
Year 15 $15,723,370
Year 16 $16,195,071
Year 17 $16,680,923
Year 18 $17,181,351
Year 19 $17,696,792
Year 20 $18,227,695
Year 21 $18,774,526
Year 22 $19,337,762
Year 23 $19,917,895
Year 24 $20,515,432
Page 38
Year 24 $20,515,432
Year 25 $21,130,895
Page 38
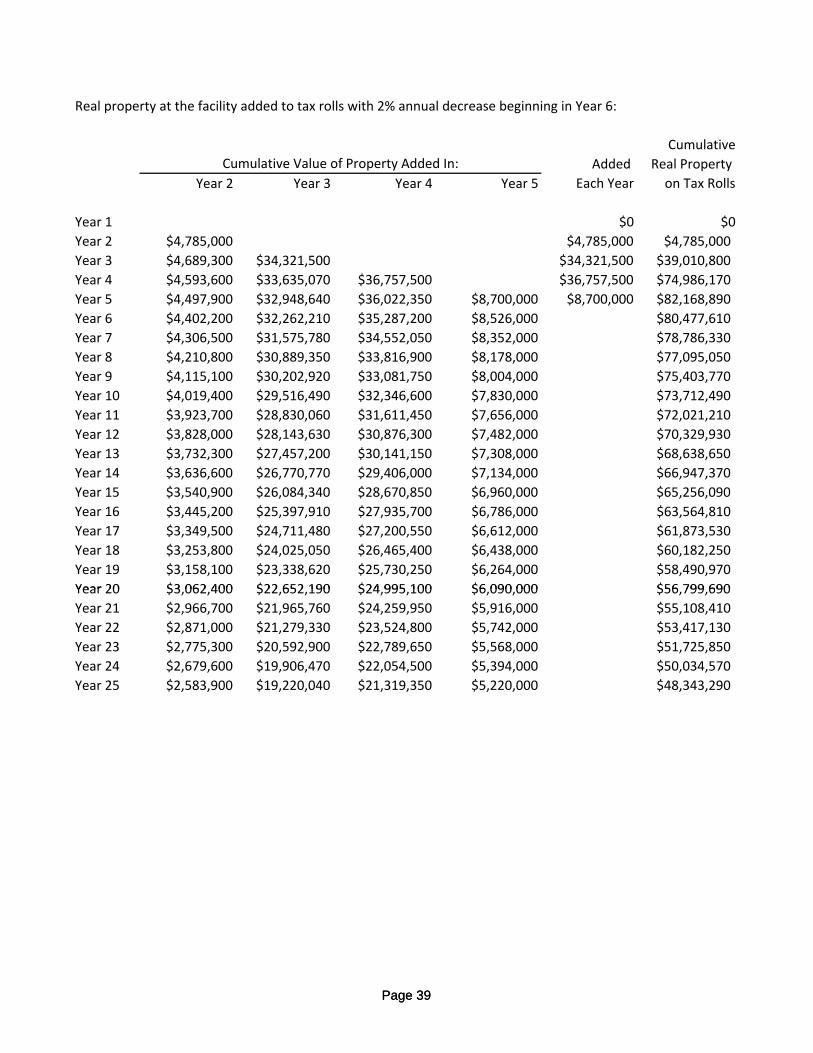
Real property at the facility added to tax rolls with 2% annual decrease beginning in Year 6:
Cumulative
Added Real Property
Year 2 Year 3 Year 4 Year 5 Each Year on Tax Rolls
Year 1 $0 $0
Year 2 $4,785,000 $4,785,000 $4,785,000
Year 3 $4,689,300 $34,321,500 $34,321,500 $39,010,800
Year 4 $4,593,600 $33,635,070 $36,757,500 $36,757,500 $74,986,170
Year 5 $4,497,900 $32,948,640 $36,022,350 $8,700,000 $8,700,000 $82,168,890
Year 6 $4,402,200 $32,262,210 $35,287,200 $8,526,000 $80,477,610
Year 7 $4,306,500 $31,575,780 $34,552,050 $8,352,000 $78,786,330
Year 8 $4,210,800 $30,889,350 $33,816,900 $8,178,000 $77,095,050
Year 9 $4,115,100 $30,202,920 $33,081,750 $8,004,000 $75,403,770
Year 10 $4,019,400 $29,516,490 $32,346,600 $7,830,000 $73,712,490
Year 11 $3,923,700 $28,830,060 $31,611,450 $7,656,000 $72,021,210
Year 12 $3,828,000 $28,143,630 $30,876,300 $7,482,000 $70,329,930
Year 13 $3,732,300 $27,457,200 $30,141,150 $7,308,000 $68,638,650
Year 14 $3,636,600 $26,770,770 $29,406,000 $7,134,000 $66,947,370
Year 15 $3,540,900 $26,084,340 $28,670,850 $6,960,000 $65,256,090
Year 16 $3,445,200 $25,397,910 $27,935,700 $6,786,000 $63,564,810
Year 17 $3,349,500 $24,711,480 $27,200,550 $6,612,000 $61,873,530
Year 18 $3,253,800 $24,025,050 $26,465,400 $6,438,000 $60,182,250
Year 19 $3,158,100 $23,338,620 $25,730,250 $6,264,000 $58,490,970
Year 20 $3 062 400 $22 652 190 $24 995 100 $6 090 000 $56 799 690
Cumulative Value of Property Added In:
Page 39
Year 20 $3,062,400 $22,652,190 $24,995,100 $6,090,000 $56,799,690
Year 21 $2,966,700 $21,965,760 $24,259,950 $5,916,000 $55,108,410
Year 22 $2,871,000 $21,279,330 $23,524,800 $5,742,000 $53,417,130
Year 23 $2,775,300 $20,592,900 $22,789,650 $5,568,000 $51,725,850
Year 24 $2,679,600 $19,906,470 $22,054,500 $5,394,000 $50,034,570
Year 25 $2,583,900 $19,220,040 $21,319,350 $5,220,000 $48,343,290
Page 39
Business personal property including vehicles, furniture, fixtures and inventories at the facility
added to tax rolls
Average annual increase in the value and volume of taxable inventories 2%
Business
Personal
Added Value on Added Value on Property
Each Year Tax Rolls Each Year Tax Rolls on Tax Rolls
Year 1 $100,000 $100,000 $100,000
Year 2 $100,000 $10,000,000 $10,000,000 $10,100,000
Year 3 $100,000 $5,000,000 $15,000,000 $15,100,000
Year 4 $100,000 $6,662,000 $21,662,000 $21,762,000
Year 5 $100,000 $21,662,000 $21,762,000
Year 6 $100,000 $22,095,240 $22,195,240
Year 7 $100,000 $22,537,145 $22,637,145
Year 8 $100,000 $22,987,888 $23,087,888
Year 9 $100,000 $23,447,645 $23,547,645
Year 10 $80,000 $180,000 $23,916,598 $24,096,598
Year 11 $180,000 $24,394,930 $24,574,930
Year 12 $180,000 $24,882,829 $25,062,829
Year 13 $180,000 $25,380,486 $25,560,486
Year 14 $180,000 $25,888,095 $26,068,095
Year 15 $180,000 $26,405,857 $26,585,857
Year 16 $180 000 $26 933 974 $27 113 974
Inventories
Vehicles, Furniture, and
Fixtures
Page 40
Year 16 $180,000 $26,933,974 $27,113,974
Year 17 $180,000 $27,472,654 $27,652,654
Year 18 $180,000 $28,022,107 $28,202,107
Year 19 $180,000 $28,582,549 $28,762,549
Year 20 $10,000 $190,000 $29,154,200 $29,344,200
Year 21 $190,000 $29,737,284 $29,927,284
Year 22 $190,000 $30,332,030 $30,522,030
Year 23 $190,000 $30,938,670 $31,128,670
Year 24 $190,000 $31,557,444 $31,747,444
Year 25 $190,000 $32,188,592 $32,378,592
Page 40
Appendix CCosts and Benefits for Jefferson County
Page 41Page 41
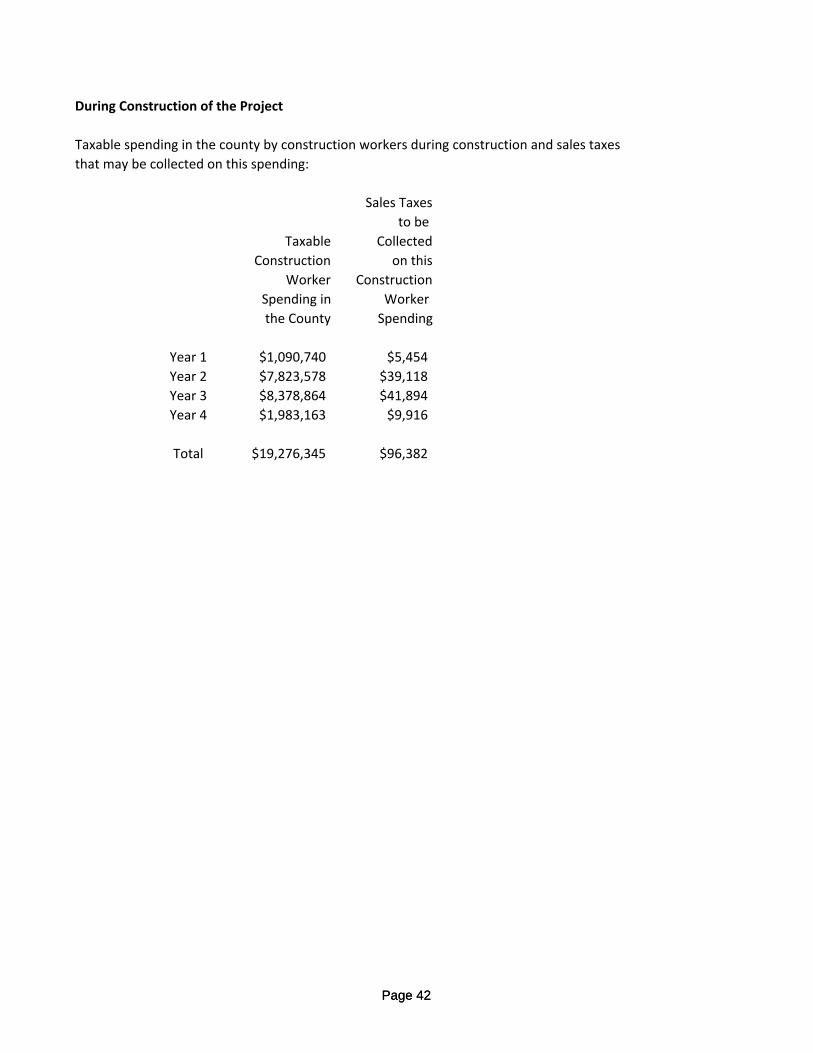
During Construction of the Project
Taxable spending in the county by construction workers during construction and sales taxes
that may be collected on this spending:
Sales Taxes
to be
Taxable Collected
Construction on this
Worker Construction
Spending in Worker
the County Spending
Year 1 $1,090,740 $5,454
Year 2 $7,823,578 $39,118
Year 3 $8,378,864 $41,894
Year 4 $1,983,163 $9,916
Total $19,276,345 $96,382
Page 42Page 42
During Operations of the Facility:
Taxable spending in the county by workers at the facility and sales taxes to be collected on this spending:
Sales Taxes
to be
Taxable Collected
Spending by Direct and
Direct and Indirect
Indirect Workers Worker in the County Spending
Year 1 $3,847,932 $19,240
Year 2 $4,766,078 $23,830
Year 3 $5,167,432 $25,837
Year 4 $5,588,577 $27,943
Year 5 $5,756,235 $28,781
Year 6 $5,928,922 $29,645
Year 7 $6,106,789 $30,534
Year 8 $6,289,993 $31,450
Year 9 $6,478,693 $32,393
Year 10 $6,673,054 $33,365
Year 11 $6,873,245 $34,366
Year 12 $7,079,443 $35,397
Year 13 $7,291,826 $36,459
Year 14 $7,510,581 $37,553
Page 43
Year 14 $7,510,581 $37,553
Year 15 $7,735,898 $38,679
Year 16 $7,967,975 $39,840
Year 17 $8,207,014 $41,035
Year 18 $8,453,225 $42,266
Year 19 $8,706,822 $43,534
Year 20 $8,968,026 $44,840
Year 21 $9,237,067 $46,185
Year 22 $9,514,179 $47,571
Year 23 $9,799,604 $48,998
Year 24 $10,093,592 $50,468
Year 25 $10,396,400 $51,982
$184,438,602 $922,193
Costs of services to workers at the facility and workers in spin‐off jobs created in the county:
Number of new direct and indirect jobs to be created by the project's operations 395
Page 43
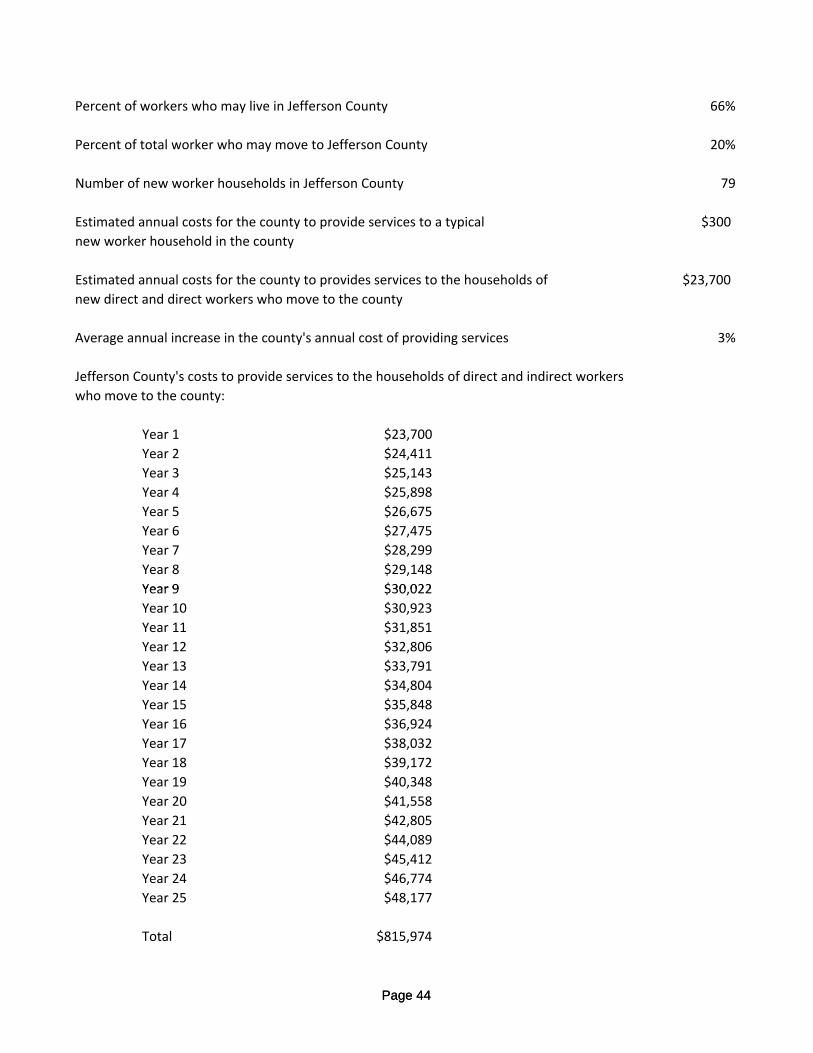
Percent of workers who may live in Jefferson County 66%
Percent of total worker who may move to Jefferson County 20%
Number of new worker households in Jefferson County 79
Estimated annual costs for the county to provide services to a typical $300
new worker household in the county
Estimated annual costs for the county to provides services to the households of $23,700
new direct and direct workers who move to the county
Average annual increase in the county's annual cost of providing services 3%
Jefferson County's costs to provide services to the households of direct and indirect workers
who move to the county:
Year 1 $23,700
Year 2 $24,411
Year 3 $25,143
Year 4 $25,898
Year 5 $26,675
Year 6 $27,475
Year 7 $28,299
Year 8 $29,148
Year 9 $30 022
Page 44
Year 9 $30,022
Year 10 $30,923
Year 11 $31,851
Year 12 $32,806
Year 13 $33,791
Year 14 $34,804
Year 15 $35,848
Year 16 $36,924
Year 17 $38,032
Year 18 $39,172
Year 19 $40,348
Year 20 $41,558
Year 21 $42,805
Year 22 $44,089
Year 23 $45,412
Year 24 $46,774
Year 25 $48,177
Total $815,974
Page 44
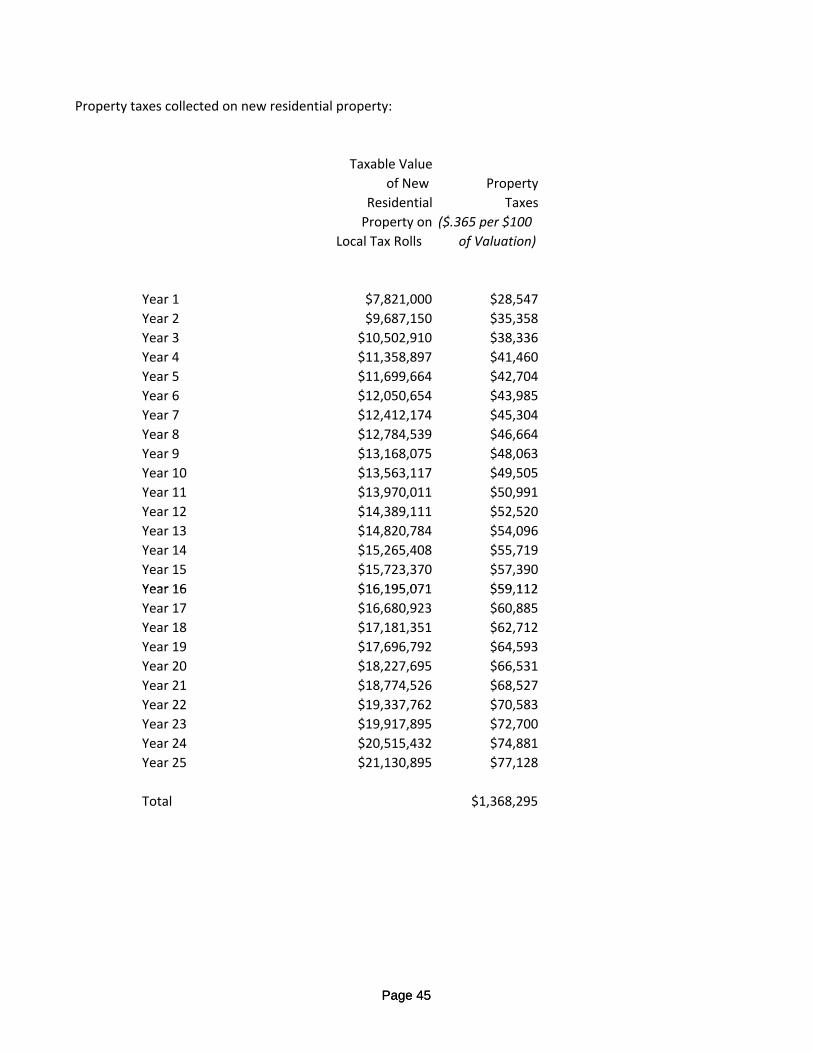
Property taxes collected on new residential property:
Taxable Value
of New Property
Residential Taxes
Property on ($.365 per $100
Local Tax Rolls of Valuation)
Year 1 $7,821,000 $28,547
Year 2 $9,687,150 $35,358
Year 3 $10,502,910 $38,336
Year 4 $11,358,897 $41,460
Year 5 $11,699,664 $42,704
Year 6 $12,050,654 $43,985
Year 7 $12,412,174 $45,304
Year 8 $12,784,539 $46,664
Year 9 $13,168,075 $48,063
Year 10 $13,563,117 $49,505
Year 11 $13,970,011 $50,991
Year 12 $14,389,111 $52,520
Year 13 $14,820,784 $54,096
Year 14 $15,265,408 $55,719
Year 15 $15,723,370 $57,390
Year 16 $16 195 071 $59 112
Page 45
Year 16 $16,195,071 $59,112
Year 17 $16,680,923 $60,885
Year 18 $17,181,351 $62,712
Year 19 $17,696,792 $64,593
Year 20 $18,227,695 $66,531
Year 21 $18,774,526 $68,527
Year 22 $19,337,762 $70,583
Year 23 $19,917,895 $72,700
Year 24 $20,515,432 $74,881
Year 25 $21,130,895 $77,128
Total $1,368,295
Page 45
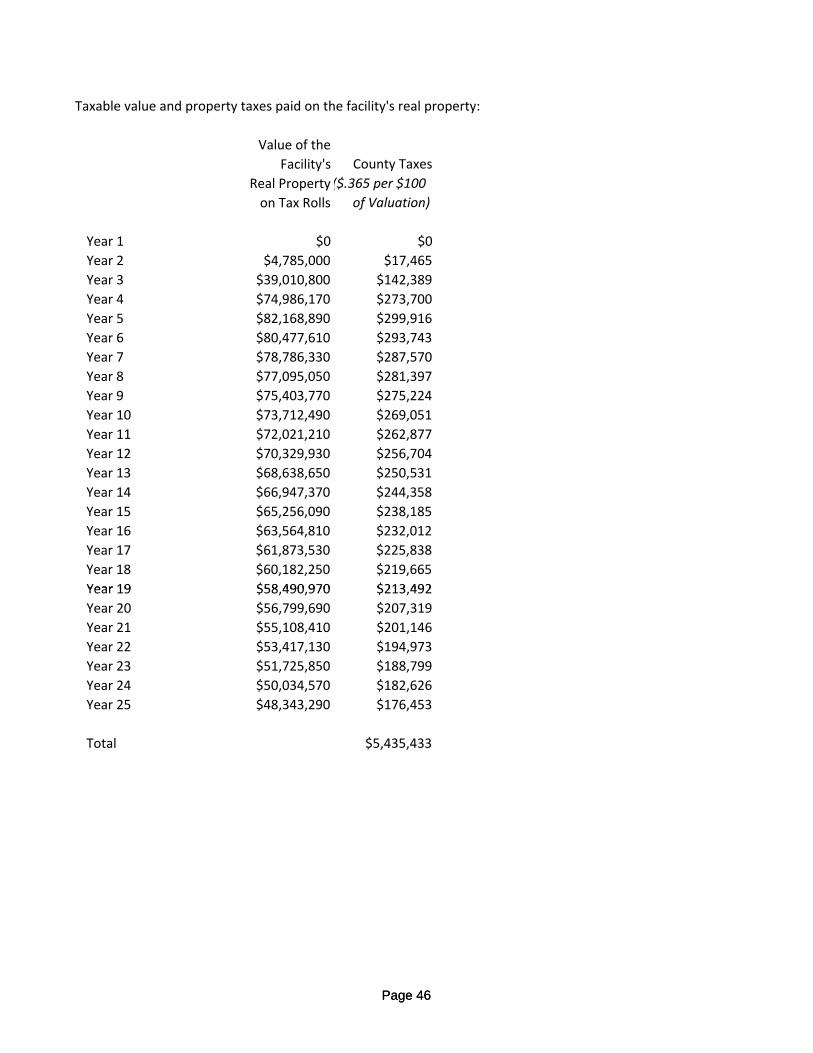
Taxable value and property taxes paid on the facility's real property:
Value of the
Facility's County Taxes
Real Property ($.365 per $100
on Tax Rolls of Valuation)
Year 1 $0 $0
Year 2 $4,785,000 $17,465
Year 3 $39,010,800 $142,389
Year 4 $74,986,170 $273,700
Year 5 $82,168,890 $299,916
Year 6 $80,477,610 $293,743
Year 7 $78,786,330 $287,570
Year 8 $77,095,050 $281,397
Year 9 $75,403,770 $275,224
Year 10 $73,712,490 $269,051
Year 11 $72,021,210 $262,877
Year 12 $70,329,930 $256,704
Year 13 $68,638,650 $250,531
Year 14 $66,947,370 $244,358
Year 15 $65,256,090 $238,185
Year 16 $63,564,810 $232,012
Year 17 $61,873,530 $225,838
Year 18 $60,182,250 $219,665
Year 19 $58 490 970 $213 492
Page 46
Year 19 $58,490,970 $213,492
Year 20 $56,799,690 $207,319
Year 21 $55,108,410 $201,146
Year 22 $53,417,130 $194,973
Year 23 $51,725,850 $188,799
Year 24 $50,034,570 $182,626
Year 25 $48,343,290 $176,453
Total $5,435,433
Page 46
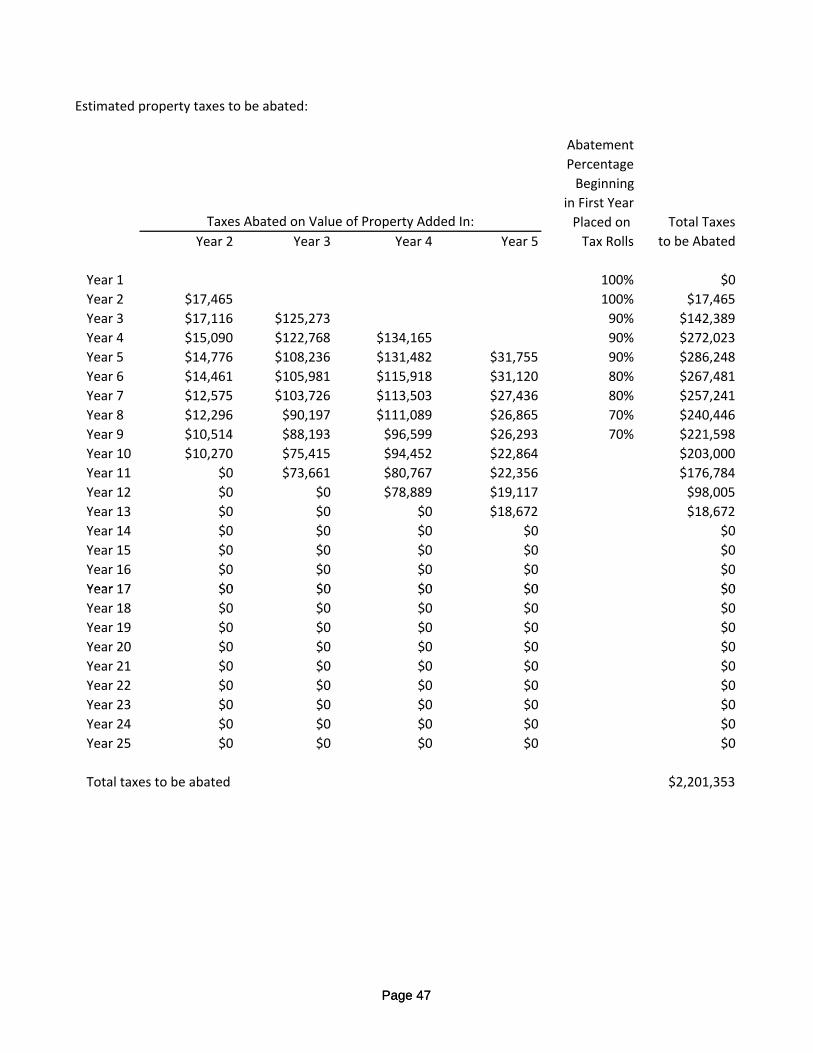
Estimated property taxes to be abated:
Abatement
Percentage
Beginning
in First Year
Placed on Total Taxes
Year 2 Year 3 Year 4 Year 5 Tax Rolls to be Abated
Year 1 100% $0
Year 2 $17,465 100% $17,465
Year 3 $17,116 $125,273 90% $142,389
Year 4 $15,090 $122,768 $134,165 90% $272,023
Year 5 $14,776 $108,236 $131,482 $31,755 90% $286,248
Year 6 $14,461 $105,981 $115,918 $31,120 80% $267,481
Year 7 $12,575 $103,726 $113,503 $27,436 80% $257,241
Year 8 $12,296 $90,197 $111,089 $26,865 70% $240,446
Year 9 $10,514 $88,193 $96,599 $26,293 70% $221,598
Year 10 $10,270 $75,415 $94,452 $22,864 $203,000
Year 11 $0 $73,661 $80,767 $22,356 $176,784
Year 12 $0 $0 $78,889 $19,117 $98,005
Year 13 $0 $0 $0 $18,672 $18,672
Year 14 $0 $0 $0 $0 $0
Year 15 $0 $0 $0 $0 $0
Year 16 $0 $0 $0 $0 $0
Year 17 $0 $0 $0 $0 $0
Taxes Abated on Value of Property Added In:
Page 47
Year 17 $0 $0 $0 $0 $0
Year 18 $0 $0 $0 $0 $0
Year 19 $0 $0 $0 $0 $0
Year 20 $0 $0 $0 $0 $0
Year 21 $0 $0 $0 $0 $0
Year 22 $0 $0 $0 $0 $0
Year 23 $0 $0 $0 $0 $0
Year 24 $0 $0 $0 $0 $0
Year 25 $0 $0 $0 $0 $0
Total taxes to be abated $2,201,353
Page 47
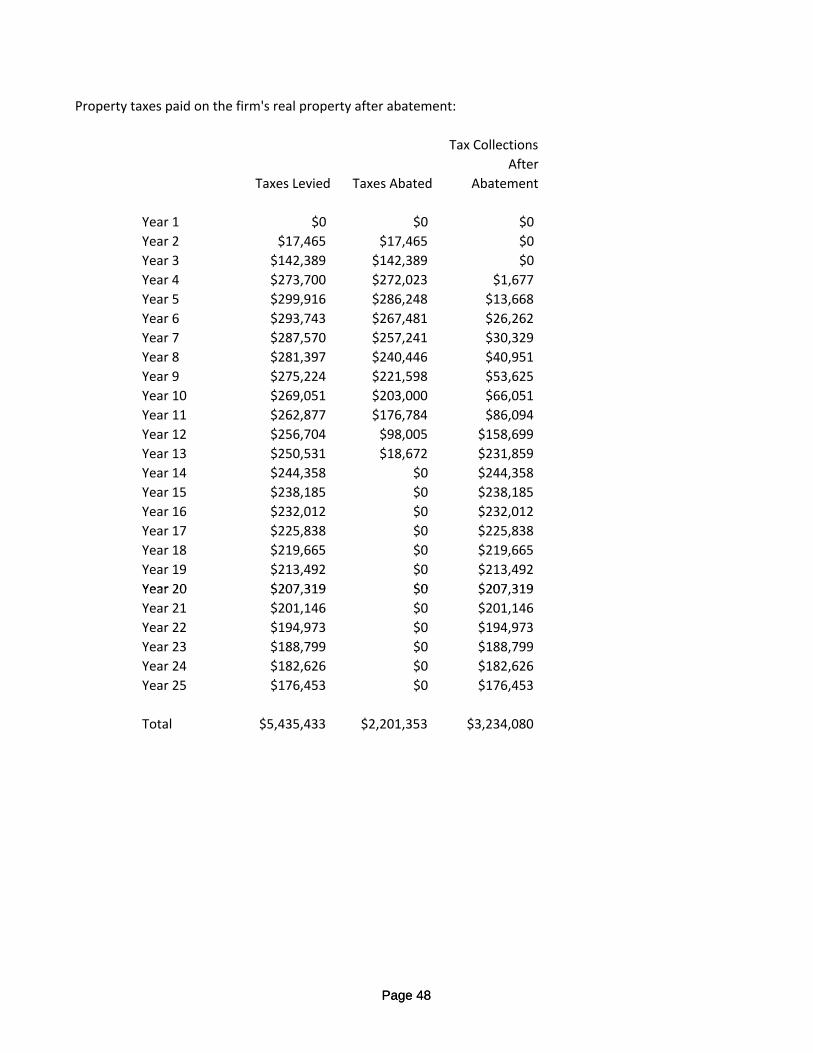
Property taxes paid on the firm's real property after abatement:
Tax Collections
After
Taxes Levied Taxes Abated Abatement
Year 1 $0 $0 $0
Year 2 $17,465 $17,465 $0
Year 3 $142,389 $142,389 $0
Year 4 $273,700 $272,023 $1,677
Year 5 $299,916 $286,248 $13,668
Year 6 $293,743 $267,481 $26,262
Year 7 $287,570 $257,241 $30,329
Year 8 $281,397 $240,446 $40,951
Year 9 $275,224 $221,598 $53,625
Year 10 $269,051 $203,000 $66,051
Year 11 $262,877 $176,784 $86,094
Year 12 $256,704 $98,005 $158,699
Year 13 $250,531 $18,672 $231,859
Year 14 $244,358 $0 $244,358
Year 15 $238,185 $0 $238,185
Year 16 $232,012 $0 $232,012
Year 17 $225,838 $0 $225,838
Year 18 $219,665 $0 $219,665
Year 19 $213,492 $0 $213,492
Year 20 $207 319 $0 $207 319
Page 48
Year 20 $207,319 $0 $207,319
Year 21 $201,146 $0 $201,146
Year 22 $194,973 $0 $194,973
Year 23 $188,799 $0 $188,799
Year 24 $182,626 $0 $182,626
Year 25 $176,453 $0 $176,453
Total $5,435,433 $2,201,353 $3,234,080
Page 48
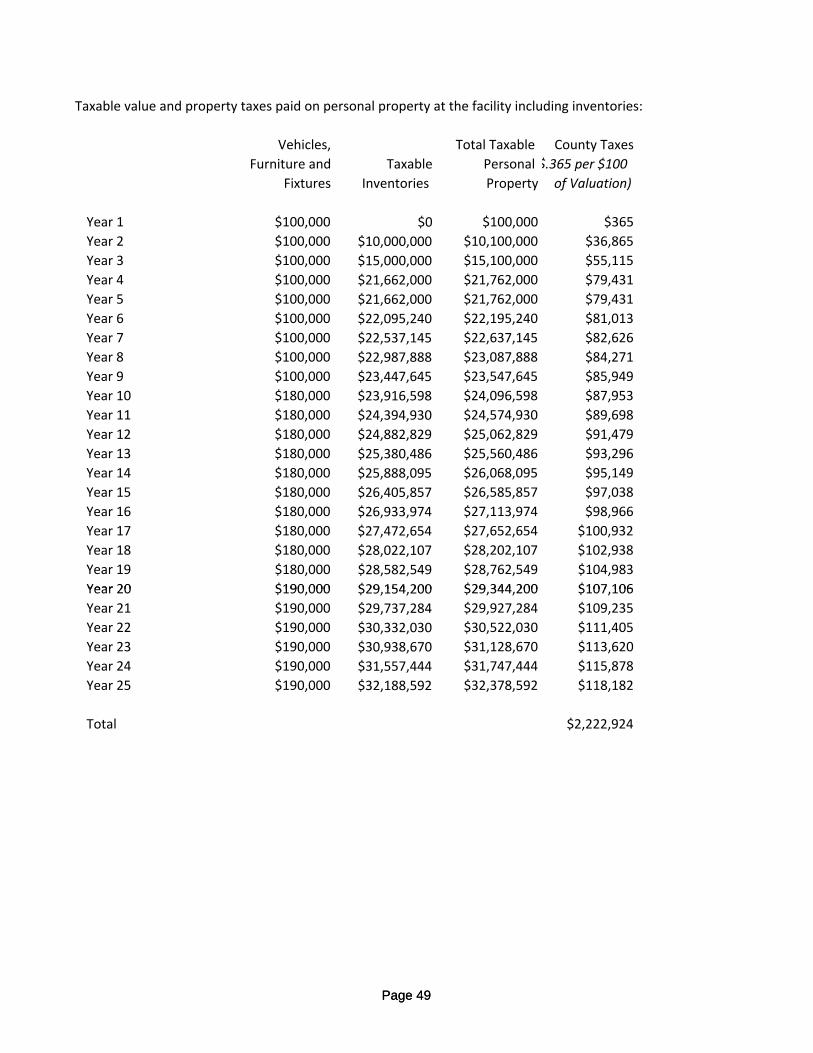
Taxable value and property taxes paid on personal property at the facility including inventories:
Vehicles, Total Taxable County Taxes
Furniture and Taxable Personal $.365 per $100
Fixtures Inventories Property of Valuation)
Year 1 $100,000 $0 $100,000 $365
Year 2 $100,000 $10,000,000 $10,100,000 $36,865
Year 3 $100,000 $15,000,000 $15,100,000 $55,115
Year 4 $100,000 $21,662,000 $21,762,000 $79,431
Year 5 $100,000 $21,662,000 $21,762,000 $79,431
Year 6 $100,000 $22,095,240 $22,195,240 $81,013
Year 7 $100,000 $22,537,145 $22,637,145 $82,626
Year 8 $100,000 $22,987,888 $23,087,888 $84,271
Year 9 $100,000 $23,447,645 $23,547,645 $85,949
Year 10 $180,000 $23,916,598 $24,096,598 $87,953
Year 11 $180,000 $24,394,930 $24,574,930 $89,698
Year 12 $180,000 $24,882,829 $25,062,829 $91,479
Year 13 $180,000 $25,380,486 $25,560,486 $93,296
Year 14 $180,000 $25,888,095 $26,068,095 $95,149
Year 15 $180,000 $26,405,857 $26,585,857 $97,038
Year 16 $180,000 $26,933,974 $27,113,974 $98,966
Year 17 $180,000 $27,472,654 $27,652,654 $100,932
Year 18 $180,000 $28,022,107 $28,202,107 $102,938
Year 19 $180,000 $28,582,549 $28,762,549 $104,983
Year 20 $190 000 $29 154 200 $29 344 200 $107 106
Page 49
Year 20 $190,000 $29,154,200 $29,344,200 $107,106
Year 21 $190,000 $29,737,284 $29,927,284 $109,235
Year 22 $190,000 $30,332,030 $30,522,030 $111,405
Year 23 $190,000 $30,938,670 $31,128,670 $113,620
Year 24 $190,000 $31,557,444 $31,747,444 $115,878
Year 25 $190,000 $32,188,592 $32,378,592 $118,182
Total $2,222,924
Page 49
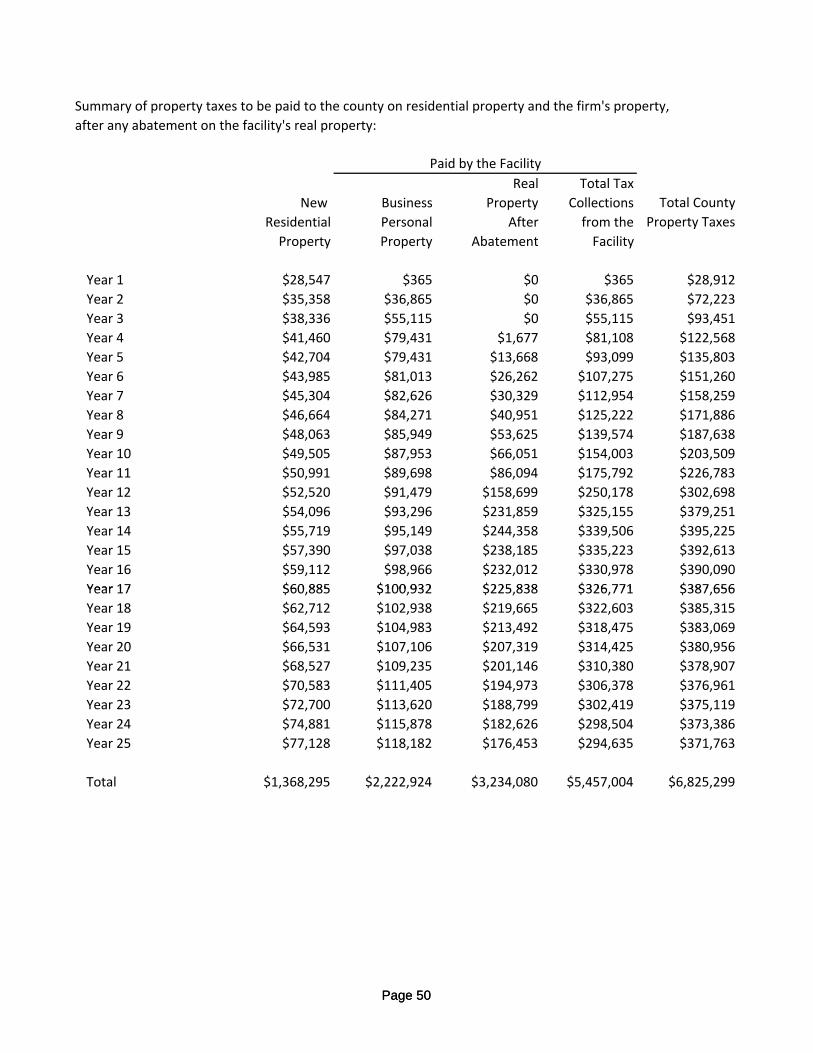
Summary of property taxes to be paid to the county on residential property and the firm's property,
after any abatement on the facility's real property:
Real Total Tax
New Business Property Collections Total County
Residential Personal After from the Property Taxes
Property Property Abatement Facility
Year 1 $28,547 $365 $0 $365 $28,912
Year 2 $35,358 $36,865 $0 $36,865 $72,223
Year 3 $38,336 $55,115 $0 $55,115 $93,451
Year 4 $41,460 $79,431 $1,677 $81,108 $122,568
Year 5 $42,704 $79,431 $13,668 $93,099 $135,803
Year 6 $43,985 $81,013 $26,262 $107,275 $151,260
Year 7 $45,304 $82,626 $30,329 $112,954 $158,259
Year 8 $46,664 $84,271 $40,951 $125,222 $171,886
Year 9 $48,063 $85,949 $53,625 $139,574 $187,638
Year 10 $49,505 $87,953 $66,051 $154,003 $203,509
Year 11 $50,991 $89,698 $86,094 $175,792 $226,783
Year 12 $52,520 $91,479 $158,699 $250,178 $302,698
Year 13 $54,096 $93,296 $231,859 $325,155 $379,251
Year 14 $55,719 $95,149 $244,358 $339,506 $395,225
Year 15 $57,390 $97,038 $238,185 $335,223 $392,613
Year 16 $59,112 $98,966 $232,012 $330,978 $390,090
Year 17 $60 885 $100 932 $225 838 $326 771 $387 656
Paid by the Facility
Page 50
Year 17 $60,885 $100,932 $225,838 $326,771 $387,656
Year 18 $62,712 $102,938 $219,665 $322,603 $385,315
Year 19 $64,593 $104,983 $213,492 $318,475 $383,069
Year 20 $66,531 $107,106 $207,319 $314,425 $380,956
Year 21 $68,527 $109,235 $201,146 $310,380 $378,907
Year 22 $70,583 $111,405 $194,973 $306,378 $376,961
Year 23 $72,700 $113,620 $188,799 $302,419 $375,119
Year 24 $74,881 $115,878 $182,626 $298,504 $373,386
Year 25 $77,128 $118,182 $176,453 $294,635 $371,763
Total $1,368,295 $2,222,924 $3,234,080 $5,457,004 $6,825,299
Page 50
Appendix D
Page 51
ppAdditional Revenues for the City of Beaumont
Page 51
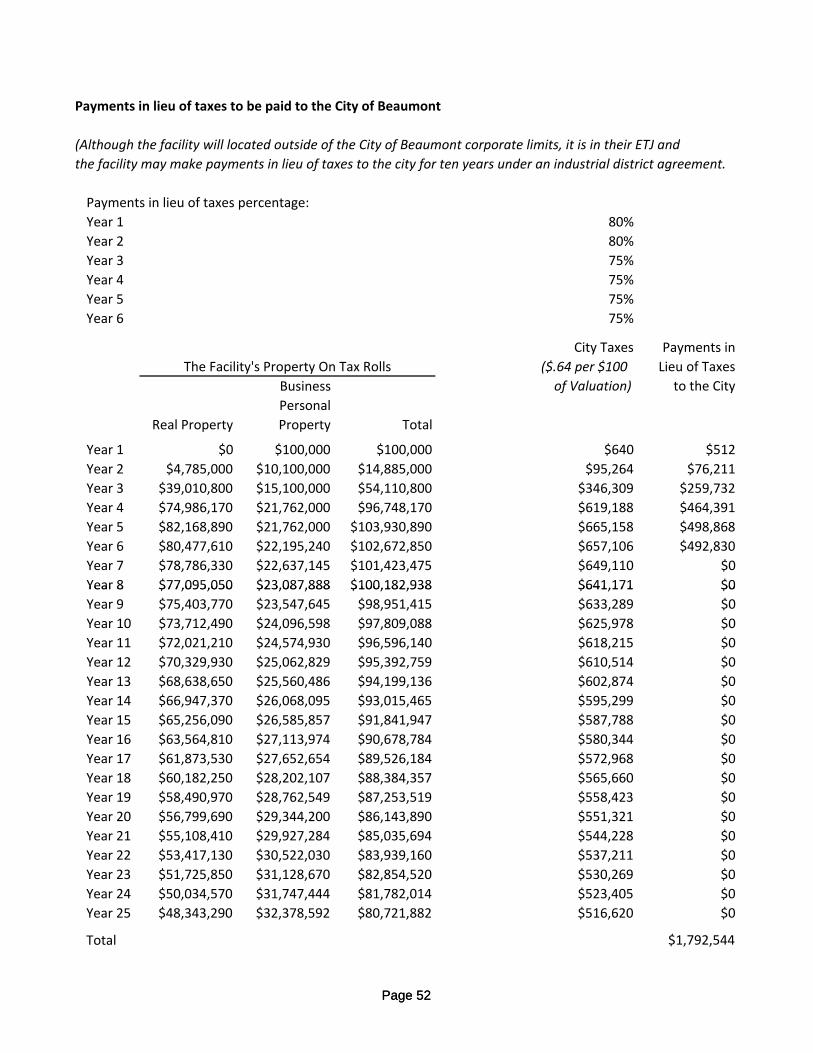
Payments in lieu of taxes to be paid to the City of Beaumont
(Although the facility will located outside of the City of Beaumont corporate limits, it is in their ETJ and
the facility may make payments in lieu of taxes to the city for ten years under an industrial district agreement.
Payments in lieu of taxes percentage:
Year 1 80%
Year 2 80%
Year 3 75%
Year 4 75%
Year 5 75%
Year 6 75%
City Taxes Payments in
($.64 per $100 Lieu of Taxes
Business of Valuation) to the City
Personal
Real Property Property Total
Year 1 $0 $100,000 $100,000 $640 $512
Year 2 $4,785,000 $10,100,000 $14,885,000 $95,264 $76,211
Year 3 $39,010,800 $15,100,000 $54,110,800 $346,309 $259,732
Year 4 $74,986,170 $21,762,000 $96,748,170 $619,188 $464,391
Year 5 $82,168,890 $21,762,000 $103,930,890 $665,158 $498,868
Year 6 $80,477,610 $22,195,240 $102,672,850 $657,106 $492,830
Year 7 $78,786,330 $22,637,145 $101,423,475 $649,110 $0
Year 8 $77,095,050 $23,087,888 $100,182,938 $641,171 $0
The Facility's Property On Tax Rolls
Page 52
Year 8 $77,095,050 $23,087,888 $100,182,938 $641,171 $0
Year 9 $75,403,770 $23,547,645 $98,951,415 $633,289 $0
Year 10 $73,712,490 $24,096,598 $97,809,088 $625,978 $0
Year 11 $72,021,210 $24,574,930 $96,596,140 $618,215 $0
Year 12 $70,329,930 $25,062,829 $95,392,759 $610,514 $0
Year 13 $68,638,650 $25,560,486 $94,199,136 $602,874 $0
Year 14 $66,947,370 $26,068,095 $93,015,465 $595,299 $0
Year 15 $65,256,090 $26,585,857 $91,841,947 $587,788 $0
Year 16 $63,564,810 $27,113,974 $90,678,784 $580,344 $0
Year 17 $61,873,530 $27,652,654 $89,526,184 $572,968 $0
Year 18 $60,182,250 $28,202,107 $88,384,357 $565,660 $0
Year 19 $58,490,970 $28,762,549 $87,253,519 $558,423 $0
Year 20 $56,799,690 $29,344,200 $86,143,890 $551,321 $0
Year 21 $55,108,410 $29,927,284 $85,035,694 $544,228 $0
Year 22 $53,417,130 $30,522,030 $83,939,160 $537,211 $0
Year 23 $51,725,850 $31,128,670 $82,854,520 $530,269 $0
Year 24 $50,034,570 $31,747,444 $81,782,014 $523,405 $0
Year 25 $48,343,290 $32,378,592 $80,721,882 $516,620 $0
Total $1,792,544
Page 52
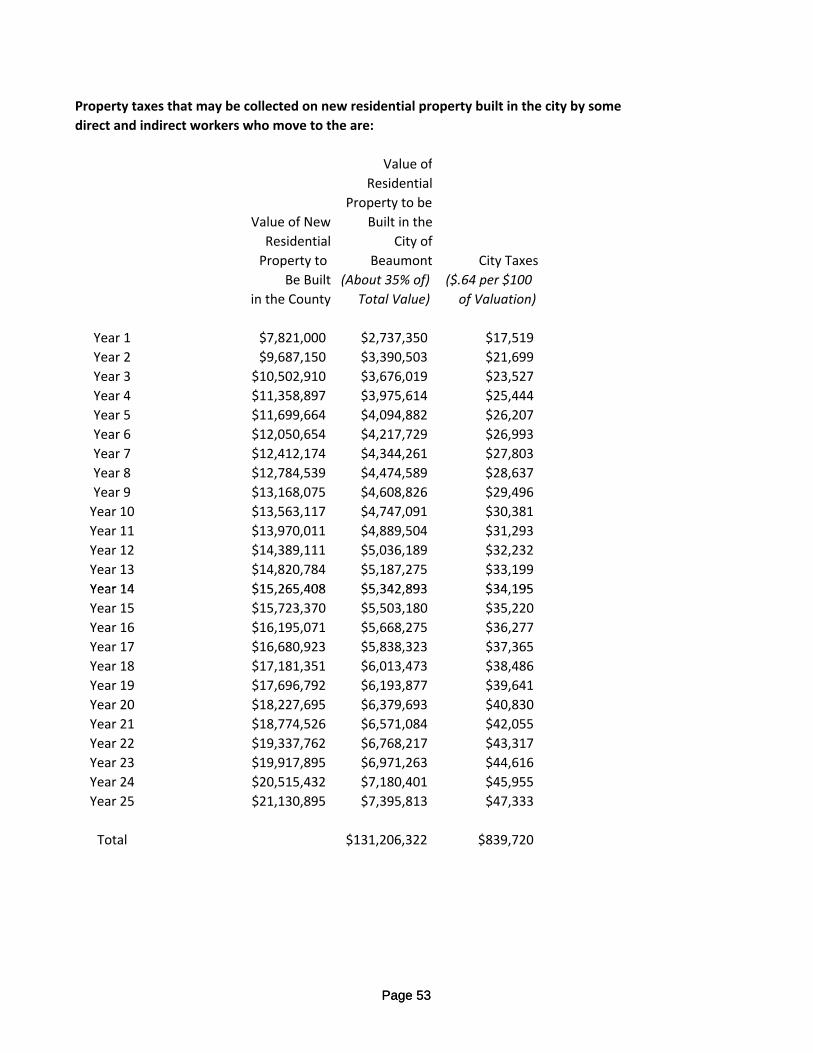
Property taxes that may be collected on new residential property built in the city by some
direct and indirect workers who move to the are:
Value of
Residential
Property to be
Value of New Built in the
Residential City of
Property to Beaumont City Taxes
Be Built (About 35% of) ($.64 per $100
in the County Total Value) of Valuation)
Year 1 $7,821,000 $2,737,350 $17,519
Year 2 $9,687,150 $3,390,503 $21,699
Year 3 $10,502,910 $3,676,019 $23,527
Year 4 $11,358,897 $3,975,614 $25,444
Year 5 $11,699,664 $4,094,882 $26,207
Year 6 $12,050,654 $4,217,729 $26,993
Year 7 $12,412,174 $4,344,261 $27,803
Year 8 $12,784,539 $4,474,589 $28,637
Year 9 $13,168,075 $4,608,826 $29,496
Year 10 $13,563,117 $4,747,091 $30,381
Year 11 $13,970,011 $4,889,504 $31,293
Year 12 $14,389,111 $5,036,189 $32,232
Year 13 $14,820,784 $5,187,275 $33,199
Year 14 $15 265 408 $5 342 893 $34 195
Page 53
Year 14 $15,265,408 $5,342,893 $34,195
Year 15 $15,723,370 $5,503,180 $35,220
Year 16 $16,195,071 $5,668,275 $36,277
Year 17 $16,680,923 $5,838,323 $37,365
Year 18 $17,181,351 $6,013,473 $38,486
Year 19 $17,696,792 $6,193,877 $39,641
Year 20 $18,227,695 $6,379,693 $40,830
Year 21 $18,774,526 $6,571,084 $42,055
Year 22 $19,337,762 $6,768,217 $43,317
Year 23 $19,917,895 $6,971,263 $44,616
Year 24 $20,515,432 $7,180,401 $45,955
Year 25 $21,130,895 $7,395,813 $47,333
Total $131,206,322 $839,720
Page 53
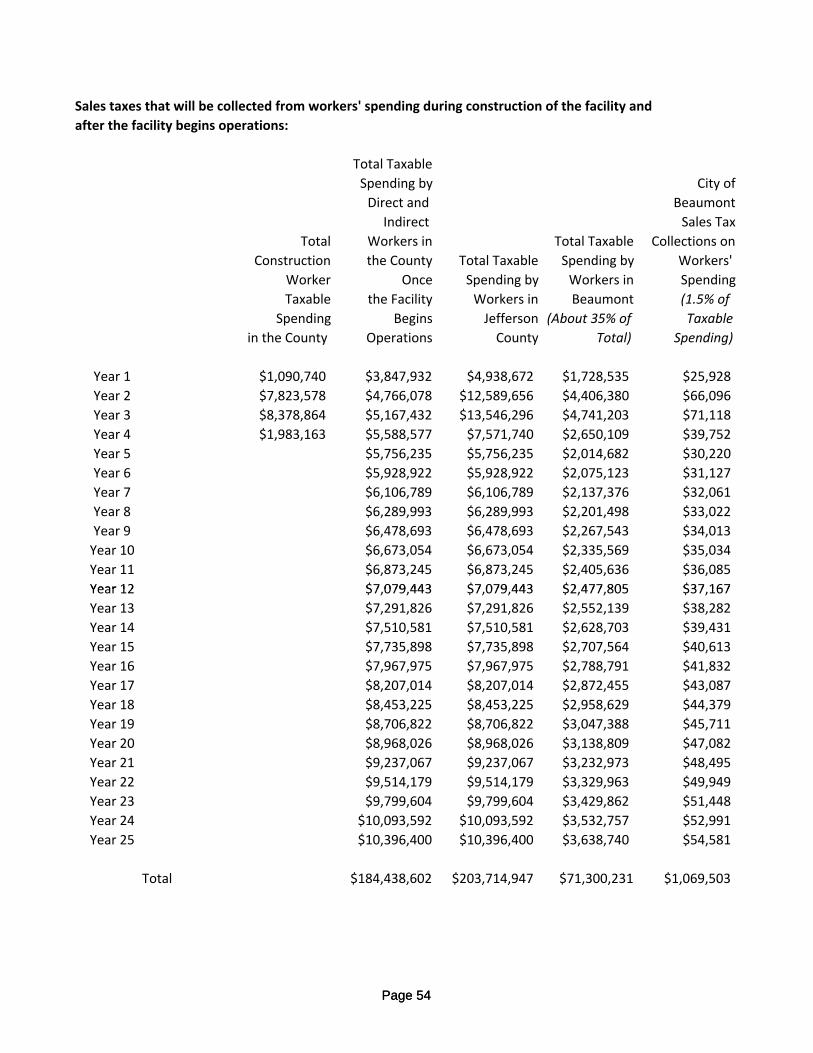
Sales taxes that will be collected from workers' spending during construction of the facility and
after the facility begins operations:
Total Taxable
Spending by City of
Direct and Beaumont
Indirect Sales Tax
Total Workers in Total Taxable Collections on
Construction the County Total Taxable Spending by Workers'
Worker Once Spending by Workers in Spending
Taxable the Facility Workers in Beaumont (1.5% of
Spending Begins Jefferson (About 35% of Taxable
in the County Operations County Total) Spending)
Year 1 $1,090,740 $3,847,932 $4,938,672 $1,728,535 $25,928
Year 2 $7,823,578 $4,766,078 $12,589,656 $4,406,380 $66,096
Year 3 $8,378,864 $5,167,432 $13,546,296 $4,741,203 $71,118
Year 4 $1,983,163 $5,588,577 $7,571,740 $2,650,109 $39,752
Year 5 $5,756,235 $5,756,235 $2,014,682 $30,220
Year 6 $5,928,922 $5,928,922 $2,075,123 $31,127
Year 7 $6,106,789 $6,106,789 $2,137,376 $32,061
Year 8 $6,289,993 $6,289,993 $2,201,498 $33,022
Year 9 $6,478,693 $6,478,693 $2,267,543 $34,013
Year 10 $6,673,054 $6,673,054 $2,335,569 $35,034
Year 11 $6,873,245 $6,873,245 $2,405,636 $36,085
Year 12 $7 079 443 $7 079 443 $2 477 805 $37 167
Page 54
Year 12 $7,079,443 $7,079,443 $2,477,805 $37,167
Year 13 $7,291,826 $7,291,826 $2,552,139 $38,282
Year 14 $7,510,581 $7,510,581 $2,628,703 $39,431
Year 15 $7,735,898 $7,735,898 $2,707,564 $40,613
Year 16 $7,967,975 $7,967,975 $2,788,791 $41,832
Year 17 $8,207,014 $8,207,014 $2,872,455 $43,087
Year 18 $8,453,225 $8,453,225 $2,958,629 $44,379
Year 19 $8,706,822 $8,706,822 $3,047,388 $45,711
Year 20 $8,968,026 $8,968,026 $3,138,809 $47,082
Year 21 $9,237,067 $9,237,067 $3,232,973 $48,495
Year 22 $9,514,179 $9,514,179 $3,329,963 $49,949
Year 23 $9,799,604 $9,799,604 $3,429,862 $51,448
Year 24 $10,093,592 $10,093,592 $3,532,757 $52,991
Year 25 $10,396,400 $10,396,400 $3,638,740 $54,581
Total $184,438,602 $203,714,947 $71,300,231 $1,069,503
Page 54
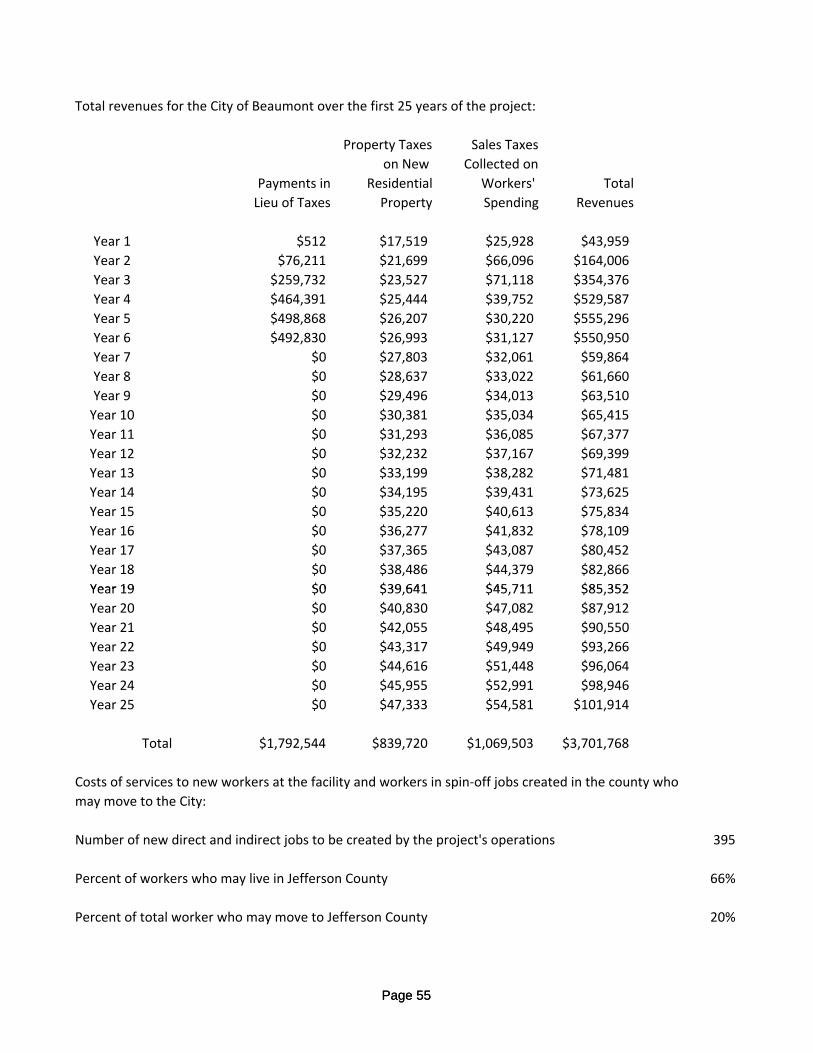
Total revenues for the City of Beaumont over the first 25 years of the project:
Property Taxes Sales Taxes
on New Collected on
Payments in Residential Workers' Total
Lieu of Taxes Property Spending Revenues
Year 1 $512 $17,519 $25,928 $43,959
Year 2 $76,211 $21,699 $66,096 $164,006
Year 3 $259,732 $23,527 $71,118 $354,376
Year 4 $464,391 $25,444 $39,752 $529,587
Year 5 $498,868 $26,207 $30,220 $555,296
Year 6 $492,830 $26,993 $31,127 $550,950
Year 7 $0 $27,803 $32,061 $59,864
Year 8 $0 $28,637 $33,022 $61,660
Year 9 $0 $29,496 $34,013 $63,510
Year 10 $0 $30,381 $35,034 $65,415
Year 11 $0 $31,293 $36,085 $67,377
Year 12 $0 $32,232 $37,167 $69,399
Year 13 $0 $33,199 $38,282 $71,481
Year 14 $0 $34,195 $39,431 $73,625
Year 15 $0 $35,220 $40,613 $75,834
Year 16 $0 $36,277 $41,832 $78,109
Year 17 $0 $37,365 $43,087 $80,452
Year 18 $0 $38,486 $44,379 $82,866
Year 19 $0 $39 641 $45 711 $85 352
Page 55
Year 19 $0 $39,641 $45,711 $85,352
Year 20 $0 $40,830 $47,082 $87,912
Year 21 $0 $42,055 $48,495 $90,550
Year 22 $0 $43,317 $49,949 $93,266
Year 23 $0 $44,616 $51,448 $96,064
Year 24 $0 $45,955 $52,991 $98,946
Year 25 $0 $47,333 $54,581 $101,914
Total $1,792,544 $839,720 $1,069,503 $3,701,768
Costs of services to new workers at the facility and workers in spin‐off jobs created in the county who
may move to the City:
Number of new direct and indirect jobs to be created by the project's operations 395
Percent of workers who may live in Jefferson County 66%
Percent of total worker who may move to Jefferson County 20%
Page 55
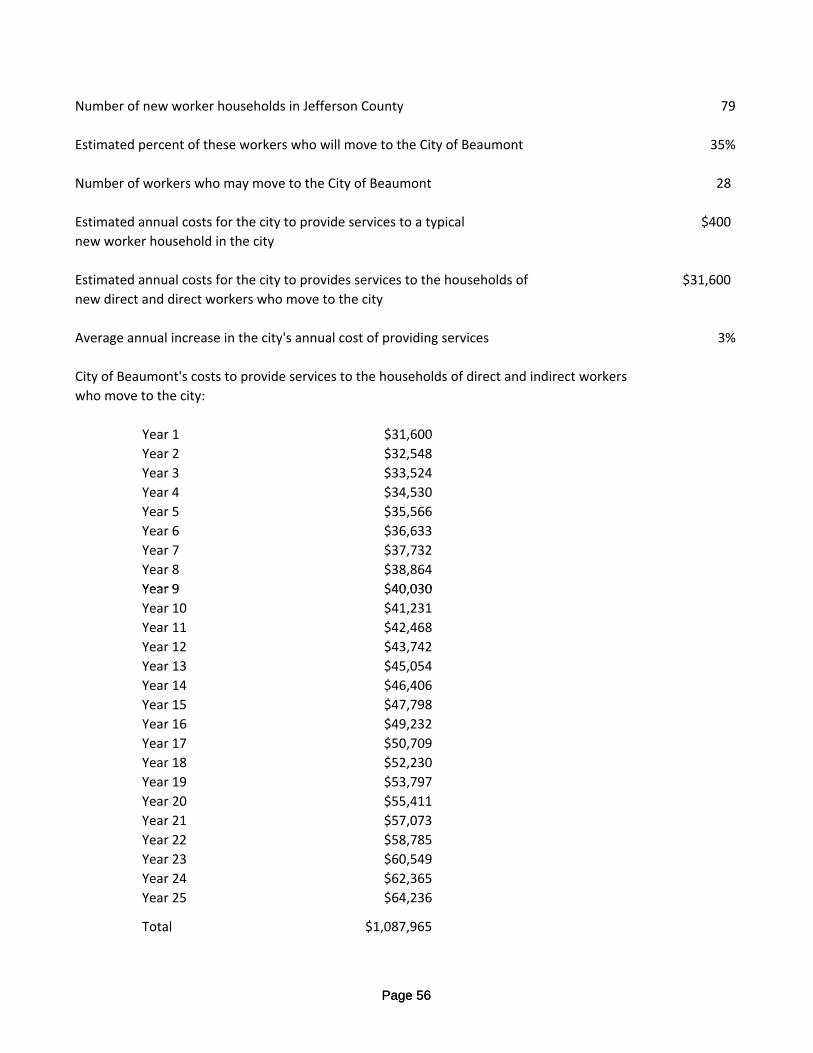
Number of new worker households in Jefferson County 79
Estimated percent of these workers who will move to the City of Beaumont 35%
Number of workers who may move to the City of Beaumont 28
Estimated annual costs for the city to provide services to a typical $400
new worker household in the city
Estimated annual costs for the city to provides services to the households of $31,600
new direct and direct workers who move to the city
Average annual increase in the city's annual cost of providing services 3%
City of Beaumont's costs to provide services to the households of direct and indirect workers
who move to the city:
Year 1 $31,600
Year 2 $32,548
Year 3 $33,524
Year 4 $34,530
Year 5 $35,566
Year 6 $36,633
Year 7 $37,732
Year 8 $38,864
Year 9 $40 030
Page 56
Year 9 $40,030
Year 10 $41,231
Year 11 $42,468
Year 12 $43,742
Year 13 $45,054
Year 14 $46,406
Year 15 $47,798
Year 16 $49,232
Year 17 $50,709
Year 18 $52,230
Year 19 $53,797
Year 20 $55,411
Year 21 $57,073
Year 22 $58,785
Year 23 $60,549
Year 24 $62,365
Year 25 $64,236
Total $1,087,965
Page 56
Appendix ERevenues for Beaumont ISD
Page 57Page 57
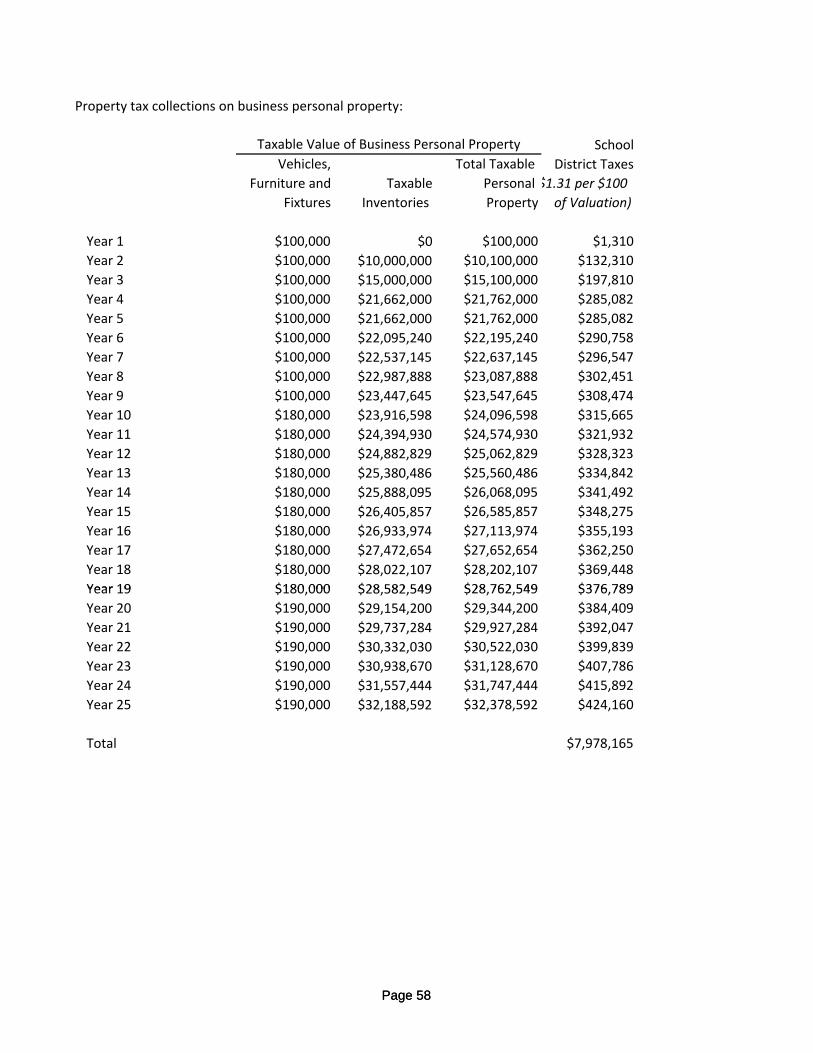
Property tax collections on business personal property:
School
Vehicles, Total Taxable District Taxes
Furniture and Taxable Personal $1.31 per $100
Fixtures Inventories Property of Valuation)
Year 1 $100,000 $0 $100,000 $1,310
Year 2 $100,000 $10,000,000 $10,100,000 $132,310
Year 3 $100,000 $15,000,000 $15,100,000 $197,810
Year 4 $100,000 $21,662,000 $21,762,000 $285,082
Year 5 $100,000 $21,662,000 $21,762,000 $285,082
Year 6 $100,000 $22,095,240 $22,195,240 $290,758
Year 7 $100,000 $22,537,145 $22,637,145 $296,547
Year 8 $100,000 $22,987,888 $23,087,888 $302,451
Year 9 $100,000 $23,447,645 $23,547,645 $308,474
Year 10 $180,000 $23,916,598 $24,096,598 $315,665
Year 11 $180,000 $24,394,930 $24,574,930 $321,932
Year 12 $180,000 $24,882,829 $25,062,829 $328,323
Year 13 $180,000 $25,380,486 $25,560,486 $334,842
Year 14 $180,000 $25,888,095 $26,068,095 $341,492
Year 15 $180,000 $26,405,857 $26,585,857 $348,275
Year 16 $180,000 $26,933,974 $27,113,974 $355,193
Year 17 $180,000 $27,472,654 $27,652,654 $362,250
Year 18 $180,000 $28,022,107 $28,202,107 $369,448
Year 19 $180 000 $28 582 549 $28 762 549 $376 789
Taxable Value of Business Personal Property
Page 58
Year 19 $180,000 $28,582,549 $28,762,549 $376,789
Year 20 $190,000 $29,154,200 $29,344,200 $384,409
Year 21 $190,000 $29,737,284 $29,927,284 $392,047
Year 22 $190,000 $30,332,030 $30,522,030 $399,839
Year 23 $190,000 $30,938,670 $31,128,670 $407,786
Year 24 $190,000 $31,557,444 $31,747,444 $415,892
Year 25 $190,000 $32,188,592 $32,378,592 $424,160
Total $7,978,165
Page 58
Possible School District Tax Abatement Under Texas Tax Code Chapter 313
Beaumont ISD may be asked for tax abatement or credits for the facility under the Texas Economic
Development Act. This abatement will begin in 2011 when the facility is fully placed on school district
tax rolls.
In 2001, the 77th Texas Legislature enacted House Bill 1200 creating Tax Code Chapter 313, Texas
Economic Development Act. This Act allows school districts to attract new taxable property by offering a tax
credit and an eight‐year limitation on the appraised value of a property for the maintenance and operations
portion of the school district property tax. The most recent adopted rules by the Texas Comptroller of
Public Accounts and forms for Chapter 313 were published in Texas Register June 18, 2010.
Qualification under the Act in Beaumont ISD would require the firm have an estimated minimum
qualified investment of $30 million. The firm's plans to invest $97 billion in the facility ‐‐ more than the
minimum qualified investment.
The tax limitation applies to property used in connection with manufacturing, research and development, and
renewable energy electric generation. The company's property qualifies for the tax limit since the firm
produces methacrylates.
The Act provides for a tax credit and appraised value limitation.
Tax Credit:
For the first two years after the finalization of an agreement, the company will pay school property tax on its
full‐appraised value.
Page 59
full‐appraised value.
However, the company may receive a credit for the property taxes paid on the portion of value exceeding the
investment limitation in the first two years. The credit would be granted by the school district in seven annual
installments beginning in the year following the approval of the application by the school district or in the
fourth year. The credit for any year could not exceed 50% of the year's property taxes imposed on the
qualified property.
Appraised Value Limitation:
In addition, beginning in the third year, and for a total of seven years, the appraised value of the property for
maintenance and operations property taxes will be capped at the lower of the investment limitation, as
determined by the total property wealth of the school district, or its market value.
Based on the requirements of Chapter 313, Beaumont ISD will collect taxes from the firm during the
first two years but the firm will receive a credit for these taxes collected on the firm's investment value
exceeding $30 million.
Page 59
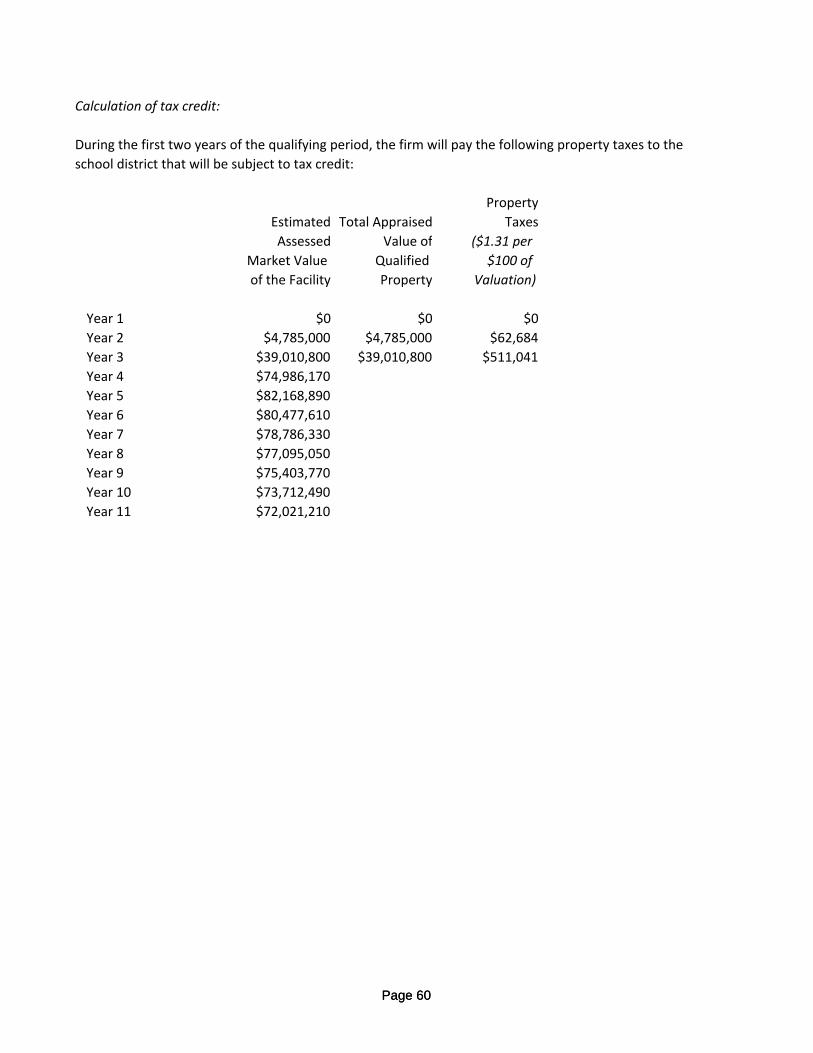
Calculation of tax credit:
During the first two years of the qualifying period, the firm will pay the following property taxes to the
school district that will be subject to tax credit:
Property
Estimated Total Appraised Taxes
Assessed Value of ($1.31 per
Market Value Qualified $100 of
of the Facility Property Valuation)
Year 1 $0 $0 $0
Year 2 $4,785,000 $4,785,000 $62,684
Year 3 $39,010,800 $39,010,800 $511,041
Year 4 $74,986,170
Year 5 $82,168,890
Year 6 $80,477,610
Year 7 $78,786,330
Year 8 $77,095,050
Year 9 $75,403,770
Year 10 $73,712,490
Year 11 $72,021,210
Page 60Page 60
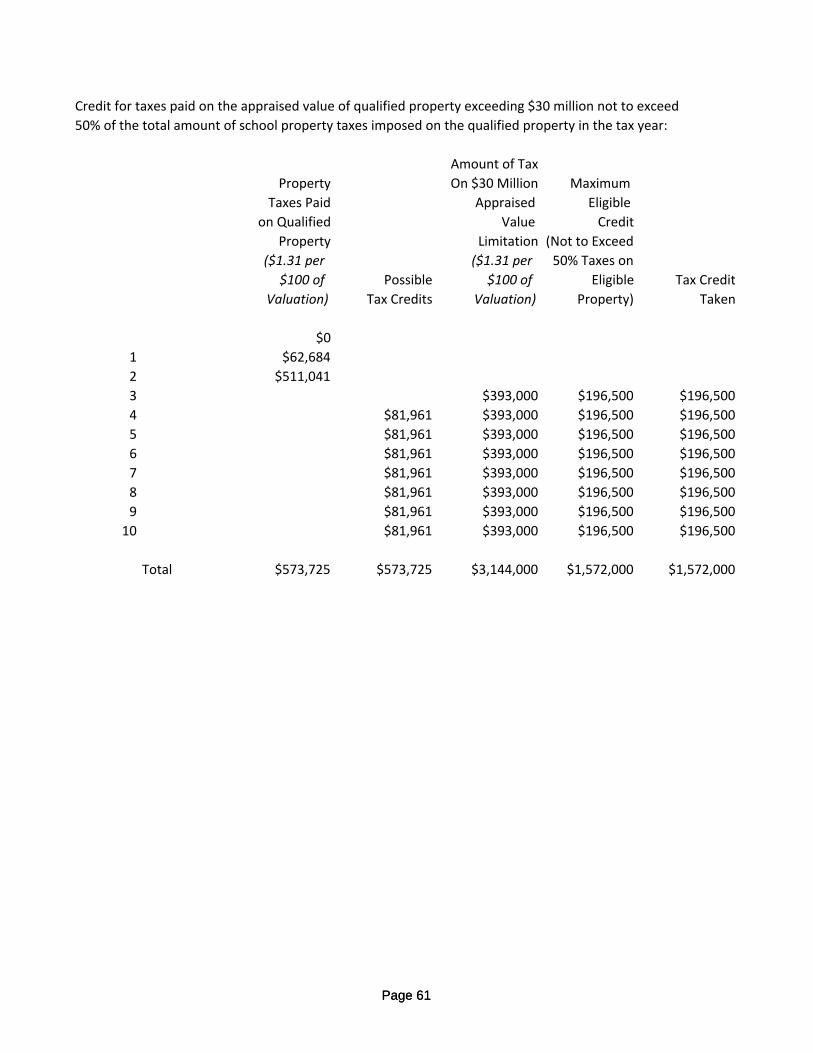
Credit for taxes paid on the appraised value of qualified property exceeding $30 million not to exceed
50% of the total amount of school property taxes imposed on the qualified property in the tax year:
Amount of Tax
Property On $30 Million Maximum
Taxes Paid Appraised Eligible
on Qualified Value Credit
Property Limitation (Not to Exceed
($1.31 per ($1.31 per 50% Taxes on
$100 of Possible $100 of Eligible Tax Credit
Valuation) Tax Credits Valuation) Property) Taken
$0
1 $62,684
2 $511,041
3 $393,000 $196,500 $196,500
4 $81,961 $393,000 $196,500 $196,500
5 $81,961 $393,000 $196,500 $196,500
6 $81,961 $393,000 $196,500 $196,500
7 $81,961 $393,000 $196,500 $196,500
8 $81,961 $393,000 $196,500 $196,500
9 $81,961 $393,000 $196,500 $196,500
10 $81,961 $393,000 $196,500 $196,500
Total $573,725 $573,725 $3,144,000 $1,572,000 $1,572,000
Page 61Page 61
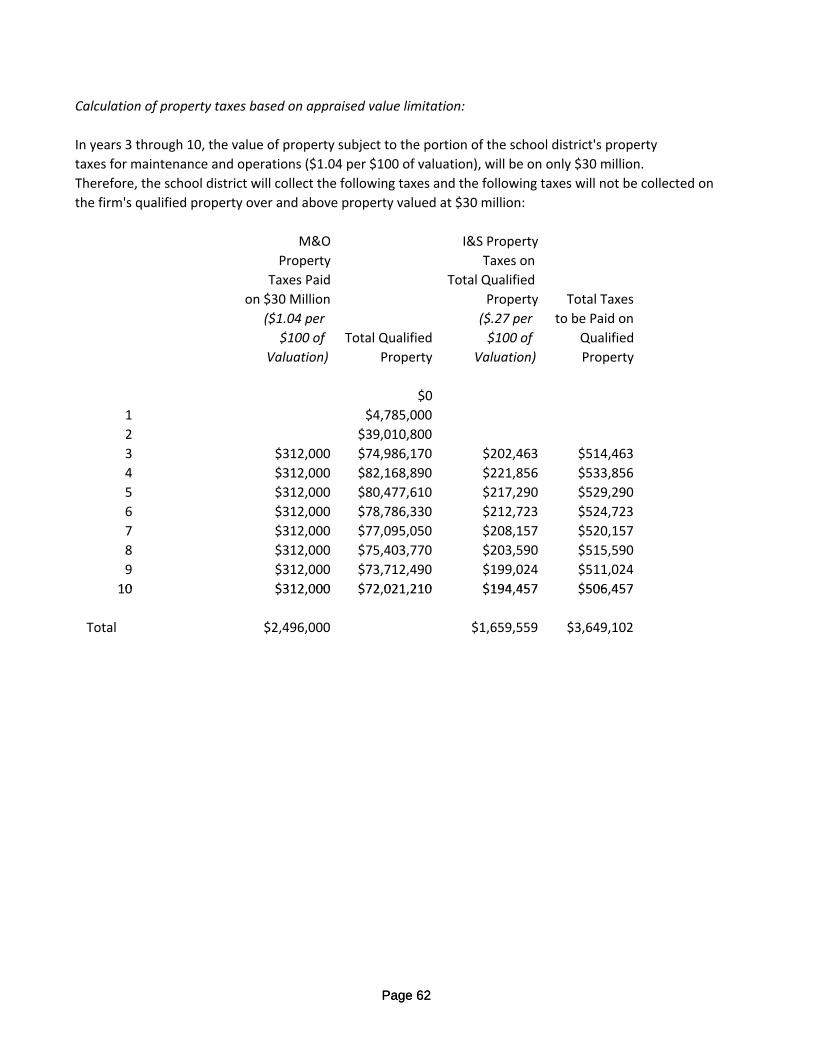
Calculation of property taxes based on appraised value limitation:
In years 3 through 10, the value of property subject to the portion of the school district's property
taxes for maintenance and operations ($1.04 per $100 of valuation), will be on only $30 million.
Therefore, the school district will collect the following taxes and the following taxes will not be collected on
the firm's qualified property over and above property valued at $30 million:
M&O I&S Property
Property Taxes on
Taxes Paid Total Qualified
on $30 Million Property Total Taxes
($1.04 per ($.27 per to be Paid on
$100 of Total Qualified $100 of Qualified
Valuation) Property Valuation) Property
$0
1 $4,785,000
2 $39,010,800
3 $312,000 $74,986,170 $202,463 $514,463
4 $312,000 $82,168,890 $221,856 $533,856
5 $312,000 $80,477,610 $217,290 $529,290
6 $312,000 $78,786,330 $212,723 $524,723
7 $312,000 $77,095,050 $208,157 $520,157
8 $312,000 $75,403,770 $203,590 $515,590
9 $312,000 $73,712,490 $199,024 $511,024
10 $312 000 $72 021 210 $194 457 $506 457
Page 62
10 $312,000 $72,021,210 $194,457 $506,457
Total $2,496,000 $1,659,559 $3,649,102
Page 62
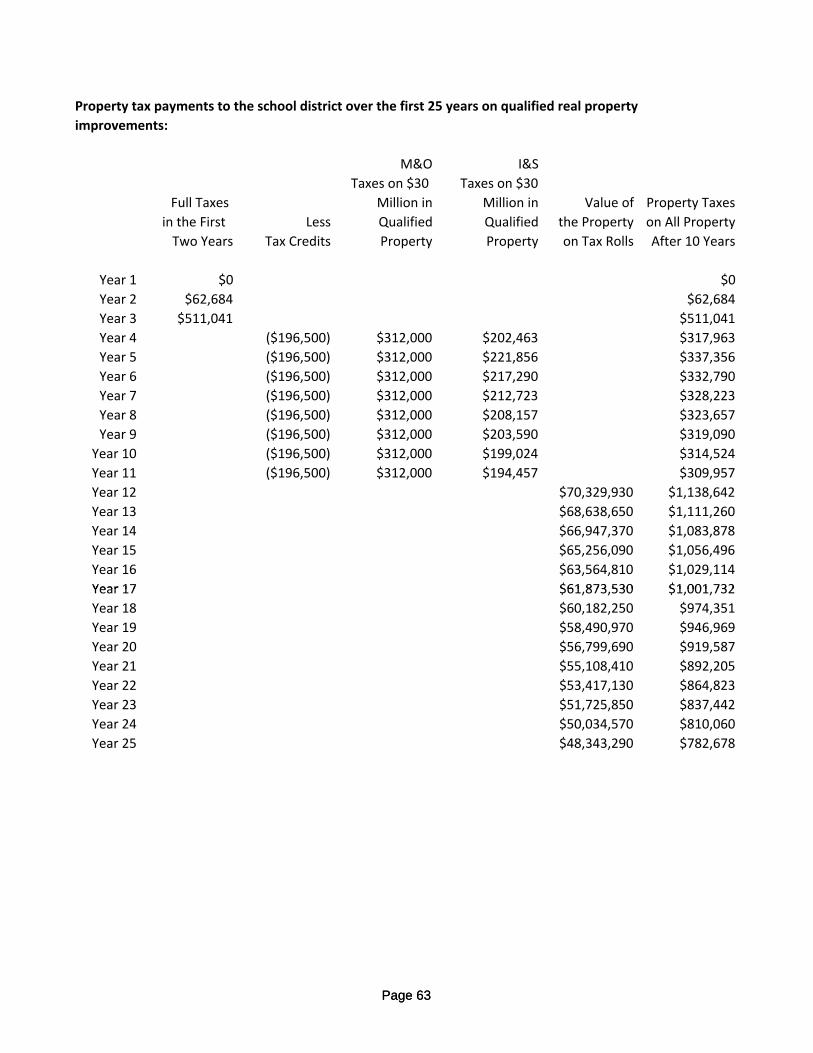
Property tax payments to the school district over the first 25 years on qualified real property
improvements:
M&O I&S
Taxes on $30 Taxes on $30
Full Taxes Million in Million in Value of Property Taxes
in the First Less Qualified Qualified the Property on All Property
Two Years Tax Credits Property Property on Tax Rolls After 10 Years
Year 1 $0 $0
Year 2 $62,684 $62,684
Year 3 $511,041 $511,041
Year 4 ($196,500) $312,000 $202,463 $317,963
Year 5 ($196,500) $312,000 $221,856 $337,356
Year 6 ($196,500) $312,000 $217,290 $332,790
Year 7 ($196,500) $312,000 $212,723 $328,223
Year 8 ($196,500) $312,000 $208,157 $323,657
Year 9 ($196,500) $312,000 $203,590 $319,090
Year 10 ($196,500) $312,000 $199,024 $314,524
Year 11 ($196,500) $312,000 $194,457 $309,957
Year 12 $70,329,930 $1,138,642
Year 13 $68,638,650 $1,111,260
Year 14 $66,947,370 $1,083,878
Year 15 $65,256,090 $1,056,496
Year 16 $63,564,810 $1,029,114
Year 17 $61 873 530 $1 001 732
Page 63
Year 17 $61,873,530 $1,001,732
Year 18 $60,182,250 $974,351
Year 19 $58,490,970 $946,969
Year 20 $56,799,690 $919,587
Year 21 $55,108,410 $892,205
Year 22 $53,417,130 $864,823
Year 23 $51,725,850 $837,442
Year 24 $50,034,570 $810,060
Year 25 $48,343,290 $782,678
Page 63
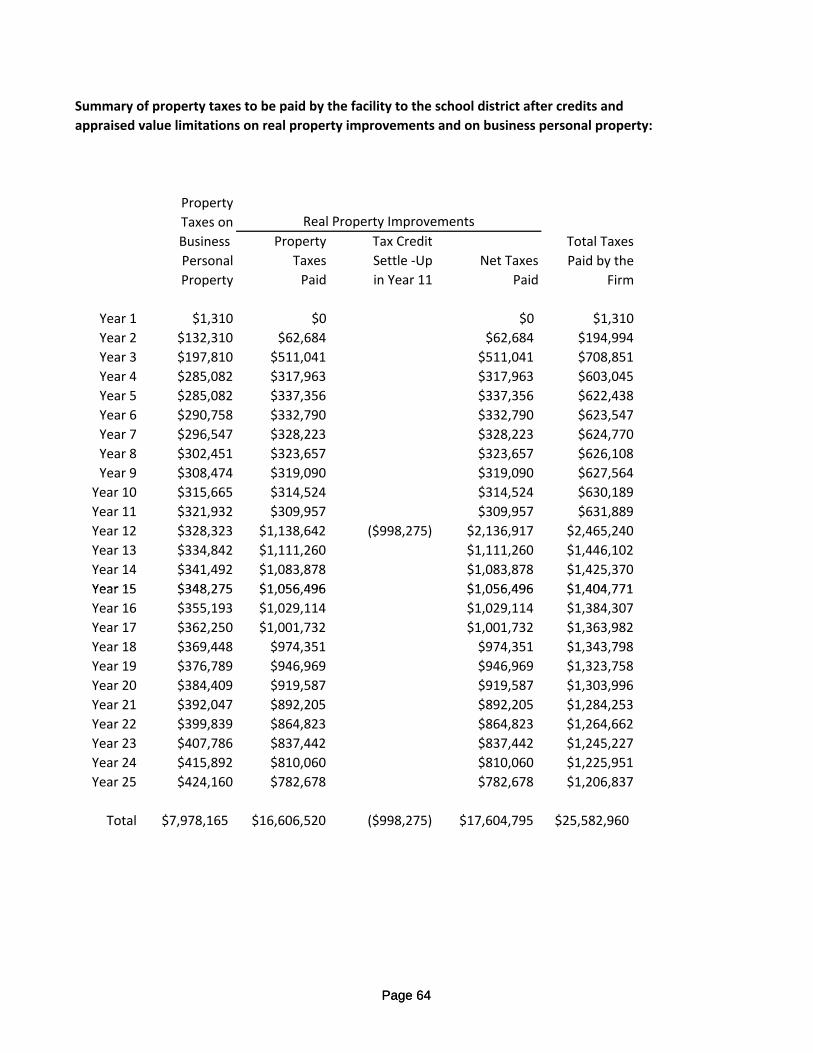
Summary of property taxes to be paid by the facility to the school district after credits and
appraised value limitations on real property improvements and on business personal property:
Property
Taxes on
Business Property Tax Credit Total Taxes
Personal Taxes Settle ‐Up Net Taxes Paid by the
Property Paid in Year 11 Paid Firm
Year 1 $1,310 $0 $0 $1,310
Year 2 $132,310 $62,684 $62,684 $194,994
Year 3 $197,810 $511,041 $511,041 $708,851
Year 4 $285,082 $317,963 $317,963 $603,045
Year 5 $285,082 $337,356 $337,356 $622,438
Year 6 $290,758 $332,790 $332,790 $623,547
Year 7 $296,547 $328,223 $328,223 $624,770
Year 8 $302,451 $323,657 $323,657 $626,108
Year 9 $308,474 $319,090 $319,090 $627,564
Year 10 $315,665 $314,524 $314,524 $630,189
Year 11 $321,932 $309,957 $309,957 $631,889
Year 12 $328,323 $1,138,642 ($998,275) $2,136,917 $2,465,240
Year 13 $334,842 $1,111,260 $1,111,260 $1,446,102
Year 14 $341,492 $1,083,878 $1,083,878 $1,425,370
Year 15 $348 275 $1 056 496 $1 056 496 $1 404 771
Real Property Improvements
Page 64
Year 15 $348,275 $1,056,496 $1,056,496 $1,404,771
Year 16 $355,193 $1,029,114 $1,029,114 $1,384,307
Year 17 $362,250 $1,001,732 $1,001,732 $1,363,982
Year 18 $369,448 $974,351 $974,351 $1,343,798
Year 19 $376,789 $946,969 $946,969 $1,323,758
Year 20 $384,409 $919,587 $919,587 $1,303,996
Year 21 $392,047 $892,205 $892,205 $1,284,253
Year 22 $399,839 $864,823 $864,823 $1,264,662
Year 23 $407,786 $837,442 $837,442 $1,245,227
Year 24 $415,892 $810,060 $810,060 $1,225,951
Year 25 $424,160 $782,678 $782,678 $1,206,837
Total $7,978,165 $16,606,520 ($998,275) $17,604,795 $25,582,960
Page 64
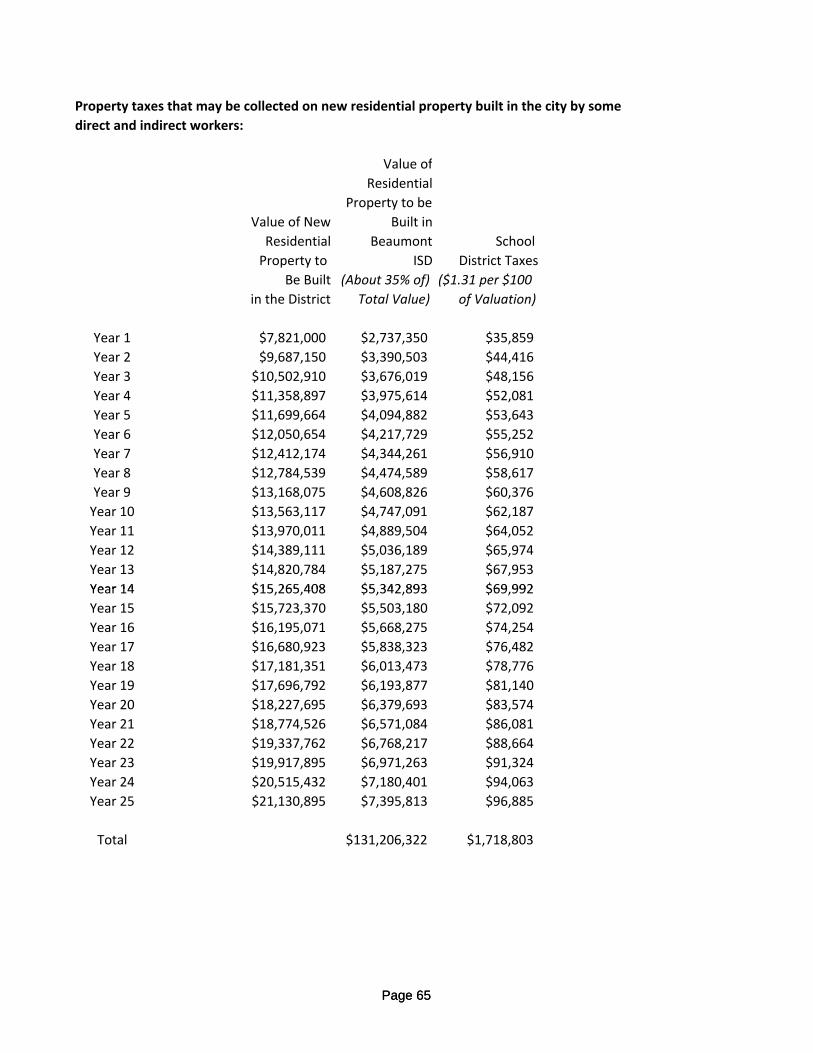
Property taxes that may be collected on new residential property built in the city by some
direct and indirect workers:
Value of
Residential
Property to be
Value of New Built in
Residential Beaumont School
Property to ISD District Taxes
Be Built (About 35% of) ($1.31 per $100
in the District Total Value) of Valuation)
Year 1 $7,821,000 $2,737,350 $35,859
Year 2 $9,687,150 $3,390,503 $44,416
Year 3 $10,502,910 $3,676,019 $48,156
Year 4 $11,358,897 $3,975,614 $52,081
Year 5 $11,699,664 $4,094,882 $53,643
Year 6 $12,050,654 $4,217,729 $55,252
Year 7 $12,412,174 $4,344,261 $56,910
Year 8 $12,784,539 $4,474,589 $58,617
Year 9 $13,168,075 $4,608,826 $60,376
Year 10 $13,563,117 $4,747,091 $62,187
Year 11 $13,970,011 $4,889,504 $64,052
Year 12 $14,389,111 $5,036,189 $65,974
Year 13 $14,820,784 $5,187,275 $67,953
Year 14 $15 265 408 $5 342 893 $69 992
Page 65
Year 14 $15,265,408 $5,342,893 $69,992
Year 15 $15,723,370 $5,503,180 $72,092
Year 16 $16,195,071 $5,668,275 $74,254
Year 17 $16,680,923 $5,838,323 $76,482
Year 18 $17,181,351 $6,013,473 $78,776
Year 19 $17,696,792 $6,193,877 $81,140
Year 20 $18,227,695 $6,379,693 $83,574
Year 21 $18,774,526 $6,571,084 $86,081
Year 22 $19,337,762 $6,768,217 $88,664
Year 23 $19,917,895 $6,971,263 $91,324
Year 24 $20,515,432 $7,180,401 $94,063
Year 25 $21,130,895 $7,395,813 $96,885
Total $131,206,322 $1,718,803
Page 65
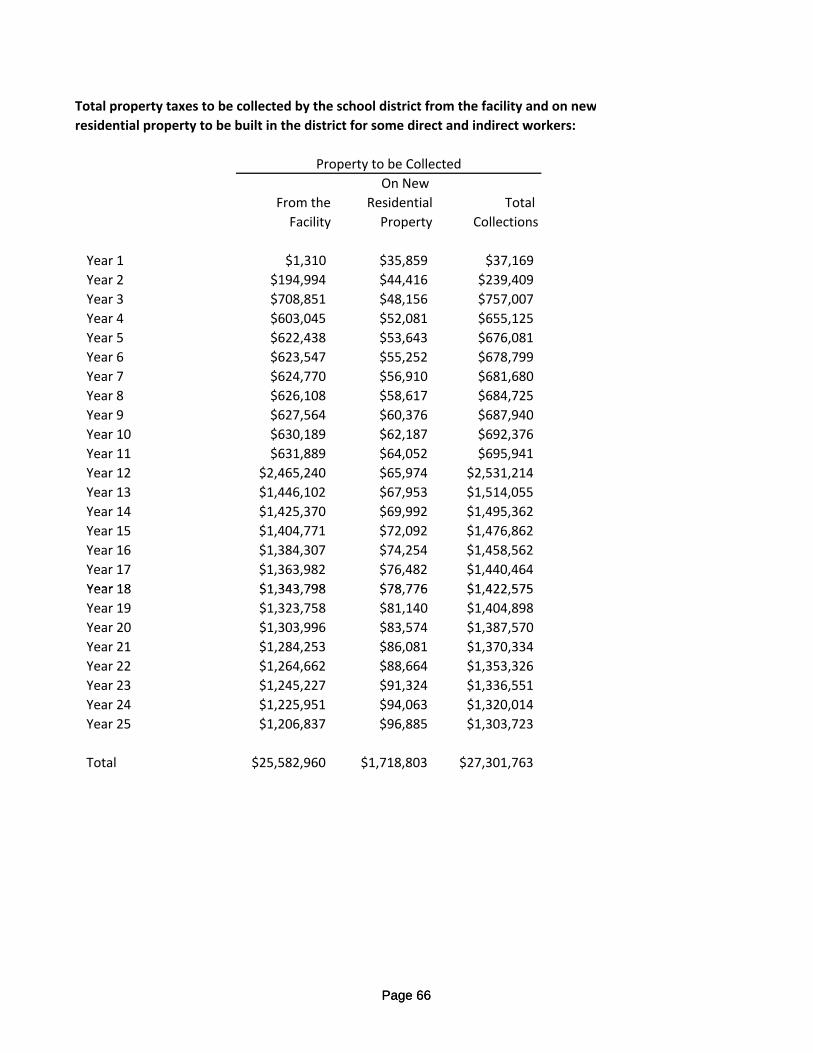
Total property taxes to be collected by the school district from the facility and on new
residential property to be built in the district for some direct and indirect workers:
On New
From the Residential Total
Facility Property Collections
Year 1 $1,310 $35,859 $37,169
Year 2 $194,994 $44,416 $239,409
Year 3 $708,851 $48,156 $757,007
Year 4 $603,045 $52,081 $655,125
Year 5 $622,438 $53,643 $676,081
Year 6 $623,547 $55,252 $678,799
Year 7 $624,770 $56,910 $681,680
Year 8 $626,108 $58,617 $684,725
Year 9 $627,564 $60,376 $687,940
Year 10 $630,189 $62,187 $692,376
Year 11 $631,889 $64,052 $695,941
Year 12 $2,465,240 $65,974 $2,531,214
Year 13 $1,446,102 $67,953 $1,514,055
Year 14 $1,425,370 $69,992 $1,495,362
Year 15 $1,404,771 $72,092 $1,476,862
Year 16 $1,384,307 $74,254 $1,458,562
Year 17 $1,363,982 $76,482 $1,440,464
Year 18 $1 343 798 $78 776 $1 422 575
Property to be Collected
Page 66
Year 18 $1,343,798 $78,776 $1,422,575
Year 19 $1,323,758 $81,140 $1,404,898
Year 20 $1,303,996 $83,574 $1,387,570
Year 21 $1,284,253 $86,081 $1,370,334
Year 22 $1,264,662 $88,664 $1,353,326
Year 23 $1,245,227 $91,324 $1,336,551
Year 24 $1,225,951 $94,063 $1,320,014
Year 25 $1,206,837 $96,885 $1,303,723
Total $25,582,960 $1,718,803 $27,301,763
Page 66
Appendix FRevenues for the Port of Beaumont
Page 67Page 67

Property tax collections on business personal property:
Vehicles, Total Taxable Total Taxes
Furniture and Taxable Personal $.074 per $100
Fixtures Inventories Property of Valuation)
Year 1 $100,000 $0 $100,000 $74
Year 2 $100,000 $10,000,000 $10,100,000 $7,477
Year 3 $100,000 $15,000,000 $15,100,000 $11,178
Year 4 $100,000 $21,662,000 $21,762,000 $16,109
Year 5 $100,000 $21,662,000 $21,762,000 $16,109
Year 6 $100,000 $22,095,240 $22,195,240 $16,430
Year 7 $100,000 $22,537,145 $22,637,145 $16,757
Year 8 $100,000 $22,987,888 $23,087,888 $17,091
Year 9 $100,000 $23,447,645 $23,547,645 $17,431
Year 10 $180,000 $23,916,598 $24,096,598 $17,838
Year 11 $180,000 $24,394,930 $24,574,930 $18,192
Year 12 $180,000 $24,882,829 $25,062,829 $18,553
Year 13 $180,000 $25,380,486 $25,560,486 $18,921
Year 14 $180,000 $25,888,095 $26,068,095 $19,297
Year 15 $180,000 $26,405,857 $26,585,857 $19,680
Year 16 $180,000 $26,933,974 $27,113,974 $20,071
Year 17 $180,000 $27,472,654 $27,652,654 $20,470
Year 18 $180,000 $28,022,107 $28,202,107 $20,877
Year 19 $180 000 $28 582 549 $28 762 549 $21 291
Taxable Value of Business Personal Property
Page 68
Year 19 $180,000 $28,582,549 $28,762,549 $21,291
Year 20 $190,000 $29,154,200 $29,344,200 $21,722
Year 21 $190,000 $29,737,284 $29,927,284 $22,154
Year 22 $190,000 $30,332,030 $30,522,030 $22,594
Year 23 $190,000 $30,938,670 $31,128,670 $23,043
Year 24 $190,000 $31,557,444 $31,747,444 $23,501
Year 25 $190,000 $32,188,592 $32,378,592 $23,968
Total $450,827
Page 68
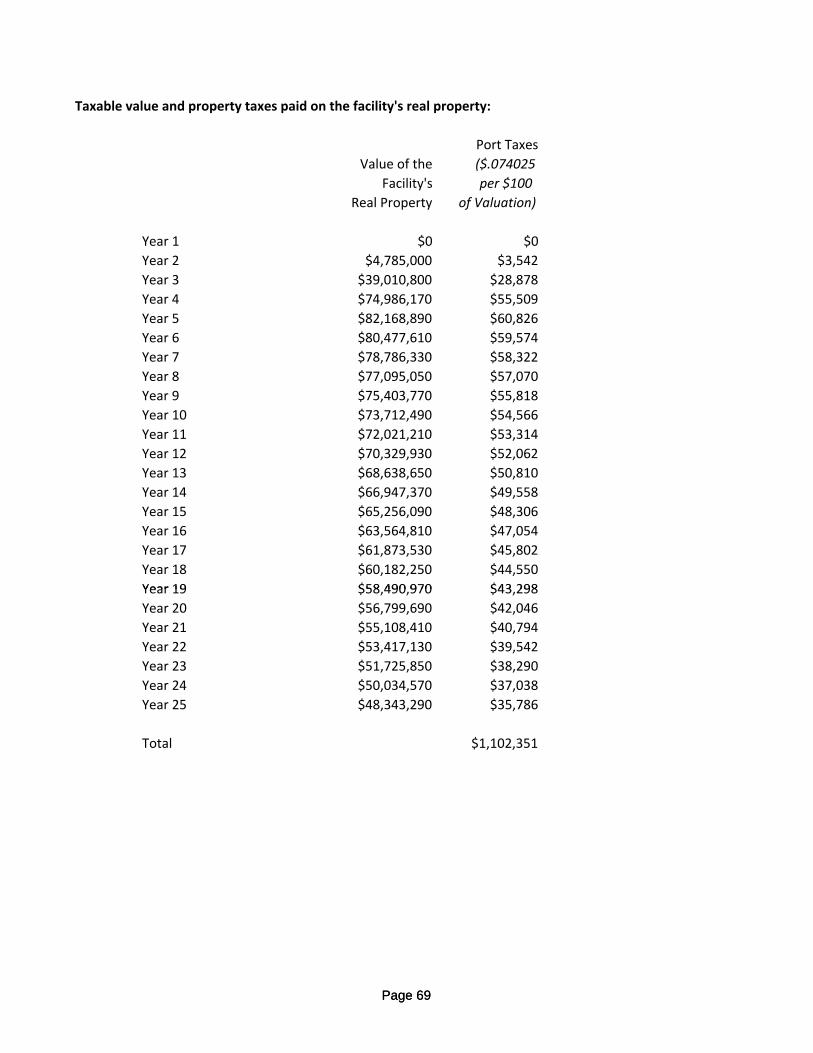
Taxable value and property taxes paid on the facility's real property:
Port Taxes
Value of the ($.074025
Facility's per $100
Real Property of Valuation)
Year 1 $0 $0
Year 2 $4,785,000 $3,542
Year 3 $39,010,800 $28,878
Year 4 $74,986,170 $55,509
Year 5 $82,168,890 $60,826
Year 6 $80,477,610 $59,574
Year 7 $78,786,330 $58,322
Year 8 $77,095,050 $57,070
Year 9 $75,403,770 $55,818
Year 10 $73,712,490 $54,566
Year 11 $72,021,210 $53,314
Year 12 $70,329,930 $52,062
Year 13 $68,638,650 $50,810
Year 14 $66,947,370 $49,558
Year 15 $65,256,090 $48,306
Year 16 $63,564,810 $47,054
Year 17 $61,873,530 $45,802
Year 18 $60,182,250 $44,550
Year 19 $58 490 970 $43 298
Page 69
Year 19 $58,490,970 $43,298
Year 20 $56,799,690 $42,046
Year 21 $55,108,410 $40,794
Year 22 $53,417,130 $39,542
Year 23 $51,725,850 $38,290
Year 24 $50,034,570 $37,038
Year 25 $48,343,290 $35,786
Total $1,102,351
Page 69
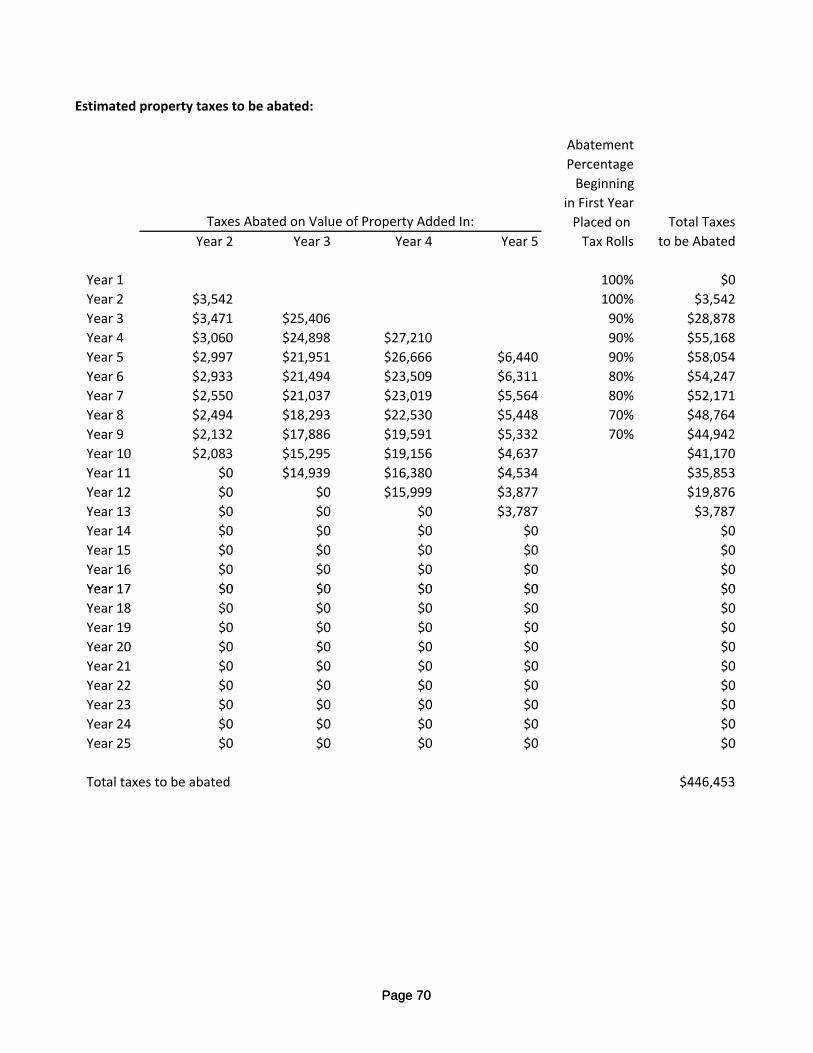
Estimated property taxes to be abated:
Abatement
Percentage
Beginning
in First Year
Placed on Total Taxes
Year 2 Year 3 Year 4 Year 5 Tax Rolls to be Abated
Year 1 100% $0
Year 2 $3,542 100% $3,542
Year 3 $3,471 $25,406 90% $28,878
Year 4 $3,060 $24,898 $27,210 90% $55,168
Year 5 $2,997 $21,951 $26,666 $6,440 90% $58,054
Year 6 $2,933 $21,494 $23,509 $6,311 80% $54,247
Year 7 $2,550 $21,037 $23,019 $5,564 80% $52,171
Year 8 $2,494 $18,293 $22,530 $5,448 70% $48,764
Year 9 $2,132 $17,886 $19,591 $5,332 70% $44,942
Year 10 $2,083 $15,295 $19,156 $4,637 $41,170
Year 11 $0 $14,939 $16,380 $4,534 $35,853
Year 12 $0 $0 $15,999 $3,877 $19,876
Year 13 $0 $0 $0 $3,787 $3,787
Year 14 $0 $0 $0 $0 $0
Year 15 $0 $0 $0 $0 $0
Year 16 $0 $0 $0 $0 $0
Year 17 $0 $0 $0 $0 $0
Taxes Abated on Value of Property Added In:
Page 70
Year 17 $0 $0 $0 $0 $0
Year 18 $0 $0 $0 $0 $0
Year 19 $0 $0 $0 $0 $0
Year 20 $0 $0 $0 $0 $0
Year 21 $0 $0 $0 $0 $0
Year 22 $0 $0 $0 $0 $0
Year 23 $0 $0 $0 $0 $0
Year 24 $0 $0 $0 $0 $0
Year 25 $0 $0 $0 $0 $0
Total taxes to be abated $446,453
Page 70
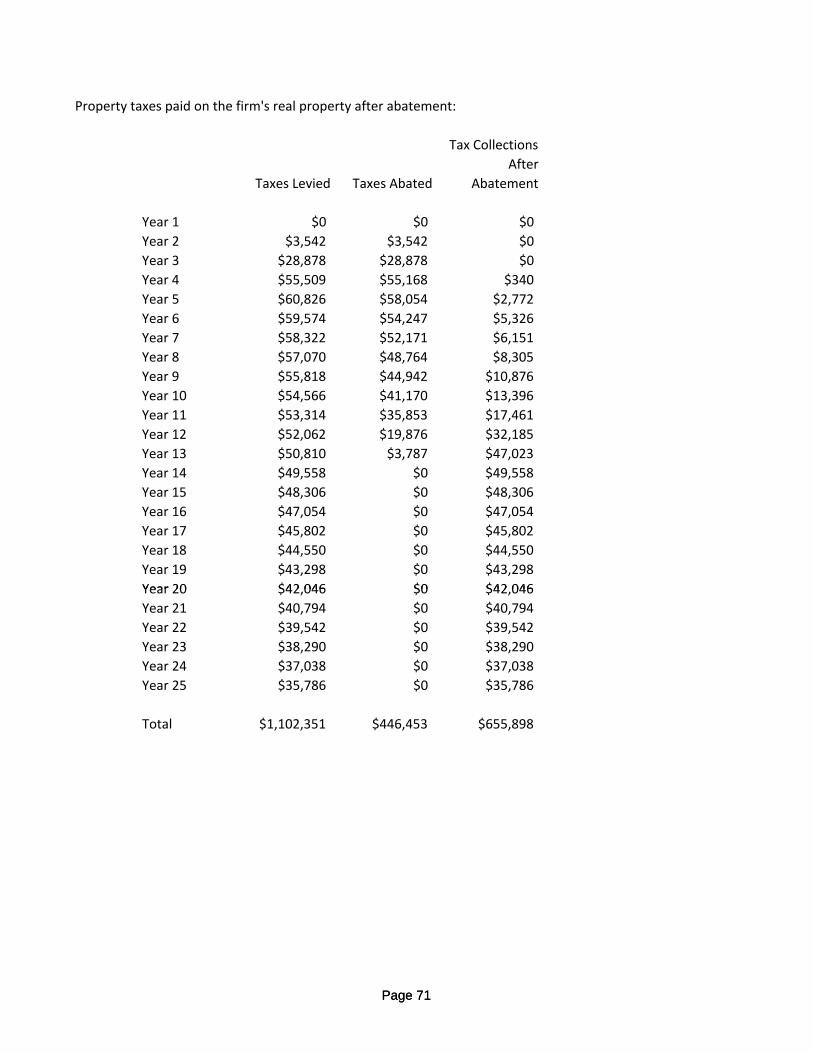
Property taxes paid on the firm's real property after abatement:
Tax Collections
After
Taxes Levied Taxes Abated Abatement
Year 1 $0 $0 $0
Year 2 $3,542 $3,542 $0
Year 3 $28,878 $28,878 $0
Year 4 $55,509 $55,168 $340
Year 5 $60,826 $58,054 $2,772
Year 6 $59,574 $54,247 $5,326
Year 7 $58,322 $52,171 $6,151
Year 8 $57,070 $48,764 $8,305
Year 9 $55,818 $44,942 $10,876
Year 10 $54,566 $41,170 $13,396
Year 11 $53,314 $35,853 $17,461
Year 12 $52,062 $19,876 $32,185
Year 13 $50,810 $3,787 $47,023
Year 14 $49,558 $0 $49,558
Year 15 $48,306 $0 $48,306
Year 16 $47,054 $0 $47,054
Year 17 $45,802 $0 $45,802
Year 18 $44,550 $0 $44,550
Year 19 $43,298 $0 $43,298
Year 20 $42 046 $0 $42 046
Page 71
Year 20 $42,046 $0 $42,046
Year 21 $40,794 $0 $40,794
Year 22 $39,542 $0 $39,542
Year 23 $38,290 $0 $38,290
Year 24 $37,038 $0 $37,038
Year 25 $35,786 $0 $35,786
Total $1,102,351 $446,453 $655,898
Page 71
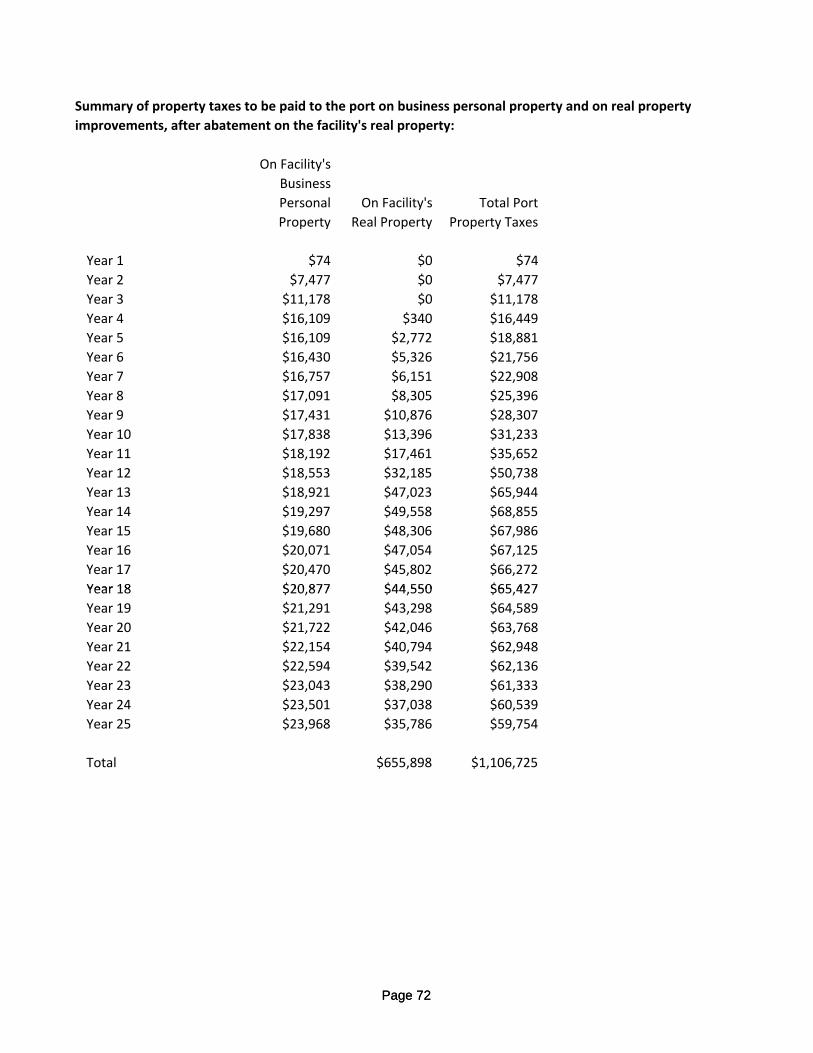
Summary of property taxes to be paid to the port on business personal property and on real property
improvements, after abatement on the facility's real property:
On Facility's
Business
Personal On Facility's Total Port
Property Real Property Property Taxes
Year 1 $74 $0 $74
Year 2 $7,477 $0 $7,477
Year 3 $11,178 $0 $11,178
Year 4 $16,109 $340 $16,449
Year 5 $16,109 $2,772 $18,881
Year 6 $16,430 $5,326 $21,756
Year 7 $16,757 $6,151 $22,908
Year 8 $17,091 $8,305 $25,396
Year 9 $17,431 $10,876 $28,307
Year 10 $17,838 $13,396 $31,233
Year 11 $18,192 $17,461 $35,652
Year 12 $18,553 $32,185 $50,738
Year 13 $18,921 $47,023 $65,944
Year 14 $19,297 $49,558 $68,855
Year 15 $19,680 $48,306 $67,986
Year 16 $20,071 $47,054 $67,125
Year 17 $20,470 $45,802 $66,272
Year 18 $20 877 $44 550 $65 427
Page 72
Year 18 $20,877 $44,550 $65,427
Year 19 $21,291 $43,298 $64,589
Year 20 $21,722 $42,046 $63,768
Year 21 $22,154 $40,794 $62,948
Year 22 $22,594 $39,542 $62,136
Year 23 $23,043 $38,290 $61,333
Year 24 $23,501 $37,038 $60,539
Year 25 $23,968 $35,786 $59,754
Total $655,898 $1,106,725
Page 72
Appendix GRevenues for Sabine ‐ Neches Navigation District
Page 73Page 73
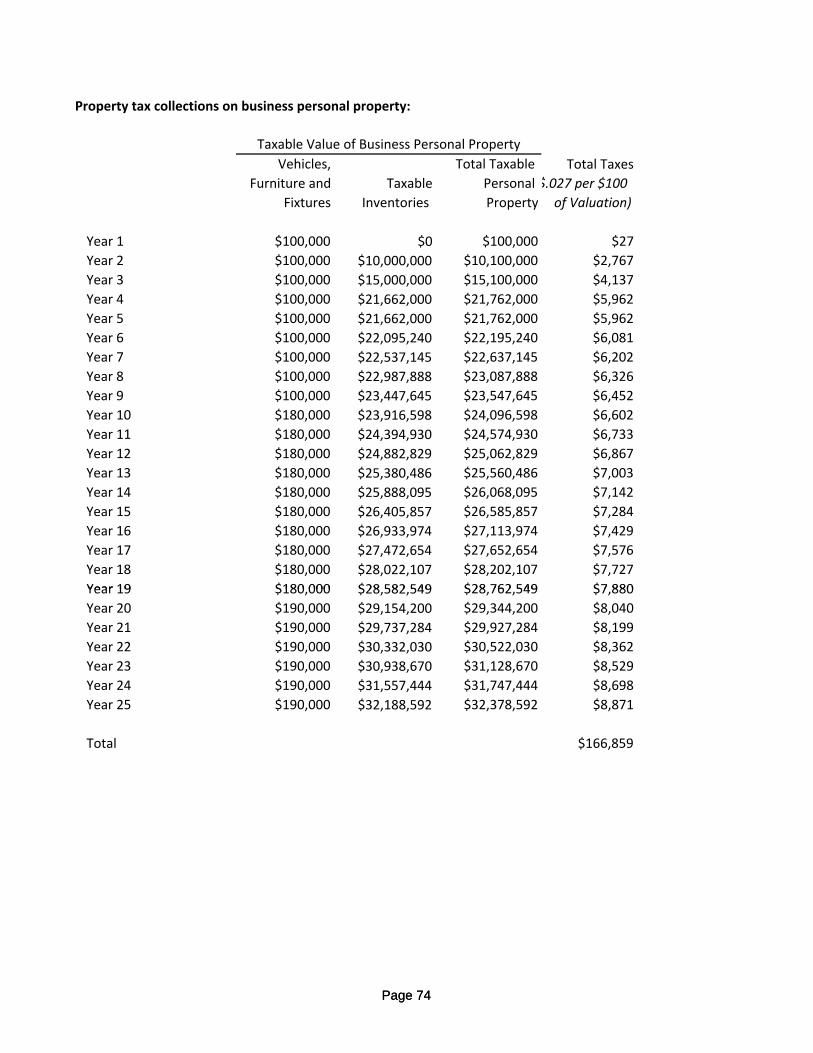
Property tax collections on business personal property:
Vehicles, Total Taxable Total Taxes
Furniture and Taxable Personal $.027 per $100
Fixtures Inventories Property of Valuation)
Year 1 $100,000 $0 $100,000 $27
Year 2 $100,000 $10,000,000 $10,100,000 $2,767
Year 3 $100,000 $15,000,000 $15,100,000 $4,137
Year 4 $100,000 $21,662,000 $21,762,000 $5,962
Year 5 $100,000 $21,662,000 $21,762,000 $5,962
Year 6 $100,000 $22,095,240 $22,195,240 $6,081
Year 7 $100,000 $22,537,145 $22,637,145 $6,202
Year 8 $100,000 $22,987,888 $23,087,888 $6,326
Year 9 $100,000 $23,447,645 $23,547,645 $6,452
Year 10 $180,000 $23,916,598 $24,096,598 $6,602
Year 11 $180,000 $24,394,930 $24,574,930 $6,733
Year 12 $180,000 $24,882,829 $25,062,829 $6,867
Year 13 $180,000 $25,380,486 $25,560,486 $7,003
Year 14 $180,000 $25,888,095 $26,068,095 $7,142
Year 15 $180,000 $26,405,857 $26,585,857 $7,284
Year 16 $180,000 $26,933,974 $27,113,974 $7,429
Year 17 $180,000 $27,472,654 $27,652,654 $7,576
Year 18 $180,000 $28,022,107 $28,202,107 $7,727
Year 19 $180 000 $28 582 549 $28 762 549 $7 880
Taxable Value of Business Personal Property
Page 74
Year 19 $180,000 $28,582,549 $28,762,549 $7,880
Year 20 $190,000 $29,154,200 $29,344,200 $8,040
Year 21 $190,000 $29,737,284 $29,927,284 $8,199
Year 22 $190,000 $30,332,030 $30,522,030 $8,362
Year 23 $190,000 $30,938,670 $31,128,670 $8,529
Year 24 $190,000 $31,557,444 $31,747,444 $8,698
Year 25 $190,000 $32,188,592 $32,378,592 $8,871
Total $166,859
Page 74
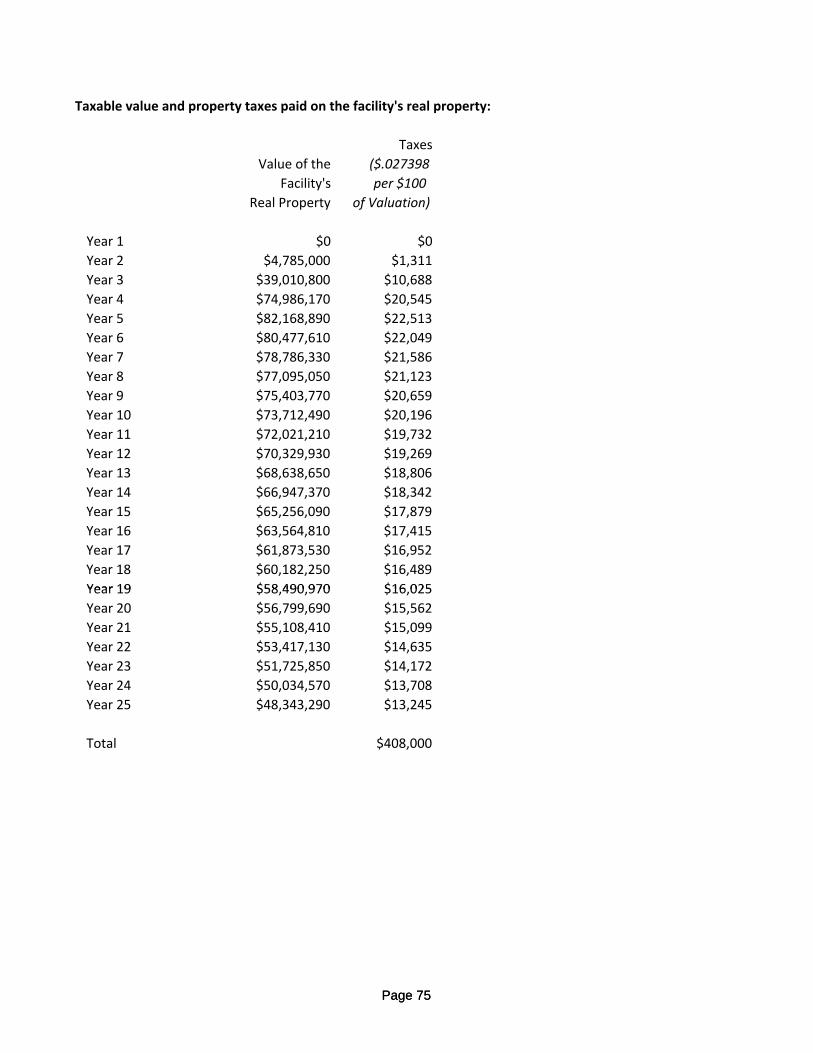
Taxable value and property taxes paid on the facility's real property:
Taxes
Value of the ($.027398
Facility's per $100
Real Property of Valuation)
Year 1 $0 $0
Year 2 $4,785,000 $1,311
Year 3 $39,010,800 $10,688
Year 4 $74,986,170 $20,545
Year 5 $82,168,890 $22,513
Year 6 $80,477,610 $22,049
Year 7 $78,786,330 $21,586
Year 8 $77,095,050 $21,123
Year 9 $75,403,770 $20,659
Year 10 $73,712,490 $20,196
Year 11 $72,021,210 $19,732
Year 12 $70,329,930 $19,269
Year 13 $68,638,650 $18,806
Year 14 $66,947,370 $18,342
Year 15 $65,256,090 $17,879
Year 16 $63,564,810 $17,415
Year 17 $61,873,530 $16,952
Year 18 $60,182,250 $16,489
Year 19 $58 490 970 $16 025
Page 75
Year 19 $58,490,970 $16,025
Year 20 $56,799,690 $15,562
Year 21 $55,108,410 $15,099
Year 22 $53,417,130 $14,635
Year 23 $51,725,850 $14,172
Year 24 $50,034,570 $13,708
Year 25 $48,343,290 $13,245
Total $408,000
Page 75

Estimated property taxes to be abated:
Abatement
Percentage
Beginning
in First Year
Placed on Total Taxes
Year 2 Year 3 Year 4 Year 5 Tax Rolls to be Abated
Year 1 100% $0
Year 2 $1,311 100% $1,311
Year 3 $1,285 $9,403 90% $10,688
Year 4 $1,133 $9,215 $10,071 90% $20,419
Year 5 $1,109 $8,125 $9,869 $2,384 90% $21,487
Year 6 $1,086 $7,955 $8,701 $2,336 80% $20,078
Year 7 $944 $7,786 $8,520 $2,059 80% $19,309
Year 8 $923 $6,770 $8,339 $2,017 70% $18,049
Year 9 $789 $6,620 $7,251 $1,974 70% $16,634
Year 10 $771 $5,661 $7,090 $1,716 $15,238
Year 11 $0 $5,529 $6,063 $1,678 $13,270
Year 12 $0 $0 $5,922 $1,435 $7,357
Year 13 $0 $0 $0 $1,402 $1,402
Year 14 $0 $0 $0 $0 $0
Year 15 $0 $0 $0 $0 $0
Year 16 $0 $0 $0 $0 $0
Year 17 $0 $0 $0 $0 $0
Taxes Abated on Value of Property Added In:
Page 76
Year 17 $0 $0 $0 $0 $0
Year 18 $0 $0 $0 $0 $0
Year 19 $0 $0 $0 $0 $0
Year 20 $0 $0 $0 $0 $0
Year 21 $0 $0 $0 $0 $0
Year 22 $0 $0 $0 $0 $0
Year 23 $0 $0 $0 $0 $0
Year 24 $0 $0 $0 $0 $0
Year 25 $0 $0 $0 $0 $0
Total taxes to be abated $165,240
Page 76
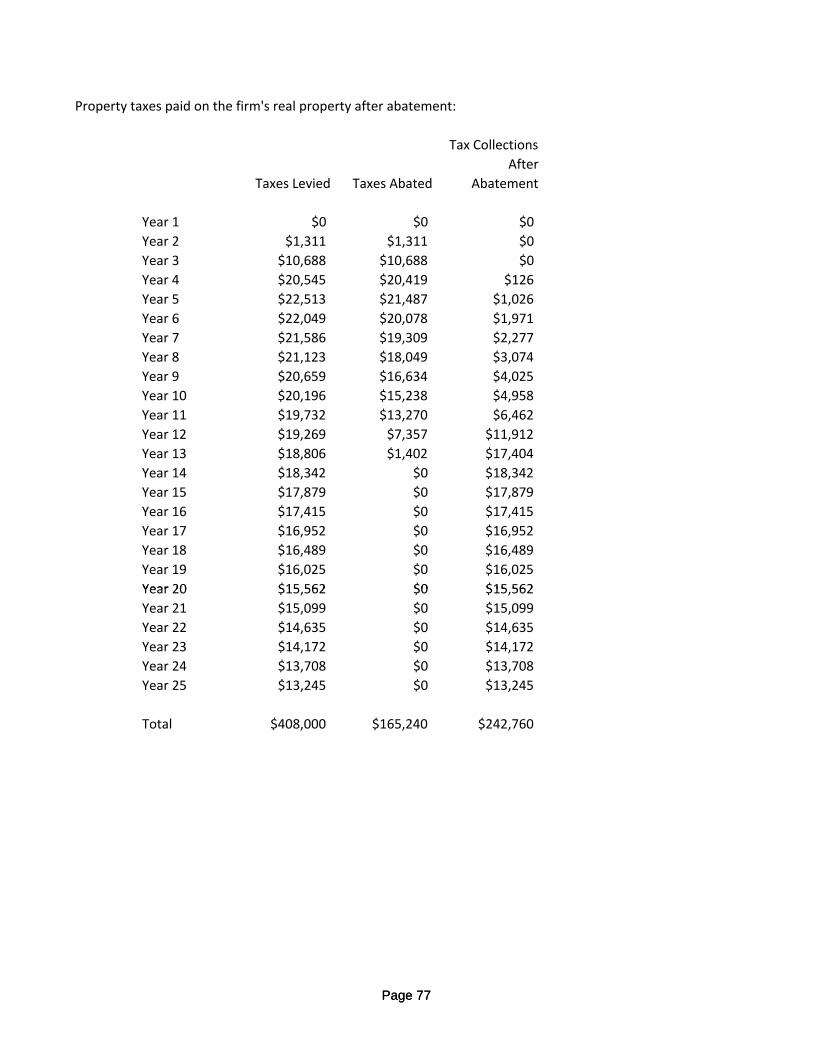
Property taxes paid on the firm's real property after abatement:
Tax Collections
After
Taxes Levied Taxes Abated Abatement
Year 1 $0 $0 $0
Year 2 $1,311 $1,311 $0
Year 3 $10,688 $10,688 $0
Year 4 $20,545 $20,419 $126
Year 5 $22,513 $21,487 $1,026
Year 6 $22,049 $20,078 $1,971
Year 7 $21,586 $19,309 $2,277
Year 8 $21,123 $18,049 $3,074
Year 9 $20,659 $16,634 $4,025
Year 10 $20,196 $15,238 $4,958
Year 11 $19,732 $13,270 $6,462
Year 12 $19,269 $7,357 $11,912
Year 13 $18,806 $1,402 $17,404
Year 14 $18,342 $0 $18,342
Year 15 $17,879 $0 $17,879
Year 16 $17,415 $0 $17,415
Year 17 $16,952 $0 $16,952
Year 18 $16,489 $0 $16,489
Year 19 $16,025 $0 $16,025
Year 20 $15 562 $0 $15 562
Page 77
Year 20 $15,562 $0 $15,562
Year 21 $15,099 $0 $15,099
Year 22 $14,635 $0 $14,635
Year 23 $14,172 $0 $14,172
Year 24 $13,708 $0 $13,708
Year 25 $13,245 $0 $13,245
Total $408,000 $165,240 $242,760
Page 77
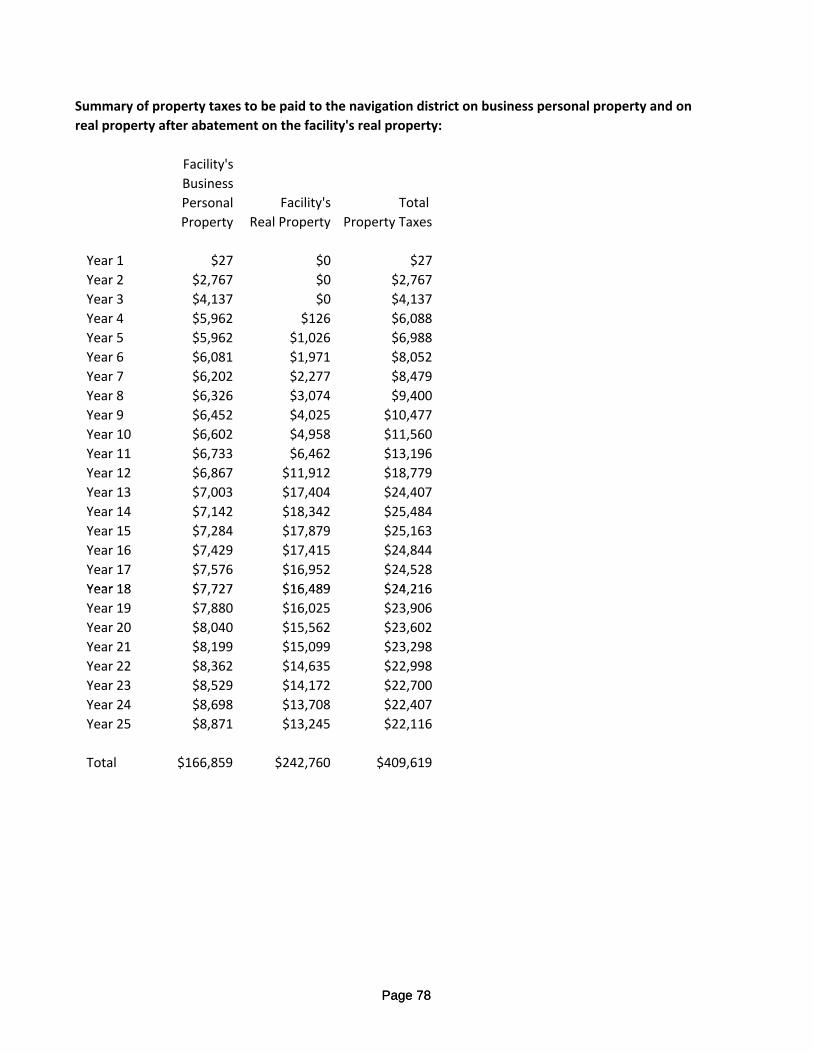
Summary of property taxes to be paid to the navigation district on business personal property and on
real property after abatement on the facility's real property:
Facility's
Business
Personal Facility's Total
Property Real Property Property Taxes
Year 1 $27 $0 $27
Year 2 $2,767 $0 $2,767
Year 3 $4,137 $0 $4,137
Year 4 $5,962 $126 $6,088
Year 5 $5,962 $1,026 $6,988
Year 6 $6,081 $1,971 $8,052
Year 7 $6,202 $2,277 $8,479
Year 8 $6,326 $3,074 $9,400
Year 9 $6,452 $4,025 $10,477
Year 10 $6,602 $4,958 $11,560
Year 11 $6,733 $6,462 $13,196
Year 12 $6,867 $11,912 $18,779
Year 13 $7,003 $17,404 $24,407
Year 14 $7,142 $18,342 $25,484
Year 15 $7,284 $17,879 $25,163
Year 16 $7,429 $17,415 $24,844
Year 17 $7,576 $16,952 $24,528
Year 18 $7 727 $16 489 $24 216
Page 78
Year 18 $7,727 $16,489 $24,216
Year 19 $7,880 $16,025 $23,906
Year 20 $8,040 $15,562 $23,602
Year 21 $8,199 $15,099 $23,298
Year 22 $8,362 $14,635 $22,998
Year 23 $8,529 $14,172 $22,700
Year 24 $8,698 $13,708 $22,407
Year 25 $8,871 $13,245 $22,116
Total $166,859 $242,760 $409,619
Page 78
Appendix HRevenues for Drainage District # 7
Page 79Page 79
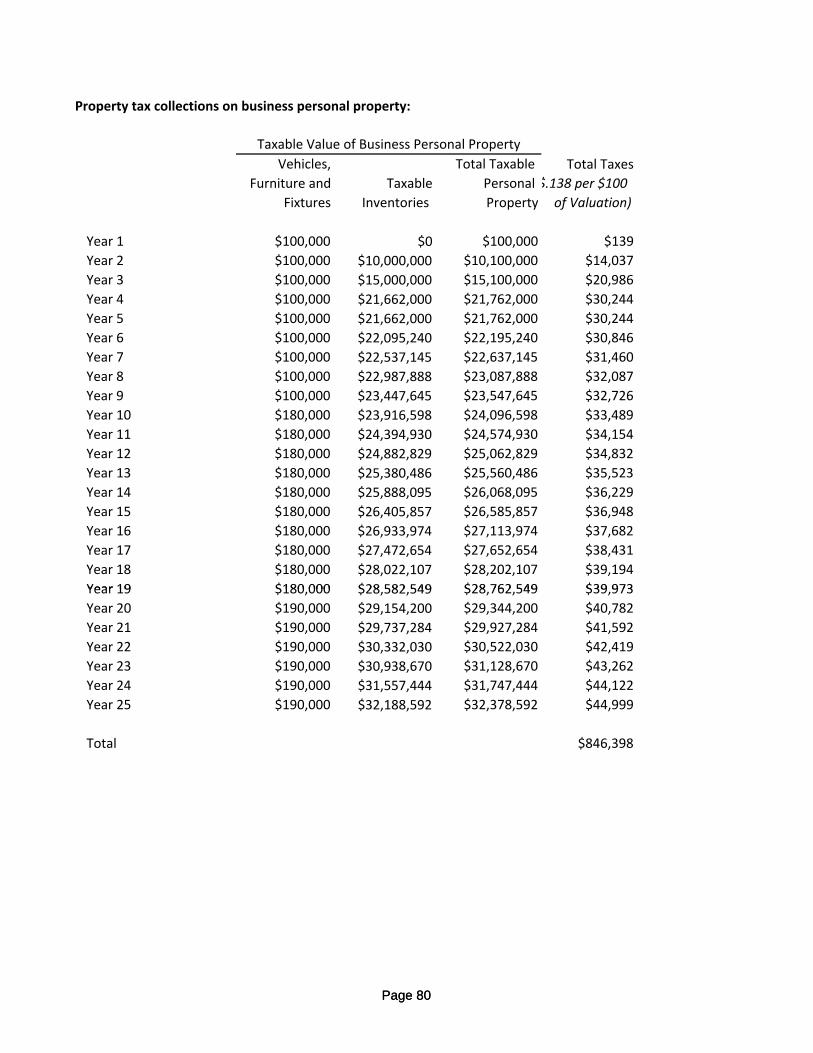
Property tax collections on business personal property:
Vehicles, Total Taxable Total Taxes
Furniture and Taxable Personal $.138 per $100
Fixtures Inventories Property of Valuation)
Year 1 $100,000 $0 $100,000 $139
Year 2 $100,000 $10,000,000 $10,100,000 $14,037
Year 3 $100,000 $15,000,000 $15,100,000 $20,986
Year 4 $100,000 $21,662,000 $21,762,000 $30,244
Year 5 $100,000 $21,662,000 $21,762,000 $30,244
Year 6 $100,000 $22,095,240 $22,195,240 $30,846
Year 7 $100,000 $22,537,145 $22,637,145 $31,460
Year 8 $100,000 $22,987,888 $23,087,888 $32,087
Year 9 $100,000 $23,447,645 $23,547,645 $32,726
Year 10 $180,000 $23,916,598 $24,096,598 $33,489
Year 11 $180,000 $24,394,930 $24,574,930 $34,154
Year 12 $180,000 $24,882,829 $25,062,829 $34,832
Year 13 $180,000 $25,380,486 $25,560,486 $35,523
Year 14 $180,000 $25,888,095 $26,068,095 $36,229
Year 15 $180,000 $26,405,857 $26,585,857 $36,948
Year 16 $180,000 $26,933,974 $27,113,974 $37,682
Year 17 $180,000 $27,472,654 $27,652,654 $38,431
Year 18 $180,000 $28,022,107 $28,202,107 $39,194
Year 19 $180 000 $28 582 549 $28 762 549 $39 973
Taxable Value of Business Personal Property
Page 80
Year 19 $180,000 $28,582,549 $28,762,549 $39,973
Year 20 $190,000 $29,154,200 $29,344,200 $40,782
Year 21 $190,000 $29,737,284 $29,927,284 $41,592
Year 22 $190,000 $30,332,030 $30,522,030 $42,419
Year 23 $190,000 $30,938,670 $31,128,670 $43,262
Year 24 $190,000 $31,557,444 $31,747,444 $44,122
Year 25 $190,000 $32,188,592 $32,378,592 $44,999
Total $846,398
Page 80
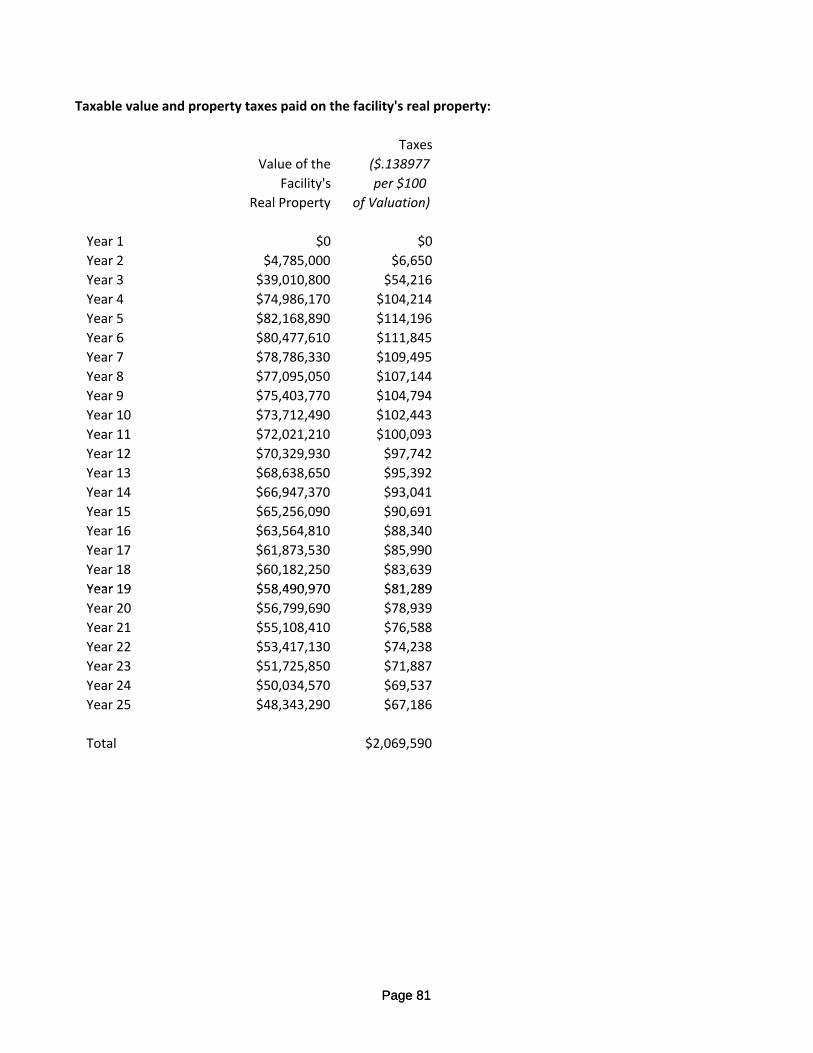
Taxable value and property taxes paid on the facility's real property:
Taxes
Value of the ($.138977
Facility's per $100
Real Property of Valuation)
Year 1 $0 $0
Year 2 $4,785,000 $6,650
Year 3 $39,010,800 $54,216
Year 4 $74,986,170 $104,214
Year 5 $82,168,890 $114,196
Year 6 $80,477,610 $111,845
Year 7 $78,786,330 $109,495
Year 8 $77,095,050 $107,144
Year 9 $75,403,770 $104,794
Year 10 $73,712,490 $102,443
Year 11 $72,021,210 $100,093
Year 12 $70,329,930 $97,742
Year 13 $68,638,650 $95,392
Year 14 $66,947,370 $93,041
Year 15 $65,256,090 $90,691
Year 16 $63,564,810 $88,340
Year 17 $61,873,530 $85,990
Year 18 $60,182,250 $83,639
Year 19 $58 490 970 $81 289
Page 81
Year 19 $58,490,970 $81,289
Year 20 $56,799,690 $78,939
Year 21 $55,108,410 $76,588
Year 22 $53,417,130 $74,238
Year 23 $51,725,850 $71,887
Year 24 $50,034,570 $69,537
Year 25 $48,343,290 $67,186
Total $2,069,590
Page 81
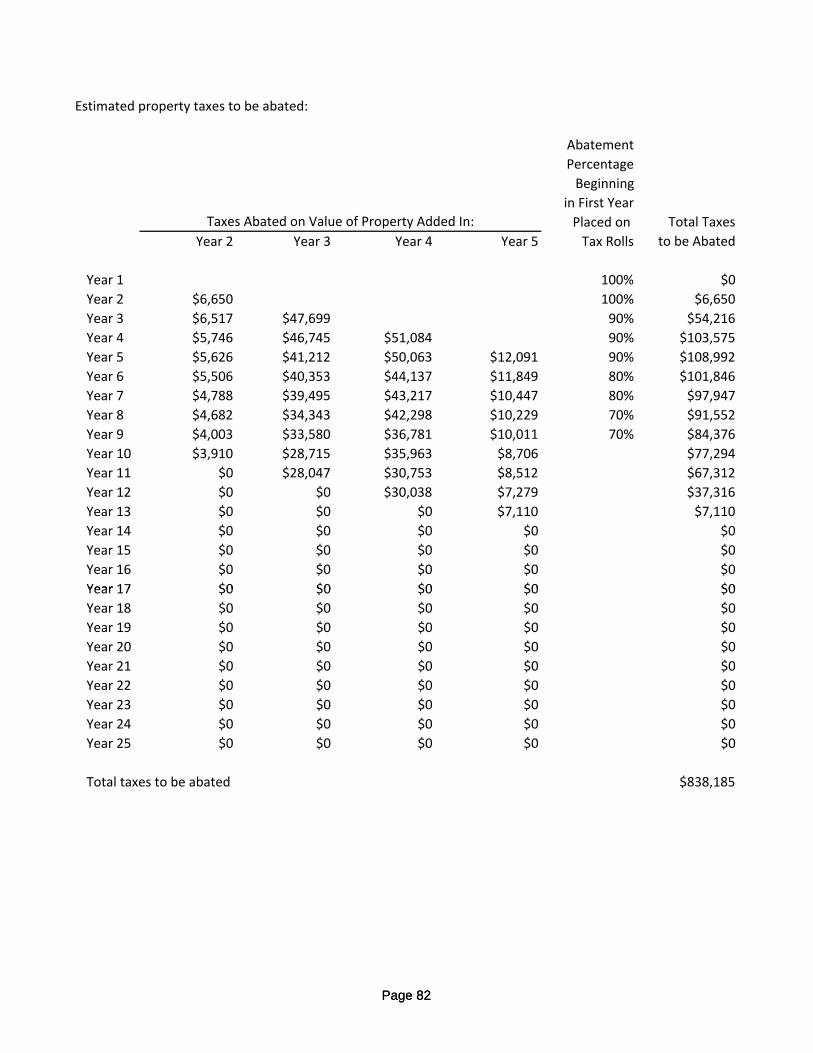
Estimated property taxes to be abated:
Abatement
Percentage
Beginning
in First Year
Placed on Total Taxes
Year 2 Year 3 Year 4 Year 5 Tax Rolls to be Abated
Year 1 100% $0
Year 2 $6,650 100% $6,650
Year 3 $6,517 $47,699 90% $54,216
Year 4 $5,746 $46,745 $51,084 90% $103,575
Year 5 $5,626 $41,212 $50,063 $12,091 90% $108,992
Year 6 $5,506 $40,353 $44,137 $11,849 80% $101,846
Year 7 $4,788 $39,495 $43,217 $10,447 80% $97,947
Year 8 $4,682 $34,343 $42,298 $10,229 70% $91,552
Year 9 $4,003 $33,580 $36,781 $10,011 70% $84,376
Year 10 $3,910 $28,715 $35,963 $8,706 $77,294
Year 11 $0 $28,047 $30,753 $8,512 $67,312
Year 12 $0 $0 $30,038 $7,279 $37,316
Year 13 $0 $0 $0 $7,110 $7,110
Year 14 $0 $0 $0 $0 $0
Year 15 $0 $0 $0 $0 $0
Year 16 $0 $0 $0 $0 $0
Year 17 $0 $0 $0 $0 $0
Taxes Abated on Value of Property Added In:
Page 82
Year 17 $0 $0 $0 $0 $0
Year 18 $0 $0 $0 $0 $0
Year 19 $0 $0 $0 $0 $0
Year 20 $0 $0 $0 $0 $0
Year 21 $0 $0 $0 $0 $0
Year 22 $0 $0 $0 $0 $0
Year 23 $0 $0 $0 $0 $0
Year 24 $0 $0 $0 $0 $0
Year 25 $0 $0 $0 $0 $0
Total taxes to be abated $838,185
Page 82
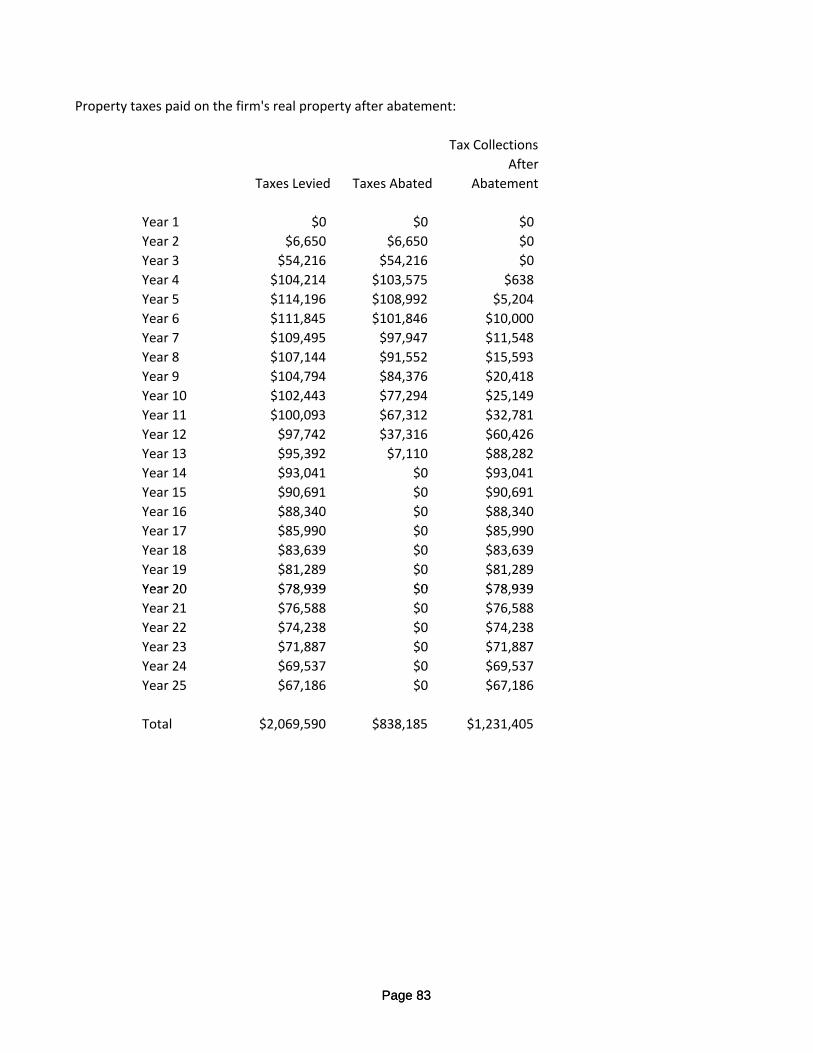
Property taxes paid on the firm's real property after abatement:
Tax Collections
After
Taxes Levied Taxes Abated Abatement
Year 1 $0 $0 $0
Year 2 $6,650 $6,650 $0
Year 3 $54,216 $54,216 $0
Year 4 $104,214 $103,575 $638
Year 5 $114,196 $108,992 $5,204
Year 6 $111,845 $101,846 $10,000
Year 7 $109,495 $97,947 $11,548
Year 8 $107,144 $91,552 $15,593
Year 9 $104,794 $84,376 $20,418
Year 10 $102,443 $77,294 $25,149
Year 11 $100,093 $67,312 $32,781
Year 12 $97,742 $37,316 $60,426
Year 13 $95,392 $7,110 $88,282
Year 14 $93,041 $0 $93,041
Year 15 $90,691 $0 $90,691
Year 16 $88,340 $0 $88,340
Year 17 $85,990 $0 $85,990
Year 18 $83,639 $0 $83,639
Year 19 $81,289 $0 $81,289
Year 20 $78 939 $0 $78 939
Page 83
Year 20 $78,939 $0 $78,939
Year 21 $76,588 $0 $76,588
Year 22 $74,238 $0 $74,238
Year 23 $71,887 $0 $71,887
Year 24 $69,537 $0 $69,537
Year 25 $67,186 $0 $67,186
Total $2,069,590 $838,185 $1,231,405
Page 83
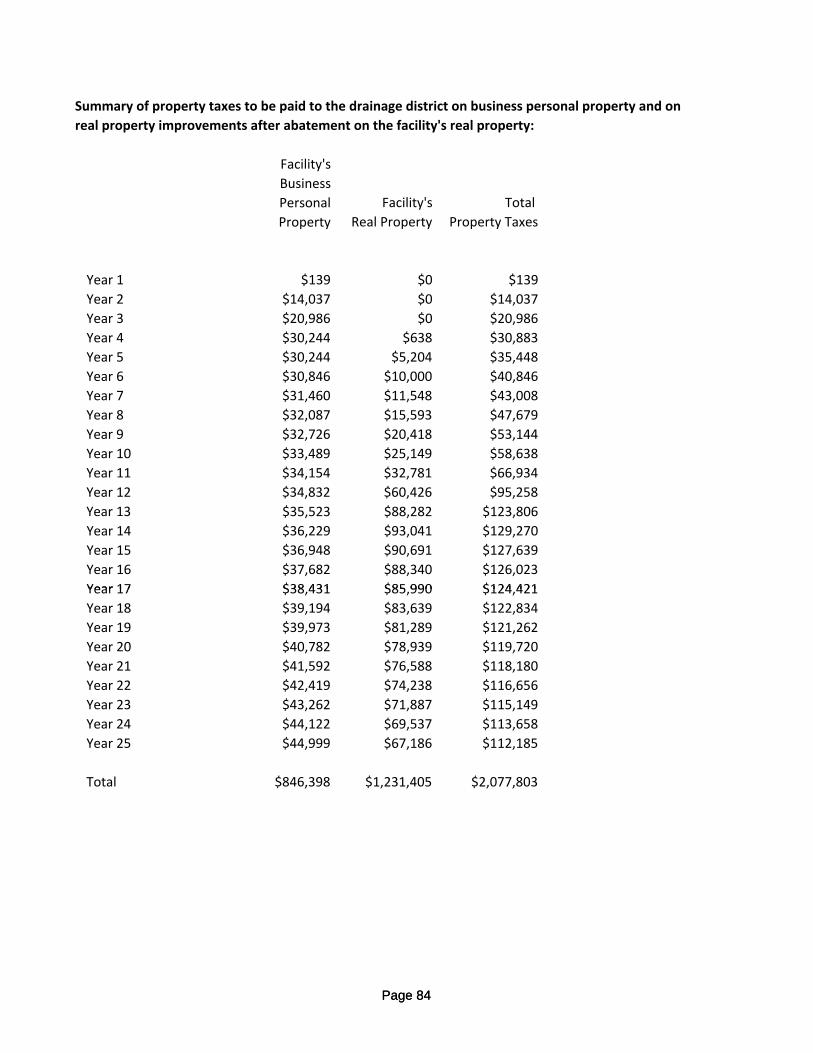
Summary of property taxes to be paid to the drainage district on business personal property and on
real property improvements after abatement on the facility's real property:
Facility's
Business
Personal Facility's Total
Property Real Property Property Taxes
Year 1 $139 $0 $139
Year 2 $14,037 $0 $14,037
Year 3 $20,986 $0 $20,986
Year 4 $30,244 $638 $30,883
Year 5 $30,244 $5,204 $35,448
Year 6 $30,846 $10,000 $40,846
Year 7 $31,460 $11,548 $43,008
Year 8 $32,087 $15,593 $47,679
Year 9 $32,726 $20,418 $53,144
Year 10 $33,489 $25,149 $58,638
Year 11 $34,154 $32,781 $66,934
Year 12 $34,832 $60,426 $95,258
Year 13 $35,523 $88,282 $123,806
Year 14 $36,229 $93,041 $129,270
Year 15 $36,948 $90,691 $127,639
Year 16 $37,682 $88,340 $126,023
Year 17 $38 431 $85 990 $124 421
Page 84
Year 17 $38,431 $85,990 $124,421
Year 18 $39,194 $83,639 $122,834
Year 19 $39,973 $81,289 $121,262
Year 20 $40,782 $78,939 $119,720
Year 21 $41,592 $76,588 $118,180
Year 22 $42,419 $74,238 $116,656
Year 23 $43,262 $71,887 $115,149
Year 24 $44,122 $69,537 $113,658
Year 25 $44,999 $67,186 $112,185
Total $846,398 $1,231,405 $2,077,803
Page 84
Appendix ISales Tax Collections by Other Cities in Jefferson County on Workers Spending
Page 85
p g
Page 85
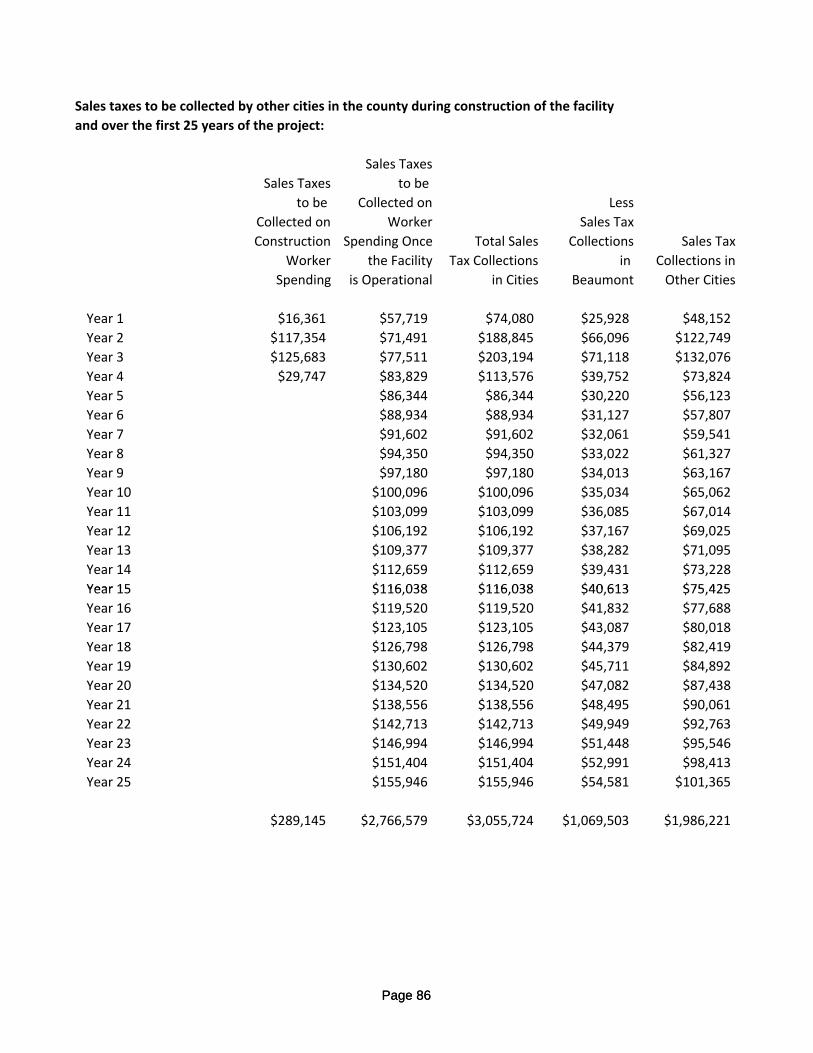
Sales taxes to be collected by other cities in the county during construction of the facility
and over the first 25 years of the project:
Sales Taxes
Sales Taxes to be
to be Collected on Less
Collected on Worker Sales Tax
Construction Spending Once Total Sales Collections Sales Tax
Worker the Facility Tax Collections in Collections in
Spending is Operational in Cities Beaumont Other Cities
Year 1 $16,361 $57,719 $74,080 $25,928 $48,152
Year 2 $117,354 $71,491 $188,845 $66,096 $122,749
Year 3 $125,683 $77,511 $203,194 $71,118 $132,076
Year 4 $29,747 $83,829 $113,576 $39,752 $73,824
Year 5 $86,344 $86,344 $30,220 $56,123
Year 6 $88,934 $88,934 $31,127 $57,807
Year 7 $91,602 $91,602 $32,061 $59,541
Year 8 $94,350 $94,350 $33,022 $61,327
Year 9 $97,180 $97,180 $34,013 $63,167
Year 10 $100,096 $100,096 $35,034 $65,062
Year 11 $103,099 $103,099 $36,085 $67,014
Year 12 $106,192 $106,192 $37,167 $69,025
Year 13 $109,377 $109,377 $38,282 $71,095
Year 14 $112,659 $112,659 $39,431 $73,228
Year 15 $116 038 $116 038 $40 613 $75 425
Page 86
Year 15 $116,038 $116,038 $40,613 $75,425
Year 16 $119,520 $119,520 $41,832 $77,688
Year 17 $123,105 $123,105 $43,087 $80,018
Year 18 $126,798 $126,798 $44,379 $82,419
Year 19 $130,602 $130,602 $45,711 $84,892
Year 20 $134,520 $134,520 $47,082 $87,438
Year 21 $138,556 $138,556 $48,495 $90,061
Year 22 $142,713 $142,713 $49,949 $92,763
Year 23 $146,994 $146,994 $51,448 $95,546
Year 24 $151,404 $151,404 $52,991 $98,413
Year 25 $155,946 $155,946 $54,581 $101,365
$289,145 $2,766,579 $3,055,724 $1,069,503 $1,986,221
Page 86
Appendix JProperty Taxes to be Collected by Other Cities, School Districts and Special Taxing Districts on the Residential Property Built for
Page 87
p g p ySome Direct and Indirect Workers
Page 87
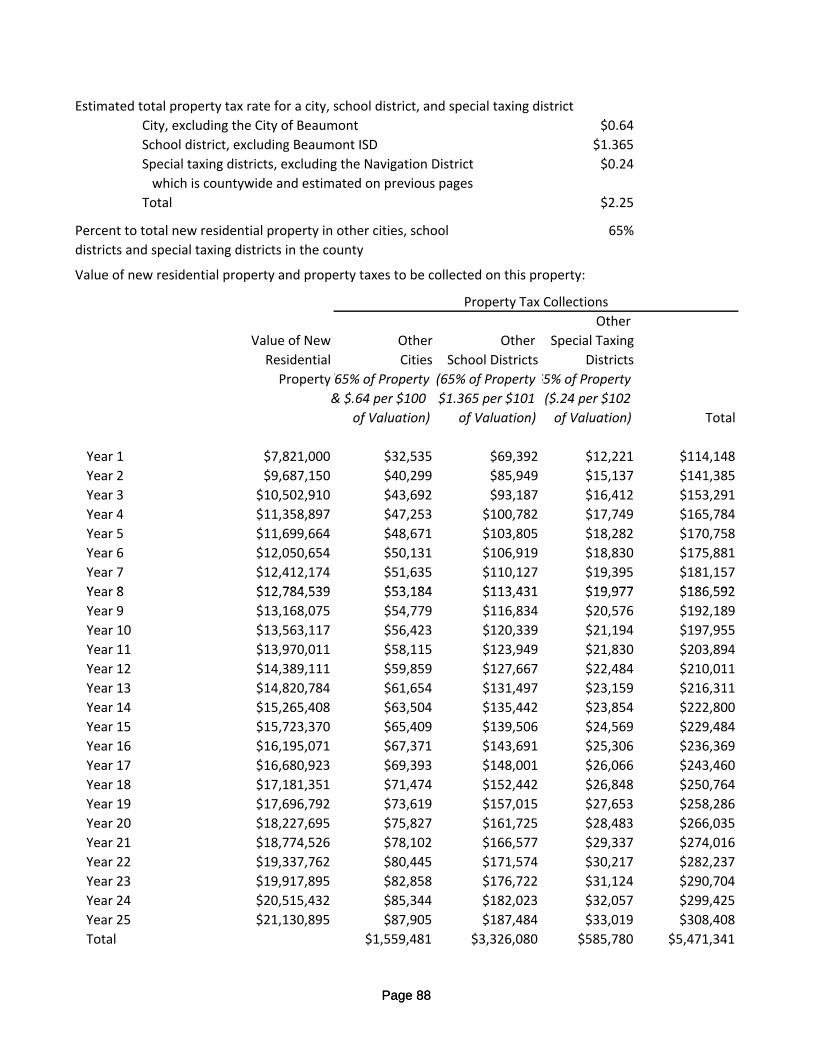
Estimated total property tax rate for a city, school district, and special taxing district
City, excluding the City of Beaumont $0.64
School district, excluding Beaumont ISD $1.365
Special taxing districts, excluding the Navigation District $0.24
which is countywide and estimated on previous pages
Total $2.25
Percent to total new residential property in other cities, school 65%
districts and special taxing districts in the county
Value of new residential property and property taxes to be collected on this property:
Other
Value of New Other Other Special Taxing
Residential Cities School Districts Districts
Property(65% of Property (65% of Property65% of Property
& $.64 per $100 $1.365 per $101 ($.24 per $102
of Valuation) of Valuation) of Valuation) Total
Year 1 $7,821,000 $32,535 $69,392 $12,221 $114,148
Year 2 $9,687,150 $40,299 $85,949 $15,137 $141,385
Year 3 $10,502,910 $43,692 $93,187 $16,412 $153,291
Year 4 $11,358,897 $47,253 $100,782 $17,749 $165,784
Year 5 $11,699,664 $48,671 $103,805 $18,282 $170,758
Year 6 $12,050,654 $50,131 $106,919 $18,830 $175,881
Year 7 $12,412,174 $51,635 $110,127 $19,395 $181,157
Y 8 $12 784 539 $53 184 $113 431 $19 977 $186 592
Property Tax Collections
Page 88
Year 8 $12,784,539 $53,184 $113,431 $19,977 $186,592
Year 9 $13,168,075 $54,779 $116,834 $20,576 $192,189
Year 10 $13,563,117 $56,423 $120,339 $21,194 $197,955
Year 11 $13,970,011 $58,115 $123,949 $21,830 $203,894
Year 12 $14,389,111 $59,859 $127,667 $22,484 $210,011
Year 13 $14,820,784 $61,654 $131,497 $23,159 $216,311
Year 14 $15,265,408 $63,504 $135,442 $23,854 $222,800
Year 15 $15,723,370 $65,409 $139,506 $24,569 $229,484
Year 16 $16,195,071 $67,371 $143,691 $25,306 $236,369
Year 17 $16,680,923 $69,393 $148,001 $26,066 $243,460
Year 18 $17,181,351 $71,474 $152,442 $26,848 $250,764
Year 19 $17,696,792 $73,619 $157,015 $27,653 $258,286
Year 20 $18,227,695 $75,827 $161,725 $28,483 $266,035
Year 21 $18,774,526 $78,102 $166,577 $29,337 $274,016
Year 22 $19,337,762 $80,445 $171,574 $30,217 $282,237
Year 23 $19,917,895 $82,858 $176,722 $31,124 $290,704
Year 24 $20,515,432 $85,344 $182,023 $32,057 $299,425
Year 25 $21,130,895 $87,905 $187,484 $33,019 $308,408
Total $1,559,481 $3,326,080 $585,780 $5,471,341
Page 88
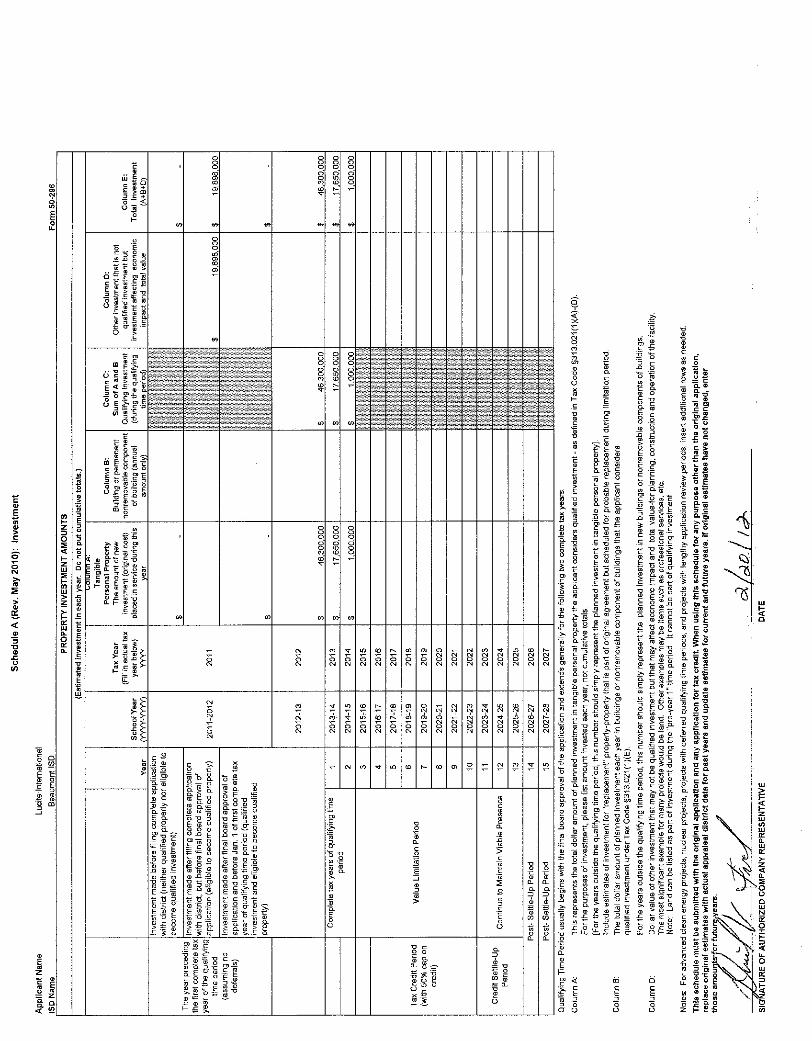
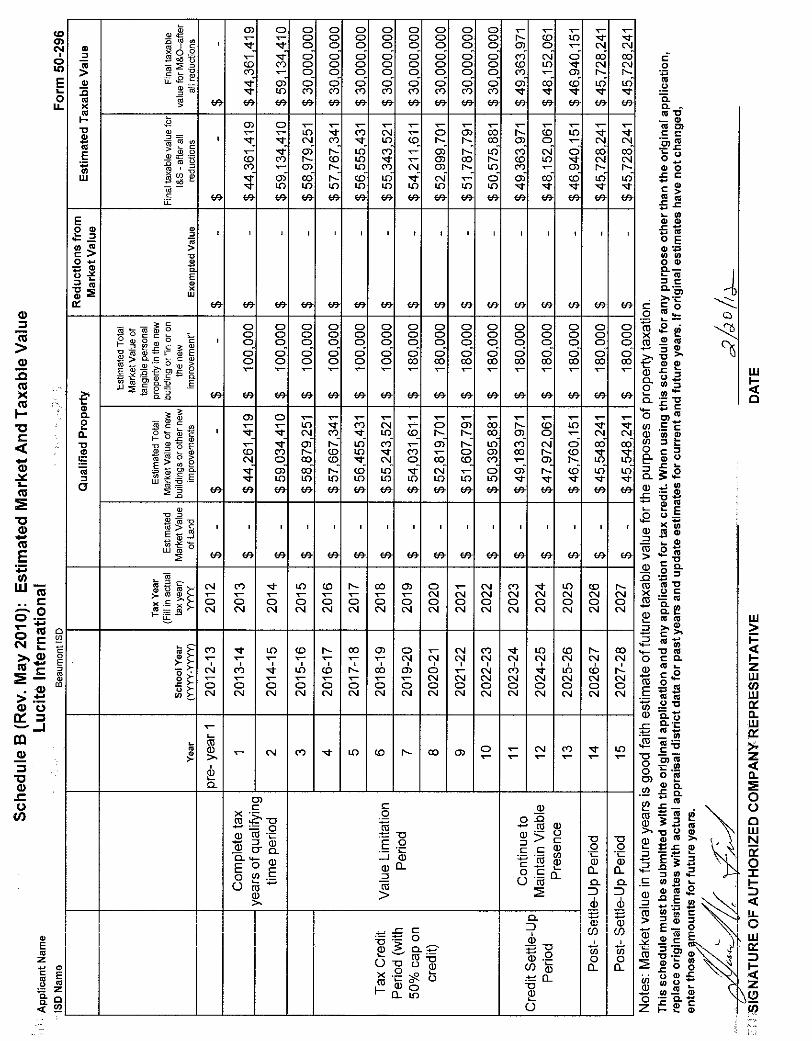
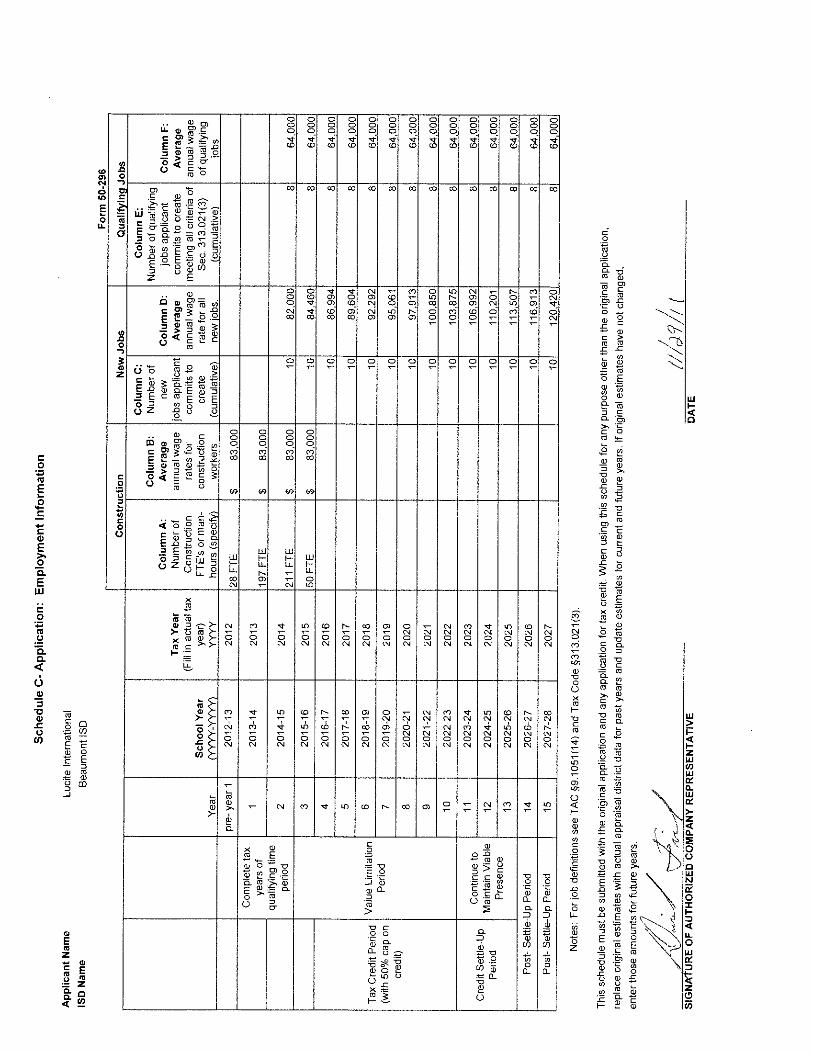
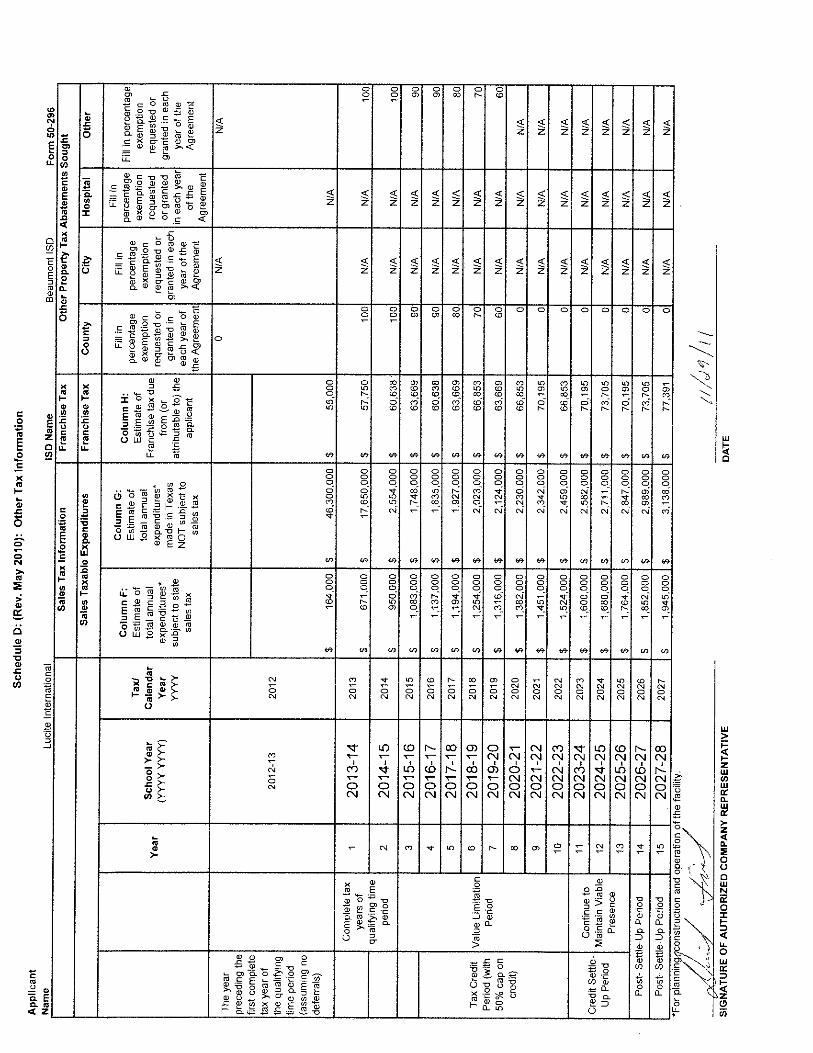
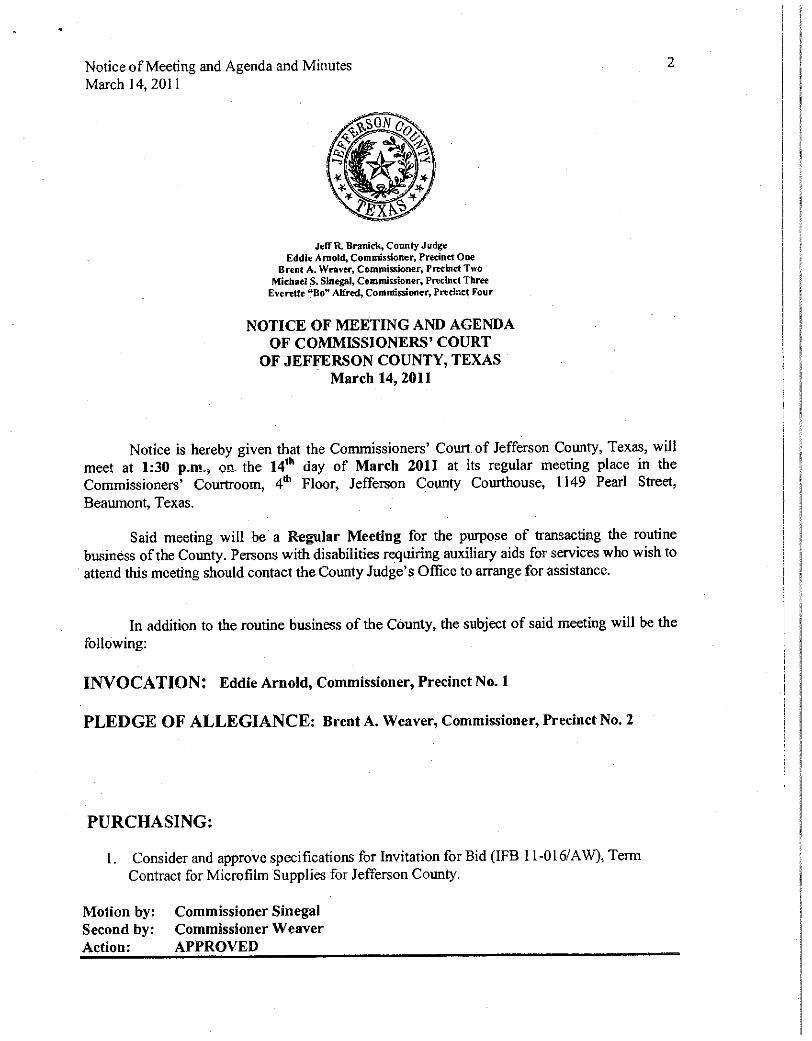
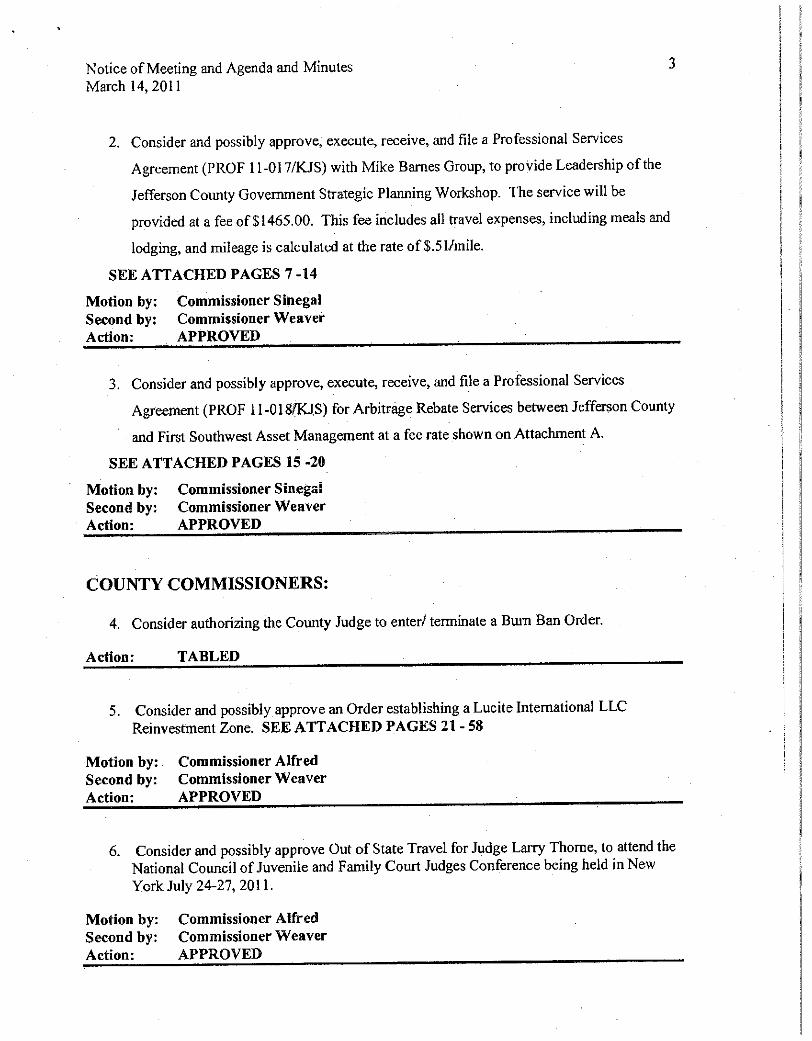
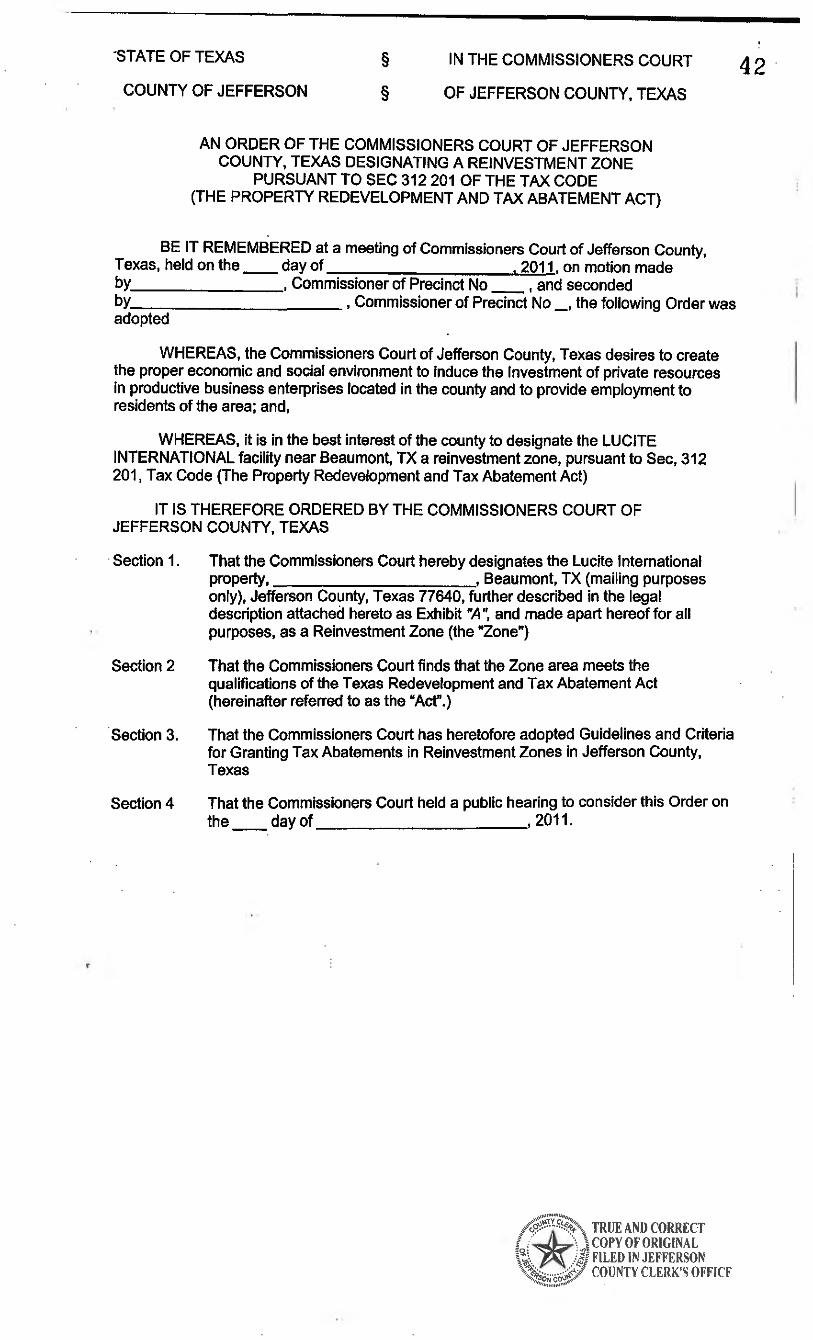
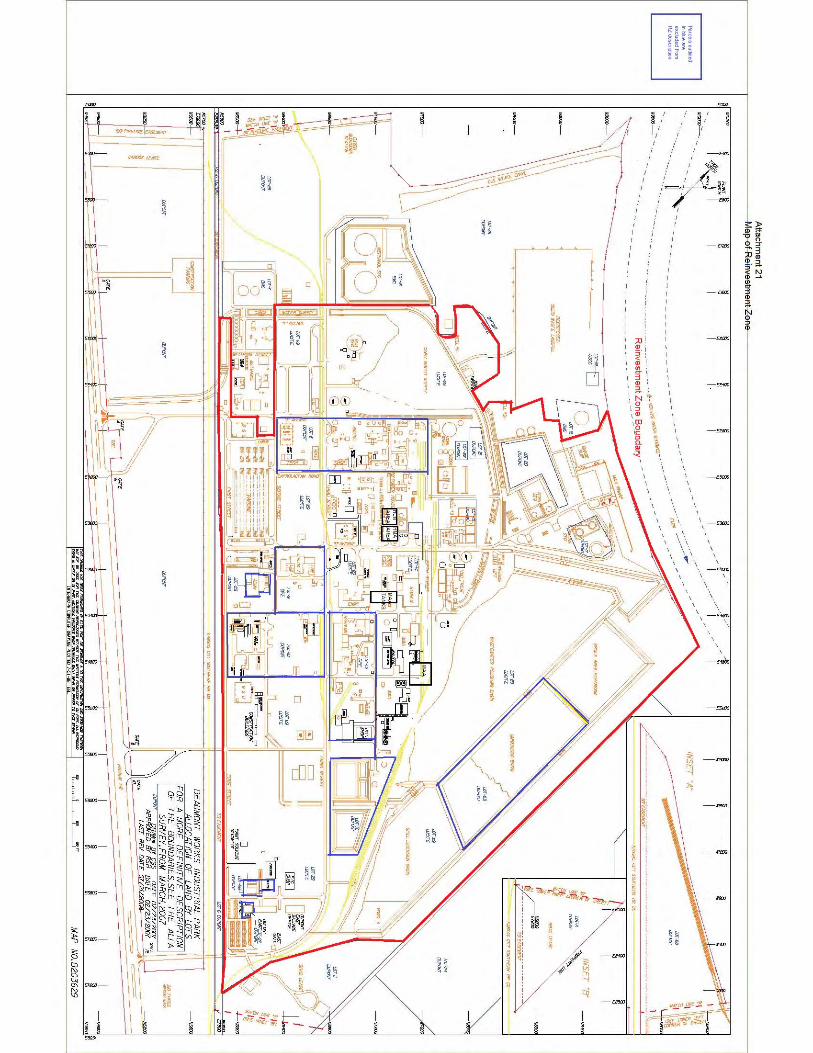
JEFFERSON COUNTY UNIFORM TAX ABATEMENT POLICY-2009
ADMONITORY PROVISIONS
The final determination of value to be abated is vested with the Jefferson County Appraisal District (JCAD), an agency autonomous from Jefferson County. The Procedures used by JCAD are attached as Exhibit “A” and incorporated and adopted in this Abatement Policy for all purposes. These provisions are illustrative only and shall not limit the Appraisal District in making determinations in any manner otherwise allowed by law. Businesses applying for tax abatement with the County are advised that any agreement with the County applies only to taxes assessed by Jefferson County. Any abatement agreement with other taxing entities must be negotiated directly with such entities. In addition, each individual or business receiving an abatement retains the responsibility for annually applying to the Jefferson County Appraisal District for recognition and implementation of such abatement agreement.
STATEMENT OF PURPOSE
SECTION I
(a) The Commissioners Court of Jefferson County, Texas adopts this tax abatement policy to provide incentives to the owner of real property who proposes a Project to develop, redevelop or improve eligible facilities. The incentives will consist of a limited special exemption from certain taxes provided that the Owner agrees to accept and abide by this Policy and provided that the real property is located in a lawfully created Reinvestment or Enterprise Zone. (b) This policy is intended to improve the quality of life in economically depressed areas and throughout the County by stimulating industrial development, and job creation and retention. DEFINITIONS SECTION II (a) “Abatement” means the full or partial exemption from ad valorem taxes of certain real property values and/or tangible personal property values in a reinvestment or enterprise zone designated by the County for economic development purposes. (b) “Agreement” means a contractual agreement between a property owner and/or lessee and the County. (c) “Base Year” means the calendar year in which the abatement contract is executed (signed). (d) “Base Year Value” means the assessed value of eligible property January 1 preceding the execution of the agreement plus the value of eligible property improvements and Tangible Personal Property made after January 1, but before the execution of the Agreement, and which property is owned by the owner, co-owner, and/or its parent companies, subsidiaries, partners, co-venturers, or any entity exercising legal control over the owner or subject to control by the owner.
(e) “Deferred Maintenance” means improvements necessary for continued operation which that do not improve productivity, or alter the process technology, reduce pollution or conserve resources. (f) “Distribution Center” means buildings and structures, including fixed machinery and equipment, used or to be used primarily to receive, store, service or distribute goods or materials owned by the Facility operator where a majority of the goods or services are distributed to points beyond Jefferson County. (g) “Eligible Facilities” or “Eligible Projects” means new, expanded or modernized buildings and structures, tangible personal property as defined in the Texas Tax Code, including fixed machinery and equipment, which is reasonably likely as a result of granting abatement to contribute to the retention or expansion of primary employment or to attract major investment in the reinvestment or enterprise zone that would be a benefit to the property and that would contribute to the economic development within the County, but does not include facilities which are intended primarily to provide goods or services to residents or existing businesses located in the County such as, but not limited to, restaurants and retail sales establishments. Eligible facilities may include, but shall not be limited to, industrial buildings and warehouses. Eligible facilities may also include facilities designed to serve a regional population greater than the County for medical, scientific, recreational or other purposes. (h) “Expansion” means the addition of buildings, structures, machinery, tangible personal property, equipment, payroll or other taxable value for purposes of increasing production capacity. (i) “Modernization” means a complete or partial demolition of facilities and the complete or partial reconstruction or installation of a facility of similar or expanded production capacity. Modernization may result from the construction, alteration, or installation of buildings, structures, machinery, equipment, pollution control devices or resource conservation equipment. Modernization shall include improvements for the purpose of increasing productivity or updating the technology of machinery and equipment, or both. (j) “Facility” means property improvements completed or in the process of construction which together comprise and integral whole. (k) “New Facility” means a property previously undeveloped which is placed into service by means other than in conjunction with Expansion or Modernization. (l) “Productive Life” means the number of years a property improvement is expected to be in service in a facility. (m) “Tangible Personal Property” means tangible personal property classified as such under state law, but excluding inventory and/or supplies and tangible personal property that was located in the investment or enterprise zone at any time before the period covered by the agreement with the County.
WHEN ABATEMENT AUTHORIZED SECTION III (a) Eligible Facilities. Upon application, Eligible Facilities shall be considered for tax abatement as hereinafter provided. (b) Creation of New Value. Abatement may only be granted for the creation of additional value to eligible facilities made subsequent to and specified in an abatement agreement between the County and the property owner or lessee, subject to such limitations as the County may require. Under no circumstances will abatements be considered or granted once construction on a facility or project has begun. (c) New and Existing Facilities. Abatement may be granted for new facilities and improvements to existing facilities for purposes of modernization or expansion. (d) Eligible Property. Abatement may be extended to the value of buildings, structures, fixed machinery and equipment, site improvements, and related fixed improvements necessary to the operation and administration of the facility. (e) Ineligible Property. The following types of property shall be fully taxable and ineligible for tax abatement: land, supplies, inventory, vehicles, vessels, housing, improvements for the generation or transmission of electrical energy not wholly consumed by a new facility or expansion; any improvements, including those to produce, store or distribute natural gas, fluids or gases, which are not integral to the operation of the facility; deferred maintenance, property to be rented or leased (except as provided in Section III(f), property which has a productive life of less than ten years, or any other property for which abatement is not allowed by state law. (f) Owned/Leased Facilities. If a leased facility is granted abatement, both the owner/lessor and the lessee shall be parties to the abatement contract with the County. (g) Economic Qualification. In order for an Eligible Facility to receive tax abatement the planned improvement: (1) Must create an increased appraised ad valorem tax value based upon the Jefferson County Appraisal District’s assessment of the eligible property; and (2) Must prevent the loss of payroll or retain, increase or create payroll (full-time employment) on a permanent basis in the County. (3) Must not have the effect of displacing workers or transferring employment from one part of the County to another. (4) Must demonstrate by an independent economic impact analysis that the local economic benefit will be substantially in excess of the amount of anticipated foregone tax revenues resulting from the abatement.
Factors Considered By County In Considering Abatement Requests Section IV (a) Standards For Tax Abatement. The following non-exclusive factors may be considered in determining whether to grant tax abatements for an Eligible Facility or Project, and if so, the percentage of value to be abated and the duration of the tax abatement: (1) Existing improvements, if any; (2) Type and value of proposed improvements; (3) Productive life of proposed improvements; (4) Number of existing jobs to be retained by proposed improvements; (5) Number and types of new jobs to be created by proposed improvements; (6) The extent to which new jobs to be created will be filled by persons who are economically disadvantaged, including residents of a Reinvestment or Enterprise Zone; (7) The extent to which local labor, local subcontractors and local vendors and suppliers will be used in the construction phase of the project; (8) The amount of local taxes to be generated directly; (9) The amount the property tax base valuation will be increased during term of abatement and after abatement; (10) The amount of economic impact the Eligible Facility will provide to the local community; (11) The costs to be incurred by the County to provide facilities or services directly resulting from the new improvements; (12) The amount of ad valorem taxes to be paid to the County during the abatement period considering (a) the existing values; (b) the percentage of new value abated; (c) the abatement period; and (d) the value after expiration of the abatement period; (13) The population growth of the County projected to occur directly as a result of new improvements; (14) The types and values of public improvements, if any, to be made by the applicant seeking abatement; (15) Whether the proposed improvements compete with existing businesses to the detriment of the local economy; (16) The impact of the proposed project on the business opportunities of existing businesses;
(17) The attraction of other new businesses to the area as a result of the project; (18) The overall compatibility with the zoning ordinances and comprehensive plan for the area; (19) Whether the project is environmentally compatible with no negative impact on quality of life perceptions; Each application for tax abatement shall be reviewed on its merits utilizing the factors provided above. After such review, abatement may be denied entirely or may be granted to the extent deemed appropriate after full evaluation. (b) Local Employment. For purposes of evaluating Section III(h)(7): Local labor is defined as those laborers or skilled craftsmen who are residents and domiciliaries of the nine county region comprised of Jefferson, Orange, Hardin, Jasper, Newton, Liberty, Tyler and Chambers counties, as well as the Bolivar Peninsula area of Galveston County. Local vendors and suppliers shall include only those located or having a principal office in Jefferson County. Local Subcontractors shall include only those located or having a principal office in Jefferson County. Each recipient of property tax abatement shall additionally agree to give preference and priority to local manufacturers, suppliers, vendors, contractors and labor, except where not reasonably possible to do so without significant added expense, substantial inconvenience, or sacrifice in operating efficiency. In any such exception, cases involving purchases over $10,000.00, a justification for such purchase shall be included in the annual report. Each recipient shall further acknowledge that is a legal and moral obligation of persons receiving property tax abatement to favor local manufacturers, suppliers, contractors and labor, all other factors being equal. In the event of breach of the “buy-local” provision, the percentage of abatement shall be proportionately reduced in an amount equal to the amount the disqualified contract bears to the total construction cost for the project. (c) Each recipient of a property tax abatement must also provide bidding information to local contractors, manufacturers and labor to allow them to have sufficient information and time to submit their bids and pre-bid meetings must be held between the owner and potential local bidders and suppliers of services and materials. (d) Historically Underutilized Businesses/Disadvantaged Business Enterprises. The County will also strongly consider the extent to which the project will encourage and promote the utilization of Historically Underutilized Businesses (HUBs) (also known as Disadvantaged Business Enterprises, or DBEs) by the owner and general contractor by ensuring that qualified HUB vendors and contractors are given an opportunity to bid on all contracts. 1. A Historically Underutilized Business (HUB) is a business owned or controlled by Socially and Economically Disadvantaged Individuals as defined by all applicable federal or state laws and local policies, including Black Americans, Hispanic Americans, Native Americans, Asian-Pacific Americans, Asian-Indian Americans, women and individuals with disabilities. A HUB is one that is at least 51 percent owned or controlled by one or more women or Socially and Economically Disadvantaged Individuals who actively participate in the conduct of the business or, in the case of a publicly owned business, one in which at least 51 percent of the stock is controlled by one or more women or Socially and Economically Disadvantaged Individuals. A business that has been certified as a HUB/DBE by an agency of the federal government or the State of Texas is presumed to be a HUB/DBE for purposes of this policy. Only a HUB/DBE with its principal office in Jefferson, Hardin or Orange counties will be recognized as a HUB/DBE for purposes of this policy.
2. The County will require that each abatement contract between itself and any individual or entity seeking the abatement of ad valorem taxes contain a provision requiring the owner, on at least a quarterly basis, and at owner’s cost, to allow the full examination by County or its designated representative(s) of all documents necessary for County to assure that best efforts have been used by owner to utilize local labor, subcontractors, vendors, suppliers and HUB’s/DBE’s. The County will also require that such contracts contain provisions binding the engineering/construction firms utilized as general contractors on the Project to the terms of the abatement contract. (e) Denial of Abatement. Neither a reinvestment or enterprise zone nor abatement agreement shall be authorized if it is determined that: (1) There would be a substantial adverse affect on the provision of government service or tax base; (2) The applicant has insufficient financial capacity; (3) Planned or potential use of the property would constitute a substantial hazard to public safety, health or morals; (4) The project would cause a violation of state or federal laws; or (5) For any other reason deemed appropriate by the County including the pendency of litigation between the individual or entity requesting the creation of the reinvestment or enterprise zone and the County. (f) “Taxability” From the execution of the abatement agreement to the end of the agreement period, taxes shall be payable as follows: (1) The value of ineligible property as provided in Section II(e) shall be fully taxable; and (2) The base year value of existing eligible property as determined each year shall be fully taxable. APPLICATION PROCESS SECTION V (a) Any present owner, potential owner or Lessee of taxable property in the County may request the creation of a reinvestment or enterprise zone and tax abatement by filing a written request with the County Judge. (b) The application shall consist of a completed application form which shall provide detailed information on the items described in Section III(h) hereof; a map and property description; a time schedule for undertaking and completing the planned improvements. In the case of modernization, a statement of the assessed value of the facility, separately stated for real and personal property, shall be given for the tax year immediately preceding the application. The application form may require such financial and other information as may be deemed appropriate for evaluating the financial capacity and other factors of the applicant. The County shall also require an application fee in the amount of $1,000.00 to be submitted with the application. If the application is granted and an abatement contract is entered into by and between the applicant and the County, such application fee will be refunded to applicant. (c) Prior to the adoption of an ordinance order designating a reinvestment or application by the County for designation of an enterprise zone, the County shall: (1) give written notice to the
presiding officer of the governing body of each taxing unit in which the property to be subject to the agreement is located not later than seventh (7th) day before the public hearing; and (2) publish notice of a public hearing in a newspaper of general circulation within such taxing jurisdiction not later than the seventh (7th) day before the public hearing. Before acting upon the application, the County shall, through public hearing, afford the applicant and the designated representative of any governing body referenced hereinabove opportunity to show cause why the abatement should or should not be granted. (d) The County shall make every reasonable effort to either approve or disapprove the application for tax abatement within forty-five (45) days after receipt of the application. The County shall notify the applicant of approval or disapproval. (e) The County shall not establish a reinvestment or enterprise zone or enter into an abatement agreement if it finds that the request for the abatement was filed after the commencement of construction, alteration, or installation or improvements related to a proposed modernization, expansion or new facility. (f) Information that is provided to the County in connection with an application or request for tax abatement and that describes the specific processes or business activities to be conducted or the equipment or other property to be located on the property for which a tax abatement agreement is requested is confidential and not subject to public disclosure pursuant to the Texas Public Information Act until the tax abatement agreement is executed. That information in the possession of a taxing unit after the agreement is executed is not confidential and is subject to disclosure. AGREEMENT SECTION VI (a) Not later than the seventh (7th) day before the date on which the County enters into the abatement agreement, the County shall deliver to the presiding officer of the governing body of each other taxing unit in which the property is located a written notice that the County intends to enter into the agreement. The notice shall include a copy of the prepared agreement. (b) The County shall formally pass a resolution and execute an agreement with the owner of the facility and lessee, as the case may be, which shall include at least the following terms: (1) Estimated value to be abated and the base year value; (2) Percent of value to be abated each year as provided in Section III(g); (3) The commencement date and the termination date of abatement; (4) The proposed use of the facility, nature of construction, time schedule, map, property description and improvement list as provided in application, Section IV(b); (5) Contractual obligations in the event of default, violation of terms or conditions, delinquent taxes, or assignment; (6) Provision for access to and authorization for inspection of the property by County employees to ensure that the improvements or repairs are made according to the specifications and conditions of the agreement; (7) Limitations on the uses of the property consistent with the general purpose of encouraging development or redevelopment of the zone during the period that property tax exemptions are in effect; (8) Provision for recapturing property tax revenue lost as a result of the agreement if the owner of the property fails to make the improvements or repairs as provided by the agreement;
(9) Provision that all permanent jobs be registered with the Texas Workforce Commission and that all contractors shall give preference to and to seek qualified workers through the Texas Workforce Commission. (10) Contain each and every term agreed to by the owner of the property; (11) Requirement that the owner or lessee of the property certify annually to the governing body of each taxing unit that the owner or lessee is in compliance with each applicable term of the agreement; and (12)All terms required by Texas Tax Code §312.205, as amended; Such agreement shall normally be executed within sixty (60) days after the applicant has forwarded all necessary information and documentation to the County. RECAPTURE SECTION VII (a) In the event that the company or individual (1) allows its ad valorem taxes owed the County to become delinquent and fails to timely and properly follow the legal procedures for their protest and/or contest; or (2) violates any of the terms and conditions of the abatement agreement; and fails to cure during the cure period, or discontinues production the agreement then may be terminated and all taxes previously abated by virtue of the agreement will be recaptured and paid within thirty (30) days of the termination. (b) Should the County determine that the company or individual is in default according to the terms and conditions of its agreement, the County shall notify the company or individual of such default in writing at the address stated in the agreement; and if such is not cured within thirty (30) days from the date of such notice (“Cure Period”), then the agreement may be terminated. Alternatively, County may, as a penalty for default or non-compliance with the provisions of an abatement contract, reduce the term of the abatement period and/or the annual percentage abatements available thereunder. (c) Payment in Lieu of Taxes: If, during the period of this abatement, any Federal or State law provides and additional tax exemption for the property that is already the subject of this agreement, Applicant agrees to decline that tax exemption during the period of this abatement. If Applicant is unable to decline that tax exemption, Applicant agrees to pay the taxes, or payment in lieu of taxes, on the reduction of property tax revenue to the County that is the result of said exemption. Any payment in lieu of taxes shall be due on or before November 15 of the year in which payment is due. ADMINISTRATION SECTION VIII (a) The Chief Appraiser of the Jefferson County Appraisal District will annually determine an assessment of the real and personal property subject to each abatement agreement. Each year, the company or individual receiving abatement shall furnish the appraiser with such information as may be necessary to determine compliance with the abatement agreement. Once value has been established, the Chief Appraiser will notify the County of the amount of the assessment. (b) The abatement agreement shall stipulate that employees and/or designated representatives of the County will have access to the facility during the term of the abatement to inspect the facility to determine if the terms and conditions of the agreement are being met. Inspections will only be conducted in such manner as to not unreasonably interfere with the construction and/or
operation of the facility. All inspections will be made with one or more representative of the company or individual and in accordance with its safety standards. (c) Upon completion of construction, the designated representative of the Owner shall annually evaluate each facility receiving abatement to insure compliance with the agreement, and a formal report shall be made to the County. (d) During the course of construction of the Project, Owner and it’s general contractor shall, on at least a quarterly basis, meet with designated County representatives to assure compliance with the terms of the abatement agreement. Owner shall be responsible to County for the payment of costs associated with such monitoring. In the event it is determined that Owner or its contractors have failed to comply with the terms of the abatement agreement, then County may terminate the abatement agreement or, in County’s discretion, reduce the duration or annual percentages of such abatement. (e) During construction, the Applicant shall maintain appropriate records of the employees affected by this abatement, including but not limited to, proof of employees’ legal residence, proof of immigration-resident status, and, if applicable, such other documentation that may be required to document compliance with the Agreement (f) The Chief Appraiser of the Jefferson County Appraisal District shall timely file with the Texas Department of Economic Development and the State Property Tax Board all information required by the Tax Code. (g) All requirements of the Abatement Agreement shall apply to Applicant’s contractors/subcontractors and Applicant shall ensure that they abide by the terms of the Agreement. AGREEMENT SECTION IX Abatement may be transferred, assumed and assigned in whole or in part by the holder to a new owner or lessee of the same facility upon the approval by resolution of the Commissioners’ Court; subject to the financial capacity of the assignee and provided that all conditions and obligations in the abatement agreement are guaranteed. No assignment or transfer shall be approved if the parties to the existing agreement, the new owner or new lessee are liable to any jurisdiction for outstanding taxes or other obligations. Approval shall not be unreasonably withheld. As a condition of transfer, an assignment fee of 1% may be required, with the maximum fee being $10,000.00 SUNSET PROVISION SECTION X These guidelines and criteria are effective upon the date of their adoption and will remain in force for two years, unless amended by three-quarters of the Commissioners’ Court at which time all reinvestment and enterprise zones and tax abatement agreements created pursuant to these provisions will be reviewed to determine whether the goals have been achieved. Based on that review, the guidelines and criteria may be modified, renewed or eliminated.
DISCRETION OF THE COUNTY SECTION XI The adoption of these guidelines and criteria by the County does not: (1) Limit the discretion of the County to decide whether to enter into a specific tax abatement agreement; (2) Limit the discretion of the County to delegate to its employees the authority to determine whether or not the County should consider a particular application or request for tax abatement; or (3) Create any property, contract, or other legal rights in any person to have the County consider or grant a specific application or request for tax abatement.
QUESTIONS TO BE ANSWERED IN ORDER TO DEVELOP AN APPLICATION AND ECONOMIC IMPACT STATEMENT
FOR VALUE ADDED TAX ABATEMENTS IN JEFFERSON COUNTY
General: Jefferson County will provide a representative to assist in preparation and presentation of all documents and to guide them through the abatement process. Opening Paragraph: The application should include a summary statement about the company and its operations. This information can come from an annual report, corporate 10K or other document provided by the company. (Please include these documents with this questionnaire.) Economic Impact Analysis: The application must include the attachment of an independently prepared economic impact analysis of the proposed facility as it impacts the local economy detailing the information referred in Section III herein. Maps and Plats Provide maps, plats, and drawings necessary to establish the location of the improvements and their relationships to the boundaries of cities, ETJ’s, and reinvestment or enterprise zone boundaries. Questions to be Answered (1) Is your project within a city limit? . Name of City (2) Is your project within an ETJ? . Name of City (3) Is your project within an Enterprise or Reinvestment Zone? Which?
(4) Will you own the realty or lease the realty? (5) Present Appraisal District value of land and any EXISTING improvements owned by the OWNER: (Answer this question based on Appraisal District records for the specific site you select.) Cost of Land (If you are purchasing): $_____________________ Number of Acres:__________ or Square Feet: ______________ (6)Type and value of proposed improvements: ________________________________ Type of construction: (Tiltwall, Build-Out of Existing Facility, Etc.) Value of Construction: Value of Equipment: Value of Personal Property: Value of Pollution Control Devices: (7) Productive life of proposed improvements:_____ years, or term of initial lease:___________ (8) Number of existing jobs to be retained by proposed improvements: _____________ (Answer only if the location is already in or near Jefferson County and now employs Jefferson residents.) (9) Number and types of new jobs to be created by proposed improvements:__________ (10) Amount of Annual local payroll to be created: ________________________. (11) What percentage and type of jobs to be created will Jefferson residents have the opportunity to fill? ________________________________________________ (12) Amount property tax base valuation will be increased: During term of abatement: ____________________________ After term of abatement: ____________________________ (13) The costs to be incurred by local government to provide facilities or services directly resulting from the new improvements:________________________________________ (Explain any costs for development or depletion of infrastructure the city is being asked to absorb, if any.) (14) The amount of ad valorem taxes to be paid to the county during the abatement period considering: (a) the existing values; (b) the percentage of new value abated; (c) the abatement period; and (d) the value after expiration of the abatement period. (15) The population growth of the county that will occur directly as a result of new improvements: ________________________________________________ (If you relocate to Jefferson County, how many of your employees do you anticipate to relocate?)
(16) The types and values of public improvements, if any, to be made by applicant seeking abatement: _________________________________________________________________ _______________________________________________________________________ ___________________________________________________________ (List any facilities from which the public might benefit.) (17) Do the proposed improvements compete with existing businesses to the detriment of the local economy: __________________________________________________________ (18) The impact on the business opportunities of existing businesses: _______________________________________________________________ _______________________________________________________________ (Are there possibilities for local businesses to become suppliers? Any new retail opportunities?) (19) The attraction of other new businesses to the area: ______________________________________________________________________ _______________________________________________________________ (Will any of your suppliers, customers, parent, or sister companies relocate because of your relocation?) (20) The overall compatibility with the zoning ordinances and comprehensive plan for the area: (21) Describe, including the estimated value, all pollution control devices and other improvements for which you intend to seek TNRCC exemption from taxation: NOTE: Failure to accurately disclose exempted property may result in a total default under the Abatement Contract, resulting in recapture of previously abated taxes and forfeiture of future abatement. EXHIBIT “A”
JEFFERSON COUNTY APPRAISAL DISTRICT PROCEDURE FOR CALCULATING ABATEMENTS
Purpose
The purpose of this procedure is to clarify the method used in calculating the tax abatement under the attached Contract. This requires calculation of the current market Value, Base Year Value, and taxable Value as these terms are defined below. By deducting the abatable value from the current market Value the Taxable Value may be determined. However, in accordance with the Jefferson County Uniform Tax Abatement Policy, the Real Property Owner’s Current Taxable Value shall not be less than the Base Year Value in order for a project to receive the full amount of abatement.
Calculation of “Current Market Value”
“Current Market Value” is determined by calculating for that Tax Year the market value of all industrial realty improvements of a property owner that comprise the “Base year Value” or each taxing entity.
Calculation Base Year Value”
“Base Year Value” for each taxing entity executing an abatement contract is the market value of all industrial realty improvements of a property owner located within that entity for the tax period defined as the “Base Year” less the abated value of all projects granted by that entity for the “Base year.” “Base year” is defined as the calendar year in which the abatement contract is executed (signed).
Calculation of “Taxable Value”
“Taxable Value” for each taxing entity is determined by deducting from the appraised market value of all industrial realty improvements of a property owner the amount of any applicable abatements granted for that Tax Year.
Calculation of Value Potentially Eligible for Abatement
The following procedures are followed for each project for which a tax abatement contract has been executed and for each taxing entity granting the abatement. 1. The project base value, if applicable, is subtracted from the current year project value, and the percentage of abatement to be granted is then applied to the net amount determine the project value subject to abatement. 2. The Base Year Value is subtracted from the current Market Value. If the difference is greater than zero (0), then the remaining value is the value potentially eligible for abatement to the extent that it does not exceed the project value subject to abatement. If the difference is zero (0) or less, then the project is not eligible for an abatement for that Tax Year.
Calculation of Abated Value
Each project that remains potentially eligible for abatement is then tested for each taxing entity granting the abatement on an individual basis in chronological order based on the date the contract was executed. 1. For the project being tested, the Base year Value plus the value potentially eligible for abatement for all other projects is subtracted from the Current Market Value. If the difference is greater than zero (0), then the remaining value is the value of the project to be abated to the extent that it does not exceed the project value subject to abatement for that year. If the difference is zero (0) or less, then the project is not eligible for an abatement for that Tax Year. If a subsequent project being tested is determined to be ineligible for the full value potentially eligible for abatement calculated previously after performing the calculation stated above, then the test process must be redone for all prior projects using the actual value subject to abatement for the subsequent project to determine if there is any effect on the abatement for each project and each taxing entity for that Tax Year.