Embed Size (px)
Citation preview
E-Payables 2011 Efficiency, Visibility, and Collaboration in the Financial Supply Chain
September 2011
Scott Pezza
~ Underwritten, in Part, by ~
E-Payables 2011: Efficiency, Visibility, and Collaboration in the Financial Supply Chain Page 2
© 2011 Aberdeen Group. Telephone: 617 854 5200 www.aberdeen.com Fax: 617 723 7897
Executive Summary Accounts Payable (AP) exists largely in a paper-based world, though the tides are slowly changing. Enterprises are seeking ways to drive down volumes of incoming paper invoices and to migrate from traditional check payments to faster electronic alternatives. This study, based on the responses of 116 professionals gathered in July and August of 2011, examines the best practices of high-performing organizations to see what aspects of invoice receipt, approval processing, payment, and audit serve to differentiate them from their lower-performing counterparts.
Best-in-Class Performance Aberdeen used the following three key performance criteria to distinguish Best-in-Class companies:
• 5.3 days to process an invoice from receipt through settlement
• 60% of invoices paid early enough to secure early payment discounts
• $7.78 average cost to process an invoice from receipt through settlement (96% able to measure invoice processing costs)
Competitive Maturity Assessment Survey results show that the firms enjoying Best-in-Class performance shared several common characteristics as compared to Laggards:
• 3.8-times as likely to have established pre-negotiated, fixed early payment discounts
• 2.6-times as likely to have automated alerts to notify managers of payments exceeding pre-defined thresholds
• 1.4-times as likely to have segmented their supply base for electronic payment enablement
Required Actions In addition to the specific recommendations in Chapter Three of this report, to achieve Best-in-Class performance, companies must:
• Take a step back, and view the entire payments cycle as a whole. Instead of approaching each piece in isolation, focus on how changes in one area may have positive (or negative) results downstream.
• Do not lose sight of the importance of quality. Selecting an enabling technology is more complicated than checking a box, or finding the lowest-cost provider.
• Remember that the greatest benefit of efficiency is control: it provides opportunities for discount capture and allows you to make choices when it comes time for payment.
Research Benchmark
Aberdeen’s Research Benchmarks provide an in-depth and comprehensive look into process, procedure, methodologies, and technologies with best practice identification and actionable recommendations
This document is the result of primary research performed by Aberdeen Group. Aberdeen Group's methodologies provide for objective fact-based research and represent the best analysis available at the time of publication. Unless otherwise noted, the entire contents of this publication are copyrighted by Aberdeen Group, Inc. and may not be reproduced, distributed, archived, or transmitted in any form or by any means without prior written consent by Aberdeen Group, Inc.
E-Payables 2011: Efficiency, Visibility, and Collaboration in the Financial Supply Chain Page 3
© 2011 Aberdeen Group. Telephone: 617 854 5200 www.aberdeen.com Fax: 617 723 7897
Table of Contents Executive Summary....................................................................................................... 2
Best-in-Class Performance..................................................................................... 2 Competitive Maturity Assessment....................................................................... 2 Required Actions...................................................................................................... 2
Chapter One: Benchmarking the Best-in-Class.................................................... 4 Business Context ..................................................................................................... 4 The Maturity Class Framework............................................................................ 5 The Best-in-Class PACE Model ............................................................................ 6 Best-in-Class Strategies........................................................................................... 6
Chapter Two: Benchmarking Requirements for Success................................... 9 Competitive Assessment........................................................................................ 9 Capabilities and Enablers......................................................................................10
Chapter Three: Required Actions .........................................................................17 Laggard Steps to Success......................................................................................17 Industry Average Steps to Success ....................................................................17 Best-in-Class Steps to Success ............................................................................18
Appendix A: Research Methodology.....................................................................19 Appendix B: Related Aberdeen Research............................................................21 Featured Underwriters ..............................................................................................22
Figures Figure 1: Pressures Driving a Focus on E-Payables ............................................... 4 Figure 2: Top Strategies for Accounts Payable Improvement ............................ 7 Figure 3: Prevalence of Discounting and Financing Programs ..........................11 Figure 4: Technology Choices of the Best-in-Class ............................................13 Figure 5: Current and Preferred AP Solution Types ..........................................15 Figure 6: Current and Preferred AP Deployment Models ................................16
Tables Table 1: Top Performers Earn Best-in-Class Status.............................................. 5 Table 2: The Best-in-Class PACE Framework ....................................................... 6 Table 3: Payment Types by Volume, Recent and Planned Changes.................. 8 Table 4: The Competitive Framework..................................................................... 9 Table 5: The PACE Framework Key ......................................................................20 Table 6: The Competitive Framework Key ..........................................................20 Table 7: The Relationship Between PACE and the Competitive Framework.........................................................................................................................................20
E-Payables 2011: Efficiency, Visibility, and Collaboration in the Financial Supply Chain Page 4
© 2011 Aberdeen Group. Telephone: 617 854 5200 www.aberdeen.com Fax: 617 723 7897
Chapter One: Benchmarking the Best-in-Class
Business Context For the better part of the past decade, the story of accounts payable has remained largely the same. Its focus has been on the promise of technology to cut down volumes of paper invoices and checks, with the resulting efficiencies driving down processing times and costs, and maximizing discount capture. That is not to say that there have not been incremental gains over the years. For example, in Aberdeen's 2004 Invoice Reconciliation and Payment study, over two-thirds of responding enterprises reported that paper-based invoices accounted for at least 80% of their total volume; in the 2011 Invoicing and Workflow report, only one-third of respondents reported similar levels. Aside from these types of improvements, however, accounts payable remains a largely manual business function that holds tremendous potential for future large-scale improvement.
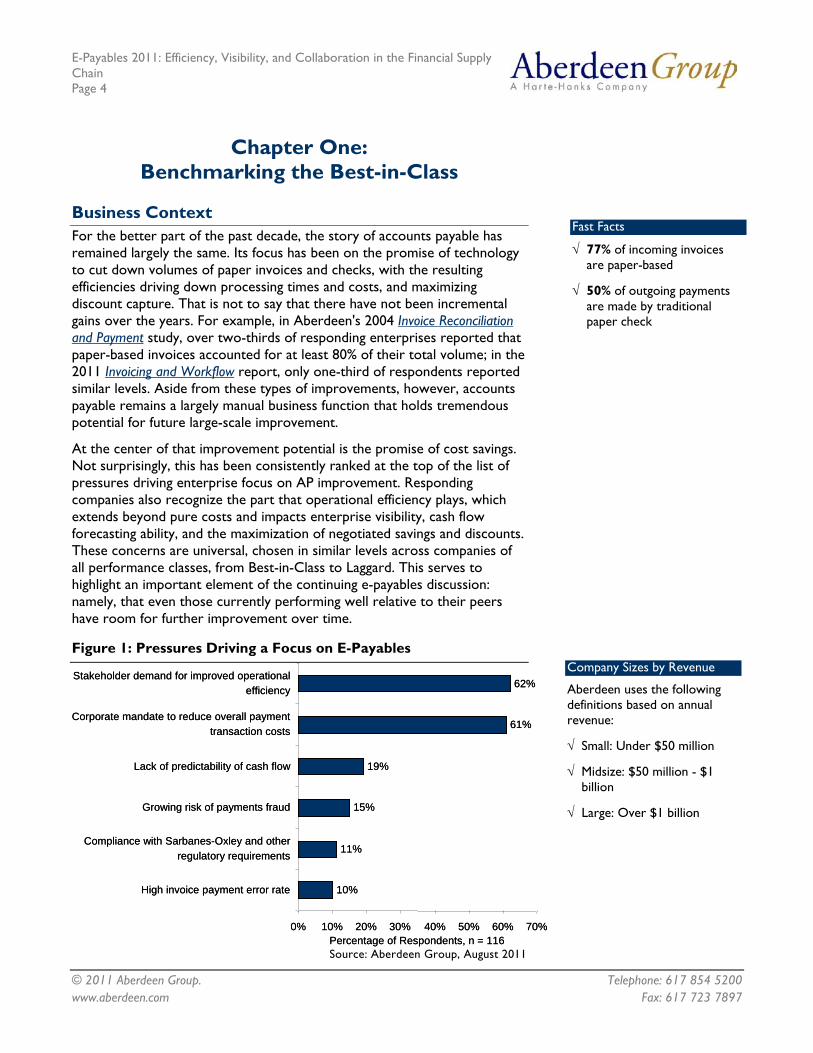
At the center of that improvement potential is the promise of cost savings. Not surprisingly, this has been consistently ranked at the top of the list of pressures driving enterprise focus on AP improvement. Responding companies also recognize the part that operational efficiency plays, which extends beyond pure costs and impacts enterprise visibility, cash flow forecasting ability, and the maximization of negotiated savings and discounts. These concerns are universal, chosen in similar levels across companies of all performance classes, from Best-in-Class to Laggard. This serves to highlight an important element of the continuing e-payables discussion: namely, that even those currently performing well relative to their peers have room for further improvement over time.
Figure 1: Pressures Driving a Focus on E-Payables
10%
11%
15%
19%
61%
62%
0% 10% 20% 30% 40% 50% 60% 70%
High invoice payment error rate
Compliance with Sarbanes-Oxley and otherregulatory requirements
Growing risk of payments fraud
Lack of predictability of cash flow
Corporate mandate to reduce overall paymenttransaction costs
Stakeholder demand for improved operationalefficiency
Percentage of Respondents, n = 116
10%
11%
15%
19%
61%
62%
0% 10% 20% 30% 40% 50% 60% 70%
High invoice payment error rate
Compliance with Sarbanes-Oxley and otherregulatory requirements
Growing risk of payments fraud
Lack of predictability of cash flow
Corporate mandate to reduce overall paymenttransaction costs
Stakeholder demand for improved operationalefficiency
Percentage of Respondents, n = 116 Source: Aberdeen Group, August 2011
Fast Facts
√ 77% of incoming invoices are paper-based
√ 50% of outgoing payments are made by traditional paper check
Company Sizes by Revenue
Aberdeen uses the following definitions based on annual revenue:
√ Small: Under $50 million
√ Midsize: $50 million - $1 billion
√ Large: Over $1 billion
E-Payables 2011: Efficiency, Visibility, and Collaboration in the Financial Supply Chain Page 5
© 2011 Aberdeen Group. Telephone: 617 854 5200 www.aberdeen.com Fax: 617 723 7897
While these pressures are reported with similar frequencies across the different performance groups, some interesting differences emerge when comparing companies based on their annual revenues. Large enterprises selected cost reduction nearly twice as often as small companies (85% versus 44%), while they were also far less likely than those small companies to cite concerns over cash flow predictability (6% versus 31%) and risk of payments fraud (6% versus 19%). For most pressures, midsize companies tended to occupy the middle-ground between small and large, with the exception of operational efficiency (71%), which they reported more often than both their small and large counterparts (56% and 62%, respectively). This presents a picture of small companies waging battles on multiple fronts, while midsize and large companies are focused more intently on cost and efficiency. These differences help set the context for the varied strategies each group is employing, which adds another perspective to the performance-based evaluation that follows.
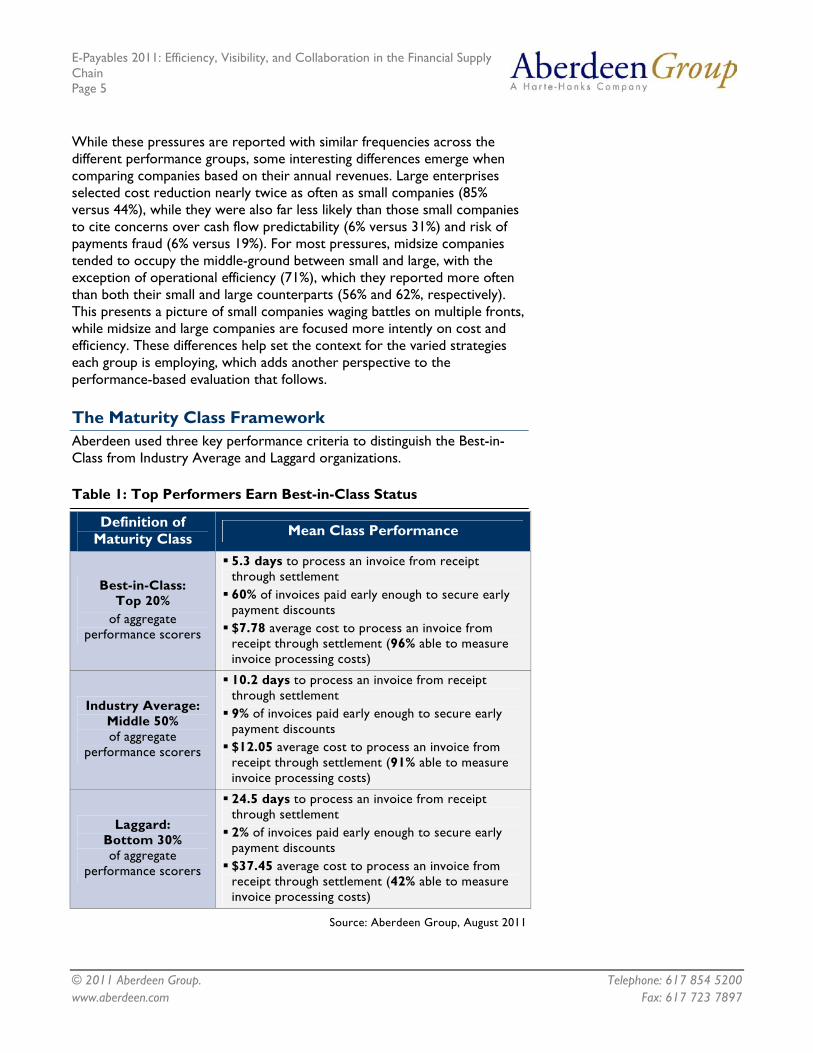
The Maturity Class Framework Aberdeen used three key performance criteria to distinguish the Best-in-Class from Industry Average and Laggard organizations.
Table 1: Top Performers Earn Best-in-Class Status
Definition of Maturity Class Mean Class Performance
Best-in-Class: Top 20%
of aggregate performance scorers
5.3 days to process an invoice from receipt through settlement 60% of invoices paid early enough to secure early payment discounts $7.78 average cost to process an invoice from receipt through settlement (96% able to measure invoice processing costs)
Industry Average: Middle 50% of aggregate
performance scorers
10.2 days to process an invoice from receipt through settlement 9% of invoices paid early enough to secure early payment discounts $12.05 average cost to process an invoice from receipt through settlement (91% able to measure invoice processing costs)
Laggard: Bottom 30% of aggregate
performance scorers
24.5 days to process an invoice from receipt through settlement 2% of invoices paid early enough to secure early payment discounts $37.45 average cost to process an invoice from receipt through settlement (42% able to measure invoice processing costs)
Source: Aberdeen Group, August 2011
E-Payables 2011: Efficiency, Visibility, and Collaboration in the Financial Supply Chain Page 6
© 2011 Aberdeen Group. Telephone: 617 854 5200 www.aberdeen.com Fax: 617 723 7897
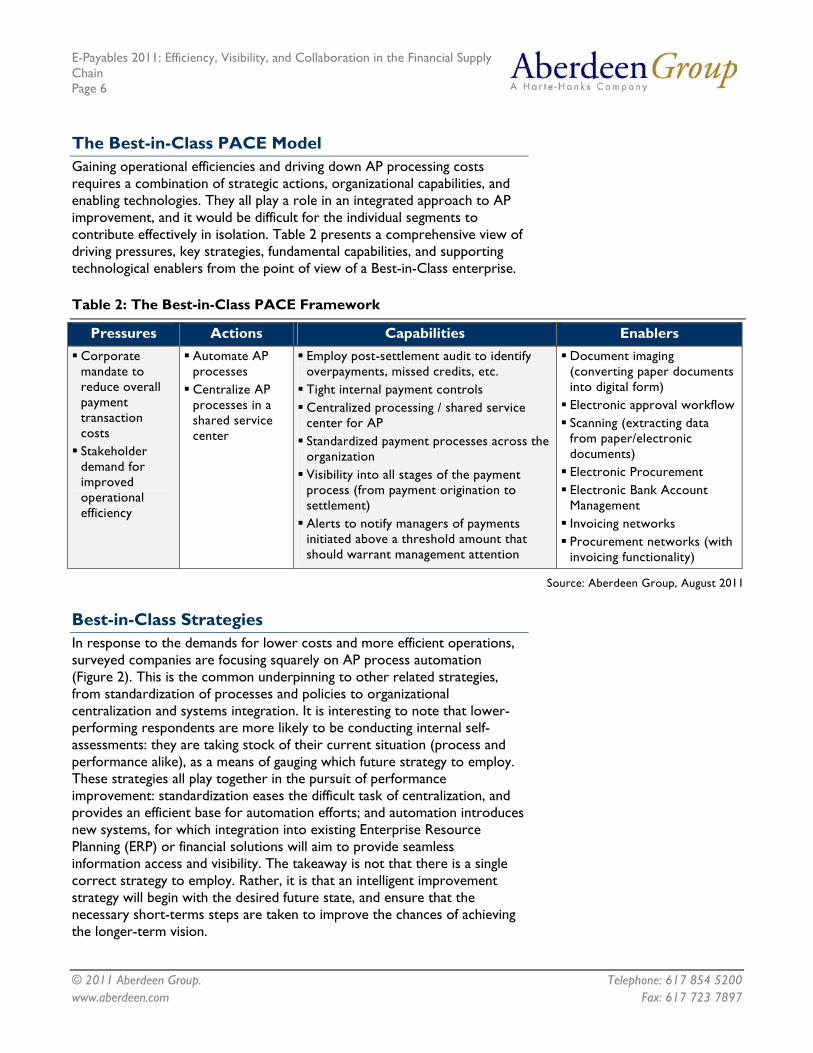
The Best-in-Class PACE Model Gaining operational efficiencies and driving down AP processing costs requires a combination of strategic actions, organizational capabilities, and enabling technologies. They all play a role in an integrated approach to AP improvement, and it would be difficult for the individual segments to contribute effectively in isolation. Table 2 presents a comprehensive view of driving pressures, key strategies, fundamental capabilities, and supporting technological enablers from the point of view of a Best-in-Class enterprise.
Table 2: The Best-in-Class PACE Framework
Pressures Actions Capabilities Enablers Corporate mandate to reduce overall payment transaction costs Stakeholder demand for improved operational efficiency
Automate AP processes Centralize AP processes in a shared service center
Employ post-settlement audit to identify overpayments, missed credits, etc. Tight internal payment controls Centralized processing / shared service center for AP Standardized payment processes across the organization Visibility into all stages of the payment process (from payment origination to settlement) Alerts to notify managers of payments initiated above a threshold amount that should warrant management attention
Document imaging (converting paper documents into digital form) Electronic approval workflow Scanning (extracting data from paper/electronic documents) Electronic Procurement Electronic Bank Account Management Invoicing networks Procurement networks (with invoicing functionality)
Source: Aberdeen Group, August 2011
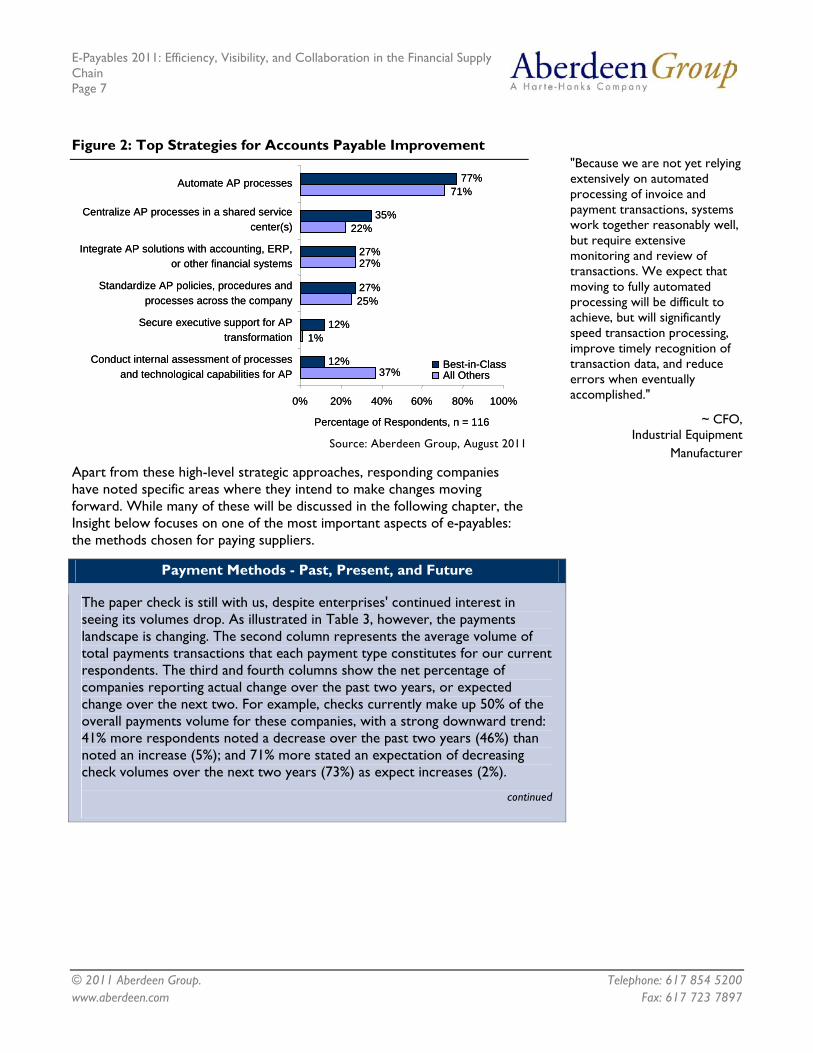
Best-in-Class Strategies In response to the demands for lower costs and more efficient operations, surveyed companies are focusing squarely on AP process automation (Figure 2). This is the common underpinning to other related strategies, from standardization of processes and policies to organizational centralization and systems integration. It is interesting to note that lower-performing respondents are more likely to be conducting internal self-assessments: they are taking stock of their current situation (process and performance alike), as a means of gauging which future strategy to employ. These strategies all play together in the pursuit of performance improvement: standardization eases the difficult task of centralization, and provides an efficient base for automation efforts; and automation introduces new systems, for which integration into existing Enterprise Resource Planning (ERP) or financial solutions will aim to provide seamless information access and visibility. The takeaway is not that there is a single correct strategy to employ. Rather, it is that an intelligent improvement strategy will begin with the desired future state, and ensure that the necessary short-terms steps are taken to improve the chances of achieving the longer-term vision.
E-Payables 2011: Efficiency, Visibility, and Collaboration in the Financial Supply Chain Page 7
© 2011 Aberdeen Group. Telephone: 617 854 5200 www.aberdeen.com Fax: 617 723 7897
Figure 2: Top Strategies for Accounts Payable Improvement
37%
1%
25%
27%
22%
71%
12%
12%
27%
27%
35%
77%
0% 20% 40% 60% 80% 100%
Conduct internal assessment of processesand technological capabilities for AP
Secure executive support for APtransformation
Standardize AP policies, procedures andprocesses across the company
Integrate AP solutions with accounting, ERP,or other financial systems
Centralize AP processes in a shared servicecenter(s)
Automate AP processes
Percentage of Respondents, n = 116
Best-in-ClassAll Others37%
1%
25%
27%
22%
71%
12%
12%
27%
27%
35%
77%
0% 20% 40% 60% 80% 100%
Conduct internal assessment of processesand technological capabilities for AP
Secure executive support for APtransformation
Standardize AP policies, procedures andprocesses across the company
Integrate AP solutions with accounting, ERP,or other financial systems
Centralize AP processes in a shared servicecenter(s)
Automate AP processes
Percentage of Respondents, n = 116
Best-in-ClassAll Others
Source: Aberdeen Group, August 2011
Apart from these high-level strategic approaches, responding companies have noted specific areas where they intend to make changes moving forward. While many of these will be discussed in the following chapter, the Insight below focuses on one of the most important aspects of e-payables: the methods chosen for paying suppliers.
Payment Methods - Past, Present, and Future
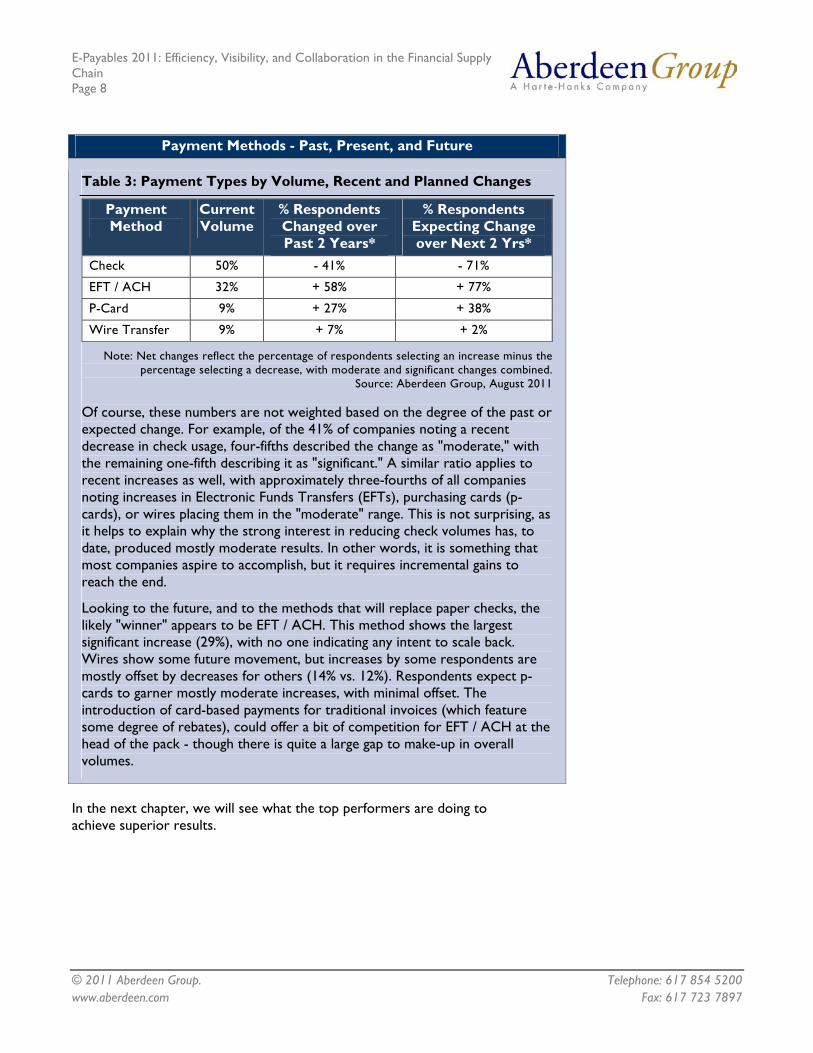
The paper check is still with us, despite enterprises' continued interest in seeing its volumes drop. As illustrated in Table 3, however, the payments landscape is changing. The second column represents the average volume of total payments transactions that each payment type constitutes for our current respondents. The third and fourth columns show the net percentage of companies reporting actual change over the past two years, or expected change over the next two. For example, checks currently make up 50% of the overall payments volume for these companies, with a strong downward trend: 41% more respondents noted a decrease over the past two years (46%) than noted an increase (5%); and 71% more stated an expectation of decreasing check volumes over the next two years (73%) as expect increases (2%).
continued
"Because we are not yet relying extensively on automated processing of invoice and payment transactions, systems work together reasonably well, but require extensive monitoring and review of transactions. We expect that moving to fully automated processing will be difficult to achieve, but will significantly speed transaction processing, improve timely recognition of transaction data, and reduce errors when eventually accomplished."
~ CFO, Industrial Equipment
Manufacturer
E-Payables 2011: Efficiency, Visibility, and Collaboration in the Financial Supply Chain Page 8
© 2011 Aberdeen Group. Telephone: 617 854 5200 www.aberdeen.com Fax: 617 723 7897
Payment Methods - Past, Present, and Future
Table 3: Payment Types by Volume, Recent and Planned Changes
Payment Method
Current Volume
% Respondents Changed over Past 2 Years*
% Respondents Expecting Change over Next 2 Yrs*
Check 50% - 41% - 71%
EFT / ACH 32% + 58% + 77%
P-Card 9% + 27% + 38%
Wire Transfer 9% + 7% + 2%
Note: Net changes reflect the percentage of respondents selecting an increase minus the percentage selecting a decrease, with moderate and significant changes combined.
Source: Aberdeen Group, August 2011
Of course, these numbers are not weighted based on the degree of the past or expected change. For example, of the 41% of companies noting a recent decrease in check usage, four-fifths described the change as "moderate," with the remaining one-fifth describing it as "significant." A similar ratio applies to recent increases as well, with approximately three-fourths of all companies noting increases in Electronic Funds Transfers (EFTs), purchasing cards (p-cards), or wires placing them in the "moderate" range. This is not surprising, as it helps to explain why the strong interest in reducing check volumes has, to date, produced mostly moderate results. In other words, it is something that most companies aspire to accomplish, but it requires incremental gains to reach the end.
Looking to the future, and to the methods that will replace paper checks, the likely "winner" appears to be EFT / ACH. This method shows the largest significant increase (29%), with no one indicating any intent to scale back. Wires show some future movement, but increases by some respondents are mostly offset by decreases for others (14% vs. 12%). Respondents expect p-cards to garner mostly moderate increases, with minimal offset. The introduction of card-based payments for traditional invoices (which feature some degree of rebates), could offer a bit of competition for EFT / ACH at the head of the pack - though there is quite a large gap to make-up in overall volumes.
In the next chapter, we will see what the top performers are doing to achieve superior results.
E-Payables 2011: Efficiency, Visibility, and Collaboration in the Financial Supply Chain Page 9
© 2011 Aberdeen Group. Telephone: 617 854 5200 www.aberdeen.com Fax: 617 723 7897
Chapter Two: Benchmarking Requirements for Success
The ultimate success of an AP improvement initiative requires the cultivation of capabilities, implementation of measures, and integration of related technologies and business functions to drive down costs, speed up processing times, and improve overall visibility. This chapter examines the steps Best-in-Class enterprises have taken when positioning themselves for performance improvement.
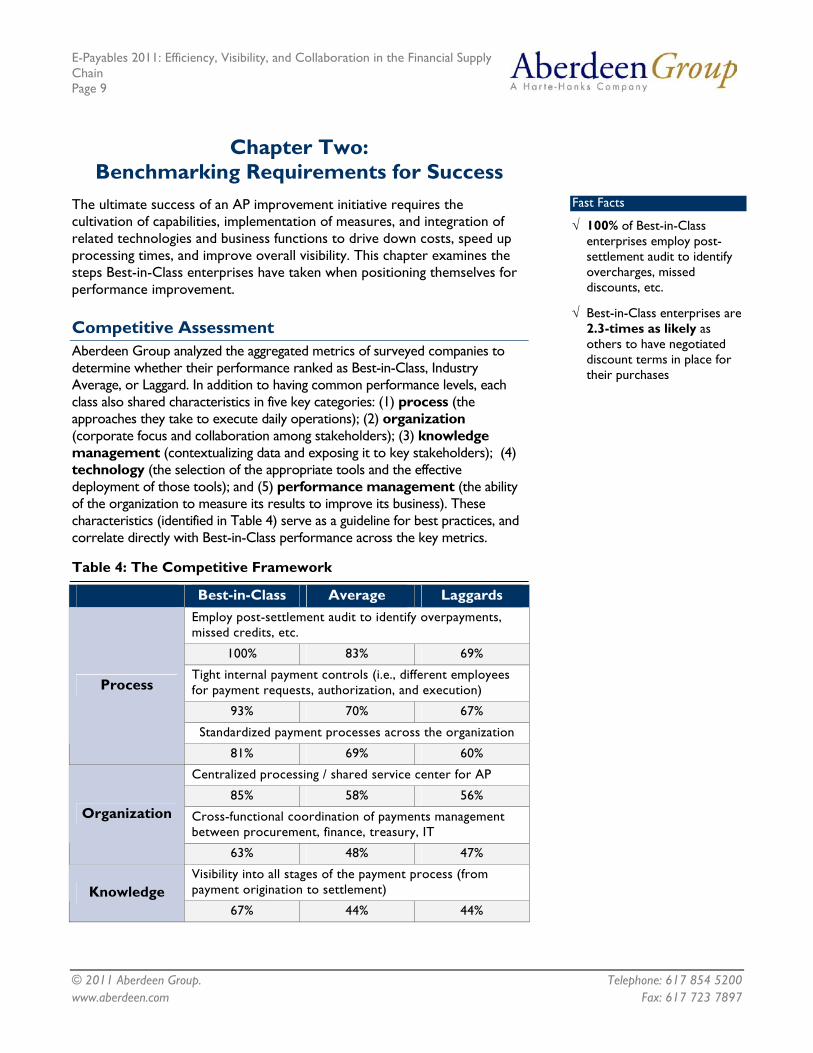
Competitive Assessment Aberdeen Group analyzed the aggregated metrics of surveyed companies to determine whether their performance ranked as Best-in-Class, Industry Average, or Laggard. In addition to having common performance levels, each class also shared characteristics in five key categories: (1) process (the approaches they take to execute daily operations); (2) organization (corporate focus and collaboration among stakeholders); (3) knowledge management (contextualizing data and exposing it to key stakeholders); (4) technology (the selection of the appropriate tools and the effective deployment of those tools); and (5) performance management (the ability of the organization to measure its results to improve its business). These characteristics (identified in Table 4) serve as a guideline for best practices, and correlate directly with Best-in-Class performance across the key metrics.
Table 4: The Competitive Framework
Best-in-Class Average Laggards Employ post-settlement audit to identify overpayments, missed credits, etc.
100% 83% 69%
Tight internal payment controls (i.e., different employees for payment requests, authorization, and execution)
93% 70% 67%
Standardized payment processes across the organization
Process
81% 69% 60%
Centralized processing / shared service center for AP
85% 58% 56%
Cross-functional coordination of payments management between procurement, finance, treasury, IT
Organization
63% 48% 47%
Visibility into all stages of the payment process (from payment origination to settlement) Knowledge
67% 44% 44%
Fast Facts
√ 100% of Best-in-Class enterprises employ post-settlement audit to identify overcharges, missed discounts, etc.
√ Best-in-Class enterprises are 2.3-times as likely as others to have negotiated discount terms in place for their purchases
E-Payables 2011: Efficiency, Visibility, and Collaboration in the Financial Supply Chain Page 10
© 2011 Aberdeen Group. Telephone: 617 854 5200 www.aberdeen.com Fax: 617 723 7897
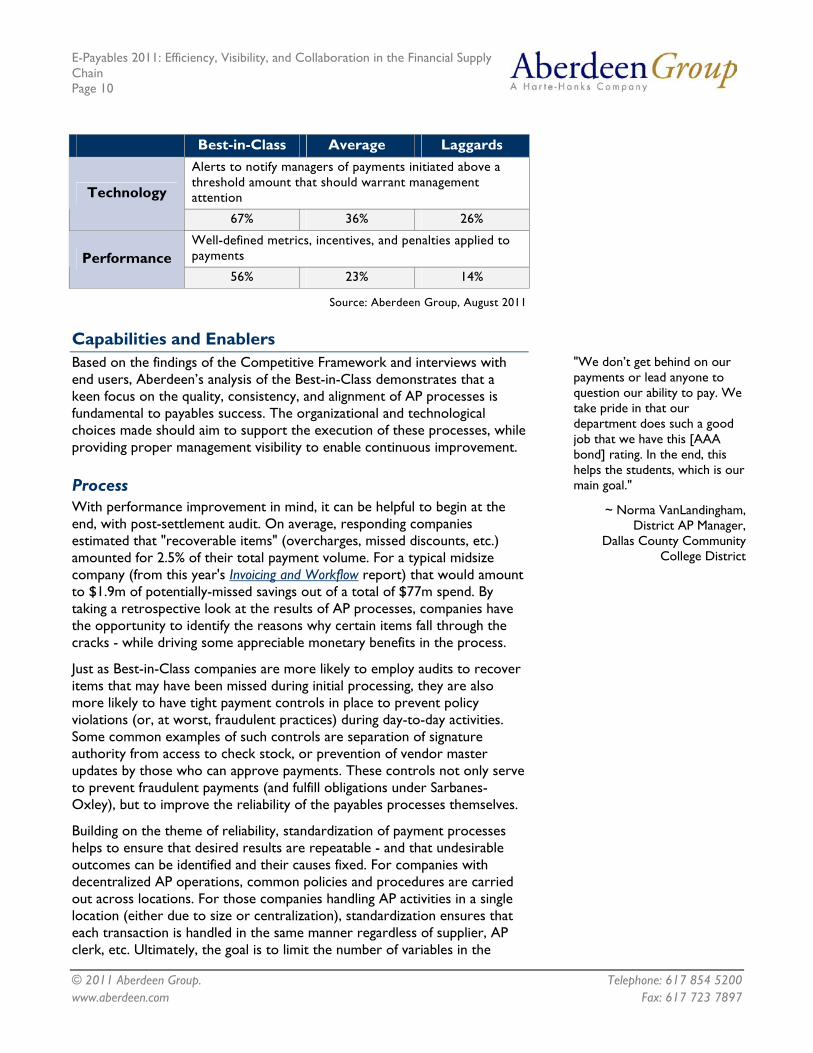
Best-in-Class Average Laggards Alerts to notify managers of payments initiated above a threshold amount that should warrant management attention Technology
67% 36% 26%
Well-defined metrics, incentives, and penalties applied to payments Performance
56% 23% 14%
Source: Aberdeen Group, August 2011
Capabilities and Enablers Based on the findings of the Competitive Framework and interviews with end users, Aberdeen’s analysis of the Best-in-Class demonstrates that a keen focus on the quality, consistency, and alignment of AP processes is fundamental to payables success. The organizational and technological choices made should aim to support the execution of these processes, while providing proper management visibility to enable continuous improvement.
Process With performance improvement in mind, it can be helpful to begin at the end, with post-settlement audit. On average, responding companies estimated that "recoverable items" (overcharges, missed discounts, etc.) amounted for 2.5% of their total payment volume. For a typical midsize company (from this year's Invoicing and Workflow report) that would amount to $1.9m of potentially-missed savings out of a total of $77m spend. By taking a retrospective look at the results of AP processes, companies have the opportunity to identify the reasons why certain items fall through the cracks - while driving some appreciable monetary benefits in the process.
Just as Best-in-Class companies are more likely to employ audits to recover items that may have been missed during initial processing, they are also more likely to have tight payment controls in place to prevent policy violations (or, at worst, fraudulent practices) during day-to-day activities. Some common examples of such controls are separation of signature authority from access to check stock, or prevention of vendor master updates by those who can approve payments. These controls not only serve to prevent fraudulent payments (and fulfill obligations under Sarbanes-Oxley), but to improve the reliability of the payables processes themselves.
Building on the theme of reliability, standardization of payment processes helps to ensure that desired results are repeatable - and that undesirable outcomes can be identified and their causes fixed. For companies with decentralized AP operations, common policies and procedures are carried out across locations. For those companies handling AP activities in a single location (either due to size or centralization), standardization ensures that each transaction is handled in the same manner regardless of supplier, AP clerk, etc. Ultimately, the goal is to limit the number of variables in the
"We don’t get behind on our payments or lead anyone to question our ability to pay. We take pride in that our department does such a good job that we have this [AAA bond] rating. In the end, this helps the students, which is our main goal."
~ Norma VanLandingham, District AP Manager,
Dallas County Community College District
E-Payables 2011: Efficiency, Visibility, and Collaboration in the Financial Supply Chain Page 11
© 2011 Aberdeen Group. Telephone: 617 854 5200 www.aberdeen.com Fax: 617 723 7897
process, to make identifying flaws as easy as possible in support of continued improvement efforts.
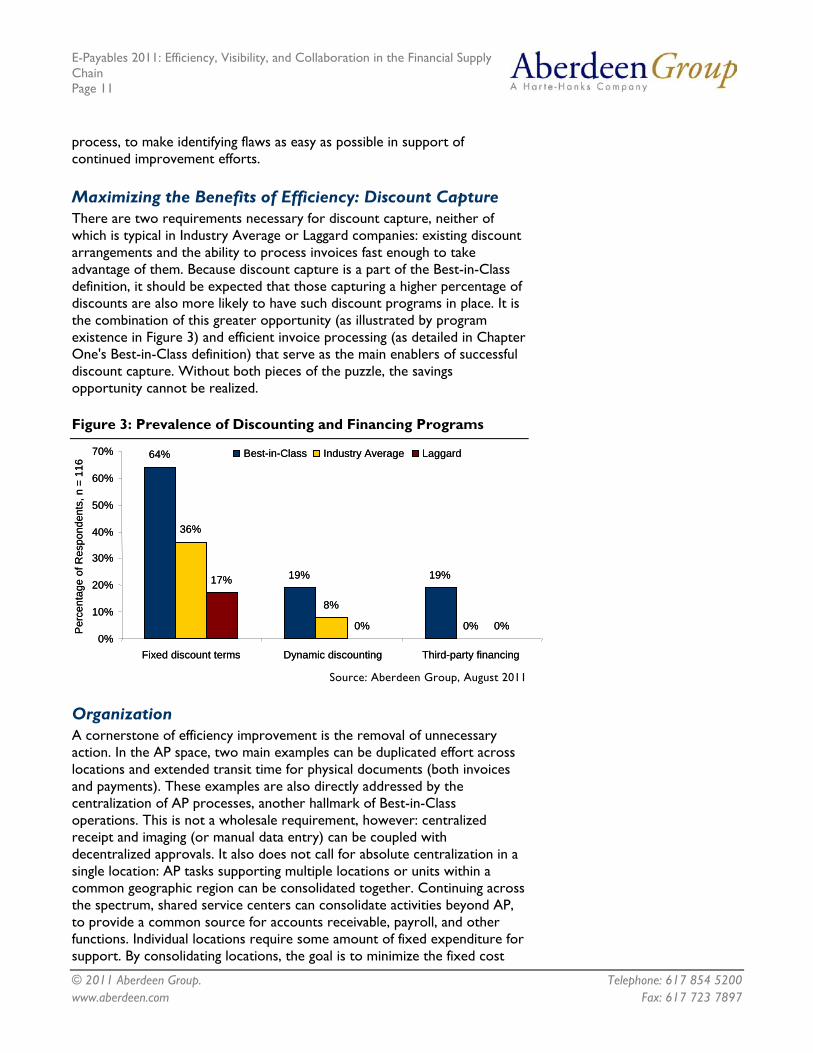
Maximizing the Benefits of Efficiency: Discount Capture There are two requirements necessary for discount capture, neither of which is typical in Industry Average or Laggard companies: existing discount arrangements and the ability to process invoices fast enough to take advantage of them. Because discount capture is a part of the Best-in-Class definition, it should be expected that those capturing a higher percentage of discounts are also more likely to have such discount programs in place. It is the combination of this greater opportunity (as illustrated by program existence in Figure 3) and efficient invoice processing (as detailed in Chapter One's Best-in-Class definition) that serve as the main enablers of successful discount capture. Without both pieces of the puzzle, the savings opportunity cannot be realized.
Figure 3: Prevalence of Discounting and Financing Programs
64%
19% 19%
36%
8%
0%
17%
0% 0%0%
10%
20%
30%
40%
50%
60%
70%
Fixed discount terms Dynamic discounting Third-party financing
Per
cent
age
of R
espo
nden
ts, n
= 1
16
Best-in-Class Industry Average Laggard64%
19% 19%
36%
8%
0%
17%
0% 0%0%
10%
20%
30%
40%
50%
60%
70%
Fixed discount terms Dynamic discounting Third-party financing
Per
cent
age
of R
espo
nden
ts, n
= 1
16
Best-in-Class Industry Average Laggard
Source: Aberdeen Group, August 2011
Organization A cornerstone of efficiency improvement is the removal of unnecessary action. In the AP space, two main examples can be duplicated effort across locations and extended transit time for physical documents (both invoices and payments). These examples are also directly addressed by the centralization of AP processes, another hallmark of Best-in-Class operations. This is not a wholesale requirement, however: centralized receipt and imaging (or manual data entry) can be coupled with decentralized approvals. It also does not call for absolute centralization in a single location: AP tasks supporting multiple locations or units within a common geographic region can be consolidated together. Continuing across the spectrum, shared service centers can consolidate activities beyond AP, to provide a common source for accounts receivable, payroll, and other functions. Individual locations require some amount of fixed expenditure for support. By consolidating locations, the goal is to minimize the fixed cost
E-Payables 2011: Efficiency, Visibility, and Collaboration in the Financial Supply Chain Page 12
© 2011 Aberdeen Group. Telephone: 617 854 5200 www.aberdeen.com Fax: 617 723 7897
(or semi-variable costs such as individual units of labor) to more closely match overall requirements - and keep the total cost per transaction to a minimum.
Transitioning from how the organization is structured to how those structures interact, the topic of cross-functional coordination is front-and-center. Best-in-Class companies are those that have active coordination and collaboration between functional areas like AP, procurement, finance, and IT. In essence, this requires thinking of AP as part of the larger source-to-settle process - and further still as an integral piece of the overall financial supply chain. Successful negotiations in procurement result in favorable pricing and payment terms, but it is up to AP to ensure that those prices are accurately invoiced, and that the process is efficient enough to capitalized on those available terms. In the same vein, the opportunities afforded by efficient AP processing are still subject to cash availability and related concerns of the greater finance organization. All of the parts must work together to produce the best results, and inter-departmental collaboration (with the likely assistance of proper data sharing and visibility) is the key to that relationship.
Knowledge Management Picking up on the theme of information sharing, visibility is critical not only for collaboration, but also for effective management on a day-to-day basis. Best-in-Class enterprises are those that can provide visibility into all stages of the payment process, ensuring that managers have the information necessary to identify and rectify flaws in the process while also keeping interested suppliers up-to-date on the status of their outstanding invoices. In this respect, "visibility" can take the form of dashboards summarizing overall invoice volumes, outstanding transactions at different points in the cycle, or those flagged for review. Visibility can also refer to supplier portals providing similar data to fulfill outside inquiries. In both cases, the common element is the provision of accurate and timely data to meet the specific needs of individual stakeholders.
Technology Whereas dashboards and portals provide needed information to those looking for it, rules-based alerts take an active approach in drawing management attention. For example, Best-in-Class enterprises have implemented alerts to notify managers of payments initiated above a threshold amount that should warrant management attention. These sorts of automated aides serve to guide transactions along standardized paths, in the same manner as time-based reminders that ensure digital transactions avoid the stereotypical pitfalls of misplaced paper-based documents in a manual environment. These alerts and notifications are typical features of commercial AP automation solutions, though they are not beyond the capability of homegrown software.
"We use a Financial Management Information System that was built in the mid 1990's on older technology. Integration is what was designed then and does not 'talk' well with other systems that have been added in recent years, such as a work order system. The difficulties are in balancing the multiple systems to ensure accuracy, proper coding of expenditures (including to the correct capital projects and/or grants) and the time it takes to do the offline analysis (if any)."
~ CFO, Government Transit
Authority
E-Payables 2011: Efficiency, Visibility, and Collaboration in the Financial Supply Chain Page 13
© 2011 Aberdeen Group. Telephone: 617 854 5200 www.aberdeen.com Fax: 617 723 7897
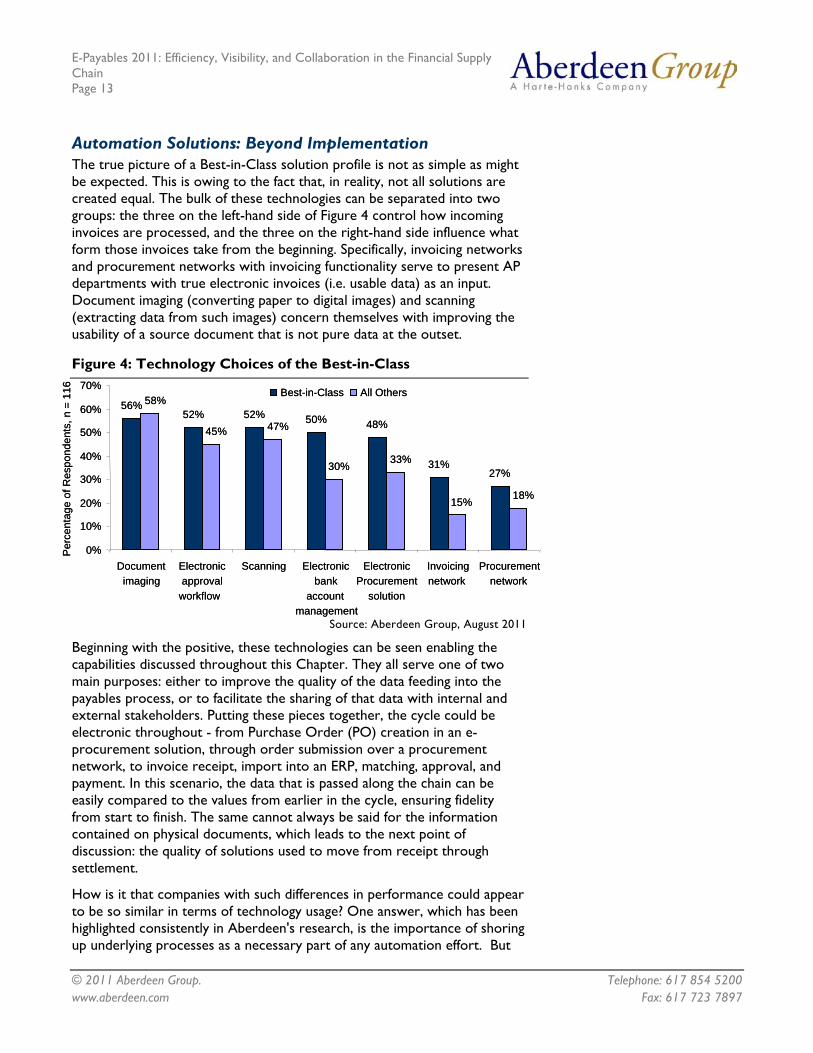
Automation Solutions: Beyond Implementation The true picture of a Best-in-Class solution profile is not as simple as might be expected. This is owing to the fact that, in reality, not all solutions are created equal. The bulk of these technologies can be separated into two groups: the three on the left-hand side of Figure 4 control how incoming invoices are processed, and the three on the right-hand side influence what form those invoices take from the beginning. Specifically, invoicing networks and procurement networks with invoicing functionality serve to present AP departments with true electronic invoices (i.e. usable data) as an input. Document imaging (converting paper to digital images) and scanning (extracting data from such images) concern themselves with improving the usability of a source document that is not pure data at the outset.
Figure 4: Technology Choices of the Best-in-Class
56%52% 52% 50% 48%
31%27%
58%
45% 47%
30% 33%
15% 18%
0%
10%
20%
30%
40%
50%
60%
70%
Documentimaging
Electronicapproval
workflow
Scanning Electronicbank
accountmanagement
ElectronicProcurement
solution
Invoicingnetwork
Procurementnetwork
Per
cent
age
of R
espo
nden
ts, n
= 1
16 Best-in-Class All Others56%
52% 52% 50% 48%
31%27%
58%
45% 47%
30% 33%
15% 18%
0%
10%
20%
30%
40%
50%
60%
70%
Documentimaging
Electronicapproval
workflow
Scanning Electronicbank
accountmanagement
ElectronicProcurement
solution
Invoicingnetwork
Procurementnetwork
Per
cent
age
of R
espo
nden
ts, n
= 1
16 Best-in-Class All Others
Source: Aberdeen Group, August 2011
Beginning with the positive, these technologies can be seen enabling the capabilities discussed throughout this Chapter. They all serve one of two main purposes: either to improve the quality of the data feeding into the payables process, or to facilitate the sharing of that data with internal and external stakeholders. Putting these pieces together, the cycle could be electronic throughout - from Purchase Order (PO) creation in an e-procurement solution, through order submission over a procurement network, to invoice receipt, import into an ERP, matching, approval, and payment. In this scenario, the data that is passed along the chain can be easily compared to the values from earlier in the cycle, ensuring fidelity from start to finish. The same cannot always be said for the information contained on physical documents, which leads to the next point of discussion: the quality of solutions used to move from receipt through settlement.
How is it that companies with such differences in performance could appear to be so similar in terms of technology usage? One answer, which has been highlighted consistently in Aberdeen's research, is the importance of shoring up underlying processes as a necessary part of any automation effort. But
E-Payables 2011: Efficiency, Visibility, and Collaboration in the Financial Supply Chain Page 14
© 2011 Aberdeen Group. Telephone: 617 854 5200 www.aberdeen.com Fax: 617 723 7897
there is more. The second answer is that performance relies on the quality of the chosen solution. Looking beyond overall adoption rates, and focusing on satisfaction with the installed solutions' ability to support specific capabilities provides a much more interesting portrait of Best-in-Class technology choices.
When we discuss imaging and scanning solutions, accuracy, flexibility, and accessibility are paramount. How well can the solution adapt to variations in invoice format? How accurately does it capture information, and what tools are provided for validation? These are a few areas where solution quality begins to make its presence known. To gauge this effectiveness, Aberdeen queried respondents for their level of satisfaction with their current solutions across a variety of areas, judged on a 5-point scale (from very dissatisfied to very satisfied). Here, Best-in-Class respondents are 3.75-times as likely to be "very satisfied" with solution's ability to match invoice data at the line level, and over four-times as likely to be very satisfied with its ability to handle various incoming invoice formats.
The same differences are evident when looking downstream towards approval and settlement. Best-in-Class companies are 2.12-times as likely to be very satisfied with their solution's ability to provide quick and easy access to invoices and related documentation. From a managerial perspective, they are also 2.24-times as likely to be very satisfied with its ability to provide visibility into current invoice processing status. What is clear from these examples is that performance is not dictated by the existence of some solution, but by the implementation of an effective solution.
Performance Management Any discussion of effectiveness will ultimately be based on the ability to meet predefined goals and objectives. Defining such measures, as well as the incentives and penalties attached to them to guide behavior, is another area where Best-in-Class enterprises outpace the others. For the enterprise, this could be as simple as invoices processed per full-time employee, or a top-down cost measure (labor costs, licensing fees, physical document costs, etc. divided by invoices processed). From the measure, identify the components that can be reduced (i.e., amount of hours needed for manual work, number of license seats required), and from them the behaviors that need to change in order to reduce those components. This can apply to internal resources (getting staff to follow standard procedures) or external partners (convincing suppliers to offer discount terms or accept electronic payment). Following the exercise through, once the desired behaviors have been found, settle on what benefits (bonuses for employees, additional business for suppliers) will incentive them. Of course, this process would not be possible without those measures that help to define the success of the underlying improvement initiative.
Aside from the often-cited benefits of faster processing times, lower costs, and greater visibility, accounts payable performance can support the organization in less obvious ways. One great example of this comes from the Dallas County Community College District (DCCCD), which provides
E-Payables 2011: Efficiency, Visibility, and Collaboration in the Financial Supply Chain Page 15
© 2011 Aberdeen Group. Telephone: 617 854 5200 www.aberdeen.com Fax: 617 723 7897
quality education for nearly 100,000 students across seven colleges in Texas. In its AP operations, DCCCD has achieved many of the Best-in-Class capabilities discussed in this chapter, and the results go beyond time and cost. The District was recently awarded AAA ratings for its bonds by all three national ratings agencies, due in part to what Fitch cited as "strong financial operations." "We don’t get behind on our payments or lead anyone to question our ability to pay," said Norma VanLandingham, District Accounts Payable Manager for DCCCD. "We take pride in that our department does such a good job that we have this rating. In the end, this helps the students, which is our main goal."
A Glance at AP Technology Preferences
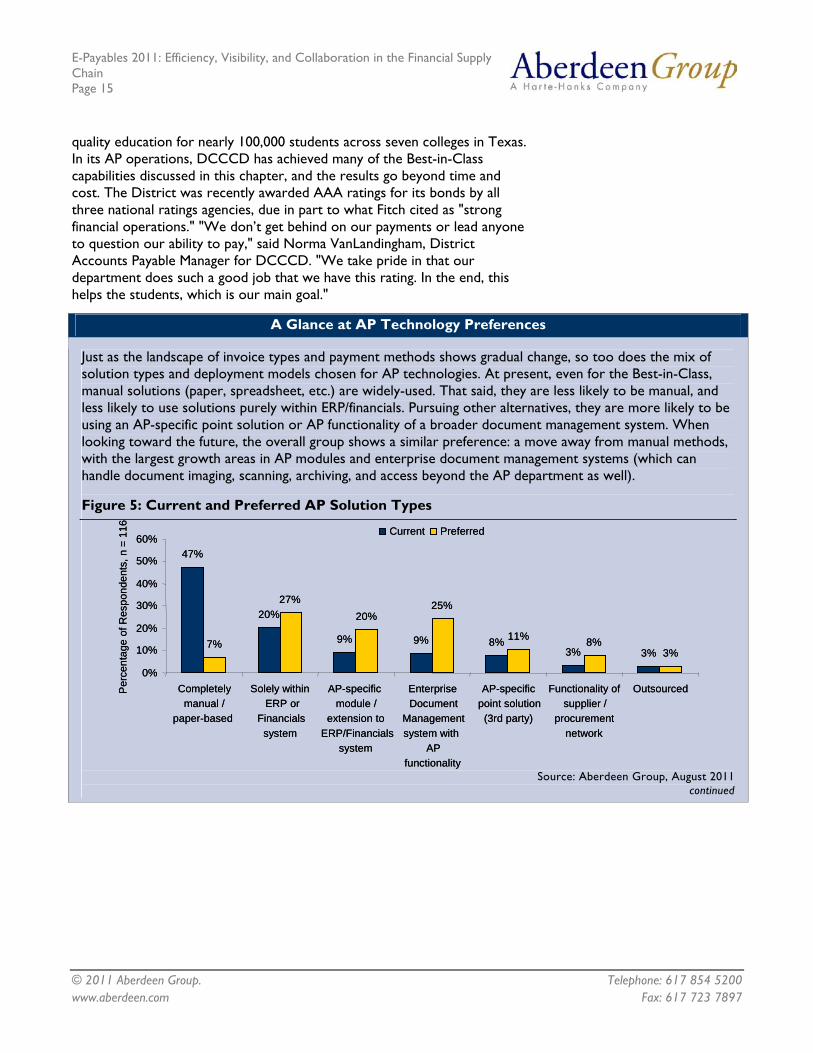
Just as the landscape of invoice types and payment methods shows gradual change, so too does the mix of solution types and deployment models chosen for AP technologies. At present, even for the Best-in-Class, manual solutions (paper, spreadsheet, etc.) are widely-used. That said, they are less likely to be manual, and less likely to use solutions purely within ERP/financials. Pursuing other alternatives, they are more likely to be using an AP-specific point solution or AP functionality of a broader document management system. When looking toward the future, the overall group shows a similar preference: a move away from manual methods, with the largest growth areas in AP modules and enterprise document management systems (which can handle document imaging, scanning, archiving, and access beyond the AP department as well).
Figure 5: Current and Preferred AP Solution Types
47%
20%
9% 9% 8%3% 3%
7%
27%20%
25%
11% 8%3%
0%
10%
20%
30%
40%
50%
60%
Completelymanual /
paper-based
Solely withinERP or
Financialssystem
AP-specificmodule /
extension toERP/Financials
system
EnterpriseDocument
Managementsystem with
APfunctionality
AP-specificpoint solution
(3rd party)
Functionality ofsupplier /
procurementnetwork
OutsourcedPer
cent
age
of R
espo
nden
ts, n
= 1
16 Current Preferred
Source: Aberdeen Group, August 2011
continued
E-Payables 2011: Efficiency, Visibility, and Collaboration in the Financial Supply Chain Page 16
© 2011 Aberdeen Group. Telephone: 617 854 5200 www.aberdeen.com Fax: 617 723 7897
A Glance at AP Technology Preferences
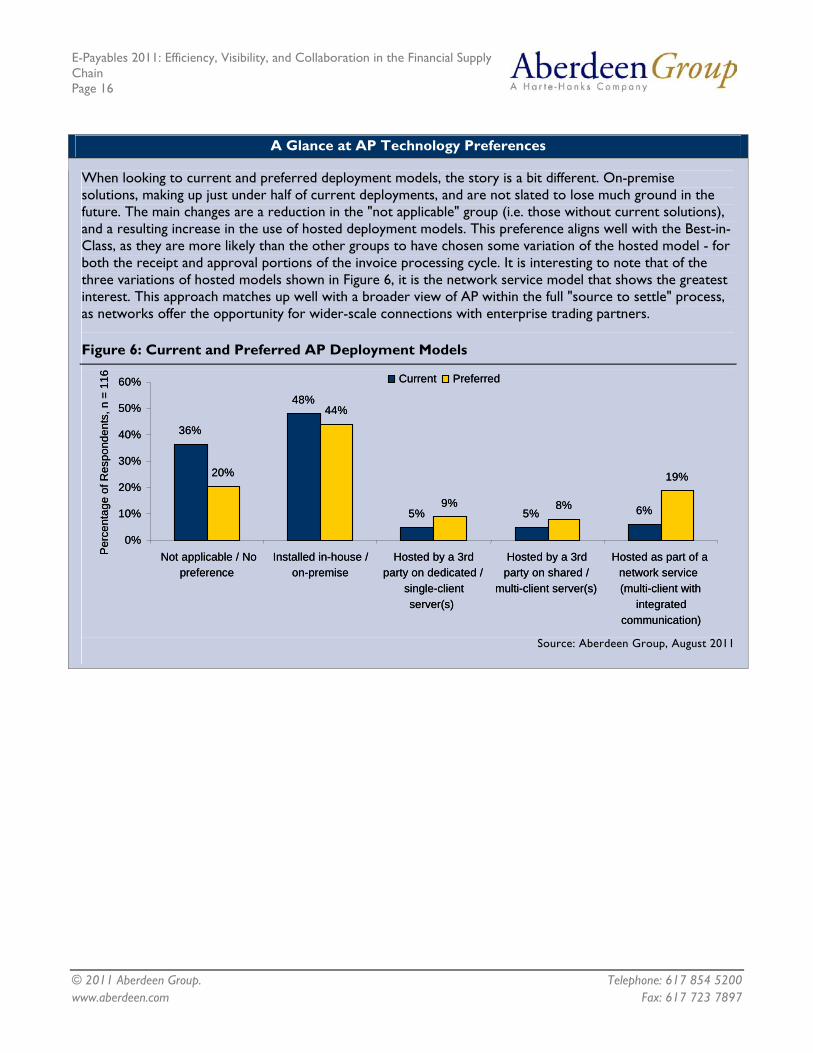
When looking to current and preferred deployment models, the story is a bit different. On-premise solutions, making up just under half of current deployments, and are not slated to lose much ground in the future. The main changes are a reduction in the "not applicable" group (i.e. those without current solutions), and a resulting increase in the use of hosted deployment models. This preference aligns well with the Best-in-Class, as they are more likely than the other groups to have chosen some variation of the hosted model - for both the receipt and approval portions of the invoice processing cycle. It is interesting to note that of the three variations of hosted models shown in Figure 6, it is the network service model that shows the greatest interest. This approach matches up well with a broader view of AP within the full "source to settle" process, as networks offer the opportunity for wider-scale connections with enterprise trading partners.
Figure 6: Current and Preferred AP Deployment Models
36%
48%
5% 5% 6%
20%
44%
9% 8%
19%
0%
10%
20%
30%
40%
50%
60%
Not applicable / Nopreference
Installed in-house /on-premise
Hosted by a 3rdparty on dedicated /
single-clientserver(s)
Hosted by a 3rdparty on shared /
multi-client server(s)
Hosted as part of anetwork service(multi-client with
integratedcommunication)
Per
cent
age
of R
espo
nden
ts, n
= 1
16 Current Preferred
Source: Aberdeen Group, August 2011
E-Payables 2011: Efficiency, Visibility, and Collaboration in the Financial Supply Chain Page 17
© 2011 Aberdeen Group. Telephone: 617 854 5200 www.aberdeen.com Fax: 617 723 7897
Chapter Three: Required Actions
Whether a company is trying to move its performance in invoice processing and settlement from Laggard to Industry Average, or Industry Average to Best-in-Class, the following actions will help spur the necessary performance improvements:
Laggard Steps to Success • Standardize AP processes across the organization. The goal
is to create repeatable processes, which are consistent from transaction to transaction, employee to employee, and location to location (for distributed enterprises). Companies that have taken this step see less fall through the cracks, reporting volumes of overpayments (or missed credits) 40% less than others.
• Define metrics and incentives to guide payables improvement efforts. Incentives help to align individual action with enterprise benefits. Identify areas of potential gains (accurate and timely coding by employees, adoption of electronic invoicing or acceptance of electronic payments by trading partners) and make sure you have the measures in place that will allow you to gauge their impact. As just one example, respondents with these metrics and incentives in place report early payment discount volumes 84% higher than those without them.
• Employ post-settlement audit to maximize AP results. Going hand in hand with the process design, metrics, and incentives that dictate what should happen, post-settlement audit helps to get a handle on what actually did. Responding companies employing internal and / or third-party audits report average recoverable amounts (i.e., missed discounts, missed credits and overpayments) between 2.4% and 3.1% of total AP-executed payments. These levels are 60% to 108% higher than what non-auditing respondents estimate to be available. As such, these companies may be leaving far more on the table than they realize.
Industry Average Steps to Success • Tighten up internal controls. These controls serve three main
purposes: first, they fulfill a requirement for publicly-traded companies; second, they help to reduce the risk of fraud; and third, they work hand-in-hand with process standardization and centralization to streamline and control AP operations. Companies with these controls in place report incurring 66% less late payment penalties than those without them.
• Plan for centralization. The possibilities here can run from centralized receipt and scanning all the way through consolidation of
Fast Facts
√ 93% of the Best-in-Class have tight controls in place to guide their payments processes
√ 81% of the Best-in-Class have standardized their AP processes across the enterprise
E-Payables 2011: Efficiency, Visibility, and Collaboration in the Financial Supply Chain Page 18
© 2011 Aberdeen Group. Telephone: 617 854 5200 www.aberdeen.com Fax: 617 723 7897
multiple functions (AP, AR, Payroll, etc.) within a shared service center. Respondents that have centralized AP operations either in a corporate department or shared service center report processing costs 20% lower than their decentralized peers.
• Investigate triggered alerts to focus on high-priority items. In an ideal scenario, non-exceptions would be automatically ushered through matching, validation, and payment with manual intervention required only for identified exceptions. Even in a non-ideal environment, rules-based alerts can help to prioritize important transactions (e.g., those with high-dollar values, at risk suppliers, etc.). Companies with these alerts in place report average processing times 21% lower than others, with related processing costs 32% lower.
Best-in-Class Steps to Success • Expand the use of discounting programs. These can take the
form of either fixed or tiered terms pre-negotiated by procurement, or dynamic discounts available at the suppliers' discretion. For companies with available cash, the 36% return (2% for 20-days use in a typical 2/10 net 30 scenario) can be quite attractive. Although the Best-in-Class are already leading the way, they are still missing discounts on two-fifths of their payments.
• Get related enterprise functions on-board. AP does not exist in isolation. It delivers on the potential savings driven by procurement. Its discounts are essentially alternative investment mechanisms for enterprise cash, which offer attractive returns (and are of interest to treasury). Across all functions, the visibility derived from solution integration may fall on the shoulders of internal IT resources. What benefits may come when all of these functions are actively engaged? Responding companies that have this cross-functional collaboration report processing times for exceptions 13% faster, and capture discounts on 76% more transactions than others.
E-Payables 2011: Summary
Automation in accounts payable offers great potential benefits to the enterprise. As such, it deserves to be thought of not as an isolated business function, but within the greater context of the financial supply chain. Within the enterprise, accounts payable is intimately tied to the efforts of purchasing and treasury, and its efficiency and transparency is important to maintaining vendor relationships. As this study has highlighted, paper still plays a large part for both invoicing and payments. However, intelligently-designed processed, and intelligently-chosen technologies can go a long way toward driving performance improvements - and there is still a lot of savings left to be captured.
"Everybody in the company, no matter what their job is, is somewhat strategic. It takes everyone. While some people may be 90/10 strategic, some the opposite, we don’t have anyone who is purely transactional."
~ CFO, Dental Supply Company
E-Payables 2011: Efficiency, Visibility, and Collaboration in the Financial Supply Chain Page 19
© 2011 Aberdeen Group. Telephone: 617 854 5200 www.aberdeen.com Fax: 617 723 7897
Appendix A: Research Methodology
Between July and August 2011, Aberdeen examined the use, the experiences, and the intentions of 116 enterprises in accounts payable automation across a diverse set of enterprises.
Aberdeen supplemented this online survey effort with interviews with select survey respondents, gathering additional information on corporate strategies, experiences, and results.
Responding enterprises included the following:
• Job title: The research sample included respondents with the following job titles: CFO (16%); Other Executive (CEO, CIO, President, etc.) (9%); Treasurer / Controller (12%); EVP / SVP / VP (8%); Director (16%); Manager (23%); and other (16%).
• Department / function: The research sample included respondents from the following departments or functions: Finance / Administration (63%); Corporate Management (10%); Procurement / Purchasing (10%); Information Technology (4%); Operations (3%); other (10%).
• Industry: The research sample included respondents from a broad selection of industries, including: Education (14%); Government (12%); Financial Services (11%); Healthcare (8%); Software (7%); Industrial Products (7%); Insurance (5%); Food & Beverage (4%); Metals & Metal Products (4%); Retail (4%).
• Geography: The majority of respondents (78%) were from North America. Remaining respondents were from Europe (12%), the Asia-Pacific region (7%) and South/Central America (2%), and the Middle East and Africa (1%).
• Company size: Thirty-two percent (33%) of respondents were from large enterprises (annual revenues above US $1 billion); 34% were from midsize enterprises (annual revenues between $50 million and $1 billion); and 33% of respondents were from small businesses (annual revenues of $50 million or less).
• Headcount: Fifty-four percent (54%) of respondents were from large enterprises (headcount greater than 1,000 employees); 32% were from midsize enterprises (headcount between 100 and 999 employees); and 14% of respondents were from small businesses (headcount between 1 and 99 employees).
Study Focus
Responding executives completed an online survey that included questions designed to determine the following:
√ The degree to which automation and electronic payments are deployed in their operations and the financial implications of the technology
√ The structure and effectiveness of existing payables automation implementations
√ Current and planned use of AP automation to aid efficiency gains and discount capture
√ The benefits, if any, that have been derived from AP improvement initiatives
The study aimed to identify emerging best practices for AP automation usage in, and to provide a framework by which readers could assess their own management capabilities.
E-Payables 2011: Efficiency, Visibility, and Collaboration in the Financial Supply Chain Page 20
© 2011 Aberdeen Group. Telephone: 617 854 5200 www.aberdeen.com Fax: 617 723 7897
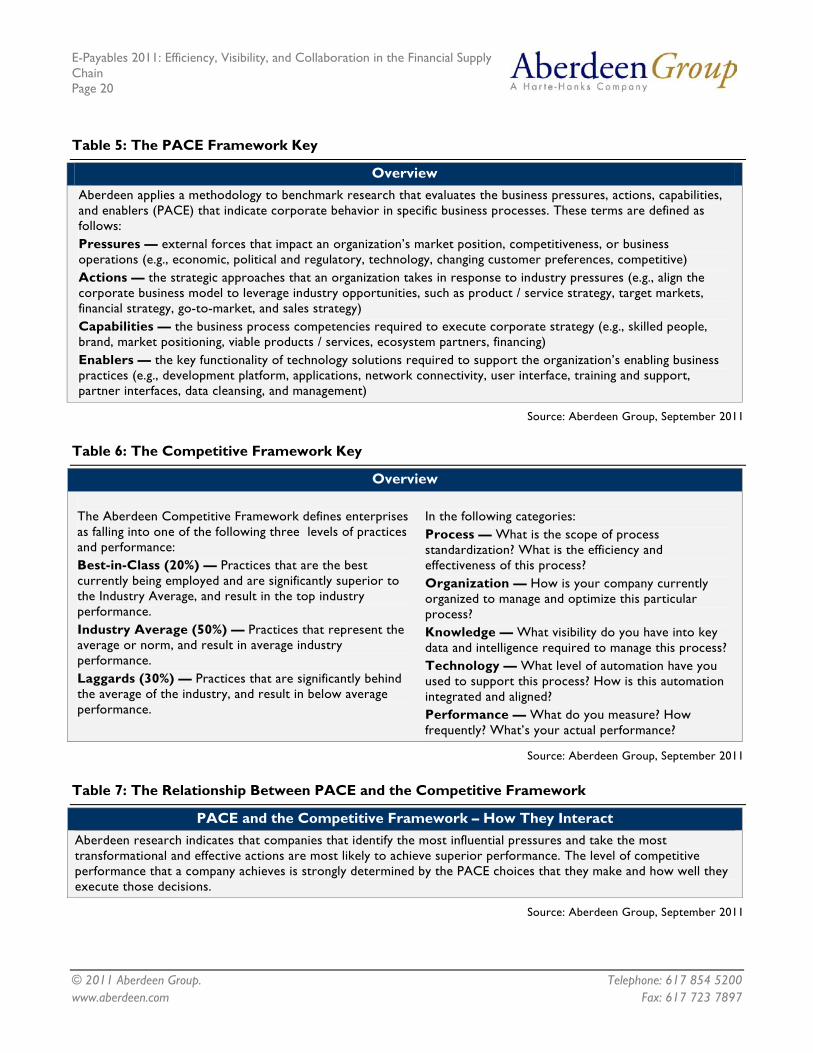
Table 5: The PACE Framework Key
Overview Aberdeen applies a methodology to benchmark research that evaluates the business pressures, actions, capabilities, and enablers (PACE) that indicate corporate behavior in specific business processes. These terms are defined as follows: Pressures — external forces that impact an organization’s market position, competitiveness, or business operations (e.g., economic, political and regulatory, technology, changing customer preferences, competitive) Actions — the strategic approaches that an organization takes in response to industry pressures (e.g., align the corporate business model to leverage industry opportunities, such as product / service strategy, target markets, financial strategy, go-to-market, and sales strategy) Capabilities — the business process competencies required to execute corporate strategy (e.g., skilled people, brand, market positioning, viable products / services, ecosystem partners, financing) Enablers — the key functionality of technology solutions required to support the organization’s enabling business practices (e.g., development platform, applications, network connectivity, user interface, training and support, partner interfaces, data cleansing, and management)
Source: Aberdeen Group, September 2011
Table 6: The Competitive Framework Key
Overview The Aberdeen Competitive Framework defines enterprises as falling into one of the following three levels of practices and performance: Best-in-Class (20%) — Practices that are the best currently being employed and are significantly superior to the Industry Average, and result in the top industry performance. Industry Average (50%) — Practices that represent the average or norm, and result in average industry performance. Laggards (30%) — Practices that are significantly behind the average of the industry, and result in below average performance.
In the following categories: Process — What is the scope of process standardization? What is the efficiency and effectiveness of this process? Organization — How is your company currently organized to manage and optimize this particular process? Knowledge — What visibility do you have into key data and intelligence required to manage this process? Technology — What level of automation have you used to support this process? How is this automation integrated and aligned? Performance — What do you measure? How frequently? What’s your actual performance?
Source: Aberdeen Group, September 2011
Table 7: The Relationship Between PACE and the Competitive Framework
PACE and the Competitive Framework – How They Interact Aberdeen research indicates that companies that identify the most influential pressures and take the most transformational and effective actions are most likely to achieve superior performance. The level of competitive performance that a company achieves is strongly determined by the PACE choices that they make and how well they execute those decisions.
Source: Aberdeen Group, September 2011
E-Payables 2011: Efficiency, Visibility, and Collaboration in the Financial Supply Chain Page 21
© 2011 Aberdeen Group. Telephone: 617 854 5200 www.aberdeen.com Fax: 617 723 7897
Appendix B: Related Aberdeen Research
Related Aberdeen research that forms a companion or reference to this report includes:
• Invoicing and Workflow: Integrating Process Automation to Enhance Operational Performance; May 2011
• Understanding the Value of Purchasing Card Programs; March 2011
• Understanding Your Cost to Pay: Effective Measurement in Accounts Payable; February 2011
• Supply Chain Finance: Gaining Control in the Face of Uncertainty; January 2011
• The E-Payables Solution Selection Report: A Buyer's Guide to Accounts Payable Optimization; October 2010
Information on these and any other Aberdeen publications can be found at www.aberdeen.com.
Author: Scott Pezza, Senior Research Associate, Financial Management & GRC, ([email protected])
For more than two decades, Aberdeen's research has been helping corporations worldwide become Best-in-Class. Having benchmarked the performance of more than 644,000 companies, Aberdeen is uniquely positioned to provide organizations with the facts that matter — the facts that enable companies to get ahead and drive results. That's why our research is relied on by more than 2.5 million readers in over 40 countries, 90% of the Fortune 1,000, and 93% of the Technology 500.
As a Harte-Hanks Company, Aberdeen’s research provides insight and analysis to the Harte-Hanks community of local, regional, national and international marketing executives. Combined, we help our customers leverage the power of insight to deliver innovative multichannel marketing programs that drive business-changing results. For additional information, visit Aberdeen http://www.aberdeen.com or call (617) 854-5200, or to learn more about Harte-Hanks, call (800) 456-9748 or go to http://www.harte-hanks.com.
This document is the result of primary research performed by Aberdeen Group. Aberdeen Group's methodologies provide for objective fact-based research and represent the best analysis available at the time of publication. Unless otherwise noted, the entire contents of this publication are copyrighted by Aberdeen Group, Inc. and may not be reproduced, distributed, archived, or transmitted in any form or by any means without prior written consent by Aberdeen Group, Inc. (2011a)
E-Payables 2011: Efficiency, Visibility, and Collaboration in the Financial Supply Chain Page 22
© 2011 Aberdeen Group. Telephone: 617 854 5200 www.aberdeen.com Fax: 617 723 7897
Featured Underwriters This research report was made possible, in part, with the financial support of our underwriters. These individuals and organizations share Aberdeen’s vision of bringing fact based research to corporations worldwide at little or no cost. Underwriters have no editorial or research rights, and the facts and analysis of this report remain an exclusive production and product of Aberdeen Group. Solution providers recognized as underwriters were solicited after the fact and had no substantive influence on the direction of this report. Their sponsorship has made it possible for Aberdeen Group to make these findings available to readers at no charge.
Ariba, Inc. is the leading provider of collaborative business commerce solutions. Ariba enables more efficient and effective buying, selling, and cash management by combining industry-leading software as a service (SaaS) commerce technology with the world's largest web-based global trading community and expert capabilities and services to augment internal resources and skills – all as a flexible, cloud-based service. The Ariba® Commerce Cloud™ delivers everything needed to control costs, increase sales, minimize risk, and enhance cash flow and operations. More than 300,000 companies, including over 80 percent of the Fortune 100, use Ariba's solutions to drive more efficient and effective inter-enterprise commerce. Why not join them?
For additional information on Ariba, Inc.:
Ariba
910 Hermosa Court
Sunnyvale, CA 94085
Phone: 1.866.772.7422
www.ariba.com/contact.cfm
E-Payables 2011: Efficiency, Visibility, and Collaboration in the Financial Supply Chain Page 23
© 2011 Aberdeen Group. Telephone: 617 854 5200 www.aberdeen.com Fax: 617 723 7897
Syncada from Visa is a global financial supply chain network which corporations and governments can use to improve business intelligence, process invoices, make payments, and finance payables or receivables through sponsor financial institutions. Syncada processes invoices for hundreds of buyers and makes payments to tens of thousands of sellers in 42 countries. In 2009, the network processed more than USD $18 billion in payments and more than 200 million invoices and supporting trade documents.
For additional information on Syncada from Visa:
Syncada from Visa
901 Marquette Avenue South, Suite 1800
Minneapolis, MN 55402
Phone: 1.800.404.2744
www.syncada.com
E-Payables 2011: Efficiency, Visibility, and Collaboration in the Financial Supply Chain Page 24
© 2011 Aberdeen Group. Telephone: 617 854 5200 www.aberdeen.com Fax: 617 723 7897
Kofax plc (LSE: KFX) is the leading provider of capture driven process automation solutions. Kofax solutions provide a rapid return on investment by automating information intensive processes and by managing the capture of information in a more accurate, timely and cost effective manner. Our integrated AP automation solutions streamline invoice capture to increase processing speed and dramatically reduce data entry costs, and leverage best practice workflows to expedite the invoice review, coding and approval process.
For additional information on Kofax plc:
Kofax plc
15211 Laguna Canyon Road
Irvine, CA 92618
Phone: 1.949.272.1733
Fax: 1.949.273.9080
www.kofax.com
www.kofax.com/solutions/invoice-processing.asp
E-Payables 2011: Efficiency, Visibility, and Collaboration in the Financial Supply Chain Page 25
© 2011 Aberdeen Group. Telephone: 617 854 5200 www.aberdeen.com Fax: 617 723 7897
Paymode-X is revolutionizing payment and invoice automation. The world’s fastest-growing payment network for business helps companies convert from paper to electronic payments and invoices with a modular order-to-pay solution.
More than 140,000 companies already make and receive secure payments as Paymode-X network members. And, after seeing that 30 to 50 percent of their strategic suppliers are already in the network, a tremendous number of new companies join Paymode-X each day.
For additional information on Bottomline Technologies:
Bottomline Technologies
25 Corporate Drive
Portsmouth, NH 03801
Phone: 1.800.472.1321
www.bottomlinetechnologies.com