Embed Size (px)
Citation preview

Early Algebra and
College Participation in
STEM
Xiaoxia Newton
David Torres Irribarra
Rosario Rivero

Acknowledgement
�AIR Research Grant Program
�Doctoral students
David Torres�David Torres
�Rosario Rivero

Motivation
� National Mathematics Advisory Panel Report (2008)
� California Board of Education Vote (2008)
� Policy makers’ interest in reforming math and
science education
� Trends in degree attainment: Under-representation � Trends in degree attainment: Under-representation
of certain demographic groups in STEM fields (e.g.,
Clewell, the Urban Institute, 2002)
� Gatekeeper: Timing of taking algebra in secondary
schools and postsecondary participation in STEM

Broader Research Context
� Develop “early warning systems” (Tinto, 1987)
� Borrow the concept of “path dependence” (e.g.,
Pierson, 2000; Goldstone, 1998; Nelson & Winter,
1982)
� Draw upon “signaling” vs. “production” models � Draw upon “signaling” vs. “production” models
(Spence, 2001; Hanushek, 1986)
� Timing of taking algebra and pathways into post-
secondary STEM

Pathways: Algebra and College
Participation in STEM
8th grade
College introductory math
9th grade
Timing of taking
algebra I10th or higher
Never take or pass
College introductory
science
Remedial courses
STEM majors
Secondary schooling process and preparation:
- socio-psychological factors
- types of schools and school context
- career aspiration and highest math taken
Transition to college:
- initial introductory STEM courses
- advanced college STEM courses
- college experiences and activities
End of college:
- degree attainment

Research Questions
� Does early algebra tell us anything about
students’ participation in college introductory
mathematics and science courses?
� Does early algebra predict whether students will � Does early algebra predict whether students will
have one of the STEM majors?

BASE YEAR FIRST FOLLOW-UPUP
SECOND FOLLOW-
UP UP
THIRD FOLLOW-
UP UP
FOURTH FOLLOW-
UP
NELS Dataset
8TH GRADE
1988
10TH GRADE
1990
12TH GRADE
1992
2ND YEAR –
COLLEGE 20001988 1990 1992
COLLEGE
1994
2000

College Participation in STEM and Key
Predictors
� Gender
� Race and ethnicity indicators
� Early algebra indicator
� Social economic status� Social economic status
� Mathematics ability
� Career aspiration for work in science and engineering fields

Regular Math Physics Chemistry Biology
(1a) (1b) (2a) (2b) (3a) (3b) (4a) (4b)
Female
SES
Mathematics Ability
Career Aspiration in Science/Eng.
Early Algebra or Advanced Math
Race
Asian/Pacific Isl.
Hispanic
African American
Native American
Observations 6326 5083 6335 5089 6336 5090 6335 5089

Regular Math Physics Chemistry Biology
(1a) (1b) (2a) (2b) (3a) (3b) (4a) (4b)
Female
SES
Mathematics Ability
Career Aspiration in Science/Eng.
Early Algebra or Advanced Math
Race
Asian/Pacific Isl. 1.179 1.770** 1.651** 1.124
(0.169) (0.254) (0.231) (0.149)
Hispanic 0.586** 0.525** 0.498** 0.515**
(0.0766) (0.0734) (0.0627) (0.0583)
African American 0.728 0.479** 0.760 1.315
(0.131) (0.0795) (0.138) (0.217)
Native American 0.647 1.275 0.696 0.768
(0.235) (0.549) (0.385) (0.306)
Observations 6326 5083 6335 5089 6336 5090 6335 5089

Regular Math Physics Chemistry Biology
(1a) (1b) (2a) (2b) (3a) (3b) (4a) (4b)
Female
SES
Mathematics Ability
Career Aspiration in Science/Eng.
Early Algebra or Advanced Math
Race
Asian/Pacific Isl. 1.179 1.101 1.770** 1.731** 1.651** 1.568** 1.124 1.104
(0.169) (0.199) (0.254) (0.296) (0.231) (0.245) (0.149) (0.196)
Hispanic 0.586** 0.875 0.525** 0.871 0.498** 0.703* 0.515** 0.541**
(0.0766) (0.149) (0.0734) (0.160) (0.0627) (0.110) (0.0583) (0.0732)
African American 0.728 1.135 0.479** 0.840 0.760 1.484 1.315 1.358
(0.131) (0.220) (0.0795) (0.170) (0.138) (0.299) (0.217) (0.228)
Native American 0.647 0.962 1.275 2.868 0.696 1.188 0.768 0.978
(0.235) (0.346) (0.549) (1.675) (0.385) (0.664) (0.306) (0.388)
Observations 6326 5083 6335 5089 6336 5090 6335 5089

Regular Math Physics Chemistry Biology
(1a) (1b) (2a) (2b) (3a) (3b) (4a) (4b)
Female 0.986 0.498** 0.978 1.995**
(0.0772) (0.0494) (0.0847) (0.158)
SES 1.069 1.064 1.043 1.049
(0.0731) (0.0738) (0.0658) (0.0671)
Mathematics Ability 1.758** 1.929** 1.644** 1.201**
(0.0919) (0.119) (0.0827) (0.0558)
Career Aspiration in Science/Eng. 1.394* 1.795** 2.014** 0.934
(0.211) (0.270) (0.251) (0.113)
Early Algebra or Advanced Math
Race
Asian/Pacific Isl. 1.179 1.101 1.770** 1.731** 1.651** 1.568** 1.124 1.104
(0.169) (0.199) (0.254) (0.296) (0.231) (0.245) (0.149) (0.196)
Hispanic 0.586** 0.875 0.525** 0.871 0.498** 0.703* 0.515** 0.541**
(0.0766) (0.149) (0.0734) (0.160) (0.0627) (0.110) (0.0583) (0.0732)
African American 0.728 1.135 0.479** 0.840 0.760 1.484 1.315 1.358
(0.131) (0.220) (0.0795) (0.170) (0.138) (0.299) (0.217) (0.228)
Native American 0.647 0.962 1.275 2.868 0.696 1.188 0.768 0.978
(0.235) (0.346) (0.549) (1.675) (0.385) (0.664) (0.306) (0.388)
Observations 6326 5083 6335 5089 6336 5090 6335 5089
Regular Math Physics Chemistry Biology
(1a) (1b) (2a) (2b) (3a) (3b) (4a) (4b)
Female 0.986 0.498** 0.978 1.995**
(0.0772) (0.0494) (0.0847) (0.158)
SES 1.069 1.064 1.043 1.049
(0.0731) (0.0738) (0.0658) (0.0671)
Mathematics Ability 1.758** 1.929** 1.644** 1.201**
(0.0919) (0.119) (0.0827) (0.0558)
Career Aspiration in Science/Eng. 1.394* 1.795** 2.014** 0.934
(0.211) (0.270) (0.251) (0.113)
Early Algebra or Advanced Math 1.204 1.241* 1.315** 1.002
(0.114) (0.137) (0.128) (0.0913)(0.114) (0.137) (0.128) (0.0913)
Race
Asian/Pacific Isl. 1.179 1.101 1.770** 1.731** 1.651** 1.568** 1.124 1.104
(0.169) (0.199) (0.254) (0.296) (0.231) (0.245) (0.149) (0.196)
Hispanic 0.586** 0.875 0.525** 0.871 0.498** 0.703* 0.515** 0.541**
(0.0766) (0.149) (0.0734) (0.160) (0.0627) (0.110) (0.0583) (0.0732)
African American 0.728 1.135 0.479** 0.840 0.760 1.484 1.315 1.358
(0.131) (0.220) (0.0795) (0.170) (0.138) (0.299) (0.217) (0.228)
Native American 0.647 0.962 1.275 2.868 0.696 1.188 0.768 0.978
(0.235) (0.346) (0.549) (1.675) (0.385) (0.664) (0.306) (0.388)
Observations 6326 5083 6335 5089 6336 5090 6335 5089

MATH, ENGINEERING, CHEMISTRY, AND PHYSICS MAJORS
Model 4a Model 4b Model 4c Model 4dRace
Asian/Pacific Islander
Hispanic
African American
Native American
Female
SES
Mathematics Ability
Aspiration in Science/Eng.
Early Algebra or Advanced Math
Observations 5362 5362 5097 4296

MATH, ENGINEERING, CHEMISTRY, AND PHYSICS MAJORS
Model 4a Model 4b Model 4c Model 4dRace
Asian/Pacific Islander 1.607*
(0.325)
Hispanic 0.931
(0.252)
African American 0.676
(0.192)
Native American 0.705
(0.541)
Female
SES
Mathematics Ability
Aspiration in Science/Eng.
Early Algebra or Advanced Math
Observations 5362 5362 5097 4296

MATH, ENGINEERING, CHEMISTRY, AND PHYSICS MAJORS
Model 4a Model 4b Model 4c Model 4dRace
Asian/Pacific Islander 1.607* 1.479
(0.325) (0.315)
Hispanic 0.931 1.076
(0.252) (0.276)
African American 0.676 0.896
(0.192) (0.278)
Native American 0.705 1.137
(0.541) (0.859)
Female 0.200**
(0.0297)(0.0297)
SES 1.306**
(0.118)
Mathematics Ability
Aspiration in Science/Eng.
Early Algebra or Advanced Math
Observations 5362 5362 5097 4296

MATH, ENGINEERING, CHEMISTRY, AND PHYSICS MAJORS
Model 4a Model 4b Model 4c Model 4dRace
Asian/Pacific Islander 1.607* 1.479 1.422*
(0.325) (0.315) (0.293)
Hispanic 0.931 1.076 1.689*
(0.252) (0.276) (0.494)
African American 0.676 0.896 1.450
(0.192) (0.278) (0.446)
Native American 0.705 1.137 1.757
(0.541) (0.859) (1.533)
Female 0.200** 0.220**
(0.0297) (0.0327)(0.0297) (0.0327)
SES 1.306** 0.875
(0.118) (0.0850)
Mathematics Ability 2.114**
(0.159)
Aspiration in Science/Eng. 3.092**
(0.538)
Early Algebra or Advanced Math
Observations 5362 5362 5097 4296

MATH, ENGINEERING, CHEMISTRY, AND PHYSICS MAJORS
Model 4a Model 4b Model 4c Model 4dRace
Asian/Pacific Islander 1.607* 1.479 1.422* 1.455*
(0.325) (0.315) (0.293) (0.323)
Hispanic 0.931 1.076 1.689* 1.658
(0.252) (0.276) (0.494) (0.535)
African American 0.676 0.896 1.450 1.623
(0.192) (0.278) (0.446) (0.564)
Native American 0.705 1.137 1.757 0.738
(0.541) (0.859) (1.533) (0.885)
Female 0.200** 0.220** 0.213**
(0.0297) (0.0327) (0.0341)(0.0297) (0.0327) (0.0341)
SES 1.306** 0.875 0.912
(0.118) (0.0850) (0.0976)
Mathematics Ability 2.114** 1.963**
(0.159) (0.170)
Aspiration in Science/Eng. 3.092** 3.107**
(0.538) (0.592)
Early Algebra or Advanced Math 1.567**
(0.232)
Observations 5362 5362 5097 4296
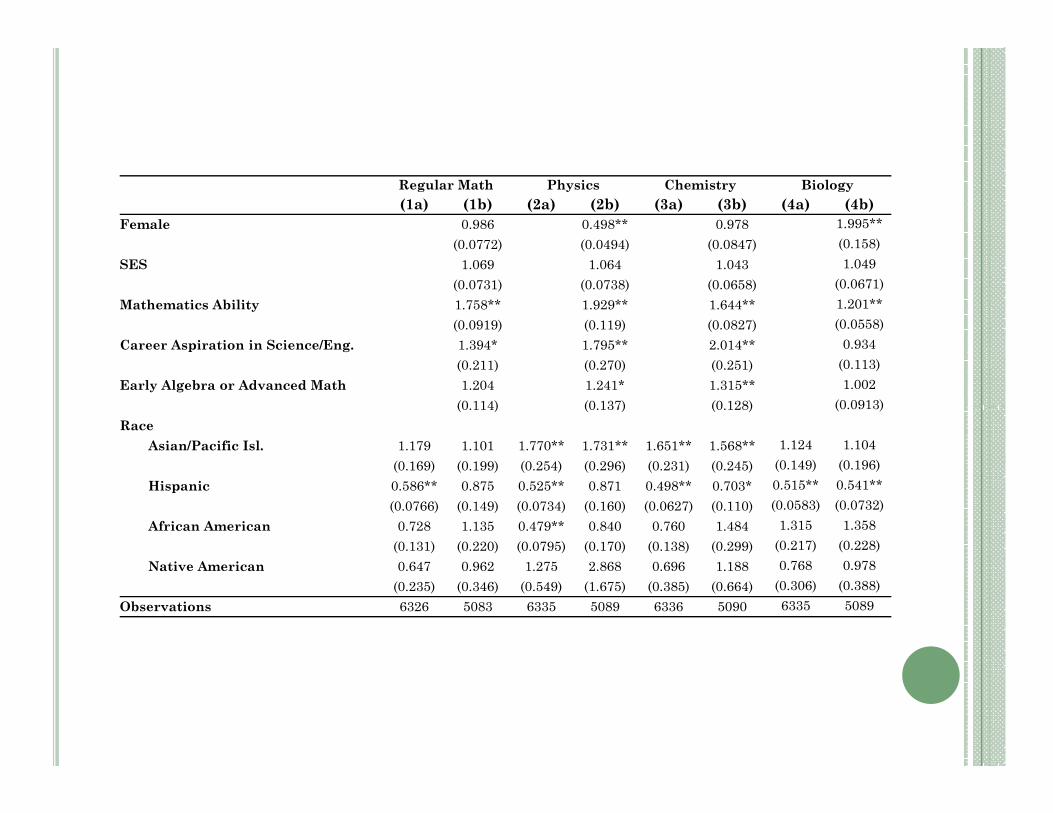
BIOLOGY RELATED MAJORSModel 4a Model 4b Model 4c Model 4d
Race
Asian/Pacific Islander
Hispanic
African American
Native American
Female
SES
Mathematics Ability
Aspiration in Science/Eng.
Early Algebra or Advanced Math
Observations 5362 5362 5097 4296

BIOLOGY RELATED MAJORSModel 4a Model 4b Model 4c Model 4d
Race
Asian/Pacific Islander 3.287**
(0.658)
Hispanic 1.278
(0.275)
African American 0.638
(0.192)
Native American 0.994
(0.675)
Female
SES
Mathematics Ability
Aspiration in Science/Eng.
Early Algebra or Advanced Math
Observations 5362 5362 5097 4296

BIOLOGY RELATED MAJORSModel 4a Model 4b Model 4c Model 4d
Race
Asian/Pacific Islander 3.287** 3.151**
(0.658) (0.626)
Hispanic 1.278 1.671*
(0.275) (0.380)
African American 0.638 0.808
(0.192) (0.250)
Native American 0.994 1.219
(0.675) (0.829)
Female 1.031
(0.150)(0.150)
SES 1.597**
(0.172)
Mathematics Ability
Aspiration in Science/Eng.
Early Algebra or Advanced Math
Observations 5362 5362 5097 4296

BIOLOGY RELATED MAJORSModel 4a Model 4b Model 4c Model 4d
Race
Asian/Pacific Islander 3.287** 3.151** 2.991**
(0.658) (0.626) (0.639)
Hispanic 1.278 1.671* 2.022**
(0.275) (0.380) (0.499)
African American 0.638 0.808 1.144
(0.192) (0.250) (0.346)
Native American 0.994 1.219 1.587
(0.675) (0.829) (1.069)
Female 1.031 1.123
(0.150) (0.162)(0.150) (0.162)
SES 1.597** 1.169
(0.172) (0.150)
Mathematics Ability 1.665**
(0.164)
Aspiration in Science/Eng. 2.745**
(0.597)
Early Algebra or Advanced Math
Observations 5362 5362 5097 4296

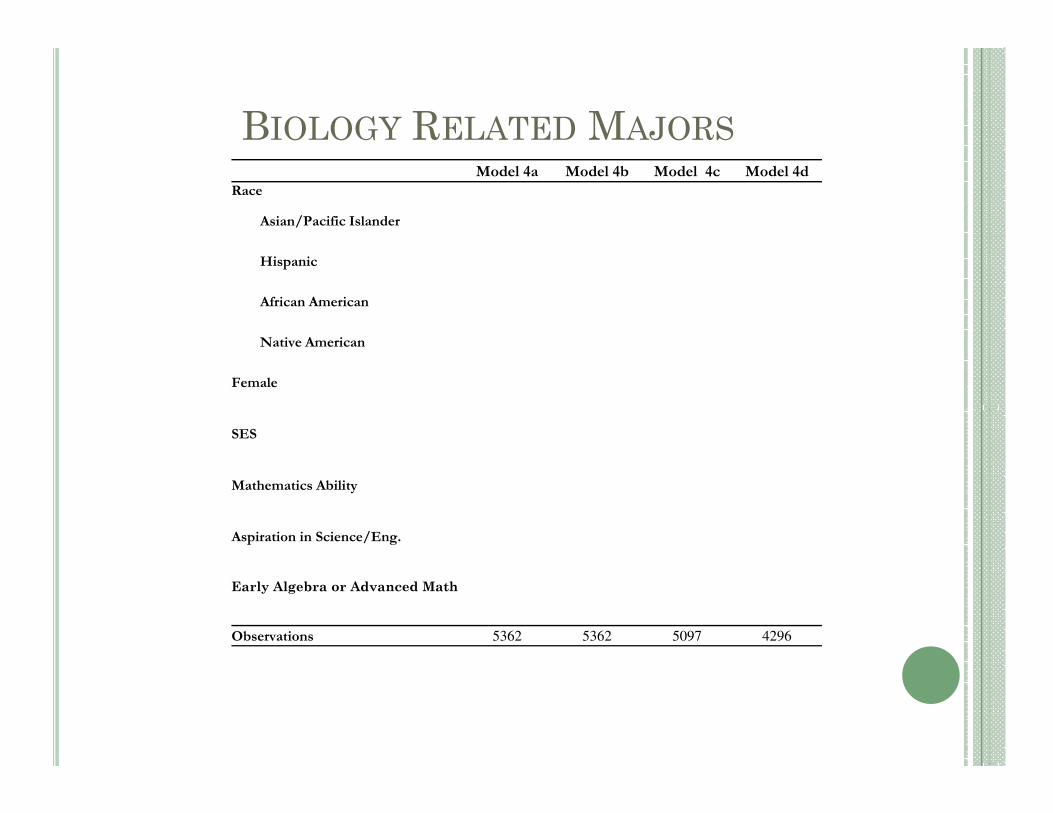
BIOLOGY RELATED MAJORSModel 4a Model 4b Model 4c Model 4d
Race
Asian/Pacific Islander 3.287** 3.151** 2.991** 3.032**
(0.658) (0.626) (0.639) (0.725)
Hispanic 1.278 1.671* 2.022** 1.667
(0.275) (0.380) (0.499) (0.459)
African American 0.638 0.808 1.144 1.359
(0.192) (0.250) (0.346) (0.432)
Native American 0.994 1.219 1.587 1.337
(0.675) (0.829) (1.069) (1.023)
Female 1.031 1.123 1.146
(0.150) (0.162) (0.185)(0.150) (0.162) (0.185)
SES 1.597** 1.169 1.150
(0.172) (0.150) (0.158)
Mathematics Ability 1.665** 1.552**
(0.164) (0.182)
Aspiration in Science/Eng. 2.745** 3.032**
(0.597) (0.690)
Early Algebra or Advanced Math 1.267
(0.230)
Observations 5362 5362 5097 4296

Summary
� Early algebra and college propensity
� STEM participation and different demographic
groups (gender & ethnicity)
� Mathematics ability vs. early algebra� Mathematics ability vs. early algebra
� Signaling model?
� Production model?
� Mixed: the most plausible
� Re-thinking the notion of “ability”

Implications
� Policy
� Early algebra mandate?
� Quality of students’ experiences: K-7
� Research� Research
� Differentiation within STEM fields
� Practice
� Students’ career aspirations
� Beliefs and attitudes

Current Work
� Cross examine: PETS: 2000 data
� Timing of taking algebra: 8th, 9th, 10th, etc.
� Probe patterns of participation
� Gender� Gender
� Specific STEM fields
� Long term: Examine quality of students’ learning
experiences at the foundational level