Embed Size (px)
Citation preview
Dina East and Hannah Alston October 2015
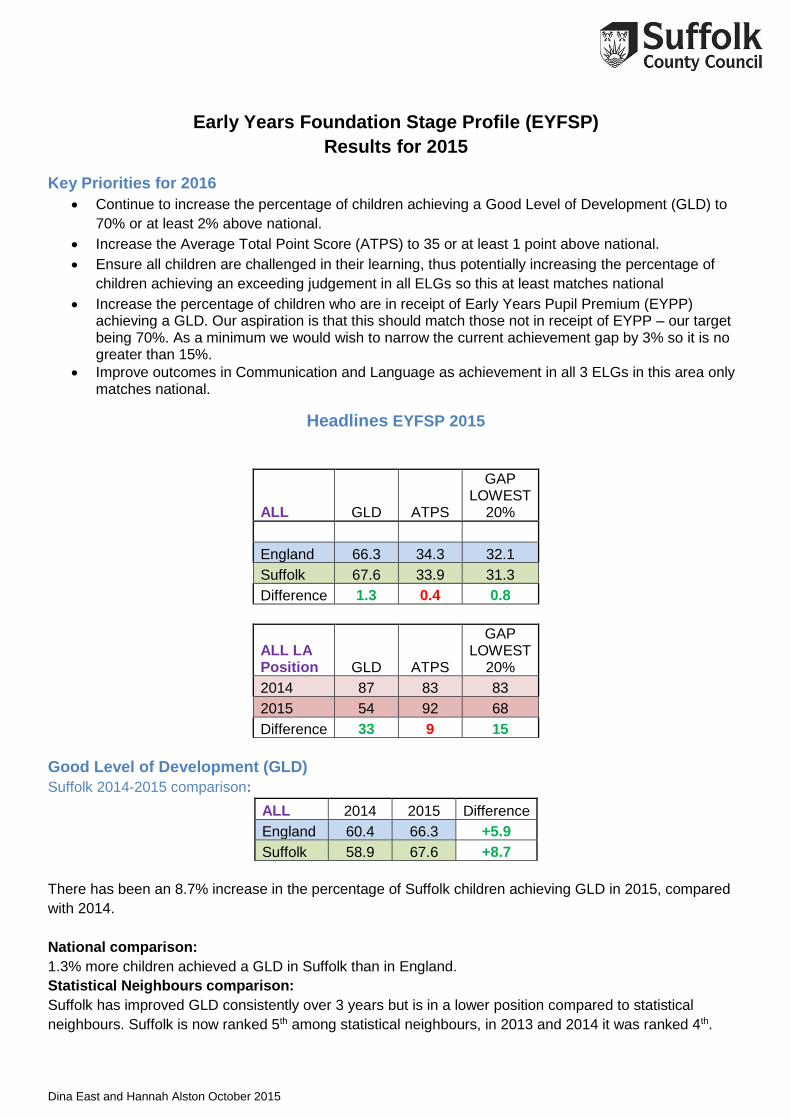
Early Years Foundation Stage Profile (EYFSP)
Results for 2015
Key Priorities for 2016
Continue to increase the percentage of children achieving a Good Level of Development (GLD) to
70% or at least 2% above national.
Increase the Average Total Point Score (ATPS) to 35 or at least 1 point above national.
Ensure all children are challenged in their learning, thus potentially increasing the percentage of
children achieving an exceeding judgement in all ELGs so this at least matches national
Increase the percentage of children who are in receipt of Early Years Pupil Premium (EYPP) achieving a GLD. Our aspiration is that this should match those not in receipt of EYPP – our target being 70%. As a minimum we would wish to narrow the current achievement gap by 3% so it is no greater than 15%.
Improve outcomes in Communication and Language as achievement in all 3 ELGs in this area only matches national.
Headlines EYFSP 2015
ALL GLD ATPS
GAP LOWEST
20%
England 66.3 34.3 32.1
Suffolk 67.6 33.9 31.3
Difference 1.3 0.4 0.8
ALL LA Position GLD ATPS
GAP LOWEST
20%
2014 87 83 83
2015 54 92 68
Difference 33 9 15
Good Level of Development (GLD)
Suffolk 2014-2015 comparison:
ALL 2014 2015 Difference
England 60.4 66.3 +5.9
Suffolk 58.9 67.6 +8.7
There has been an 8.7% increase in the percentage of Suffolk children achieving GLD in 2015, compared
with 2014.
National comparison:
1.3% more children achieved a GLD in Suffolk than in England.
Statistical Neighbours comparison:
Suffolk has improved GLD consistently over 3 years but is in a lower position compared to statistical
neighbours. Suffolk is now ranked 5th among statistical neighbours, in 2013 and 2014 it was ranked 4th.
Dina East and Hannah Alston October 2015
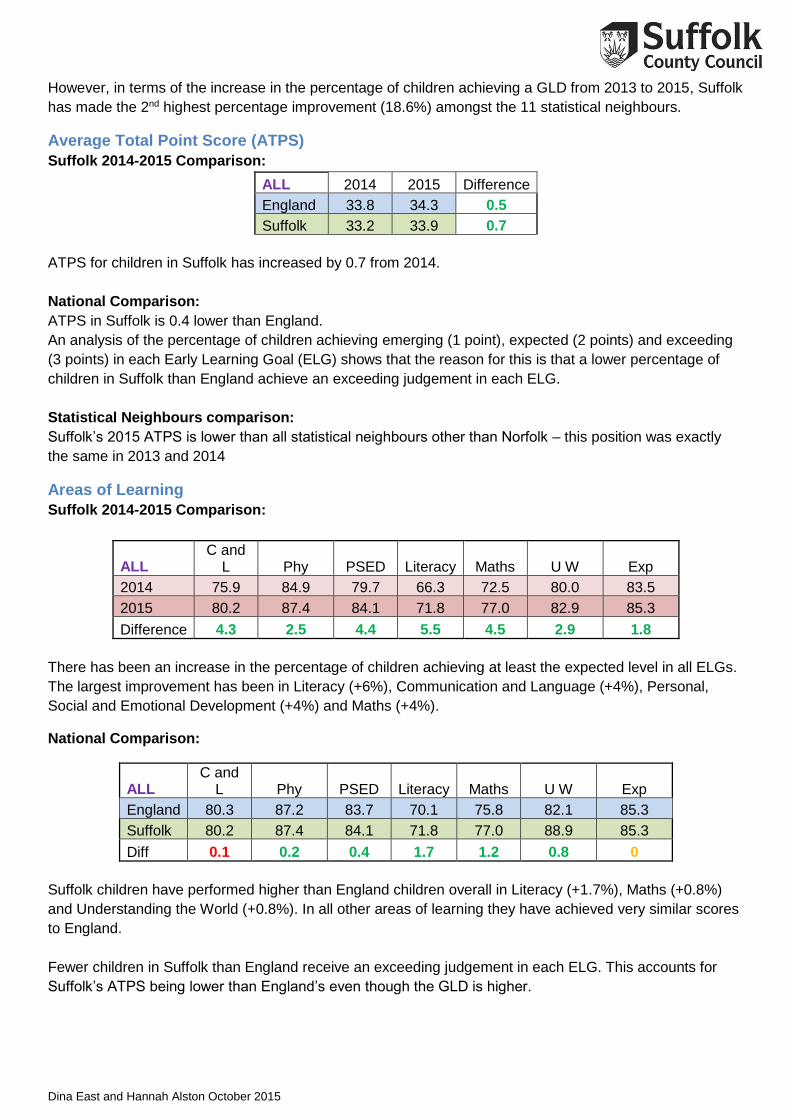
However, in terms of the increase in the percentage of children achieving a GLD from 2013 to 2015, Suffolk
has made the 2nd highest percentage improvement (18.6%) amongst the 11 statistical neighbours.
Average Total Point Score (ATPS)
Suffolk 2014-2015 Comparison:
ALL 2014 2015 Difference
England 33.8 34.3 0.5
Suffolk 33.2 33.9 0.7
ATPS for children in Suffolk has increased by 0.7 from 2014.
National Comparison:
ATPS in Suffolk is 0.4 lower than England.
An analysis of the percentage of children achieving emerging (1 point), expected (2 points) and exceeding
(3 points) in each Early Learning Goal (ELG) shows that the reason for this is that a lower percentage of
children in Suffolk than England achieve an exceeding judgement in each ELG.
Statistical Neighbours comparison:
Suffolk’s 2015 ATPS is lower than all statistical neighbours other than Norfolk – this position was exactly
the same in 2013 and 2014
Areas of Learning
Suffolk 2014-2015 Comparison:
ALL C and
L Phy PSED Literacy Maths U W Exp
2014 75.9 84.9 79.7 66.3 72.5 80.0 83.5
2015 80.2 87.4 84.1 71.8 77.0 82.9 85.3
Difference 4.3 2.5 4.4 5.5 4.5 2.9 1.8
There has been an increase in the percentage of children achieving at least the expected level in all ELGs.
The largest improvement has been in Literacy (+6%), Communication and Language (+4%), Personal,
Social and Emotional Development (+4%) and Maths (+4%).
National Comparison:
ALL C and
L Phy PSED Literacy Maths U W Exp
England 80.3 87.2 83.7 70.1 75.8 82.1 85.3
Suffolk 80.2 87.4 84.1 71.8 77.0 88.9 85.3
Diff 0.1 0.2 0.4 1.7 1.2 0.8 0
Suffolk children have performed higher than England children overall in Literacy (+1.7%), Maths (+0.8%)
and Understanding the World (+0.8%). In all other areas of learning they have achieved very similar scores
to England.
Fewer children in Suffolk than England receive an exceeding judgement in each ELG. This accounts for
Suffolk’s ATPS being lower than England’s even though the GLD is higher.
Dina East and Hannah Alston October 2015
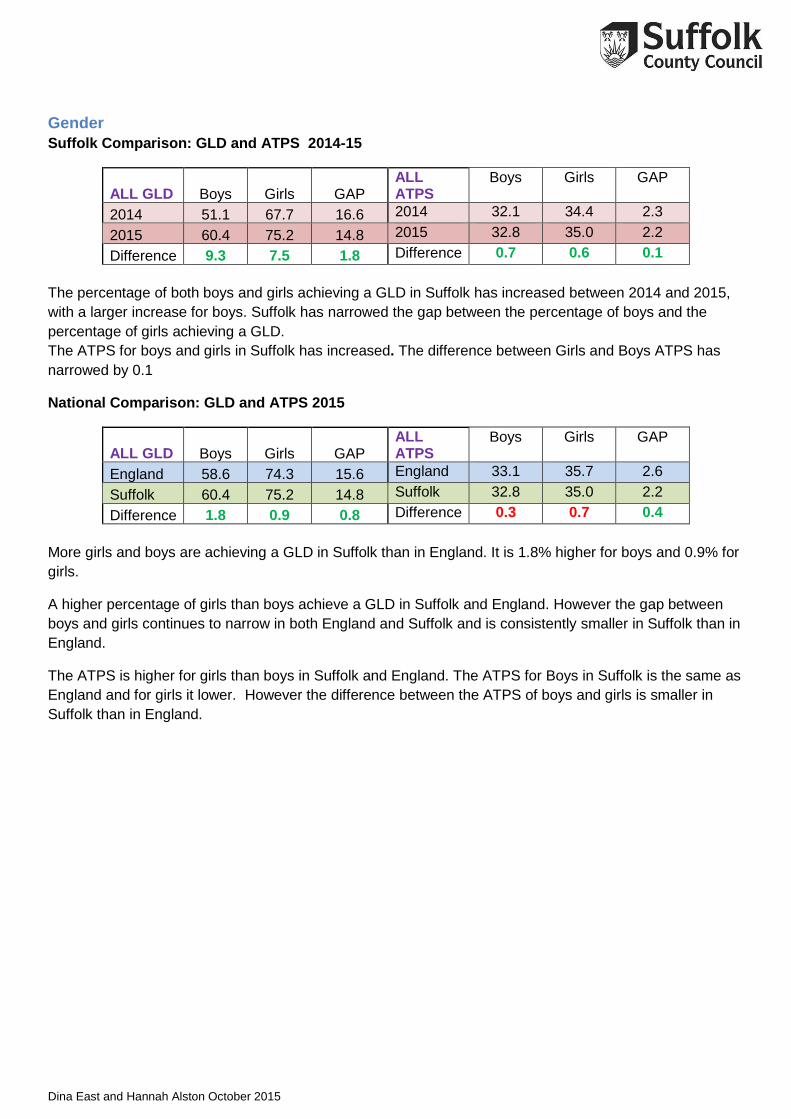
Gender
Suffolk Comparison: GLD and ATPS 2014-15
ALL GLD Boys Girls GAP ALL ATPS
Boys Girls GAP
2014 51.1 67.7 16.6 2014 32.1 34.4 2.3
2015 60.4 75.2 14.8 2015 32.8 35.0 2.2
Difference 9.3 7.5 1.8 Difference 0.7 0.6 0.1
The percentage of both boys and girls achieving a GLD in Suffolk has increased between 2014 and 2015,
with a larger increase for boys. Suffolk has narrowed the gap between the percentage of boys and the
percentage of girls achieving a GLD.
The ATPS for boys and girls in Suffolk has increased. The difference between Girls and Boys ATPS has
narrowed by 0.1
National Comparison: GLD and ATPS 2015
ALL GLD Boys Girls GAP ALL ATPS
Boys Girls GAP
England 58.6 74.3 15.6 England 33.1 35.7 2.6
Suffolk 60.4 75.2 14.8 Suffolk 32.8 35.0 2.2
Difference 1.8 0.9 0.8 Difference 0.3 0.7 0.4
More girls and boys are achieving a GLD in Suffolk than in England. It is 1.8% higher for boys and 0.9% for
girls.
A higher percentage of girls than boys achieve a GLD in Suffolk and England. However the gap between
boys and girls continues to narrow in both England and Suffolk and is consistently smaller in Suffolk than in
England.
The ATPS is higher for girls than boys in Suffolk and England. The ATPS for Boys in Suffolk is the same as
England and for girls it lower. However the difference between the ATPS of boys and girls is smaller in
Suffolk than in England.
Dina East and Hannah Alston October 2015
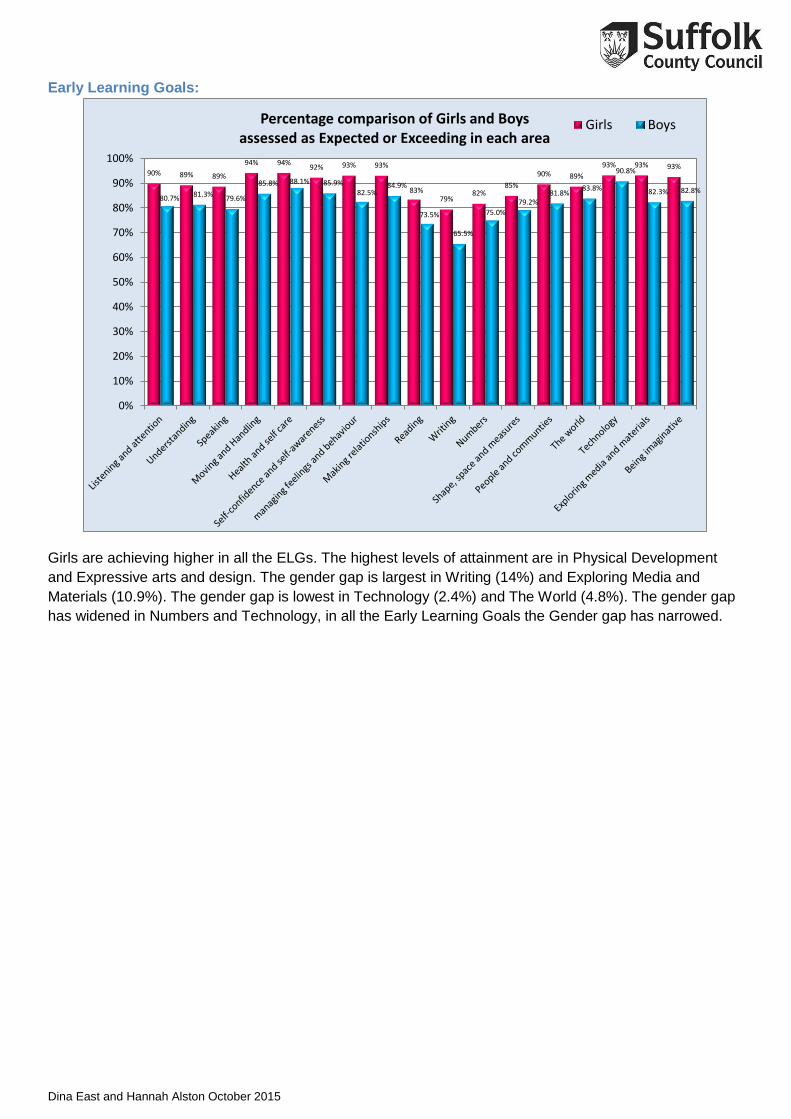
Early Learning Goals:
Girls are achieving higher in all the ELGs. The highest levels of attainment are in Physical Development
and Expressive arts and design. The gender gap is largest in Writing (14%) and Exploring Media and
Materials (10.9%). The gender gap is lowest in Technology (2.4%) and The World (4.8%). The gender gap
has widened in Numbers and Technology, in all the Early Learning Goals the Gender gap has narrowed.
90% 89% 89%
94% 94%92% 93% 93%
83%79%
82%85%
90% 89%
93% 93% 93%
80.7% 81.3%79.6%
85.8% 88.1% 85.9%82.5%
84.9%
73.5%
65.5%
75.0%
79.2%81.8%
83.8%
90.8%
82.3% 82.8%
0%
10%
20%
30%
40%
50%
60%
70%
80%
90%
100%
Percentage comparison of Girls and Boys assessed as Expected or Exceeding in each area
Girls Boys
Dina East and Hannah Alston October 2015
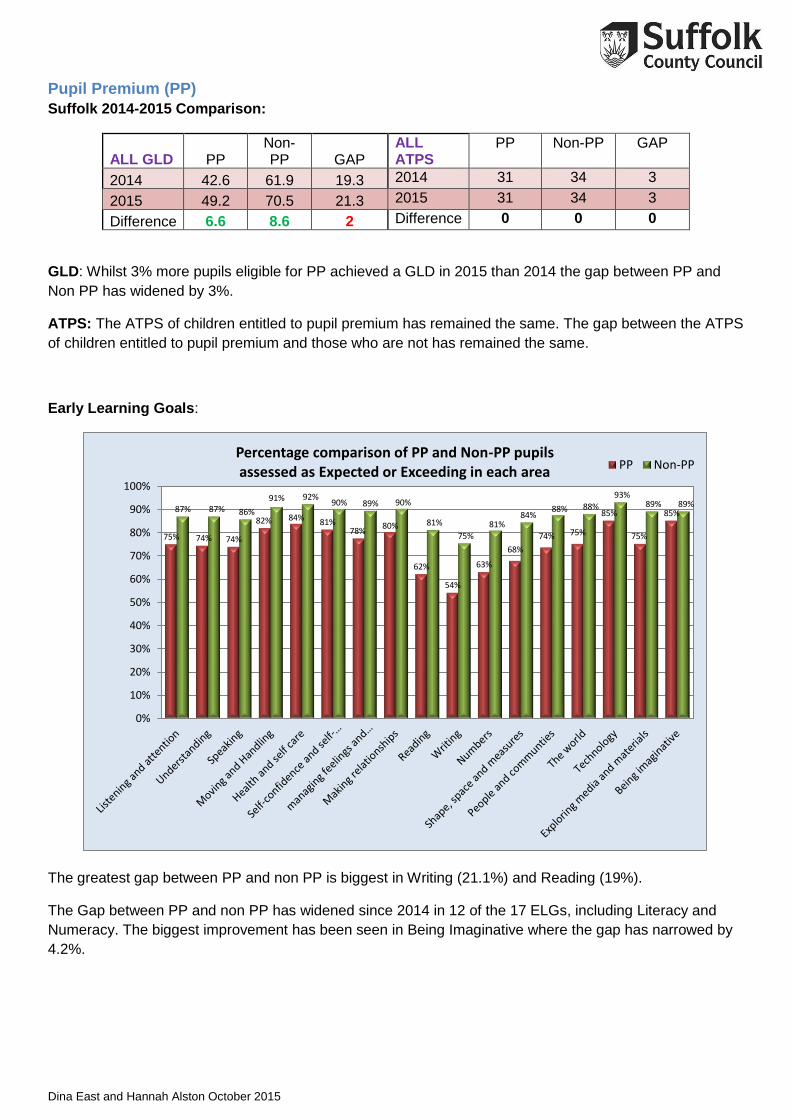
Pupil Premium (PP)
Suffolk 2014-2015 Comparison:
ALL GLD PP Non-PP GAP
ALL ATPS
PP Non-PP GAP
2014 42.6 61.9 19.3 2014 31 34 3
2015 49.2 70.5 21.3 2015 31 34 3
Difference 6.6 8.6 2 Difference 0 0 0
GLD: Whilst 3% more pupils eligible for PP achieved a GLD in 2015 than 2014 the gap between PP and
Non PP has widened by 3%.
ATPS: The ATPS of children entitled to pupil premium has remained the same. The gap between the ATPS
of children entitled to pupil premium and those who are not has remained the same.
Early Learning Goals:
The greatest gap between PP and non PP is biggest in Writing (21.1%) and Reading (19%).
The Gap between PP and non PP has widened since 2014 in 12 of the 17 ELGs, including Literacy and
Numeracy. The biggest improvement has been seen in Being Imaginative where the gap has narrowed by
4.2%.
75% 74% 74%
82% 84% 81%78%
80%
62%
54%
63%
68%
74% 75%
85%
75%
85%87% 87% 86%
91% 92%90% 89% 90%
81%
75%
81%84%
88% 88%
93%89% 89%
0%
10%
20%
30%
40%
50%
60%
70%
80%
90%
100%
Percentage comparison of PP and Non-PP pupils assessed as Expected or Exceeding in each area
PP Non-PP
Dina East and Hannah Alston October 2015
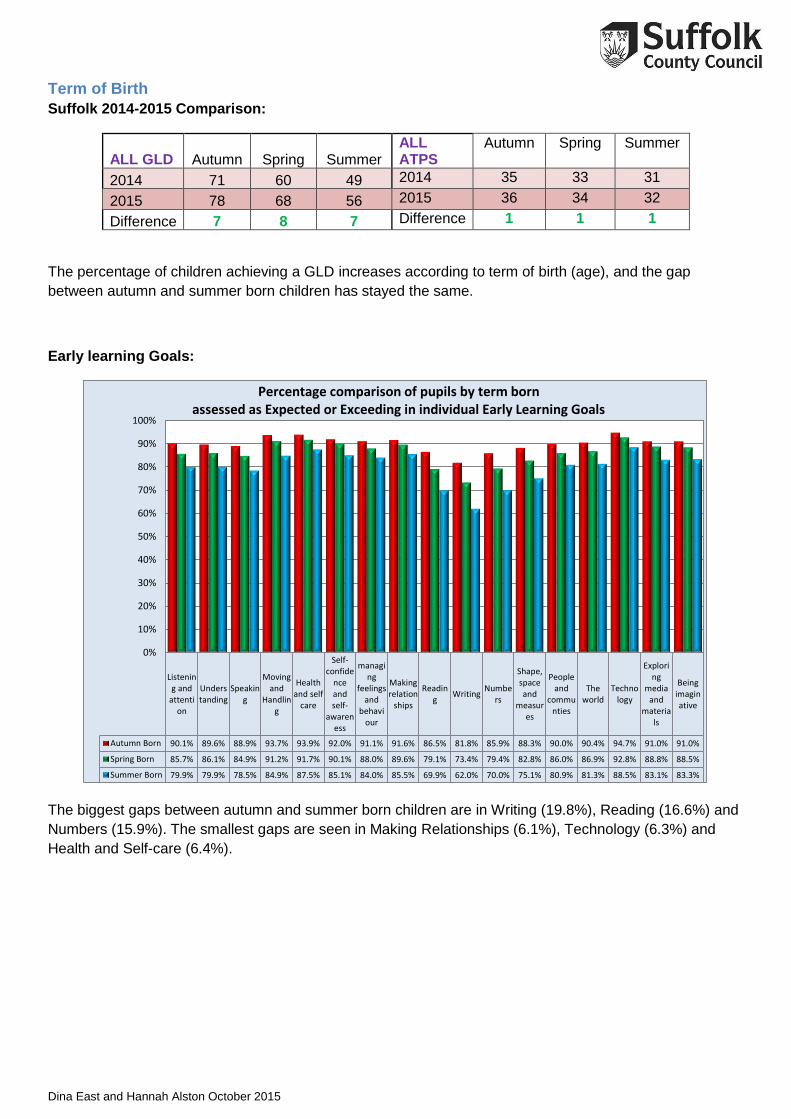
Term of Birth
Suffolk 2014-2015 Comparison:
ALL GLD Autumn Spring Summer ALL ATPS
Autumn Spring Summer
2014 71 60 49 2014 35 33 31
2015 78 68 56 2015 36 34 32
Difference 7 8 7 Difference 1 1 1
The percentage of children achieving a GLD increases according to term of birth (age), and the gap
between autumn and summer born children has stayed the same.
Early learning Goals:
The biggest gaps between autumn and summer born children are in Writing (19.8%), Reading (16.6%) and
Numbers (15.9%). The smallest gaps are seen in Making Relationships (6.1%), Technology (6.3%) and
Health and Self-care (6.4%).
Listening and
attention
Understanding
Speaking
Movingand
Handling
Healthand self
care
Self-confide
nceandself-
awareness
managing
feelingsand
behaviour
Makingrelation
ships
Reading
WritingNumbe
rs
Shape,spaceand
measures
Peopleand
communties
Theworld
Technology
Exploring
mediaand
materials
Beingimaginative
Autumn Born 90.1% 89.6% 88.9% 93.7% 93.9% 92.0% 91.1% 91.6% 86.5% 81.8% 85.9% 88.3% 90.0% 90.4% 94.7% 91.0% 91.0%
Spring Born 85.7% 86.1% 84.9% 91.2% 91.7% 90.1% 88.0% 89.6% 79.1% 73.4% 79.4% 82.8% 86.0% 86.9% 92.8% 88.8% 88.5%
Summer Born 79.9% 79.9% 78.5% 84.9% 87.5% 85.1% 84.0% 85.5% 69.9% 62.0% 70.0% 75.1% 80.9% 81.3% 88.5% 83.1% 83.3%
0%
10%
20%
30%
40%
50%
60%
70%
80%
90%
100%
Percentage comparison of pupils by term bornassessed as Expected or Exceeding in individual Early Learning Goals
Dina East and Hannah Alston October 2015
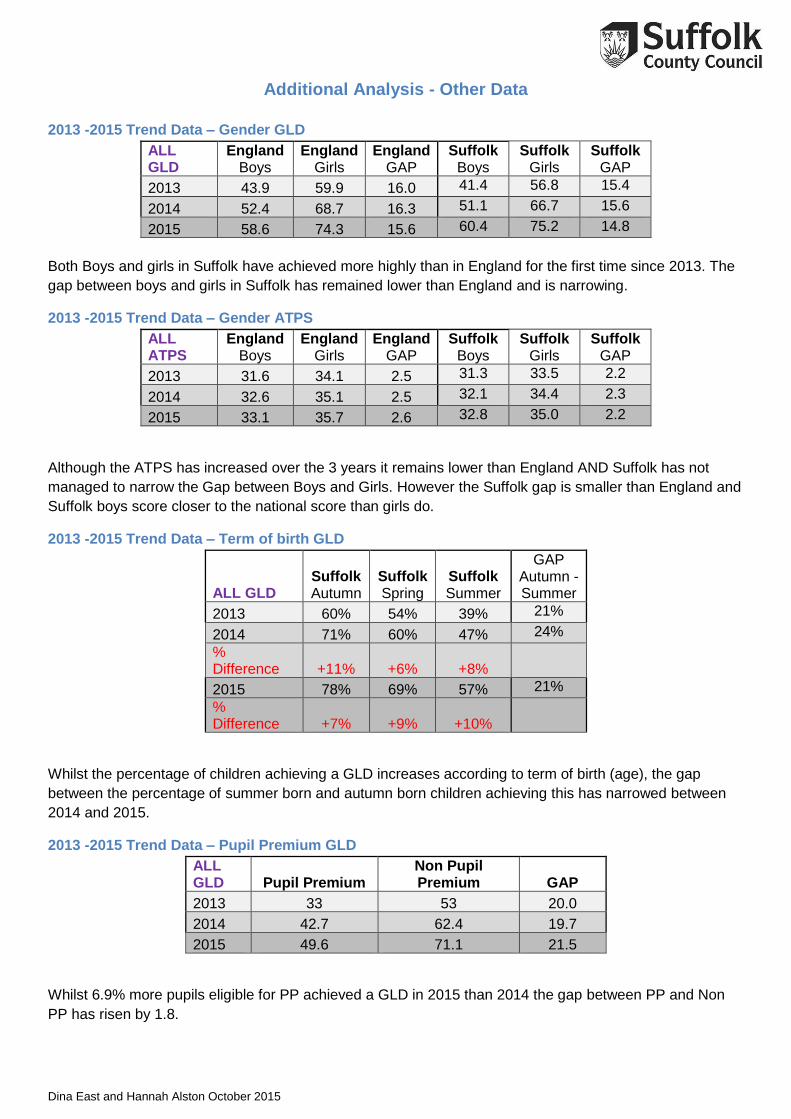
Additional Analysis - Other Data
2013 -2015 Trend Data – Gender GLD
ALL GLD
England Boys
England Girls
England GAP
Suffolk Boys
Suffolk Girls
Suffolk GAP
2013 43.9 59.9 16.0 41.4 56.8 15.4
2014 52.4 68.7 16.3 51.1 66.7 15.6
2015 58.6 74.3 15.6 60.4 75.2 14.8
Both Boys and girls in Suffolk have achieved more highly than in England for the first time since 2013. The
gap between boys and girls in Suffolk has remained lower than England and is narrowing.
2013 -2015 Trend Data – Gender ATPS
ALL ATPS
England Boys
England Girls
England GAP
Suffolk Boys
Suffolk Girls
Suffolk GAP
2013 31.6 34.1 2.5 31.3 33.5 2.2
2014 32.6 35.1 2.5 32.1 34.4 2.3
2015 33.1 35.7 2.6 32.8 35.0 2.2
Although the ATPS has increased over the 3 years it remains lower than England AND Suffolk has not
managed to narrow the Gap between Boys and Girls. However the Suffolk gap is smaller than England and
Suffolk boys score closer to the national score than girls do.
2013 -2015 Trend Data – Term of birth GLD
ALL GLD Suffolk Autumn
Suffolk Spring
Suffolk Summer
GAP Autumn - Summer
2013 60% 54% 39% 21%
2014 71% 60% 47% 24%
% Difference +11% +6% +8%
2015 78% 69% 57% 21%
% Difference +7% +9% +10%
Whilst the percentage of children achieving a GLD increases according to term of birth (age), the gap
between the percentage of summer born and autumn born children achieving this has narrowed between
2014 and 2015.
2013 -2015 Trend Data – Pupil Premium GLD
ALL GLD Pupil Premium
Non Pupil Premium GAP
2013 33 53 20.0
2014 42.7 62.4 19.7
2015 49.6 71.1 21.5
Whilst 6.9% more pupils eligible for PP achieved a GLD in 2015 than 2014 the gap between PP and Non
PP has risen by 1.8.
Dina East and Hannah Alston October 2015
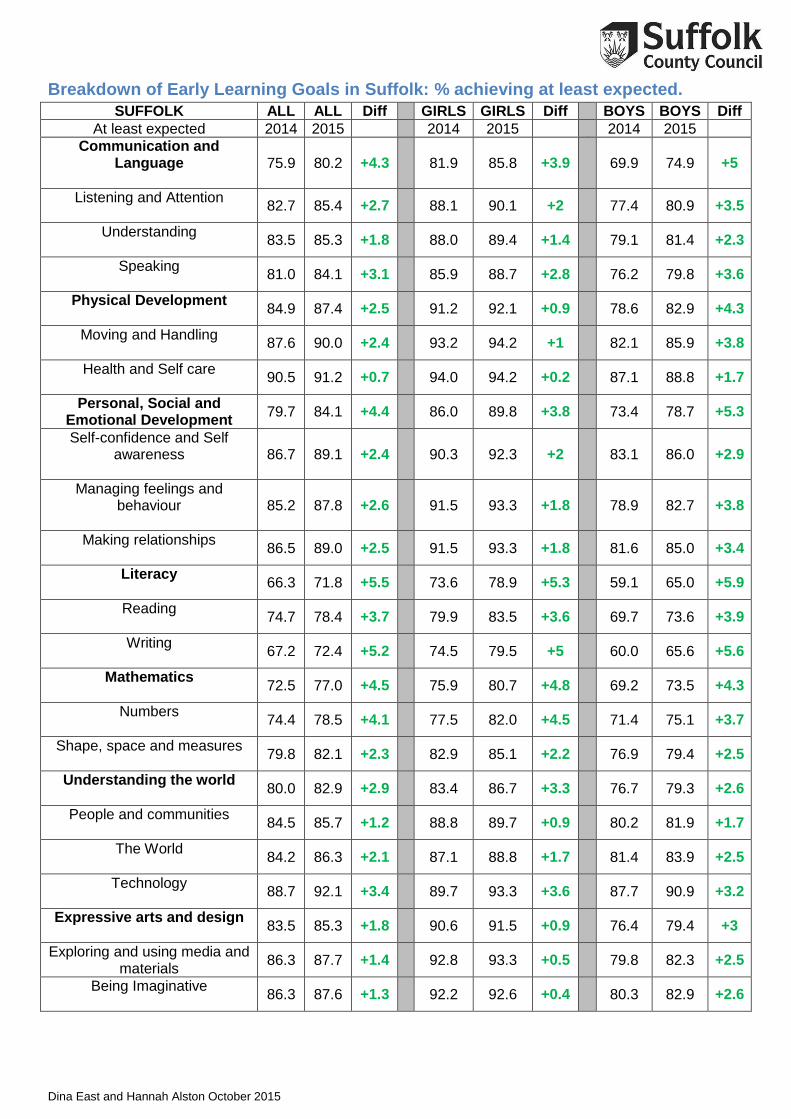
Breakdown of Early Learning Goals in Suffolk: % achieving at least expected.
SUFFOLK ALL ALL Diff GIRLS GIRLS Diff BOYS BOYS Diff
At least expected 2014 2015 2014 2015 2014 2015
Communication and Language
75.9 80.2 +4.3 81.9 85.8 +3.9 69.9 74.9 +5
Listening and Attention
82.7 85.4 +2.7 88.1 90.1 +2 77.4 80.9 +3.5
Understanding
83.5 85.3 +1.8 88.0 89.4 +1.4 79.1 81.4 +2.3
Speaking
81.0 84.1 +3.1 85.9 88.7 +2.8 76.2 79.8 +3.6
Physical Development
84.9 87.4 +2.5 91.2 92.1 +0.9 78.6 82.9 +4.3
Moving and Handling
87.6 90.0 +2.4 93.2 94.2 +1 82.1 85.9 +3.8
Health and Self care
90.5 91.2 +0.7 94.0 94.2 +0.2 87.1 88.8 +1.7
Personal, Social and Emotional Development
79.7 84.1 +4.4 86.0 89.8 +3.8 73.4 78.7 +5.3
Self-confidence and Self awareness
86.7 89.1 +2.4 90.3 92.3 +2 83.1 86.0 +2.9
Managing feelings and behaviour
85.2 87.8 +2.6 91.5 93.3 +1.8 78.9 82.7 +3.8
Making relationships
86.5 89.0 +2.5 91.5 93.3 +1.8 81.6 85.0 +3.4
Literacy
66.3 71.8 +5.5 73.6 78.9 +5.3 59.1 65.0 +5.9
Reading
74.7 78.4 +3.7 79.9 83.5 +3.6 69.7 73.6 +3.9
Writing
67.2 72.4 +5.2 74.5 79.5 +5 60.0 65.6 +5.6
Mathematics
72.5 77.0 +4.5 75.9 80.7 +4.8 69.2 73.5 +4.3
Numbers
74.4 78.5 +4.1 77.5 82.0 +4.5 71.4 75.1 +3.7
Shape, space and measures
79.8 82.1 +2.3 82.9 85.1 +2.2 76.9 79.4 +2.5
Understanding the world
80.0 82.9 +2.9 83.4 86.7 +3.3 76.7 79.3 +2.6
People and communities
84.5 85.7 +1.2 88.8 89.7 +0.9 80.2 81.9 +1.7
The World
84.2 86.3 +2.1 87.1 88.8 +1.7 81.4 83.9 +2.5
Technology
88.7 92.1 +3.4 89.7 93.3 +3.6 87.7 90.9 +3.2
Expressive arts and design
83.5 85.3 +1.8 90.6 91.5 +0.9 76.4 79.4 +3
Exploring and using media and materials
86.3 87.7 +1.4 92.8 93.3 +0.5 79.8 82.3 +2.5
Being Imaginative
86.3 87.6 +1.3 92.2 92.6 +0.4 80.3 82.9 +2.6
Dina East and Hannah Alston October 2015
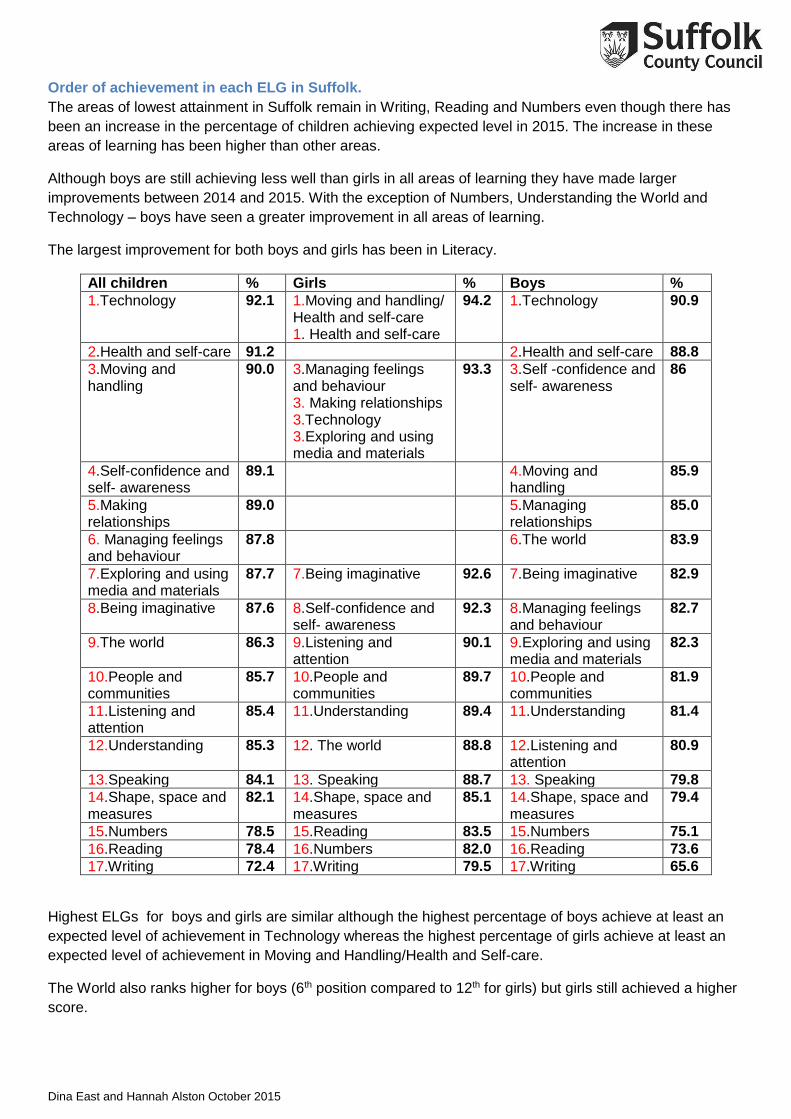
Order of achievement in each ELG in Suffolk.
The areas of lowest attainment in Suffolk remain in Writing, Reading and Numbers even though there has
been an increase in the percentage of children achieving expected level in 2015. The increase in these
areas of learning has been higher than other areas.
Although boys are still achieving less well than girls in all areas of learning they have made larger
improvements between 2014 and 2015. With the exception of Numbers, Understanding the World and
Technology – boys have seen a greater improvement in all areas of learning.
The largest improvement for both boys and girls has been in Literacy.
All children % Girls % Boys %
1.Technology 92.1 1.Moving and handling/ Health and self-care 1. Health and self-care
94.2 1.Technology 90.9
2.Health and self-care 91.2 2.Health and self-care 88.8
3.Moving and handling
90.0 3.Managing feelings and behaviour 3. Making relationships 3.Technology 3.Exploring and using media and materials
93.3 3.Self -confidence and self- awareness
86
4.Self-confidence and self- awareness
89.1 4.Moving and handling
85.9
5.Making relationships
89.0 5.Managing relationships
85.0
6. Managing feelings and behaviour
87.8 6.The world 83.9
7.Exploring and using media and materials
87.7 7.Being imaginative 92.6 7.Being imaginative
82.9
8.Being imaginative 87.6 8.Self-confidence and self- awareness
92.3 8.Managing feelings and behaviour
82.7
9.The world 86.3 9.Listening and attention
90.1 9.Exploring and using media and materials
82.3
10.People and communities
85.7 10.People and communities
89.7 10.People and communities
81.9
11.Listening and attention
85.4 11.Understanding 89.4 11.Understanding 81.4
12.Understanding 85.3 12. The world 88.8 12.Listening and attention
80.9
13.Speaking 84.1 13. Speaking 88.7 13. Speaking 79.8
14.Shape, space and measures
82.1 14.Shape, space and measures
85.1 14.Shape, space and measures
79.4
15.Numbers 78.5 15.Reading 83.5 15.Numbers 75.1
16.Reading 78.4 16.Numbers 82.0 16.Reading 73.6
17.Writing 72.4 17.Writing 79.5 17.Writing 65.6
Highest ELGs for boys and girls are similar although the highest percentage of boys achieve at least an
expected level of achievement in Technology whereas the highest percentage of girls achieve at least an
expected level of achievement in Moving and Handling/Health and Self-care.
The World also ranks higher for boys (6th position compared to 12th for girls) but girls still achieved a higher
score.
Dina East and Hannah Alston October 2015
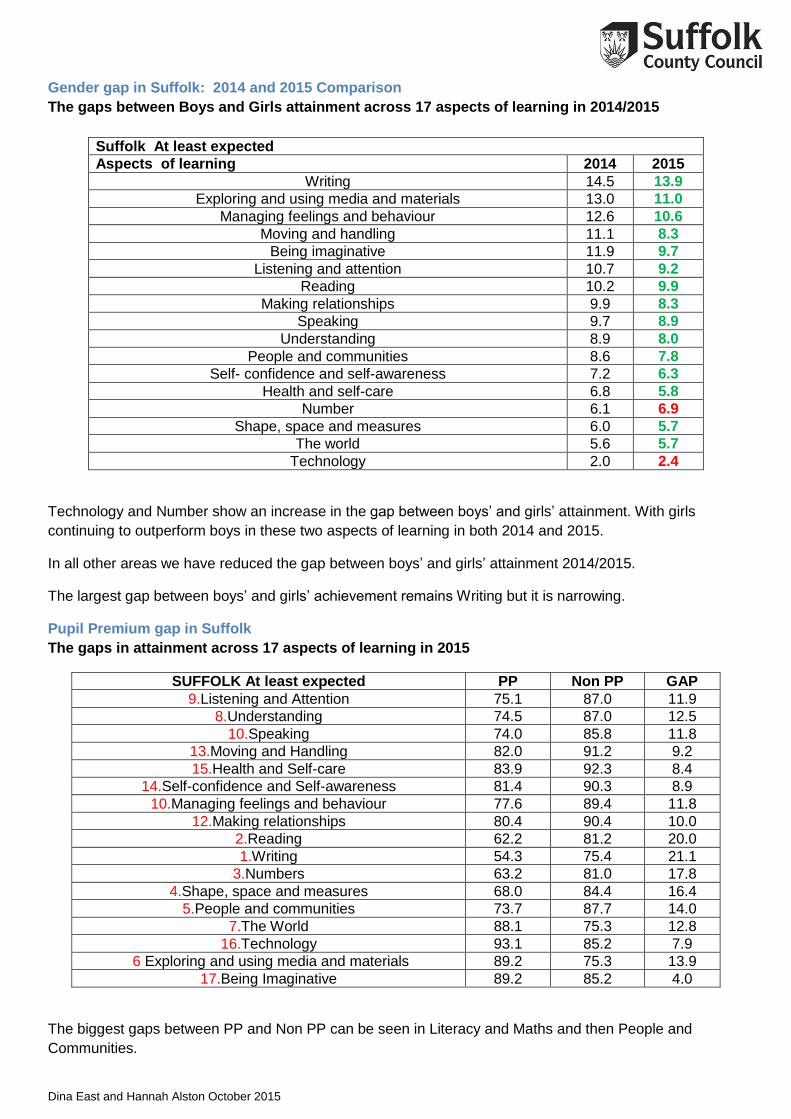
Gender gap in Suffolk: 2014 and 2015 Comparison
The gaps between Boys and Girls attainment across 17 aspects of learning in 2014/2015
Suffolk At least expected
Aspects of learning 2014 2015
Writing 14.5 13.9
Exploring and using media and materials 13.0 11.0
Managing feelings and behaviour 12.6 10.6
Moving and handling 11.1 8.3
Being imaginative 11.9 9.7
Listening and attention 10.7 9.2
Reading 10.2 9.9
Making relationships 9.9 8.3
Speaking 9.7 8.9
Understanding 8.9 8.0
People and communities 8.6 7.8
Self- confidence and self-awareness 7.2 6.3
Health and self-care 6.8 5.8
Number 6.1 6.9
Shape, space and measures 6.0 5.7
The world 5.6 5.7
Technology 2.0 2.4
Technology and Number show an increase in the gap between boys’ and girls’ attainment. With girls
continuing to outperform boys in these two aspects of learning in both 2014 and 2015.
In all other areas we have reduced the gap between boys’ and girls’ attainment 2014/2015.
The largest gap between boys’ and girls’ achievement remains Writing but it is narrowing.
Pupil Premium gap in Suffolk
The gaps in attainment across 17 aspects of learning in 2015
SUFFOLK At least expected PP Non PP GAP
9.Listening and Attention 75.1 87.0 11.9
8.Understanding 74.5 87.0 12.5
10.Speaking 74.0 85.8 11.8
13.Moving and Handling 82.0 91.2 9.2
15.Health and Self-care 83.9 92.3 8.4
14.Self-confidence and Self-awareness 81.4 90.3 8.9
10.Managing feelings and behaviour 77.6 89.4 11.8
12.Making relationships 80.4 90.4 10.0
2.Reading 62.2 81.2 20.0
1.Writing 54.3 75.4 21.1
3.Numbers 63.2 81.0 17.8
4.Shape, space and measures 68.0 84.4 16.4
5.People and communities 73.7 87.7 14.0
7.The World 88.1 75.3 12.8
16.Technology 93.1 85.2 7.9
6 Exploring and using media and materials 89.2 75.3 13.9
17.Being Imaginative 89.2 85.2 4.0
The biggest gaps between PP and Non PP can be seen in Literacy and Maths and then People and
Communities.
Dina East and Hannah Alston October 2015
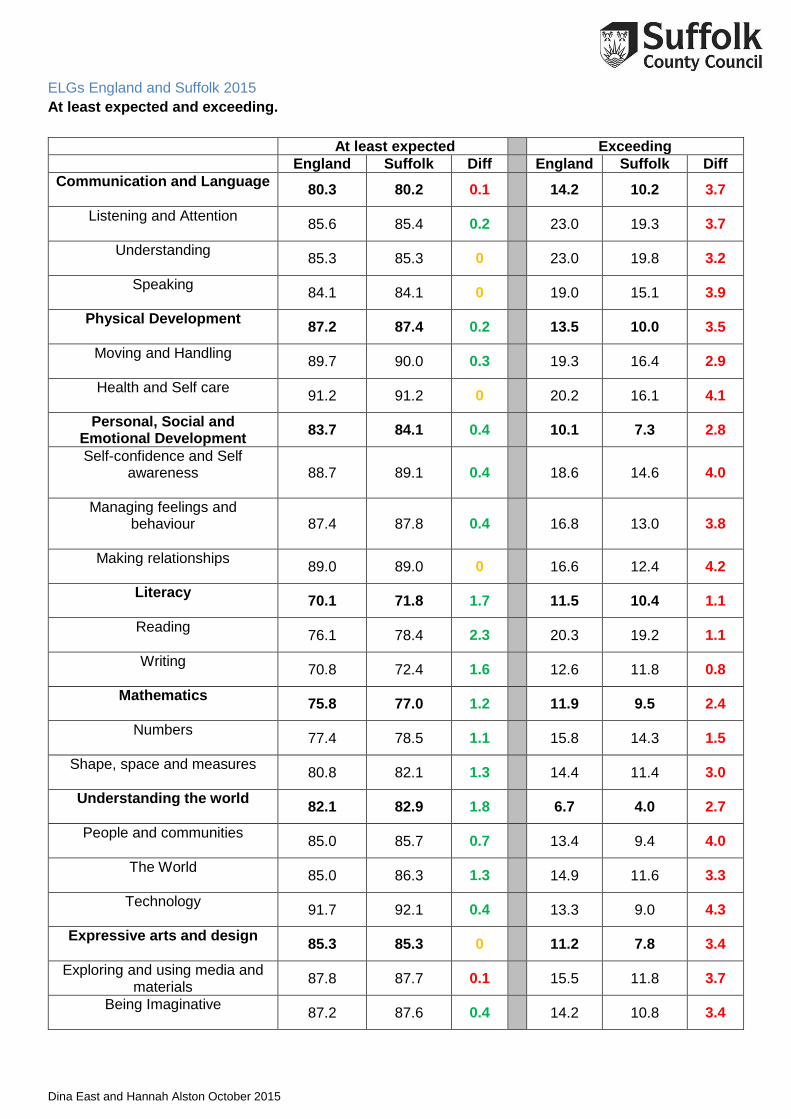
ELGs England and Suffolk 2015
At least expected and exceeding.
At least expected Exceeding
England Suffolk Diff England Suffolk Diff
Communication and Language
80.3 80.2 0.1 14.2 10.2 3.7
Listening and Attention
85.6 85.4 0.2 23.0 19.3 3.7
Understanding
85.3 85.3 0 23.0 19.8 3.2
Speaking
84.1 84.1 0 19.0 15.1 3.9
Physical Development
87.2 87.4 0.2 13.5 10.0 3.5
Moving and Handling
89.7 90.0 0.3 19.3 16.4 2.9
Health and Self care
91.2 91.2 0 20.2 16.1 4.1
Personal, Social and Emotional Development
83.7 84.1 0.4 10.1 7.3 2.8
Self-confidence and Self awareness
88.7 89.1 0.4 18.6 14.6 4.0
Managing feelings and behaviour
87.4 87.8 0.4 16.8 13.0 3.8
Making relationships
89.0 89.0 0 16.6 12.4 4.2
Literacy
70.1 71.8 1.7 11.5 10.4 1.1
Reading
76.1 78.4 2.3 20.3 19.2 1.1
Writing
70.8 72.4 1.6 12.6 11.8 0.8
Mathematics
75.8 77.0 1.2 11.9 9.5 2.4
Numbers
77.4 78.5 1.1 15.8 14.3 1.5
Shape, space and measures
80.8 82.1 1.3 14.4 11.4 3.0
Understanding the world
82.1 82.9 1.8 6.7 4.0 2.7
People and communities
85.0 85.7 0.7 13.4 9.4 4.0
The World
85.0 86.3 1.3 14.9 11.6 3.3
Technology
91.7 92.1 0.4 13.3 9.0 4.3
Expressive arts and design
85.3 85.3 0 11.2 7.8 3.4
Exploring and using media and materials
87.8 87.7 0.1 15.5 11.8 3.7
Being Imaginative
87.2 87.6 0.4 14.2 10.8 3.4
Dina East and Hannah Alston October 2015
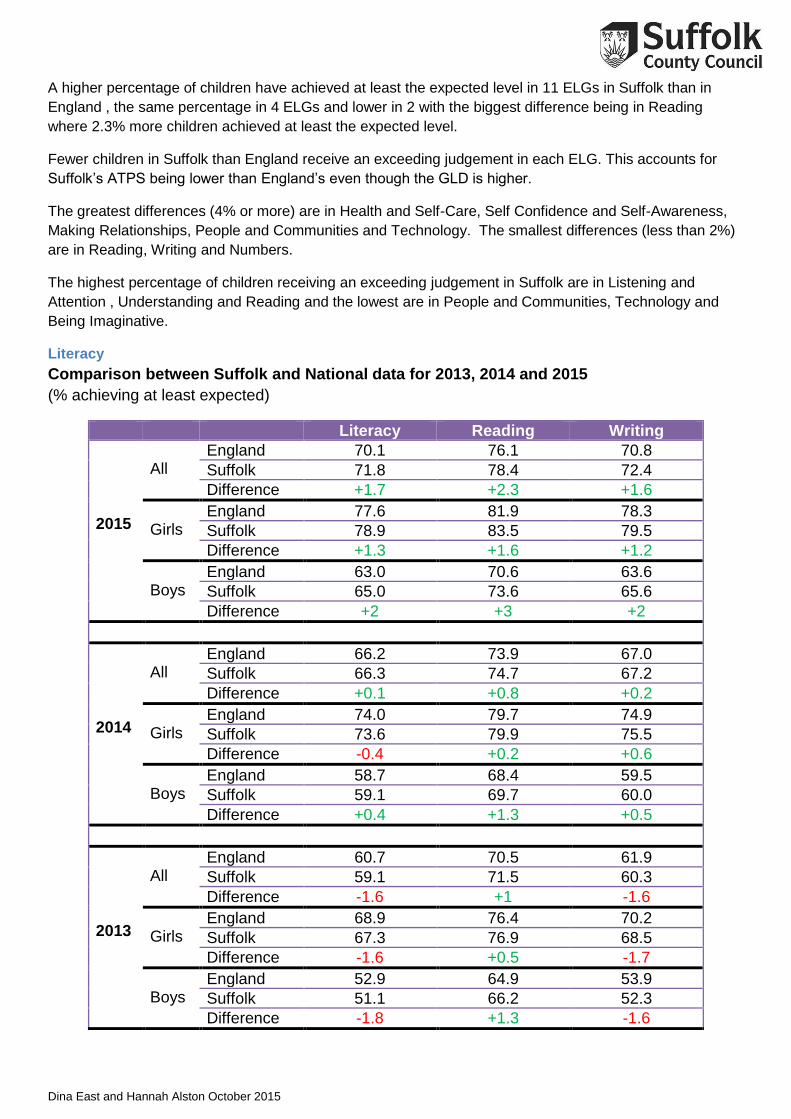
A higher percentage of children have achieved at least the expected level in 11 ELGs in Suffolk than in
England , the same percentage in 4 ELGs and lower in 2 with the biggest difference being in Reading
where 2.3% more children achieved at least the expected level.
Fewer children in Suffolk than England receive an exceeding judgement in each ELG. This accounts for
Suffolk’s ATPS being lower than England’s even though the GLD is higher.
The greatest differences (4% or more) are in Health and Self-Care, Self Confidence and Self-Awareness,
Making Relationships, People and Communities and Technology. The smallest differences (less than 2%)
are in Reading, Writing and Numbers.
The highest percentage of children receiving an exceeding judgement in Suffolk are in Listening and
Attention , Understanding and Reading and the lowest are in People and Communities, Technology and
Being Imaginative.
Literacy
Comparison between Suffolk and National data for 2013, 2014 and 2015
(% achieving at least expected)
Literacy Reading Writing
2015
All
England 70.1 76.1 70.8
Suffolk 71.8 78.4 72.4
Difference +1.7 +2.3 +1.6
Girls
England 77.6 81.9 78.3
Suffolk 78.9 83.5 79.5
Difference +1.3 +1.6 +1.2
Boys
England 63.0 70.6 63.6
Suffolk 65.0 73.6 65.6
Difference +2 +3 +2
2014
All
England 66.2 73.9 67.0
Suffolk 66.3 74.7 67.2
Difference +0.1 +0.8 +0.2
Girls
England 74.0 79.7 74.9
Suffolk 73.6 79.9 75.5
Difference -0.4 +0.2 +0.6
Boys
England 58.7 68.4 59.5
Suffolk 59.1 69.7 60.0
Difference +0.4 +1.3 +0.5
2013
All
England 60.7 70.5 61.9
Suffolk 59.1 71.5 60.3
Difference -1.6 +1 -1.6
Girls
England 68.9 76.4 70.2
Suffolk 67.3 76.9 68.5
Difference -1.6 +0.5 -1.7
Boys
England 52.9 64.9 53.9
Suffolk 51.1 66.2 52.3
Difference -1.8 +1.3 -1.6