Embed Size (px)
Citation preview

First Quarter 2013 Earnings Conference Call
13 February 2013
| 1st Quarter 2013 Earnings Conference Call 2
Safe Harbor Statement & Disclosures
The earnings call and accompanying material include forward-looking comments and information concerning the company’s plans and projections for the future, including estimates and assumptions with respect to economic, political, technological, weather, market acceptance and other factors that impact our businesses and customers. They also may include financial measures that are not in conformance with accounting principles generally accepted in the United States of America (GAAP). Words such as “forecast,” “projection,” “outlook,” “prospects,” “expected,” “estimated,” “will,” “plan,” “anticipate,” “intend,” “believe,” or other similar words or phrases often identify forward-looking statements. Actual results may differ materially from those projected in these forward-looking statements based on a number of factors and uncertainties. Additional information concerning factors that could cause actual results to differ materially is contained in the company’s most recent Form 8-K and periodic report filed with the U.S. Securities and Exchange Commission, and is incorporated by reference herein. Investors should refer to and consider the incorporated information on risks and uncertainties in addition to the information presented here. Investors should consider non-GAAP financial measures in addition to, and not as a substitute for, financial measures prepared in accordance with GAAP. The company, except as required by law, undertakes no obligation to update or revise its forward-looking statements whether as a result of new developments or otherwise. The call and accompanying materials are not an offer to sell or a solicitation of offers to buy any of the company’s securities.
| 1st Quarter 2013 Earnings Conference Call 3
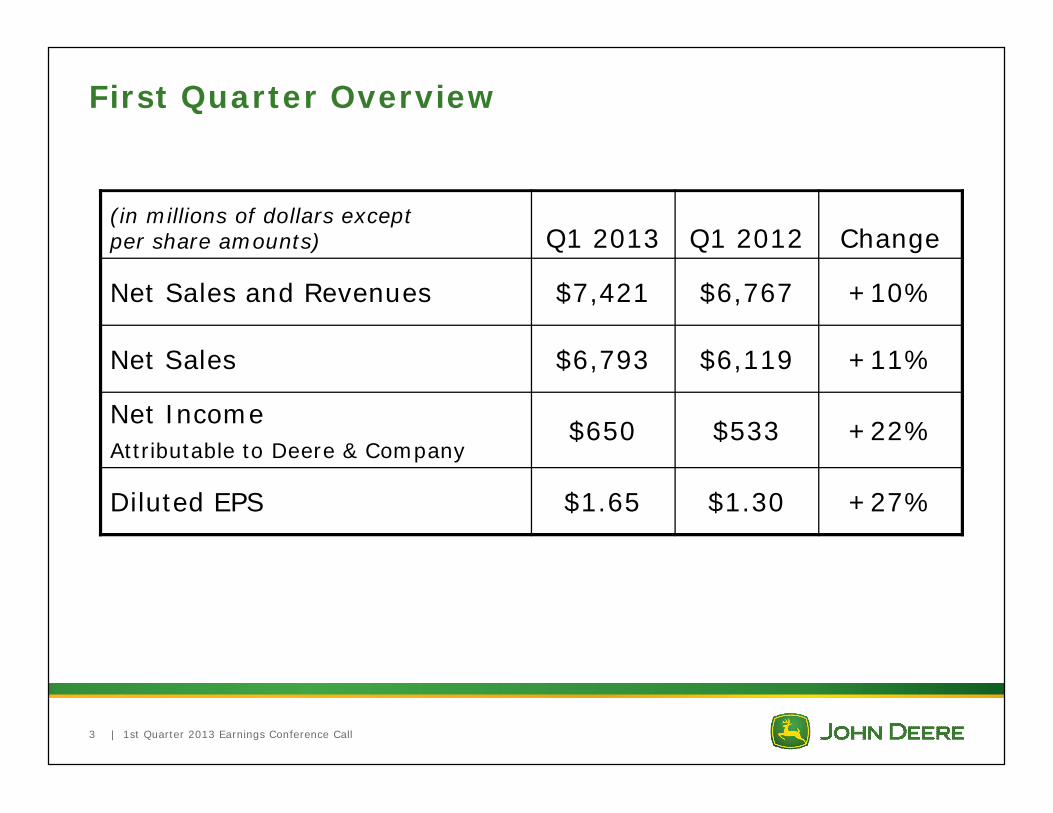
First Quarter Overview
(in millions of dollars except per share amounts) Q1 2013 Q1 2012 Change
Net Sales and Revenues $7,421 $6,767 +10%
Net Sales $6,793 $6,119 +11%
Net IncomeAttributable to Deere & Company
$650 $533 +22%
Diluted EPS $1.65 $1.30 +27%
| 1st Quarter 2013 Earnings Conference Call 4
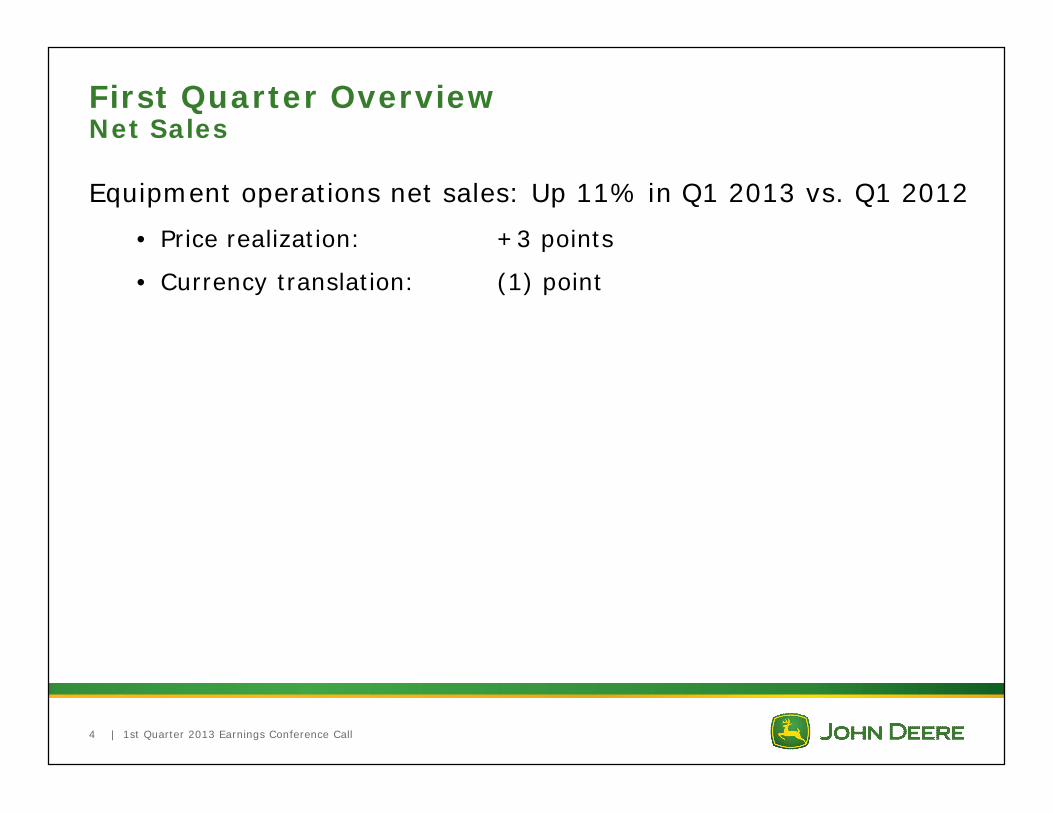
First Quarter OverviewNet Sales
Equipment operations net sales: Up 11% in Q1 2013 vs. Q1 2012
• Price realization: +3 points
• Currency translation: (1) point
| 1st Quarter 2013 Earnings Conference Call 5
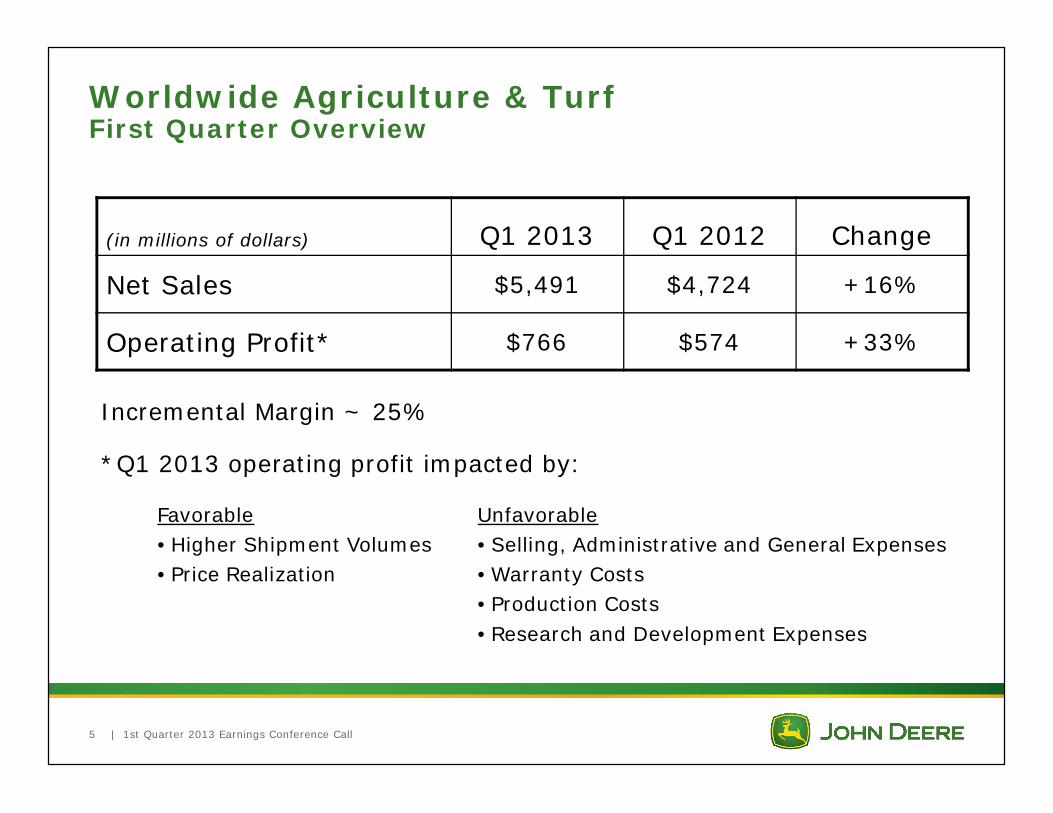
Worldwide Agriculture & TurfFirst Quarter Overview
Incremental Margin ~ 25%
*Q1 2013 operating profit impacted by:
(in millions of dollars) Q1 2013 Q1 2012 Change
Net Sales $5,491 $4,724 +16%
Operating Profit* $766 $574 +33%
Favorable Unfavorable• Higher Shipment Volumes • Selling, Administrative and General Expenses• Price Realization • Warranty Costs
• Production Costs• Research and Development Expenses
| 1st Quarter 2013 Earnings Conference Call 6
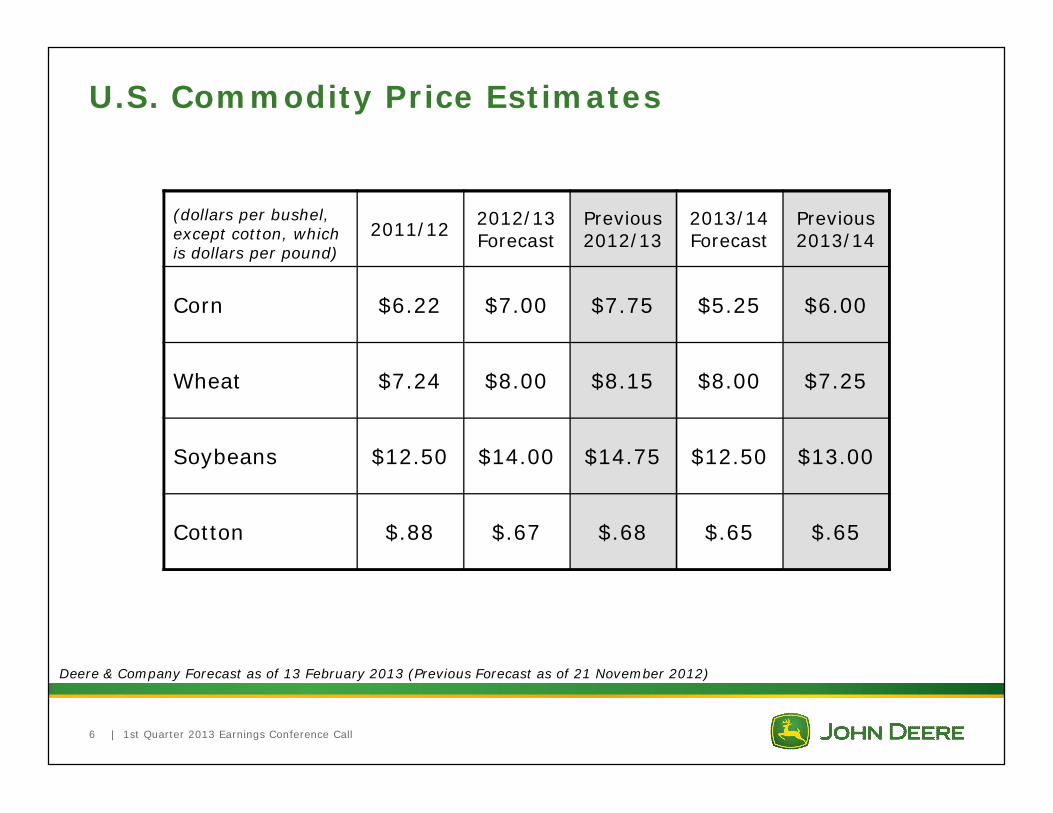
U.S. Commodity Price Estimates
Deere & Company Forecast as of 13 February 2013 (Previous Forecast as of 21 November 2012)
(dollars per bushel, except cotton, which is dollars per pound)
2011/12 2012/13 Forecast
Previous 2012/13
2013/14 Forecast
Previous 2013/14
Corn $6.22 $7.00 $7.75 $5.25 $6.00
Wheat $7.24 $8.00 $8.15 $8.00 $7.25
Soybeans $12.50 $14.00 $14.75 $12.50 $13.00
Cotton $.88 $.67 $.68 $.65 $.65
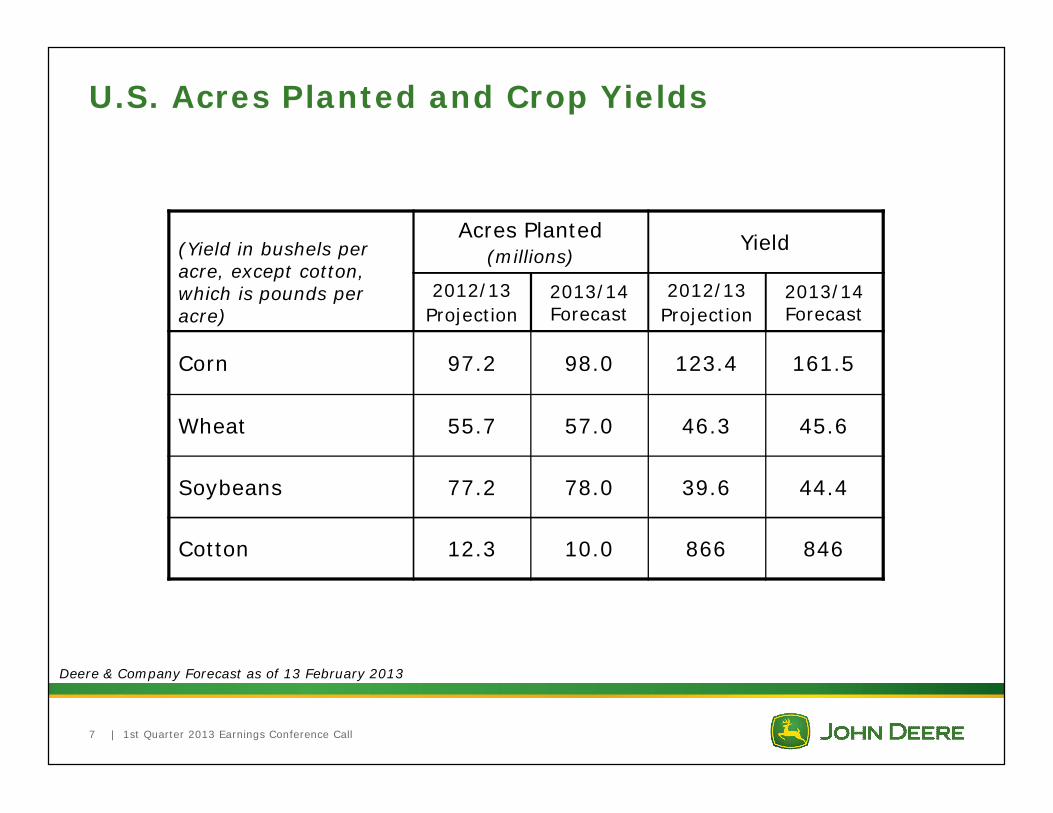
(Yield in bushels per acre, except cotton, which is pounds per acre)
Acres Planted(millions)
Yield
2012/13Projection
2013/14 Forecast
2012/13Projection
2013/14 Forecast
Corn 97.2 98.0 123.4 161.5
Wheat 55.7 57.0 46.3 45.6
Soybeans 77.2 78.0 39.6 44.4
Cotton 12.3 10.0 866 846
| 1st Quarter 2013 Earnings Conference Call 7
U.S. Acres Planted and Crop Yields
Deere & Company Forecast as of 13 February 2013
| 1st Quarter 2013 Earnings Conference Call 8
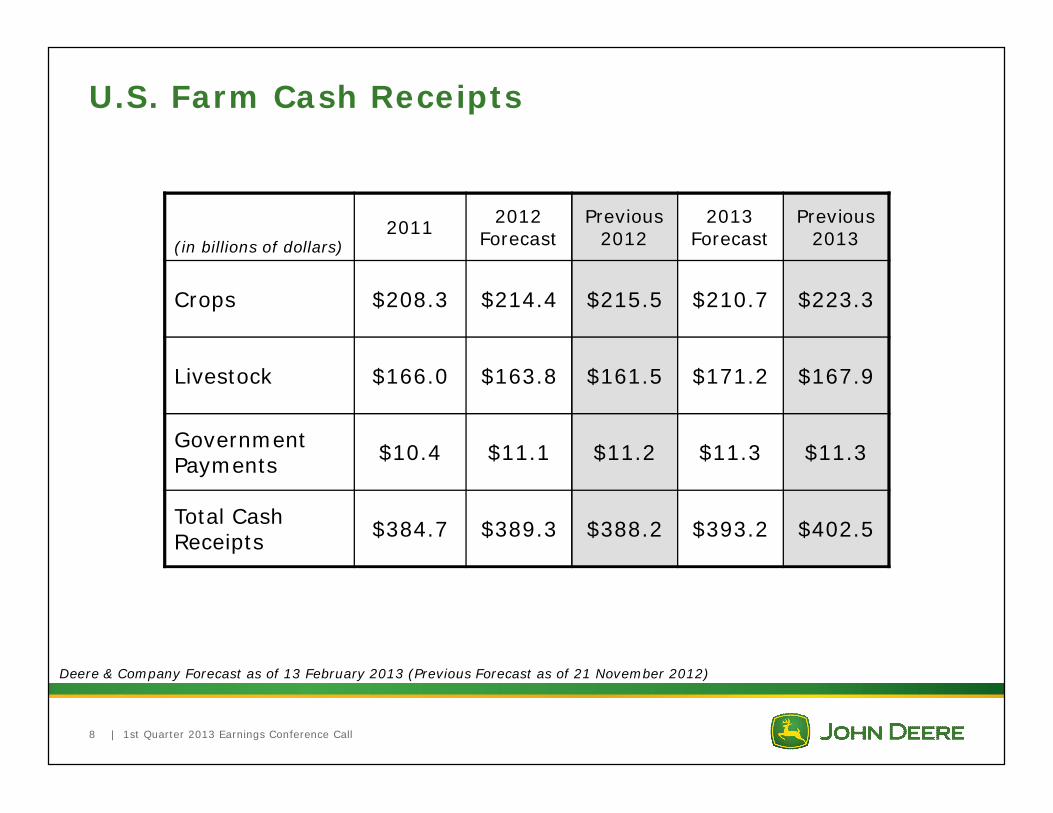
U.S. Farm Cash Receipts
Deere & Company Forecast as of 13 February 2013 (Previous Forecast as of 21 November 2012)
(in billions of dollars)2011 2012
ForecastPrevious
20122013
ForecastPrevious
2013
Crops $208.3 $214.4 $215.5 $210.7 $223.3
Livestock $166.0 $163.8 $161.5 $171.2 $167.9
Government Payments $10.4 $11.1 $11.2 $11.3 $11.3
Total Cash Receipts $384.7 $389.3 $388.2 $393.2 $402.5
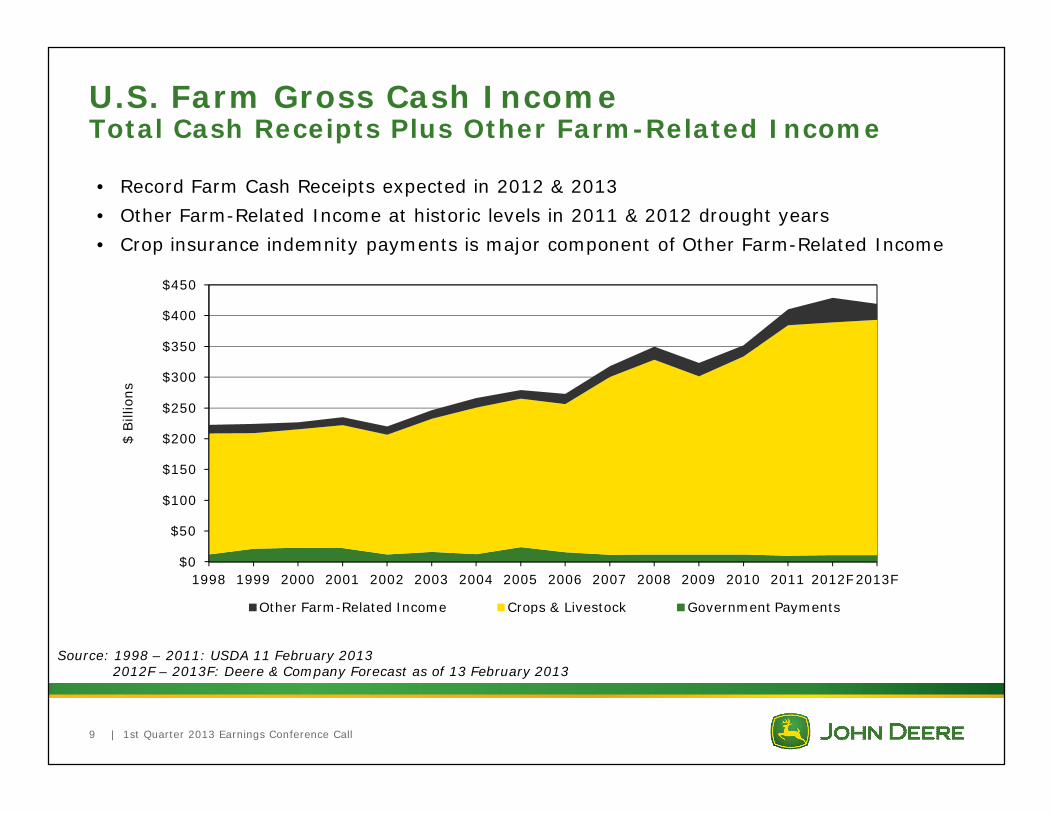
• Record Farm Cash Receipts expected in 2012 & 2013• Other Farm-Related Income at historic levels in 2011 & 2012 drought years• Crop insurance indemnity payments is major component of Other Farm-Related Income
| 1st Quarter 2013 Earnings Conference Call 9
U.S. Farm Gross Cash IncomeTotal Cash Receipts Plus Other Farm-Related Income
Source: 1998 – 2011: USDA 11 February 20132012F – 2013F: Deere & Company Forecast as of 13 February 2013
$0
$50
$100
$150
$200
$250
$300
$350
$400
$450
1998 1999 2000 2001 2002 2003 2004 2005 2006 2007 2008 2009 2010 2011 2012F2013F
$ Bill
ions
Other Farm-Related Income Crops & Livestock Government Payments
| 1st Quarter 2013 Earnings Conference Call 10
Deere & Company Forecast as of 13 February 2013
Economic UpdateEU 27
Wet weather conditions in UK negatively impacting demand
Financial crisis will continue to impact EU growth• While Portugal, Italy, Greece and Spain are in severe recession,
Northern European countries are in much better financial condition
Overall Ag economy somewhat positive due to high prices and farm income
• Beef, pork, milk and wheat prices are favorable
| 1st Quarter 2013 Earnings Conference Call 11
Deere & Company Forecast as of 13 February 2013
Economic UpdateOther Selected Markets
Commonwealth of Independent States (CIS) • Import duties will affect demand in Russia, Kazakhstan and Belarus• Farmer sentiment is positive• Commodity prices are favorable
India• Tractor market remains soft• Grain production forecast to be down ~ 5%• Reserve Bank of India lowered its key policy rate for the first time in
nine months to support the economy
China • Farm modernization supports urbanization and population growth• Ag subsidies expected to increase• Grain output expected to increase for 9th consecutive year
2003
2004
2005
2006
2007
2008
2009
2010
2011
2012
2013
F
| 1st Quarter 2013 Earnings Conference Call 12
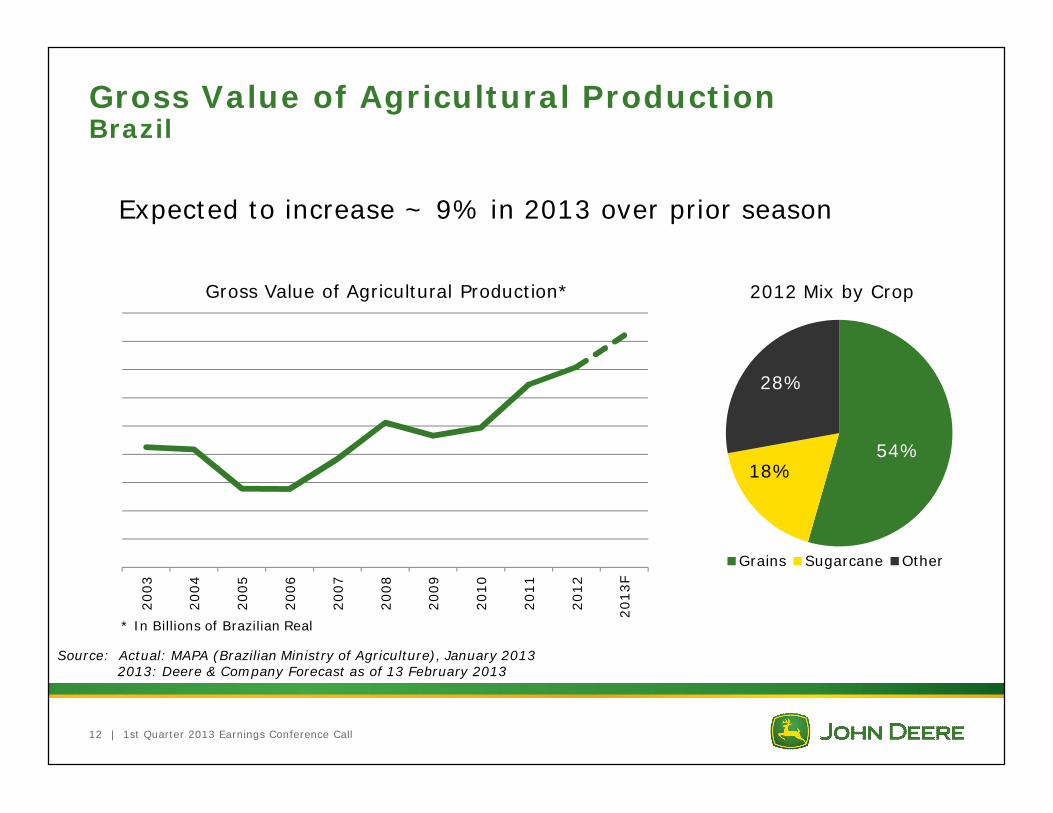
Gross Value of Agricultural Production Brazil
Gross Value of Agricultural Production*
* In Billions of Brazilian Real
Expected to increase ~ 9% in 2013 over prior season
2012 Mix by Crop
54%18%
28%
Grains Sugarcane Other
Source: Actual: MAPA (Brazilian Ministry of Agriculture), January 20132013: Deere & Company Forecast as of 13 February 2013
| 1st Quarter 2013 Earnings Conference Call 13
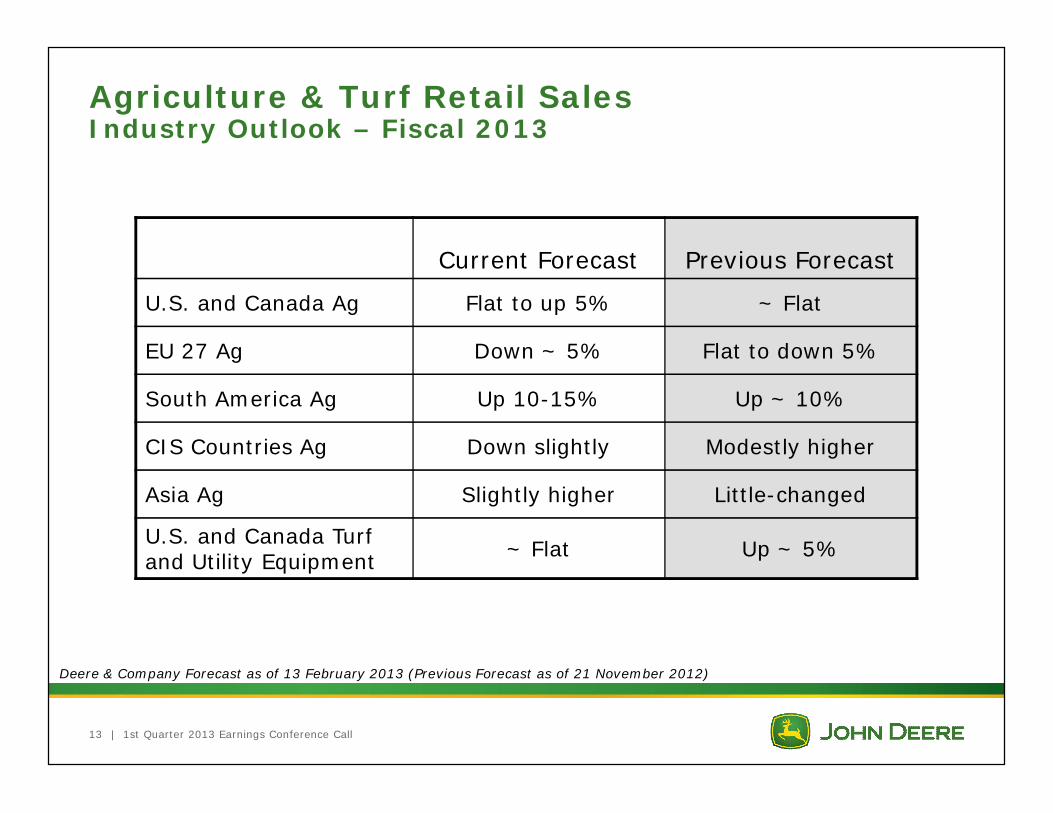
Agriculture & Turf Retail SalesIndustry Outlook – Fiscal 2013
Deere & Company Forecast as of 13 February 2013 (Previous Forecast as of 21 November 2012)
Current Forecast Previous Forecast
U.S. and Canada Ag Flat to up 5% ~ Flat
EU 27 Ag Down ~ 5% Flat to down 5%
South America Ag Up 10-15% Up ~ 10%
CIS Countries Ag Down slightly Modestly higher
Asia Ag Slightly higher Little-changed
U.S. and Canada Turf and Utility Equipment ~ Flat Up ~ 5%
| 1st Quarter 2013 Earnings Conference Call 14
Worldwide Agriculture & TurfDeere & Company Outlook
Fiscal Year 2013 Forecast• Net sales: Up ~ 6%• Previous forecast: Up ~ 4%
Deere & Company Forecast as of 13 February 2013 (Previous Forecast as of 21 November 2012)
| 1st Quarter 2013 Earnings Conference Call 15
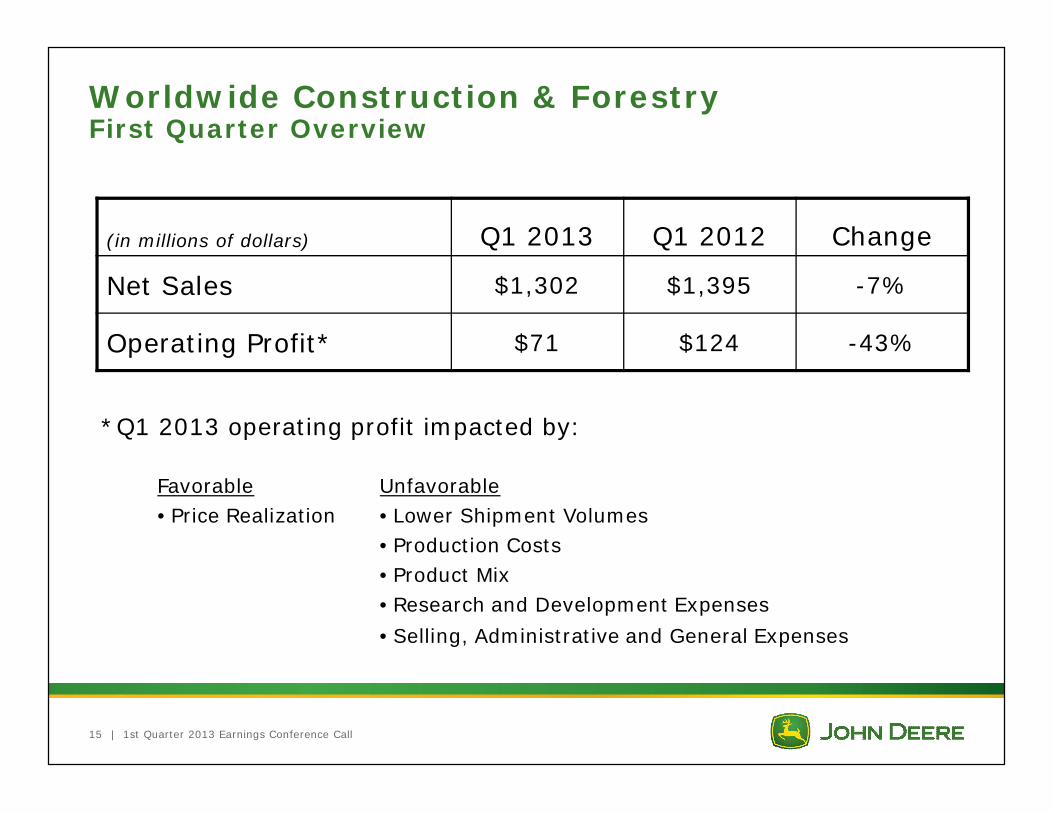
Worldwide Construction & ForestryFirst Quarter Overview
(in millions of dollars) Q1 2013 Q1 2012 Change
Net Sales $1,302 $1,395 -7%
Operating Profit* $71 $124 -43%
*Q1 2013 operating profit impacted by:
Favorable Unfavorable• Price Realization • Lower Shipment Volumes
• Production Costs• Product Mix• Research and Development Expenses• Selling, Administrative and General Expenses
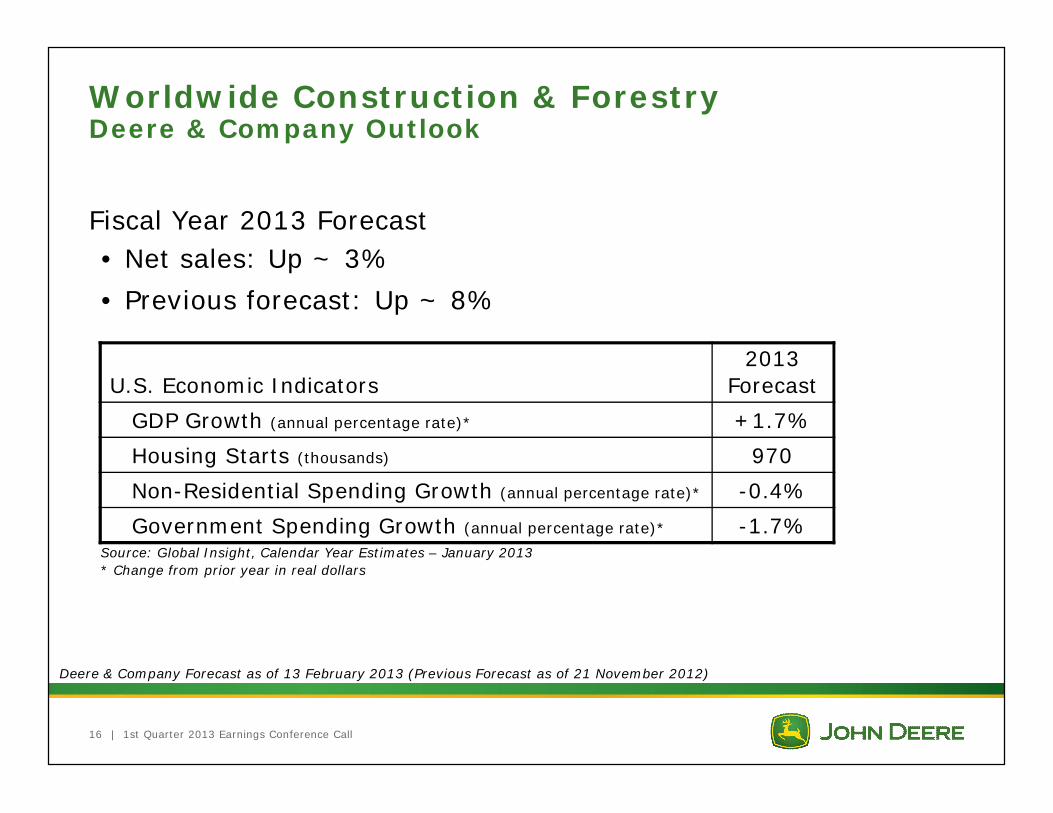
U.S. Economic Indicators2013
ForecastGDP Growth (annual percentage rate)* +1.7%Housing Starts (thousands) 970Non-Residential Spending Growth (annual percentage rate)* -0.4%Government Spending Growth (annual percentage rate)* -1.7%
| 1st Quarter 2013 Earnings Conference Call 16
Worldwide Construction & ForestryDeere & Company Outlook
Source: Global Insight, Calendar Year Estimates – January 2013* Change from prior year in real dollars
Fiscal Year 2013 Forecast• Net sales: Up ~ 3%• Previous forecast: Up ~ 8%
Deere & Company Forecast as of 13 February 2013 (Previous Forecast as of 21 November 2012)
| 1st Quarter 2013 Earnings Conference Call 17
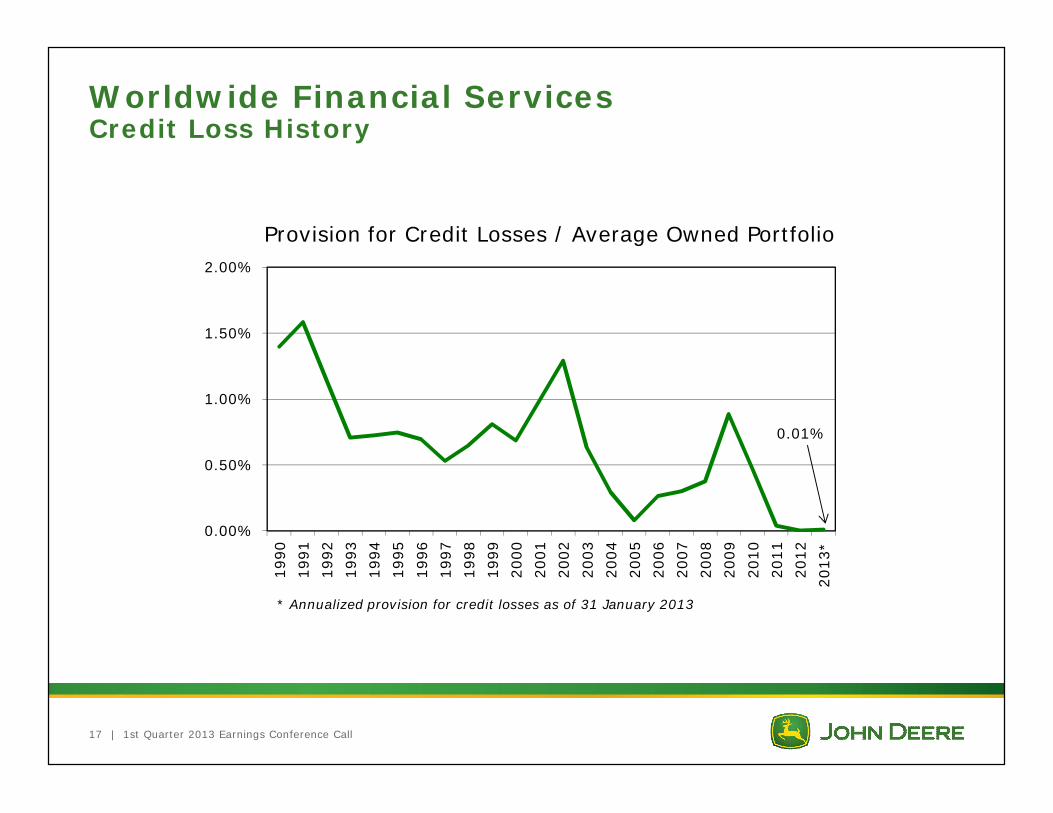
Worldwide Financial ServicesCredit Loss History
Provision for Credit Losses / Average Owned Portfolio
* Annualized provision for credit losses as of 31 January 2013
0.01%
0.00%
0.50%
1.00%
1.50%
2.00%19
9019
9119
9219
9319
9419
9519
9619
9719
9819
9920
0020
0120
0220
0320
0420
0520
0620
0720
0820
0920
1020
1120
1220
13*
| 1st Quarter 2013 Earnings Conference Call 18
Worldwide Financial Services
First Quarter 2013• Net income attributable to Deere & Company
• $133 million in Q1 2013 vs. $119 million in Q1 2012
Fiscal Year 2013 Forecast• Net income attributable to Deere & Company of ~ $540 million
• Previous forecast: ~ $500 million
Deere & Company Forecast as of 13 February 2013 (Previous Forecast as of 21 November 2012)
| 1st Quarter 2013 Earnings Conference Call 19
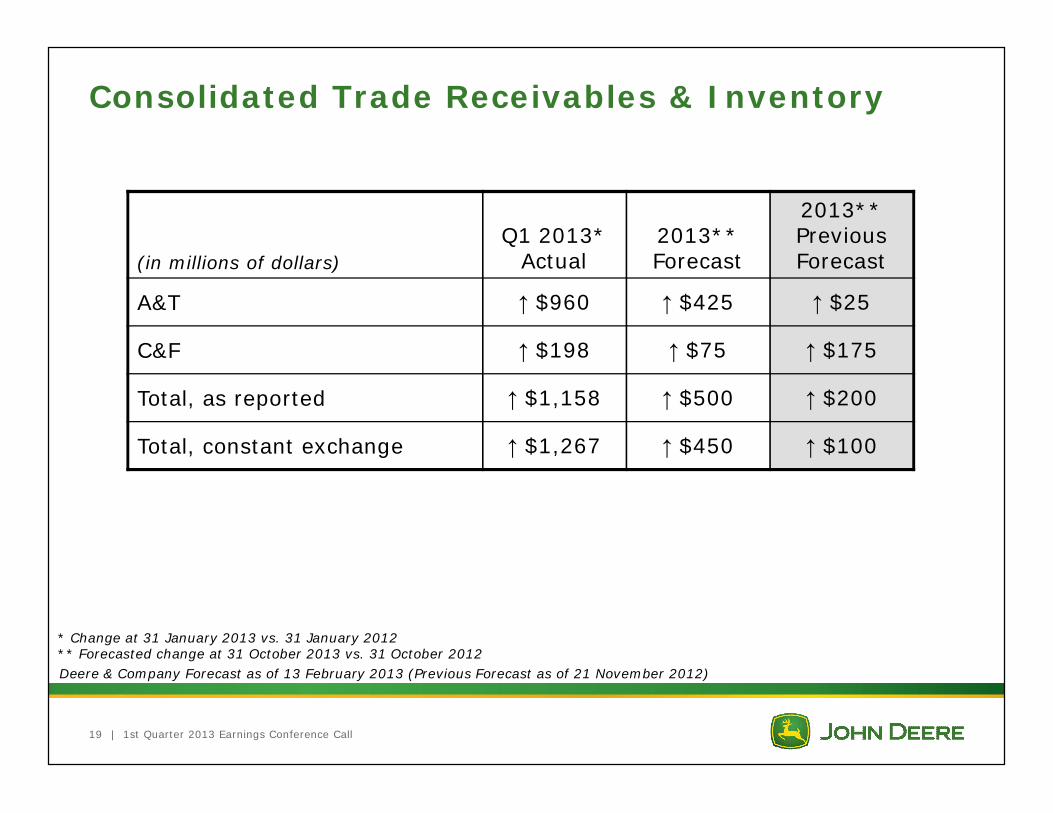
Consolidated Trade Receivables & Inventory
(in millions of dollars)Q1 2013*
Actual2013** Forecast
2013** Previous Forecast
A&T $960 $425 $25
C&F $198 $75 $175
Total, as reported $1,158 $500 $200
Total, constant exchange $1,267 $450 $100
* Change at 31 January 2013 vs. 31 January 2012** Forecasted change at 31 October 2013 vs. 31 October 2012Deere & Company Forecast as of 13 February 2013 (Previous Forecast as of 21 November 2012)
| 1st Quarter 2013 Earnings Conference Call 20
Cost of Sales as a Percent of Net SalesEquipment Operations
Deere & Company Forecast as of 13 February 2013 (Previous Forecast as of 21 November 2012)
First Quarter 2013• ~ 74%
Fiscal Year 2013 Forecast• ~ 74%• No change from previous forecast
| 1st Quarter 2013 Earnings Conference Call 21
Research & Development ExpenseEquipment Operations
First Quarter 2013• Up ~ 14% vs. Q1 2012
Fiscal Year 2013 Forecast• Up ~ 3% vs. FY 2012• No change from previous forecast
Deere & Company Forecast as of 13 February 2013 (Previous Forecast as of 21 November 2012)
| 1st Quarter 2013 Earnings Conference Call 22
Selling, Administrative & General ExpenseEquipment Operations
First Quarter 2013• Up ~ 10% vs. Q1 2012
Fiscal Year 2013 Forecast• Up ~ 7% vs. FY 2012• No change from previous forecast
Increases primarily related to growth
Deere & Company Forecast as of 13 February 2013 (Previous Forecast as of 21 November 2012)
| 1st Quarter 2013 Earnings Conference Call 23
Income TaxesEquipment Operations
First Quarter 2013• Effective tax rate: ~ 30%
Fiscal Year 2013 Forecast• Projected effective tax rate: 34-36%
• No change from previous forecast
Deere & Company Forecast as of 13 February 2013 (Previous Forecast as of 21 November 2012)
| 1st Quarter 2013 Earnings Conference Call 24
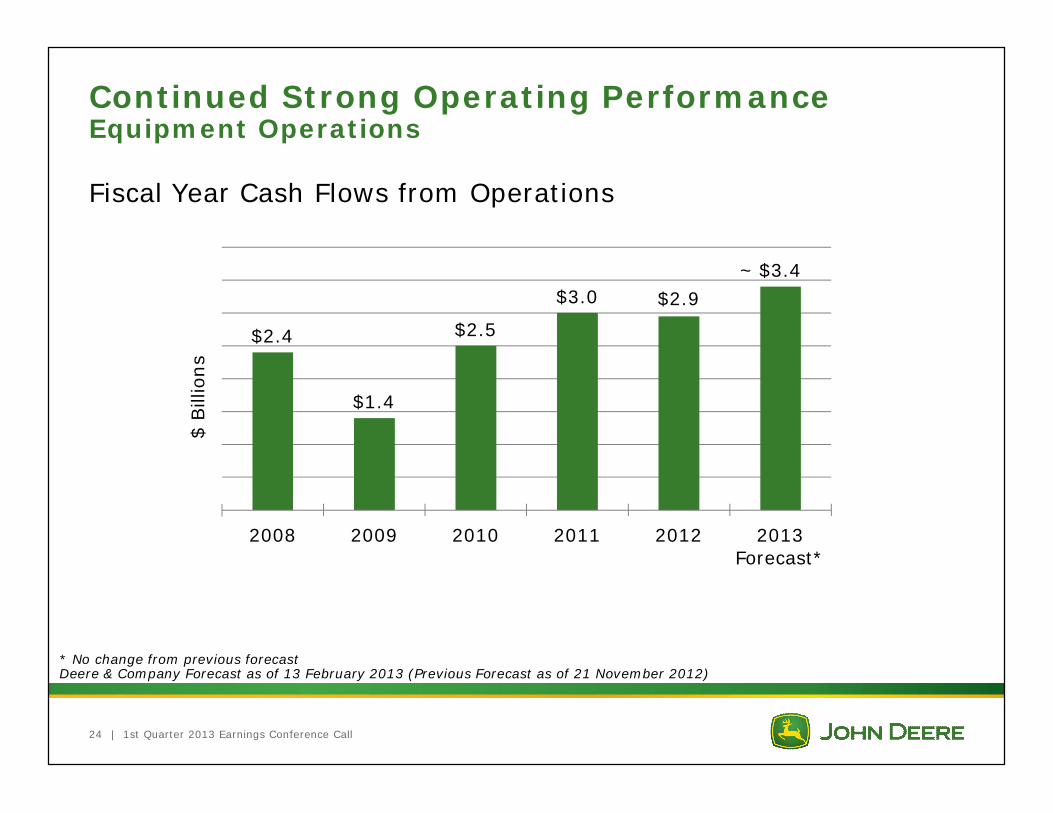
Continued Strong Operating PerformanceEquipment Operations
Fiscal Year Cash Flows from Operations
* No change from previous forecastDeere & Company Forecast as of 13 February 2013 (Previous Forecast as of 21 November 2012)
$2.4
$1.4
$2.5
$3.0 $2.9$3.4
2008 2009 2010 2011 2012 2013 Forecast*
$ Bill
ions
~
| 1st Quarter 2013 Earnings Conference Call 25
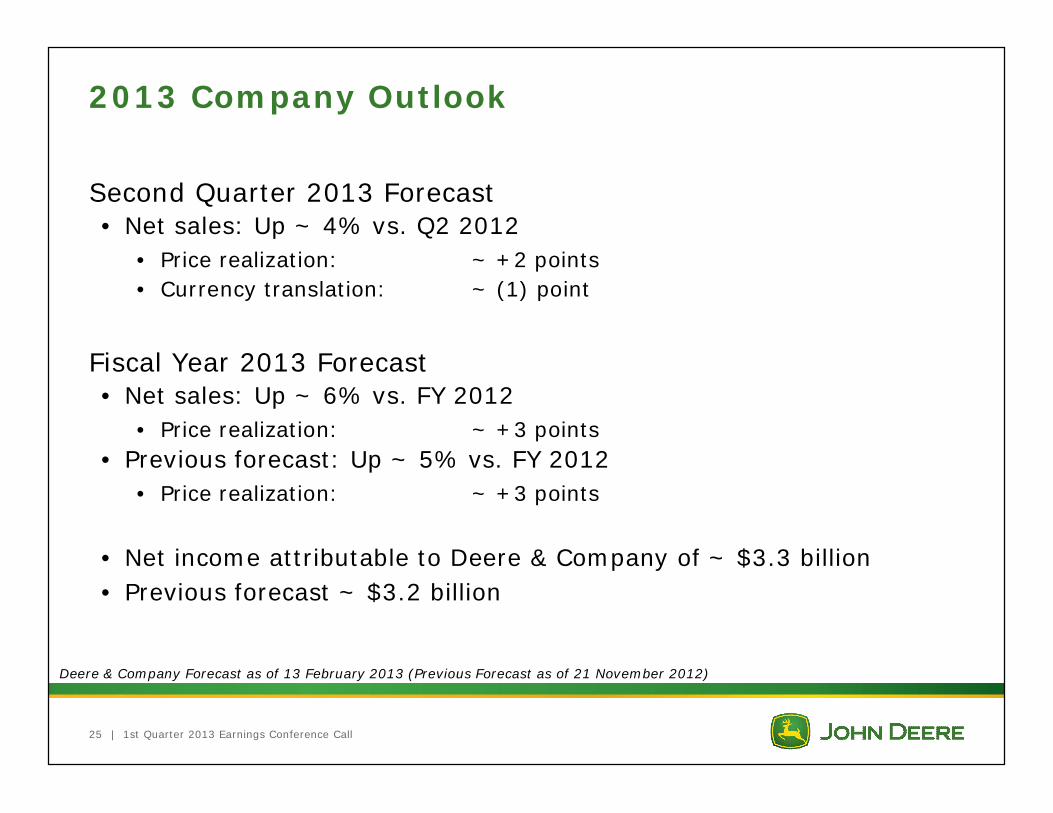
2013 Company Outlook
Second Quarter 2013 Forecast• Net sales: Up ~ 4% vs. Q2 2012
• Price realization: ~ +2 points• Currency translation: ~ (1) point
Fiscal Year 2013 Forecast• Net sales: Up ~ 6% vs. FY 2012
• Price realization: ~ +3 points• Previous forecast: Up ~ 5% vs. FY 2012
• Price realization: ~ +3 points
• Net income attributable to Deere & Company of ~ $3.3 billion• Previous forecast ~ $3.2 billion
Deere & Company Forecast as of 13 February 2013 (Previous Forecast as of 21 November 2012)
| 1st Quarter 2013 Earnings Conference Call 26
Appendix
| 1st Quarter 2013 Earnings Conference Call 27
| 1st Quarter 2013 Earnings Conference Call 28
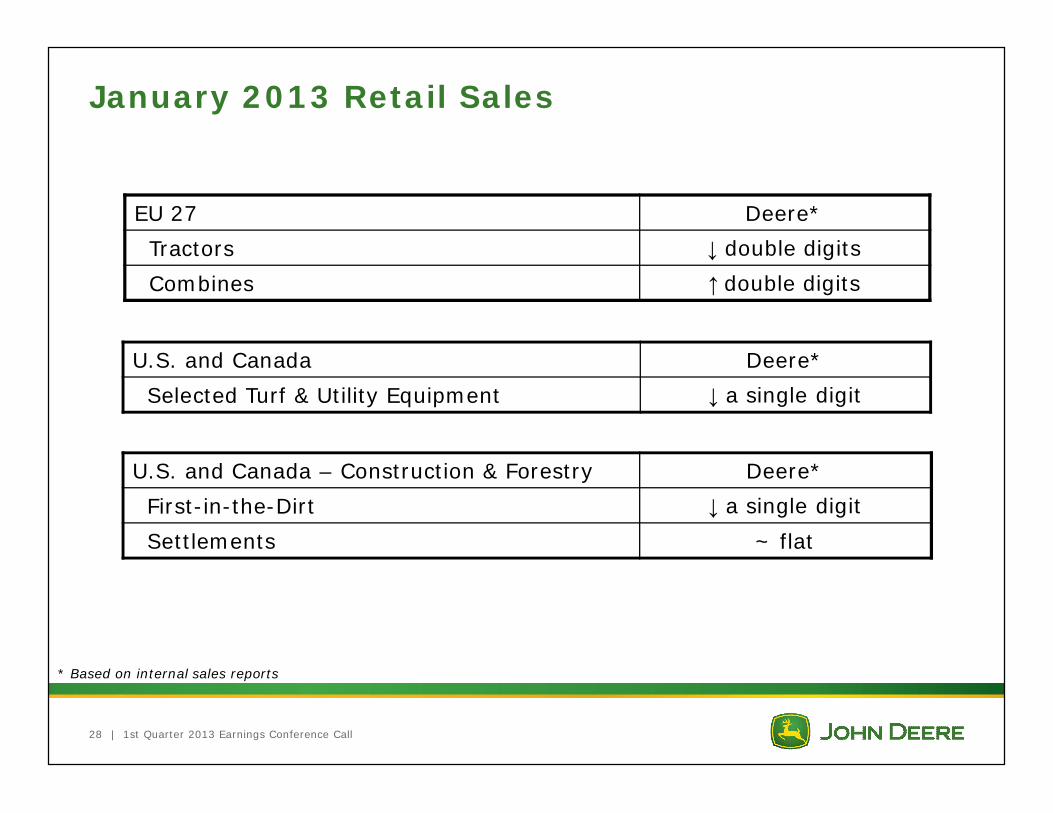
January 2013 Retail Sales
EU 27 Deere*Tractors double digitsCombines double digits
U.S. and Canada Deere*Selected Turf & Utility Equipment a single digit
* Based on internal sales reports
U.S. and Canada – Construction & Forestry Deere*First-in-the-Dirt a single digitSettlements ~ flat
| 1st Quarter 2013 Earnings Conference Call 29
Pension and OPEB Expense
First Quarter 2013• ~ Flat vs. Q1 2012
Fiscal Year 2013 Forecast• Up ~ $90 million vs. FY 2012• Previous forecast: Up ~ $70 million vs. FY 2012
Deere & Company Forecast as of 13 February 2013 (Previous Forecast as of 21 November 2012)
| 1st Quarter 2013 Earnings Conference Call 30
Other InformationEquipment Operations
Fiscal Year 2013 Forecast • Capital Expenditures: ~ $1.3 billion
• No change from previous forecast
• Depreciation and Amortization: ~ $725 million• Previous forecast: ~ $700 million
• Pension/OPEB Contributions: ~ $550 million• No change from previous forecast
Deere & Company Forecast as of 13 February 2013 (Previous Forecast as of 21 November 2012)
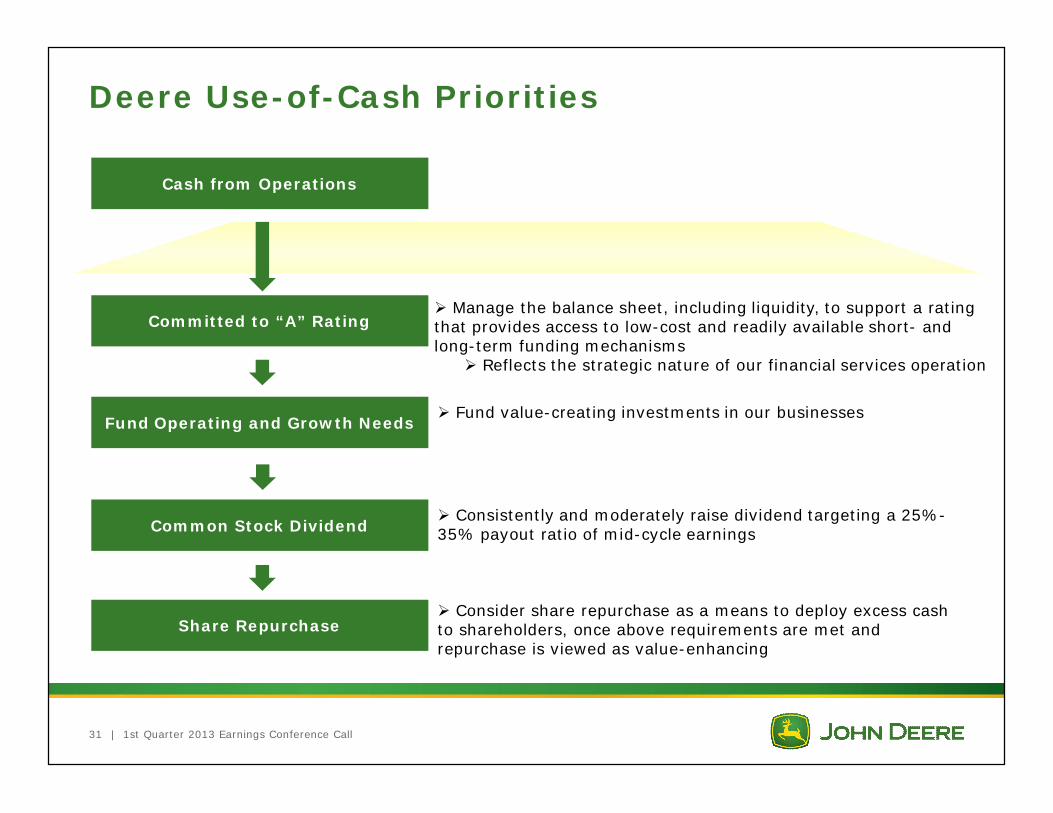
Deere Use-of-Cash Priorities
| 1st Quarter 2013 Earnings Conference Call 31
Manage the balance sheet, including liquidity, to support a rating that provides access to low-cost and readily available short- and long-term funding mechanisms
Reflects the strategic nature of our financial services operation
Committed to “A” Rating
Cash from Operations
Fund Operating and Growth Needs
Common Stock Dividend
Share Repurchase
Fund value-creating investments in our businesses
Consistently and moderately raise dividend targeting a 25%-35% payout ratio of mid-cycle earnings
Consider share repurchase as a means to deploy excess cash to shareholders, once above requirements are met and repurchase is viewed as value-enhancing
| 1st Quarter 2013 Earnings Conference Call 32
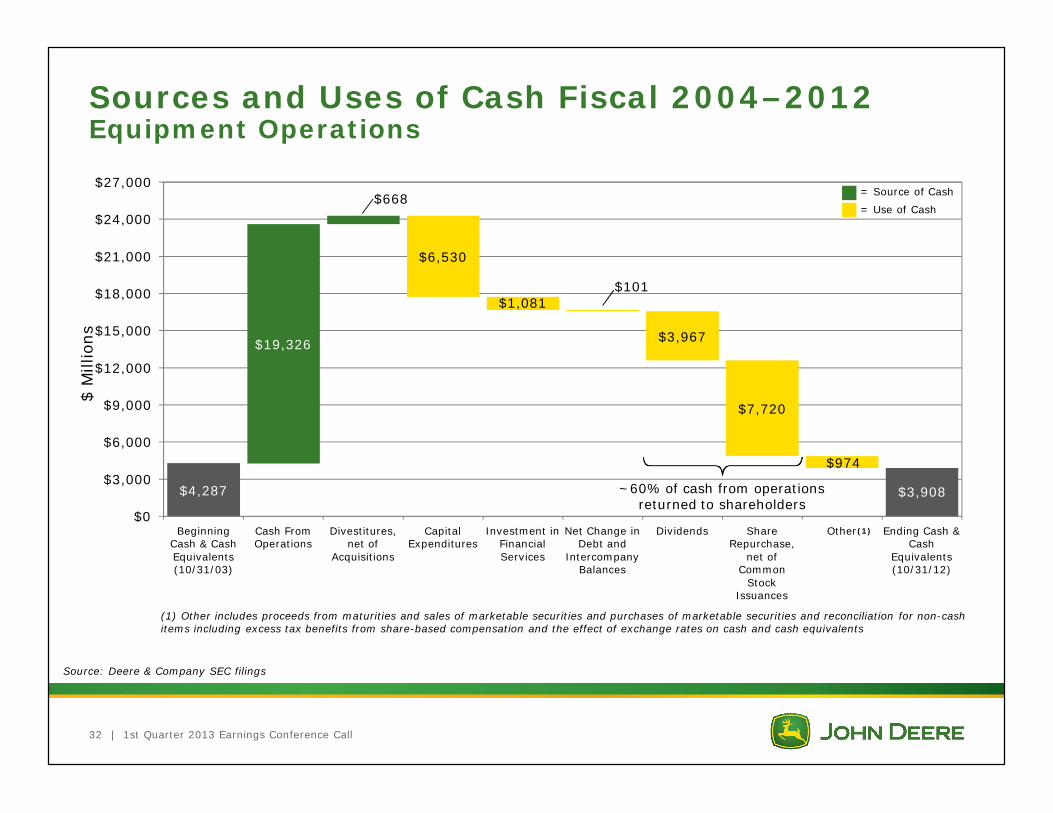
Sources and Uses of Cash Fiscal 2004–2012Equipment Operations
Source: Deere & Company SEC filings
= Source of Cash
= Use of Cash
(1) Other includes proceeds from maturities and sales of marketable securities and purchases of marketable securities and reconciliation for non-cash items including excess tax benefits from share-based compensation and the effect of exchange rates on cash and cash equivalents
$4,287
$19,326
$668
$6,530
$1,081$101
$3,967
$7,720
$974
$0
$3,000
$6,000
$9,000
$12,000
$15,000
$18,000
$21,000
$24,000
$27,000
Beginning Cash & Cash Equivalents (10/31/03)
Cash From Operations
Divestitures, net of
Acquisitions
Capital Expenditures
Investment in Financial Services
Net Change in Debt and
Intercompany Balances
Dividends Share Repurchase,
net of Common
Stock Issuances
Other Ending Cash & Cash
Equivalents (10/31/12)
(1)
$ M
illio
ns
$3,908~60% of cash from operations returned to shareholders
| 1st Quarter 2013 Earnings Conference Call 33
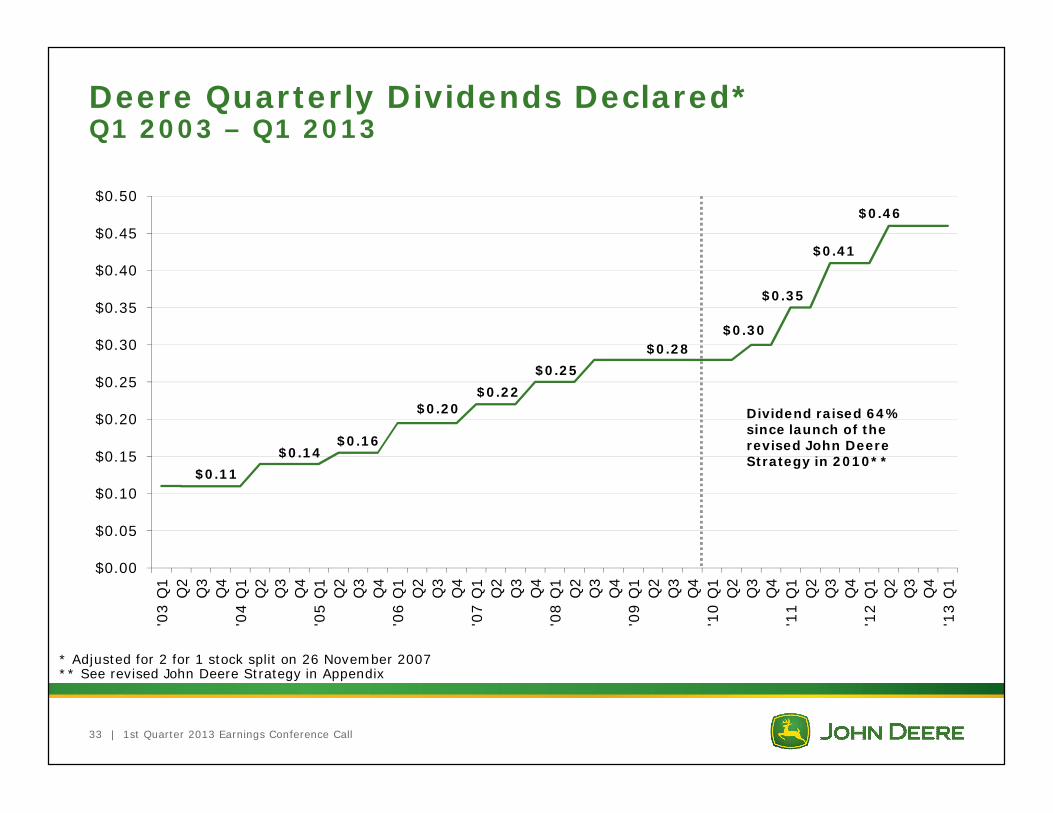
Deere Quarterly Dividends Declared*Q1 2003 – Q1 2013
* Adjusted for 2 for 1 stock split on 26 November 2007** See revised John Deere Strategy in Appendix
$0.11$0.14
$0.16
$0.20$0.22
$0.25$0.28
$0.30
$0.35
$0.41
$0.46
$0.00
$0.05
$0.10
$0.15
$0.20
$0.25
$0.30
$0.35
$0.40
$0.45
$0.50
'03
Q1
Q2
Q3
Q4
'04
Q1
Q2
Q3
Q4
'05
Q1
Q2
Q3
Q4
'06
Q1
Q2
Q3
Q4
'07
Q1
Q2
Q3
Q4
'08
Q1
Q2
Q3
Q4
'09
Q1
Q2
Q3
Q4
'10
Q1
Q2
Q3
Q4
'11
Q1
Q2
Q3
Q4
'12
Q1
Q2
Q3
Q4
'13
Q1
Dividend raised 64% since launch of the revised John Deere Strategy in 2010**
| 1st Quarter 2013 Earnings Conference Call 34
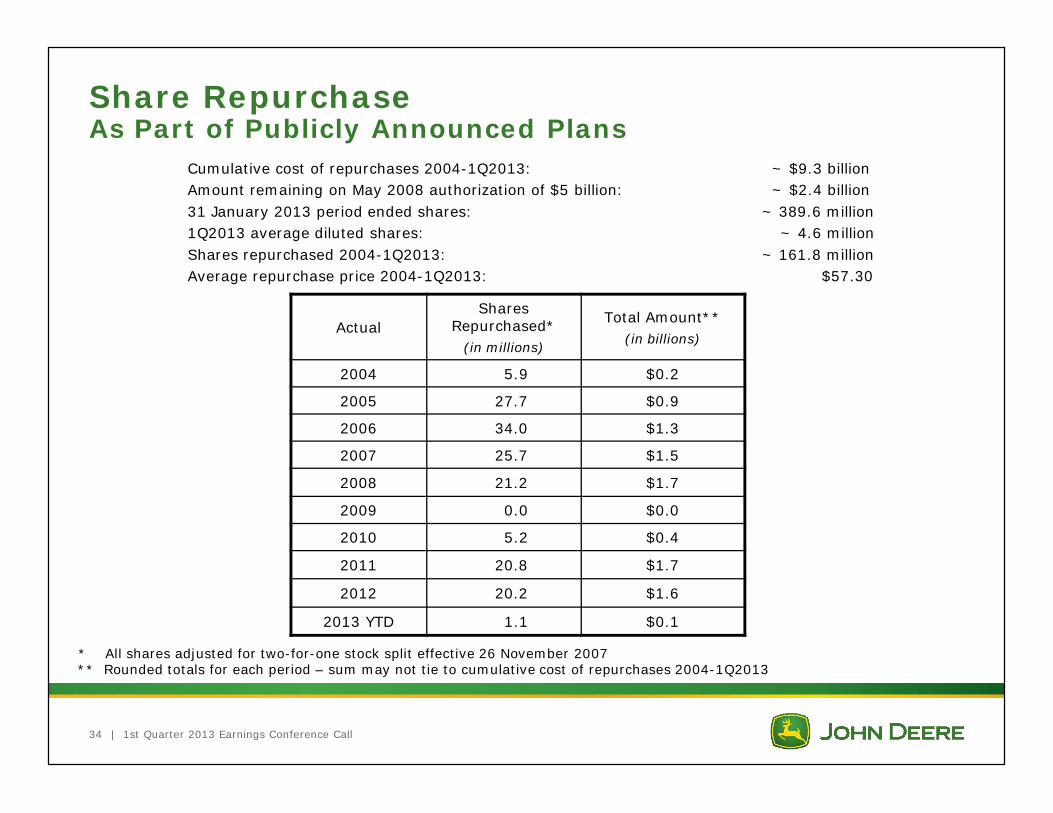
Share RepurchaseAs Part of Publicly Announced Plans
Cumulative cost of repurchases 2004-1Q2013: ~ $9.3 billionAmount remaining on May 2008 authorization of $5 billion: ~ $2.4 billion 31 January 2013 period ended shares: ~ 389.6 million1Q2013 average diluted shares: ~ 4.6 millionShares repurchased 2004-1Q2013: ~ 161.8 millionAverage repurchase price 2004-1Q2013: $57.30
* All shares adjusted for two-for-one stock split effective 26 November 2007** Rounded totals for each period – sum may not tie to cumulative cost of repurchases 2004-1Q2013
Actual Shares
Repurchased*(in millions)
Total Amount**(in billions)
2004 5.9 $0.2
2005 27.7 $0.9
2006 34.0 $1.3
2007 25.7 $1.5
2008 21.2 $1.7
2009 0.0 $0.0
2010 5.2 $0.4
2011 20.8 $1.7
2012 20.2 $1.6
2013 YTD 1.1 $0.1
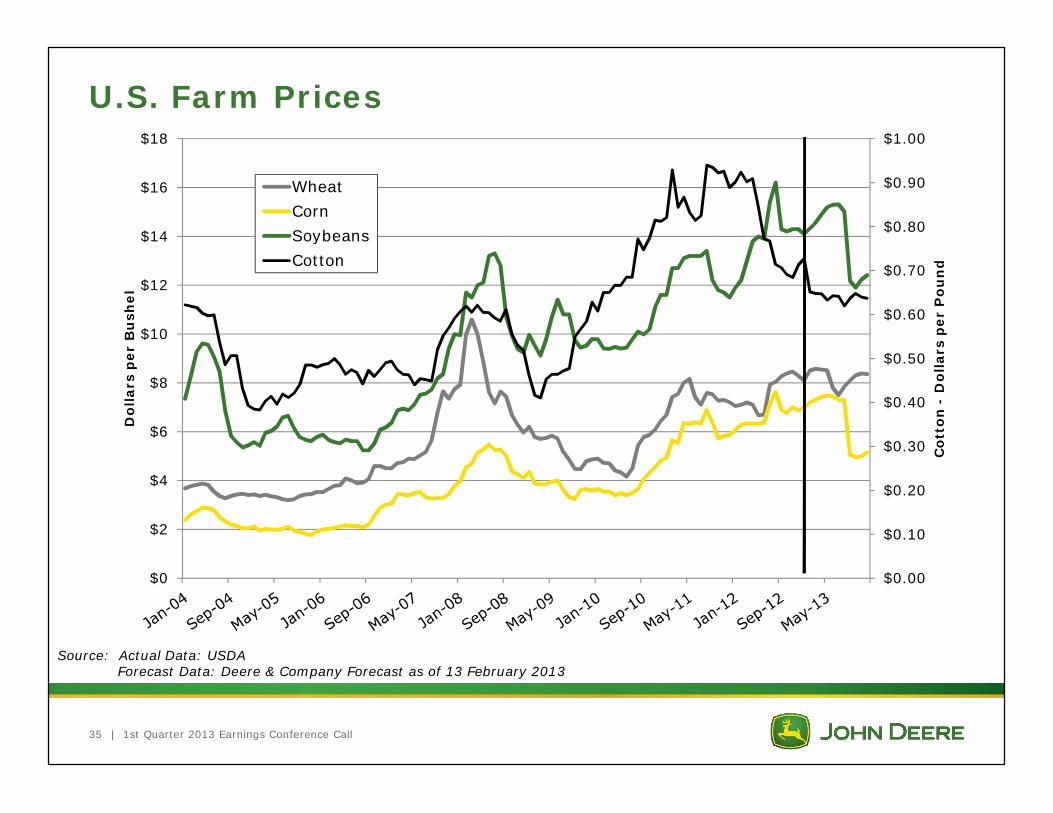
U.S. Farm Prices
| 1st Quarter 2013 Earnings Conference Call 35
Source: Actual Data: USDAForecast Data: Deere & Company Forecast as of 13 February 2013
$0.00
$0.10
$0.20
$0.30
$0.40
$0.50
$0.60
$0.70
$0.80
$0.90
$1.00
$0
$2
$4
$6
$8
$10
$12
$14
$16
$18
Co
tto
n -
Do
llars
per
Po
un
d
Do
llars
per
Bu
shel
WheatCornSoybeansCotton
| 1st Quarter 2013 Earnings Conference Call 36
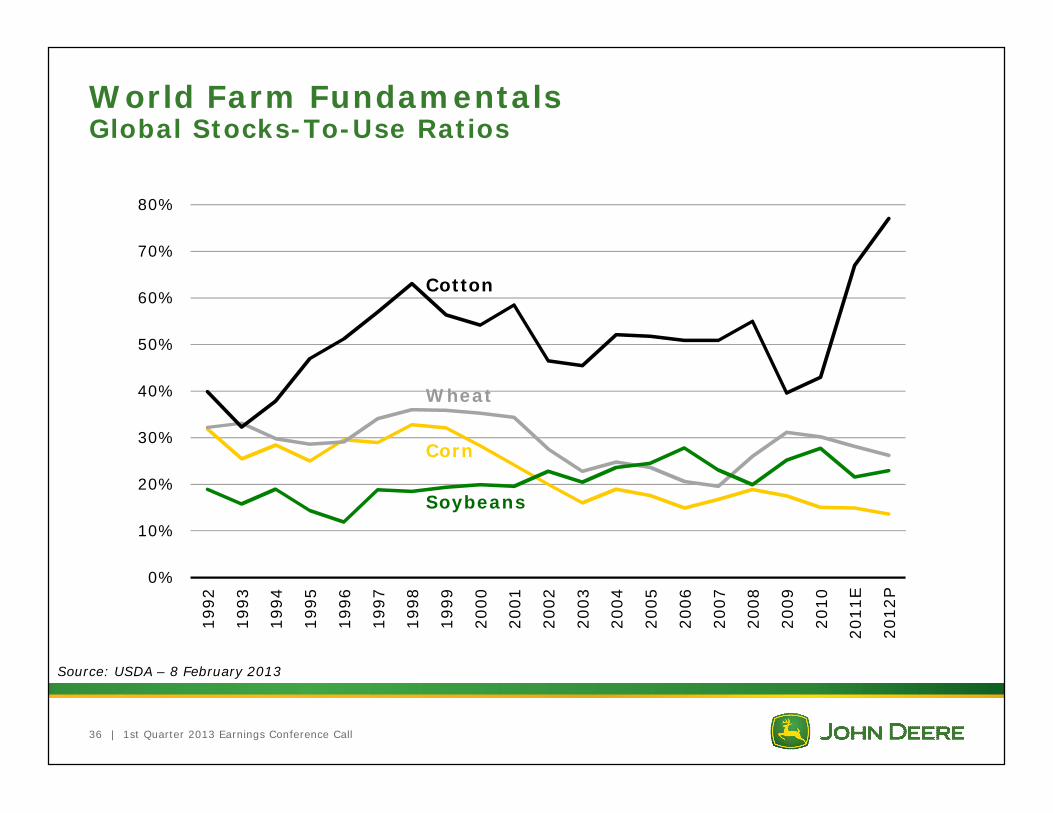
World Farm FundamentalsGlobal Stocks-To-Use Ratios
0%
10%
20%
30%
40%
50%
60%
70%
80%19
92
1993
1994
1995
1996
1997
1998
1999
2000
2001
2002
2003
2004
2005
2006
2007
2008
2009
2010
2011
E
2012
P
Source: USDA – 8 February 2013
Cotton
Wheat
Corn
Soybeans
| 1st Quarter 2013 Earnings Conference Call 37
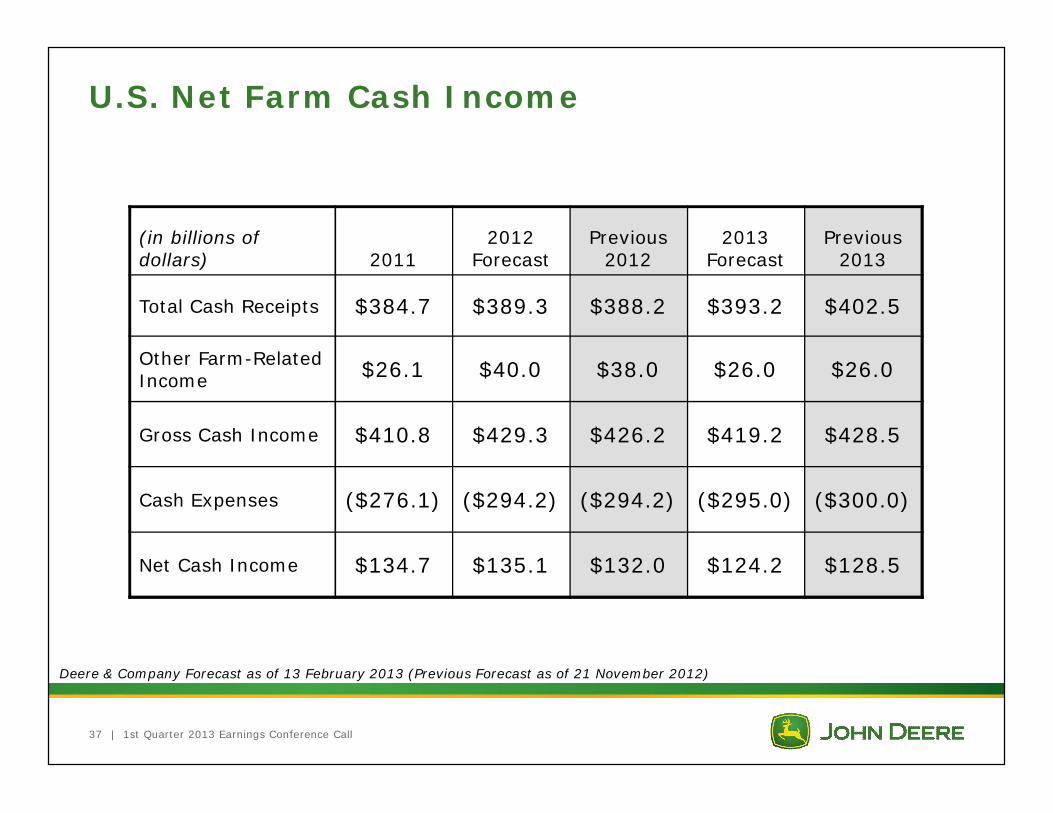
U.S. Net Farm Cash Income
Deere & Company Forecast as of 13 February 2013 (Previous Forecast as of 21 November 2012)
(in billions of dollars) 2011
2012 Forecast
Previous 2012
2013 Forecast
Previous 2013
Total Cash Receipts $384.7 $389.3 $388.2 $393.2 $402.5
Other Farm-Related Income $26.1 $40.0 $38.0 $26.0 $26.0
Gross Cash Income $410.8 $429.3 $426.2 $419.2 $428.5
Cash Expenses ($276.1) ($294.2) ($294.2) ($295.0) ($300.0)
Net Cash Income $134.7 $135.1 $132.0 $124.2 $128.5

Deere’s second quarter 2013 conference call is scheduled for 9:00 a.m. central time
on Wednesday, May 15, 2013